Article

Horizontal Distribution of Temperature Effect in Rubberized Concrete Pavement: A Case Study

1
The Key Laboratory of Road and Traffic Engineering, Ministry of Education, Tongji University, Shanghai 201804, China
2
Shaanxi Provincial Transport Planning Design and Research Institute Co. Ltd., Xi’an 710065, China
*
Authors to whom correspondence should be addressed.
Buildings 2023, 13(3), 686; https://doi.org/10.3390/buildings13030686
Submission received: 2 February 2023 / Revised: 23 February 2023 / Accepted: 1 March 2023 / Published: 6 March 2023
(This article belongs to the Special Issue Advances in Composite Construction in Civil Engineering)

Abstract

:
Temperature distribution and the deformation behavior under temperature are important parameters in the design and evaluation of concrete pavements. In this paper, in order to study the horizontal distribution of the temperature effect on rubberized concrete pavement (RCP), the distribution differences of temperature, temperature gradient and strain at different horizontal locations were analyzed based on fiber Bragg grating test technology. The relationships between temperature and strain and between temperature gradient and strain were also investigated. The results show that within a cycle of temperature or temperature gradient change, the time of temperature increase or temperature gradient increase is only 1/4 of the whole cycle, significantly less than the time of the temperature or temperature gradient decrease. Comparing the center, edges and corner of the pavement, the horizontal distribution of temperature and temperature gradients in the RCP is uneven, and the greatest negative temperature gradient is experienced at the corner of the pavement, which is 25 °C·m−1 greater than the temperature gradient at the center. The negative temperature gradient at the corner of the concrete pavement exacerbates the bottom deformation at the center and edge of the pavement, especially in the X-axis direction at the center and in the Y-axis and Z-axis directions at the edge. The relationships between temperature and horizontal strain at the center and edge of the RCP have a significant hysteresis effect and are markedly stronger than those at the corner. Moreover, when the temperature gradient is less than −23.4 °C·m−1 or greater than 14.5 °C·m−1, the curling effect at the edge of the RCP is more obvious.

1. Introduction

As a structure in direct contact with the external environment over a large area, concrete pavement is susceptible to environmental factors such as temperature, solar radiation, rainfall, etc. This can lead to changes in temperature and humidity in the concrete pavement, which can cause volume changes in the concrete pavement [1,2]. However, due to the constraints of the subgrade and surrounding pavement slabs, curling and warping stresses will inevitably occur within the concrete pavement [3,4,5]. Additionally, the temperature distribution inside the concrete pavement is very uneven, and the variation is complicated, causing the distributions of the stress and deformation inside the pavement to also be very uneven [6,7]. It is easy for the pavement to form more significant upward or downward curling deformations at the corner and edge of the pavement so that the pavement loses the support of the base layer at the corners or edges and forms voids under the pavement slab. Under the coupling effect of the traffic load, this is prone to lead to cracking, breaking, pumping, etc., affecting its service life [8,9,10]. Consequently, the stresses induced by temperature are of the same importance as those induced by heavy loads. Temperature distribution and the deformation response under temperature are important parameters for the design and evaluation of concrete pavement and are reflected in many national design and evaluation specifications [11,12].
Many studies have been conducted on the temperature distribution and temperature effects in concrete pavements based on theoretical and empirical methods. Westergaard [13] assumed a linearity of temperature variation, with depth and obtained temperature bending and curling stress solutions for concrete pavements based on theoretical calculations. These laid the foundation for pavement temperature stress calculations. However, Teller and Sutherland [14] later reported the non-linearity of the actual temperature distribution with depth. If the temperature distribution is assumed to be linear, it will affect the pavement stresses obtained from calculations, which may not match the actual stresses occurring in the pavement, thus allowing the pavement stresses to be overestimated or underestimated. Thominson’s study noted that stress development due to nonlinear temperature distribution can be divided into an axial stress component due to uniform temperature changes, the equivalent linear bending stress and the self-equilibrating stress [15]. Choubane [16] evaluated the effect of temperature gradients on the behavior of the concrete pavement and specified that the temperature distribution along the depth direction should be expressed by a binary equation. Liang [17] proposed an analytical solution for the temperature distribution of concrete pavement and calculated the curling stresses and bending moments based on a thermal analysis and the plate theory with the Winkler foundation. The results demonstrated that the frequency of temperature change had the greatest influence on the temperature distribution of the concrete pavement with depth. Therefore, the curling stresses must be calculated based on a nonlinear distribution model. In recent years, with the development of pavement monitoring, researchers have gradually found that the temperature is not only non-linearly distributed along the depth direction but also unevenly distributed in the plane. Kim [18] investigated the temperature distribution of concrete pavements in longitudinal, transverse and vertical directions, and the results showed that the temperatures within the pavement were similar at the same depth but were larger than those obtained near the edge. Tian [19] and Quan [20] found the same inhomogeneity in the horizontal distribution of temperature effects in concrete pavements by monitoring the temperature and strain in concrete pavements at different locations and depths. Therefore, the temperature distribution within the pavement is diverse, and simply using the current theoretical calculations or empirical formulas without appropriate corrections will lead to a large gap between the temperature stresses and the actual stresses in concrete pavements. It is therefore necessary to further investigate the horizontal distribution characteristics of concrete pavements in depth.
Ordinary concrete pavement has the advantages of high durability, good stability and low construction costs. However, it also has problems, such as many joints and poor flatness. In addition, the joints are prone to mud pumping, cracking and other diseases. Rubber particles have excellent elasticity, toughness, shock resistance and damping properties. These particles can be added to concrete to replace a certain volume of aggregates to form rubberized concrete. The addition of rubber particles can not only solve the environmental pollution problem of waste tires but also effectively improve the toughness, impact resistance, fatigue resistance, frost resistance and permeability of the concrete [21,22,23]. Meanwhile, the addition of rubber particles can reduce shrinkage deformation and improve the crack resistance of concrete. It is expected to build large-size concrete pavement and slow down the problem of facing the frequent joint diseases of ordinary concrete pavement [24,25]. Therefore, rubberized concrete has good prospects for application in airfield pavements.
The temperature distribution of pavements is largely controlled by the interacting thermal properties of the pavement materials, such as thermal conductivity, specific heat capacity, density, albedo and thermal emissivity [26,27]. Stemphiar [28] found that reducing the thermal conductivity and volumetric heat increased the maximum temperature of the pavement but reduced the minimum temperature at night. Phelan [29] investigated the effect of the material emissivity on pavement surface temperature and found that for every 0.1 unit increase in emissivity there was a reduction in the surface temperature of approximately 0.4 °C. Compared to ordinary concrete, the addition of rubber particles changes the concrete mixing ratio, aggregate composition, microstructure, and thermodynamic parameters, affecting the temperature distribution of rubberized concrete pavement (RCP) and changing the temperature response of the concrete pavement surface [30,31]. Ocholi [32] found that the thermal diffusivity of concrete decreased by 65.1%, thermal conductivity by 29.4%, heat capacity by 29.7% and heat exfiltration rate by 37.6% when rubber particles replaced 25% of the mineral aggregates. This indicated a decrease in the ability of rubberized concrete to withstand temperature changes, an increase in heat storage capacity, and a decrease in the rate of heat exchange with the surrounding environment. Ferretti [33] found that Westergaard’s theoretical approach was not applicable to simulate RCP by comparing the vertical stress response of RCP and ordinary concrete pavement because rubberized concrete, unlike rigid pavement, transferred loads to the soil base and absorbed them instead. Xue [34] investigated the mechanical response of RCP under the effect of a temperature gradient by numerical simulation and found that rubber particles reduced the maximum tensile stresses at the bottom of the concrete pavement at the middle of the longitudinal joint edge, the middle of the transverse joint edge and the corner and center of the pavement. Combined with the above results, it can be concluded that the addition of rubber particles changes the thermal properties of concrete. In practice, this change may lead to different temperature field distribution characteristics of the RCP compared to ordinary concrete pavement. The incorporation of rubber particles also changes the mechanical properties of the concrete, which makes the concrete behave between rigid and flexible; it therefore responds differently to loads from the same environment. At present, there is no field test to study the temperature effect of RCP to further analyze the horizontal temperature distribution and temperature deformation response of RCP. An in-depth study of the temperature distribution characteristics and temperature effect of RCP can provide a real data support for the monitoring, analysis and evaluation of RCP and provide engineers and researchers with sufficient design input criteria related to the temperature field of RCP.
Therefore, in this paper, an RCP footprint test section was established, and the temperature and strain of RCP at different horizontal positions were monitored using fiber Bragg grating test technology. Based on the measured data obtained, the horizontal distribution characteristics of temperature, temperature gradient and temperature strain of the RCP were studied, the relationship between the temperature field and strain was analyzed and the influence of the horizontal distribution characteristics of temperature field on the temperature deformation of RCP was discussed.

2. Experiment Procedure

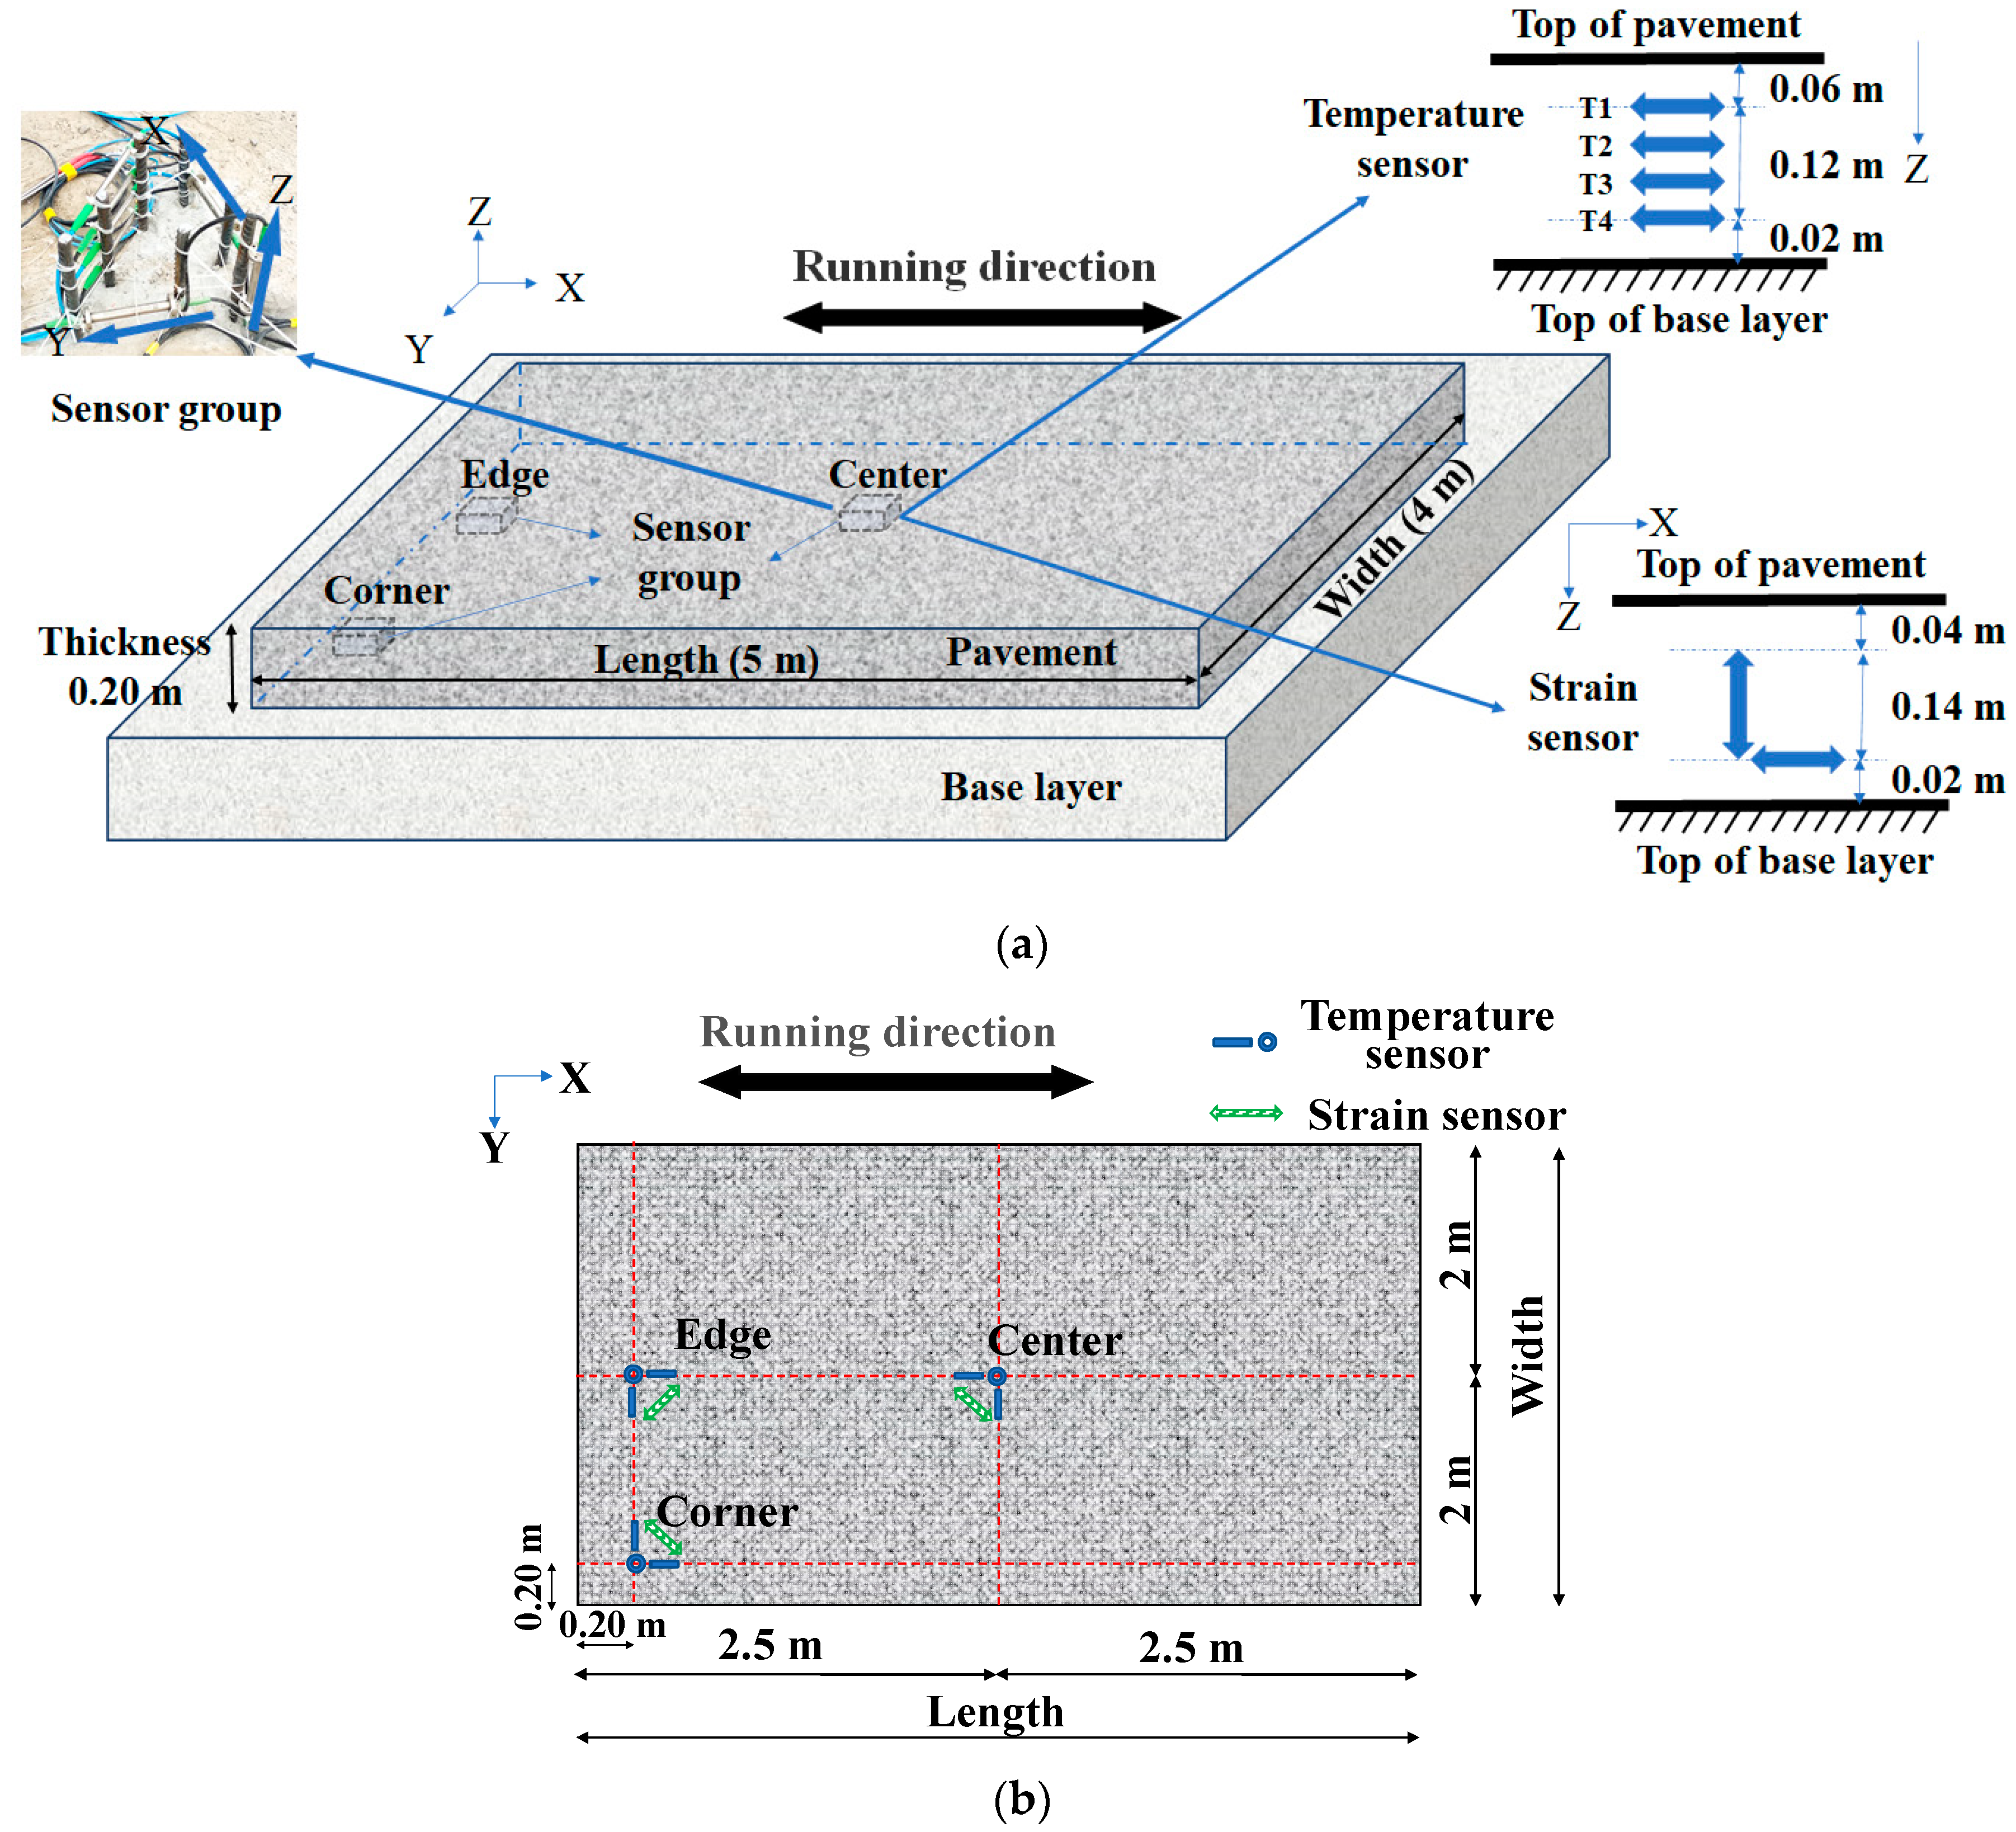
2.1. Pavement Structures and Materials

In this paper, the pavement structure of the test section comprised a combination of a 20 cm lime soil subbase layer, a 20 cm cement-stabilized macadam base layer, and 20 cm of RCP. The mixing proportions of rubberized concrete used in this paper are shown in Table 1, and the water–cement ratio is 0.4. Rubber particles (TRFA-I5075) were added according to the equal volume sand replacement method. Their technical characteristics are shown in Table 2. The test section was constructed on 20 September 2019. During construction, concrete specimens were formed on site for testing the compressive strength, flexural strength, elasticity modulus and coefficient of thermal expansion of concrete at 28 days of age. The results are shown in the Table 3. In order to study the temperature effect during the service, the test section was located in the end area to reduce the loading effect. The dimensions of the pavement in the testing section were 5 m long and 4 m wide, the tie bars were arranged longitudinally along the running direction, and the dowel bars were not arranged horizontally perpendicular to the running direction, as shown in Figure 1. To facilitate construction and the installation of monitoring instrument, one side of the test section was a compacted earth shoulder.

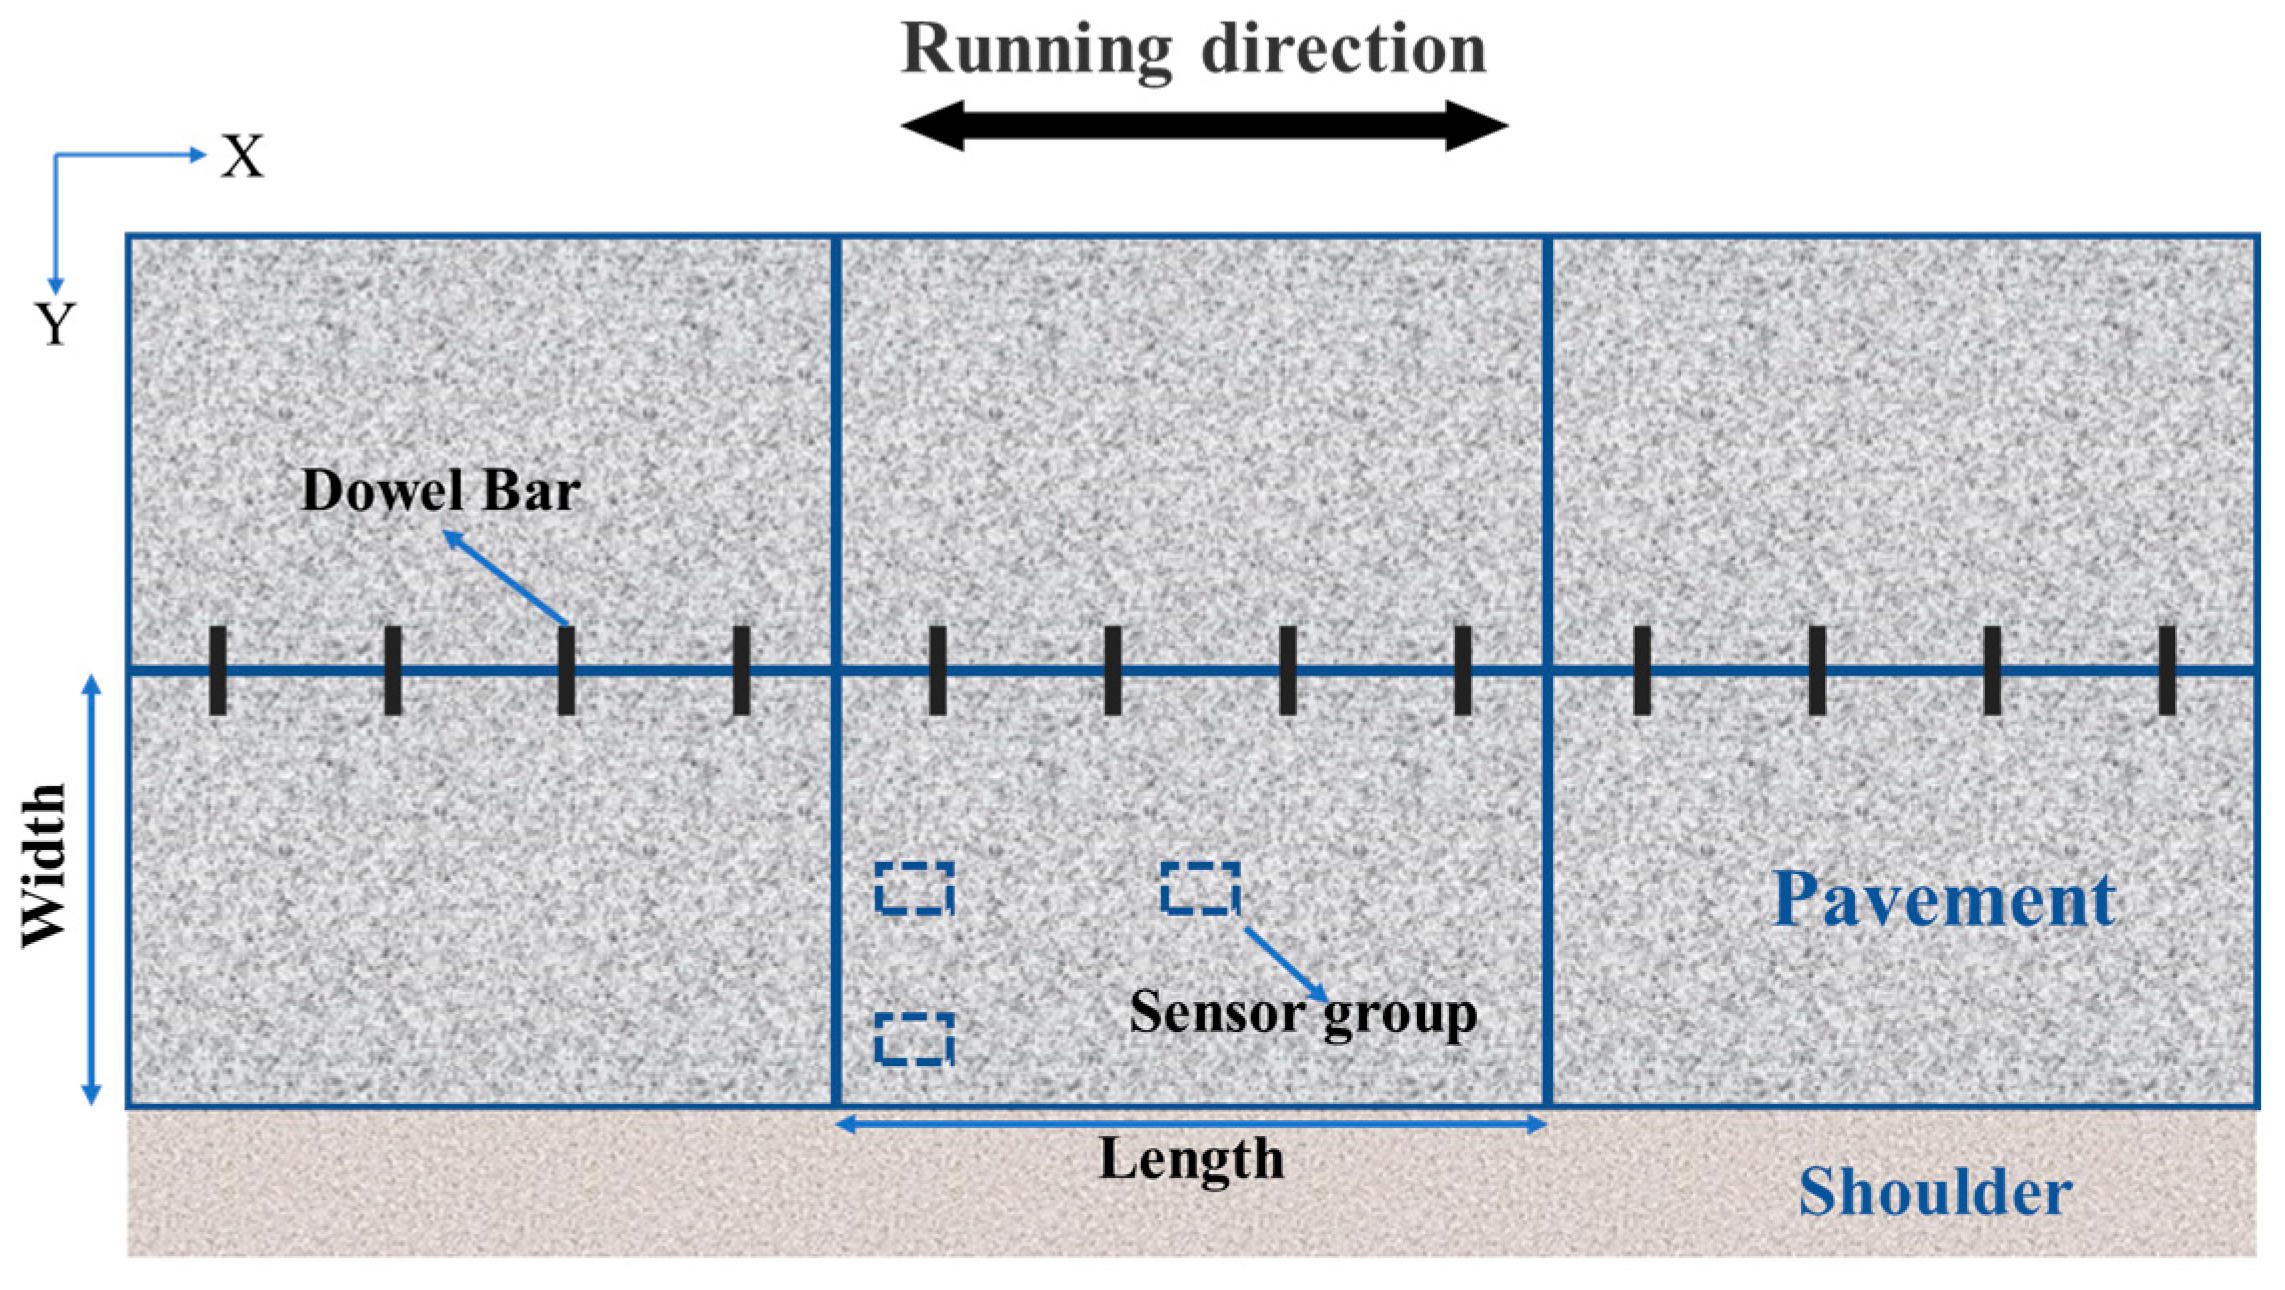
2.2. Sensor Parameters and Layout Scheme

Fiber Bragg grating sensors have a high sensitivity, high precision and excellent corrosion and water resistance. As the optical signal in the fiber is not subject to electromagnetic interference, it is the preferred sensor for an intelligent monitoring system and is especially suitable for high-water and high-alkali conditions in the concrete environment [39,40,41]. In this research, fiber Bragg grating temperature sensors (NZS-FBG-TM) and fiber Bragg grating strain sensors (NZS-FBG-ESG) were used.
In order to ensure that the sensors were closely mosaic with the surface layer, the sensors were pre-installed before the concrete surface layer was cast. First, the steel bracket was placed on the base layer, according to the positions shown in Figure 1. The sensor was then attached to the bracket, and the surface layer of concrete was finally cast. Manual vibration was used to cast the concrete near the sensor group. The fiber Bragg grating sensors were installed as shown in Figure 2. The fiber Bragg grating groups were placed in the center, edge and corner of the pavement, respectively, and each group contained four temperature sensors and three strain sensors. The center was the diagonal intersection of the rectangular pavement slab, the edge was the midpoint of the wide side of the pavement slab, and the corner was the intersection of the long side and wide side of the pavement slab. The detailed layout directions of the sensors are shown in Figure 2a. The X-axis was the running direction, the Y-axis was the width direction of the pavement and the Z-axis was the thickness direction of the pavement. The fiber Bragg grating temperature sensors were placed evenly along the thickness direction, with a safety distance of 0.06 m and 0.02 m at the top and bottom of the pavement, respectively, to reduce the effect of the concrete casting on the sensor locations. The temperature sensors were located at 0.06 m, 0.10 m, 0.14 m and 0.18 m away from the top of the pavement slab, which were recorded as T1, T2, T3 and T4, respectively. The temperature sensors were used to monitor the temperature distribution at the top (T1), middle (T2), and bottom (T4) of the RCP. The fiber Bragg grating temperature strain sensors were deployed one along the X-axis, Y-axis and Z-axis. Along the X-axis and Y-axis, a horizontal strain sensor was placed at 0.02 m from the top surface of the base layer to obtain the strain of the bottom of pavement, respectively. Along the Z-axis, a vertical strain sensor was placed to obtain the strain of the pavement slab along the thickness direction, with its lower end at 0.02 m from the top surface of the base layer and its upper end at 0.16 m from the top of the base layer. Especially for the fiber Bragg grating strain sensors at the edges and corners of the pavement, as shown in Figure 2b, the end of the horizontally placed strain sensor was 0.20 m from the boundary of the pavement slab to reduce the boundary effects during pavement casting.

2.3. Data Collection and Processing

The fiber Bragg grating demodulator (NZS-FBG-A02), which has a wireless transmission function, was used for data acquisition. The sensor was connected to the demodulator by an optical cable to establish a real-time monitoring system for the RCP with a demodulator acquisition interval of 10 min. The monitoring lasted for 70 h from 17:00 on 14 December 2020 to 15:00 on 17 December 2020. During this time, the weather was sunny and there was no precipitation. Therefore, the effect of humidity variation on the concrete pavement during the test period can be ignored. In addition, the test section was located in the end area and the influence of the load was also small; therefore, the strains acquired by the sensor were mainly caused by the change in temperature.
The wavelength information output from the fiber Bragg grating sensors was collected by the demodulator, and a computer program was used to convert the wavelength information from the sensors into temperature and strain according to Equations (1) and (2), respectively, so as to obtain the temperature effect of the RCP.
T = K T × ( P t P 0 ) + T 0
where T is the measured temperature, °C; KT is the temperature sensitivity coefficient of the sensor, which was provided by the sensor manufacturer in °C/nm; Pt is the test wavelength, nm; P0 is the initial wavelength, nm; and T0 is the constant of the sensor, which was provided by the sensor manufacturer.
S = K S × [ ( P S P 0 ) K T × ( P T P T 0 ) ]
where S is the measured strain, με; KS is the strain sensitivity coefficient, με/nm; K T is the temperature compensation coefficient, PS is the measuring wavelength of the strain grating, nm; P0 is the initial wavelength of the strain grating, nm; PT is the measuring wavelength of the temperature grating, nm; and PT0 is the initial wavelength of the temperature grating, nm. KS and K T are fixed parameters of the sensor, which was provided by the manufacturer.
Each sensor group consisted of four temperature sensors and three strain sensors. All sensors were numbered to facilitate data processing and analysis. The number of each strain sensor was the combination of its horizontal position and direction: for example, Center-X, Edge-Y, Corner-Z. The number of each temperature sensor was the combination of its horizontal position and vertical arrangement order, for example Center-T1, Edge-T2, Corner-T4.

3. Results and Discussion

3.1. Horizontal Distribution of Temperature of RCP

In order to study the horizontal distribution of the temperature in RCP, the temperature and temperature gradient at the center, edge and corner of the pavement were compared and analyzed.

3.1.1. Temperature

Figure 3 shows the temperature time history curves of the top and bottom of the RCP at different horizontal positions, which characterize the horizontal distribution of the temperature in the RCP. Overall, the temperature change in the plate lagged behind the air temperature, and the lag at the bottom is more obvious. The proportion of temperature–rise time in a temperature cycle was approximately 1/4, which is significantly smaller than the proportion of the temperature–fall time. This is because the decreasing temperature phase is simply the heat exchange between the concrete and the external environment in relation to the external temperature, whereas in the increasing temperature phase, the concrete pavement is affected not only by the external temperature but also by the thermal radiation, which accounts for approximately 50% of the effect.
In comparison with different horizontal positions, it can be seen that there are large differences in the temperature of the RCP. At the top of the pavement, the temperature and the daily temperature range (difference between daily maximum and minimum values of temperature curve) of the RCP were the highest at the center, followed by the edge, and they were lowest at the corner. For example, at 45 h, the temperature of the top at the center of the pavement was 1.6 and 3.9 °C higher than that at the edge and corner, and the daily temperature range of the top at the center of the pavement was 0.1 and 2.7 °C higher than that at the edge and corner. At the bottom of the pavement, the daily temperature ranges at the center, edge and corner of the pavement were similar, while the temperatures at the center and edge of the pavement were lower than the temperature at the corner of the pavement. Taking the temperature at 40 h as an example, the temperature at the center of the pavement was 1.1 °C lower than the temperature at the corner. The test results show that the temperature distribution of RCP was uneven on the same horizontal plane.

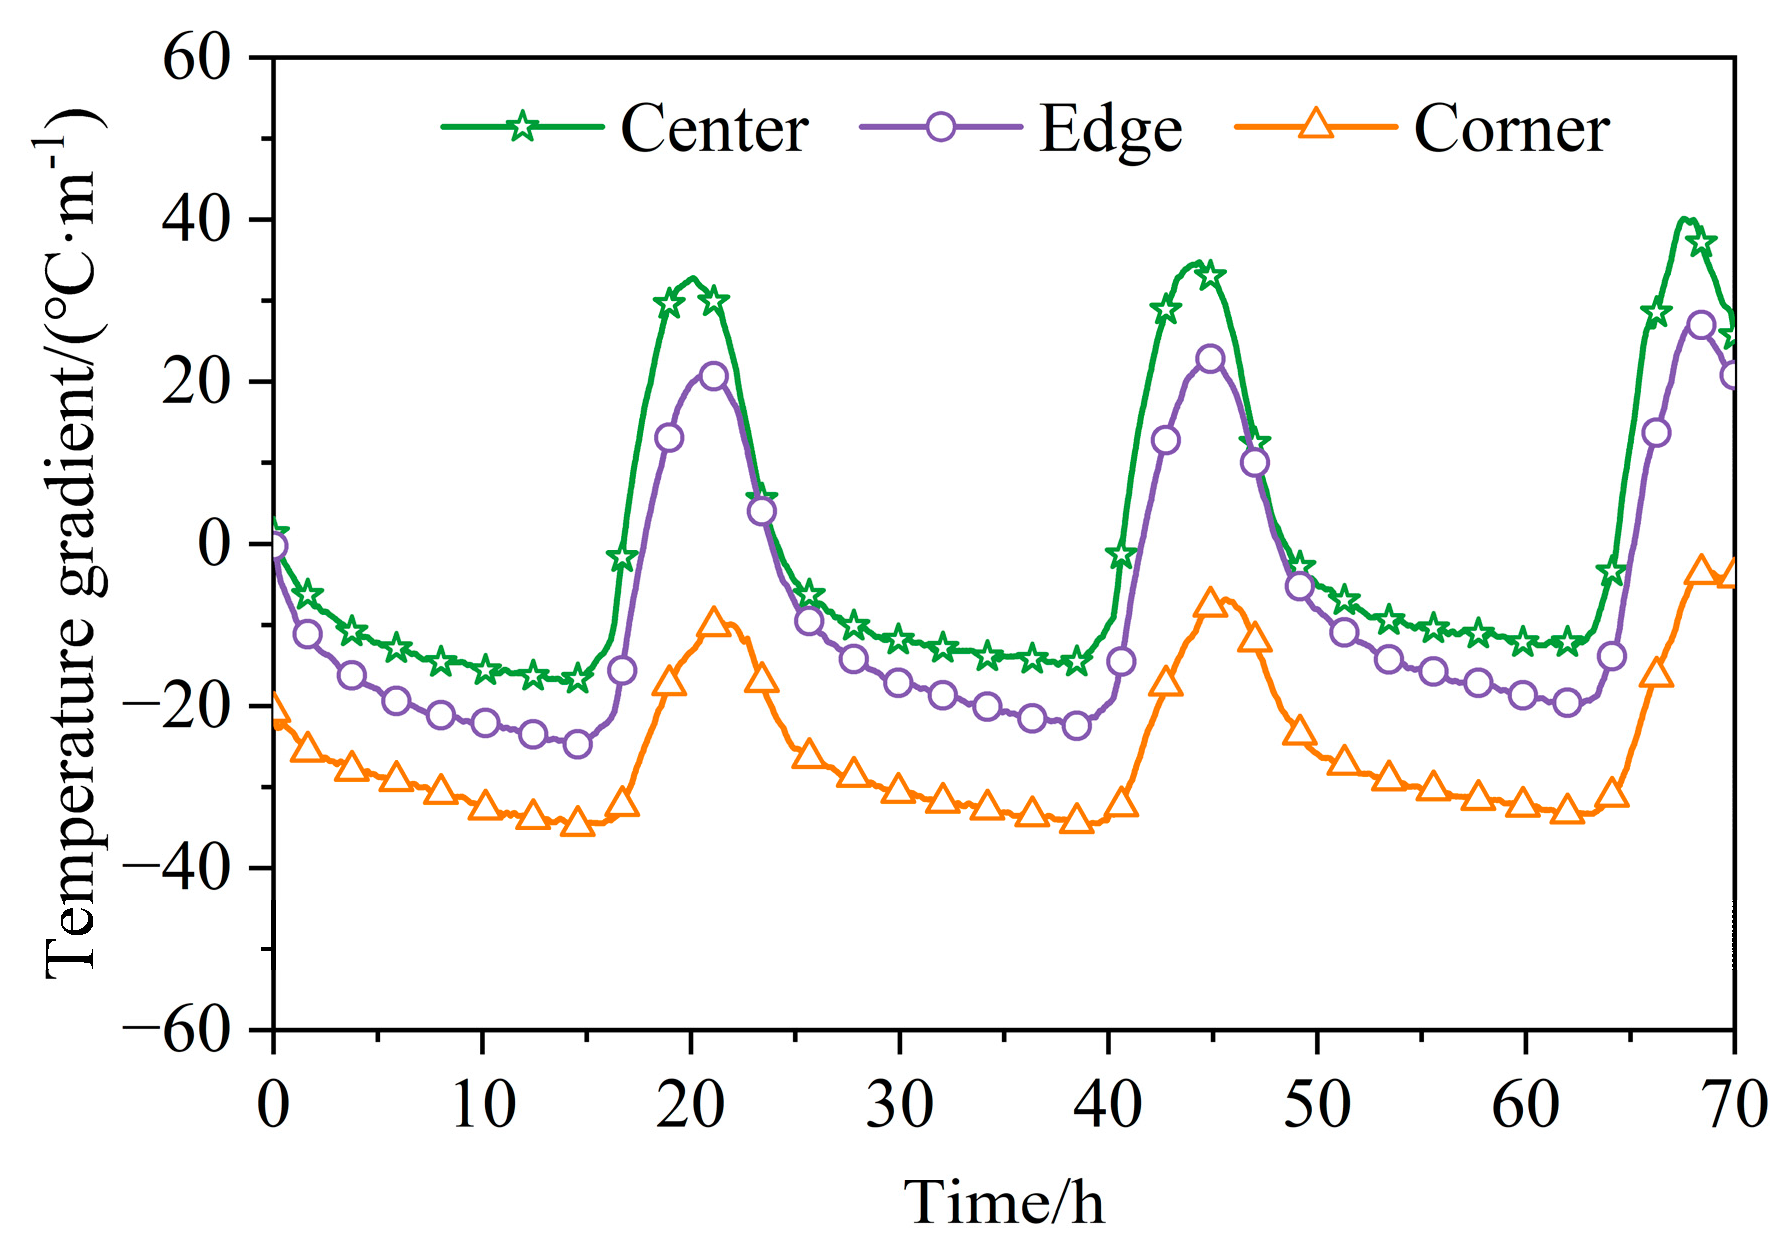
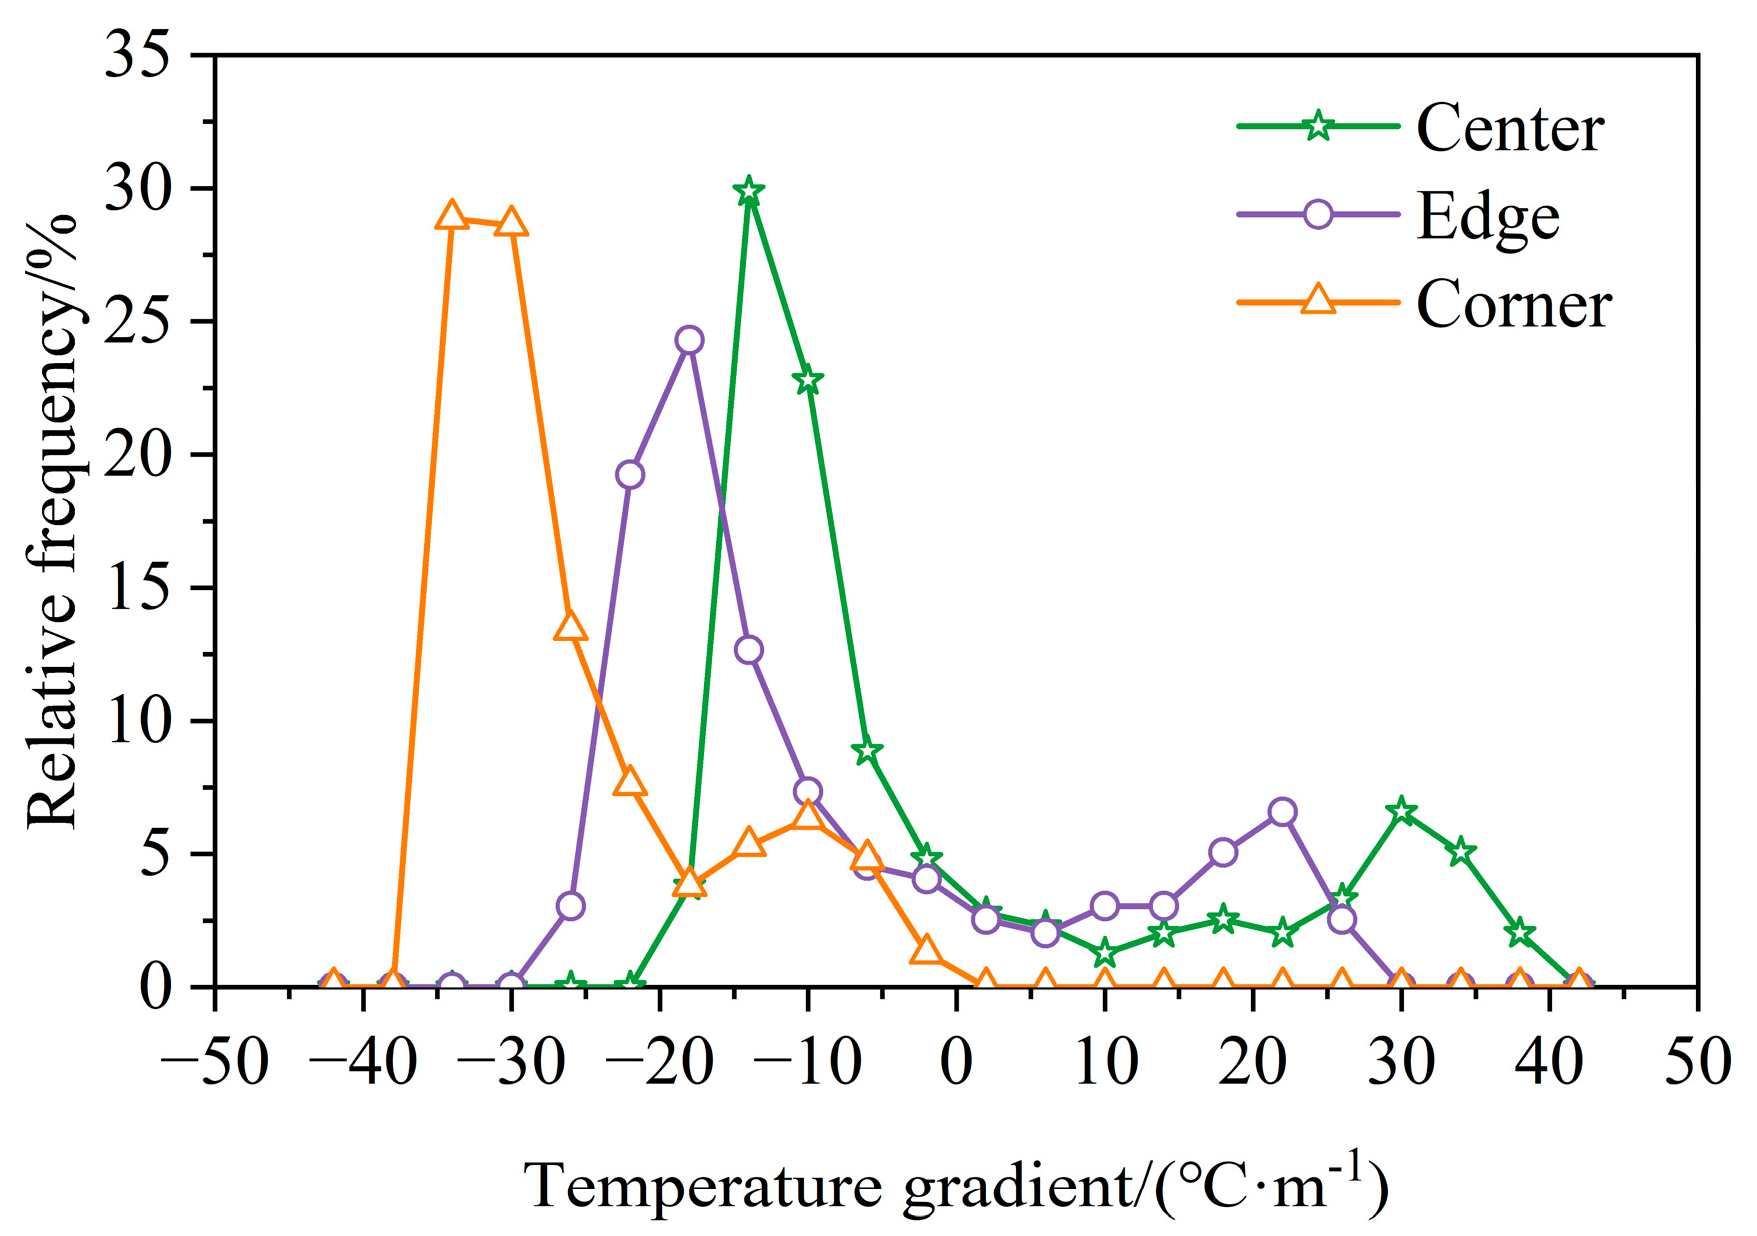
3.1.2. Temperature Gradient

With T1 as the temperature at the top of the pavement and T4 as the temperature at the bottom of the pavement, the temperature gradients at different horizontal positions of the RCP were calculated. The evolution of the results with time is displayed in Figure 4. The whole temperature gradient was then divided into several intervals, and the interval was 4 °C. The frequency statistics of the temperature gradients were then carried out. These results are displayed in Figure 5.
It can be seen from Figure 4 that the percent increase in the temperature gradient in a cycle was much smaller than the percent decrease, accounting for only approximately 25% of the total cycle time. The temperature gradient is the primary cause of pavement curling, as shown in Figure 6. Under ideal conditions, the pavement slab should be in a curl-free (flat) condition at zero temperature differential. At negative temperature differentials, the slab will curl upward at the edge, with the corners exhibiting the largest curling while the center is in contact with the subgrade. Conversely, positive temperature differences result in curling downwards at the edge and curling upwards at the center [42]. Therefore, for RCP, it is relatively rapid to change from upward curling at the corner caused by a negative temperature gradient to downward curling at the corner caused by a positive temperature gradient. Internal stresses that cannot be relieved in time are more likely to occur at this stage while the change from downward curling to upward curling is relatively slow.
In addition, there is a positive temperature gradient at the center and edge of the pavement, while the pavement corners are always under the effect of a negative temperature gradient. At the trough of the temperature gradient, the whole pavement is under the effect of a negative temperature gradient. The negative temperature gradient at the corner of the pavement is the largest, followed by the edge, and is the smallest at the center. Meanwhile, the temperature gradient at the center is only 50% of the temperature gradient at the corner. This indicates that the temperature gradient of the RCP is not uniformly distributed in the plane. The negative temperature gradient at the corner will increase the upward curling of the RCP caused by the negative temperature gradient, as shown in the Figure 7. This is because the media at the center of the pavement are different from the media at the edge and corner of the pavement. The pavement at the corner is in contact with the earth shoulder, resulting in a higher temperature at the bottom and a greater negative temperature gradient. Compared to ordinary concrete, rubberized concrete has better insulating properties; therefore, the improved insulation will reduce the increased curling displacement (L2) caused by the corner of the RCP. This increased curling displacement is more severe in ordinary concrete pavements [32,42]. If the assumption of uniformity in the plane is used in the calculation of the temperature curling stress of the RCP, the obtained temperature curling stress will be smaller than the actual value. This should be highly regarded in the design and evaluation of RCP.
As can be seen from Figure 5, the frequency distribution width of the temperature gradient at the center and edge of the RCP is similar but larger than the frequency distribution width at the corner. The average temperature gradients at the center, edge and corner of the pavement were −0.9, −8.3 and −25.9 °C·m−1, respectively. The percentages of negative temperature gradients in the center, edge and corner of the pavement were 70%, 75% and 100%, respectively. This further indicates that RCPs are mostly subject to negative, temperature-induced curling at the corners in the winter.

3.2. Horizontal Distribution of Strain of RCP

Based on the strain data obtained from monitoring, the selected initial moment strain was set as the reference value, and the strain data at other moments were all strain increments relative to the initial moment strain. The positive and negative values only expressed the direction of the increment relative to the initial moment strain and did not express the absolute magnitude of the strain. Meanwhile, the shrinkage deformation of the concrete pavement is specified as negative, and the expansion deformation is specified as positive. The bottom strains at the center, edge and corner of the RCP were then compared and analyzed, and the strain distribution of the RCP was studied.

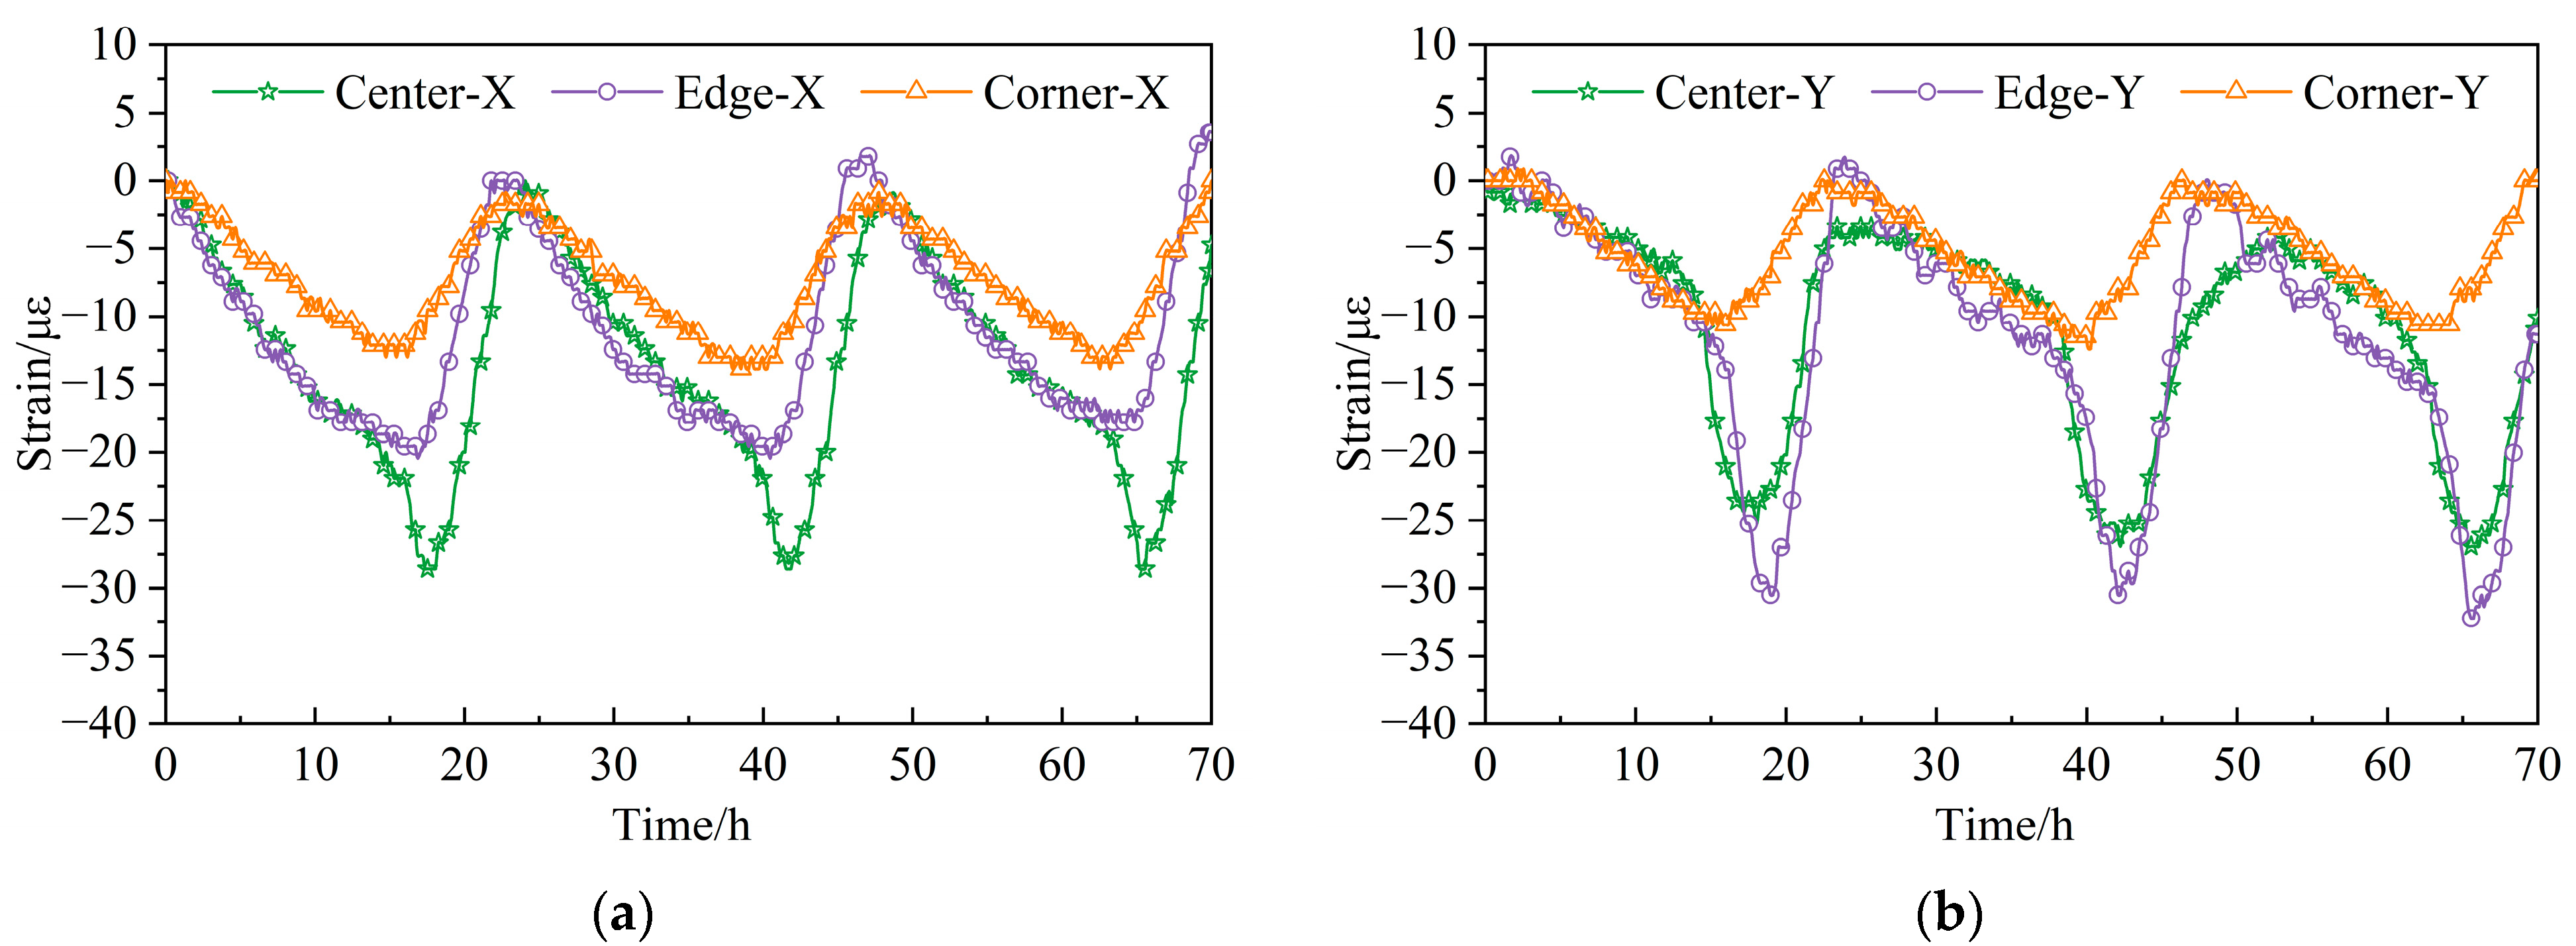
3.2.1. Horizontal Strain

Figure 8 shows the strain time history curve of the bottom of the RCP along the X-axis and Y-axis. Overall, the temperature shrinkage deformation of the concrete pavement developed more slowly, at approximately 3/4 of the time of a deformation cycle, in the same proportion as the temperature gradient reduction accounted for by one temperature gradient change cycle. The results also show that for the X-axis strain, the strain and the daily strain range (difference between the daily maximum and minimum values of the strain curve) of the RCP bottom gradually decreased from the center to the edge and then to the corner of the pavement. This is the same as the temperature change law of the RCP top. Taking the strains at 41 h as an example, the strain at the center of the pavement was 1.40 times the strain at the edge and 2.06 times the strain at the corner. Along the Y-axis, the peak strain wave and the daily strain range of the RCP both showed the largest strain at the edge, the second largest strain at the center, and the smallest strain at the corner. This phenomenon is significantly different from the temperature difference at the same time at the center, edge and corner of the pavement. This is attributed to the fact that the center of the pavement is affected not only by the temperature decrease but also by the temperature gradient at the center and the temperature gradient at the corner of the pavement. This indicates that the negative temperature gradient at the corner of the pavement intensifies the deformation of the pavement bottom at the center and the edge of the pavement, especially along the X-axis at the center and along the Y-axis at the edge, resulting in an uneven deformation distribution and more severe curling of the pavement under the same conditions.

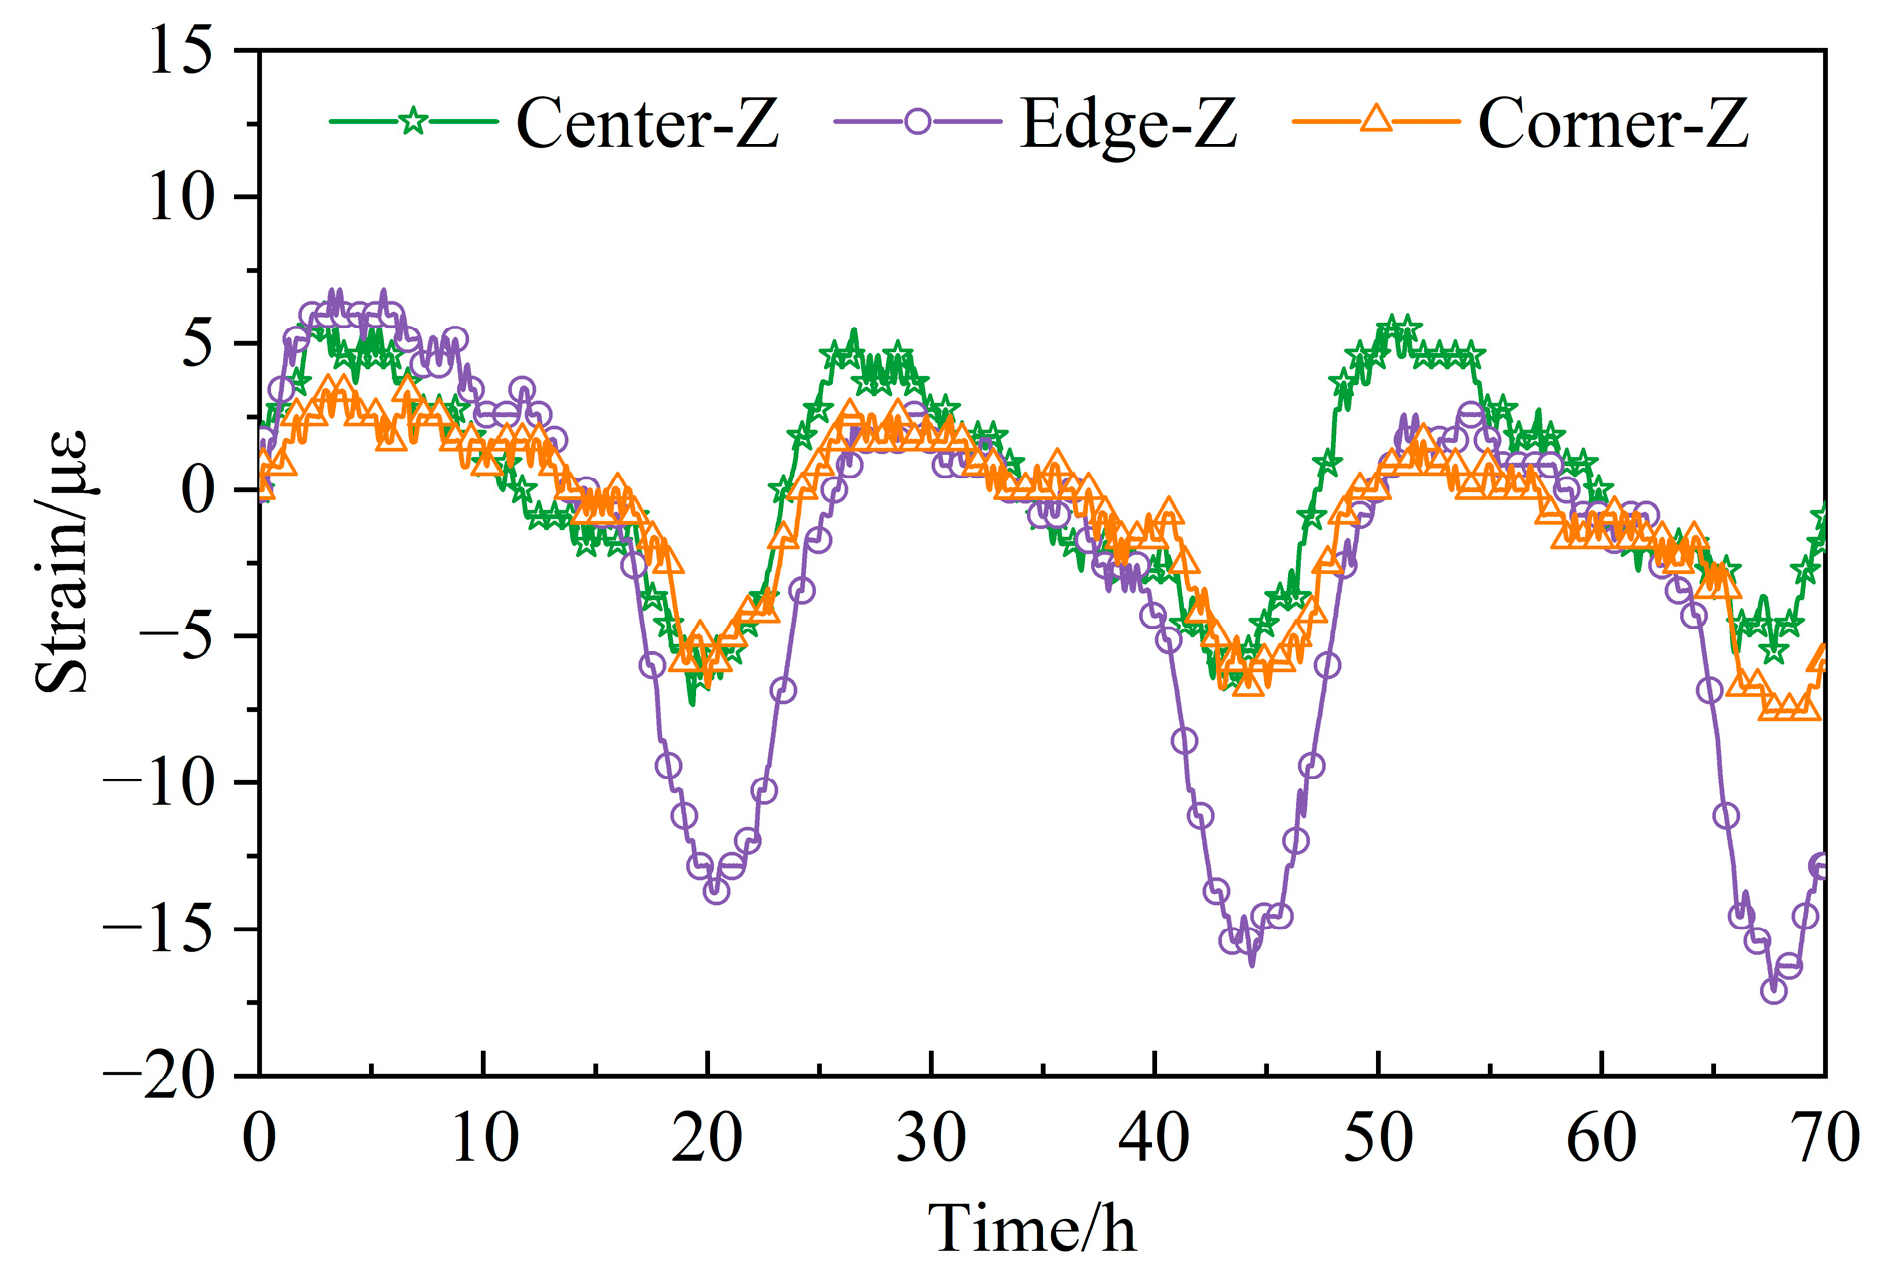
3.2.2. Vertical Strain

The vertical strain time history curves of different locations of the RCP are shown in Figure 9. The vertical strain characterizes the vertical deformation of the pavement panel due to concrete pavement curling, as shown in Figure 7, with greater vertical strain indicating more severe curling. From Figure 9, it can be seen that the vertical strain wave peak and daily strain ranges at the edge of the RCP were the largest during the monitoring, and that the daily strain ranges were between 19 and 20 με. The vertical strain wave peak and daily strain ranges at the center and corner of the pavement were similar, and the daily strain ranges were between 9 and 14 με. This indicates that the vertical deformation at the edge of the RCP was most affected by the uneven horizontal distribution of the temperature, resulting in greater curling of the RCP at the edge of the pavement.

3.3. Temperature–Strain Effect of RCP

During the monitoring period, there was no influence of precipitation and less driving. Therefore, the influence of shrinkage and creep of the RCP can be ignored, and the internal strain of the RCP was mainly caused by the temperature under the constraints of the subgrade and surrounding pavement. Therefore, based on the monitoring data, the effect of horizontal position on the temperature-strain effect of RCP was investigated.

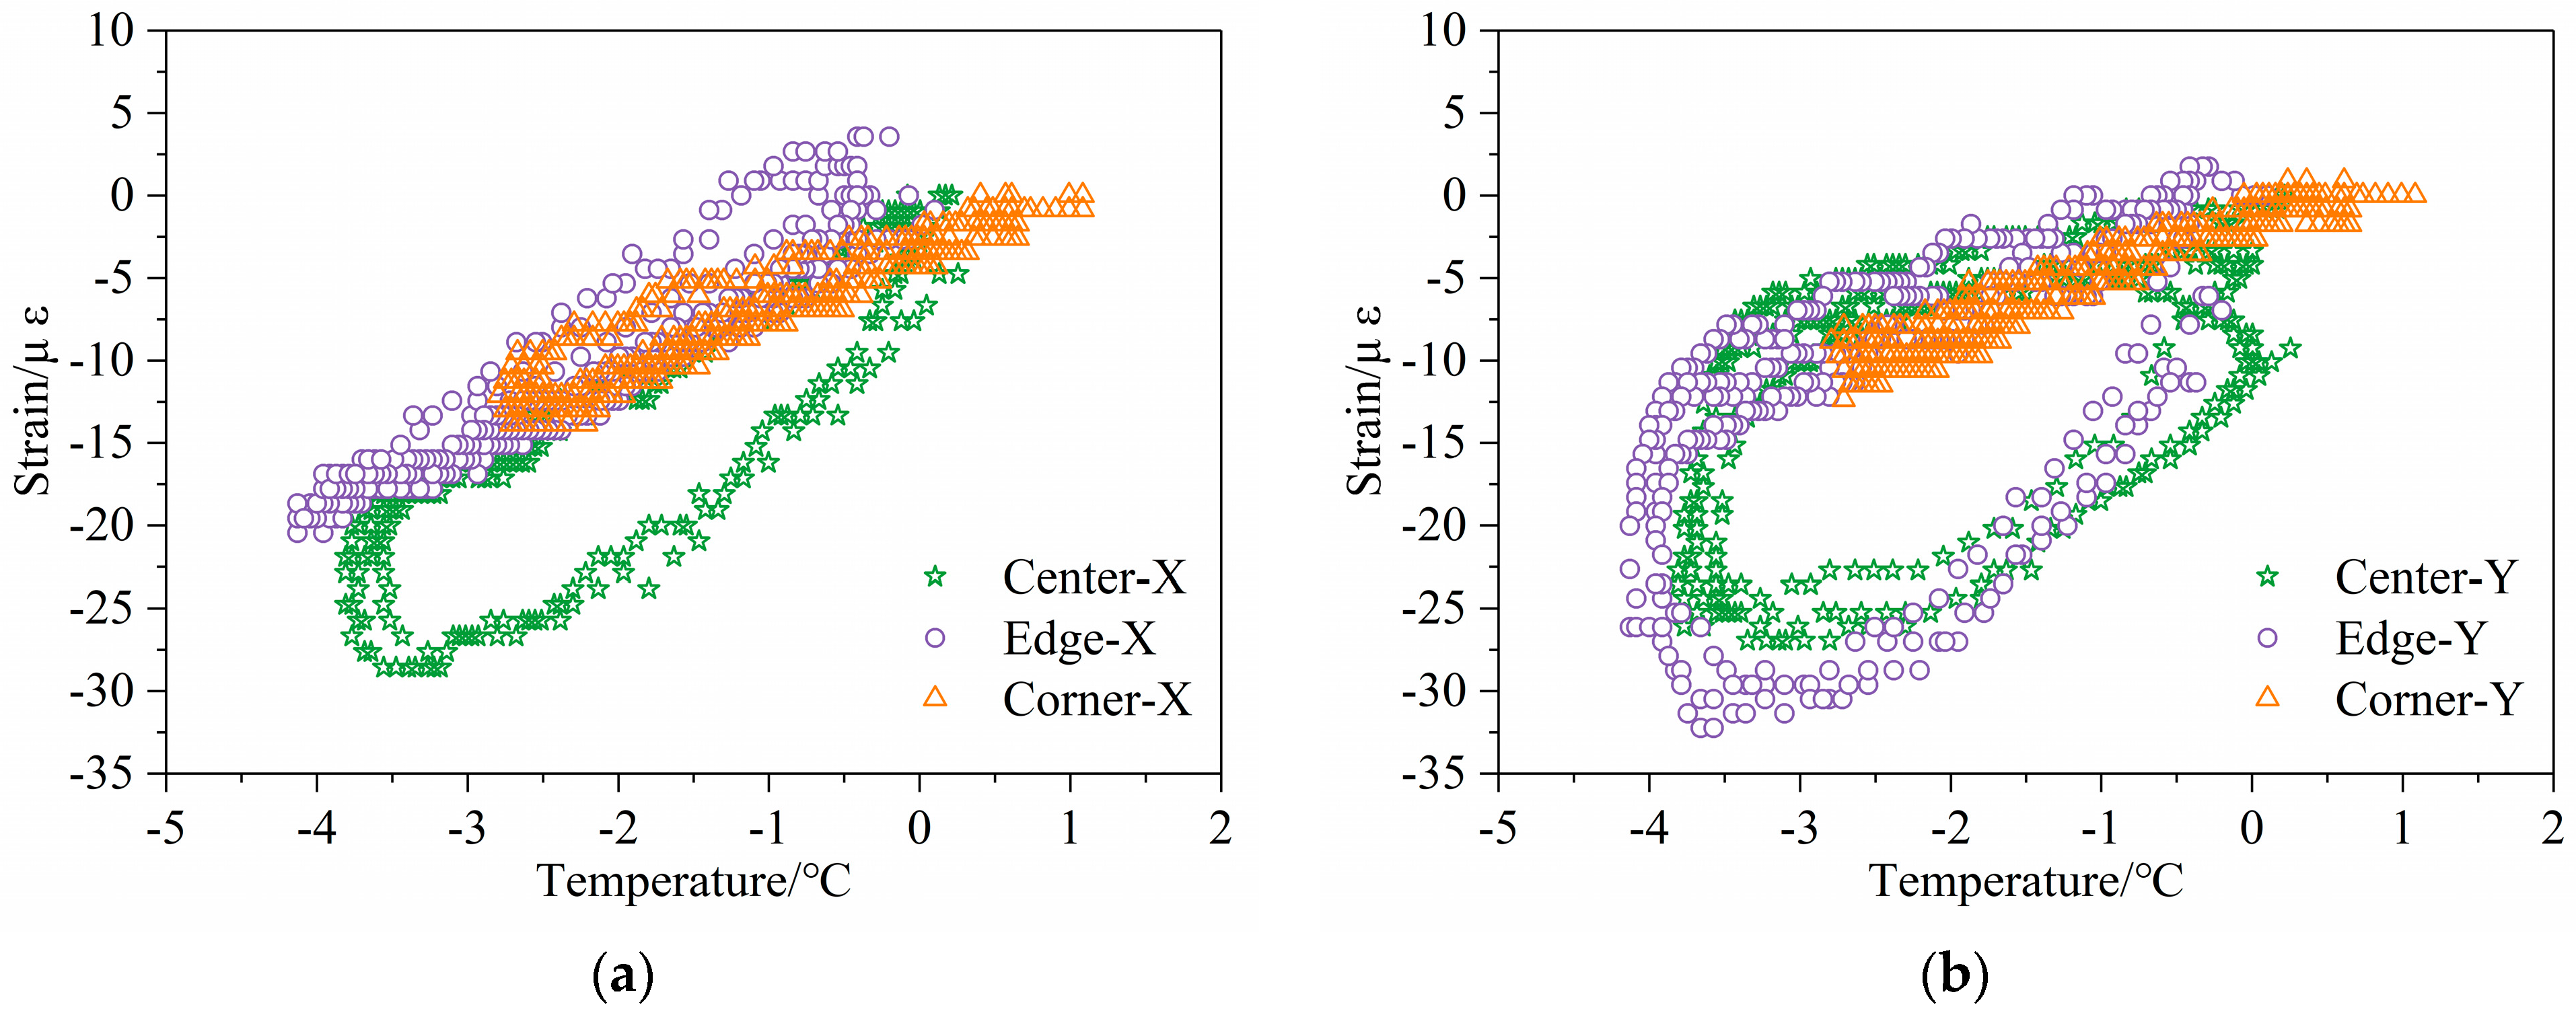
3.3.1. Temperature–Strain Hysteresis Effect

The temperature–strain coefficient characterizes the internal strain change of the RCP caused by a unit change in temperature and reflects the sensitivity of the RCP to temperature. The larger the temperature–strain coefficient, the greater the sensitivity of the RCP to temperature change.
According to the monitoring deployment scheme, the scatter diagram is drawn with the data obtained from the temperature sensor T4 and the X-axis and Y-axis strain sensors of the RCP bottom, and the results are shown in Figure 10. It can be seen that the change of strain with temperature was not linear. The strain paths of daytime heating and nighttime cooling did not coincide, and the temperature–strain curves show a significant hysteresis loop phenomenon. For the temperature–strain effect along the X-axis, the hysteresis loops became progressively smaller from the center to the edge and then to the corner of the pavement. At the corner of the pavement, the hysteresis loops became almost band-like. For the temperature–strain effect along the Y-axis, the hysteresis effect at the center and edge of the pavement was similar and stronger than that at the corner. This indicates that the deformation at the corner of the RCP was only affected by the temperature change, while at the center and edge of the pavement it was affected not only by the temperature change but also by the deformation of the corner, which was transferred to the center and edge of the pavement, resulting in the superposition of the deformation. Comparing the temperature–strain coefficients at the center, edge and corner of the RCP, it is found that the center and edge had the highest temperature sensitivity along the X-axis and therefore demonstrated a more obvious deformation under the same temperature conditions.

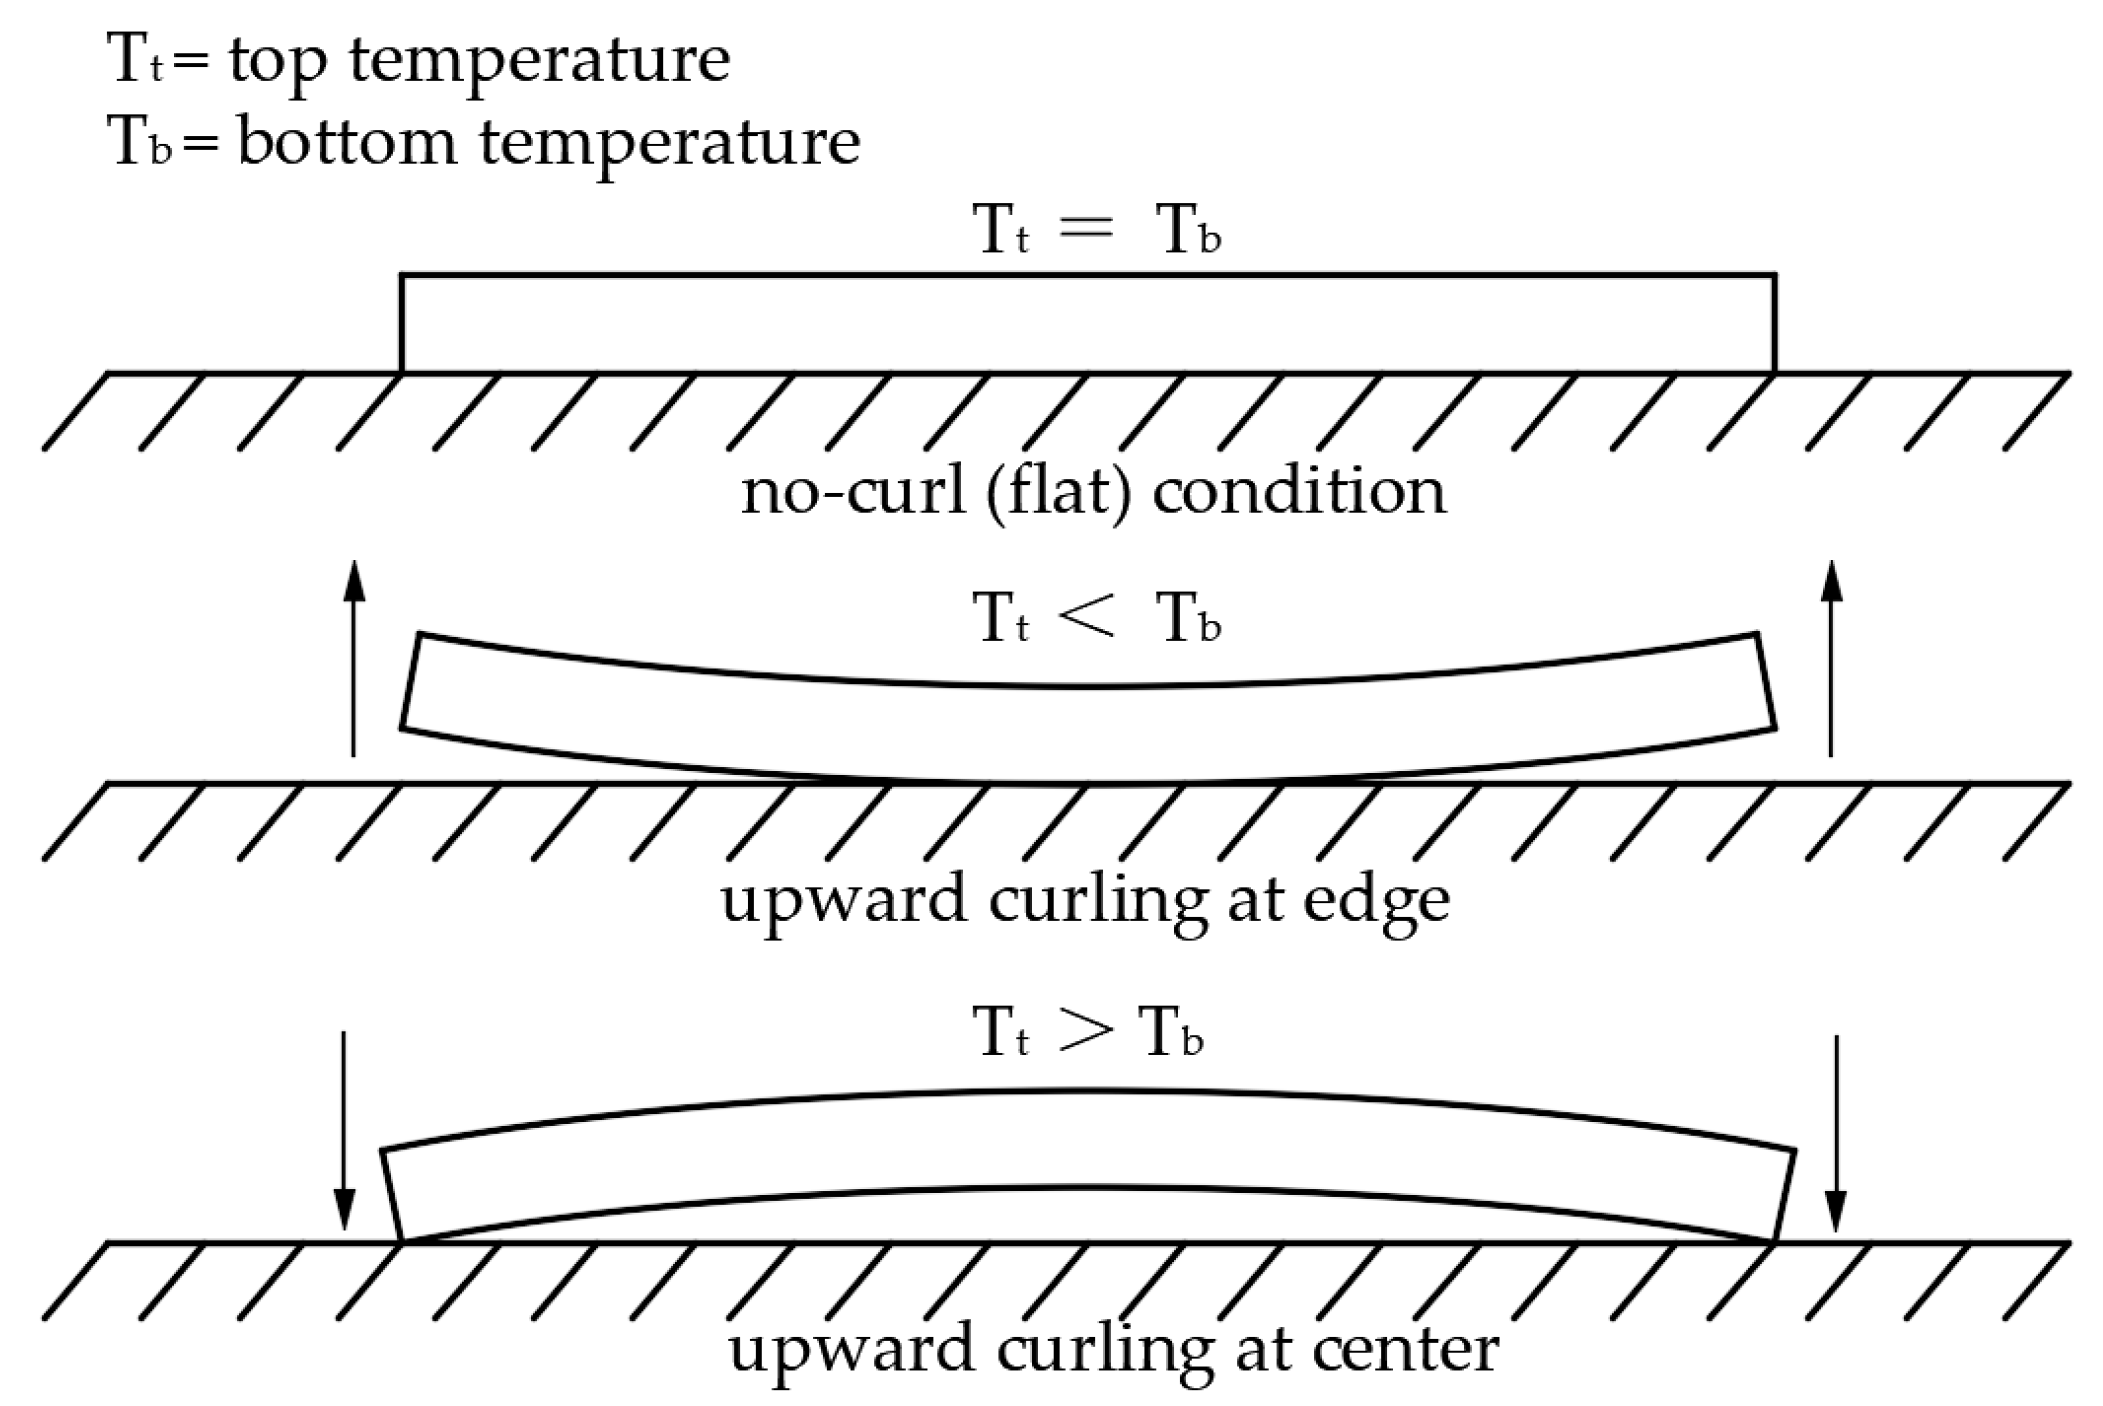
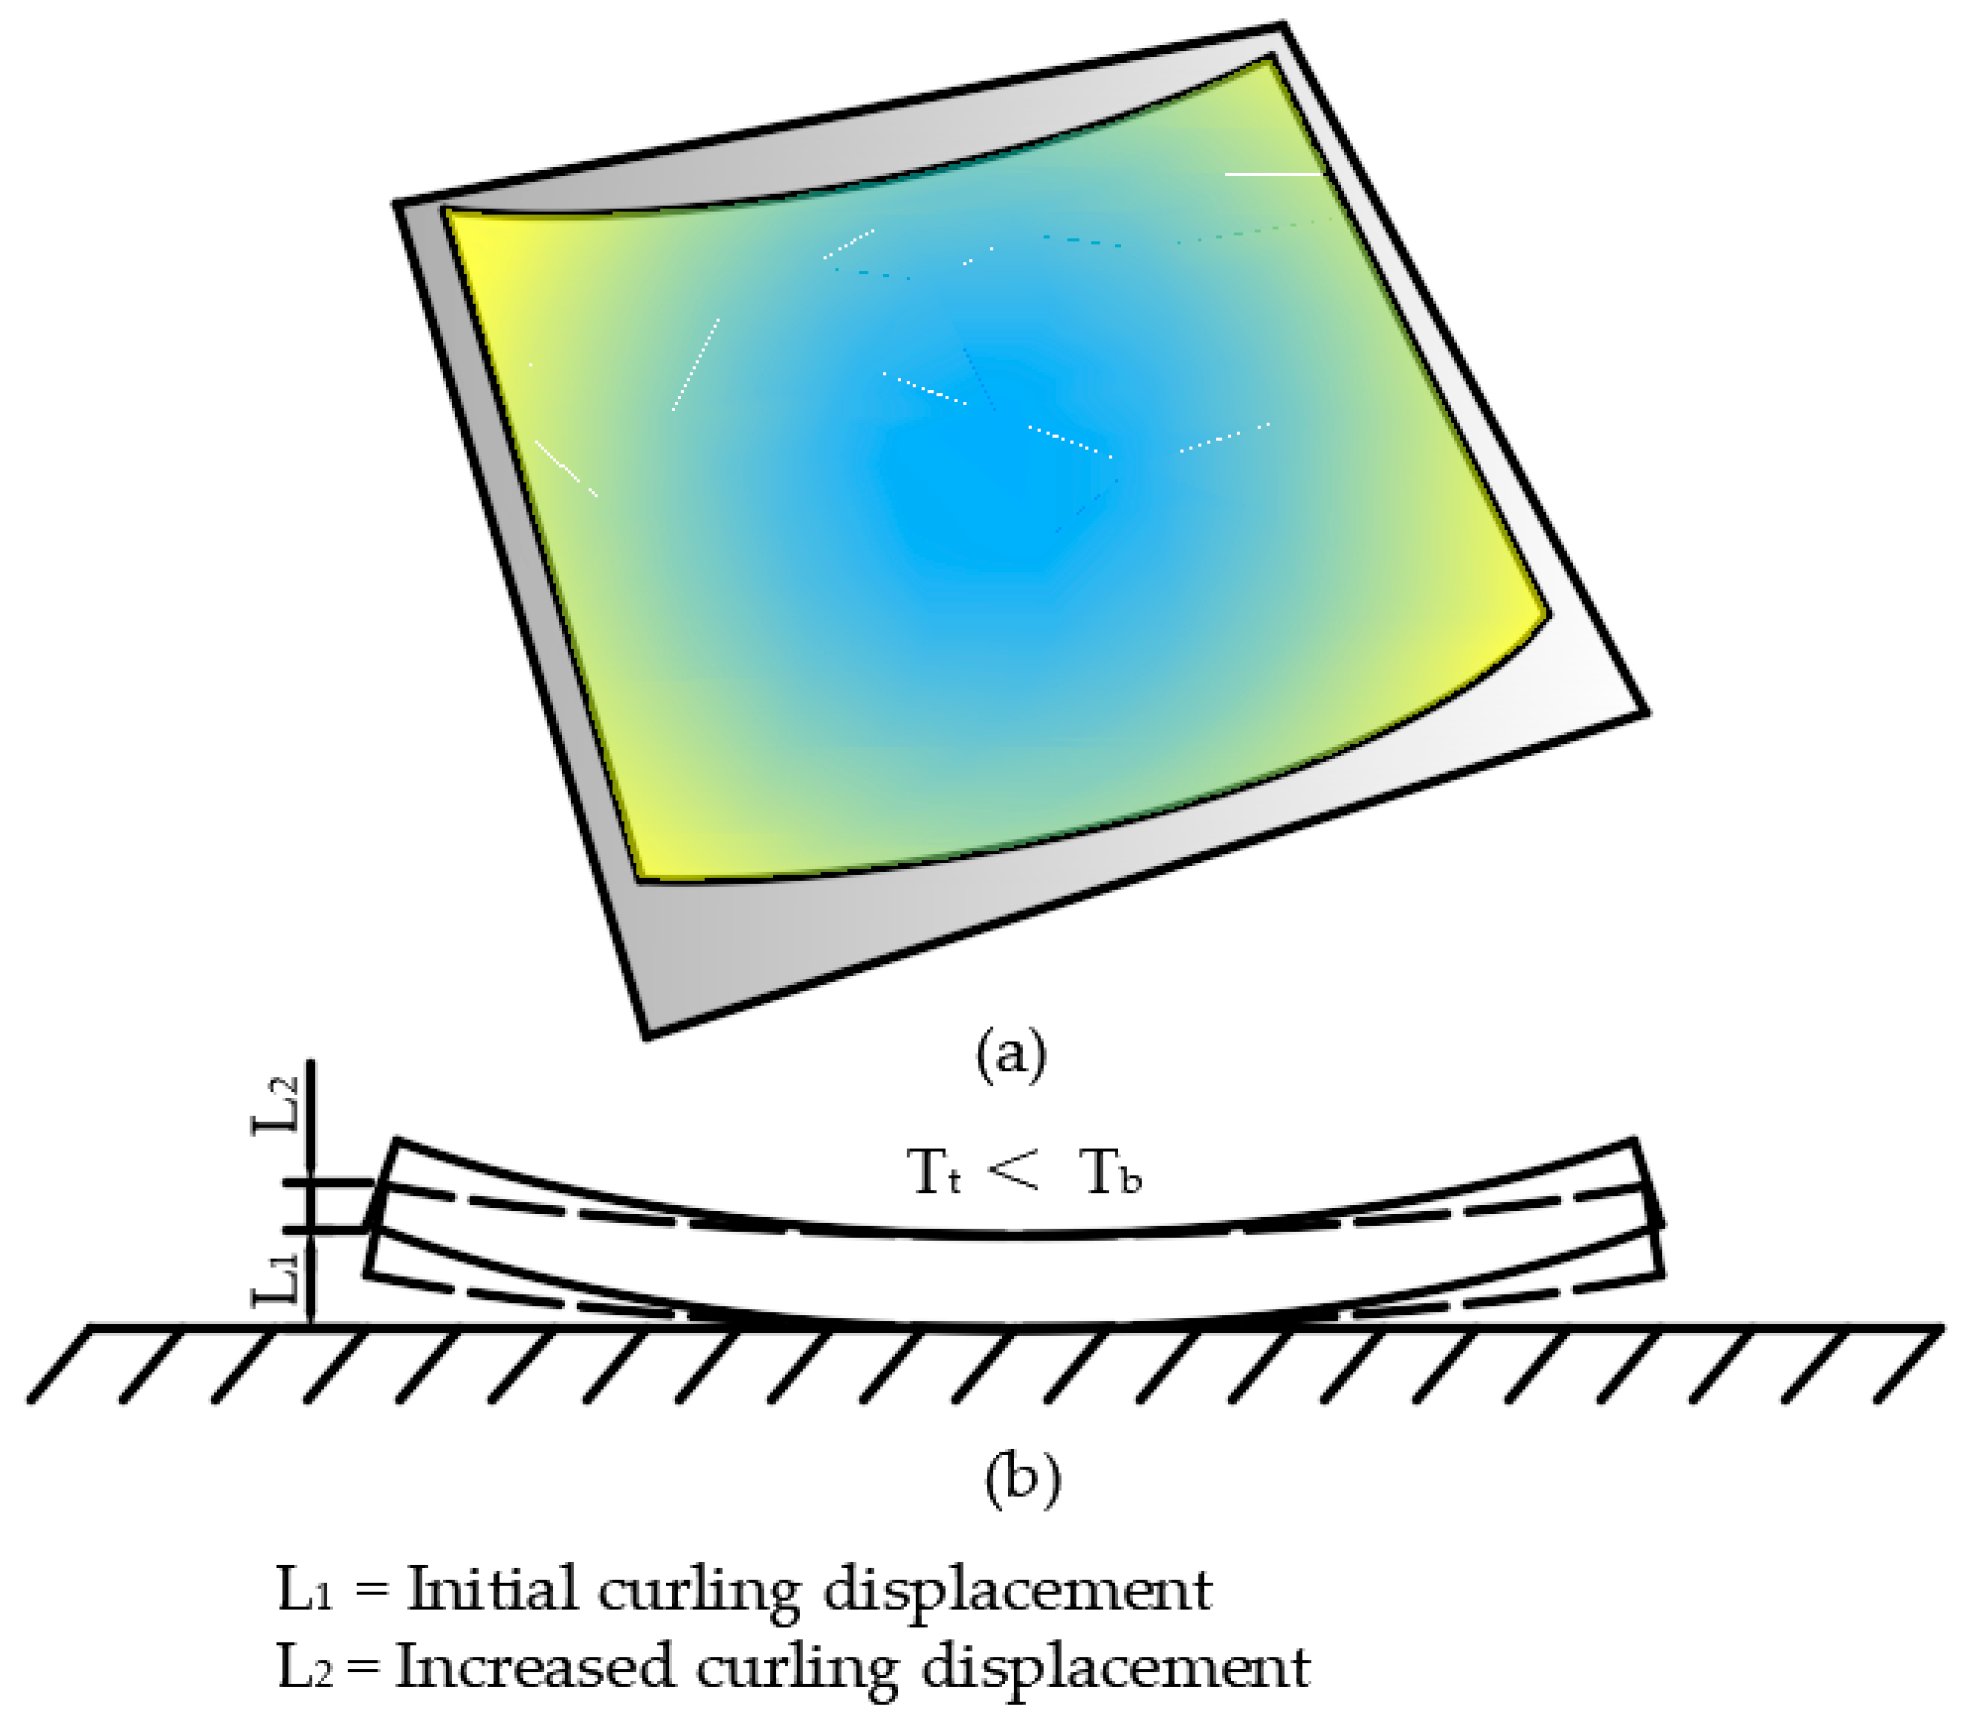
3.3.2. Temperature Curling Effect

The vertical strains at each horizontal position of the RCP characterize the curling effect of the pavement with the influence of temperature. Based on the measured data, scatter plots were drawn with the temperature gradient and vertical strain at each horizontal position, and a linear fit was performed based on the scatter plot. The results are shown in Figure 11. From Figure 11, the coefficients of temperature gradient and strain at the center, edge and corner of the pavement are −0.13, −0.37 and −0.25, respectively, which indicates that the edge of the pavement was the most sensitive to the change in the temperature gradient. When the negative temperature gradient is greater than 23.4 °C·m−1 or the positive temperature gradient is greater than 14.5 °C·m−1, the vertical strain at the edge of the pavement will be greater than the strain at the center and corner of the pavement, indicating that the curling effect at the edge of the RCP will be more obvious when the temperature gradient is outside the range of −23.4 to 14.5 °C·m−1 [43]. Therefore, when the RCP is set up with tie bars for the longitudinal joints and no dowel bars for the transverse joints, the deformation caused by the temperature gradient at the edge of the pavement is the most obvious. This should be focused on during the RCP design.

4. Conclusions

In this research, the temperature and strain at the center, edge and corner of RCP were monitored based on fiber Bragg grating sensors, and the horizontal distribution of temperature, strain and the temperature–strain effects on the RCP were investigated. The following conclusions were obtained.
(1)
The horizontal distribution of the temperature and temperature gradient of the RCP exhibited obvious inhomogeneity, resulting in the deviation of the theoretical calculation of the temperature characteristics from the actual situation. In particular, the larger negative temperature gradient at the corner will intensify the upward curling of the RCP caused by the negative temperature gradient, making the theoretical value smaller than the actual value when using the plane uniformity assumption. This should be highly regarded in the design and evaluation of the RCP;
(2)
The negative temperature gradient at the corner of the pavement aggravates the deformation of the pavement bottom at the center and edge, especially along the X-axis at the center and along the Y-axis and the Z-axis at the edge, resulting in the uneven distribution of the deformation. This leads to greater curling strain on the RCP at these locations;
(3)
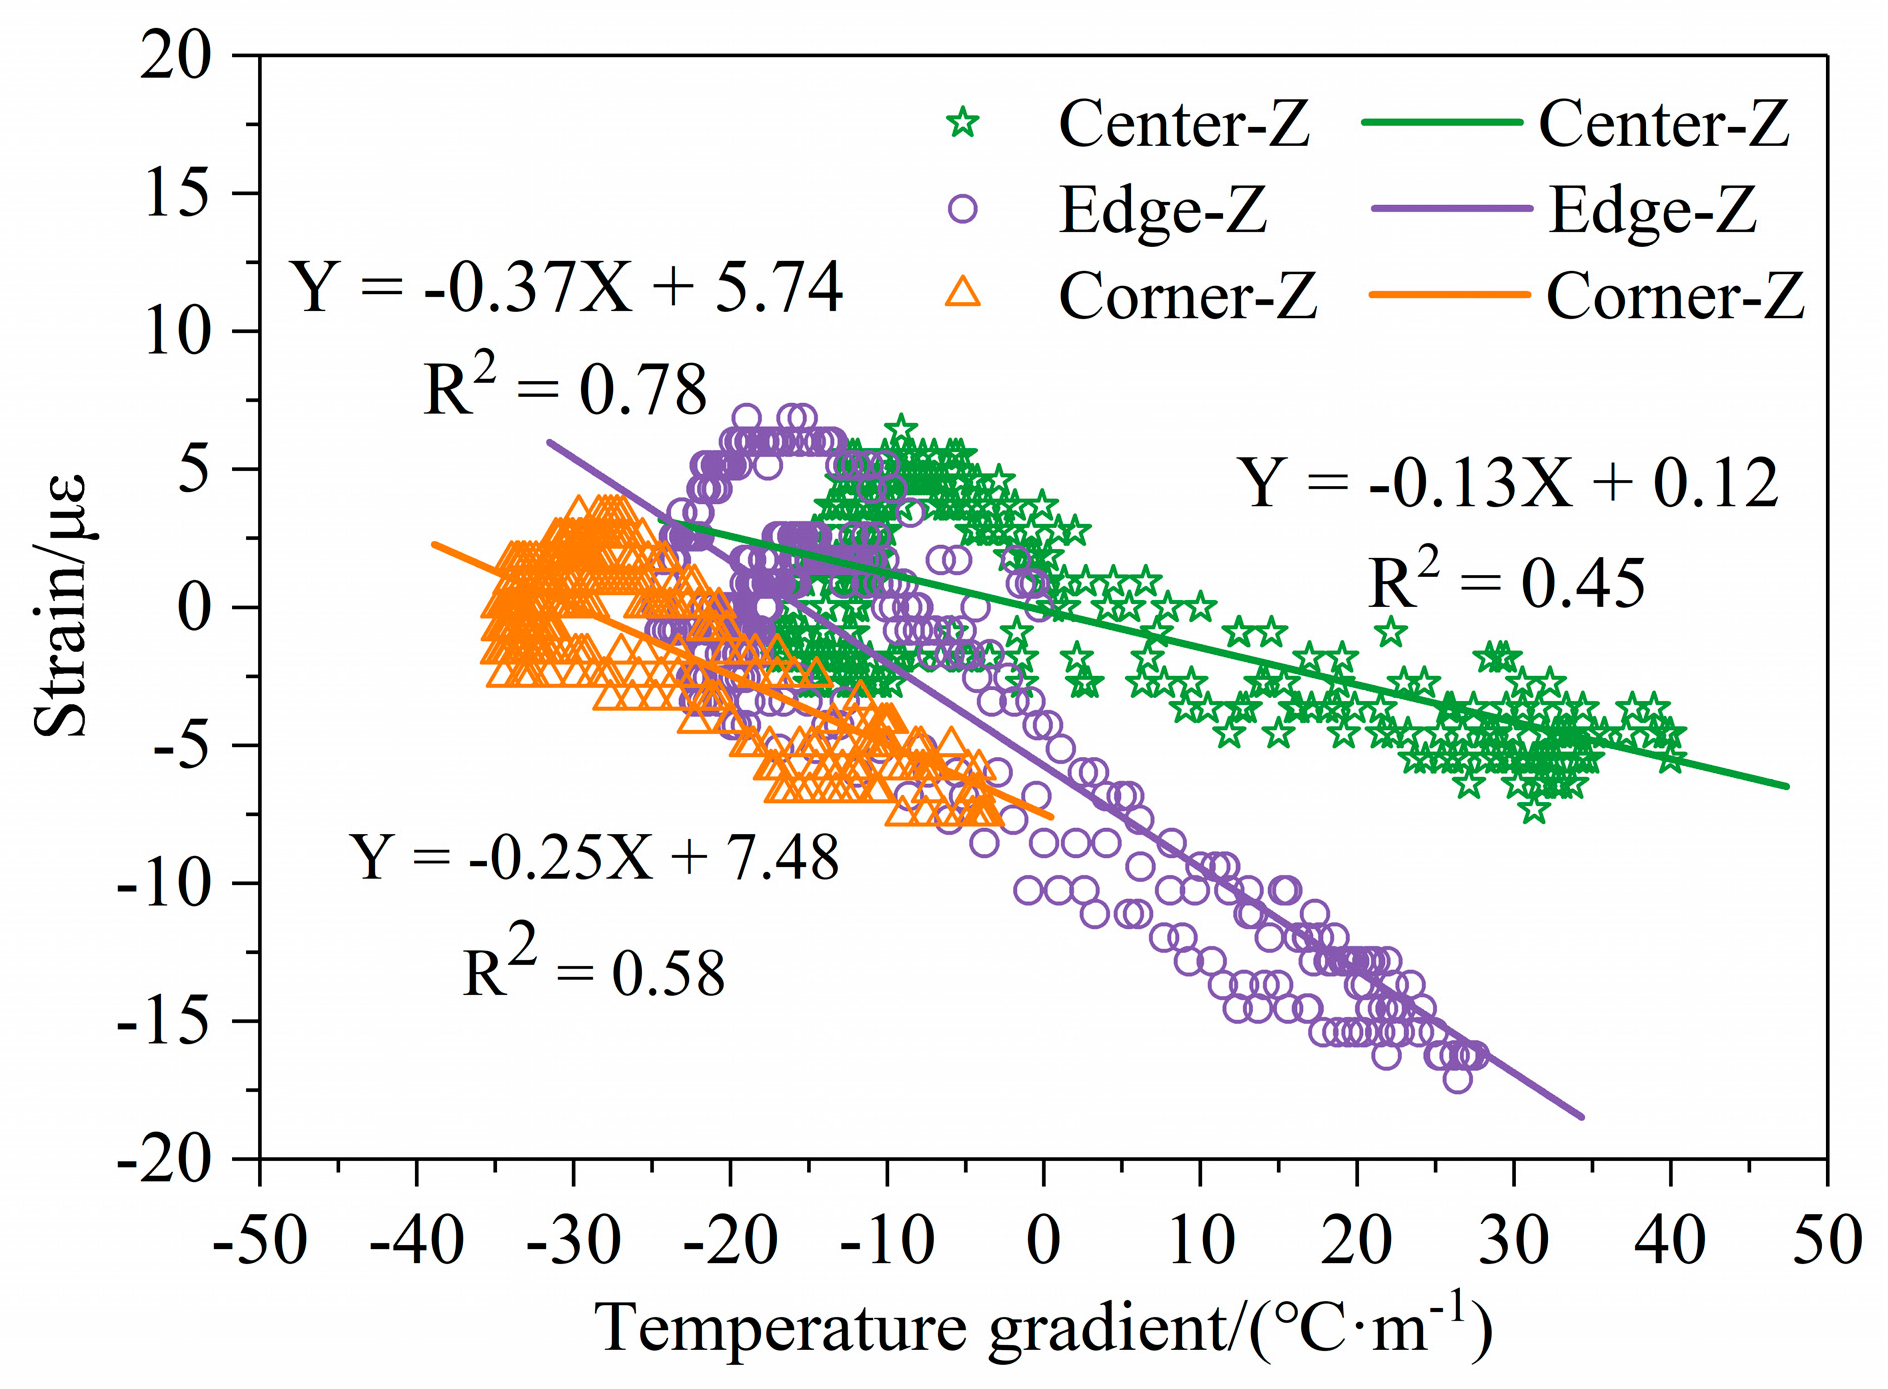
The temperature-strain effects indicate that the deformation at the corner of the RCP is affected only by the temperature change, while the deformations at the center and edge are affected not only by the temperature change but also by the deformation at the corner. The coefficients of temperature gradient and strain at the center, edge and corner of the pavement were 0.13, 0.37 and 0.25, respectively, which indicates that the edge of the pavement is the most sensitive to changes in temperature gradient. When the temperature gradient is less than −23.4 °C·m−1 or greater that 14.5 °C·m−1, the curling effect at the edge of the RCP is more obvious;
(4)
In this study, the horizontal distribution characteristics of the temperature effect on the RCP were analyzed based on the field monitoring data. In the subsequent study, numerical simulations will be carried out to further reveal the mechanism of the differences in the horizontal distribution of the RCP.

Author Contributions

Conceptualization, J.Y. and J.Z.; methodology, G.Z., J.Z. and J.Y.; Data curation, G.Z., J.Z. and S.Y.; software, G.Z. and S.Y.; formal analysis, G.Z. and S.Y.; resources, J.Y. and J.Z.; writing-original draft preparation, G.Z.; writing-review and editing, G.Z., J.Z. and J.Y.; funding acquisition, J.Y. All authors have read and agreed to the published version of the manuscript.

Funding

This research was funded by the National Key R&D Program of China, grant number 2019YFB1310600, and the National Science Foundation of China, grant number U1933116.

Data Availability Statement

Not applicable.

Conflicts of Interest

The authors declare no conflict of interest.

References

  1. Yang, S.; Ceylan, H.; Gopalakrishnan, K.; Kim, S.; Taylor, P.C.; Alhasan, A. Characterization of environmental loads related concrete pavement deflection behavior using Light Detection and Ranging technology. Int. J. Pavement Res. Technol. 2018, 11, 470–480. [Google Scholar] [CrossRef]
  2. Qiao, S.; Xiong, Z.; Li, Y.; Ye, Z.; He, S.; Li, L.; Zeng, Y. Mechanical properties of seawater sea-sand concrete exposed to daily temperature variations. Buildings 2022, 12, 517. [Google Scholar] [CrossRef]
  3. Ioannides, A.M.; Davis, C.M.; Weber, C.M. Westergaard curling solution reconsidered. Transp. Res. Rec. 1999, 1684, 61–70. [Google Scholar] [CrossRef]
  4. Mohamed, A.R.; Hansen, W. Effect of nonlinear temperature gradient on curling stress in concrete pavements. Transp. Res. Rec. 1997, 1568, 65–71. [Google Scholar] [CrossRef]
  5. Hiller, J.E.; Roesler, J.R. Simplified nonlinear temperature curling analysis for jointed concrete pavements. J. Transp. Eng. 2010, 136, 654–663. [Google Scholar] [CrossRef]
  6. Chen, J.; Wang, H.; Xie, P. Pavement temperature prediction: Theoretical models and critical affecting factors. Appl. Therm. Eng. 2019, 158, 113755. [Google Scholar] [CrossRef]
  7. Liao, W.; Zhuang, Y.; Zeng, C.; Deng, W.; Huang, J.; Ma, H. Fiber optic sensors enabled monitoring of thermal curling of concrete pavement slab: Temperature, strain and inclination. Measurement 2020, 165, 108203. [Google Scholar] [CrossRef]
  8. Sharifi, N.P.; Mahboub, K.C. Application of a PCM-rich concrete overlay to control thermal induced curling stresses in concrete pavements. Constr. Build. Mater. 2018, 183, 502–512. [Google Scholar] [CrossRef]
  9. Nam, B.H.; Yeon, J.H.; Behring, Z. Effect of daily temperature variations on the continuous deflection profiles of airfield jointed concrete pavements. Constr. Build. Mater. 2014, 73, 261–270. [Google Scholar] [CrossRef]
  10. Zhou, Y.; Tan, Z.; Liu, S.; Niu, K. Analysis of near-corner stresses in concrete pavement structure. Eng. Mech. 2010, 27, 205–211. [Google Scholar]
  11. Shao, J.; Lister, P.J. An automated nowcasting model of road surface temperature and state for winter road maintenance. J. Appl. Meteorol. Climatol. 1996, 35, 1352–1361. [Google Scholar] [CrossRef]
  12. AASHTO. Mechanistic-Empirical Pavement Design Guide: A Manual of Practice; AASHTO: Washington, DC, USA, 2008. [Google Scholar]
  13. Westergaard, H.M. Analysis of stresses in concrete pavements due to variations of temperature. In Highway Research Board Proceedings; National Research Council: Washington, DC, USA, 2 December 1926. [Google Scholar]
  14. Thomlinson, J. Temperature variations and consequent stresses produced by daily and seasonal temperature cycles in concrete slabs. Concr. Constr. Eng. 1940, 36, 298–307. [Google Scholar]
  15. Huang, B.; Shu, X.; Li, G. Laboratory investigation of Portland cement concrete containing recycled asphalt pavements. Cem. Concr. Res. 2005, 35, 2008–2013. [Google Scholar] [CrossRef]
  16. Choubane, B.; Tia, M. Nonlinear temperature gradient effect on maximum warping stresses in rigid pavements. Transp. Res. Rec. 1992, 1370, 11. [Google Scholar]
  17. Liang, R.Y.; Niu, Y.Z. Temperature and curling stress in concrete pavements: Analytical solutions. J. Transp. Eng. 1998, 124, 91–100. [Google Scholar] [CrossRef]
  18. Kim, S.M.; Nam, J.H. Measurements and experimental analysis of temperature variations in Portland cement concrete pavement systems. Road Mater. Pavement Des. 2010, 11, 745–771. [Google Scholar] [CrossRef]
  19. Tian, B.; Quan, L.; Niu, K. Structural experiment and theoretical analysis of thermal curling in JPCP with different base types. China J. Highw. Transp. 2014, 27, 17–26. [Google Scholar]
  20. Quan, L.; Tian, B.; Chen, L. Experimental Investigation of built-in curling evolution in full scale concrete pavement. J. Highw. Transp. Res. Dev. 2017, 34, 1–8. [Google Scholar]
  21. Guo, S.; Dai, Q.; Si, R.; Sun, X.; Lu, C. Evaluation of properties and performance of rubber-modified concrete for recycling of waste scrap tire. J. Clean. Prod. 2017, 148, 681–689. [Google Scholar] [CrossRef]
  22. Roychand, R.; Gravina, R.J.; Zhuge, Y.; Ma, X.; Youssf, O.; Mills, J.E. A comprehensive review on the mechanical properties of waste tire rubber concrete. Constr. Build. Mater. 2020, 237, 117651. [Google Scholar] [CrossRef]
  23. Mubaraki, M.; Abd-Elhady, A.A.; Sallam, H.E.M. Mixed mode fracture toughness of recycled tire rubber-filled concrete for airfield rigid pavements. Int. J. Pavement Res. Technol. 2013, 6, 8–14. [Google Scholar]
  24. Pham, P.N.; Zhuge, Y.; Turatsinze, A.; Toumi, A.; Siddique, R. Application of rubberized cement-based composites in pavements: Suitability and considerations. Constr. Build. Mater. 2019, 223, 1182–1195. [Google Scholar] [CrossRef]
  25. Ho, A.C.; Turatsinze, A.; Hameed, R.; Vu, D.C. Effects of rubber aggregates from grinded used tyres on the concrete resistance to cracking. J. Clean. Prod. 2012, 23, 209–215. [Google Scholar] [CrossRef]
  26. Sreedhar, S.; Biligiri, K.P. Comprehensive laboratory evaluation of thermophysical properties of pavement materials: Effects on urban heat island. J. Mater. Civ. Eng. 2016, 28, 04016026. [Google Scholar] [CrossRef]
  27. Hall, M.R.; Dehdezi, P.K.; Dawson, A.R.; Grenfell, J.; Isola, R. Influence of the thermophysical properties of pavement materials on the evolution of temperature depth profiles in different climatic regions. J. Mater. Civ. Eng. 2012, 24, 32–47. [Google Scholar] [CrossRef]
  28. Stempihar, J.J.; Pourshams-Manzouri, T.; Kaloush, K.E.; Rodezno, M.C. Porous asphalt pavement temperature effects for urban heat island analysis. Transp. Res. Rec. 2012, 2293, 123–130. [Google Scholar] [CrossRef]
  29. Phelan, P.E.; Kaloush, K.; Miner, M.; Golden, J.; Phelan, B.; Silva III, H.; Taylor, R.A. Urban heat island: Mechanisms, implications, and possible remedies. Annu. Rev. Environ. Resour. 2015, 40, 285–307. [Google Scholar] [CrossRef]
  30. Herrero, S.; Mayor, P.; Hernández-Olivares, F. Influence of proportion and particle size gradation of rubber from end-of-life tires on mechanical, thermal and acoustic properties of plaster–rubber mortars. Mater. Des. 2013, 47, 633–642. [Google Scholar] [CrossRef] [Green Version]
  31. Sukontasukkul, P. Use of crumb rubber to improve thermal and sound properties of pre-cast concrete panel. Constr. Build. Mater. 2009, 23, 1084–1092. [Google Scholar] [CrossRef]
  32. Ocholi, A.; Ejeh, S.P.; Yinka, S.M. An investigation into the thermal performance of rubber-concrete. Acad. J. Interdiscip. Stud. 2014, 3, 29. [Google Scholar] [CrossRef]
  33. Ferretti, E. Waste tire rubberized concrete plates for airport pavements: Stress and strain profiles in time and space domains. Comput. Mater. Contin. 2012, 27, 231–273. [Google Scholar]
  34. Xu, G.; Sun, L.; Pei, Z. Analysis of structural mechanics response of rubber concrete pavement under temperature gradient. J. Inn. Mong. Univ. Sci. Technol. 2019, 38, 380–388. [Google Scholar]
  35. Zhou, Z.; Liu, W.; Huang, Y.; Wang, H.; He, J.; Huang, M.; Ou, J. Optical fiber Bragg grating sensor assembly for 3D strain monitoring and its case study in highway pavement. Mech. Syst. Signal Process. 2012, 28, 36–49. [Google Scholar] [CrossRef]
  36. Zhao, H.; Wu, C.; Wang, X.; Zheng, Y. Pavement condition monitoring system at shanghai Pudong international airport. In Pavement Materials, Structures, and Performance (GSP 239); ASCE: Reston, VA, USA, 2014; pp. 283–295. [Google Scholar] [CrossRef]
  37. JTG 3420-2020; Testing Methods of Cement and Concrete for Highway Engineering. China Ministry of Transport: Beijing, China, 2020.
  38. ASTM C78; Standard Test Method for Flexural Strength of Concrete (Using Simple Beam with Third-Point Loading). ASTM International: West Conshohocken, PA, USA, 2022.
  39. ASTM C469; Standard Test Method for Static Modulus of Elasticity and Poisson’s Ratio of Concrete in Compression. ASTM International: West Conshohocken, PA, USA, 2022.
  40. AASHTO T336; Standard Method of Test for Coefficient of Thermal Expansion of Hydraulic Cement Concrete. AASHTO: Washington, DC, USA, 2019.
  41. Wang, Z.; Zhang, W.; Gao, X.; Liu, H.; Böhlke, T. Stability analysis of soil slopes based on strain information. Acta Geotech. 2020, 15, 3121–3134. [Google Scholar] [CrossRef]
  42. Armaghani, J.M.; Larsen, T.J.; Smith, L.L. Temperature response of concrete pavements. In Proceedings of the 66th Annual Meeting of the Transportation Board, Washington, DC, USA, 12 January 1987. [Google Scholar]
  43. Zhao, H.; Ma, L. Investigation into effects of temperature variations on airport cement pavements based on measured data. J. Tongji Univ. (Nat. Sci.) 2019, 47, 1764–1771. [Google Scholar] [CrossRef]
Figure 1. Schematic diagram of pavement in test area.
Buildings 13 00686 g001
Figure 2. Schematic diagram of sensor layout. (a) Spatial diagram and (b) platform.
Buildings 13 00686 g002
Figure 3. Temperature time history curve of RCP. (a) Top of pavement; (b) bottom of pavement.
Buildings 13 00686 g003
Figure 4. Temperature gradient time history curve of RCP.
Buildings 13 00686 g004
Figure 5. Temperature gradient frequency distribution of RCP.
Buildings 13 00686 g005
Figure 6. Diagram of curling of concrete pavement.
Buildings 13 00686 g006
Figure 7. Increased curling deformation of concrete pavement. (a) Spatial diagram and (b) planform.
Buildings 13 00686 g007
Figure 8. Horizontal strain time history curve of RCP. (a) X axis and(b) Y axis.
Buildings 13 00686 g008
Figure 9. Vertical strain time history curve of RCP.
Buildings 13 00686 g009
Figure 10. Relationship of temperature and horizontal strain of RCP. (a) X axis and (b) Y axis.
Buildings 13 00686 g010
Figure 11. Relationship of temperature and vertical strain of RCP.
Buildings 13 00686 g011
Table 1. Mixing proportion of rubberized concrete and ordinary concrete (kg/m3).
CementWaterRubber PowderSandAggregate
(5–10 mm)
Aggregate
(10–19 mm)
Aggregate
(19–37.5 mm)
Water Reducing Agent
4051621103584104105465.7
Table 2. Technical characteristics of rubber powder.
PropertiesSpecification
Organic matter (%)67.21
Inorganic content (%)32.79
Rubber powder size (mesh)30–60
Contact angle (°)0
Table 3. Properties of rubberized concrete.
Test ItemsTest ValueStandard Method (Specificatioin)
Compressive strength (MPa)36.5GB/T 50081 [35]
Flexural-tensile strength (MPa)5.0ASTM C78 [36]
Elasticity modulus (MPa)36700ASTM C469 [37]
Coefficient of thermal expansion9.6 × 10−6AASHTO 336 [38]
Disclaimer/Publisher’s Note: The statements, opinions and data contained in all publications are solely those of the individual author(s) and contributor(s) and not of MDPI and/or the editor(s). MDPI and/or the editor(s) disclaim responsibility for any injury to people or property resulting from any ideas, methods, instructions or products referred to in the content.

