1. Introduction
In a competitive and changing environment, it is necessary to have complete information about the final services that are provided and the costs as a whole from a budgetary perspective; this essentially recognizes in a minor way the different processes and their efficiency and burdens so that decisions can be made quickly so as to carry out modifications and anticipate or evaluate future scenarios regarding external factors. The new technologies and the demands of quality, environment, and competitiveness play a fundamental role in the internal costs that must be managed to achieve the objectives of the organization so as to position itself competitively; on the other hand, difficulties in evaluating the engagement of waste globally are numerous, including differences between cities’ characteristics, morphology, and population density.
The dispersion, the breadth of services, and the models applied are factors that intervene in the design of service. Therefore, the costs of management waste management also evolved toward separating more fractions, more superior technology, and greater complexity. Thus, planning and establishing strategic and operational objectives are fundamental to achieving viability and permanence, which are vitally important because of a map of activities and a system of indicators aligned with goals and aimed at decision-making. The development of management control and cost accounting should allow knowing that disasters are useful for evaluating the possibility of deviations and improving decision making for the implementation of new technologies and new process techniques for which it is necessary to have sufficient information [
1]. The construction and demolition (C & D) sector is well known for its fast growth activities worldwide [
2]; however, this also implies an increase in waste volume, which concerns environmentalists and presents a challenge for sustainable waste management. In Europe, the waste quantity from C & D has 0 million tons in t year [
3].
The construction industry generates around 531 million tons of construction and demolition waste, accounting for approximately a quarter of all worldwide waste [
4].
The relationship between environmental innovation and policy is also essential. Market-based instruments (taxes, subsidies, and other incentives) are better than laws that promote ecological innovation [
4].
The European Commission has proposed new purposes and goals for this kind of waste in the circular economy package; however, since, in practice the RCD management landscape is quite heterogeneous in the Member States, it is urgent to produce new approaches that consider the entire cost chain of the construction sector. This analysis is intended to be one of those necessary devices, and its purposes remain closely aligned with European tactics that focus on improving waste management.
In Europe, since the European Union adopted the Waste Framework Directive (WFD) in 2008, setting a target for the C & D waste recovery rate, there has been an improvement in the rate of recovery of C & D waste in European countries. For example, in the United Kingdom, the recovery rate of C & D waste has improved significantly, from 69% in 2005 [
5] to around 90% in 2017, which is above the target (70%) set by the WFD [
6]. In Norway, the total amount of construction and demolition waste was 814,000 tons in 2013, and among this, 603,000 tons of waste (74%) were recovered, and 210,000 tons of waste (26%) were disposed of [
7]. However, the average R&D waste recovery rate of 27 EU countries of 46% [
4] shows that many European countries dispose of a large part of C & D waste in landfills.
In the case of Spain, the high volume of C & D waste generated is accompanied by a low recycling rate. Construction waste processing has become increasingly common in most industrialized countries since the early 1980s. However, concern about waste management in Spain did not arise until 2001 with the first national plan on C & D waste [
8].
In Spain, through royal regulation decree 646/2020, it is compulsory to have a C & D waste management study to obtain a construction permit with which a project can be built. Spain also has undergone periods with a high volume of construction activities during which approximately 60% of the construction and demolition waste was created [
9].
In Spain, many regulations oblige the promoter of the plan to integrate a construction and demolition waste management analysis in the construction plan and oblige the contractor to design a building and demolition waste management strategy for the work [
9]. National Decree 105/2008 also mandates that the division of creation and demolition waste be carried out on-site and prohibits waste removal without this procedure; this discourages disposal of recyclable build-and-wreck waste [
10]. However, new challenging situations have been faced by the country. The Spanish government has set a comprehensive legislative framework for achieving a construction and demolition waste recycling rate of 40% [
11].
Despite Spain having less creation and demolition waste than other territories in Europe, it is also a challenge because there should be clear policies and regulations regarding waste management [
11]. However, it is worth mentioning today’s case of waste in Spain. INE [
12] data indicate that the total amount of waste generated in Spain by 2018 was 38,076,000 tons [
11], where the aim proposed by the European Union is to reach 70% of the recycling target by the year 2030 [
13]. To deepen the current situation, it is significant to know the recycling rates in Spain; as of 2018, the total waste recycled was 38.7% [
12].
It can be seen that there is a gap between generated and recycled waste. To improve this situation, various regulations have been implemented by the European Union. In the case of Spain, the main issues emerge from the nonstrict rules and the lower prices for the raw materials used in construction-related activities [
4].
However, this article mainly focuses on the economic part of waste management. Thus, the report represents the cost of waste disposal and the economic potential of specific waste. In many regions, construction industries try to avoid payment and taxation regarding redenomination; this indicates the origin of the high volume of garbage. Various factors have been analyzed to study this phenomenon, such as the cost of disposal, the total volume of waste generated, and recycling rates, along with disposal analysis.
This article shows waste management from an economic point of view. The high waste generated by the construction industries is well known; therefore, this waste is characterized as having potential even after demolition, as occurs in many cases. To understand the impact of C & D waste, a graph indicates the total waste generated in Spain, as shown in
Figure 1.
Figure 1 shows the quantity of waste produced from different fields; the industry field generates the highest waste, totaling 40,587,000 tons. Following this number is the second most significant sector, the construction field, with 38,076,000 techniques. This value directly indicates the rapid growth of construction and demolition waste. It is worth mentioning the other areas, trash producers, as is the case for household and water waste, with 22,699,000 tons and 24,233,000 tons, respectively [
14]. The fields with lower waste generation compared to the others are the agriculture and service-related activities, with values such as 6,258,000 tons and 5,968,000 tons, respectively [
14].
This waste volume requires treatment and proper measures to mitigate these sectors’ adverse environmental effects. Therefore, a study has been focused on construction and demolition waste, as it is the sector that produces the most quantity of waste compared to other categories [
15]. In Spain and Europe, construction and demolition in the building sector occur in large volumes, which is a challenge for sustainable waste management [
16]; thus, this article tackles the possible opportunities from an economic perspective.
At the end of 2019, Europe launched a new action plan, the European Green Deal [
17], to ensure the EU economy’s sustainable development and make Europe the first climate-neutral continent by 2050. Achieving this goal requires changing climate and environmental opportunities in general policies and achieving a just and inclusive transition for all.
One of the European Green Deal principles drove a new action plan for a circular economy [
18]. The European Commission implemented it on 25 March 2020 with a definition of the construction industry as one of its priorities. Europe is the leading consumer of resources; about half of the total is used, and raw materials are extracted.
At the national level, aligning with European plans and strategies and accelerating the transition to a circular economy model, the government of Spain approved in June 2020 the Spanish Circular Economy Strategy [
19], detecting the construction and demolition sector as one of the priority sectors for action. There is also the State Framework Plan for Waste Management (PEMAR) 2016-202014 and Law 22/2011 of 28 July on waste and contaminated soils. The main objectives are to regulate waste management, promote waste prevention activities, and reduce negative impacts on human health and the environment. For this, some autonomous communities of Spain, such as Andalusia, Aragon, Catalonia, Extremadura, Galicia, Navarra, the Basque Country, and Castilla la Mancha, have launched environmental plans and strategies promoting the circular economy.
According to the Ministry of Development of Spain, economic recovery for waste management is calculated from the estimated amount of waste generated on-site.
The price includes segregation at the source of the waste generated, the transfer to waste containers at the clean point of the work located in the Conservation and Exploitation Center, the transport of each waste to the corresponding manager, and the deposition of the trash.
Given the characteristics of the work and the expected volumes of waste generation, a ratio per ton has been established and set at EUR 1060.
Considering that there is waste whose budget for treatment is included in other work items, such as preliminary demolition work, the total waste to be considered in the valuation is 4.35 tons, so the economic valuation for waste management amounts to EUR 4611.
In the face of economic problems, this can mean transitioning to the circular economy and executing the previous waste order, the Spanish Recovery, Conversion, and Resilience Plan included in the Composition XII cycle of “Industrial Policy of Spain 2030.” The activities are grouped in the “Support Plan Executing the Spanish Strategy, Circular Economy (EEEC) and Waste Regulation,” which in turn accompanies the reform “Waste policy and promotion of the circular economy”.
2. Materials and Methods
The European Commission has postulated new aims and targets for this kind of waste in the circular economy package; however, since, in practice the landscape of CDW management is quite heterogeneous in the Member States, it is urgent to produce new approaches that consider the entire cost chain of the construction sector.
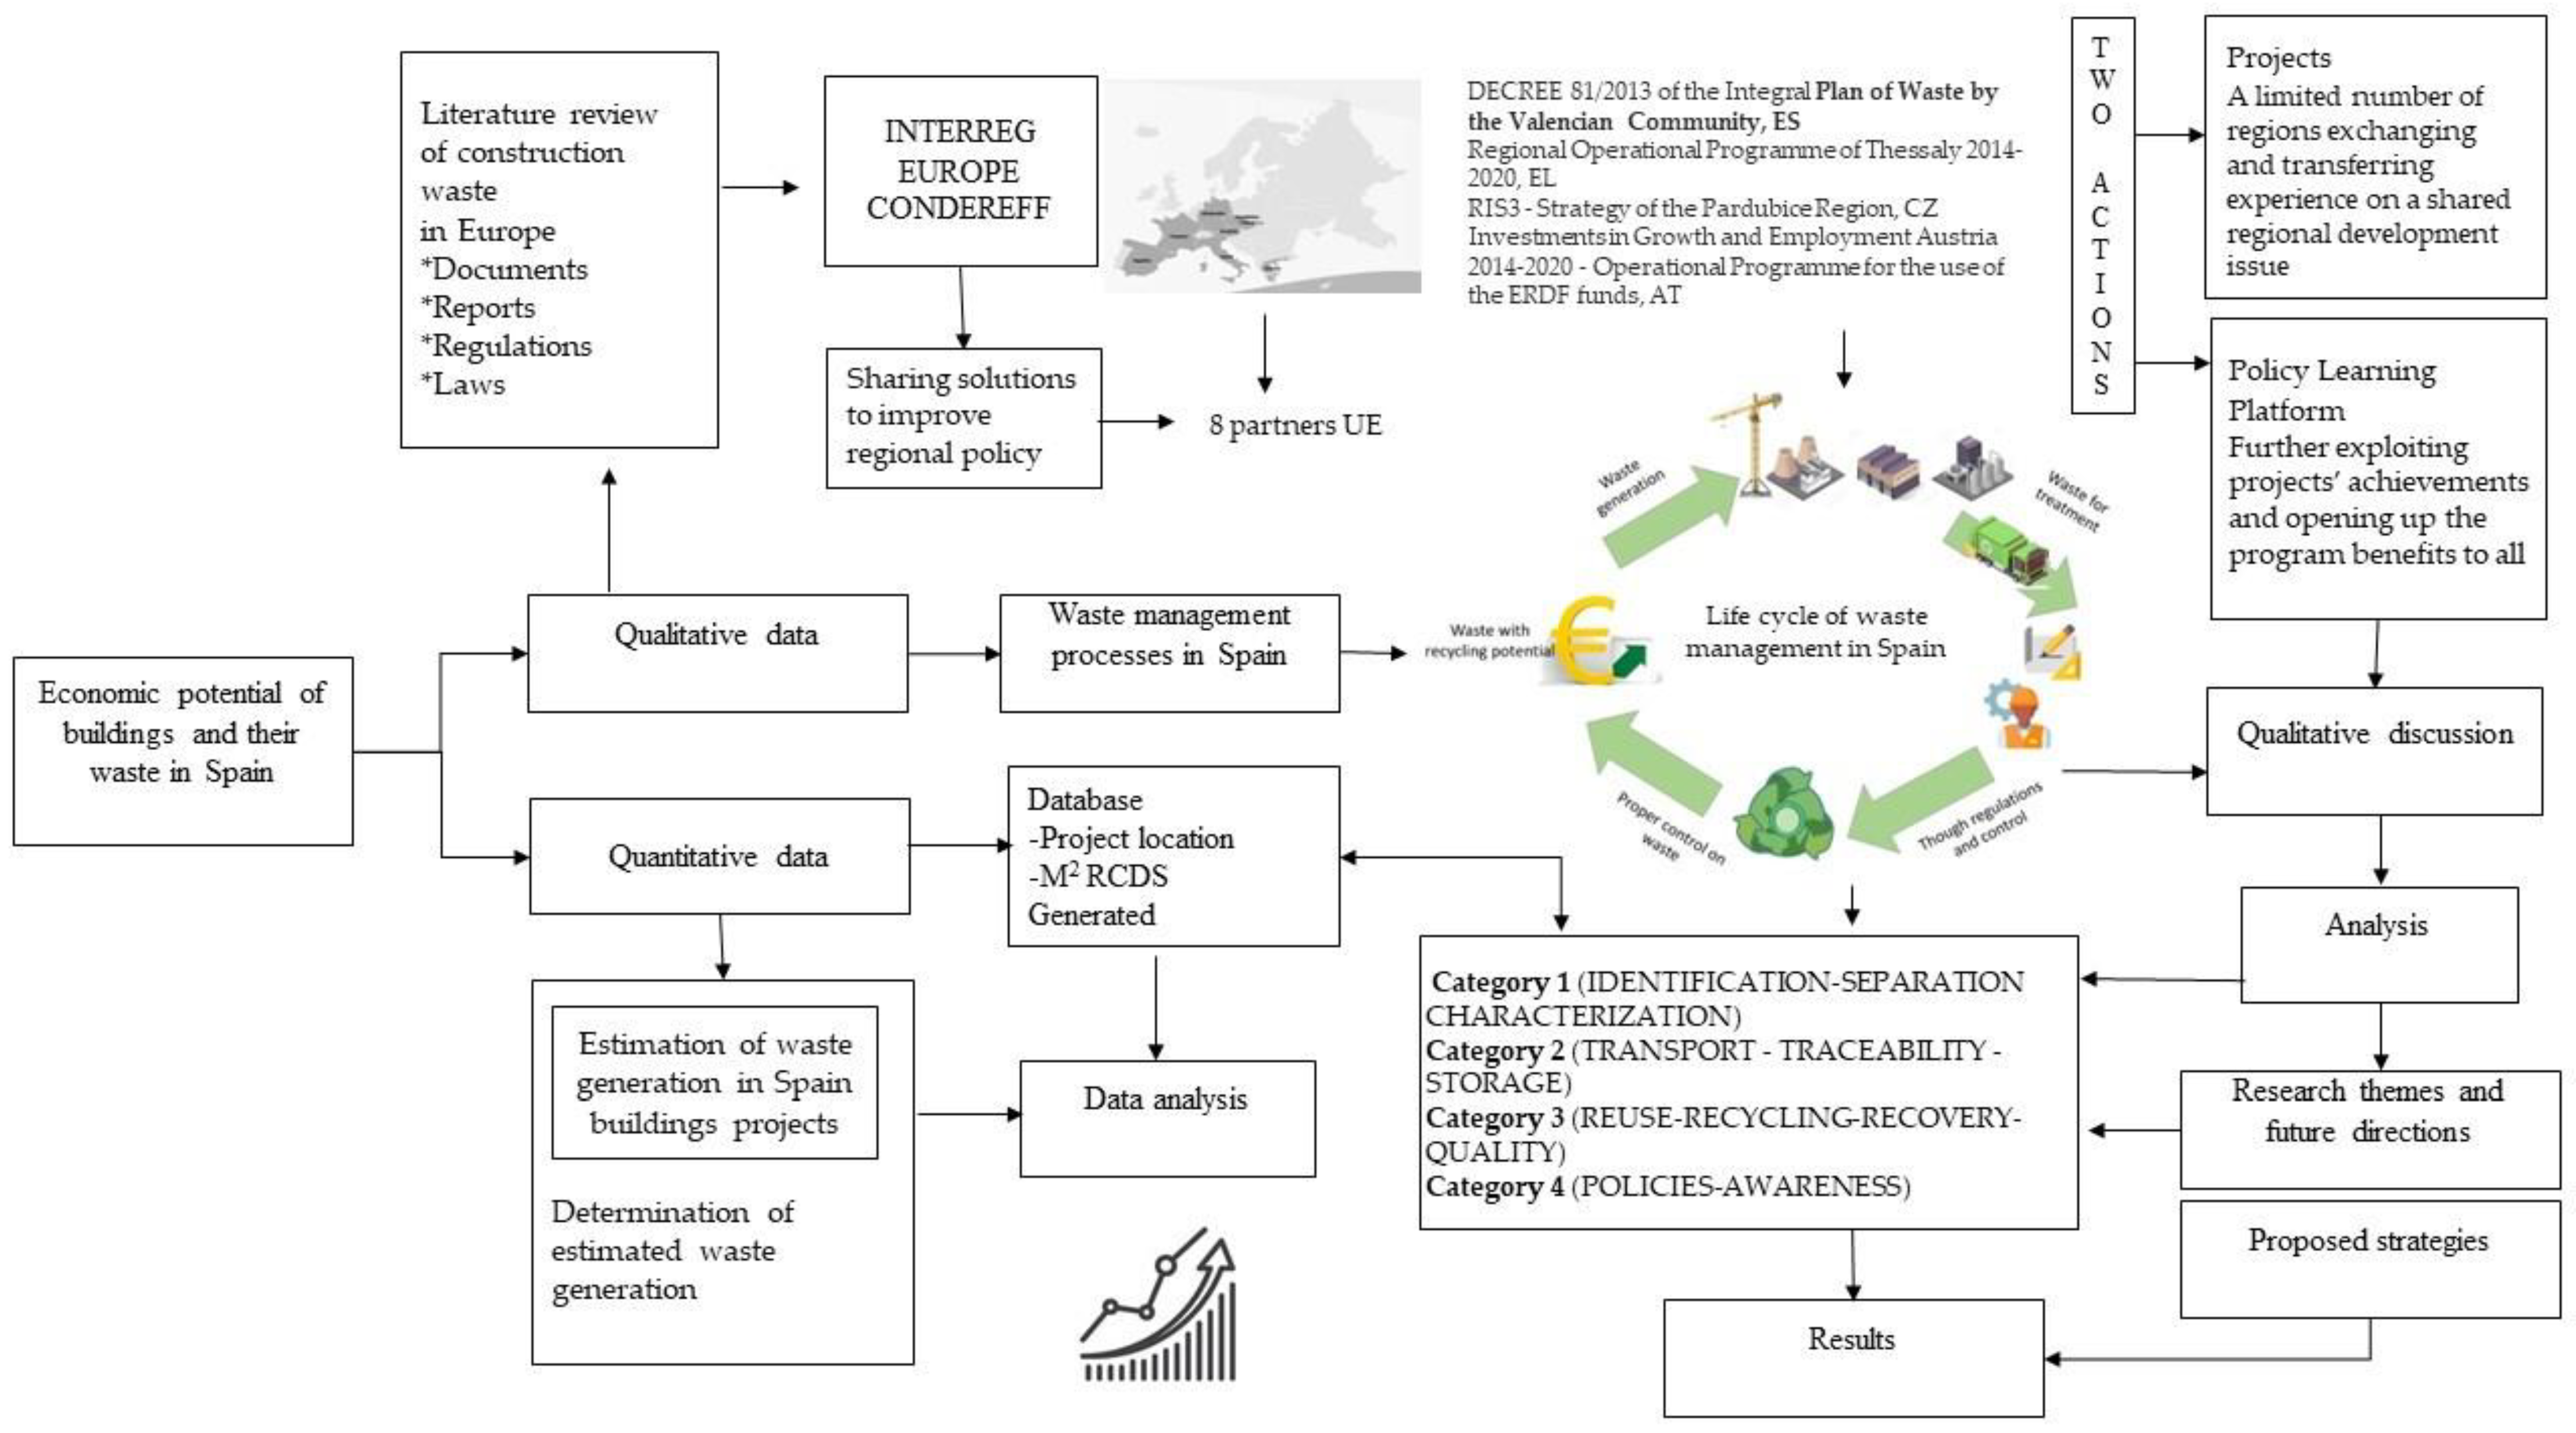
The research methodology was carried out through a qualitative and quantitative study that allowed the collection and analysis of bibliographic and economic data on C & D waste. Next, as shown in
Figure 2, we explain the type of study and design, which through the partners and good practices of the CONDEREFF project, allowed us to find four categories based on the waste management process, project selection, and m
2 of RCD followed by a description of the study area, research tools, and data collection procedures to later seek future directions and lines of research for the design of strategies.
Building on the EU Protocol on C & DW Management to increase confidence in the C & D waste management process and the quality of the materials recycled, the protocol aims to improve the quality of 5 essential areas that involve all the players in the supply chain:
Waste identification, source separation, and collection;
Waste logistics;
Waste processing;
Quality management;
Policy and framework conditions.
The application at the regional level of the best practices existing at the European level in these areas would give the confidence necessary for the market to launch recycled products from C & D waste; for this, it is essential to classify four categories:
Category 1 Identification-separation-characterization
This category includes good practices carried out mainly in the early stages of the work by construction/demolition companies.
Category 2 Transport—traceability—storage
This category includes good practices mainly carried out by waste transport companies.
Category 3 Reuse-recycling-recovery-quality
This category includes good practices implemented by companies responsible for recycling or reusing construction and demolition processes and companies’ responses for accountability for the quality of these processes and products for their new uses.
Category 4 Policies-awareness
This category includes good practices mainly implemented by public administrations.
This section summarizes the various methods and materials used for this research; thus, this article’s analysis was carried out in Europe and diverse Spanish autonomous communities. This section shows the multiple barriers in C & D waste management and how they can be turned into opportunities by implementing proper treatments and revaluing all the materials from building sector waste. The economic part of C & D waste and how to revalue these materials have been deeply analyzed to combat these issues. Volume is increasing rapidly, and new measures are also necessary.
The deep qualitative and quantitative analysis of the case study executed by [
20] was performed by studying the different disposal prices and the generation of the C & D waste. With this data, a comparison was made among various categories of waste producers and their disposal prices. This analysis was directed toward precise results relating disposal prices with waste generated by different sectors, mainly from the C & D fields, shown in
Section 3.2.
Data Collection
The data for this article have been extracted from different sources, such as surveys conducted by the European project, Construction & Demolition Waste Management Policies for Improved Resource Efficiency, or CONDEREFF (Ref PGI05560-CONDEREFF) [
21]. This plan obtained clear and transparent data from the agents involved in the creation and demolition waste management process and from end customers in the construction framework. The enormous proportion of data presented in this plan is worth noting because many European nations have participated, such as Greece, Italy, Spain, France, the Czech Republic, Austria, and Germany [
21]. This set of allies from the European alliance enables us to gather and share different visions and occupations involving the analysis, design, and creation of the circular economy and the administration of creation and demolition waste (RCD) regarding the environment. Social and technological changes are generated due to growing urbanization and global warming. In tion to the scientific and professional contribution, consultation proposals for public servants are an example of good administration practices and experiences in innovation generated by municipal and state institutions, dependencies, and entities.
However, other official sources of information have been used that remain openly accessible online at the European level, and websites such as Eurostat [
22], the European Commission [
23], and Statista [
24] have been consulted, these websites being the source of statistical data. Data such as waste generation sectors and total waste stream were analyzed for the present analysis, along with multiple economic components for waste abatement. The second part thoroughly examines the main barriers that prevent adequate waste management (creation and demolition waste) and the solution shown in this article.
3. Results and Discussion
Spain is a country where the construction sector is highly linked to the country’s economy. The building sector has indeed been growing through the years, thus creating a significant impact on the economy. A clear example is the housing bubble burst in 2007 when housing prices fell by 65% [
25], directly linked to construction activity; thus, the impact was noticeable.
Although this sector has presented fluctuations, the growth has been permanent. Therefore, C & D activities have always been active in the economy. This continuous growth also indicates the increase in waste from the C & D sector. However, the concerning point always has been the need for proper treatment of the garbage coming from the industry. The high waste volume is challenging for the environment and the sustainable waste management process.
More than half of Spain’s waste is in landfills [
26]. To be exact, the amount of waste is 54%, a value higher than the average European value [
18], where the waste disposed of in landfills is 24%. These numbers indicate the sustainability gap between Spain and other European countries, where the term “landfill” is rarely used due to the best practices these countries have implemented. Of all the waste generated in Spain, 40% corresponds to the construction and demolition sectors [
26]. This is almost half of the waste generated in this Mediterranean country, where waste is usually disposed of in many illegal dumpsters located in Europe; the waste sectors have been divided depending on the sources of the trash. Therefore, it can be observed in
Table 1 [
27] that the various waste sources in Europe and the percentages correspond to each other.
As shown in
Table 1, the C & D industry is one of the highest waste producers; despite significant growth, this issue can easily be mitigated if proper regulations are applied [
28]. This type of waste often consists of ceramic and concrete, as these materials are recyclable and have a high potential for reuse [
29].
A similar scenario occurs in Spain, where a large volume of waste is constituted by C & D destruction [
30]. This type of waste is one of the main challenges regarding current European policies about sustainable C & D waste management. Due to this enormous impact, the European Union has set various goals and targets to improve the current situation. Therefore, other factors, such as the study of waste potential, were revised. By studying waste potential, what becomes clear are the possible solutions that C & D waste can have once the building and industrial sectors have abandoned those materials or their uses. One of the most effective measures can be the proper functioning of a circular economy through the value chain.
Various activities execute this process of the value chain to create value for certain materials through multiple steps and techniques, such as from designing until the last cycle, where the involvement of consumers also plays an important role [
31]. The circular economy significantly impacts current waste management, which, as the name suggests, creates a circular value chain. In this way, materials increase in value as they are introduced into new production operations. Thus a new arrangement is made in the entire construction and demolition waste management process. In Spain, the regulations governing the operation of disposal and disposal departments show low participation compared to other European countries. Recycling various materials must be done correctly to improve the current waste situation, and landfilling should be the last resort; however, this strategy requires consolidation in Spain. On the other hand, regulations are enforced in all areas, but in the case of C & D wastes, these regulations or policies should be better executed. Despite regulatory restrictions, construction and demolition waste must be assessed due to the low price of raw materials used, forcing companies to mine or extract raw materials instead of reusing existing building construction and demolition waste.
Possible solutions have been put on the table to enhance sustainable waste management, such as a waste management fee that will compel companies to follow policies and regulations. In Spain, according to [
32], only 8% [
32] of the councils are following this strategy, and in autonomous communities such as Extremadura, País Vasco, Castilla y León, and Cataluña this figure is even lower, a total of 5% [
32]. Through these values, it can be observed that in recycling rates in Spain, only one-fourth of the C & D waste is disposed of legally in authorized landfills, where the treatment for this waste is executed correctly, obtaining almost 90% of the recycling rate. However, the figures indicate that only 75% of C & D waste is disposed of in legal and authorized landfills, which suggests a wedge in the sustainable waste management process, as the waste ends up in landfills without treatment and classification.
Figure 3 shows the 17 Spanish autonomous communities from which data is extracted. Main waste-producing categories have been analyzed, as is the case for industrial waste (RSI) and C & D waste; the last class plays a vital role in this article [
32], as do the fee charges for disposal of these types of garbage.
As shown in
Figure 2, the autonomous communities with higher rates of disposal prices for C & D waste are countries with a total of EUR 32.6 per ton of C & D waste [
33]. Following these rates is the case of the Balearic Islands, with a cost for waste disposal of EUR 30.5 [
33] per ton. After these high rates, there are the cases of La Rioja, Castilla y León, Castilla la Mancha, and Madrid, with values ranging from EUR 21 to EUR 24.7 per ton [
33]. Other Spanish autonomous communities have values below EUR 17 per ton. The neighborhood with the lowest disposal rate is Andalucía, with EUR 6.6 per ton disposed of in landfills, a rate similar to Navarra, with EUR 8. These values indicate the effortless process that companies can face regarding landfills.
In the case of industrial waste, the price for disposal is slightly higher than for C & D destruction, indicating a need for improvement in this sector.
3.1. C & D Waste Disposal Cost and Current Situation in the Case of Spain
This section is intended to show the economic part of C & D waste management. Proper treatment can lead to a sustainable waste management chain where the different types of waste can be classified, increasing their potential. On the other hand, the waste destined for disposal or incineration presents a challenge, as high volumes of C & D waste end up in landfills.
Figure 4a,b [
34] shows the different prices for waste disposal from 2017 until 2020.
One effective measure can be implementing a tax to mitigate the high amount of C & D waste in landfills and other unsustainable management. One of the measures is the disposal and incineration prices, as shown in
Figure 4a, which shows the variations in the removal cost. The purpose of this re-presentation of the data in
Figure 3 is mainly to show the variation from one autonomous community to another and to demonstrate how these price variations affect waste management and reuse of the materials, with the highest level being País Vasco, with EUR 32 per ton. Following this price is the Balearic Islands, with rates up to EUR 30 per ton. As shown in
Figure 3, the other regions worth mentioning are La Rioja and Madrid, where values are above EUR 20 (EUR 24 and 21, respectively). All the different areas where disposal takes place to have prices lower than EUR 19, with Navarra having the lowest price for removal (EUR 8 per ton) [
33].
These prices have been studied to understand the loss of potential regarding C & D waste in the building industry.
Figure 4b shows that the total waste destined for landfills is represented in percentages of destruction in Spain.
Figure 3 shows that regions such as Andalusia and Canarias heavily dispose of waste due to their low disposal rates (
Figure 4a). The disposal rates for the landfills in these regions are 68.65% and 69.97%, respectively. After the highest percentages of disposal rates, there are regions where figures are still high, such as Asturias, Castilla y León, Extremadura, and Murcia, where the values are 73.73%, 63.78%, 59.37%, and 66.95%, respectively. These values indicate the alterations in landfill quantity that can vary between autonomous communities.
On the other hand, in País Vasco, only 27.42% of the waste ends up in the landfill process; the consequence of this can be the highest disposal rate in the region. The same scenario takes place in the case of Andalusia, where the lower cost of landfills leads to a higher quantity of waste destined for dumping, as also happens in the case of Navarra, where the waste destined for landfills is 50.45% as a consequence of lower prices such as EUR 8 per each ton. In the discussion section, these variations and disposal prices’ impact on general waste management hashas been discussed.
3.2. Study of Components to Comprehend the Disposal Practice
The current study indicates a need for more strict regulations regarding the value chain; therefore, executed the materials must be appropriately revaluated. The growth of waste will continue increasing; however, implementing proper techniques and developing new methods to control waste can improve the current situation in Spain and other regions of the European Union.
This study has analyzed the various treatment plants in Spain and found the highest number of plants and legal landfills, as shown in
Figure 5.
As shown in
Figure 4, relevant data can be interpreted as the highest number of landfill places, the higher the chances are that the waste can end up in those places. Along with this, the price for this activity shows an apparent reduction as the offer for landfills increases gradually. In Andalusia’s case, 71 landfills [
35] indicate the disposal of C & D waste in the building industry. This value is followed by Cataluña, where landfills rise to 57 [
35]. Therefore, the high production of C & D garbage from these areas, therefore, requires treatment plants and landfills. Other regions in Spain are below 20 landfills per autonomous community. In these cases, it is essential to consider the activities and production rates in the construction sector.
Figure 6 explains the relation between disposal price and the number of landfills, which is studied by the percentage of waste destined for landfills.
This data shows how several factors can affect C & D waste management. In the case of Spain, C & D waste is typically generated within cities with large urban areas and construction and building activities. Many cities can be named with these characteristics, such as Cataluña, Andalusia, and the Balearic Islands, where waste generated can be found in high quantities. However, the current article also tackles disposal price, represented in
Figure 5 (left) in EUR per ton. These prices have been organized from lower to higher disposal rates and later compared to the percentage of waste destined for landfills.
To deepen the study of these values, the main cities in Spain have been analyzed. Thus, in Andalusia’s case, the waste disposal prices are around EUR 6.6 per ton; on another note, the percentage of trash in a dumpster is the highest in Spain, with almost 70% (68.65%) [
36]. A similar scenario occurs in Navarra, Asturias, and Extremadura; despite having lower activities than the other main cities of Spain, these regions tend to lower prices, attracting more waste from landfills. This relation repeats in the case of Madrid, with EUR 21 per ton, and the disposal percentage increases up to 58.51% as in Aragón, with prices such as EUR 13.8 per ton, with 70.13% of materials for landfills. The difference between prices and disposal quantities indicates significant data where the relationship between these two analyzed factors can be seen clearly: a higher percentage of the waste that will be disposed of.
An opposite scenario also occurs in the Balearic Islands, where the rate for disposal is around EUR 30.5 per ton [
33]. However, the waste volume is 20.64%. This price is higher compared to other areas in Spain. Never the less the less, it prevents materials from going into landfills; as seen in
Figure 5 (right), the disposal percentage is around 20.64%, indicating the hypothesis that the higher the price, the lesser the disposal waste. Not only are the Balearic Islands in this situation, but regions such as País Vasco also share the same tendency: the price for disposal is EUR 32.6 per ton [
24], the highest price in Spain, and as a consequence of this rate, the disposal percentage is lower, being only the 27.42% [
36]. On the other hand, it is worth mentioning that tourism impacts waste management, as in many touristic areas, the waste generated during tourist visits is doubled compared to the average generation of trash. This could be the case in Cataluña and Islas Canarias, where the flow of tourism is higher than in other Spanish areas, mainly due to the attraction of the coastline and high-quality beach areas. The waste is in landfills in places such as these and other high-waste-generation areas. The lack of treatment often causes debris to be unrecyclable, thus losing its potential for sustainable waste management.
This hypothesis is represented more clearly in
Figure 7, where the relation between disposal prices and the volume of waste for landfills is described, considering factors such as the volume of waste generated and the activity levels of each region or area.
Figure 6 summarizes the current construction and demolition waste management situation in Spain. In the results sections, various factors have been studied, such as disposal prices, the percentage of disposed waste, and the number of landfill points in Spain. As a consequence of this analysis,
Figure 6 has been prepared to demonstrate the different factors gathered to understand the current situation in Spain.
A clear relationship exists between the disposal price and the waste in landfills. Therefore, the higher the prices are, the lower the chances for the C & D trash to end up in landfills, where its potential for recycling is lost. On the other hand, if these rates are softer, more waste is easily directed to landfills. It is worth adding that the number of landfills highly affects the process through which the tendency of the C & D waste trajectory to disposal can be understood. This last stage for waste represents a high loss of potential to be reused or reinserted in building industry materials.
In contrast to the current analysis, other studies have been considered where the same tendency occurs internationally. An example of an investigation is by Thornton Matheson [
36]. In this study, it is emphasized that landfills charge for solid waste. Despite studying the different sources of waste, the tendency is the same for C & D waste in the case of Spain. The same hypothesis has been concluded through several studies, indicating that high prices can reduce the landfill process. In contrast, the low prices invite many companies and C & D agents to consider the landfill process as one of the primary methods for eliminating waste along with the incineration process.
Waste management is the objective that receives the least attention in the design and planning of construction projects, with construction costs and times prevailing [
37,
38].
The incorrect management of waste comes from all phases. On the part of the administration, the fundamental problems that have always been pointed out are the need for more personnel and the means to accurately monitor and control RCD.
In part, these problems are due to the need for more time to specialize the different technicians since they must attend to issues of different themes, such as urban planning, activity licenses, and administrative changes in the registry (among many others). This lack of specialization makes it necessary for the design of this tool to be simple, intuitive, and easy to complete.
On the part of the architects and drafters of the architecture and construction projects, the problem mainly focuses on two blocks. On the one hand is the lack of sources of information and training around RCD, summarizing the offer to minority sessions within more generalist courses. On the other hand, the lack of control and sanction by the administration and professional associations and groups, together with the disclosure (and, in general, acceptance) of simplified mechanisms and calculations to complete or justify the management of RCD, has resulted in a lack of interest in and concern for this issue.
On the part of construction companies, the lack of a precise distribution of responsibilities (even in some cases, the lack of any distribution responses) is the first cause for abandoning the control and monitoring of CDWs.
Starting the projects without a defined CDW management plan (using simplified methodologies by the designers or editors) and needing clear objectives means that the control of CDW is derived from different subcontractors that intervene in the work.
Finally, waste management companies highlight three major drawbacks or problems to be able to close the process. First is the need for more control and prior information on the project and objectives to be met in each phase. It is difficult for these companies to consult initial calculations made by the drafter of the project or the possible justifications or explanations that have been added to them. The company must collect and treat RCD that is on-site.
Second is the need for more control or audits of waste management companies to verify compliance with the requirements for treating different types of waste (machinery, space, waste entry control, etc.).
Third is the need for aid or incentives to companies to consume recycled products or to carry out good management of CDW.
The priority goals of cyclic design are durability, adaptability, waste reduction, and recyclability. Sustainability extends the life of buildings by using building systems and materials that are easy to maintain, repair, and replace. Adaptability requires the development of a new design culture capable of anticipating changes in demand, planning adaptations, and transforming spaces to use and reuse buildings and individual components. Reducing and increasing waste costs drives design, construction, and demolition processes that retain the value of materials at the end of a building’s life and allow them to be reused with consumption. Minimal energy and waste generation are consistent with pre-life cycle practices. Like all artificial objects, a building should be considered an organic whole of functional parts that can be decomposed into the distinct materials from which they are made, individually contributing to determining the stability of the entire building [
37].
Some studies recommend sizing, standardizing elements, and designing for flexibility and adaptability [
38,
39,
40]. Flexibility in space design allows space to be easily reconfigured, resulting in less waste in future changes. Another strategy to minimize CW is deconstructing the design [
41,
42,
43]. This includes skillful organization and selecting building materials that allow for carefully demolition of building elements [
44,
45]. The dismantling plan must be prepared with other design documents [
46]. It is suggested that recycling building elements should be considered to reduce waste. BIM technology has also been proposed as an effective waste reduction strategy during the design phase [
47,
48].
4. Conclusions
The use of construction waste in our society has generated a series of environmental, social, and health problems. Construction waste is the materials not used in construction but still in good condition that can be recovered. Construction waste is an essential source of renewable energy. Financing is a significant issue due to the enormous costs of fixed waste management systems. Better waste management will help cities build resilience to extreme weather conditions that flood, destroy infrastructure, and force people to move and destroy their livelihoods.
When storing waste does not generate profit, according to the type of work, as in linear constructions, there is no area of the object or the operation where containers can be designed to separate and store waste. The weight is established in Article 5.5 R&D of National Decree 105/2008, so forcing companies to separate this waste may be below average. It should be noted that in the case of waste for management, it must be carried out by companies authorized for this purpose. In the case of not storing or taking the goods to the place of some nonhazardous waste due to a lack of physical space beyond the weight set in National Decree 105/2008, debris may be segregated with the consent of the project manager. In the transport element and after loading the legally identified cargo transport element, the waste transport is sent to an authorized manager.
One of the main limitations is that abundance is not considered when calculating the demolition volume since the transport of the abundant (fluffy) material is already paid for in the demolition price, the cost of excavation, or other similar units when transporting it to an authorized manager.
Governments can incentivize using recycled construction and demolition materials at all levels. It has been long since the European Commission identified the construction industry as a priority employment sector for improving the ecological community. This makes us think that future lines of research in this area should focus on the life cycle of materials, not just on the use of recycled materials but also on regulations and guidelines that promote the ability to design dismantled buildings so that they have a high rate of discarded reuse at the end of their useful life. Many other measures can also be taken at the national and regional levels; standards could be established for using recycled aggregates as a first step. Their use is encouraged in almost all regions of Spain as in other countries of the European Union.
However, not only are economic aspects necessary for proper construction waste management, but environmental, legal, and social aspects can also have considerable influence in this field. Health and safety were found to have the most significant and dominant impact on achieving sustainable construction waste management [
49].
In comparisons of the Spanish regions with other regions, it is clear that in Spain, more than half of the C & D waste, precisely a total of 54%, ends up in landfills, 30 points more than the EU average, which is 24%, and even further away from other European countries such as Austria, Belgium, Denmark, the Netherlands, Sweden, and Switzerland, where landfills are disappearing due to the positive impact of the best practices of the European Union and its circular economy policies and the flow of materials.
In the case of Spain and this study, various measures can be implemented to improve the value chain and sustainable waste management that consider the environmental impact. These measures/strategies can be summarized as follows, according to Emgrisa:
Raw material extraction: Extracting materials from a local site is recommended to make this step more sustainable. Therefore, the environment is preserved.
Manufacturing of different materials: This process plays a vital role. In this stage the materials can be chosen by their ecological impact on the environment, along with using recycled materials.
Transportation: The impact of this activity can be mitigated by reducing the distance between different points, which also allows for the usage of local materials.
Construction: This step is one of the most important, as it can significantly impact waste management. Once the waste is produced, it should be classified on-site and redirected to a proper waste recovery sector, depending on the category.
Refurbishment: This stage occurs once the building has been constructed and requires repair of those materials. Many recycled materials can be inserted through this stage, improving the sustainable chain regarding C & D waste.
This study shows that C & D waste management can develop strategies that consider various factors such as disposal costs, the number of landfills, and the rules for achieving sustainably. Several methods can be used to improve the current situation, such as increased export fees and controlled landfills. As can be seen from the literature, the higher the disposal fee, the less waste is sent to landfills, which is consistent with the data showing that EUR 6 per ton attracts about 70% of C & D waste. If the rate is around EUR 30 everywhere, the recycling rate will drop.
Therefore, the materials gain high potential when the proper treatment and measures are applied to them according to their category; as a consequence of these treatments, the materials can be reused, and therefore potential is gained.
CONDEREFF, through its transnational and Pan-European collaborative approach, enables construction and demolition companies as well as relevant authorities and stakeholders to build the capacity of regional leaders to implement resource efficiency policies related to C & D waste management effectively, in addition to evaluating, expanding, and improving existing practices in generating C & D waste flows; monitoring and controlling the process; encouraging investment and using public procurement as an engine to increase the economic potential of construction and demolition waste reuse; streamlining the implementation of resource efficiency principles by applying proven and consistent practices in C & D, monitoring, and compliance processes; and developing action plans for public agencies to improve the policy instruments under consideration.

 ,
, 


