Article

Infrared-Fused Vision-Based Thermoregulation Performance Estimation for Personal Thermal Comfort-Driven HVAC System Controls

1
Department of the Built Environment, National University of Singapore, Singapore 117566, Singapore
2
Center for the Built Environment (CBE), UC Berkeley, Berkeley, CA 94720, USA
3
Heat Island Group, Lawrence Berkeley National Laboratory, Berkeley, CA 94720, USA
*
Author to whom correspondence should be addressed.
Buildings 2022, 12(8), 1241; https://doi.org/10.3390/buildings12081241
Submission received: 11 July 2022 / Revised: 31 July 2022 / Accepted: 4 August 2022 / Published: 15 August 2022
(This article belongs to the Special Issue Thermal Comfort in Built Environment)

Abstract

:
Thermal comfort is one of the primary factors influencing occupant health, well-being, and productivity in buildings. Existing thermal comfort systems require occupants to frequently communicate their comfort vote via a survey which is impractical as a long-term solution. Here, we present a novel thermal infrared-fused computer vision sensing method to capture thermoregulation performance in a non-intrusive and non-invasive manner. In this method, we align thermal and visible images, detect facial segments (i.e., nose, eyes, face boundary), and accordingly read the temperatures from the appropriate coordinates in the thermal image. We focus on the human face since it is often clearly visible to cameras and is not merged into a hot background (unlike hands). We use a regularized Gaussian Mixture model to track the thermoregulation changes over time and apply a heuristic algorithm to extract hot and cold indices. We present a personalized and a generalized comfort modeling method, selected based on the availability of the occupant historical indices measurements in a neutral environment, and use the time-series of the hot and cold indices to define corrections to HVAC system operations in the form of setpoint constraints. To evaluate the efficacy of our proposed approach in responding to thermal stimuli, we designed a series of controlled experiments to simulate exposure to cold and hot environments. While applying personalized modeling showed an acceptable average accuracy of 91.3%, the generalized model’s average accuracy was only 65.2%. This shows the importance of having access to physiological records in modeling and assessing comfort. We also found that individual differences should be considered in selecting the cooling and heating rates when some knowledge of the occupant’s overall thermal preference is available.

1. Introduction

Traditionally, Heating, Ventilation, and Air Conditioning (HVAC) systems, responsible for providing an acceptable thermal environment in buildings, are operated based on setpoints derived from thermal comfort standards (e.g., ASHRAE Standard 55 [1]). These setpoints often remain as fixed values and are changed only when occupants complain. However, occupant thermal comfort varies from person to person due to individual differences (e.g., body mass index and gender [2]) and changes over time due to long-term and short-term physiological and psychological variations (e.g., acclimation or transient thermal conditions [3,4,5,6,7]). This results in low comfort ratings in buildings (up to 43% dissatisfied) [8] and HVAC system energy waste of 10–32% (varying with the building size, type, construction materials, and climate) [9,10]. To capture individual differences and long-term and short-term variations in thermal comfort, several commercial and research efforts use occupant surveys to continuously monitor personal comfort. While these efforts show promising results for a short duration, they fail to sustain over a longer duration due to survey fatigue [11].
To eliminate the need for frequent surveys, researchers have explored environmental variables (e.g., air temperature, humidity) and physiological measurements (e.g., skin temperature, skin wetness, heart rate, and electroencephalograph [12,13]) as a proxy for personal comfort. However, both approaches still require occupant feedback to train the comfort model and map comfort votes to the measurements in a supervised learning fashion for each occupant. While physiological sensing could potentially be used to capture the body thermoneutral zone without the surveys [14], existing physiological sensing systems still require the surveys for training, which hinders their large-scale deployment.
In this paper, we present a novel thermal infrared-fused computer vision sensing system to monitor an individual’s thermoregulation performance and thermal comfort in a non-intrusive and non-invasive manner. We use a low-cost thermal infrared (TIR) camera and a low-cost visible light camera to capture images, apply an elastic image registration to align the thermal and visible images, detect facial segments (i.e., nose, eyes, face boundary), and accordingly read the temperatures from the appropriate coordinates in the thermal image. We focus on the human face since it is often clearly visible to cameras in commercial building settings. Other body parts could be covered by clothing or equipment. In the thermal infrared domain, hands could be merged into a hot background, making it challenging to capture reliable temperature measurements with commercially available low-resolution cameras. It utilizes a heuristic algorithm to extract hot and cold indices that feed into comfort prediction algorithms. We then use the time-series of the indices to capture the thermoregulation system, estimate the thermal comfort state, and define corrections to HVAC system operations in the form of setpoint constraints. Since humans potentially perceive comfort when they are in a thermoneutral zone, we present a personalized method and a generalized method, selected based on the availability of the occupant's historical measurement in a neutral environment to capture personal comfort states. To evaluate the efficacy of our proposed approach in responding to the thermal stimuli, we designed a series of controlled experiments to simulate exposure to cold and hot environments and to adjust the temperature setpoint in a single-zone HVAC system.

2. Literature Review

2.1. Physiological Sensing of Thermal Comfort

To reduce the need for building occupants to provide feedback on their thermal comfort continuously, researchers have explored several approaches, including environmental measurement-based and physiological measurement-based techniques [15]. Environmental measurement-based techniques aim to capture occupant thermal comfort using statistical learning methods based on environmental factors (predominantly air temperature) and estimate thermal comfort in the absence of occupant feedback [16]. However, environmental measurement-based techniques cannot capture short-term comfort variations (e.g., those induced by a hot outdoor commute). It is also challenging to apply environmental measurement-based techniques at a large scale because the sensing devices are often located at an arbitrary location, and occupants move to different locations in an indoor environment that is typically thermally non-homogenous. Therefore, the sensing device could not capture the temperature in close proximity to the occupant, and it would make the learning process difficult for the environmental measurement-based techniques [14].
Physiological measurement-based techniques could address the short-term comfort requirements, as they infer occupant thermal comfort by monitoring biological processes—specifically, thermoregulation system performance (e.g., vasodilation, vasoconstriction, shivering, and sweating), relevant physiological responses (e.g., heart rate, and electroencephalograph), and relevant physical responses (e.g., changes in posture) [13,17,18]. The thermoregulation system regulates body temperature by vasodilation (widening blood vessels) when faced with hot stresses and vasoconstriction (constricting blood vessels) when faced with cold stresses [19]. When too warm, the body can cool by evaporating sweat from the skin. When too cool, the body will shiver, and blood vessels will constrict. Shivering produces heat, and vasoconstriction reduces blood flow under the skin to retain heat [20]. In addition, heart rate variability is impacted by several thermoregulatory processes, such as vasodilation and sweating, and could be used as a measure of the thermoregulation system performance [21]. Since the main controlling mechanism of thermoregulation is located in the hypothalamus, thermal comfort has been correlated with brain activities; these activities can be measured via electroencephalogram (EEG) [22]. In addition, the changes in body postures and gestures can also indicate thermal comfort [23].
While researchers have explored various sensing methods to capture the thermoregulation system performance and relevant physiological and physical responses to estimate thermal comfort, limitations and shortcomings associated with each measurement type have prevented the scalability of these methods. For example, heart rate variability is affected by multiple factors, such as exercise, stress, and food intake [21], that may not relate to changes in the surrounding thermal environment. Similarly, sweating can be influenced by circadian rhythm, physical fitness, menstrual cycle, and gender [24,25]. In addition, sweating and shivering usually involve extreme indoor environmental changes. Mild changes in thermal conditions may not be reflected in the sweat rate variation. Even though the frequency domain transformation of electroencephalograph waves is different under various temperatures [26], it is difficult to measure electroencephalograph signals, and the measurement of brain activity tends to be intrusive. Cultural factors and state of mind can influence body postures and gestures [27].
Since skin temperature is more sensitive to the thermal environment than shivering and sweating and is affected less by other biological processes compared to heart rate variability and electroencephalograph, it appears to be a more suitable proxy to predict thermal comfort [28]. Any influencing factors such as air temperature, humidity, air velocity, clothing, and activity rate will impact the thermoregulation system performance and result in a change in skin temperature. However, traditionally, skin temperature sensing devices had to be attached to the human body, making them invasive. They may also create a microenvironment on the skin that behaves differently than the skin where no devices are attached. Moreover, they are usually on the hands or feet, where body vasodilatation responses cannot be detected well [29].
Over the past few years, the rapid decrease in costs and increase in resolution of thermal infrared imaging have allowed researchers to explore image-based, non-intrusive, and low-cost methods to capture skin temperature and predict thermal comfort [29,30,31]. Pavlin et al. [32] investigated a low-cost and non-invasive approach based on infrared imaging for monitoring occupant thermal sensation and comfort in real-time. Their preliminary results showed a good correlation between thermal sensation and forehead skin temperature. However, their approach does not provide a scalable solution for estimating personal comfort. Li et al. [28] presented a novel non-intrusive infrared thermography framework to estimate occupant thermal comfort in an indoor environment by measuring skin temperature collected from different facial regions. Their results demonstrated that ears, nose, and cheek temperatures are most indicative of thermal comfort and that non-intrusive infrared thermography can be used to assess occupants’ thermal comfort with an average accuracy of 85%. While their results could be used for short-term comfort estimation, their solutions could not be scaled since their thermal comfort prediction models require occupant feedback for continuous training. Wu et al. [33] further evaluated the accuracy of the prediction of thermal sensation using a low-cost infrared array sensors monitoring system. They argued that images captured by a low-cost infrared camera could predict individual thermal sensations with satisfactory performance. While their accuracy results were impressive (with an accuracy of ±0.15 °C), they required occupants to provide continuous feedback for training their algorithms. In summary, the thermal comfort prediction models in prior studies required the building occupants to train the system to learn their personal thermal comfort. Hence, a non-intrusive sensing technique that does not require training the occupant feedback data for the algorithm is needed.
In this paper, we aim to develop methods that could eliminate the need for occupant feedback to monitor personal thermal comfort. In the following sections, we describe the fundamentals of infrared thermography that enabled us to eliminate the need for occupant feedback in our sensing system.

2.2. Fundamentals of Infrared Thermography for Thermal Comfort

Based on the blood supply to the cutaneous vessels and the underlying deep tissues, a human body can be segregated into three-dimensional vascular territories. The anatomic territories are supplied by a source (segmental or distributing) artery and accompanying veins that span between skin and bone.
The distribution of the cutaneous vessels is not uniform across the human body. In facial areas, the density of the vessels is considerably higher, enabling higher blood circulation and yielding larger variations in skin temperature [34]. Therefore, this study mainly focused on the human face since the face is often visible for thermal imaging. The method is based on the principle that the human thermoregulation system adjusts heat exchange with the environment to achieve thermal homeostasis (i.e., heat equilibrium) by modifying the blood flow to the skin through cutaneous veins [34]. Our previous research [17] using wearable infrared sensors mounted on eyeglasses demonstrated how captured temperature using infrared thermography is related to thermal comfort. As the temperatures of the nose and ear (i.e., colder facial regions under vasoconstriction) fall below those of the cheekbone and the forehead (i.e., hotter facial regions under vasoconstriction), the probability of thermally uncomfortably cold conditions increases. This explains the familiar sensation of a cold nose or ears in a cold environment. We also found that as the temperature of the ear approaches the temperature of the cheekbone, forehead, and nose, the probability of uncomfortably warm conditions increases. However, the ears might not be visible to cameras if the subject has long hair. While inferring uncomfortably cold conditions could still happen solely based on the difference in temperatures of hotter facial regions (i.e., visible areas on forehead and cheek) and colder facial regions (i.e., nose area), inferring the uncomfortably hot conditions requires the absolute temperature values of hotter regions. It should also be noted that in case of excessive heat exposure, sweating causes radiometric temperature measurements to drop and results in temperature measurements lower than in the neutral state. Such cases could be confused with extremely cold conditions (significant temperature drops across all facial regions). Prior studies have also reported similar sweat (skin wetness) related behaviors and discrepancies between contact measurements and infrared thermography [35,36,37]. To address this challenge and infer the correct thermal state, the temperature difference between hotter and colder facial regions could be used. In cold environments, the difference between hotter and colder facial regions is larger than that observed in neutral and hot environments.

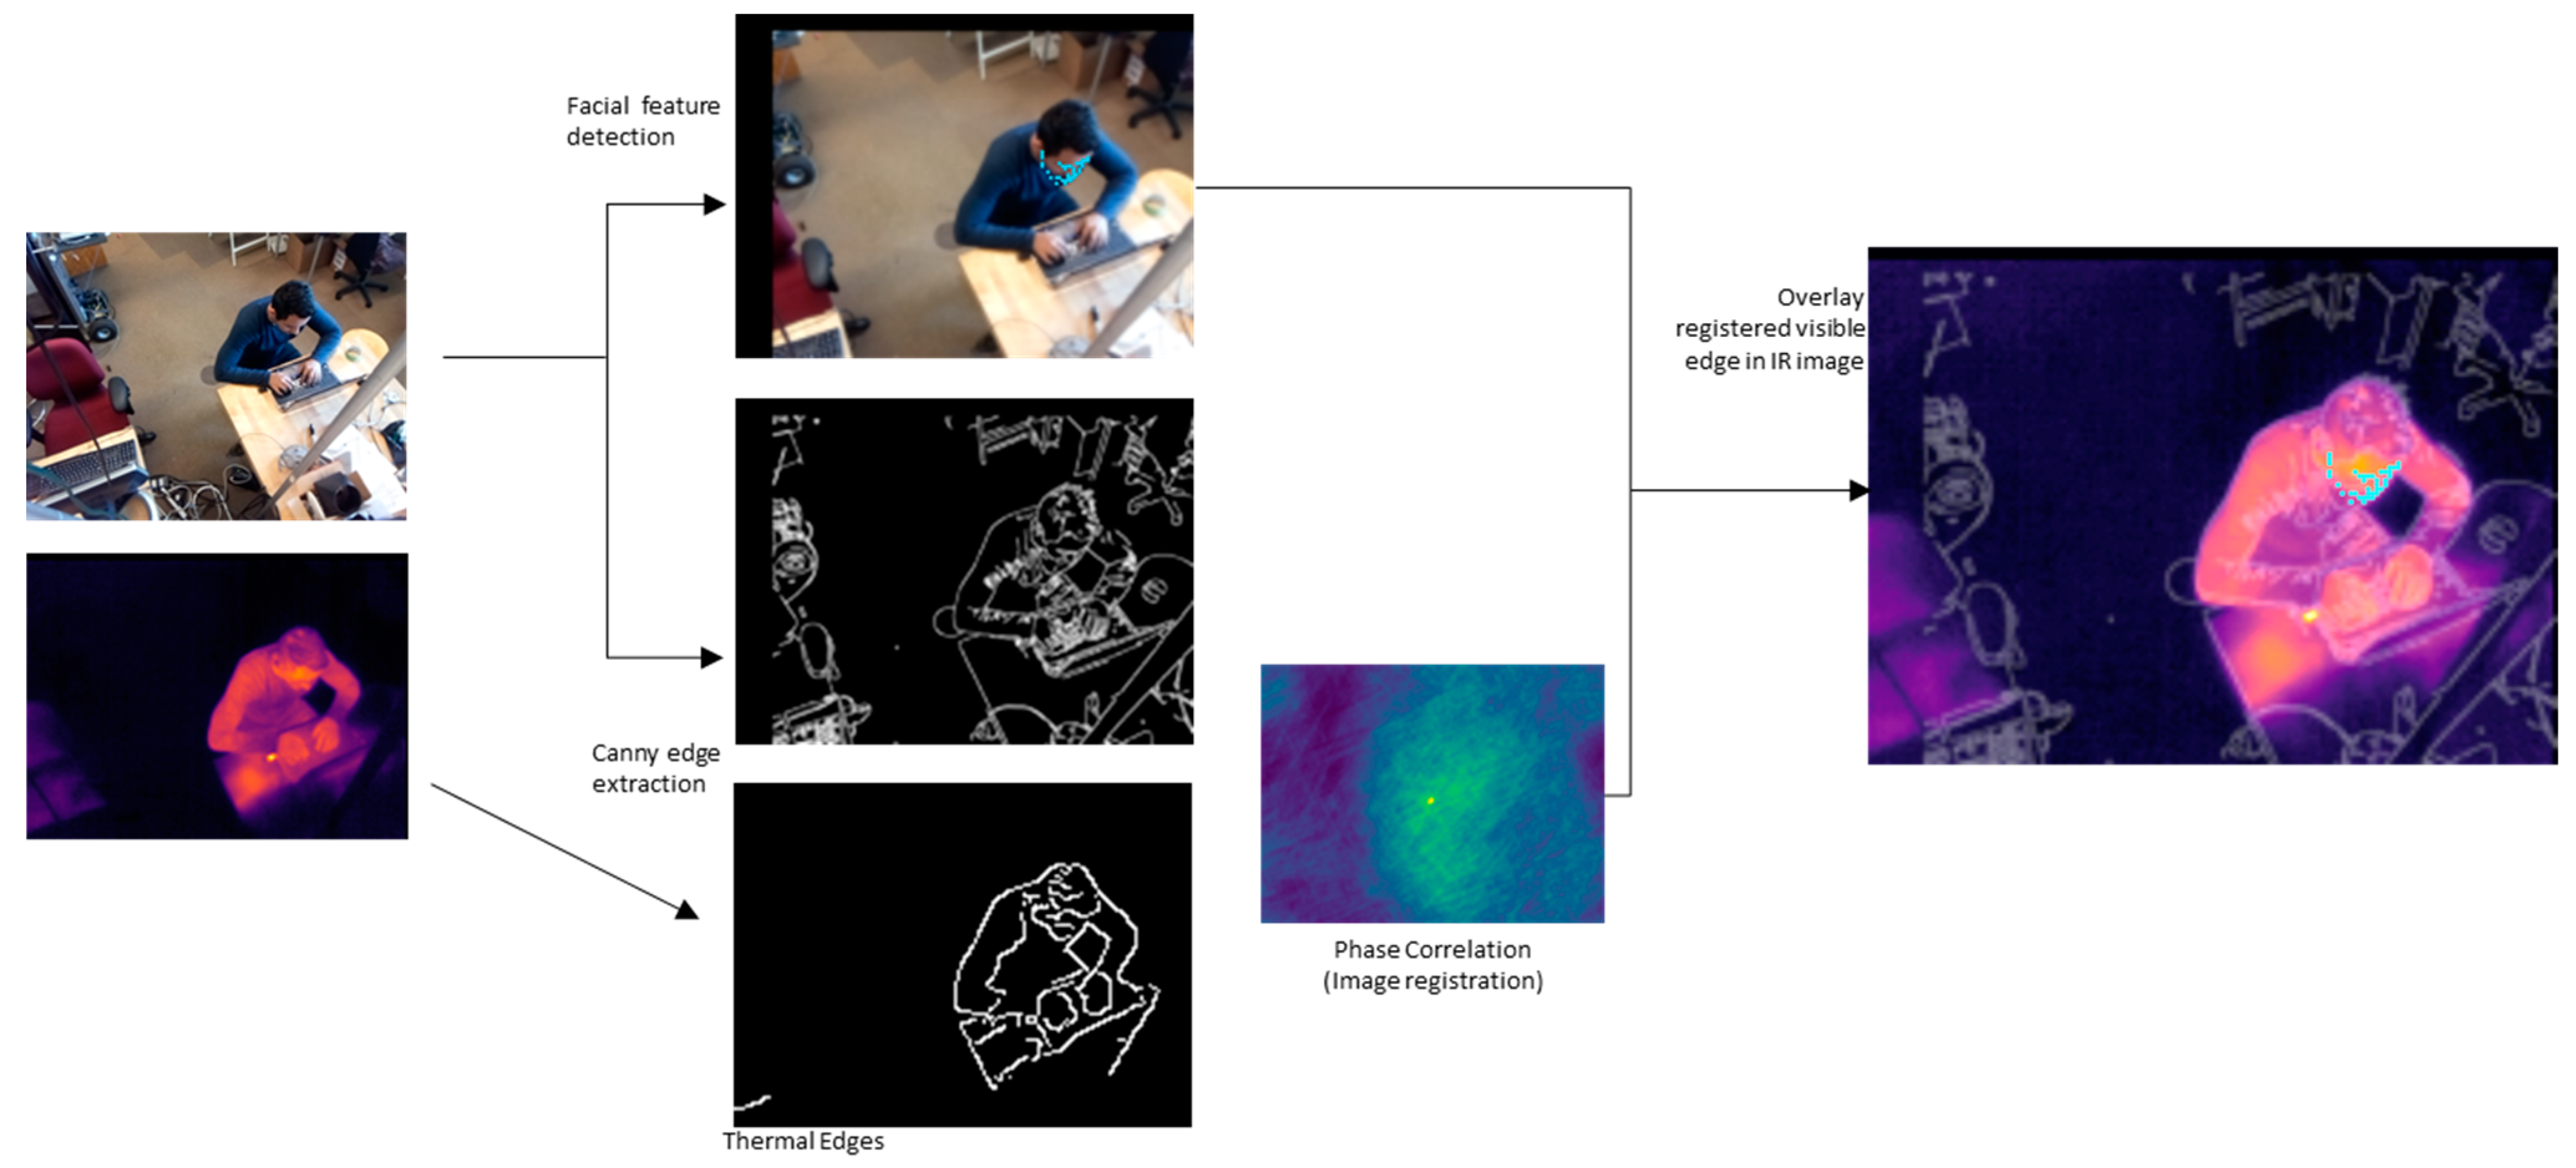
3. Infrared-Fused Computer Vision for Capturing Thermoregulation Performance

Based on the requirements defined in Section 2.2, we designed a novel, non-intrusive thermal/visual camera system that uses a thermal infrared camera and a visible light camera to capture images (Figure 1) to (1) align the thermal infrared and visible images via applying an elastic image registration, (2) identify facial components (e.g., eyes and nose), and (3) read the temperatures from the appropriate coordinates in the thermal image. Next, we utilize a heuristic algorithm that employs predefined rules to obtain reliable facial temperature measurements. The information is used to extract heuristic-based hot and cold indices that feed into comfort prediction algorithms.

3.1. Design of the Infrared-Fused Computer Vision System

In this system (Figure 1), a visible camera and a thermal infrared camera are used to take simultaneous color and thermal images. Once the image and temperature have been packaged (by zeromq, a messaging library in Python programming language), they are wirelessly sent from the client and received by the server through TCP/IP. Only when facial landmarks are identified (see Figure 2) in the image will the server initiate image registration. This will prevent unnecessary computations from being performed in the absence of a human occupant in the visible camera’s field of vision.
Due to the view angle differences in the thermal camera versus the visible camera, image registration is required to query temperature at the correct points of the thermal image temperature array. To minimize the effects of the angle differences and maximize the common view area, the thermal camera is mounted close to the visible camera. The images from the visible camera are scaled, and then we use the Canny edge detection algorithm to extract edges from simultaneous visible and thermal images. Canny edge detection is one of the most prominently used algorithms for edge detection in 2D images. It applies a double threshold to detect potential edges and tracks edges by hysteresis (remove weak edges). To register the two images, we apply phase correlation to the detected edges and identify the pixel shift between the edges of the thermal image to the edges of the visible image. The calculated pixel shift is then used to register the thermal image onto the visible image.
To illustrate, we have overlaid the visible image’s edge on the registered thermal image in the rightmost element of Figure 1. While there are several publicly available computer vision algorithms to identify facial regions (i.e., face alignment algorithms), we considered three factors in choosing the proper algorithm for our application. First, it must find and identify facial features at different facial orientations. It would be unrealistic to assume that occupants will remain in the same location with their heads facing directly toward the visible camera for an extended period. Second, it must also label facial features with enough landmarks to infer the locations of the nose, cheeks, and forehead. Third, computation should be fast enough to let the system respond to sudden changes in the occupant’s pose with little to no delay. Based on these considerations and a comprehensive review of the literature, we narrowed it down to three candidates for facial component detection. Algorithm Candidate 1 was developed by Bulat et al. [38], capable of generating 68 unique facial landmark coordinates for the eyes, eyebrows, nose, mouth, and jawline. This is achieved through a convolutional neural network based on a stacked hourglass network and hierarchical, parallel, and multi-scale (HPM) residual blocks for landmark localization. A stacked hourglass network enables inferencing by first processing features down to low resolutions before the network begins upsampling and combining features across scales to produce a set of predictions [15]. Algorithm Candidate 2 was developed by InsightFace [18,39]. They employ a stacked hourglass network and can produce 68 unique coordinates through channel aggregation residual blocks rather than HPM residual blocks. Although they share similar structures, the difference lies in the number of weight layers used for computing the output [18]. Algorithm Candidate 3 was an implementation of face alignment developed by Iván de Paz Centeno (i.e., FaceNet) using multitask cascaded convolutional neural network first explored by K. Zhang et al. [40]. Rather than generating 68 unique coordinates, it only indicates 5 unique facial landmarks with a single point.

3.2. Evaluation of Face Alignment Algorithms

We designed an experiment to compare the candidates in terms of (a) accuracy for various facial orientations, (b) accuracy under different lighting levels, and (c) computation time. We defined 11 unique facial orientations and 2 different lighting settings to capture various scenarios occurring in a typical office space. We recruited 10 individuals (4 females, 6 males) with certain physical characteristics that could affect the accurate recognition of facial features. Each subject was asked to sit on a stool with the visible camera positioned approximately a meter above and away from the stool at an angle of 30 degrees. Subjects were also asked to only move their heads and not their bodies when prompted to look in a particular direction. This was done under two lighting settings—room lights on (approximately 450 lux) or off (approximately 70 lux). We calculated precision and recall to compare the accuracy of the algorithms. Recall is defined as the fraction of all images where detection has occurred, regardless of whether or not the detections are correct. Precision is defined as the fraction of detected images that have correctly identified the subject’s facial features. Lastly, computation time is the average time required by the central processing unit to process each image containing a certain facial orientation.
Table 1 shows the precision and recall for each subject using each candidate. Algorithm Candidate 3 performed the worst overall for all individuals and was rejected. Candidate 1 yielded higher precision than Candidate 2 for all but one subject. Candidates 1 and 2 showed comparable precision and recall for upward and lateral head orientations. Results were more mixed for downward head orientations, with Candidate 1 yielding better precision and Candidate 2 providing better recall. Each showed better performance with the room lights on than off (Table 2). In the end, we selected Candidate1 because it was about twice as fast as Candidate 2 (Table 3).

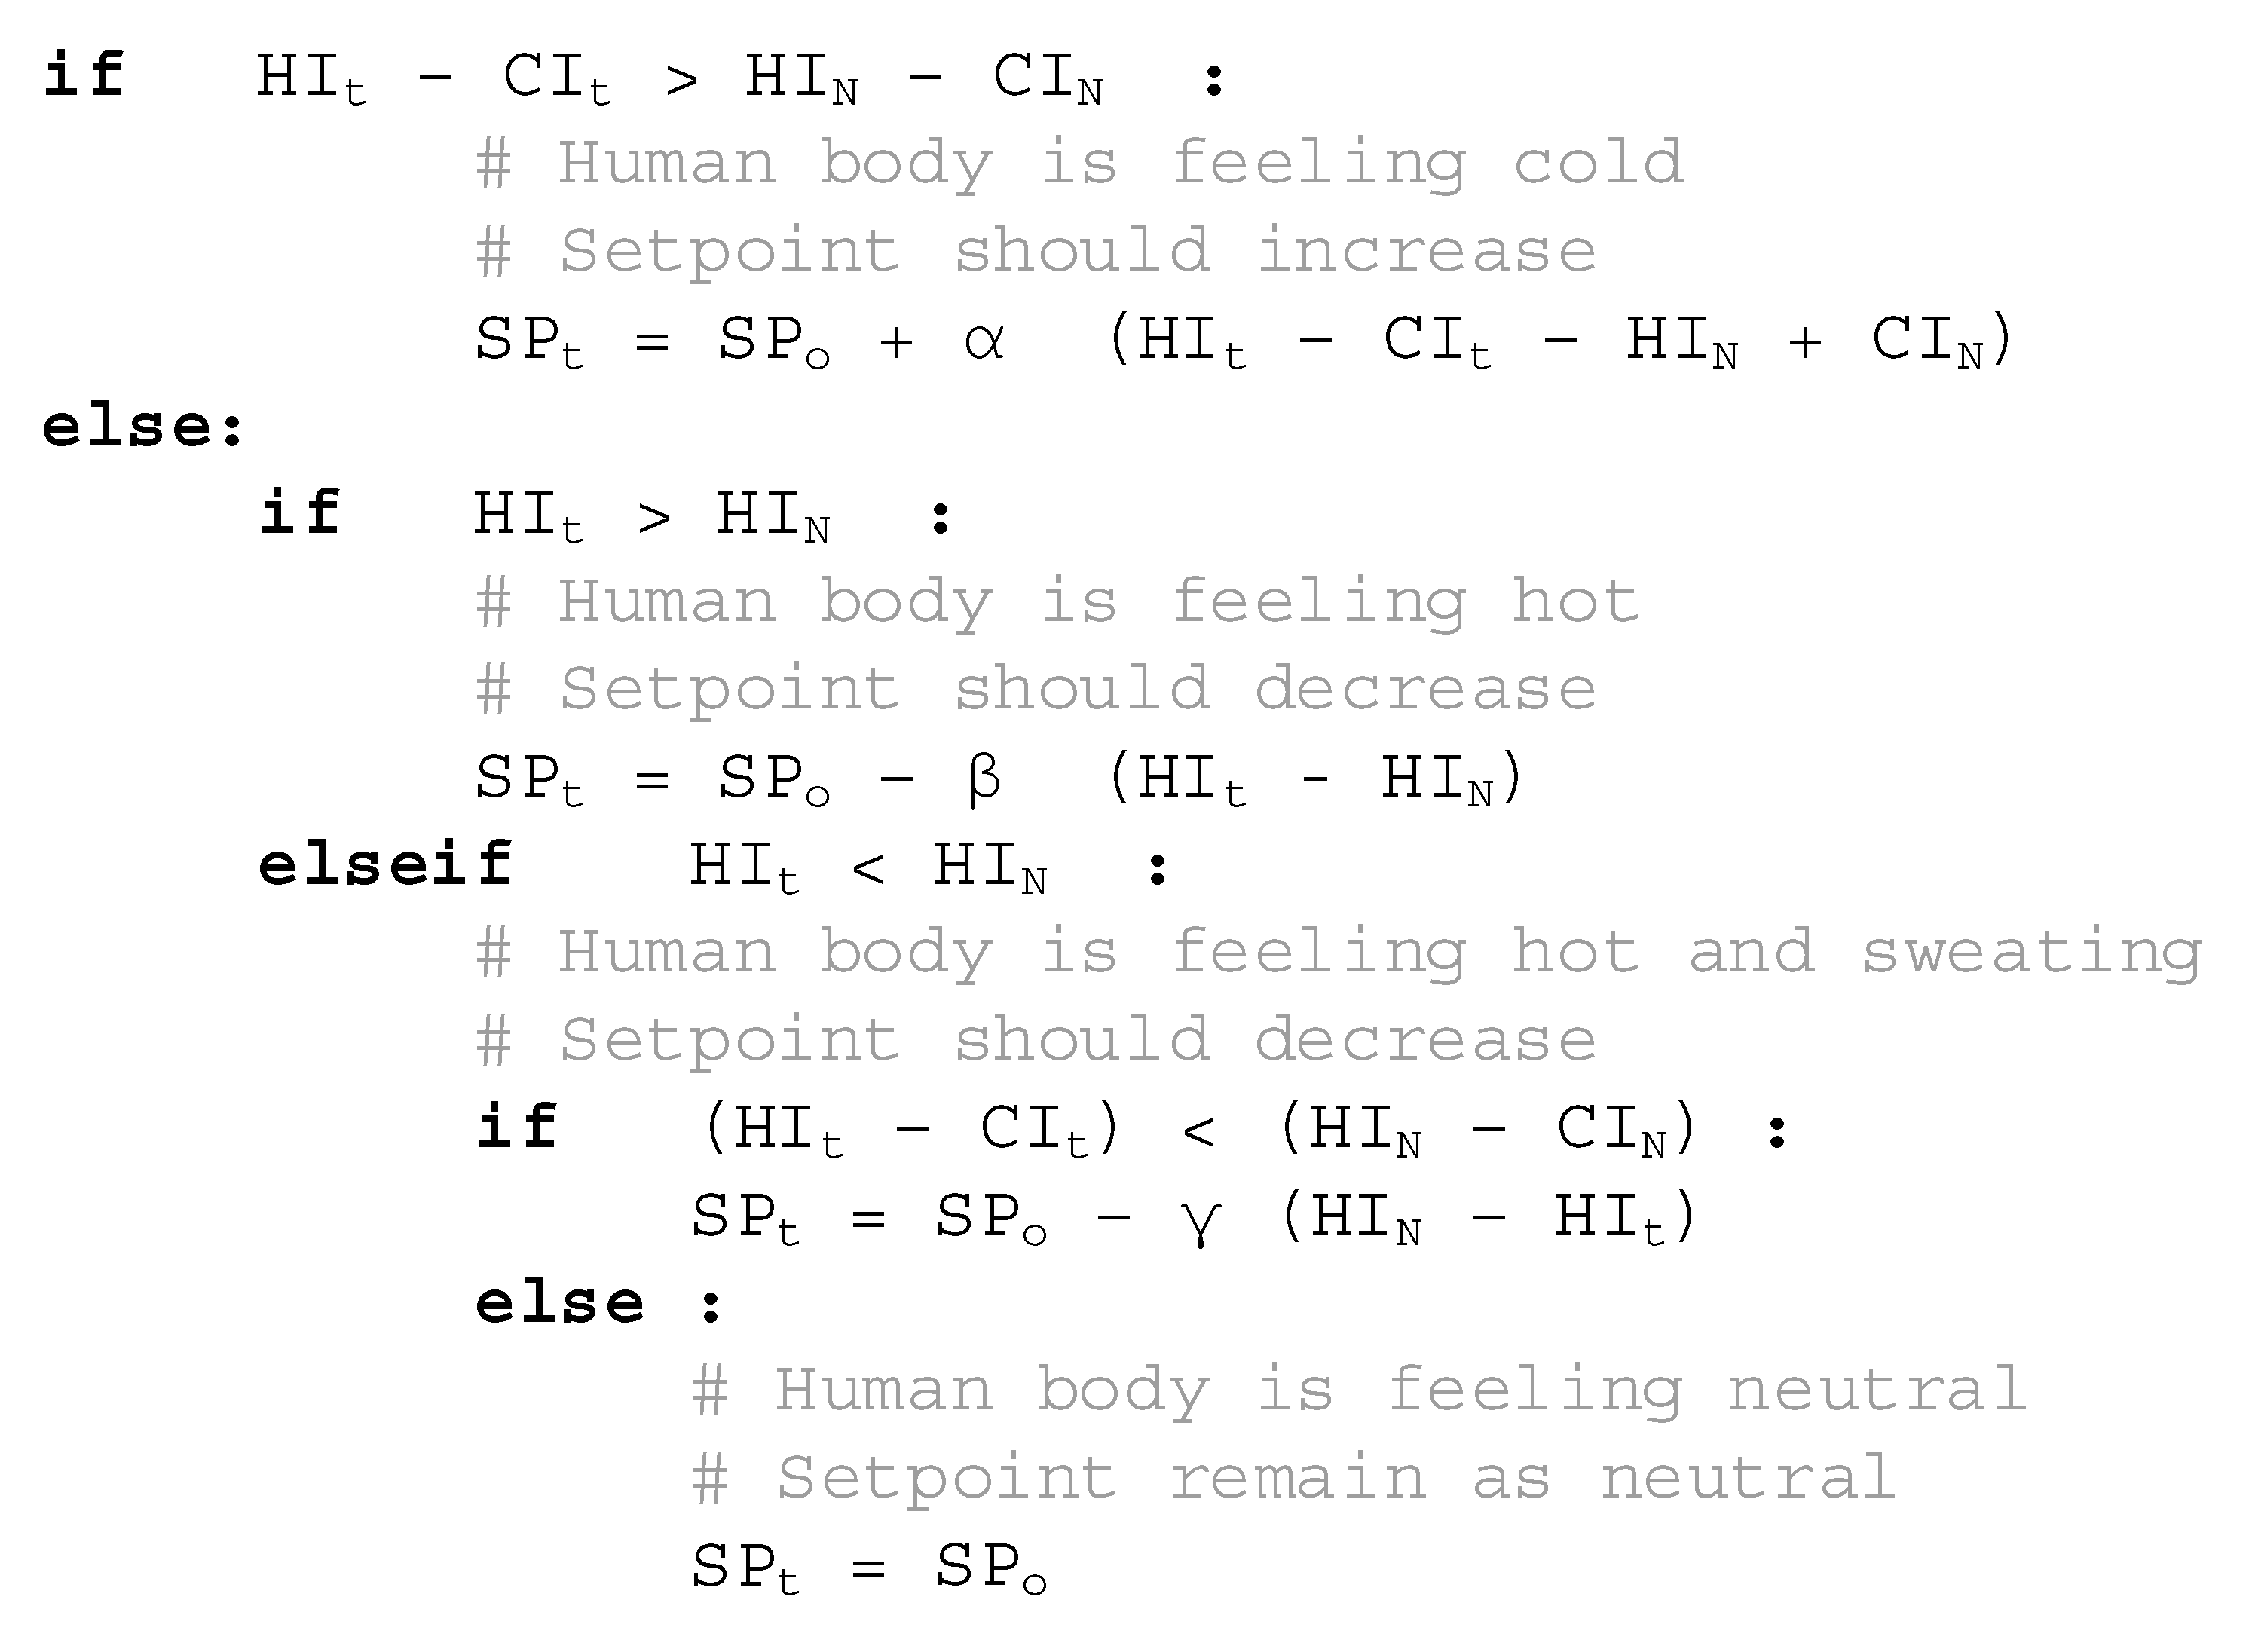
4. Comfort Estimation and Setpoint Selection

Figure 2 shows the algorithm to detect thermal comfort states and calculate the new HVAC setpoint developed based on Section 2.2. The inputs to our algorithm are the hot index (HI) and cold index (CI) values at time t ( H I t and C I t ) and those under neutral conditions ( H I N and C I N ). HI is the median temperature of the 10 hottest points on the subject’s face, and CI is the median temperature of the 5 coldest points on the subject’s face. If ( H I t C I t ) > ( H I N C I N ) , the subject is too cool. If H I t > H I N , or if H I t < H I N but ( H I t C I t ) ( H I N C I N ) , the subject is too warm (Figure 2). For a generalized model, H I N and C I N are fixed, but for personalized models (i.e., one model per subject), they are measured for each person. To prevent instability of the control system based on the derived setpoints in practice, all the conditional statements (i.e., if statements) need acceptable error margins (i.e., a deadband).
In our study, we used a regularized Gaussian mixture model (RGMM) to capture the neutral states ( H I N ,   C I N ) for each individual. RGMM helps to extract the clusters of distribution in the indices time-series measurements ( H I t , C I t ) for each individual. An RGMM is a probabilistic model for representing and capturing the presence of subpopulations within a dataset (e.g., a time-series) without requiring an observed data set with the labels of the sub-population to which an individual observation belongs.
Parameters α, β, and γ (shown in Figure 2) should be tuned in any environment as HVAC systems and thermal characteristics may vary. The tuning procedure is similar to tuning a PID controller regulating a zone temperature. These parameters are aimed to create a time and energy-efficient HVAC system response to an individual’s thermal needs—i.e., effective cooling and heating. For example, these parameters should be large in environments with slow temperature changes (i.e., the HVAC system PID controller responds slowly). The setpoint absolute value should not be confused with the individual’s preferred temperature as the setpoint only guides the HVAC system to provide short-term cooling or heating to help the human body comfortably pass through the body’s transient conditions. These parameters can be learned in real-time by operating the HVAC system based on the values suggested by search algorithms [41]. SP 0   is the steady-state zone setpoint temperature selected at the occupied zone. It can be initialized based on the zone’s historical data (long-term preferred setpoint) and tuned over time based on steady-state occupant preferences. It could be selected to optimize energy usage with considerations of long-term comfort requirements.

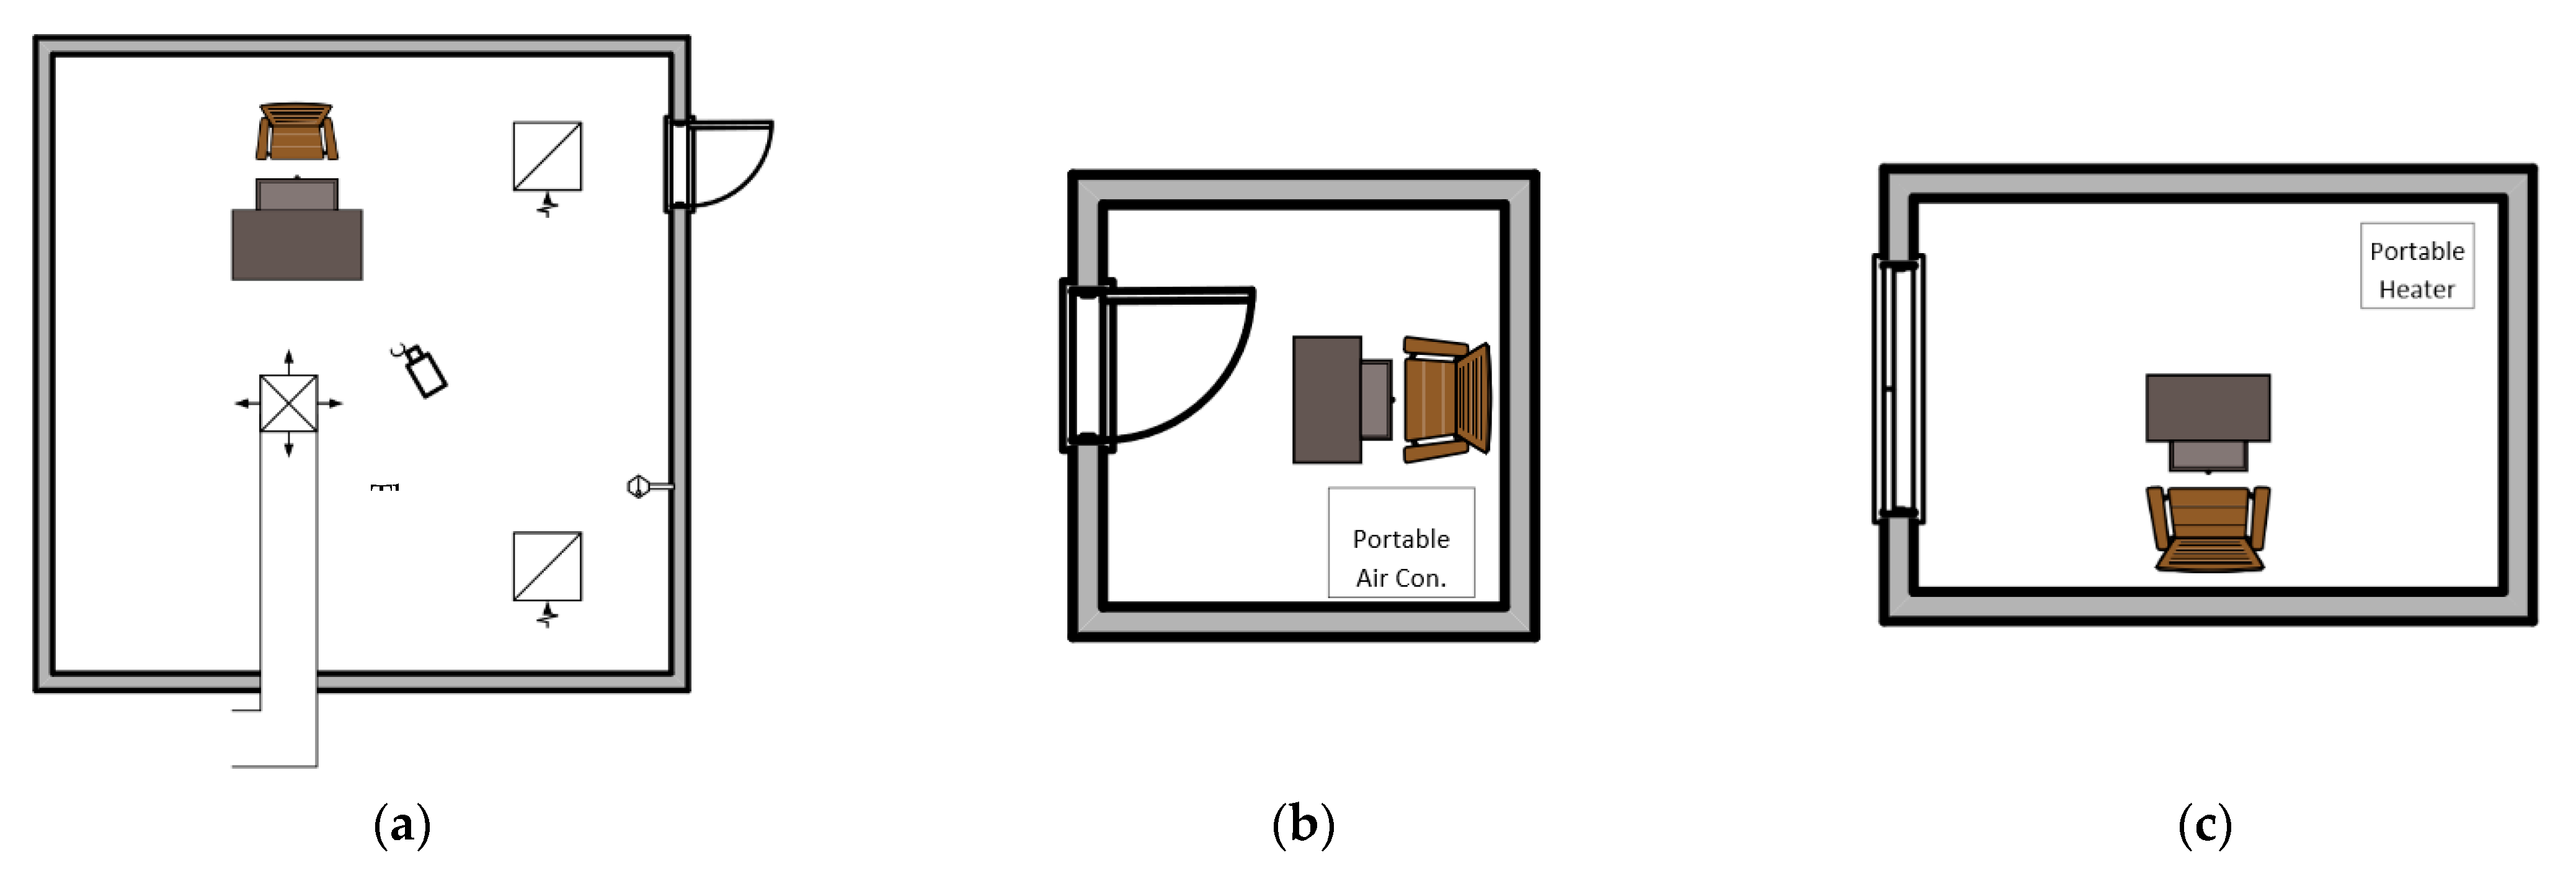
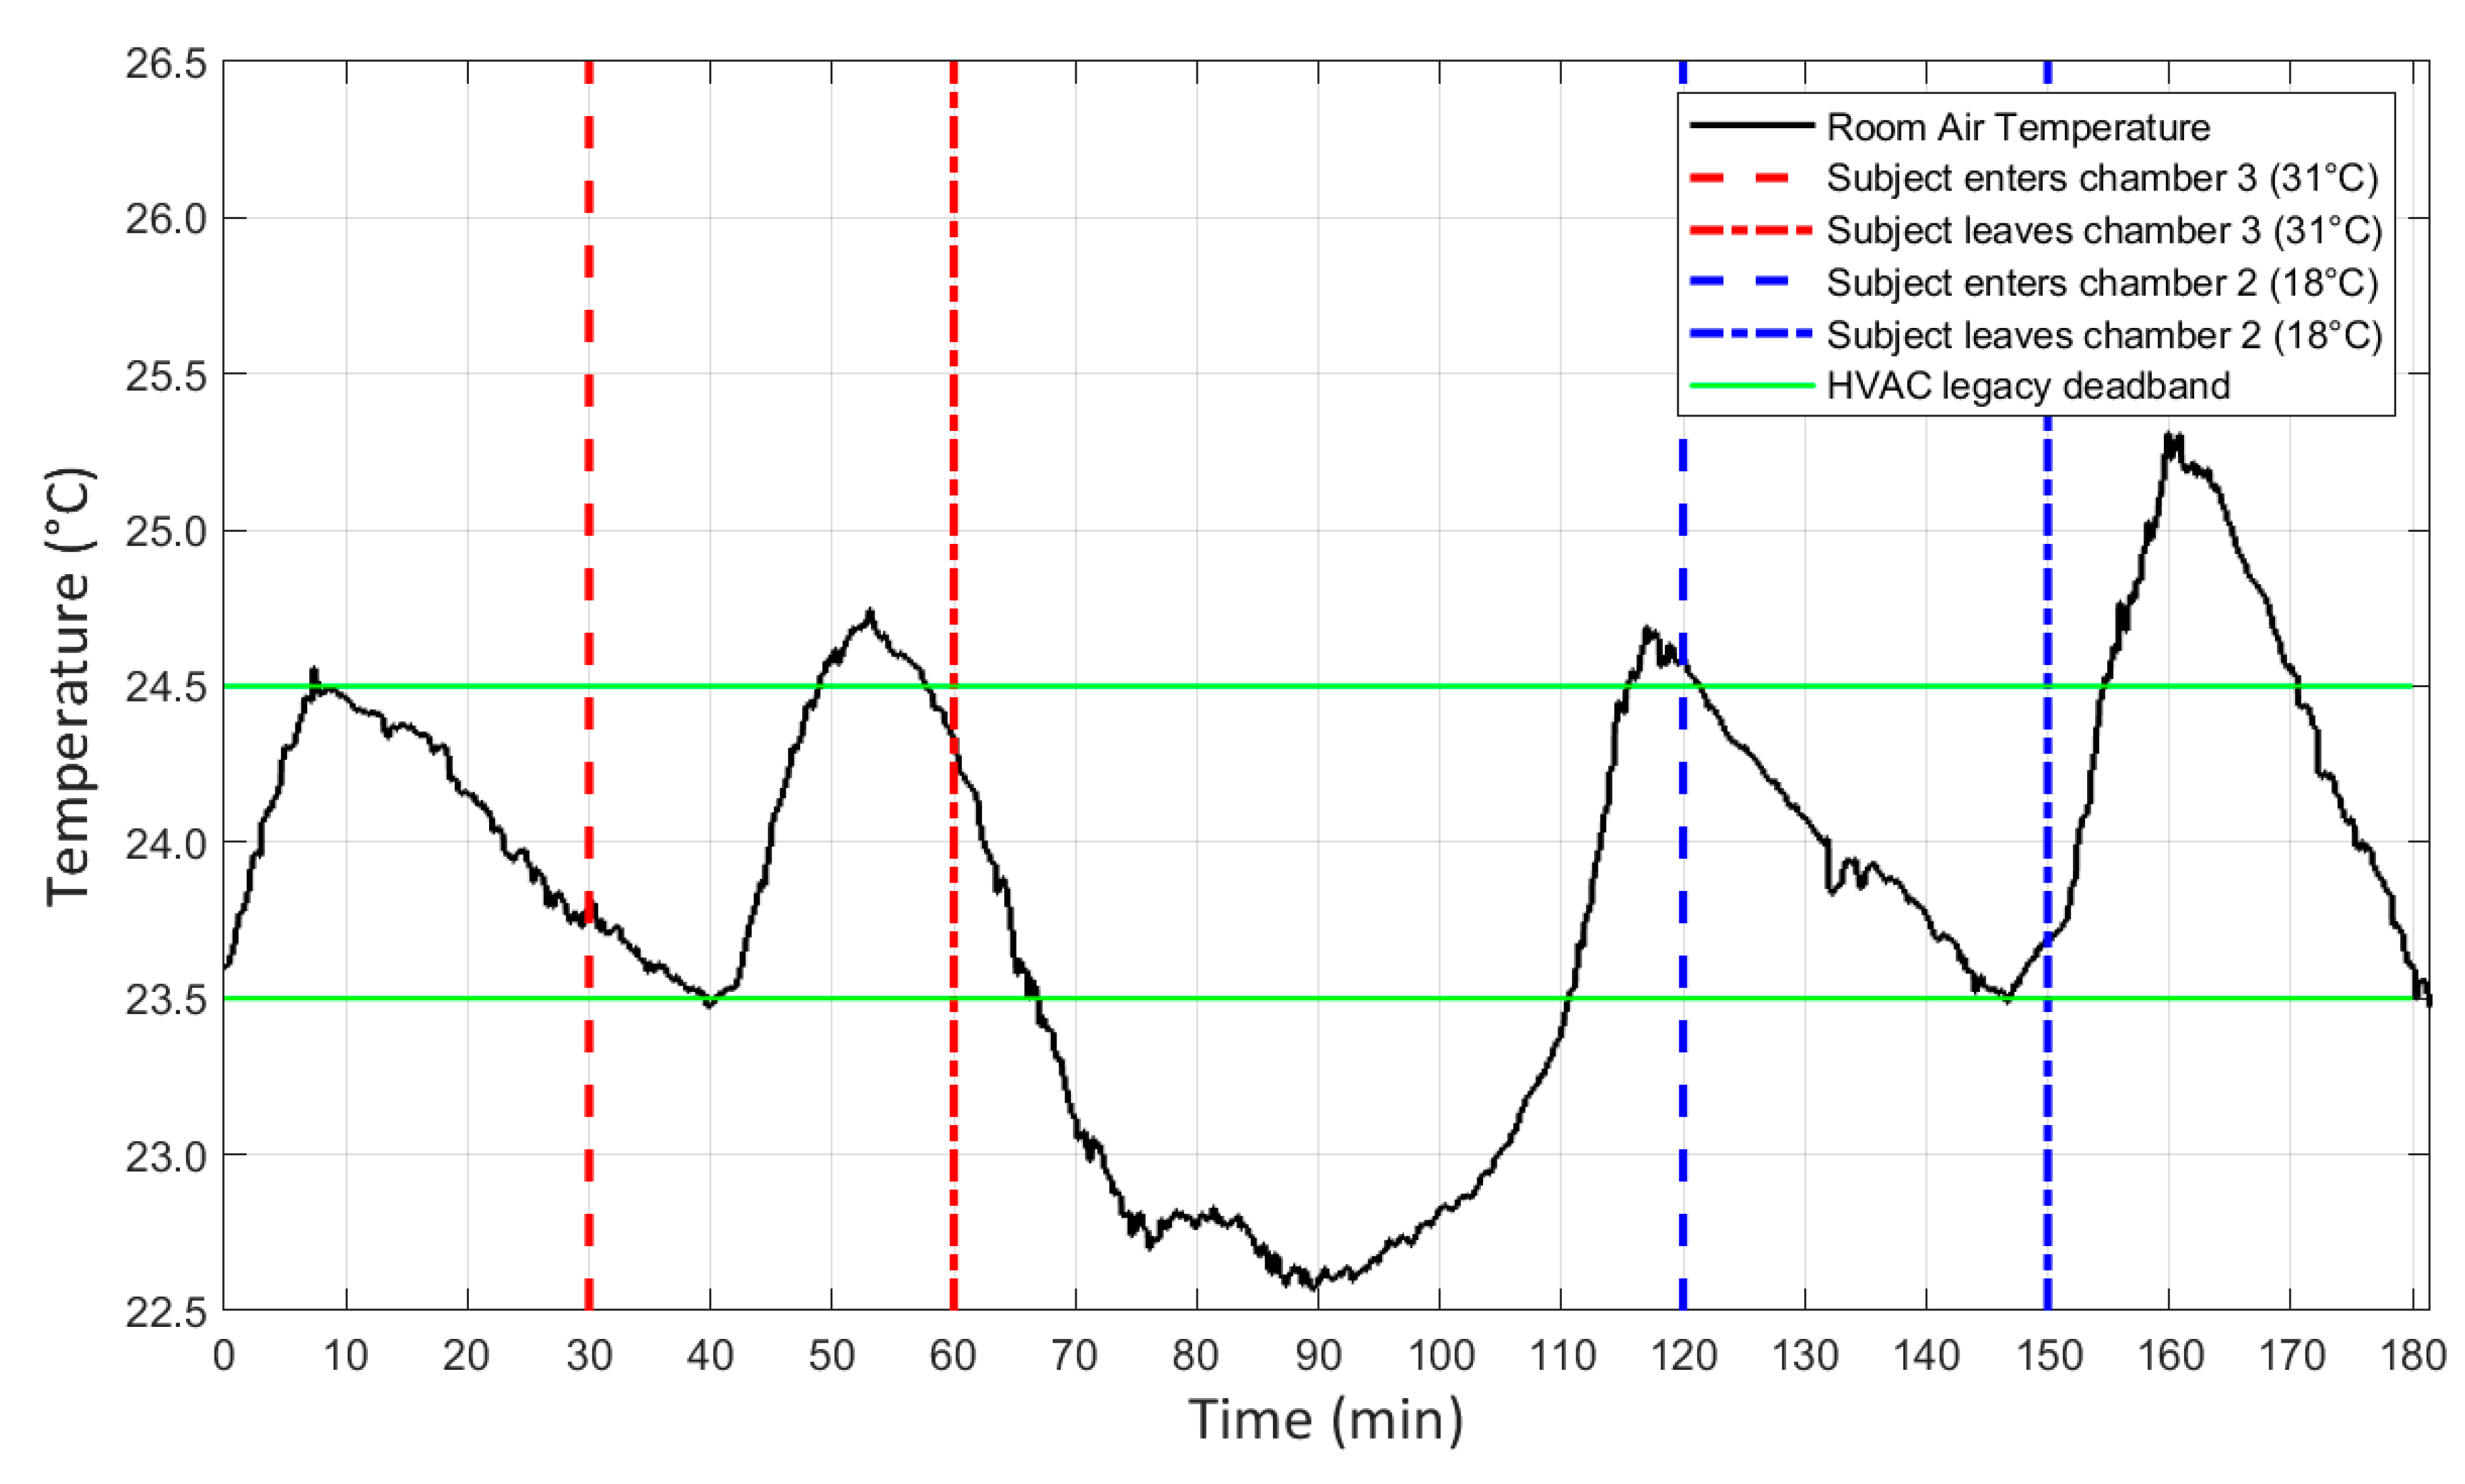
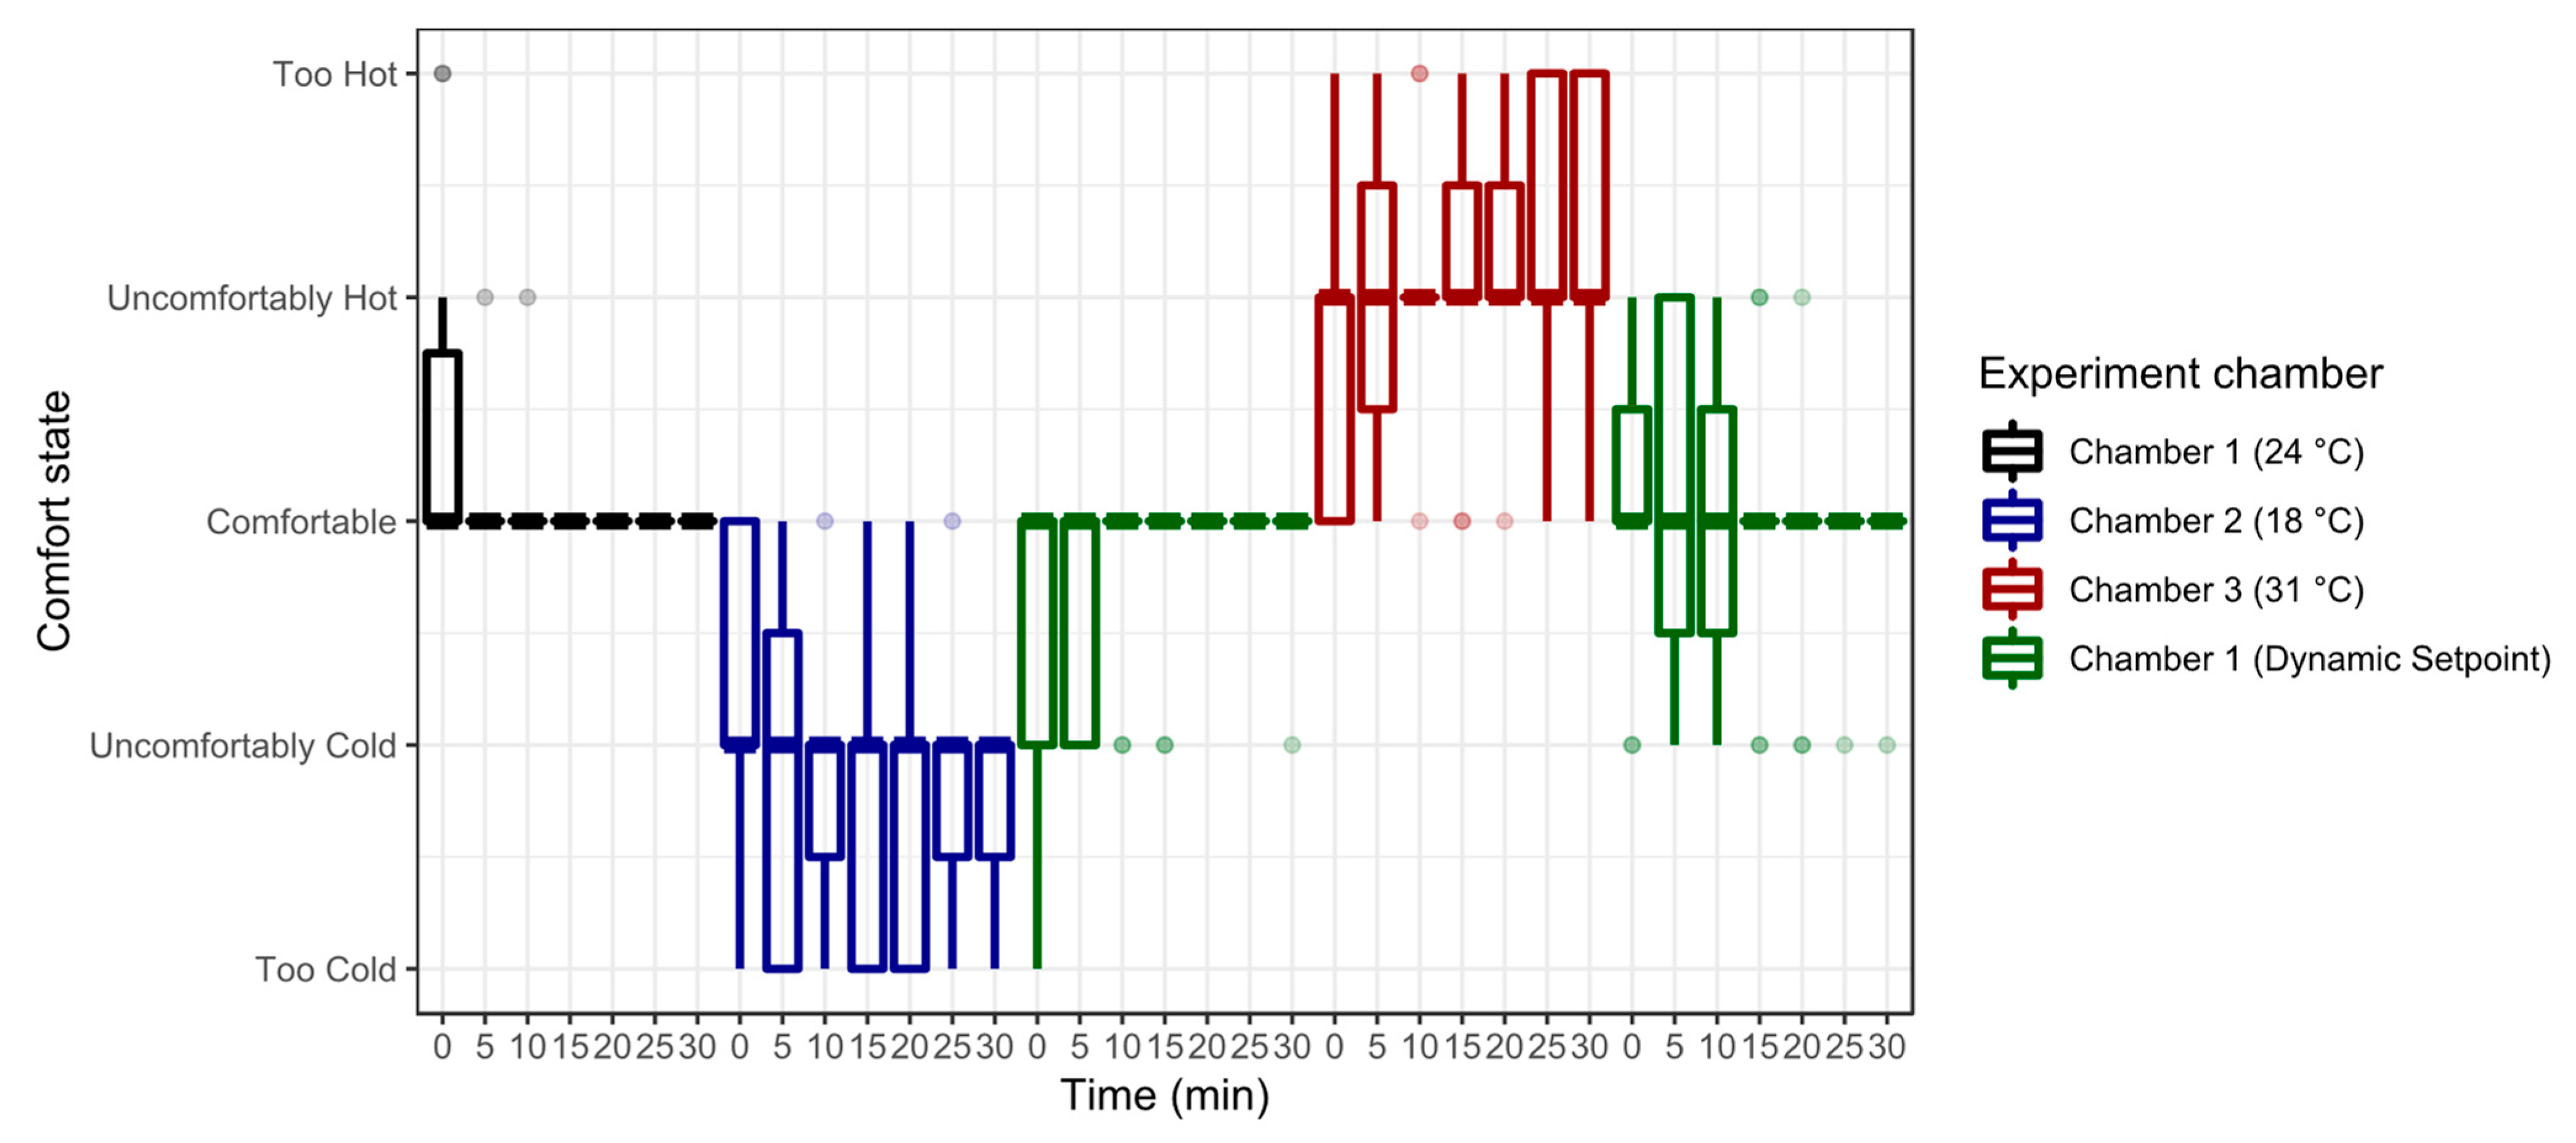
5. Experimental Design and Procedure to Simulate Exposure to Warm and Cool Environments

To evaluate the performance of our approach, we designed an experiment to expose human subjects to cold and hot thermal environments and to control the HVAC system to address the transient comfort needs of the individuals. The experiments were conducted in July and August 2021. While we did not have any clothing requirements, subjects typically wore a long-sleeve shirt, long pants, and sneakers. The experiment had five phases. In Phase 1 (acclimation in Figure 3), the subject enters climate Chamber 1 (set at 24 °C to simulate neutral indoor conditions), stays there for 30 min, and completes a comfort survey at the start and every 5 min thereafter until leaving for Phase 2. In Phase 2 (thermal stress 1 in Figure 3), the subject moves to either Chamber 2 (set at 18 °C to simulate cool conditions) or Chamber 3 (set at 31 °C to simulate warm conditions), stays there for 30 min, and completes a comfort survey at the start and every 5 min thereafter until leaving for Phase 3. We randomly assigned the subjects to Chamber 2 (cool) or 3 (warm) to eliminate the bias of our experiments to the order of experiencing Chambers 2 and 3. While the outdoor temperature in winter could reach below 0 °C and in summer exceed 35 °C in the majority of the climate zones around the world, we focused on mild conditions since the physiological responses to them are small, making them more difficult to capture and sometimes not even perceived by the subjects. Extreme hot or cold conditions have more obvious physiological signatures.
In Phase 3 (recovery phase 1 in Figure 3), the subject returns to climate Chamber 1 and stays for 60 min, completing a comfort survey at the start and every 5 min thereafter until leaving for Phase 4. Phase 3 ends early if the subject reports experiencing comfortable conditions for at least 30 min. In Phase 4 (thermal stress 2 in Figure 3), the subject moves to the other chamber (Chamber 2 if previously in Chamber 3 or Chamber 3 if previously in Chamber 2), stays there for 30 min, and completes a comfort survey at the start and every 5 min thereafter until leaving for Phase 5. In Phase 5 (recovery 2 in Figure 3), the subject returns to climate Chamber 1 and stays for 30 min, completing a comfort survey at the beginning and every 5 min until the end. The survey had just a single question, “How do you perceive the thermal environment: (1) Too cold, (2) Uncomfortably cool, (3) Comfortable, (4) Uncomfortably warm, or (5) Too hot”. At the end of the experiment, the occupant was asked, “Overall thermal preference (perceived when you compare yourself with others): (1) Prefer warmer, (2) No difference, (3) Prefer cooler”.
Three climate chambers were located at the Center for the Built Environment at the University of California, Berkeley (UC Berkeley). Chamber 1 is 5.5 mL × 5.5 mW × 2.5 mH, Chamber 2 is 2 m Long × 2 m Wide × 2.5 m High, and Chamber 2 is 3 m Long × 2 m Wide × 2.5 m High (Figure 4). The main chamber (Chamber 1) had a dedicated AHU CAV system to regulate the air temperature via a thermostat with ±0.3 °C reported accuracy. We used a portable air conditioning system in Chamber 2 to provide cooling and a portable electric heater in Chamber 3 to provide heating. We recruited 12 human subjects (4 females and 9 males), primarily research staff aged 30–40 years. The average age of the participants was 34.8 years, with a standard deviation of 9.5. The average height of the participants was 173 cm, with a standard deviation of 7.5. The average weight of the participants was 70 kg, with a standard deviation of 13.2. The test subjects were healthy and were asked to perform regular office activities such as working on their laptops, phones, or with people in the chamber while they sat behind a desk. All data from one subject and the Phase 3 data from another subject became unusable due to errors in our infrared temperature corrections (i.e., removing the effects of infrared sensor drift) and were omitted. Accordingly, we collected complete data for 11 subjects and partial data for 1 subject. The experiments were performed in July and August 2021.

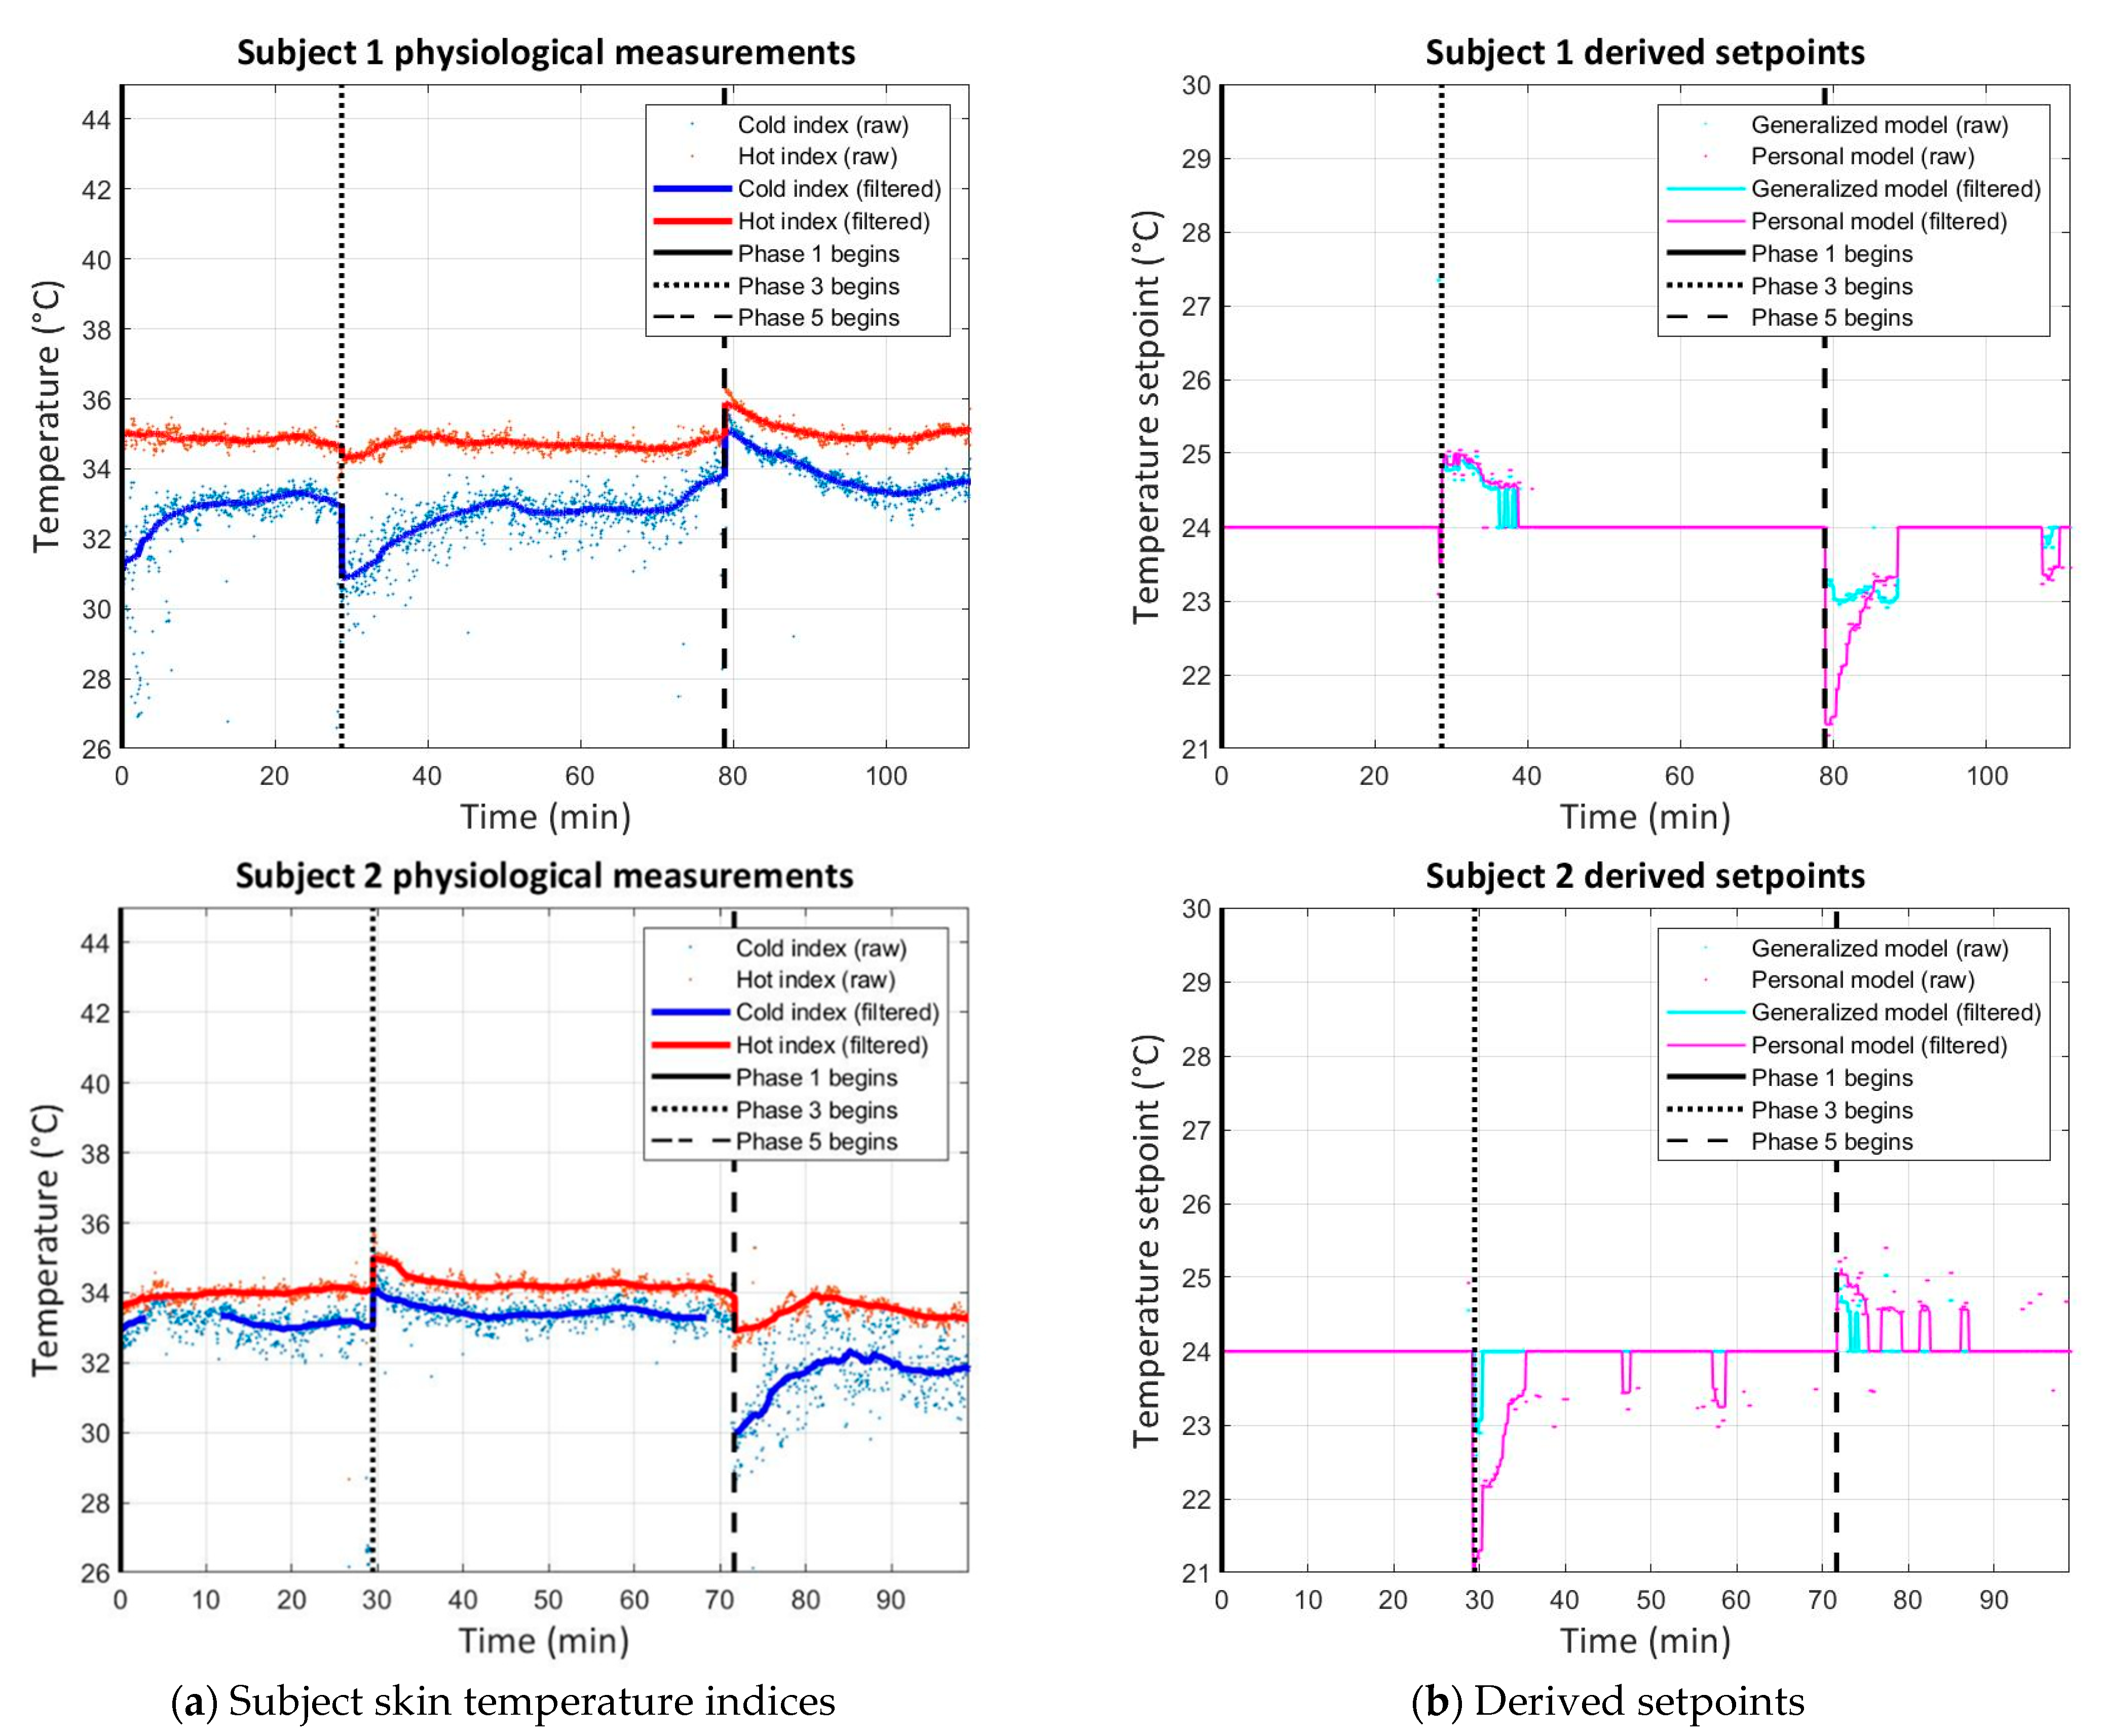
6. Validation Results for Sensor/Controller Integrated System

As occupants were randomly exposed to hot and cold environments, we tested if the physiological response monitored in our system accurately captured the thermoregulation state (i.e., being in an overheated or overcooled state) and accordingly resulted in a correct setpoint adjustment. We evaluated our system based on the correctness of response (i.e., correct cooling or heating) until it was needed. Figure 5 demonstrates two sample subject physiological measurements and derived setpoints during the fixed setpoint phase (Phase 1) and the dynamic setpoints phases (Phases 3 and 5). We did not collect physiological measurements during Phases 2 and 4 since the collected data were not useful to our analysis. The sampling rate was 2 Hz, and we applied a median filter with a window length of 60 to eliminate the noise and outliers. In Phase 1, we fixed the setpoint at 24 °C as a neutral temperature. As an example, subject 1 began Phase 1 of the experiment feeling cold and recovering. When returning from the hot chamber (Phase 3), the hot and cold indices are both elevated, and our sensor/controller correctly provides cooling until the indices reach the neutral state. When returning from the cold chamber (Phase 3), a similar behavior as Phase 1 is observed in the cold index, and our sensor/controller system increases the setpoint. We applied the same procedure for all 12 subjects.
We evaluated the performance of our system to help the human body reach its thermoneutral state by verifying if it provided the correct mode of service (cooling, no change, or heating). While we calculated setpoints based on both generalized and personalized models, we operated the chamber HVAC system based on the personalized models (as they are more accurate) in Phases 3 and 5. Generalized models were evaluated after running all the experiments and averaging hot and cold indices. Table 4 summarizes the performance evaluation. As it can be seen, out of 23 scenarios (11 subjects with 2 scenarios each and 1 subject with 1 scenario), generalized models provided the correct mode of service in 15 cases (65.2%), did not make a change in 4 cases (17.4%), and provided the wrong mode of service in 4 cases (17.4%). Generalized models performed relatively better in capturing cold stresses, correctly estimating 9 out of 12 cases (75%). Personalized models (i.e., models that used hot and cold indices derived for each subject) significantly outperformed the generalized models by providing the correct model of service in 21 cases (91.3%), did not make a change in only 1 case (4.3%), and incorrectly picked the service mode in 1 case (4.3%).
Figure 6 shows the temperature response in Chamber 1 based on the setpoints. While our sensor/controller system immediately noticed the comfort state and adjusted the setpoints, Chamber 1’s HVAC system had a delay of about 7 min in discharging cold air once the setpoints were communicated.

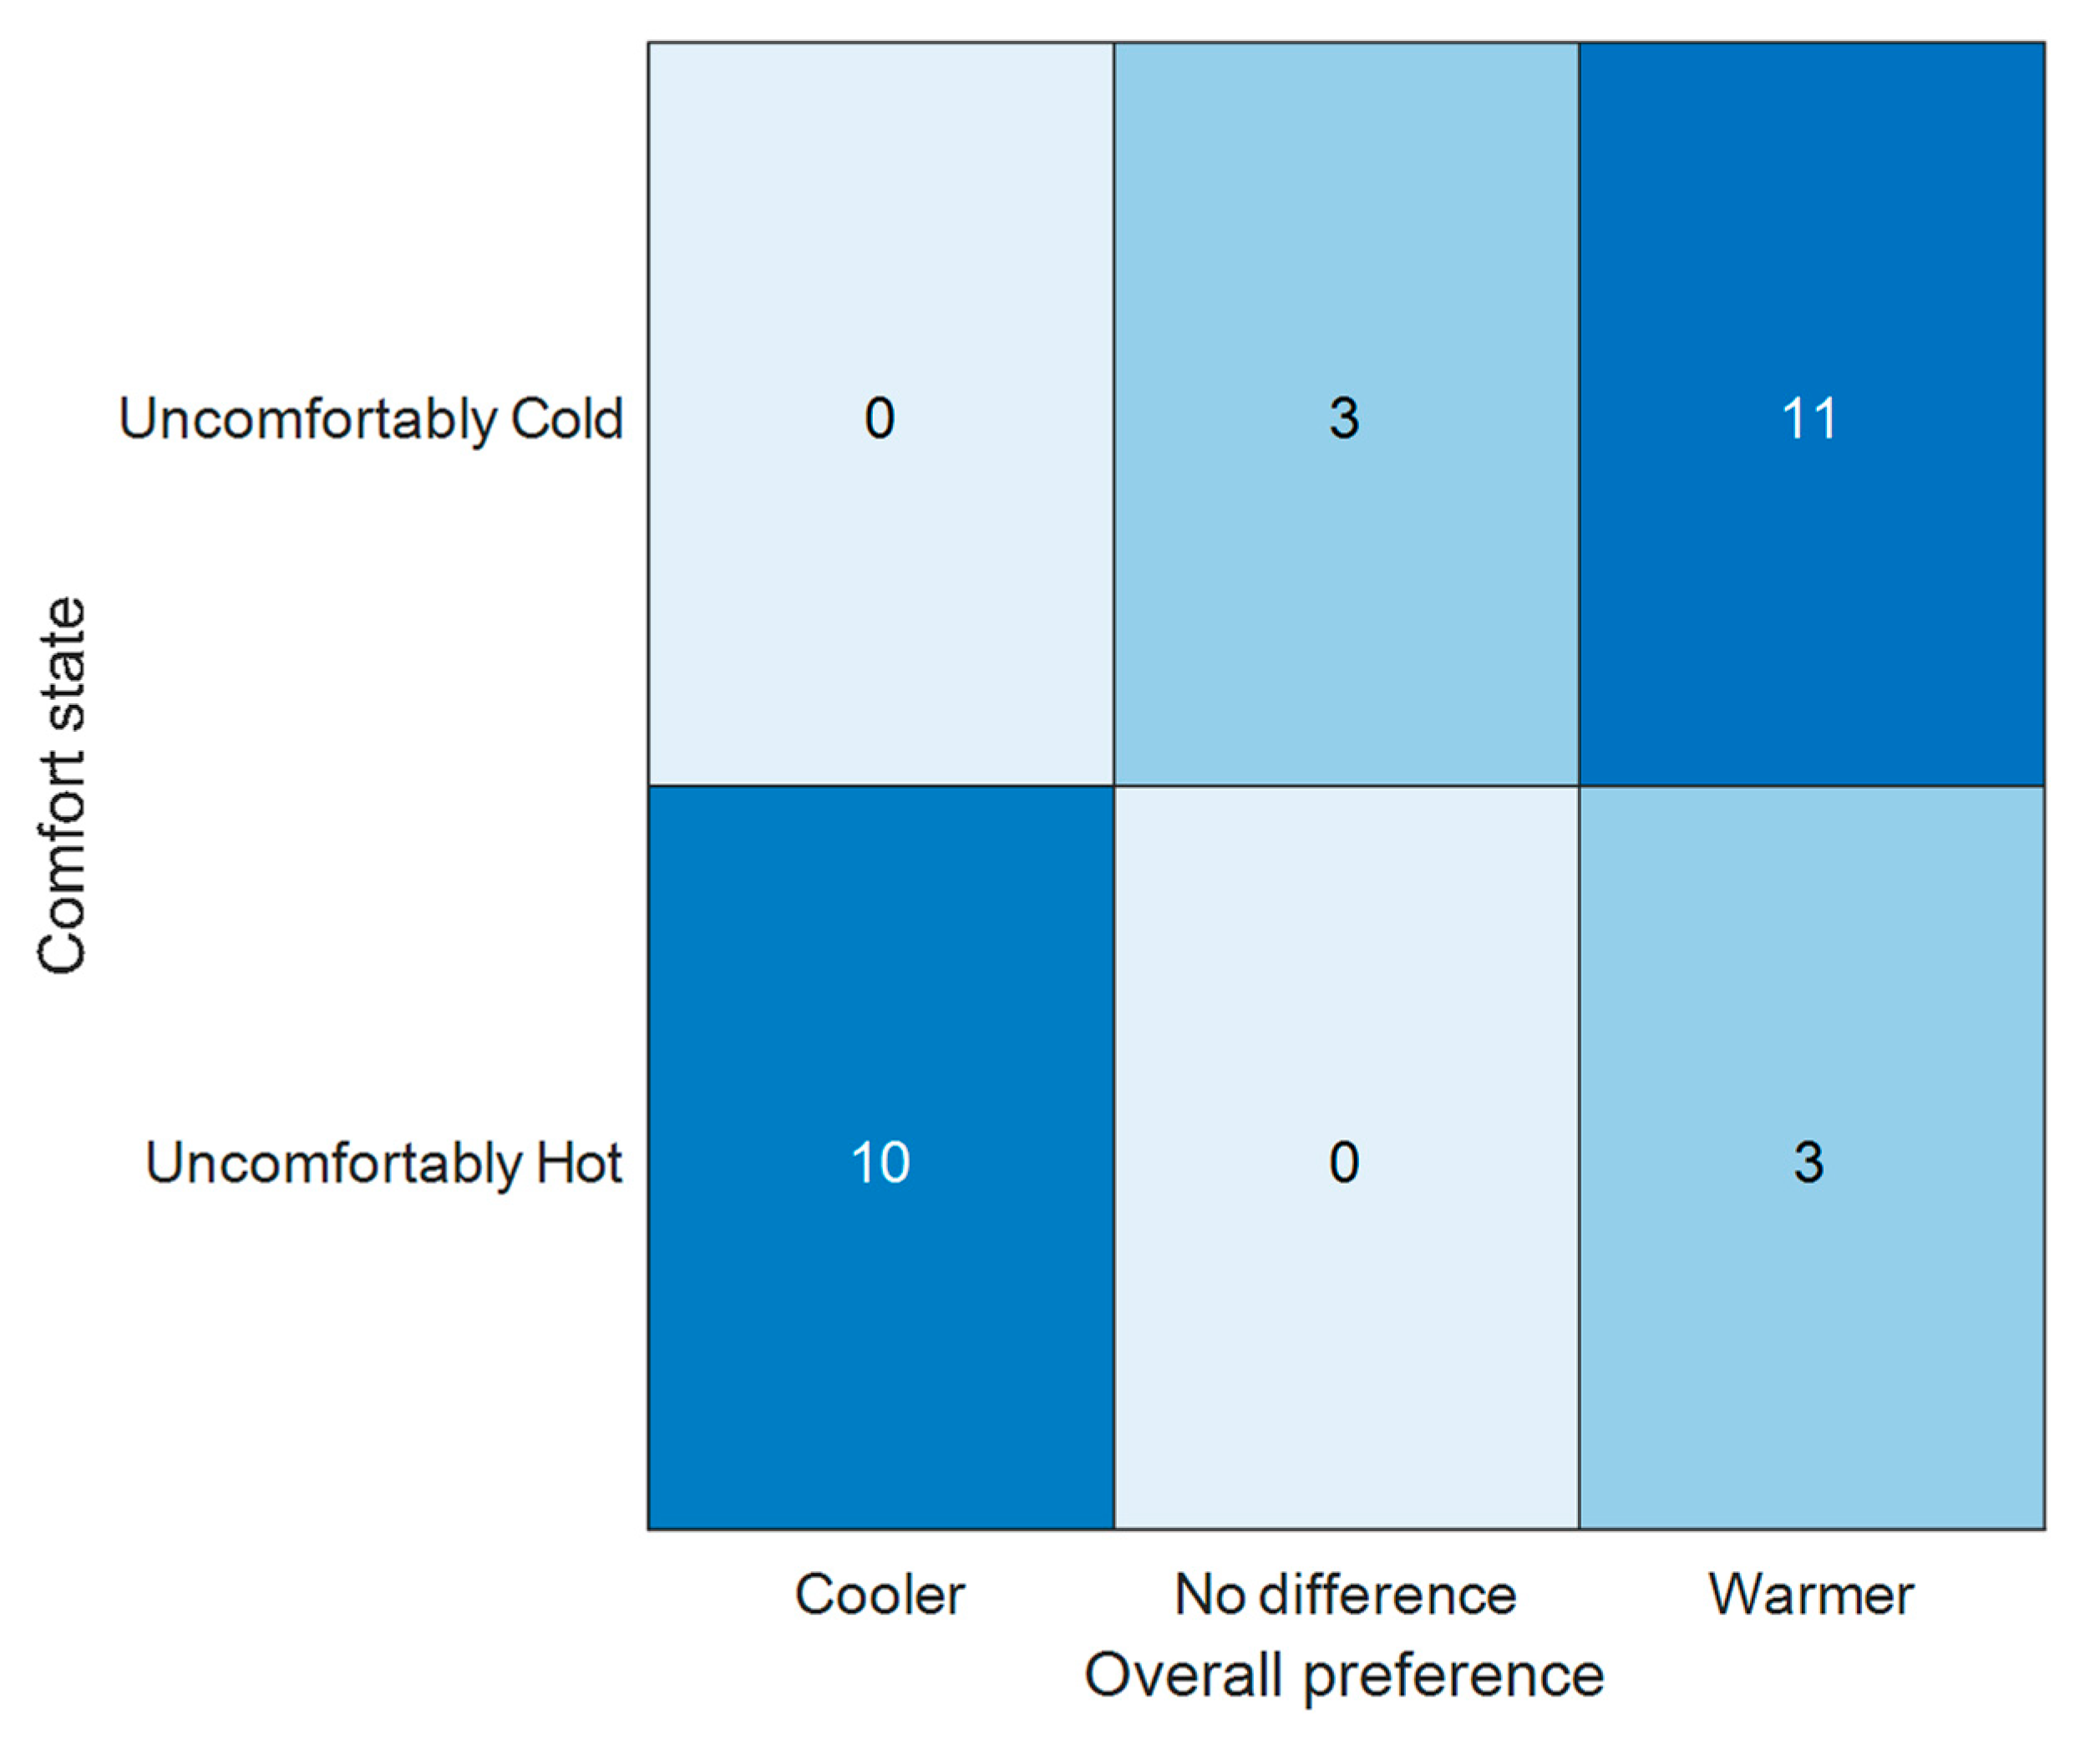
Quantification of Thermal Comfort Efficacy

The comfort survey results are presented in Figure 7. As can be seen, a few subjects started the experiments uncomfortably warm but acclimated and entered Phase 2 (either Chamber 2 or Chamber 3) of the experiment comfortably. Upon entering Chamber 2 (18 °C), either in Phase 2 or Phase 4, the subject grew increasingly cold over the 30-min period. A similar trend of increase in discomfort perceptions was observed for subjects in Chamber 3. These match the physiological response observed when entering Chamber 1, as shown in the previous section. As occupants returned to Chamber 1 operating based on our sensor/controller, the comfort states began to improve and reached comfortable states in approximately 10 min in heating mode and 15 min in cooling mode. The longer recovery time in cooling mode is partially related to the slower cooling response of the chamber air conditioning system (lag of about 7 min). The cooling provided to subjects coming from Chamber 3 (31 °C) created an uncomfortably cold state in some cases, but the uncomfortable cold state went away as setpoints recovered in response to the cooling of the subject’s body. This could be further tuned through adjustments to the coefficients α, β, and γ in a zone-level and personalized manner. As can be seen in Figure 8, subjects who prefer warmer environments reported being uncomfortably cold in these cases. The strong coefficient of correlation ( R = 0.71) shows that individual differences should be considered in the cooling and heating rates when some knowledge of occupant preference is available.

7. Discussion and Limitations

In this study, we demonstrated a non-intrusive method to capture short-term personal thermal comfort requirements and integrate them into the HVAC system’s control logic to improve comfort by defining a set of operational constraints. The advantage of defining the thermal comfort requirements as a set of operational constraints is that it transforms the multi-objective optimization problem in HVAC systems into solely one objective, which is energy efficiency. The benefits of the non-intrusive thermal comfort sensing system are not limited to energy efficiency. The prediction of thermal comfort via our proposed non-intrusive and contactless technique can be integrated into existing service systems, such as personal fans, ceiling fans, and any type of HVAC system, to make them responsive to the occupant needs in an autonomous way. Consequently, it would help improve occupant work productivity and health in the long term [42,43]. The personalized HVAC control system could also be applied to various scenarios, such as sleep and driving modes, to improve thermally comfortable indoor environments in all aspects [44]. The non-contact sensing technique can be used in construction fields to monitor thermal stress on construction workers, especially those who work in extreme weather [45]. Another potential application area is the non-contact health care field, specifically, the detection of elevated body temperature. Although wearable devices can be used to monitor and detect the patients [46], such as Covid-19-affected individuals, they are at the cost of potential exposure to the virus [47]. The non-contact autonomous thermal sensing techniques can assist healthcare staff in rapidly diagnosing the disease and making decisions on time [48].
Although this study has significant contributions and applications in practice, it has some limitations. First, the validation results were based on data collected for 12 participants; further exploration with a larger sample is required to generalize the observed behavior. Second, data collection was performed in a relatively cool indoor environment, and consequently, further adjustments may be needed when the proposed techniques are applied in tropical indoor fields. Third, we designed the experiments with a fixed set of conditions to validate the efficacy of our system in capturing the thermoregulation performance in response to thermal stimuli; the experiments did not represent realistic and regular activities of the occupants in buildings. We plan to carry out a set of experiments representing regular occupant daily activities [49] to study the proposed system in a future study. Finally, we selected the median filter window length of 60 based on simple trial and error. More sophisticated filters could be explored to conserve valuable information in the physiological measurements. While this study shows the potential for integration of infrared and visible light images to capture thermal comfort non-intrusively, we describe additional limitations which have to be addressed for scaling up the technology deployment. (1) In a real application, the camera location might not always be capable of observing the occupant's face. To address this limitation, we foresee that the camera system is located in the center of the room in the ceiling and able to look around the room via a robotic arm. (2) Since the system takes images of the occupant, the privacy and security of the occupant’s data should be considered.

8. Conclusions

Rapid technology advancements have provided the opportunity for non-intrusive and non-invasive estimation of personal thermal comfort without requiring occupant feedback. This is a prerequisite for autonomous operations of building HVAC systems. To eliminate the need for occupant feedback for training machine learning techniques, we described the fundamentals of thermoregulation system behaviors and thermal infrared thermography that were leveraged in the development of our sensor/controller system. Specifically, we designed a novel non-intrusive thermal/visual camera system that uses a thermal infrared camera and a visible light camera to capture images. Based on the non-intrusive thermal/visual camera system, we successfully aligned the thermal infrared and visible images via applying elastic image registration, identified facial components (e.g., eyes and nose), and read the temperatures from the appropriate coordinates in the thermal image. We also utilized a heuristic algorithm that employs predefined rules to obtain reliable facial temperature measurements.
In addition, we evaluated the performance of the proposed infrared contactless thermal comfort sensing system by verifying whether the system provides the correct mode of HVAC service (cooling, heating, off) to help occupants reach their thermoneutral states. Specifically, we used a five-phase experiment to simulate human exposures to cool and warm conditions and measured our sensor/controller’s thermal comfort efficacy. The results demonstrated that our generalized models could provide the correct reaction of HVAC systems in 15 out of 23 scenarios (65.2%). The generalized models can be used for occupants with no prior thermal imagery history. Specifically, they performed relatively better in capturing cold stresses. The personalized models significantly outperformed the generalized models by providing correct service in 21 out of 23 cases (91.3%). In addition, the strong coefficient of correlation ( R = 0.71) suggests that individual differences should be considered when the knowledge of the occupant’s overall thermal preference is available.
The proposed personal thermal comfort sensing strategy can effectively address individual differences and the problem of comfort transient in indoor thermal comfort requirements and possibly achieve thermal satisfaction for every occupant in an autonomous way. In addition to enhancing the satisfaction and comfort of occupants, the proposed infrared contactless thermal comfort sensing system has great potential in building energy savings. With the emergence of IoT in the built environment, the personal models can also be leveraged to build autonomous personal comfort devices and be integrated into central HVAC systems at a large scale to improve the human experience, well-being, and building energy efficiency.

Author Contributions

Conceptualization, A.G. and R.L.; methodology, A.G., H.Z. and R.L.; software, S.M., A.W. and A.M.; validation, Y.H. and H.Z.; formal analysis, A.G.; investigation, R.L. and A.G.; data curation, S.M., A.W. and A.M.; writing—original draft preparation, A.G., R.L., S.M., A.W. and Q.X.; writing—review and editing, A.G. and Q.X.; visualization, A.G., S.M., A.W.; project administration, R.L. and H.Z. funding acquisition, R.L. and A.G. All authors have read and agreed to the published version of the manuscript.

Funding

This research was supported by the Assistant Secretary for Energy Efficiency and Renewable Energy, Building Technologies Office of the U.S. Department of Energy under Contract No. DE-AC02-05CH11231; and by Singapore Ministry of Education grant no A-0008302-00-00. Any opinions, findings, conclusions, or recommendations expressed in this material are those of the authors and do not necessarily reflect the views of the U.S. Department of Energy and the Singapore Ministry of Education.

Institutional Review Board Statement

This study was conducted in accordance with approvals obtained from the UC Berkeley ethics committee.

Informed Consent Statement

Informed consent was obtained from all subjects involved in the study.

Data Availability Statement

Not applicable.

Conflicts of Interest

The authors declare no conflict of interest.

References

  1. Standard 55-2004; Thermal Environmental Conditions for Human Occupancy. American Society of Heating, Refrigerating and Air-Conditioning Engineers: Atlanta, GA, USA, 2004.
  2. Karjalainen, S. Thermal comfort and gender: A literature review. Indoor Air 2012, 22, 96–109. [Google Scholar] [CrossRef] [PubMed]
  3. Brager, G.S.; De Dear, R.J. Thermal adaptation in the built environment: A literature review. Energy Build. 1998, 27, 83–96. [Google Scholar] [CrossRef]
  4. Jendritzky, G.; Dear, R. de Adaptation and thermal environment. In Biometeorology for Adaptation to Climate Variability and Change; Springer: Berlin/Heidelberg, Germany, 2009; pp. 9–32. [Google Scholar]
  5. Ning, H.; Wang, Z.; Ji, Y. Thermal history and adaptation: Does a long-term indoor thermal exposure impact human thermal adaptability? Appl. Energy 2016, 183, 22–30. [Google Scholar] [CrossRef]
  6. Schellen, L.; van Marken Lichtenbelt, W.D.; Loomans, M.G.; Toftum, J.; De Wit, M.H. Differences between young adults and elderly in thermal comfort, productivity, and thermal physiology in response to a moderate temperature drift and a steady-state condition. Indoor Air 2010, 20, 273–283. [Google Scholar] [CrossRef]
  7. Uğursal, A.; Culp, C.H. The effect of temperature, metabolic rate and dynamic localized airflow on thermal comfort. Appl. Energy 2013, 111, 64–73. [Google Scholar] [CrossRef]
  8. Karmann, C.; Schiavon, S.; Arens, E. Percentage of commercial buildings showing at least 80% occupant satisfied with their thermal comfort. Indoor Environ. Qual. 2018. Available online: https://escholarship.org/uc/item/89m0z34x (accessed on 11 July 2022).
  9. Ghahramani, A.; Dutta, K.; Yang, Z.; Ozcelik, G.; Becerik-Gerber, B. Quantifying the influence of temperature setpoints, building and system features on energy consumption. In Proceedings of the 2015 Winter Simulation Conference (WSC), Huntington Beach, CA, USA, 6–9 December 2015; pp. 1000–1011. [Google Scholar]
  10. Ghahramani, A.; Zhang, K.; Dutta, K.; Yang, Z.; Becerik-Gerber, B. Energy savings from temperature setpoints and deadband: Quantifying the influence of building and system properties on savings. Appl. Energy 2016, 165, 930–942. [Google Scholar] [CrossRef]
  11. Yang, B.; Li, X.; Hou, Y.; Meier, A.; Cheng, X.; Choi, J.-H.; Wang, F.; Wang, H.; Wagner, A.; Yan, D. Non-invasive (non-contact) measurements of human thermal physiology signals and thermal comfort/discomfort poses—A review. Energy Build. 2020, 224, 110261. [Google Scholar] [CrossRef]
  12. Huizenga, C.; Zhang, H.; Arens, E.; Wang, D. Skin and core temperature response to partial-and whole-body heating and cooling. J. Therm. Biol. 2004, 29, 549–558. [Google Scholar] [CrossRef]
  13. Takada, S.; Matsumoto, S.; Matsushita, T. Prediction of whole-body thermal sensation in the non-steady state based on skin temperature. Build. Environ. 2013, 68, 123–133. [Google Scholar] [CrossRef]
  14. Ghahramani, A.; Castro, G.; Karvigh, S.A.; Becerik-Gerber, B. Towards unsupervised learning of thermal comfort using infrared thermography. Appl. Energy 2018, 211, 41–49. [Google Scholar] [CrossRef]
  15. Newell, A.; Yang, K.; Deng, J. Stacked hourglass networks for human pose estimation. In Proceedings of the European Conference on Computer Vision, Amsterdam, The Netherlands, 8–16 October 2016; Springer: Berlin/Heidelberg, Germany, 2016; pp. 483–499. [Google Scholar]
  16. Ghahramani, A.; Tang, C.; Becerik-Gerber, B. An online learning approach for quantifying personalized thermal comfort via adaptive stochastic modeling. Build. Environ. 2015, 92, 86–96. [Google Scholar] [CrossRef]
  17. Ghahramani, A.; Castro, G.; Becerik-Gerber, B.; Yu, X. Infrared thermography of human face for monitoring thermoregulation performance and estimating personal thermal comfort. Build. Environ. 2016, 109, 1–11. [Google Scholar] [CrossRef]
  18. Guo, J.; Deng, J.; Xue, N.; Zafeiriou, S. Stacked dense u-nets with dual transformers for robust face alignment. arXiv 2018, arXiv:1812.01936. [Google Scholar]
  19. Charkoudian, N. Skin Blood Flow in Adult Human Thermoregulation: How It Works, When It Does Not, and Why. Mayo Clin. Proc. 2003, 78, 603–612. [Google Scholar] [CrossRef]
  20. Charkoudian, N. Mechanisms and modifiers of reflex induced cutaneous vasodilation and vasoconstriction in humans. J. Appl. Physiol. 2010, 109, 1221–1228. [Google Scholar] [CrossRef] [PubMed]
  21. Riganello, F.; Garbarino, S.; Sannita, W.G. Heart Rate Variability, Homeostasis, and Brain Function: A Tutorial and Review of Application. J. Psychophysiol. 2012, 26, 178–203. [Google Scholar] [CrossRef]
  22. Mansi, S.A.; Pigliautile, I.; Porcaro, C.; Pisello, A.L.; Arnesano, M. Application of wearable EEG sensors for indoor thermal comfort measurements. Acta IMEKO 2021, 10, 214–220. [Google Scholar] [CrossRef]
  23. Yang, B.; Cheng, X.; Dai, D.; Olofsson, T.; Li, H.; Meier, A. Macro pose based non-invasive thermal comfort perception for energy efficiency. arXiv 2018, arXiv:1811.07690. [Google Scholar]
  24. Wilke, K.; Martin, A.; Terstegen, L.; Biel, S.S. A short history of sweat gland biology. Int. J. Cosmet. Sci. 2007, 29, 169–179. [Google Scholar] [CrossRef]
  25. Reilly, T.; Waterhouse, J. Circadian aspects of body temperature regulation in exercise. J. Therm. Biol. 2009, 34, 161–170. [Google Scholar] [CrossRef]
  26. Yao, Y.; Lian, Z.; Liu, W.; Shen, Q. Experimental study on physiological responses and thermal comfort under various ambient temperatures. Physiol. Behav. 2008, 93, 310–321. [Google Scholar] [CrossRef]
  27. Yang, B.; Cheng, X.; Dai, D.; Olofsson, T.; Li, H.; Meier, A. Real-time and contactless measurements of thermal discomfort based on human poses for energy efficient control of buildings. Build. Environ. 2019, 162, 106284. [Google Scholar] [CrossRef]
  28. Li, D.; Menassa, C.C.; Kamat, V.R. Non-intrusive interpretation of human thermal comfort through analysis of facial infrared thermography. Energy Build. 2018, 176, 246–261. [Google Scholar] [CrossRef]
  29. Baker, F.C.; Siboza, F.; Fuller, A. Temperature regulation in women: Effects of the menstrual cycle. Temperature 2020, 7, 226–262. [Google Scholar] [CrossRef] [PubMed]
  30. Aryal, A.; Becerik-Gerber, B. A comparative study of predicting individual thermal sensation and satisfaction using wrist-worn temperature sensor, thermal camera and ambient temperature sensor. Build. Environ. 2019, 160, 106223. [Google Scholar] [CrossRef]
  31. Aryal, A.; Becerik-Gerber, B. Skin temperature extraction using facial landmark detection and thermal imaging for comfort assessment. In Proceedings of the 6th ACM International Conference on Systems for Energy-Efficient Buildings, Cities, and Transportation, New York, NY, USA, 13–14 November 2019; pp. 71–80. [Google Scholar]
  32. Pavlin, B.; Pernigotto, G.; Cappelletti, F.; Bison, P.; Vidoni, R.; Gasparella, A. Real-Time Monitoring of Occupants’ Thermal Comfort through Infrared Imaging: A Preliminary Study. Buildings 2017, 7, 10. [Google Scholar] [CrossRef]
  33. Wu, Y.; Liu, H.; Li, B.; Kosonen, R. Prediction of thermal sensation using low-cost infrared array sensors monitoring system. IOP Conf. Ser. Mater. Sci. Eng. 2019, 609, 032002. [Google Scholar] [CrossRef]
  34. Smith, J.W.; Aston, S.J.; Beasley, R.W.; Thorne, C. Grabb and Smith’s Plastic Surgery; Lippincott-Raven: Philadelphia, Pennsylvania, 1997; ISBN 0-316-32255-5. [Google Scholar]
  35. Bach, A.J.E.; Stewart, I.B.; Disher, A.E.; Costello, J.T. A Comparison between Conductive and Infrared Devices for Measuring Mean Skin Temperature at Rest, during Exercise in the Heat, and Recovery. PLoS ONE 2015, 10, e0117907. [Google Scholar] [CrossRef] [PubMed]
  36. de Andrade Fernandes, A.; dos Santos Amorim, P.R.; Brito, C.J.; de Moura, A.G.; Moreira, D.G.; Costa, C.M.A.; Sillero-Quintana, M.; Marins, J.C.B. Measuring skin temperature before, during and after exercise: A comparison of thermocouples and infrared thermography. Physiol. Meas. 2014, 35, 189–203. [Google Scholar] [CrossRef]
  37. Priego Quesada, J.I.; Martínez Guillamón, N.; de Anda, R.M.C.O.; Psikuta, A.; Annaheim, S.; Rossi, R.M.; Corberán Salvador, J.M.; Pérez-Soriano, P.; Salvador Palmer, R. Effect of perspiration on skin temperature measurements by infrared thermography and contact thermometry during aerobic cycling. Infrared Phys. Technol. 2015, 72, 68–76. [Google Scholar] [CrossRef]
  38. Bulat, A.; Tzimiropoulos, G. How far are we from solving the 2d & 3d face alignment problem? (and a dataset of 230,000 3d facial landmarks). In Proceedings of the IEEE International Conference on Computer Vision, Venice, Italy, 22–29 October 2017; pp. 1021–1030. [Google Scholar]
  39. Deng, J.; Zhou, Y.; Cheng, S.; Zaferiou, S. Cascade multi-view hourglass model for robust 3d face alignment. In Proceedings of the 2018 13th IEEE International Conference on Automatic Face & Gesture Recognition (FG 2018), Xi’an, China, 15–19 May 2018; pp. 399–403. [Google Scholar]
  40. Zhang, K.; Zhang, Z.; Li, Z.; Qiao, Y. Joint face detection and alignment using multitask cascaded convolutional networks. IEEE Signal Process. Lett. 2016, 23, 1499–1503. [Google Scholar] [CrossRef]
  41. Ghahramani, A.; Karvigh, S.A.; Becerik-Gerber, B. HVAC system energy optimization using an adaptive hybrid metaheuristic. Energy Build. 2017, 152, 149–161. [Google Scholar] [CrossRef]
  42. Kaushik, A.; Arif, M.; Tumula, P.; Ebohon, O.J. Effect of thermal comfort on occupant productivity in office buildings: Response surface analysis. Build. Environ. 2020, 180, 107021. [Google Scholar] [CrossRef]
  43. Xu, Q.; Goh, H.C.; Mousavi, E.; Nabizadeh Rafsanjani, H.; Varghese, Z.; Pandit, Y.; Ghahramani, A. Towards Personalization of Indoor Air Quality: Review of Sensing Requirements and Field Deployments. Sensors 2022, 22, 3444. [Google Scholar] [CrossRef]
  44. Ghahramani, A.; Galicia, P.; Lehrer, D.; Varghese, Z.; Wang, Z.; Pandit, Y. Artificial intelligence for efficient thermal comfort systems: Requirements, current applications and future directions. Front. Built Environ. 2020, 6, 49. [Google Scholar] [CrossRef]
  45. Aryal, A.; Ghahramani, A.; Becerik-Gerber, B. Monitoring fatigue in construction workers using physiological measurements. Autom. Constr. 2017, 82, 154–165. [Google Scholar] [CrossRef]
  46. Ghahramani, A.; Pantelic, J.; Vannucci, M.; Pistore, L.; Liu, S.; Gilligan, B.; Alyasin, S.; Arens, E.; Kampshire, K.; Sternberg, E. Personal CO2 bubble: Context-dependent variations and wearable sensors usability. J. Build. Eng. 2019, 22, 295–304. [Google Scholar] [CrossRef]
  47. Bhattacharya, A.; Pantelic, J.; Ghahramani, A.; Mousavi, E.S. Three-dimensional analysis of the effect of human movement on indoor airflow patterns. Indoor Air 2021, 31, 587–601. [Google Scholar] [CrossRef]
  48. Saeed, U.; Shah, S.Y.; Ahmad, J.; Imran, M.A.; Abbasi, Q.H.; Shah, S.A. Machine learning empowered COVID-19 patient monitoring using non-contact sensing: An extensive review. J. Pharm. Anal. 2022, 12, 193–204. [Google Scholar] [CrossRef]
  49. Ghahramani, A.; Jazizadeh, F.; Becerik-Gerber, B. A knowledge based approach for selecting energy-aware and comfort-driven HVAC temperature set points. Energy Build. 2014, 85, 536–548. [Google Scholar] [CrossRef]
Figure 1. System architecture of the visible light and infrared image fusion.
Buildings 12 01241 g001
Figure 2. Algorithm pseudocode to infer human body comfort and provide setpoint (SP) adjustments. t refers to any given time. N refers to neutral-condition measurements of the human body. Coefficients α, β, and γ are weights that help the HVAC system respond effectively to individual comfort requirements. SP 0 is the steady-state optimal zone setpoint.
Buildings 12 01241 g002
Figure 3. Five phases of the experiment to evaluate responses to cool and warm exposures.
Buildings 12 01241 g003
Figure 4. Climate chambers at UC Berkeley, including (a) Chamber 1 (Neutral environment at 24 °C with setpoint controller), (b) Chamber 2 (cool environment at 18 °C), and (c) Chamber 3 (warm environment at 31 °C).
Buildings 12 01241 g004
Figure 5. Skin temperature indices collected and derived setpoints showing cooling in Phase 3 and heating in Phase 5 for Phases 1, 3, and 5 with HVAC system running.
Buildings 12 01241 g005
Figure 6. Thermostat measurements of room air temperature in Chamber 1 for test subject 2 show a decrease in room air temperature as the subject returns from Chamber 3 (31 °C) and the sensor/controller cools the space, and an increase in room air temperature as the subject returns from Chamber 2 (18 °C) and the sensor/controller heats the space.
Buildings 12 01241 g006
Figure 7. Comfort survey results at every 5-min interval. The last 30 min of Phase 3 (a 60-min interval designed to permit longer physiological recovery from thermal stress) has been removed for consistency.
Buildings 12 01241 g007
Figure 8. Comfort survey votes in recovery phases (Phases 3 and 5) vs. overall thermal preference for subjects.
Buildings 12 01241 g008
Table 1. Precision and recall for upward, lateral head orientations, and downward head orientations in all lighting settings.
Buildings 12 01241 i001 Buildings 12 01241 i002 Buildings 12 01241 i003
Alg.Up to the rightUpUp to the left
PrecisionRecallPrecisionRecallPrecisionRecall
C1. Bulat et al. [38]90.0%95.0%100.0%100.0%95.0%100.0%
C2. InsightFace [39]90.0%100.0%100.0%100.0%100.0%100.0%
C3. FaceNet [40]0.0%30.0%35.0%60.0%70.0%80.0%
Buildings 12 01241 i004 Buildings 12 01241 i005 Buildings 12 01241 i006 Buildings 12 01241 i007 Buildings 12 01241 i008
Alg.Right profileOblique RightFrontOblique LeftLeft Profile
PrecisionRecallPrecisionRecallPrecisionRecallPrecisionRecallPrecisionRecall
C1. Bulat et al. [38]45.0%80.0%80.0%95.0%95.0%95.0%90.0%90.0%85.0%90.0%
C2. InsightFace [39]21.4%92.9%80.0%100.0%90.0%100.0%95.0%100.0%94.7%100.0%
C3. FaceNet [40]0.0%15.0%0.0%30.0%30.0%45.0%65.0%70.0%10.0%10.0%
Buildings 12 01241 i009 Buildings 12 01241 i010 Buildings 12 01241 i011
Alg.Down to the rightDownDown to the left
PrecisionRecallPrecisionRecallPrecisionRecall
C1. Bulat et al. [38]10.0%65.0%15.0%35.0%45.0%70.0%
C2. InsightFace [39]5.9%35.3%0.0%58.3%41.7%91.7%
C3. FaceNet [40]0.0%0.0%0.0%0.0%5.0%10.0%
Table 2. Average precision and recall under different lighting settings for the three candidates.
Alg.Light-On (450 lux)Light-Off (70 lux)
PrecisionRecallPrecisionRecall
C1. Bulat et al. [38]66.4%81.8%59.1%78.2%
C2. InsightFace [39]73.6%84.6%62.7%81.8%
C3. FaceNet [40]21.8%36.4%17.3%27.3%
Table 3. Average computation time to process an image for the three candidates in all lighting settings.
Alg.Computation Time (s)
C1. Bulat et al. [38]2.32
C2. InsightFace [39]4.29
C3. FaceNet [40]0.22
Table 4. Cooling and heating verification results for warm and cool exposure using personalized and generalized methods.
SubjectGenderSystem Response after Warm ExposureSystem Response after Cool Exposure
Personalized ModelGeneralized ModelPersonalized ModelGeneralized Model
1MCoolingCoolingHeatingHeating
2FCoolingNoneHeatingHeating
3MCoolingNoneHeatingHeating
4MCoolingHeatingHeatingHeating
5FHeatingHeating
6FCoolingHeatingHeatingHeating
7MCoolingCoolingHeatingHeating
8MCoolingCoolingHeatingHeating
9MCoolingCoolingCoolingCooling
10MCoolingCoolingHeatingCooling
11MNoneCoolingHeatingHeating
12MCoolingNoneHeatingNone
Publisher’s Note: MDPI stays neutral with regard to jurisdictional claims in published maps and institutional affiliations.

