
Improvement Strategies for Microclimate and Thermal Comfort for Urban Squares: A Case of a Cold Climate Area in China


Abstract
:
1. Introduction
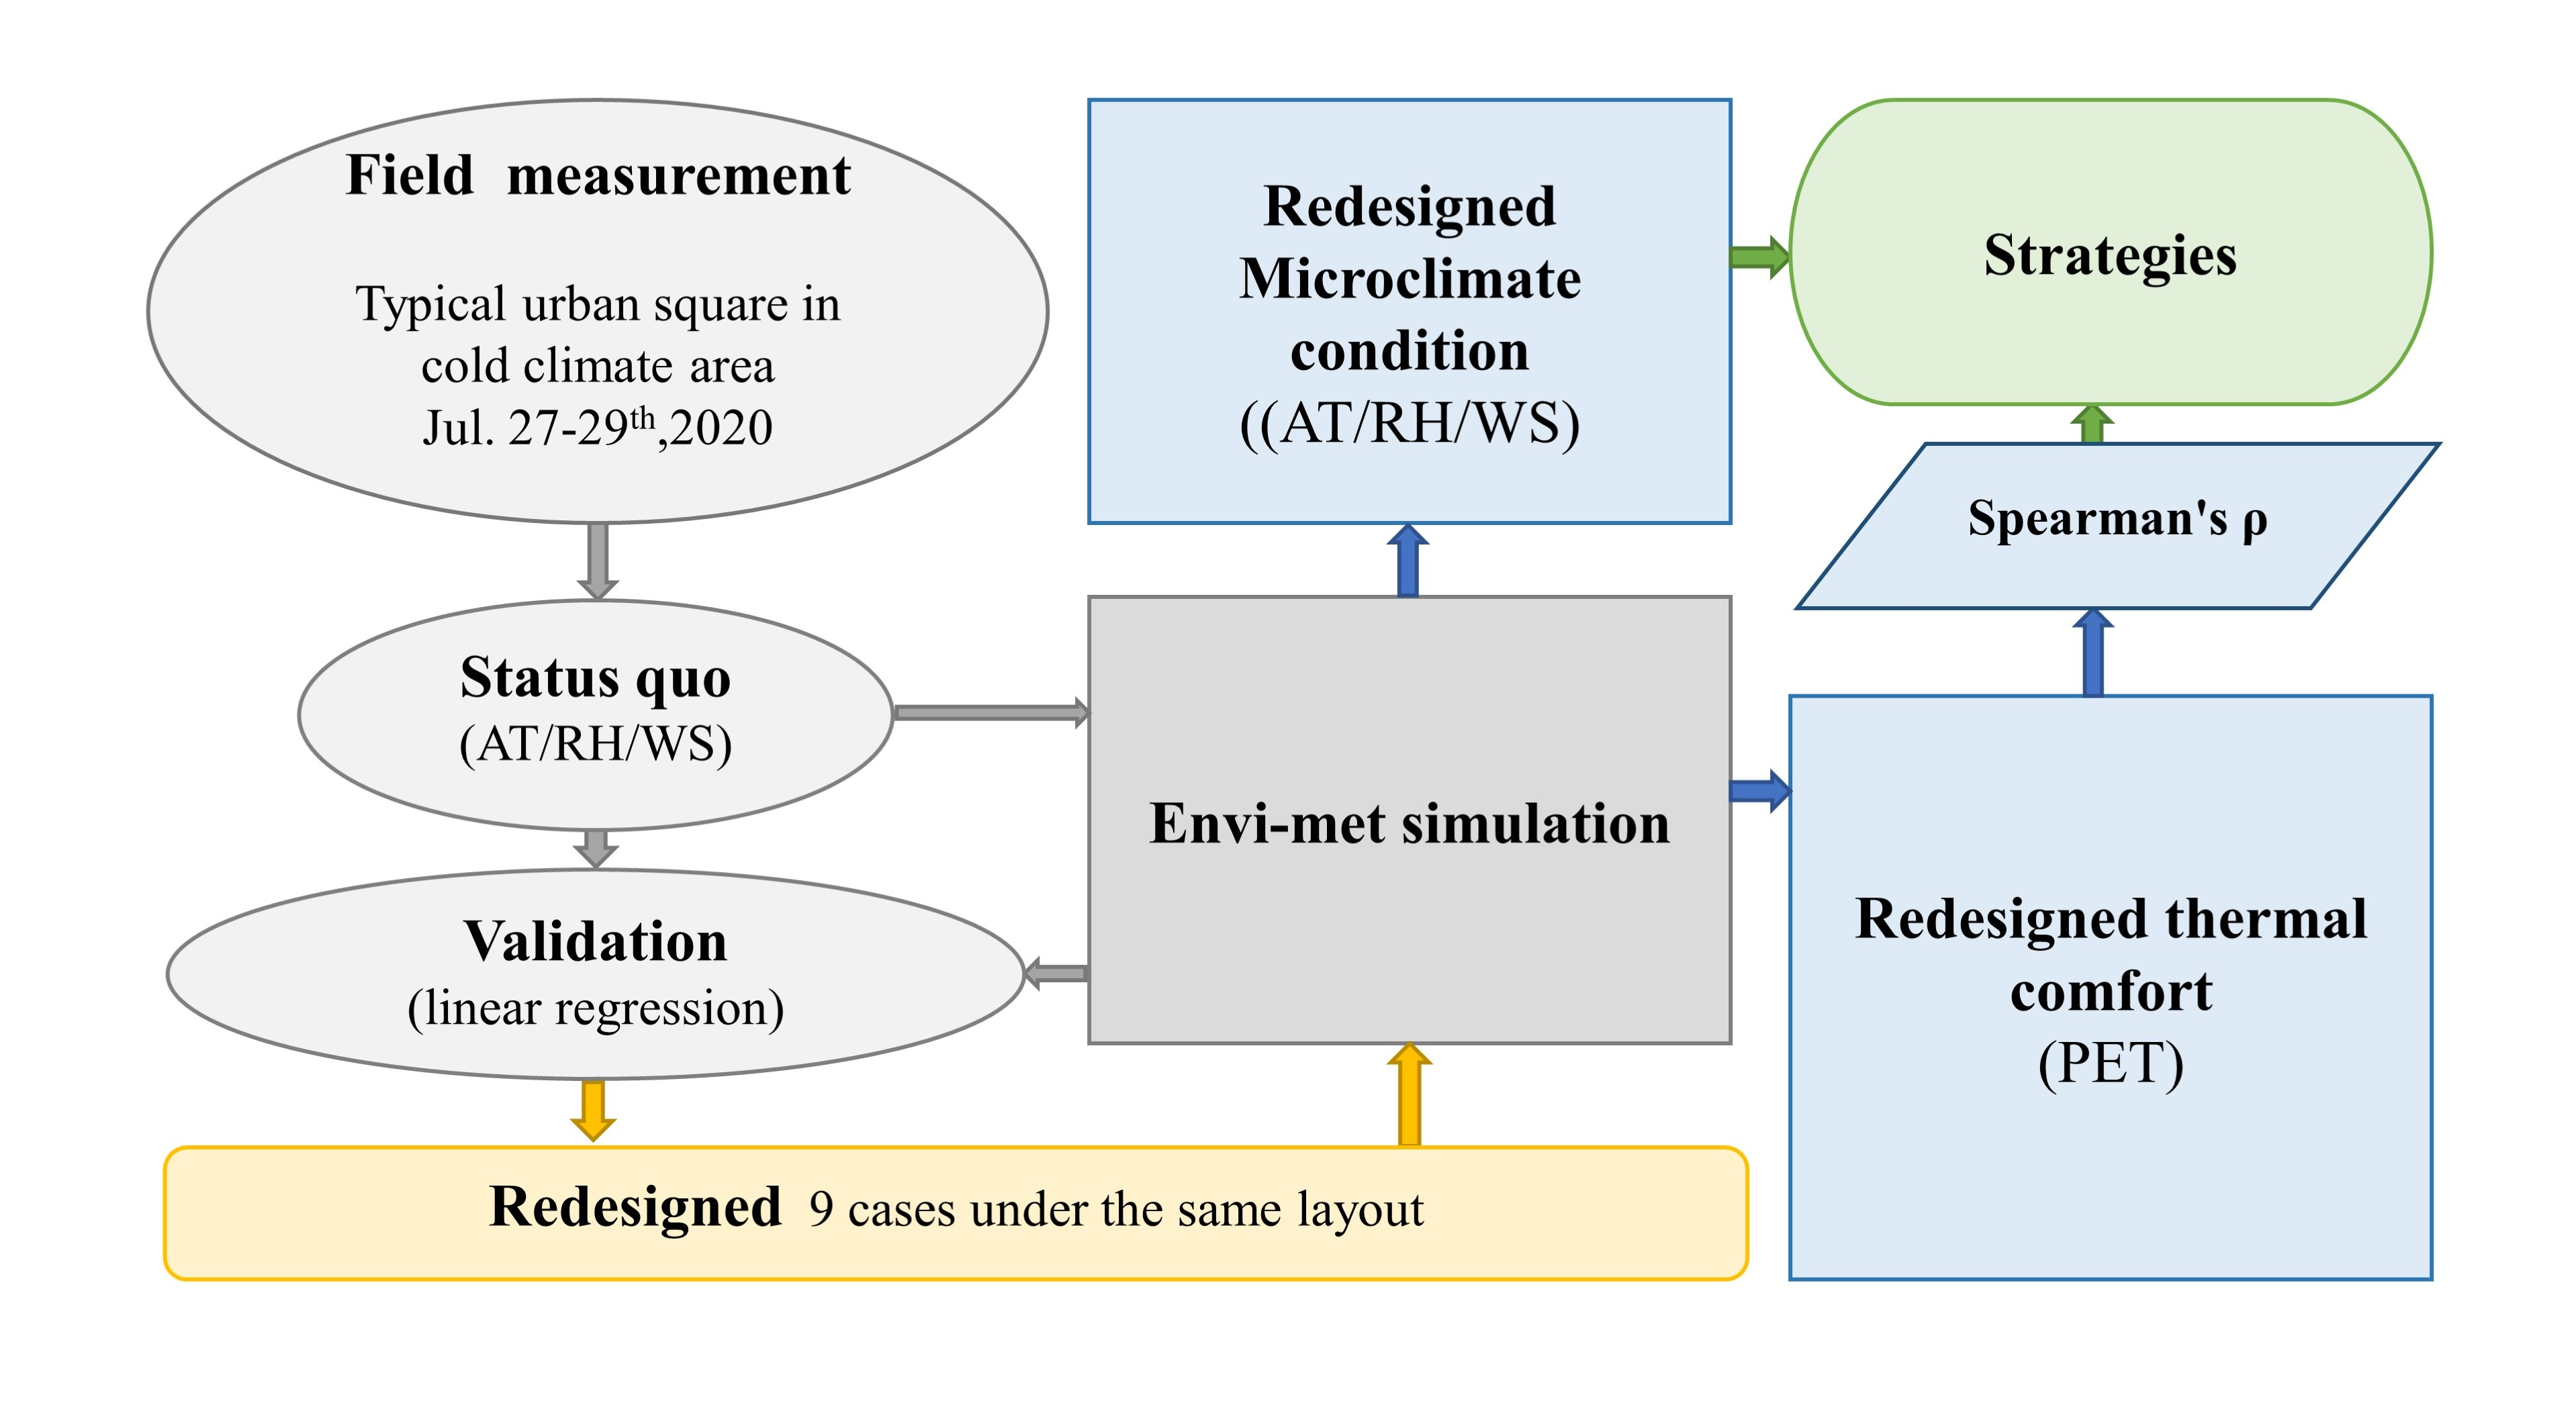
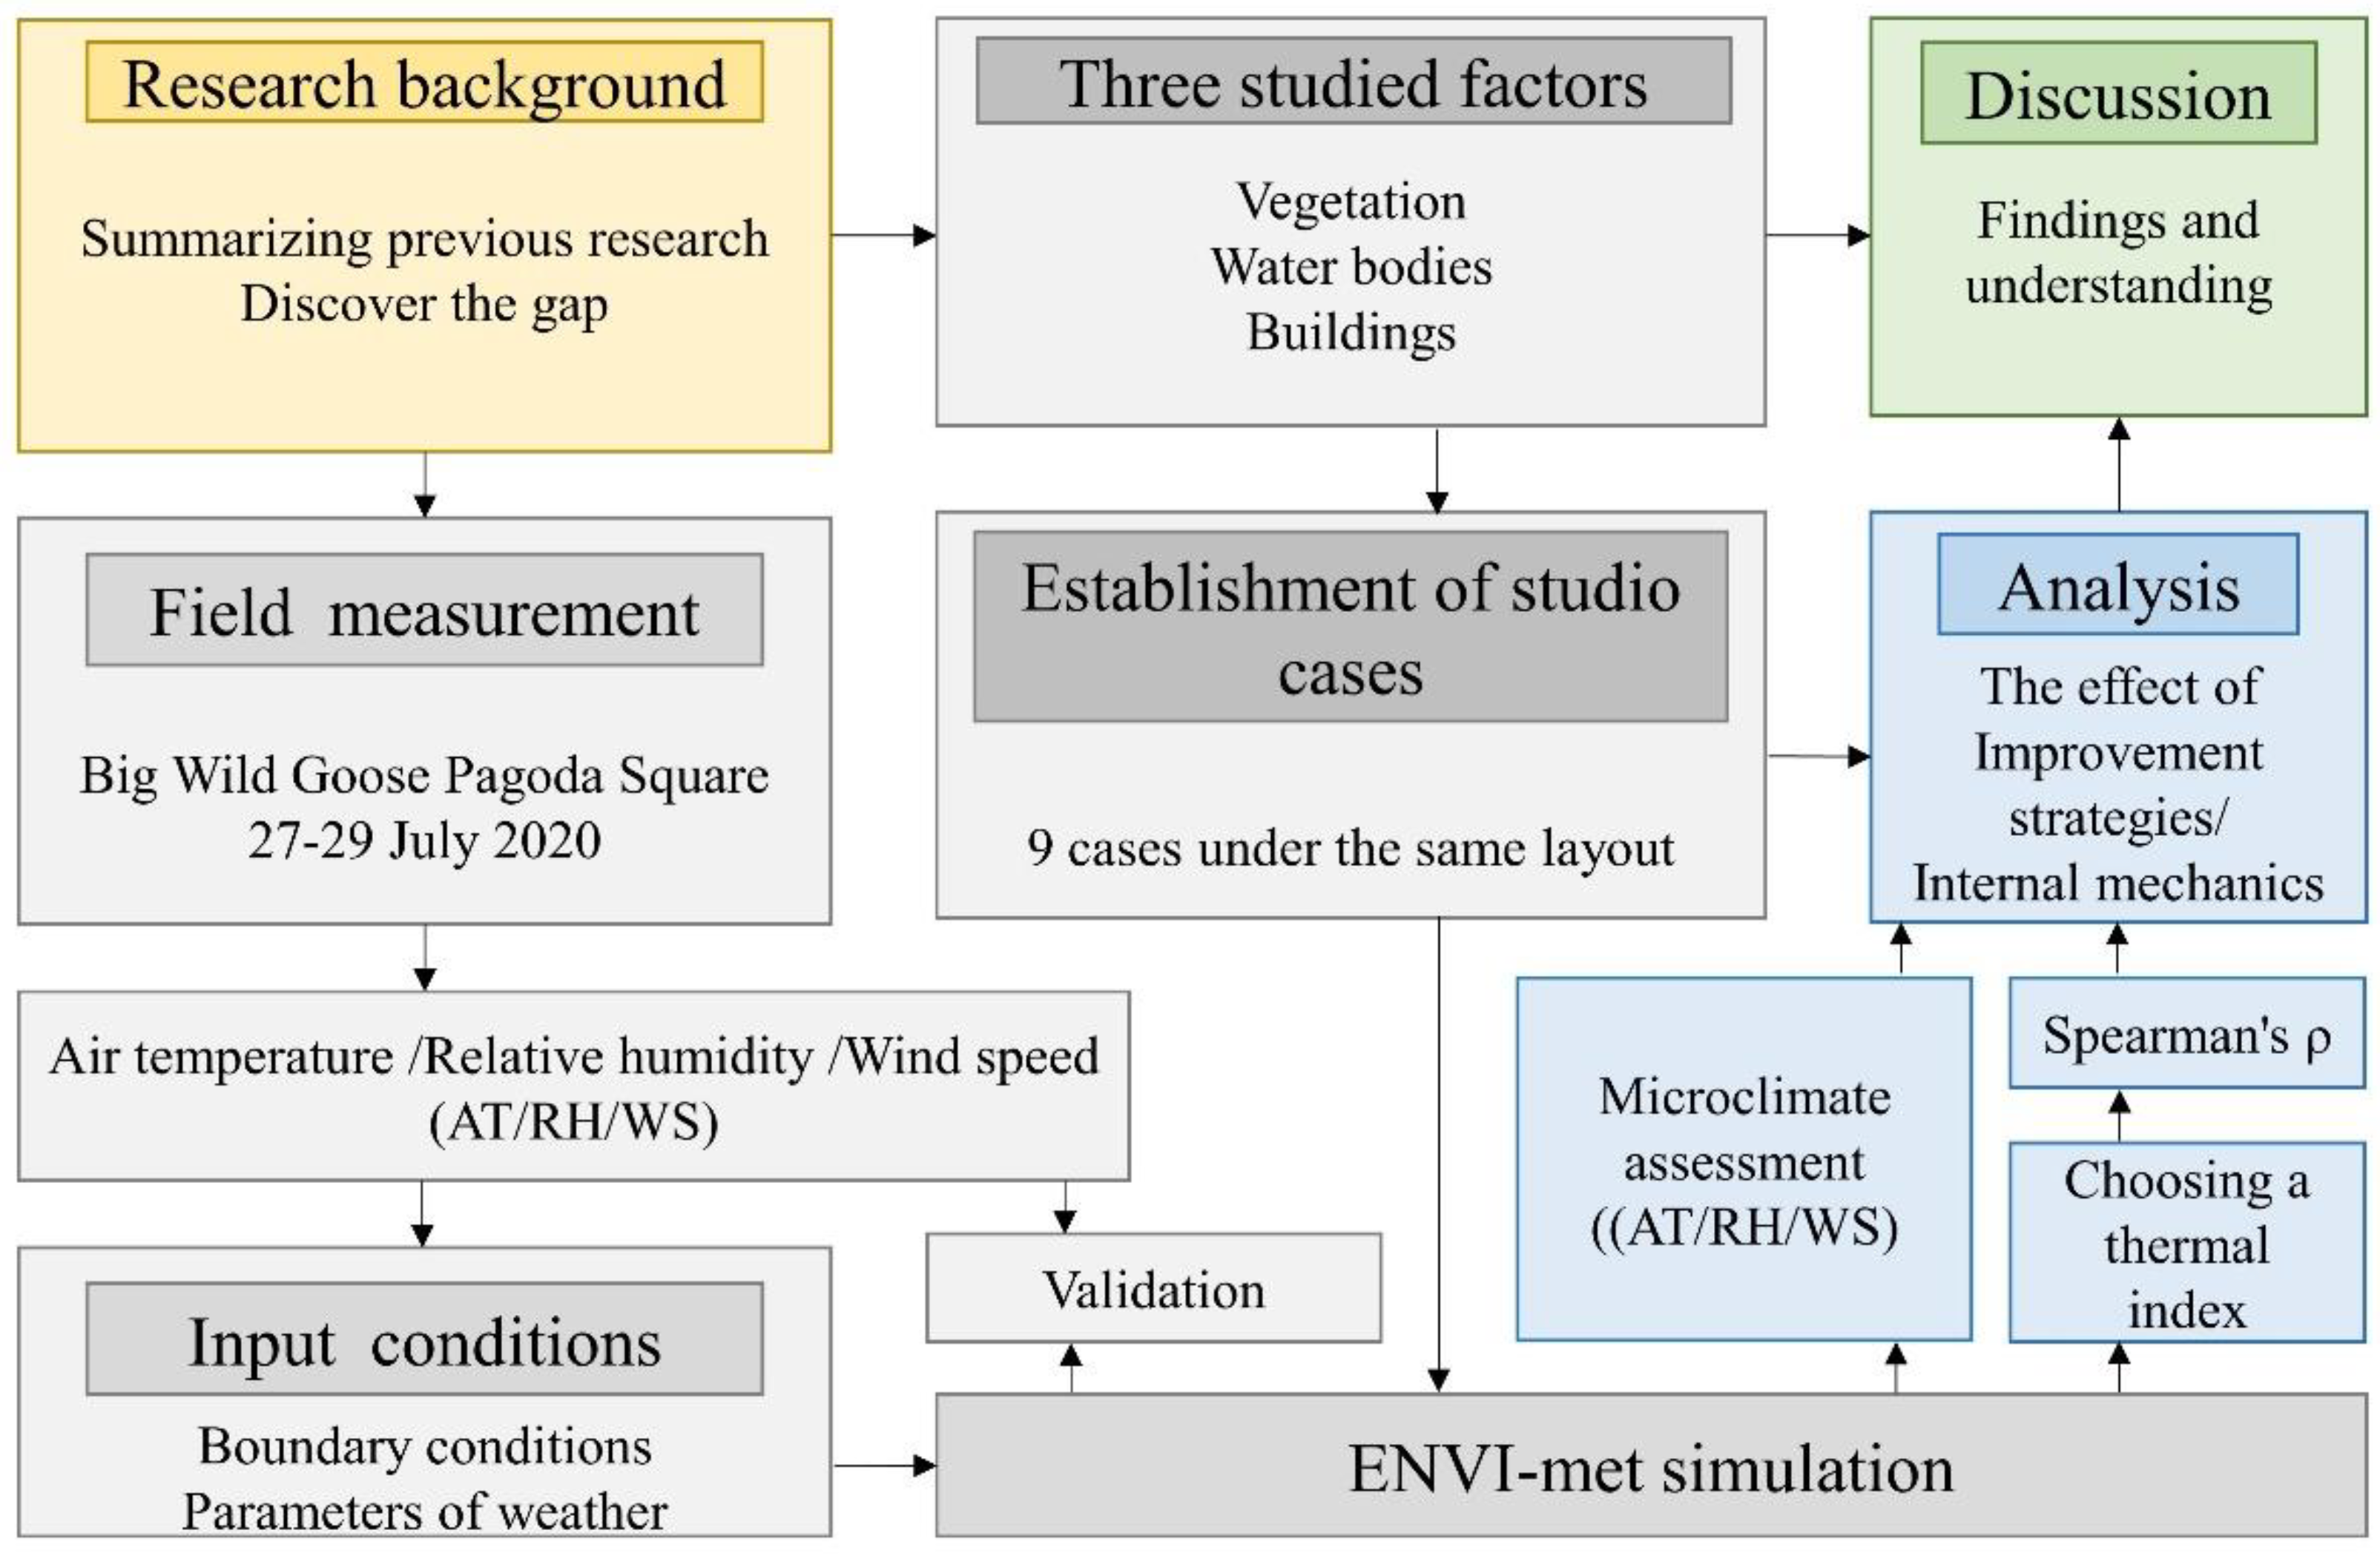
2. Materials and Methods
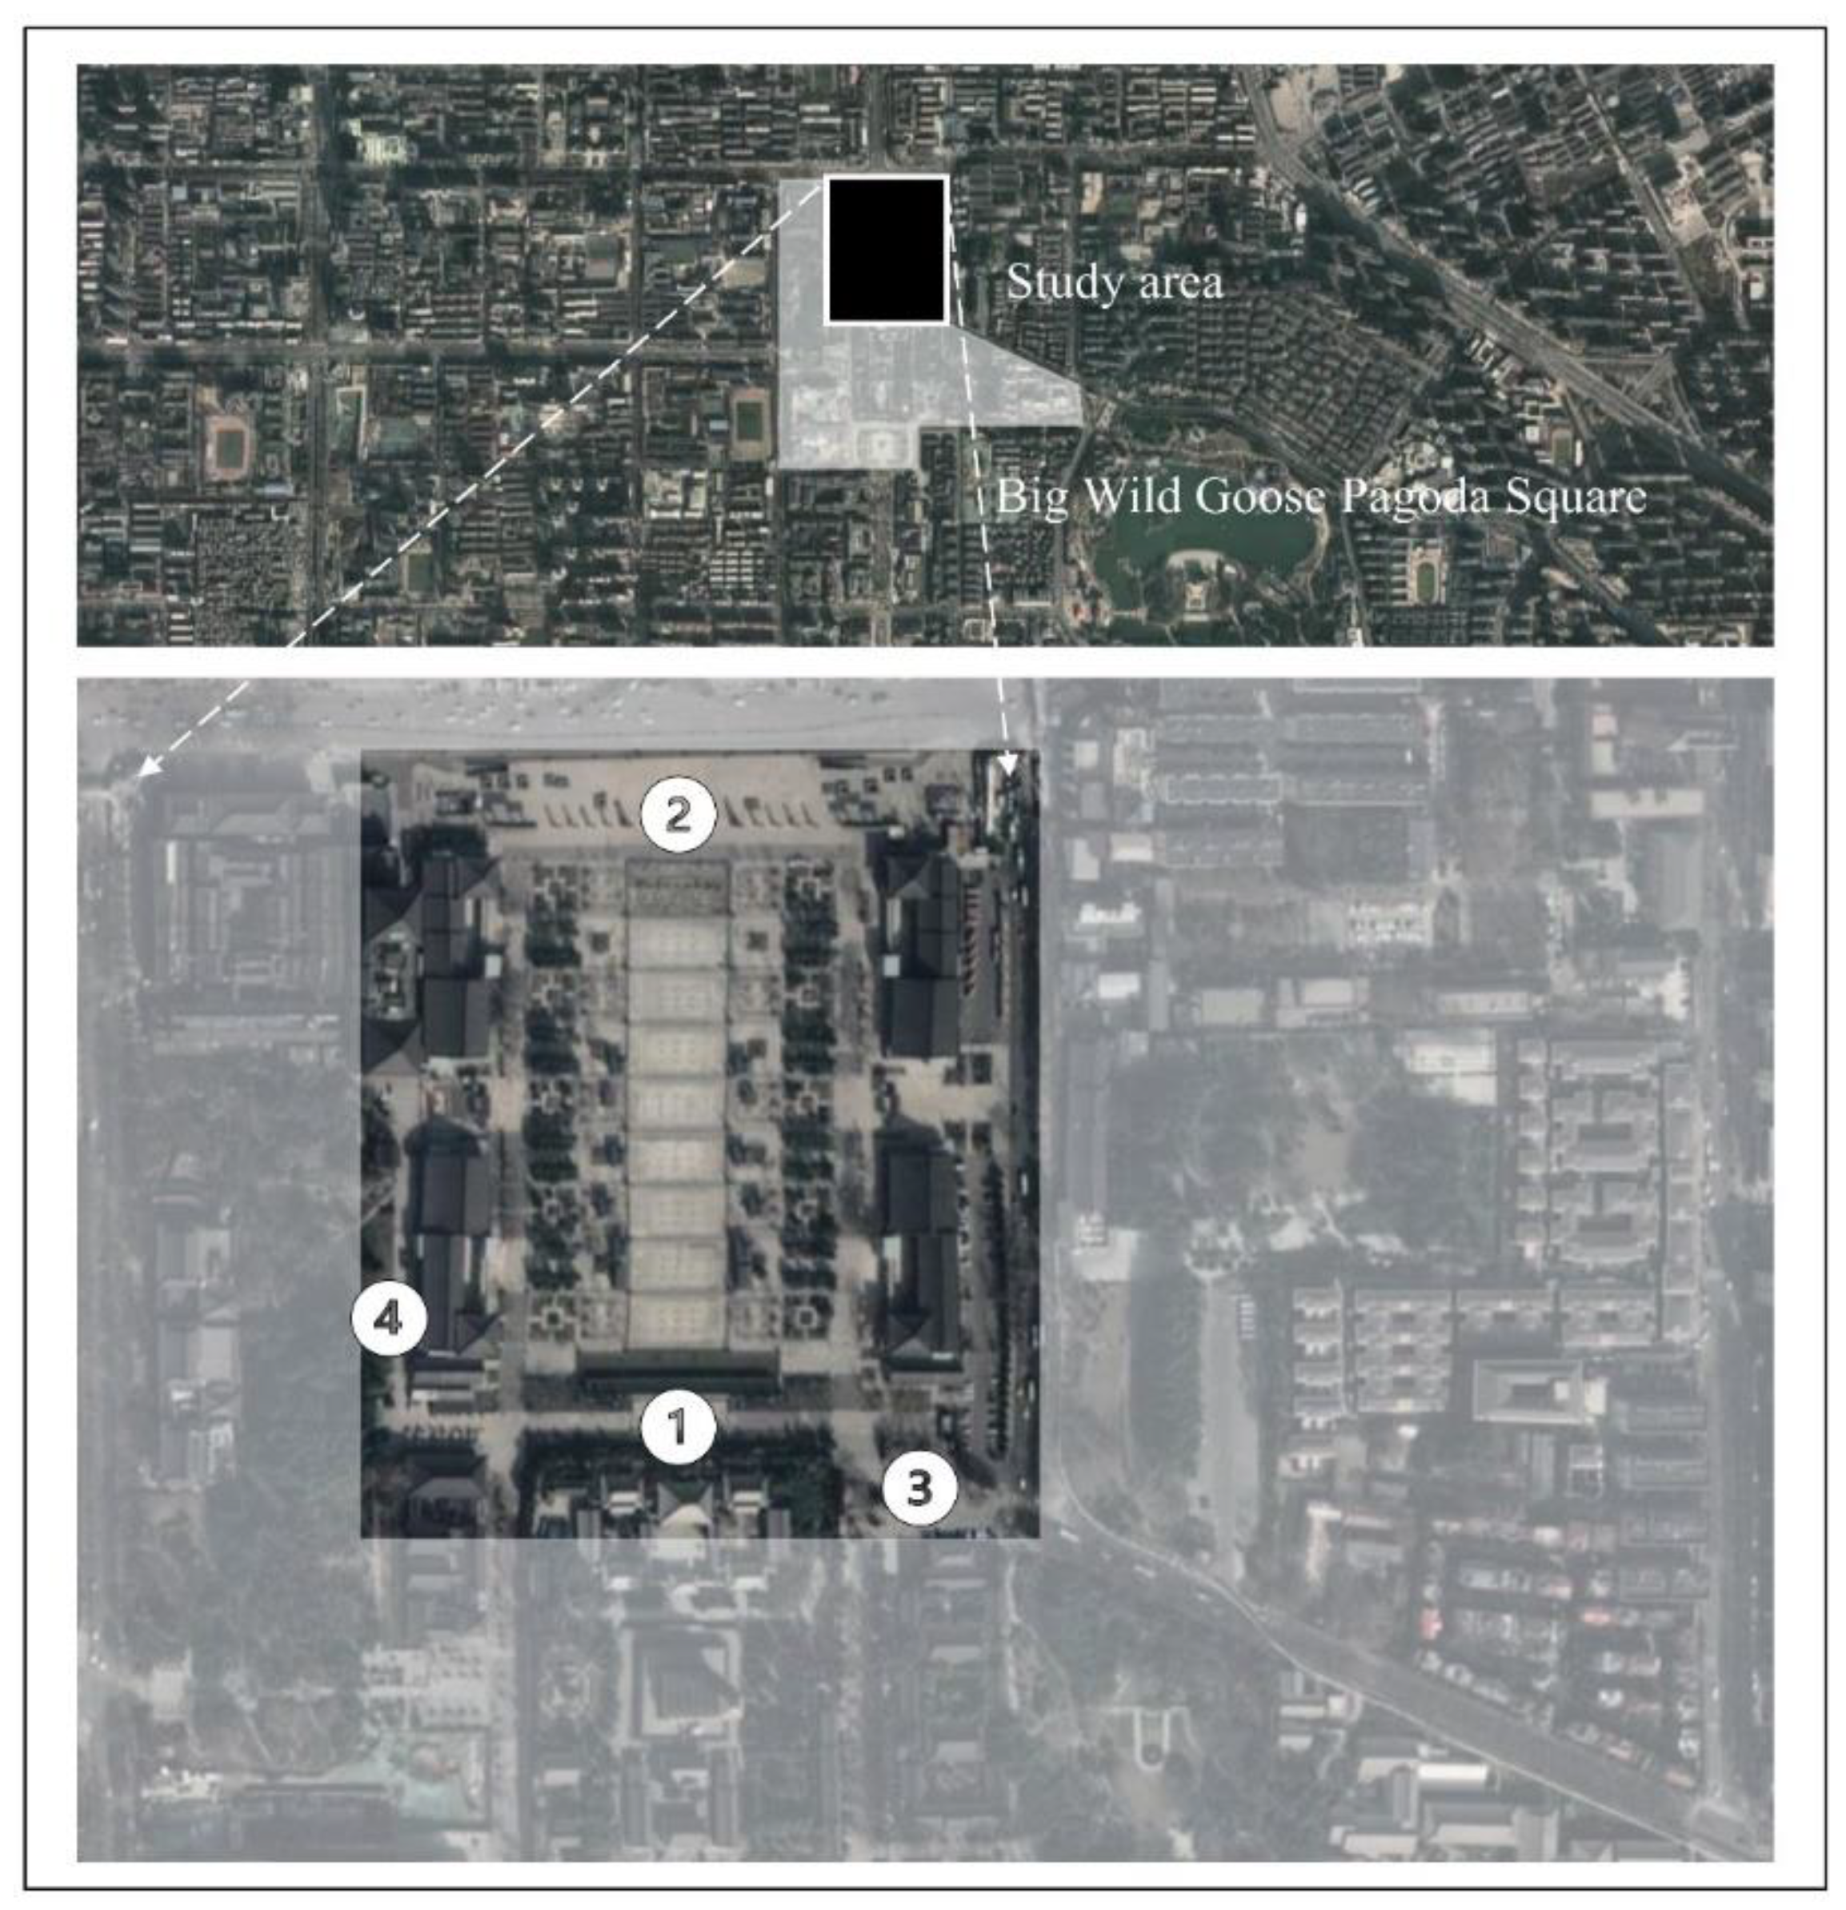
2.1. Research Area
2.2. Model Setup
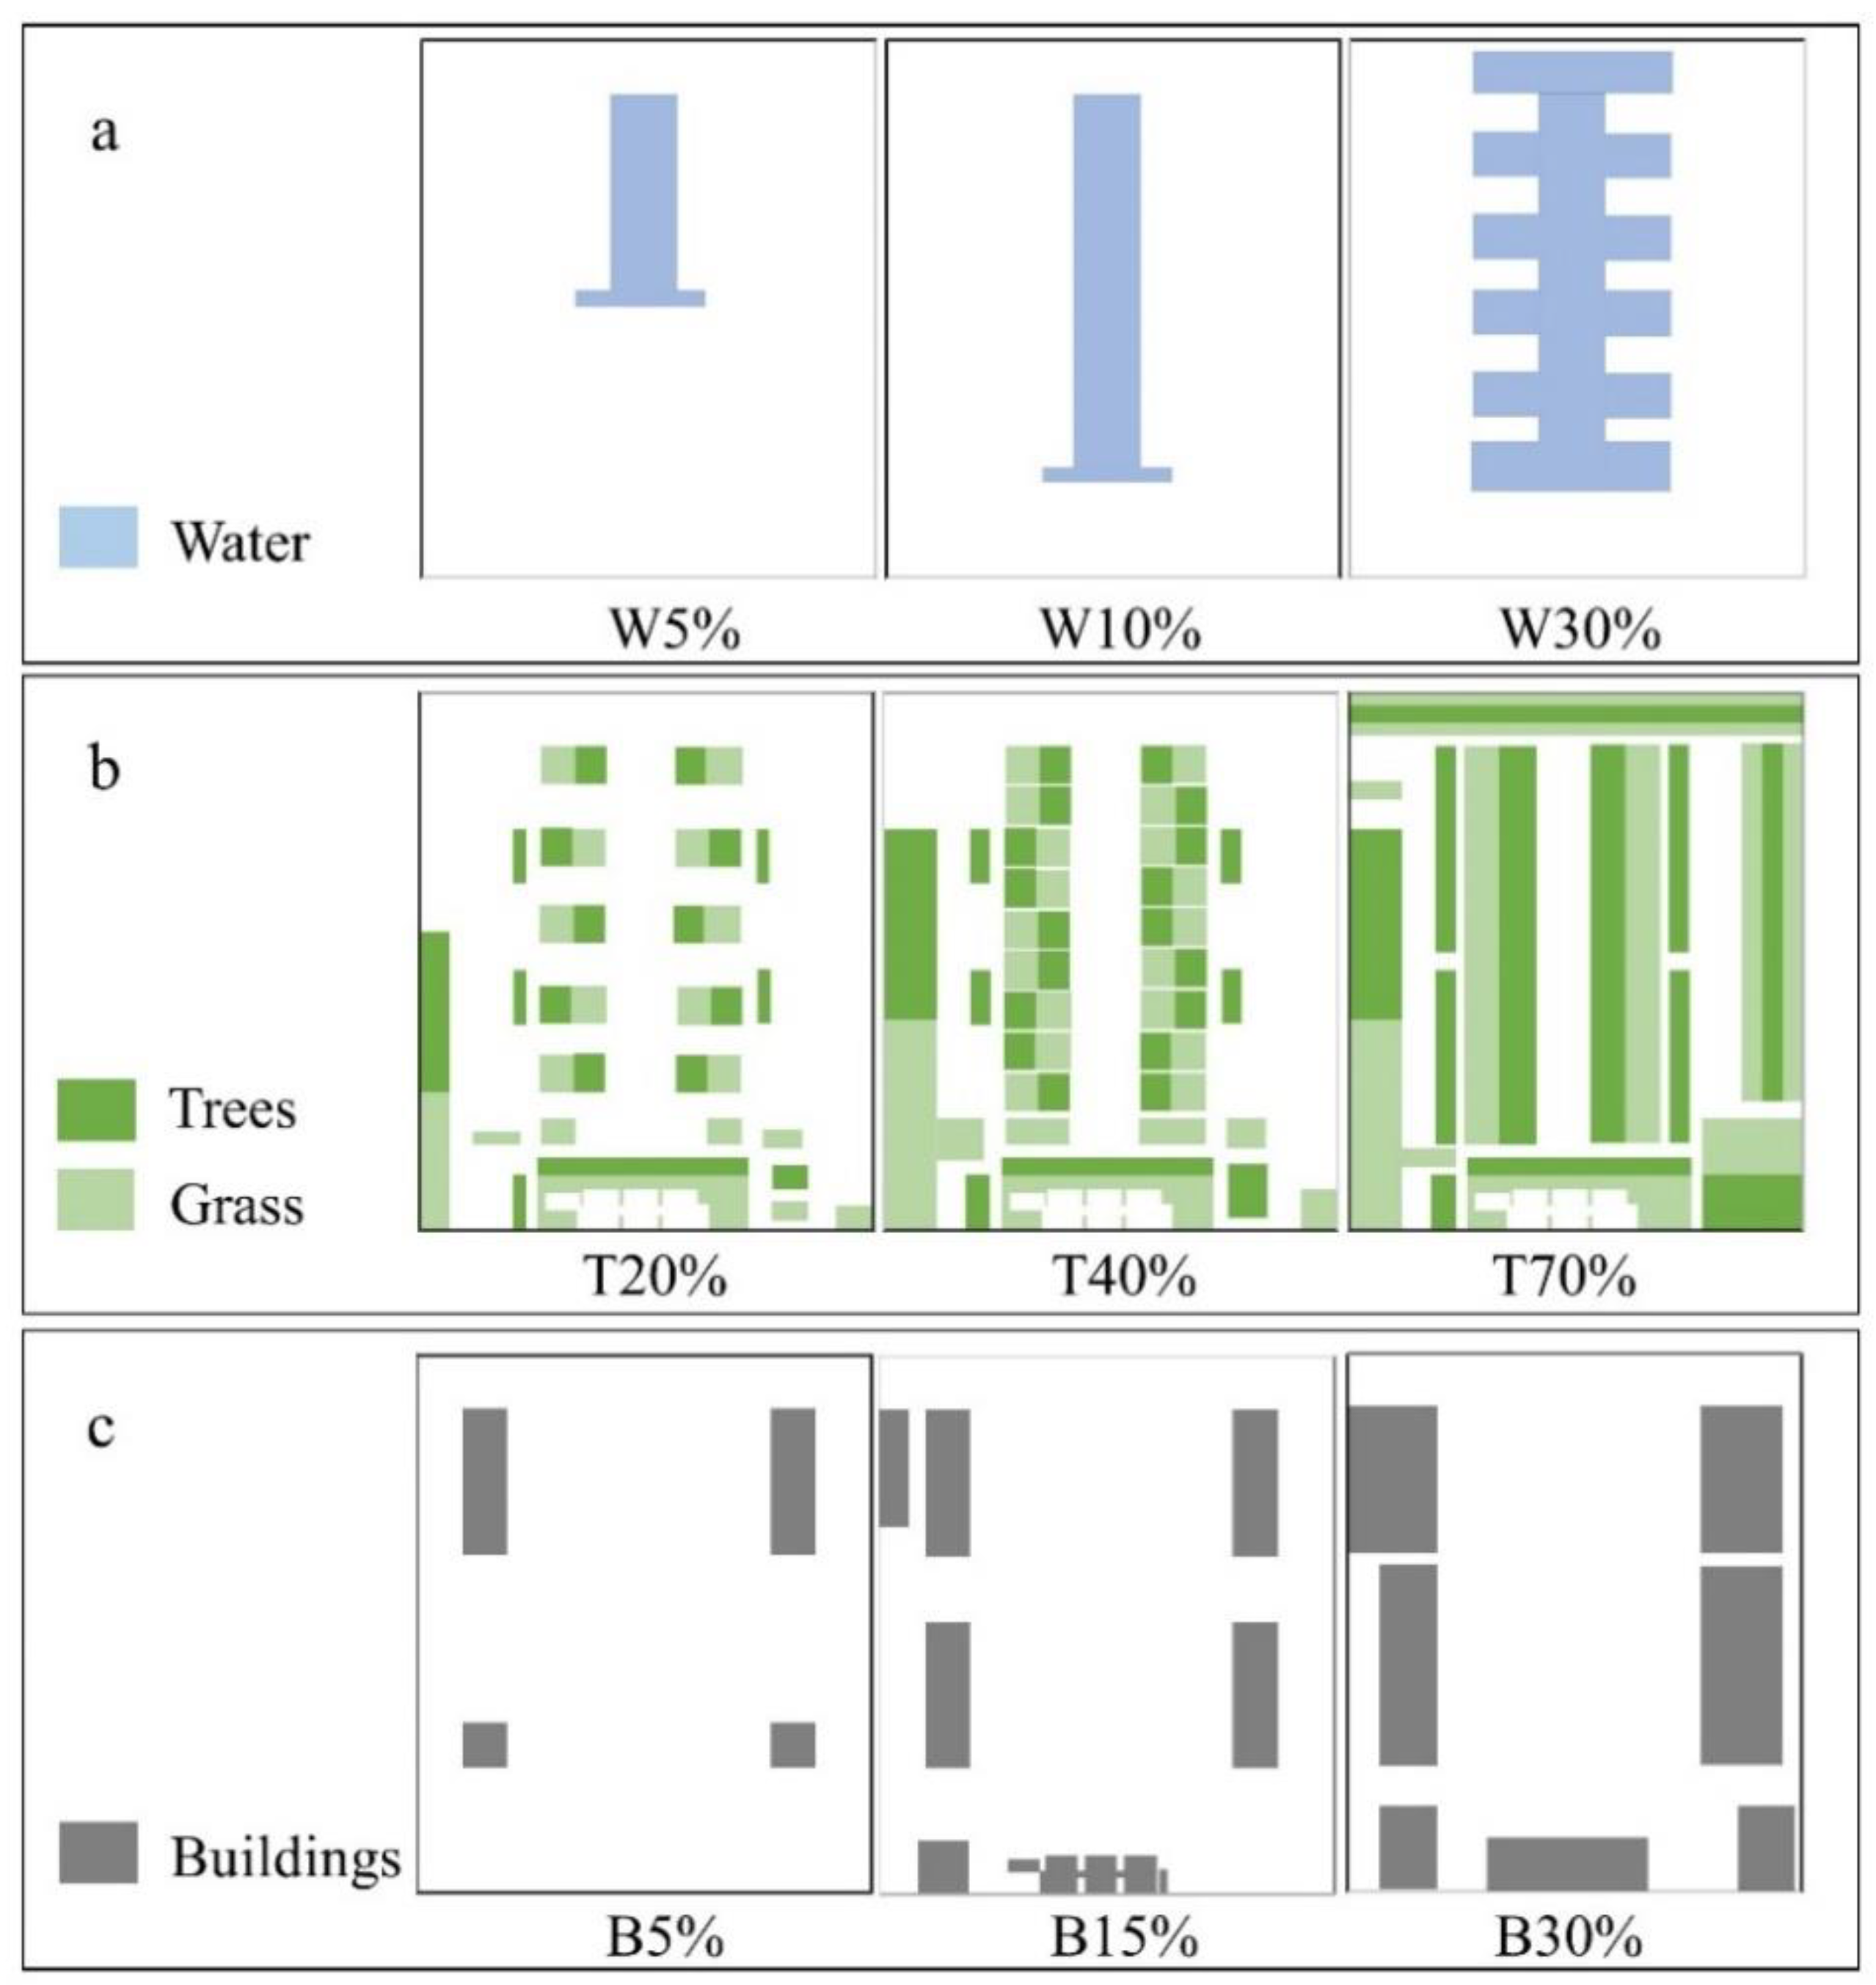
2.3. Redesign Model
2.4. Thermal Comfort Index
3. Results and Analysis
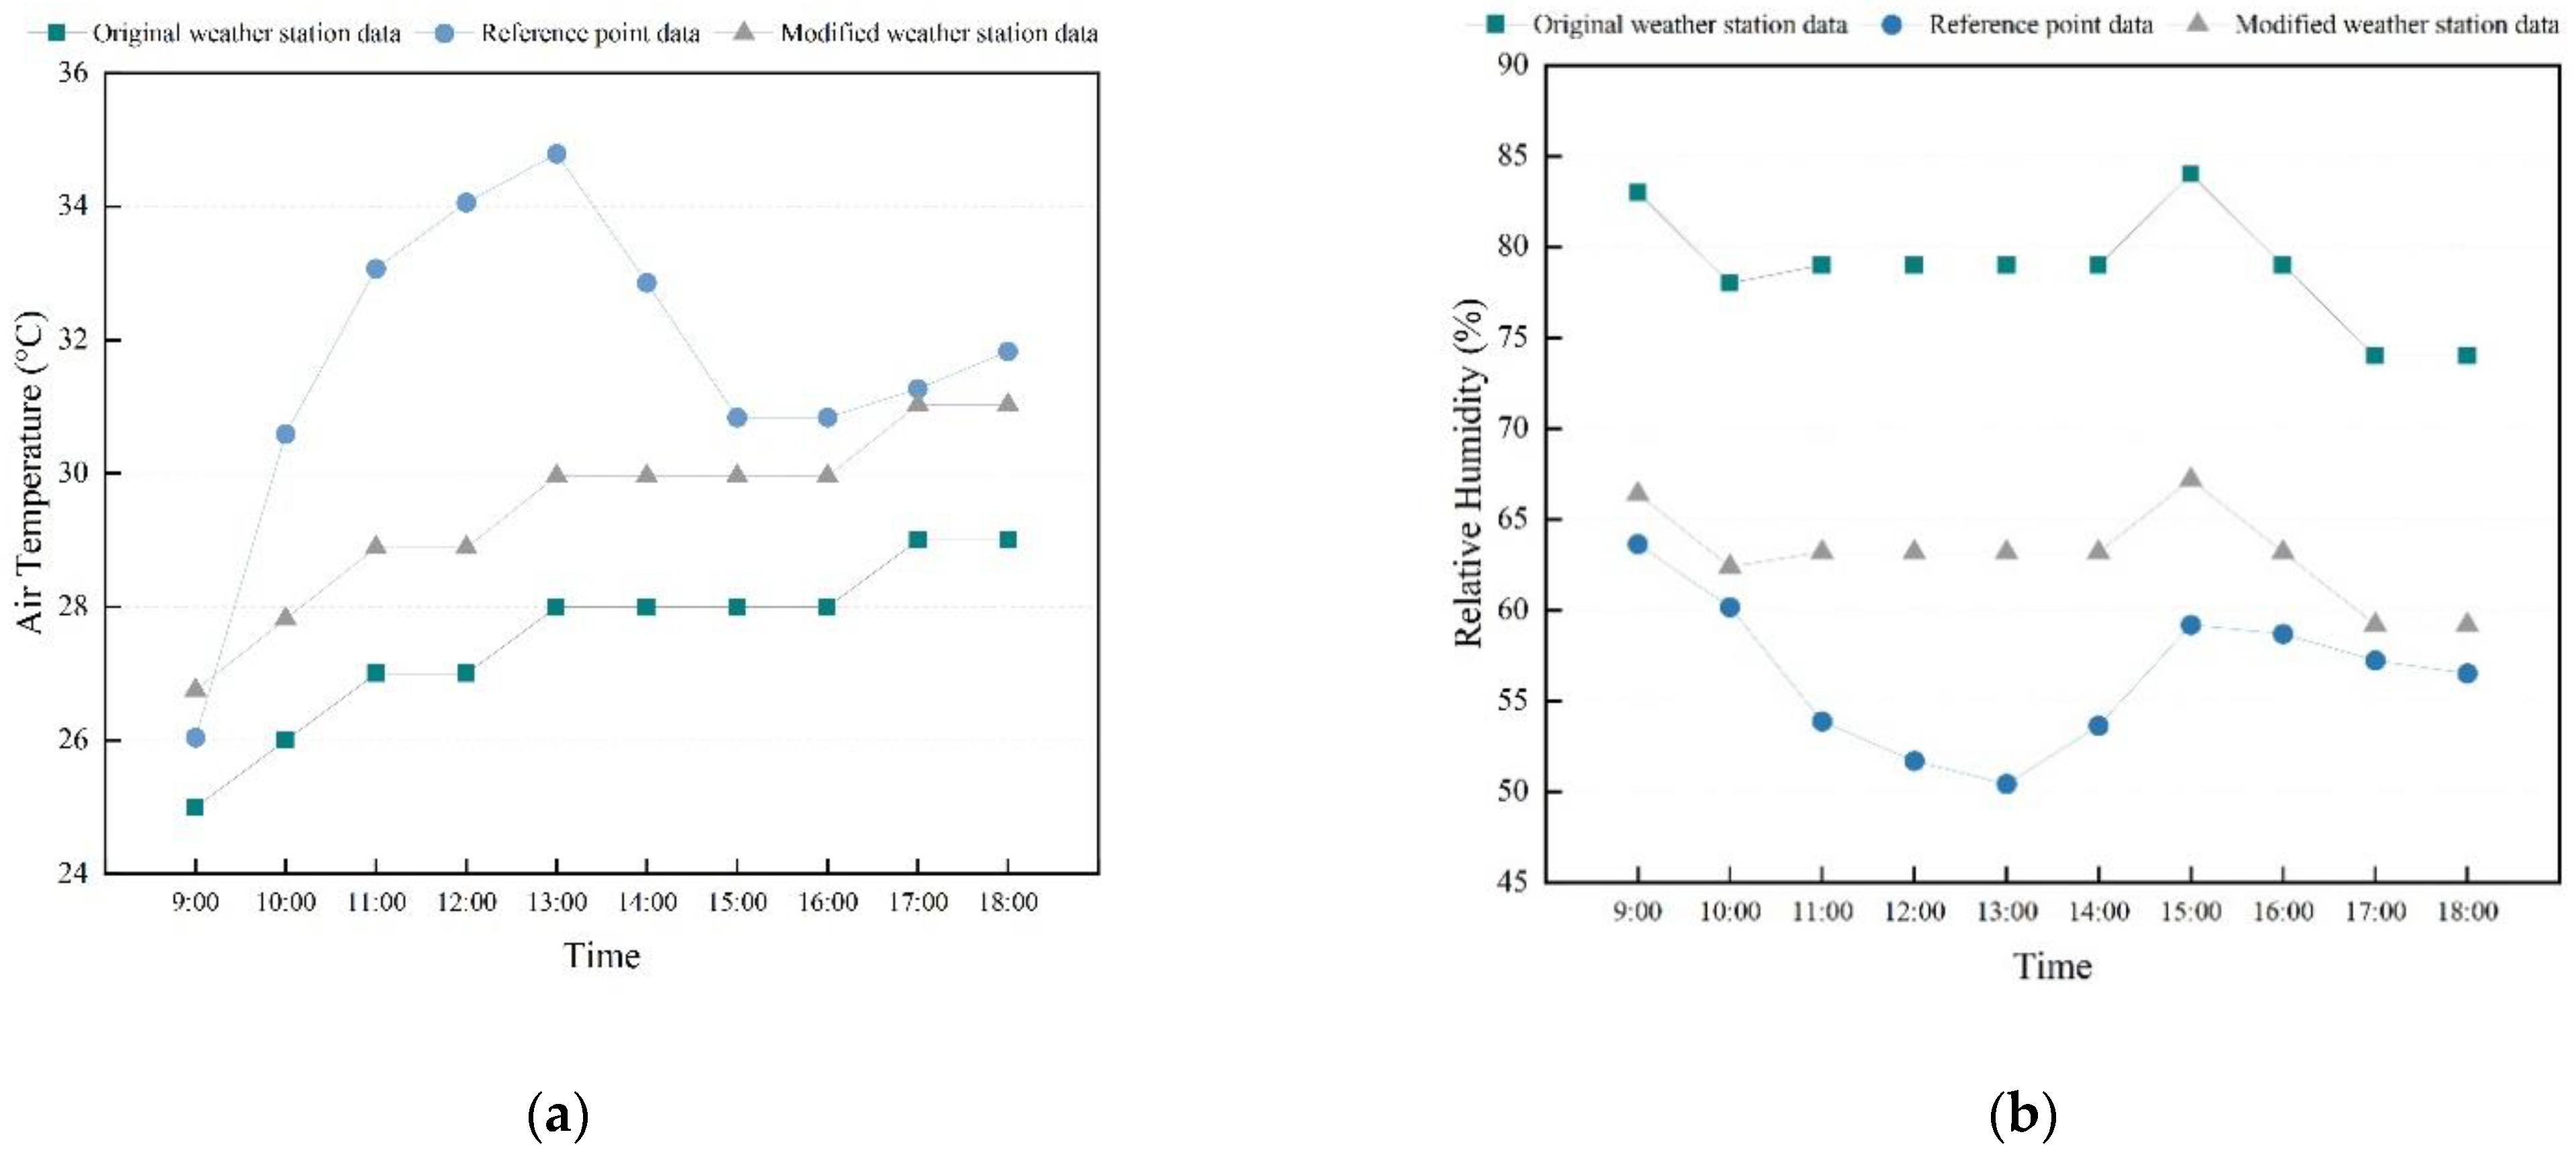
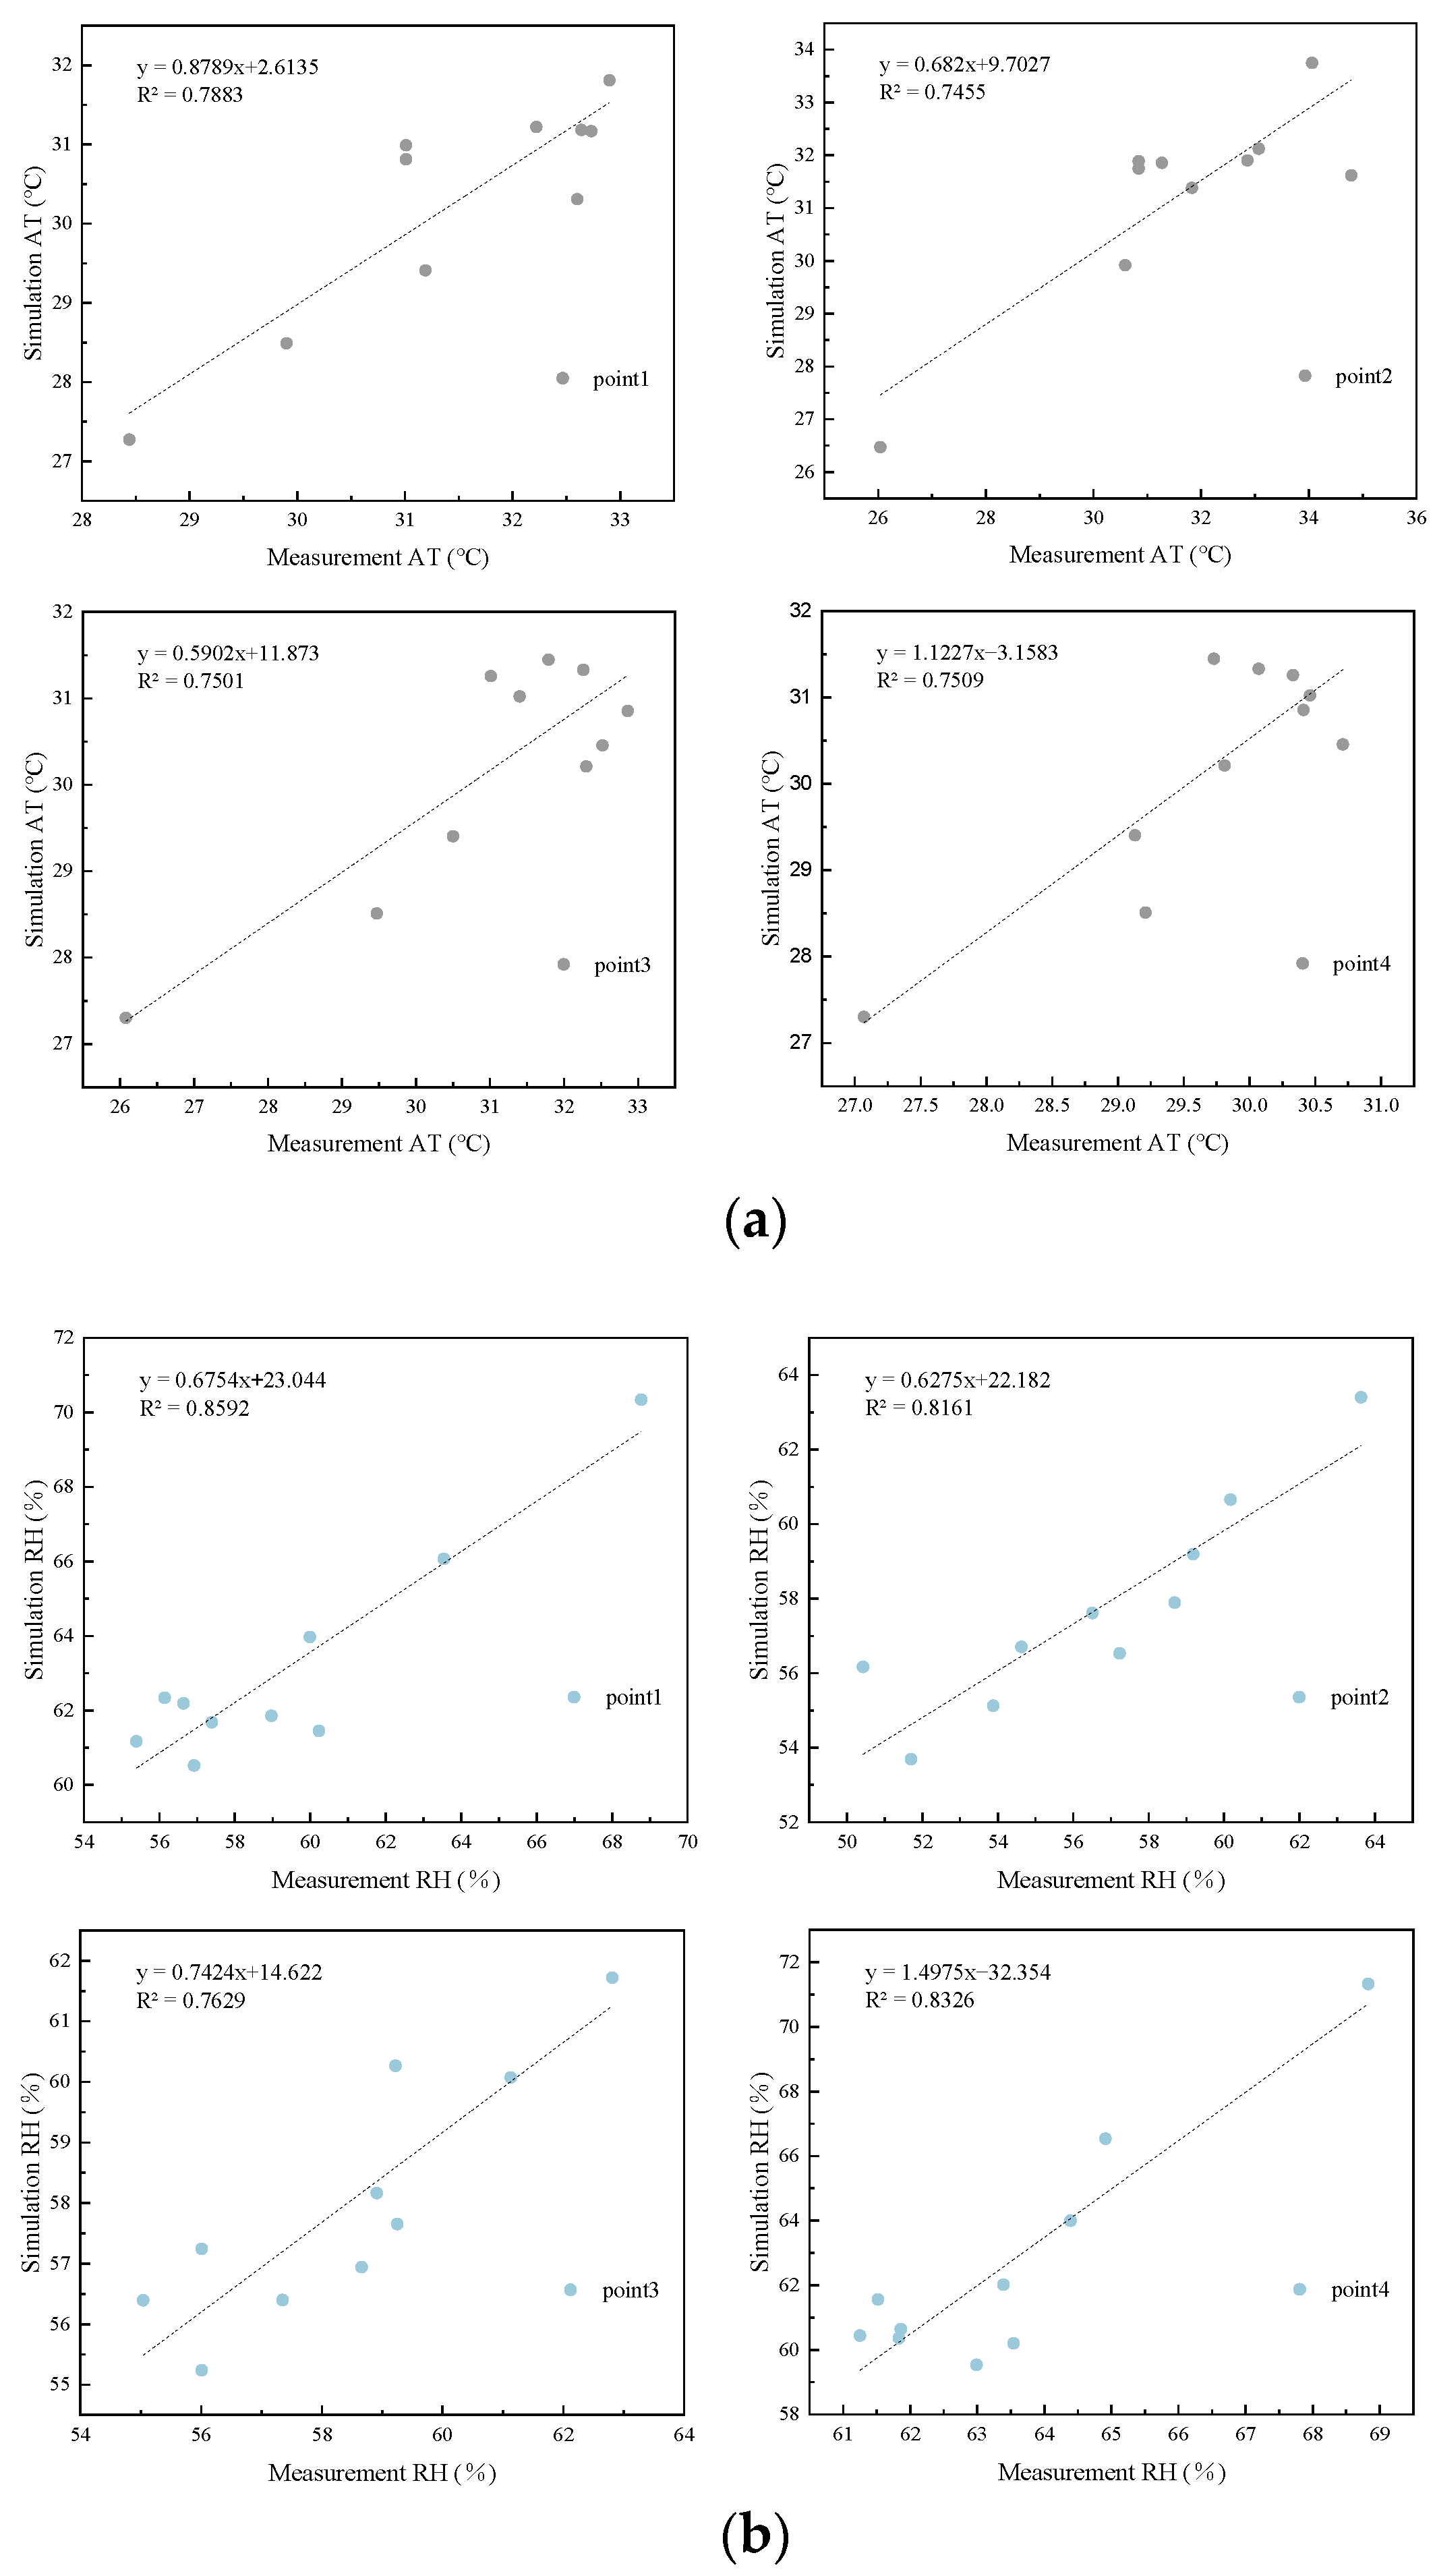
3.1. Simulation Data Validation
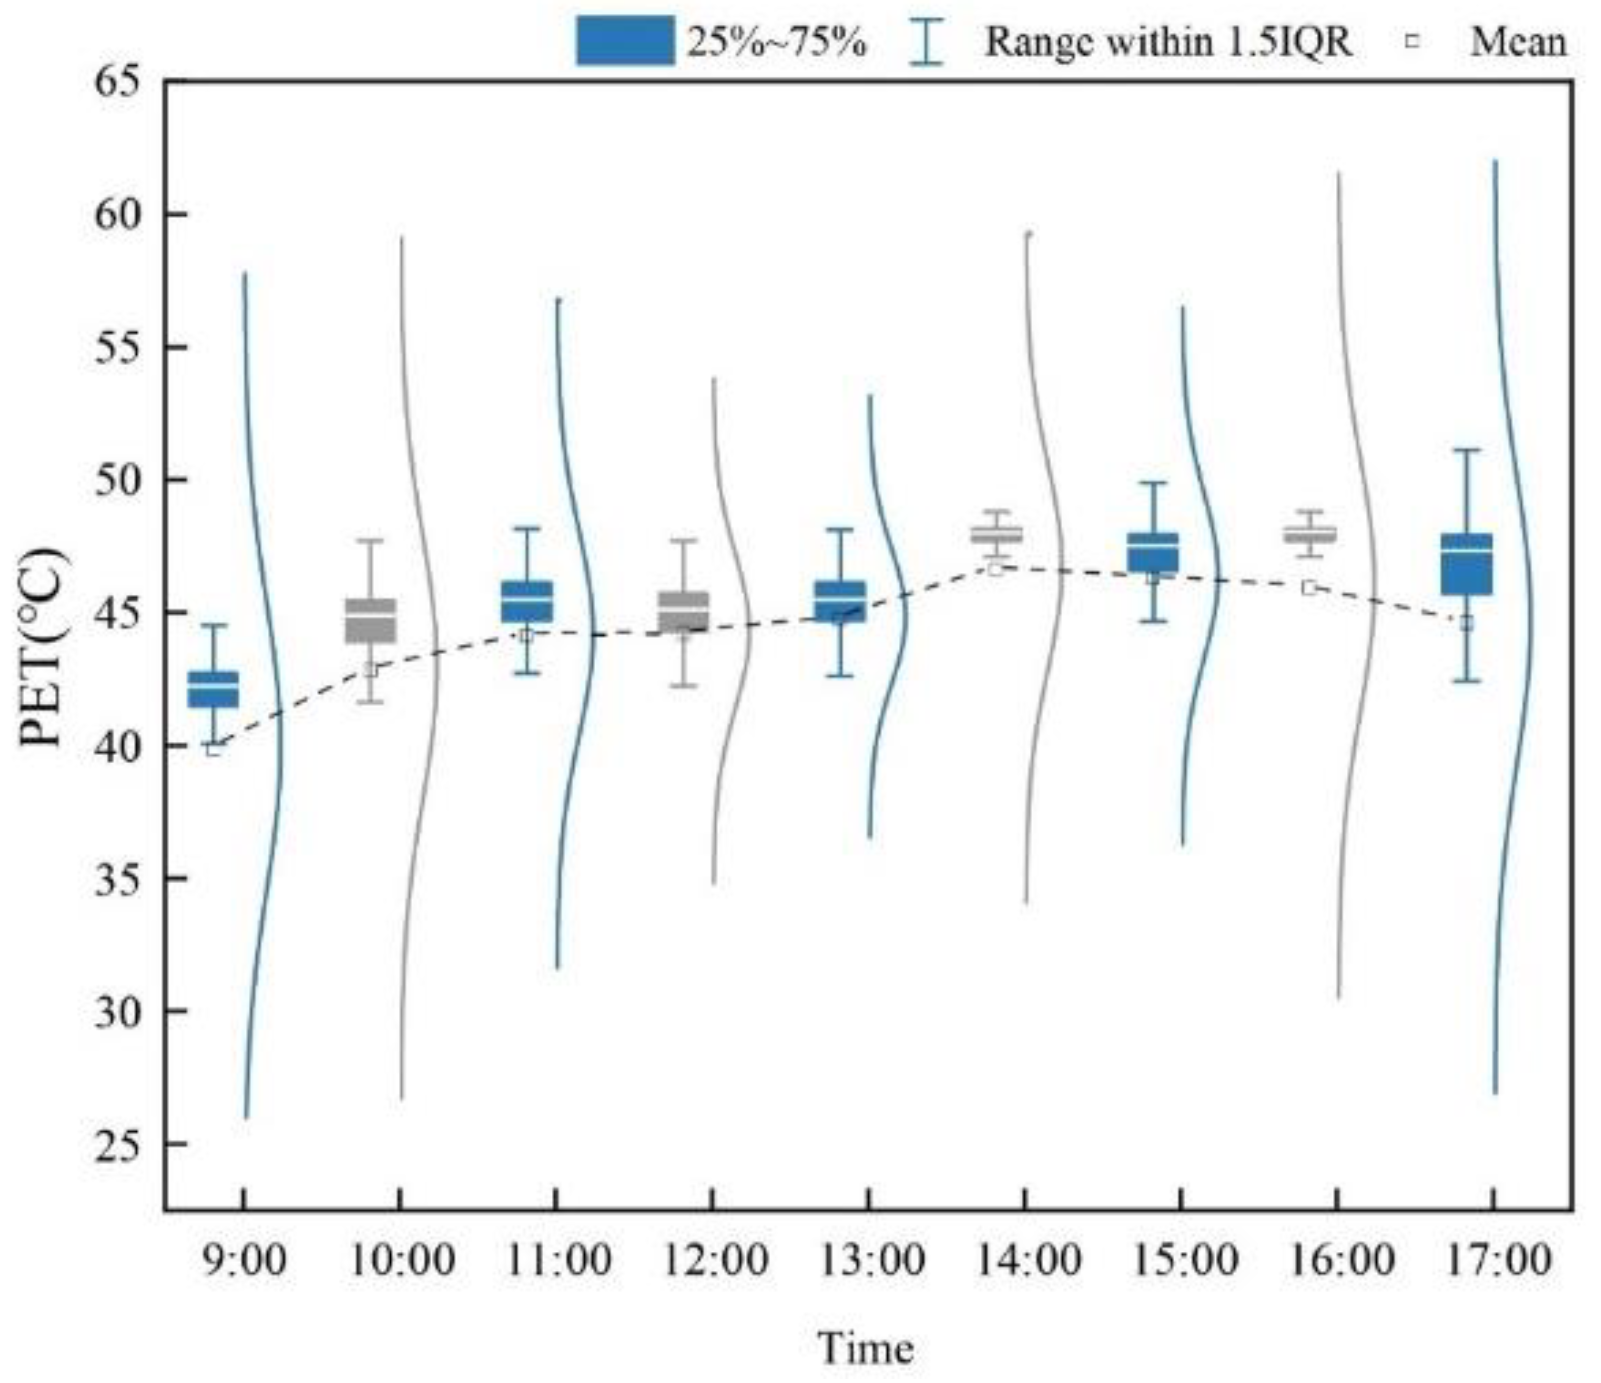
3.2. PET Distribution in the Status Quo
3.3. Microclimate Conditions of Redesigned Cases
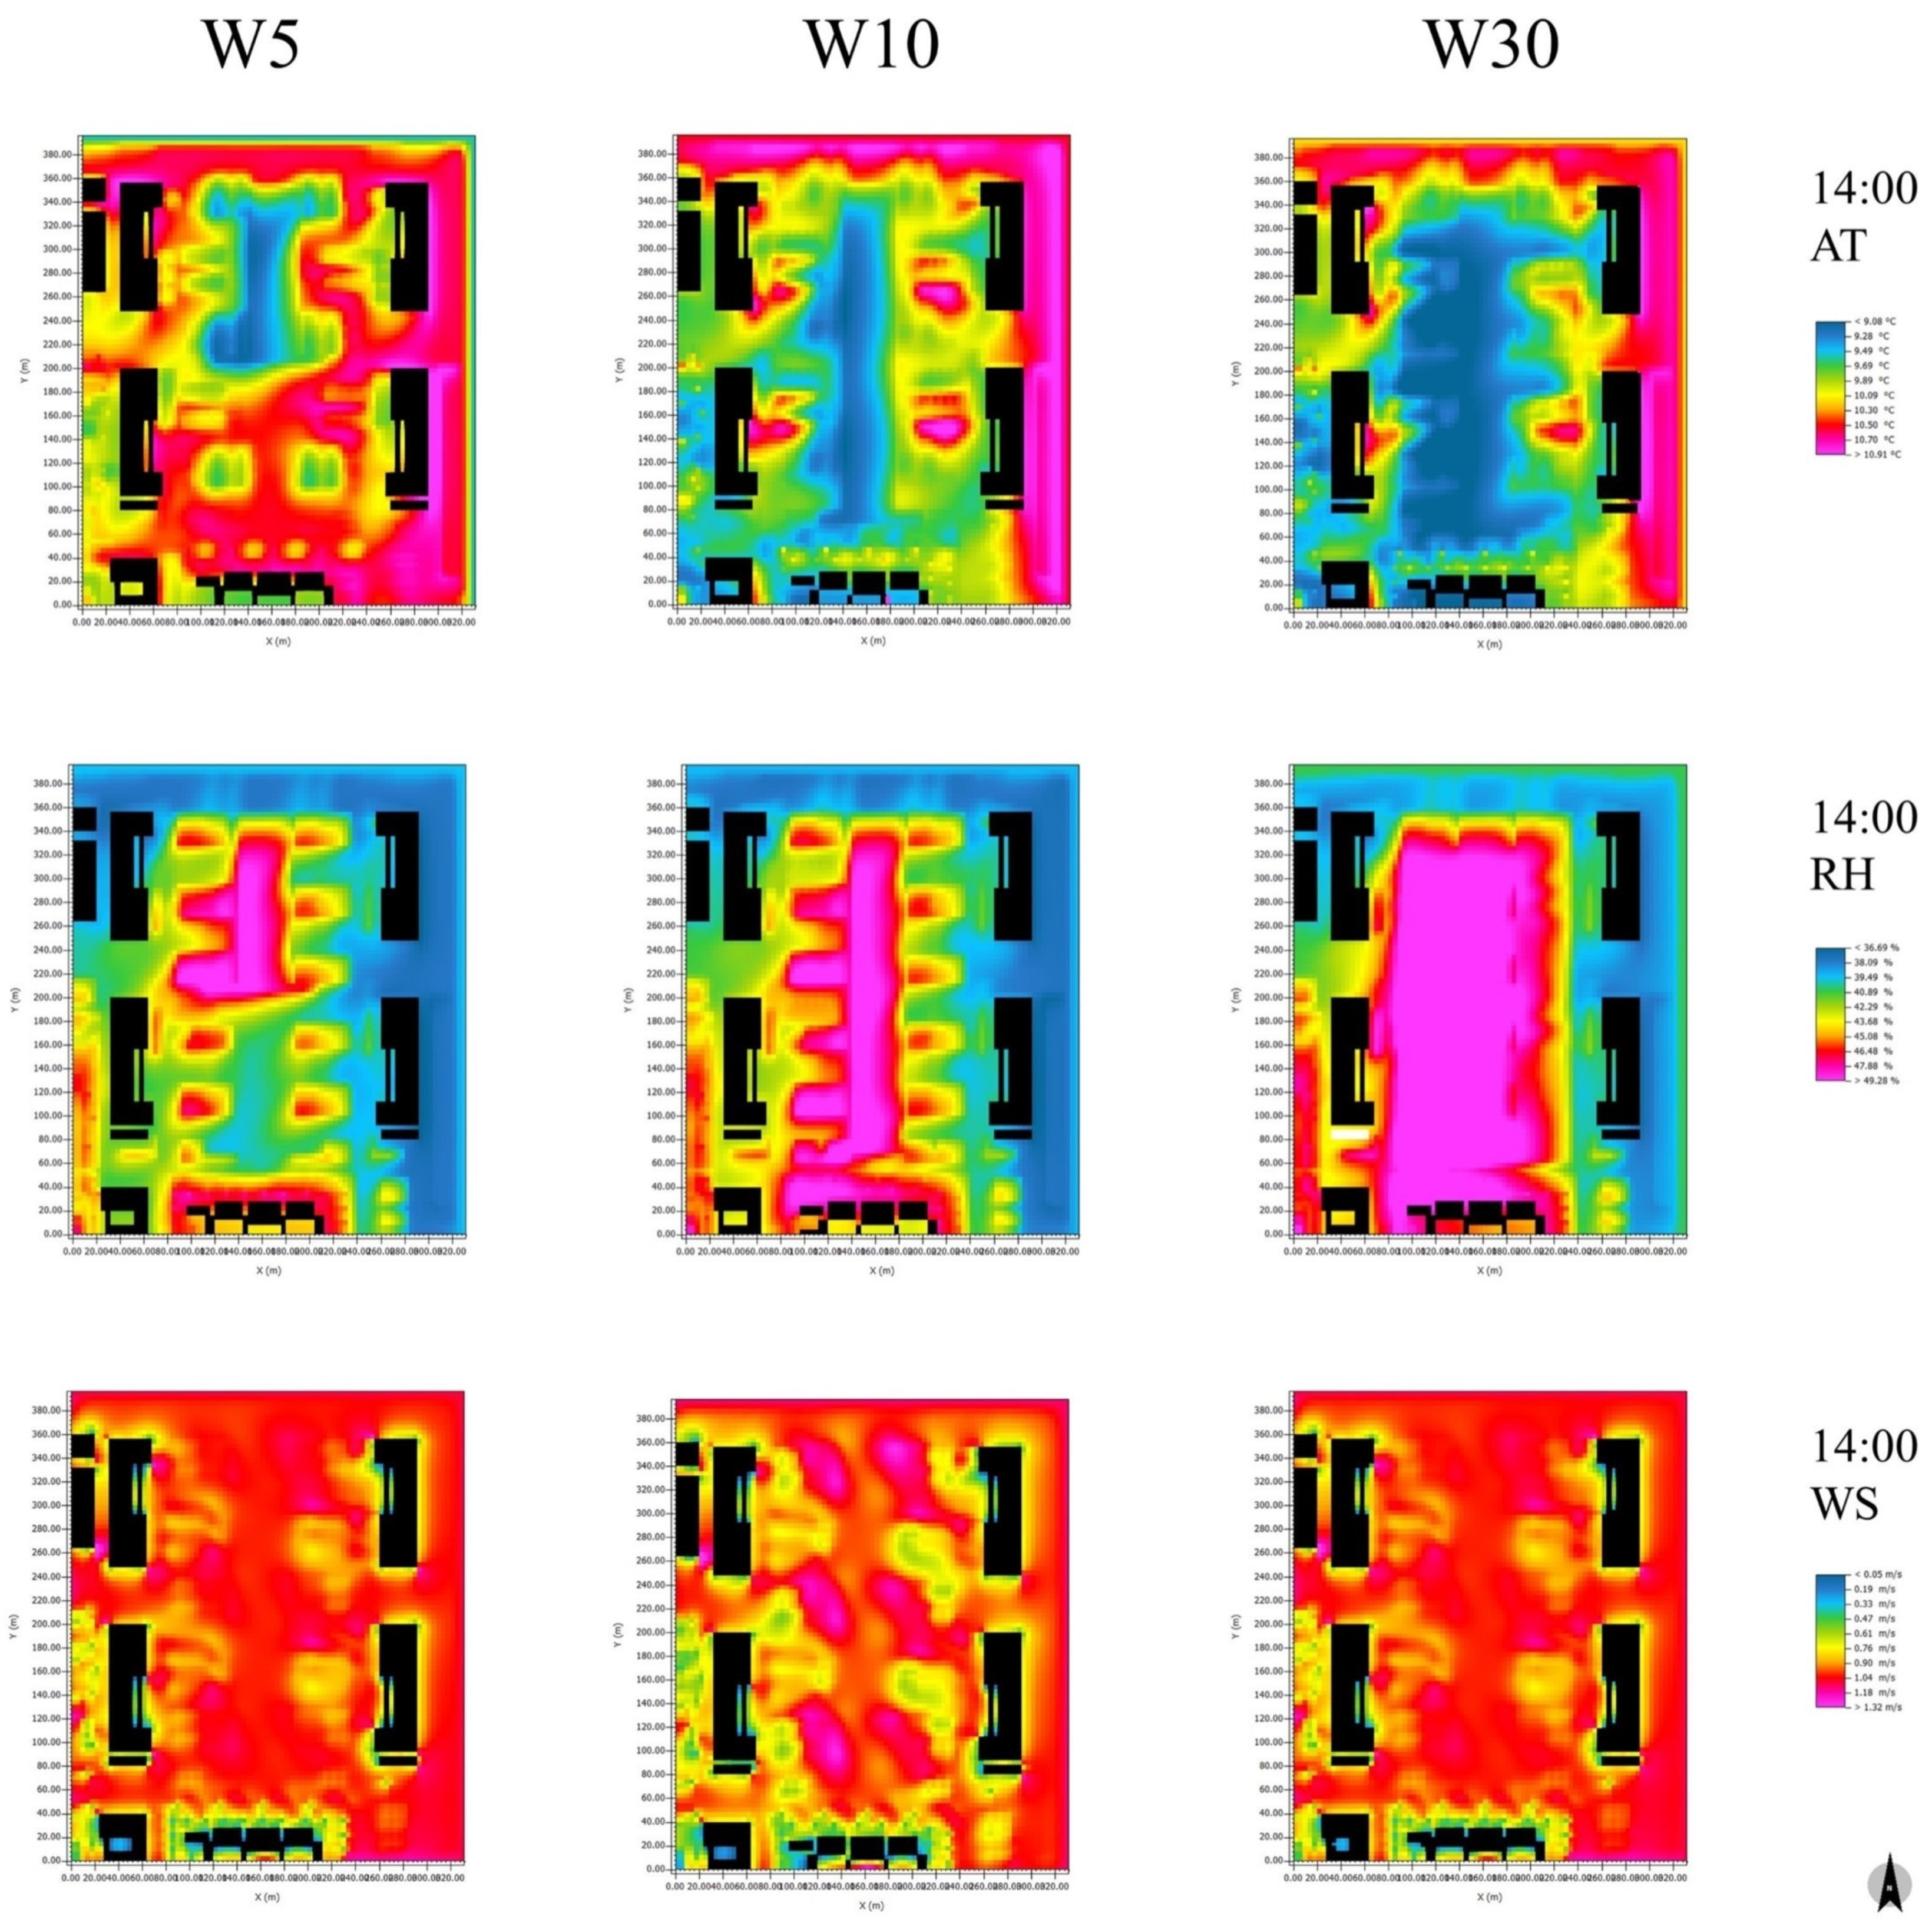
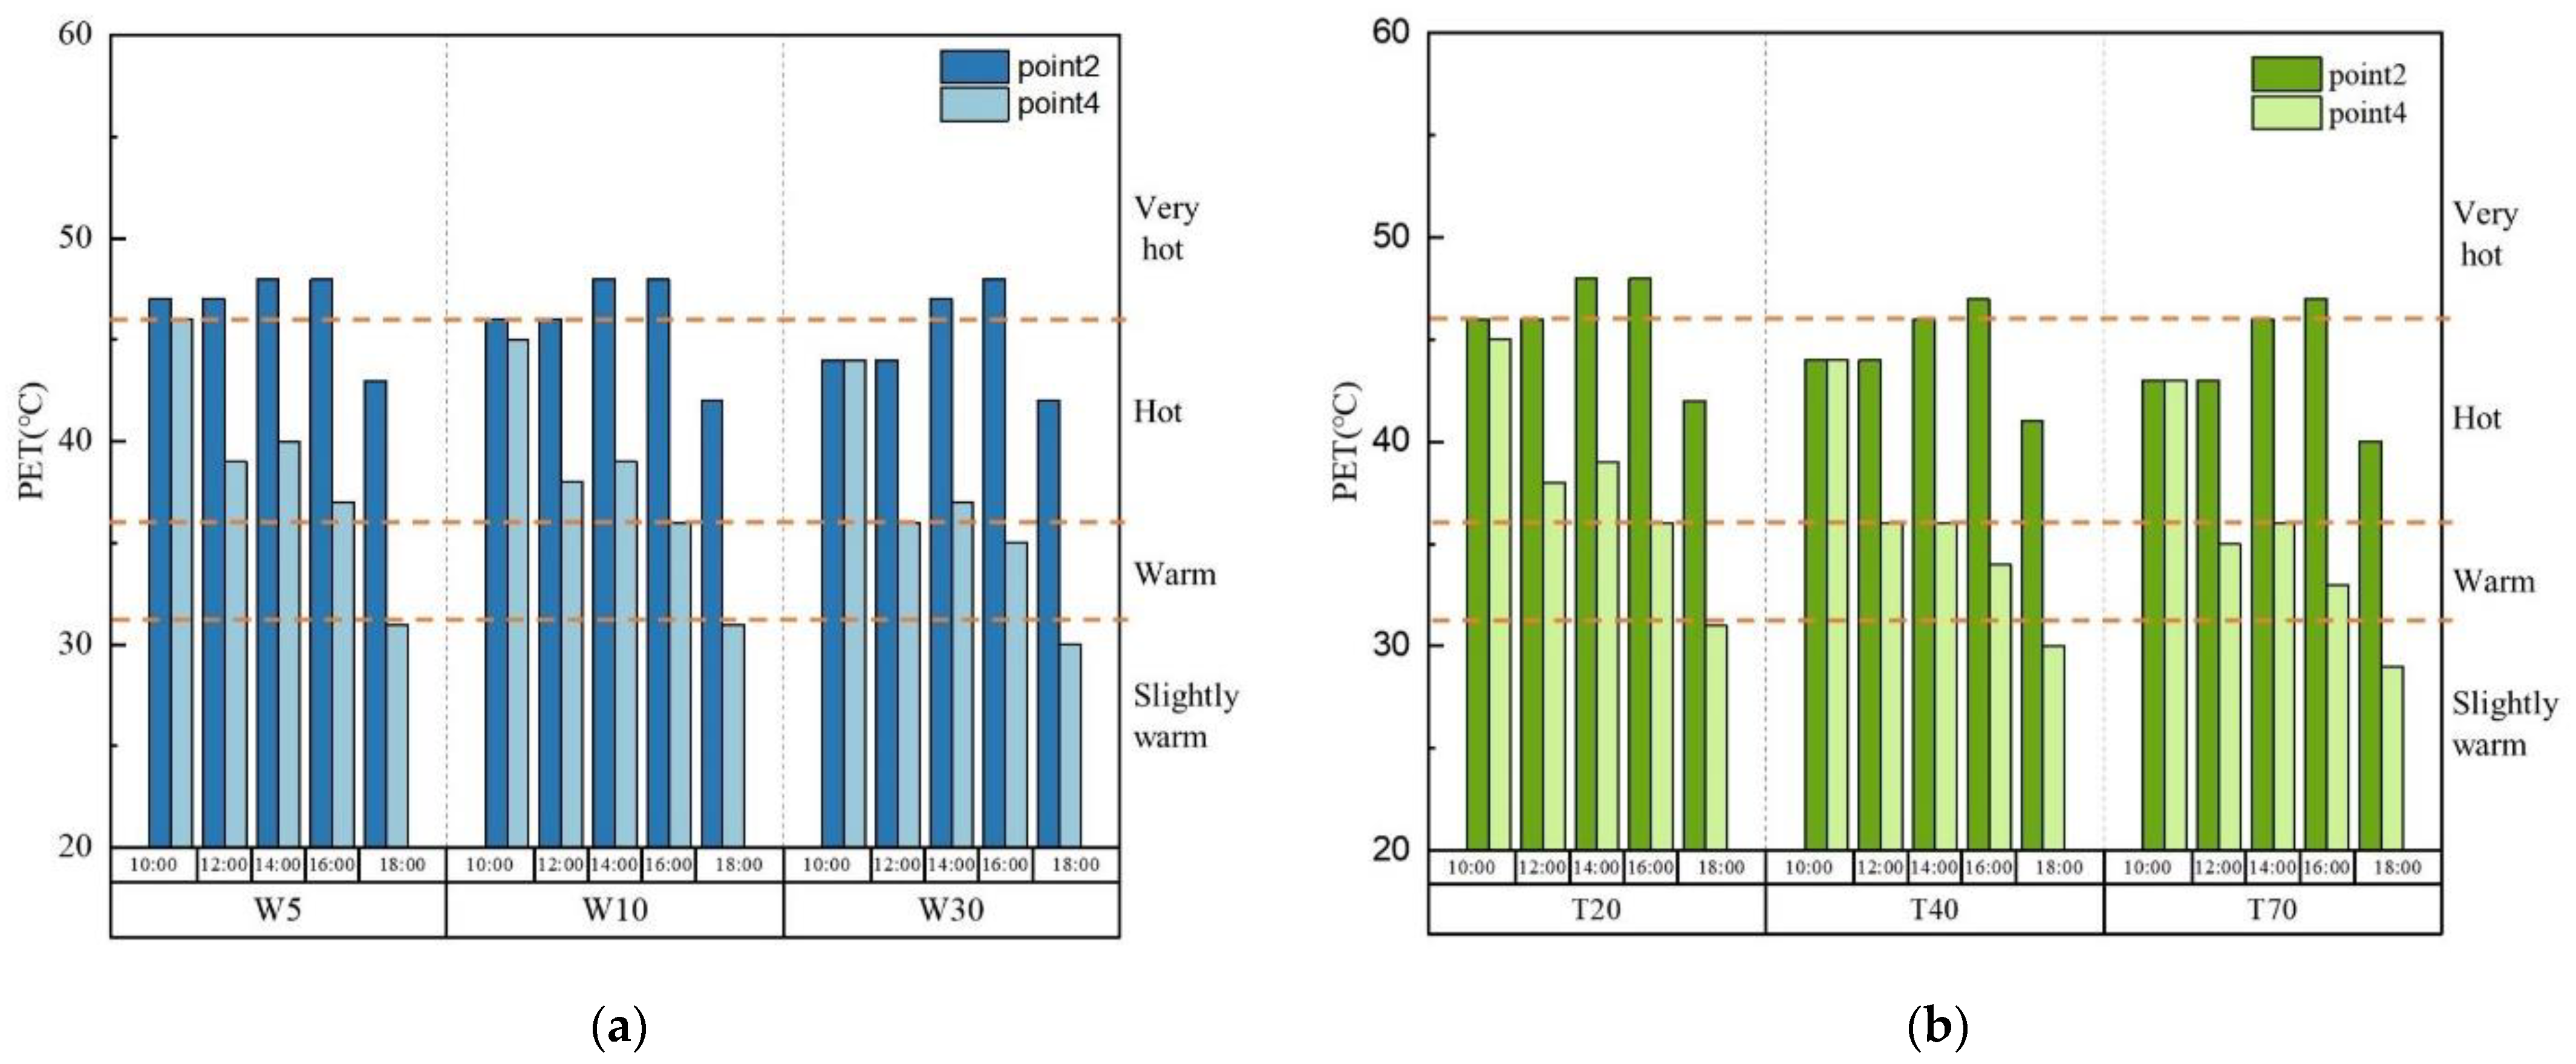
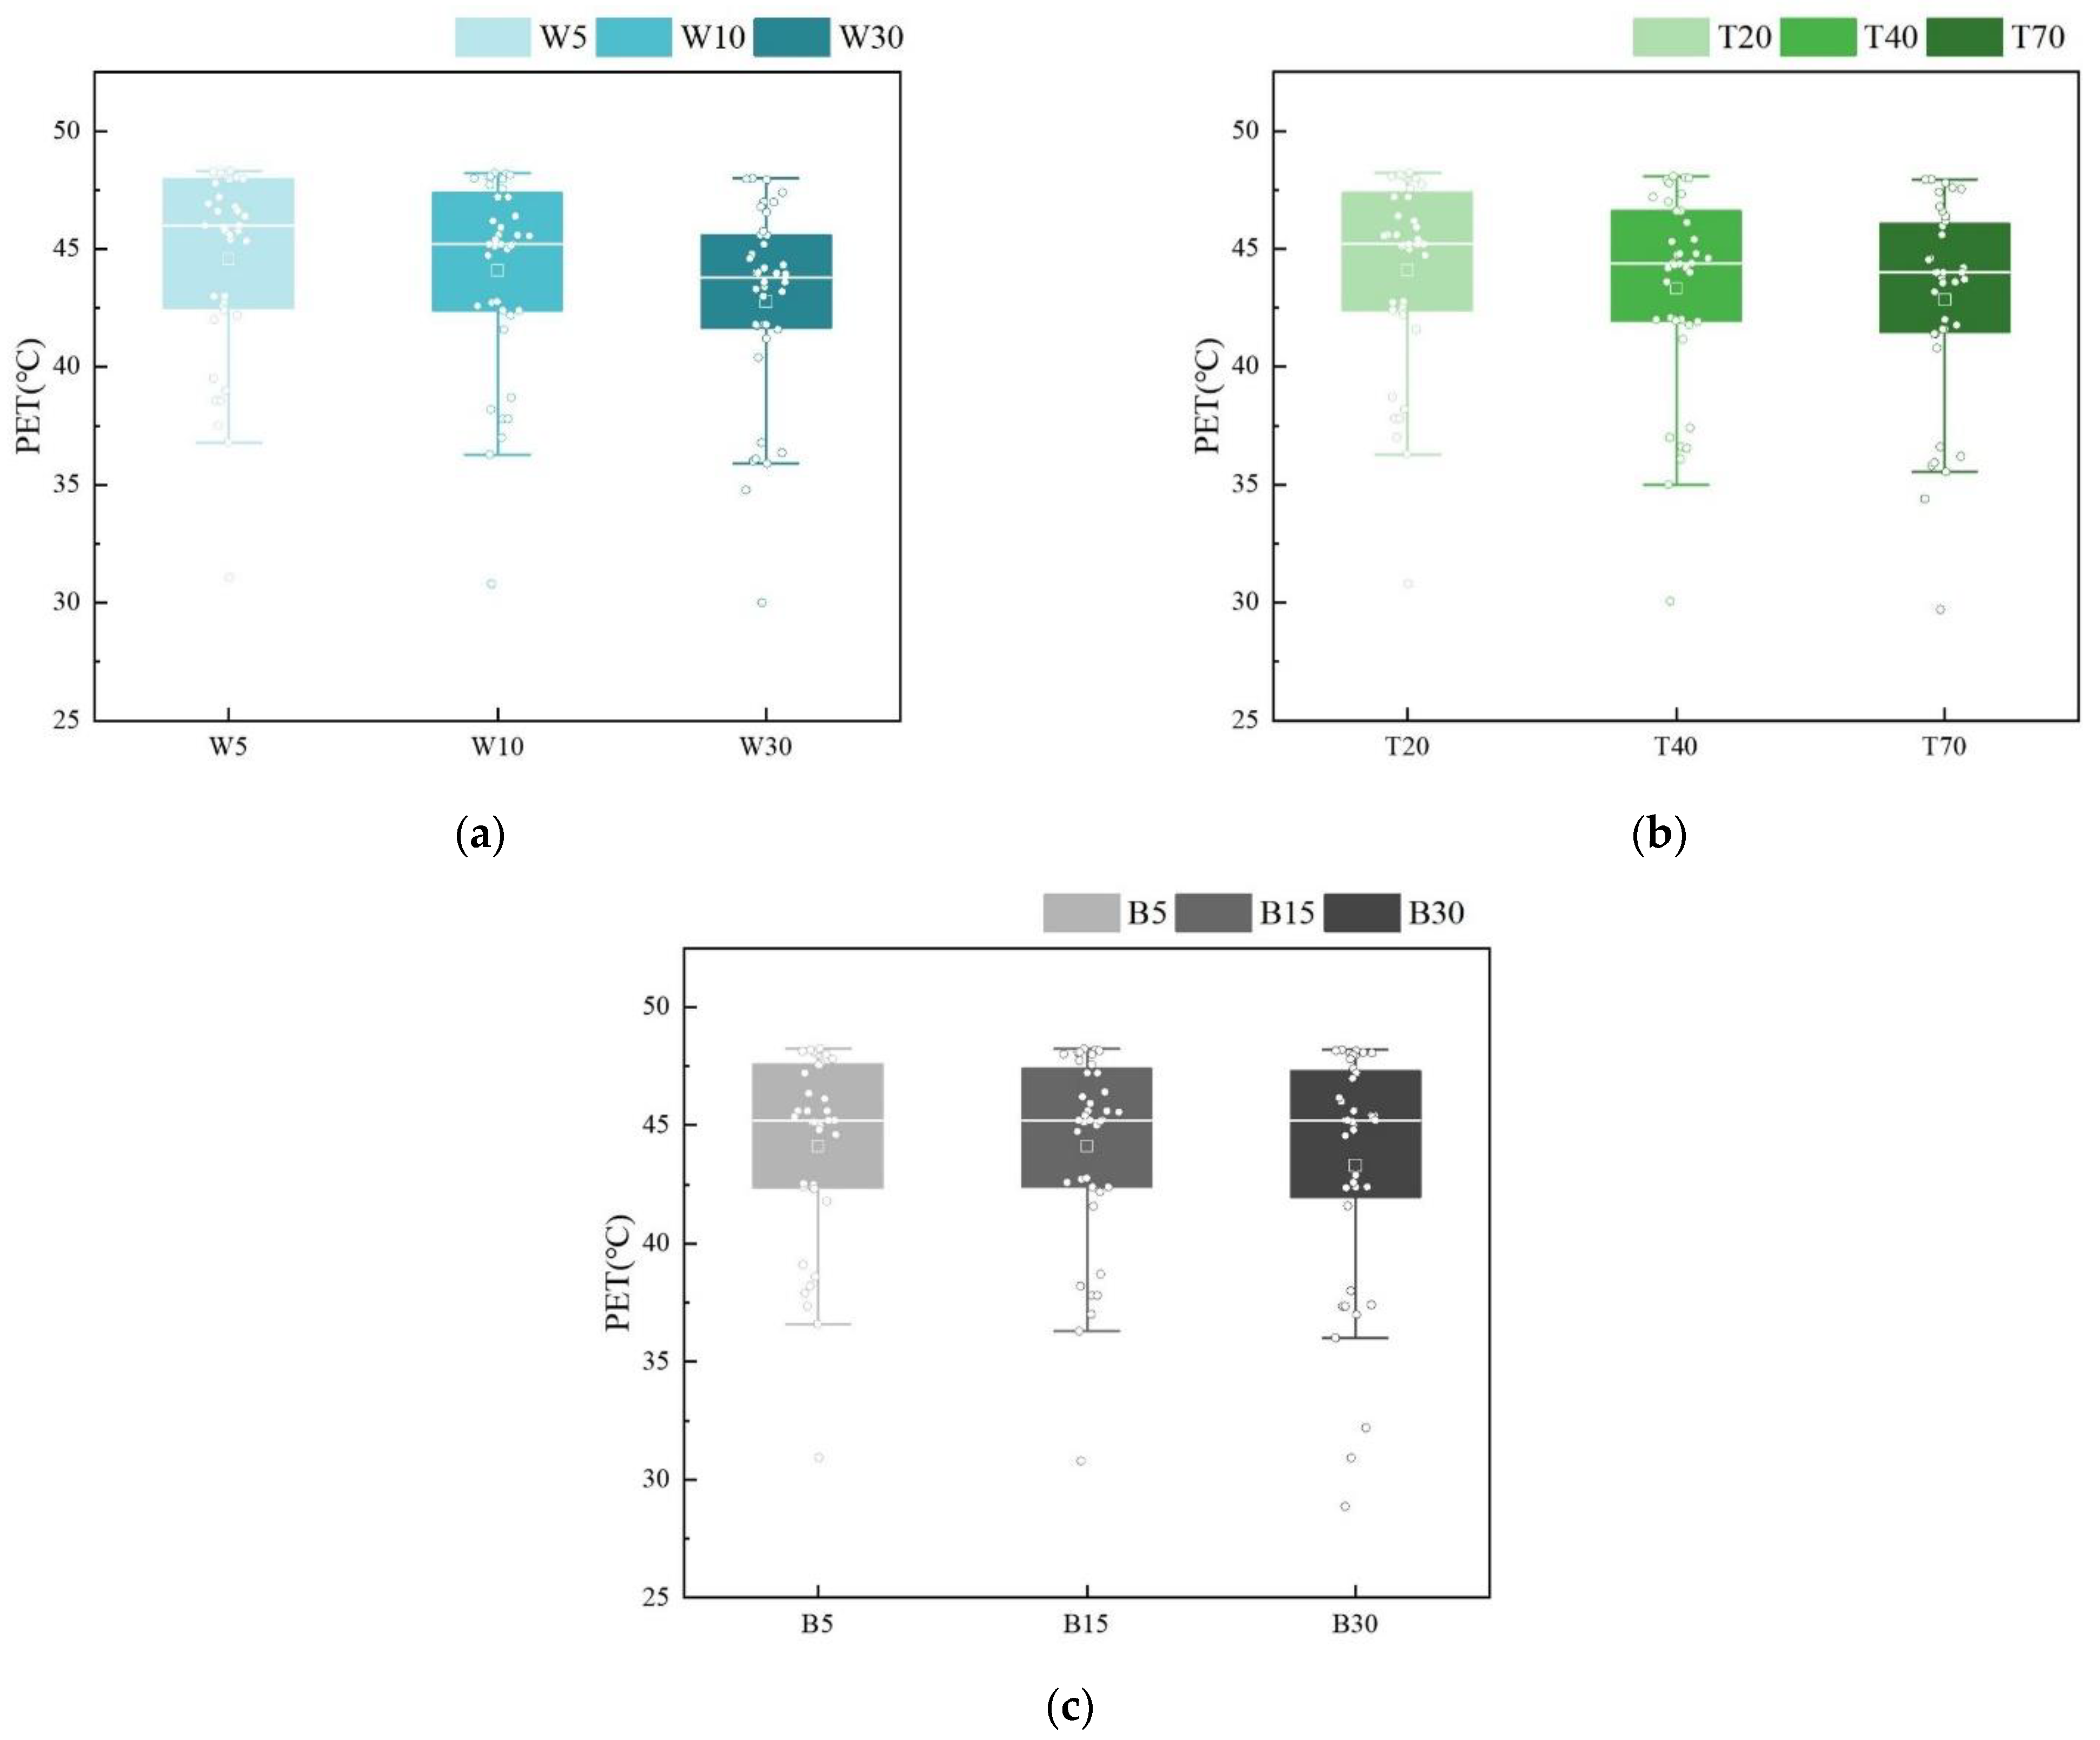
3.3.1. The Impact of Differing Water Coverage on the Microclimate Parameters
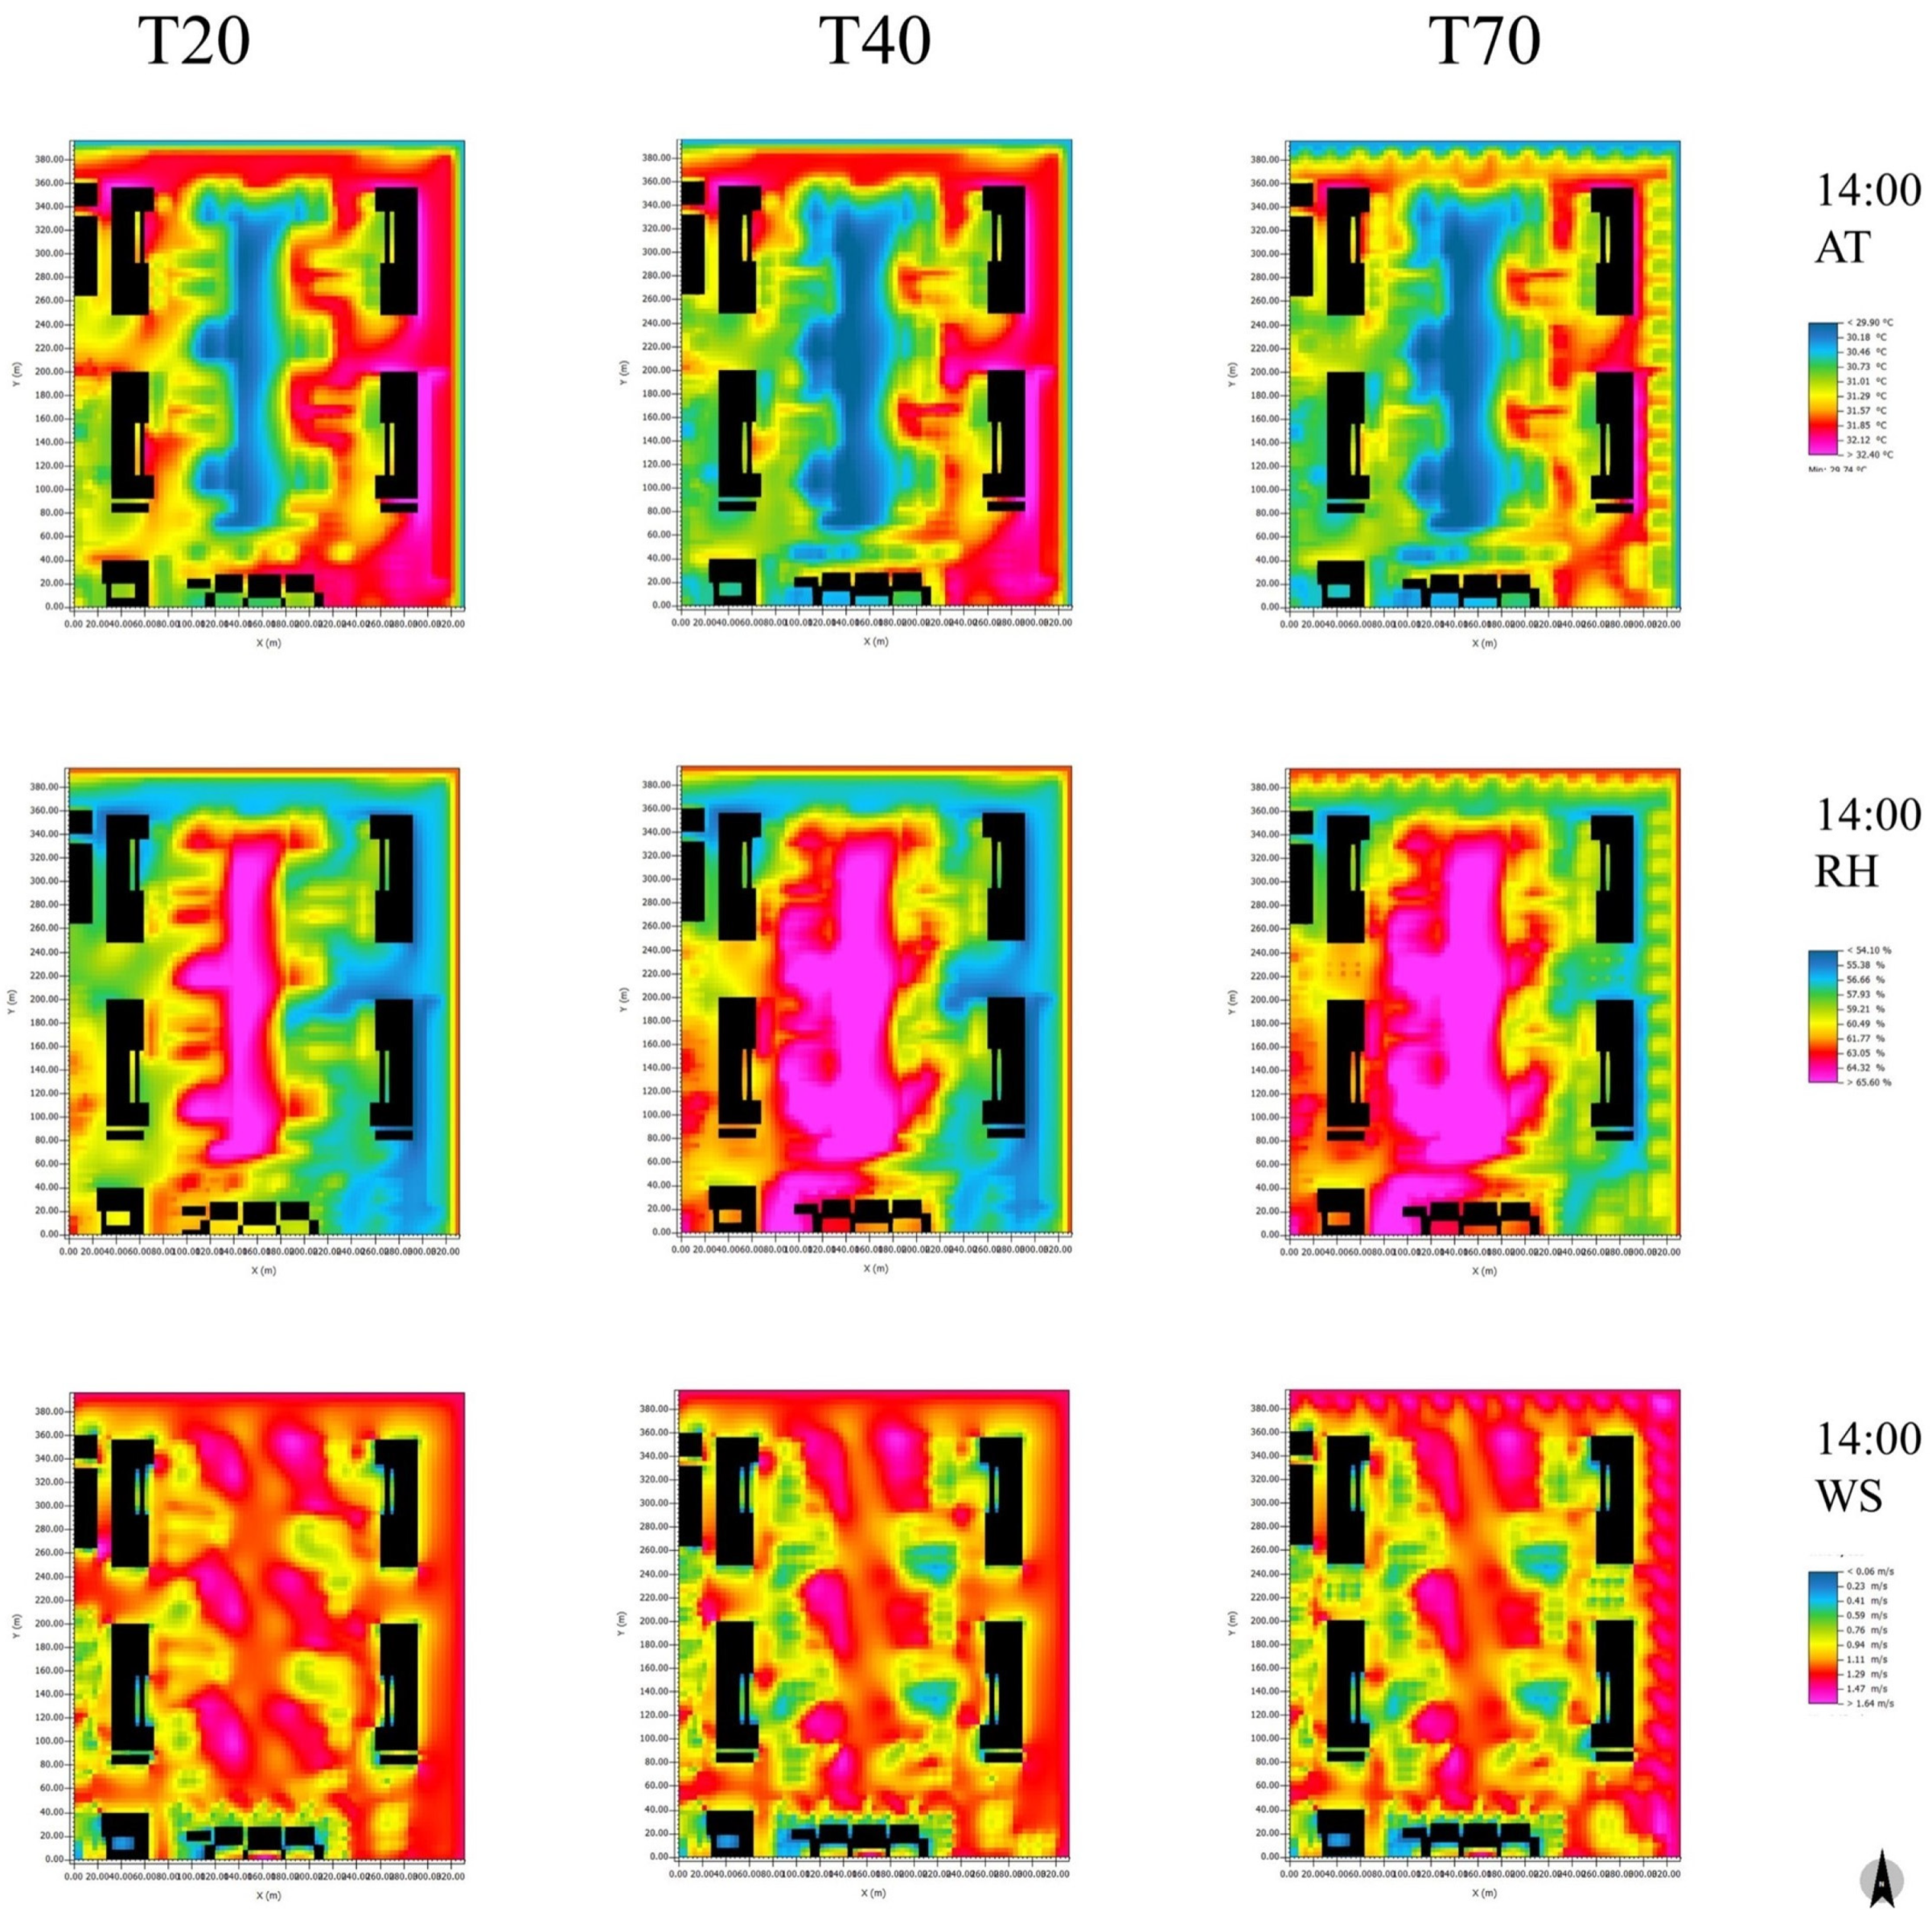
3.3.2. The Impact of Differing Vegetation Coverage on the Microclimate Parameters
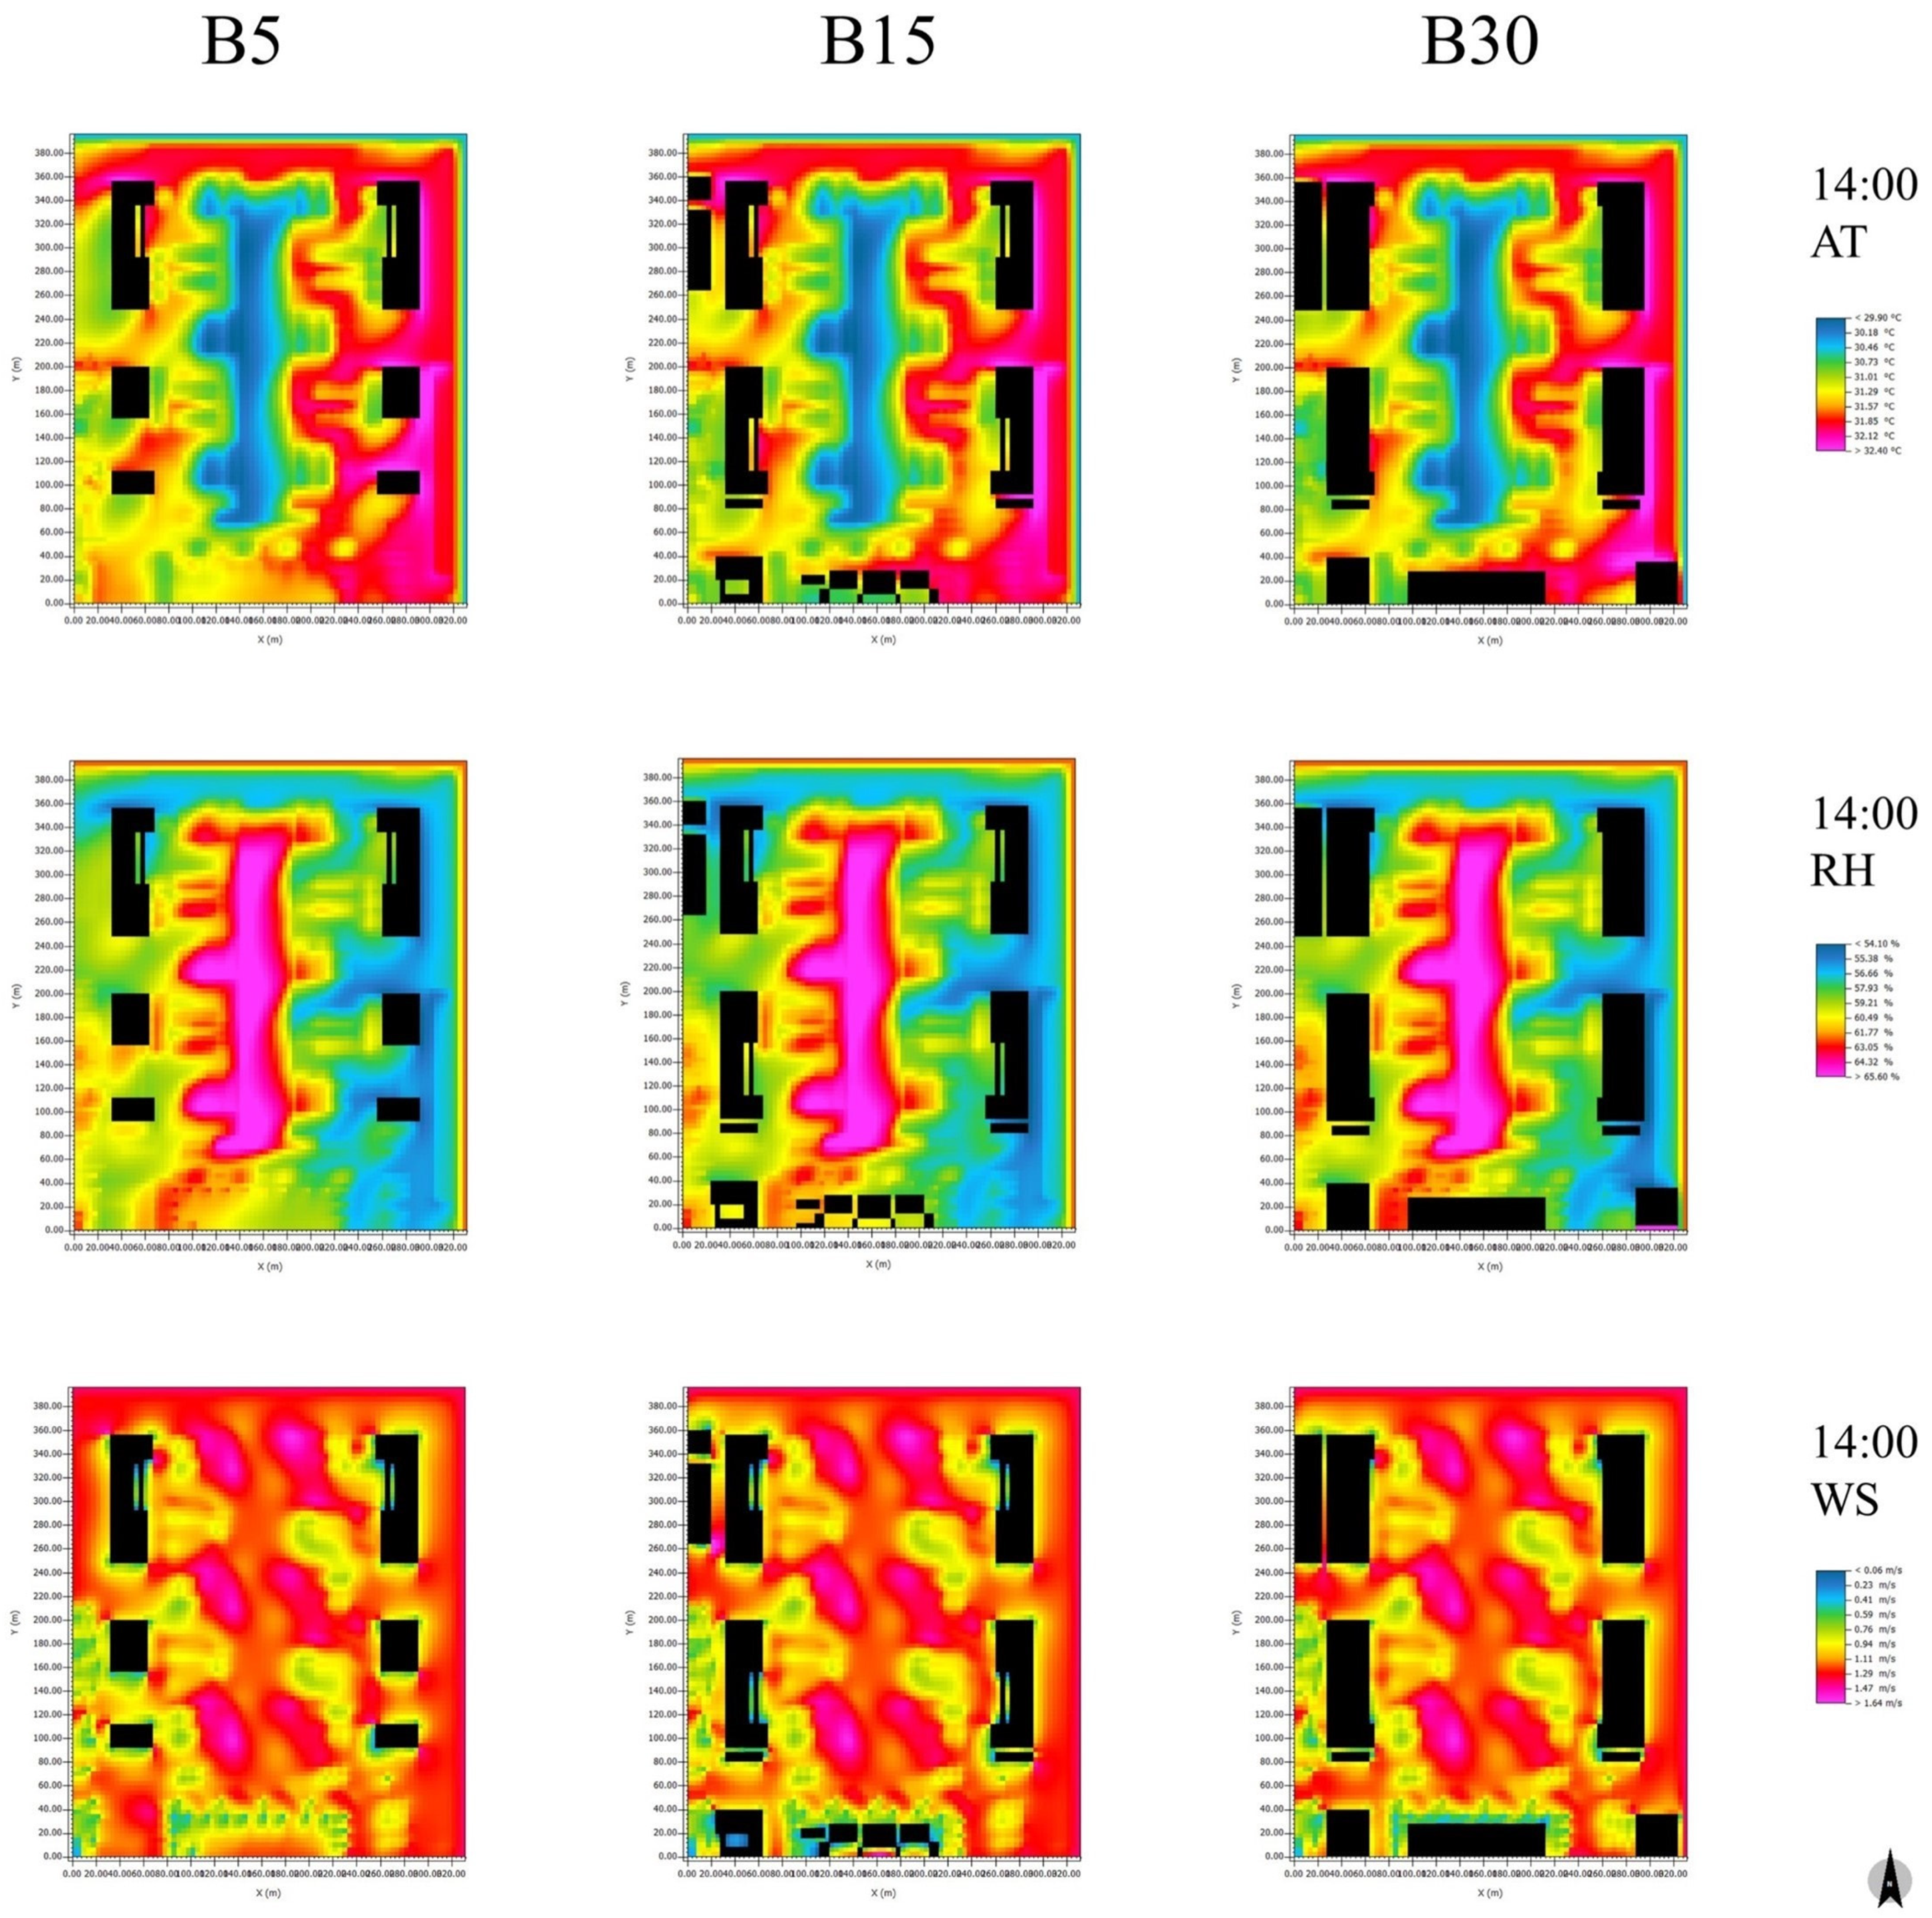
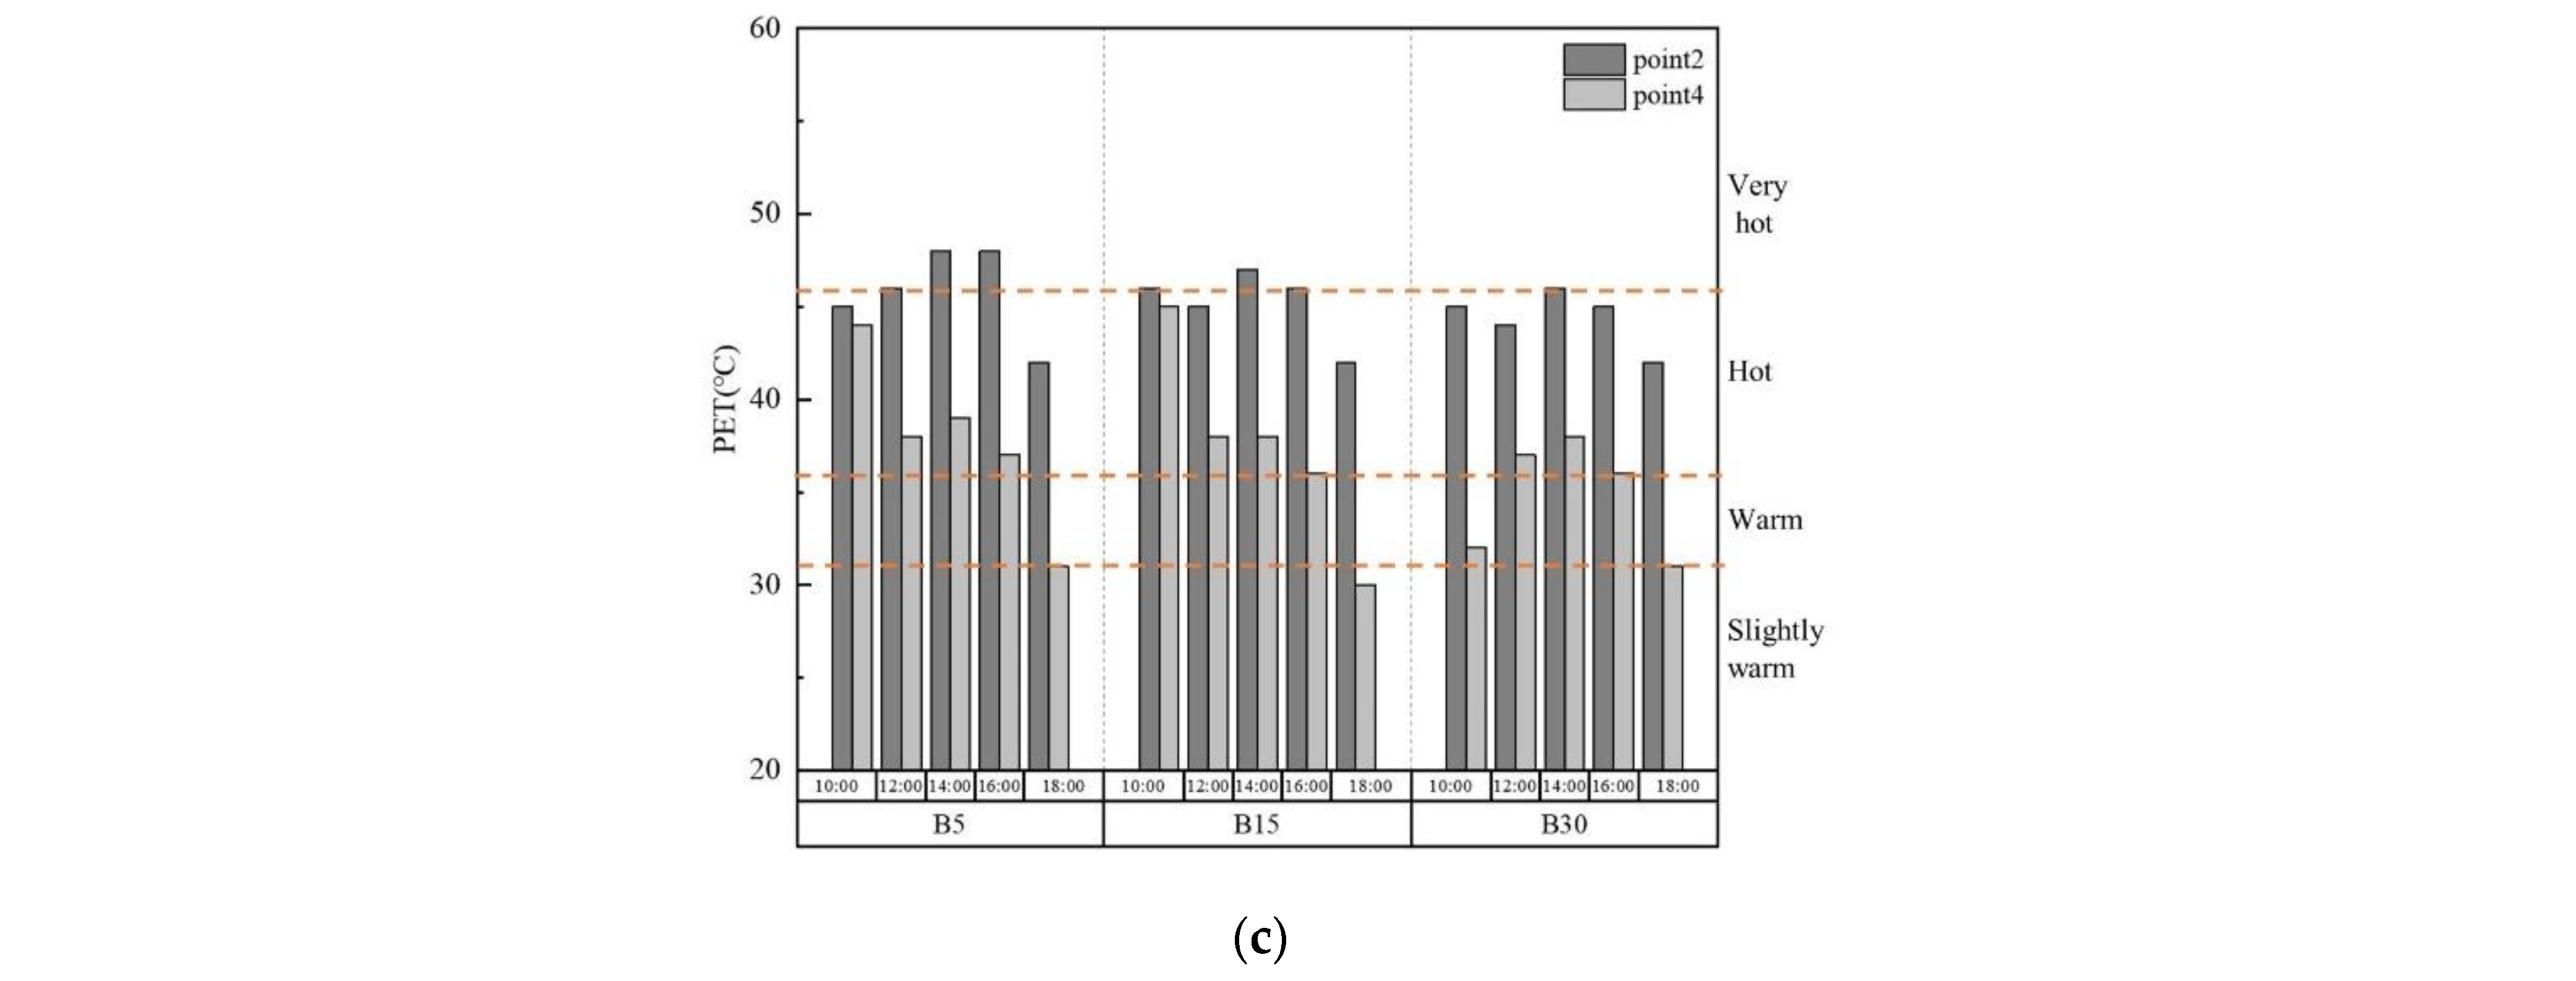
3.3.3. The Impact of Differing Building Heights and Densities on the Microclimate Parameters
3.4. Thermal Comfort of Redesigned Cases
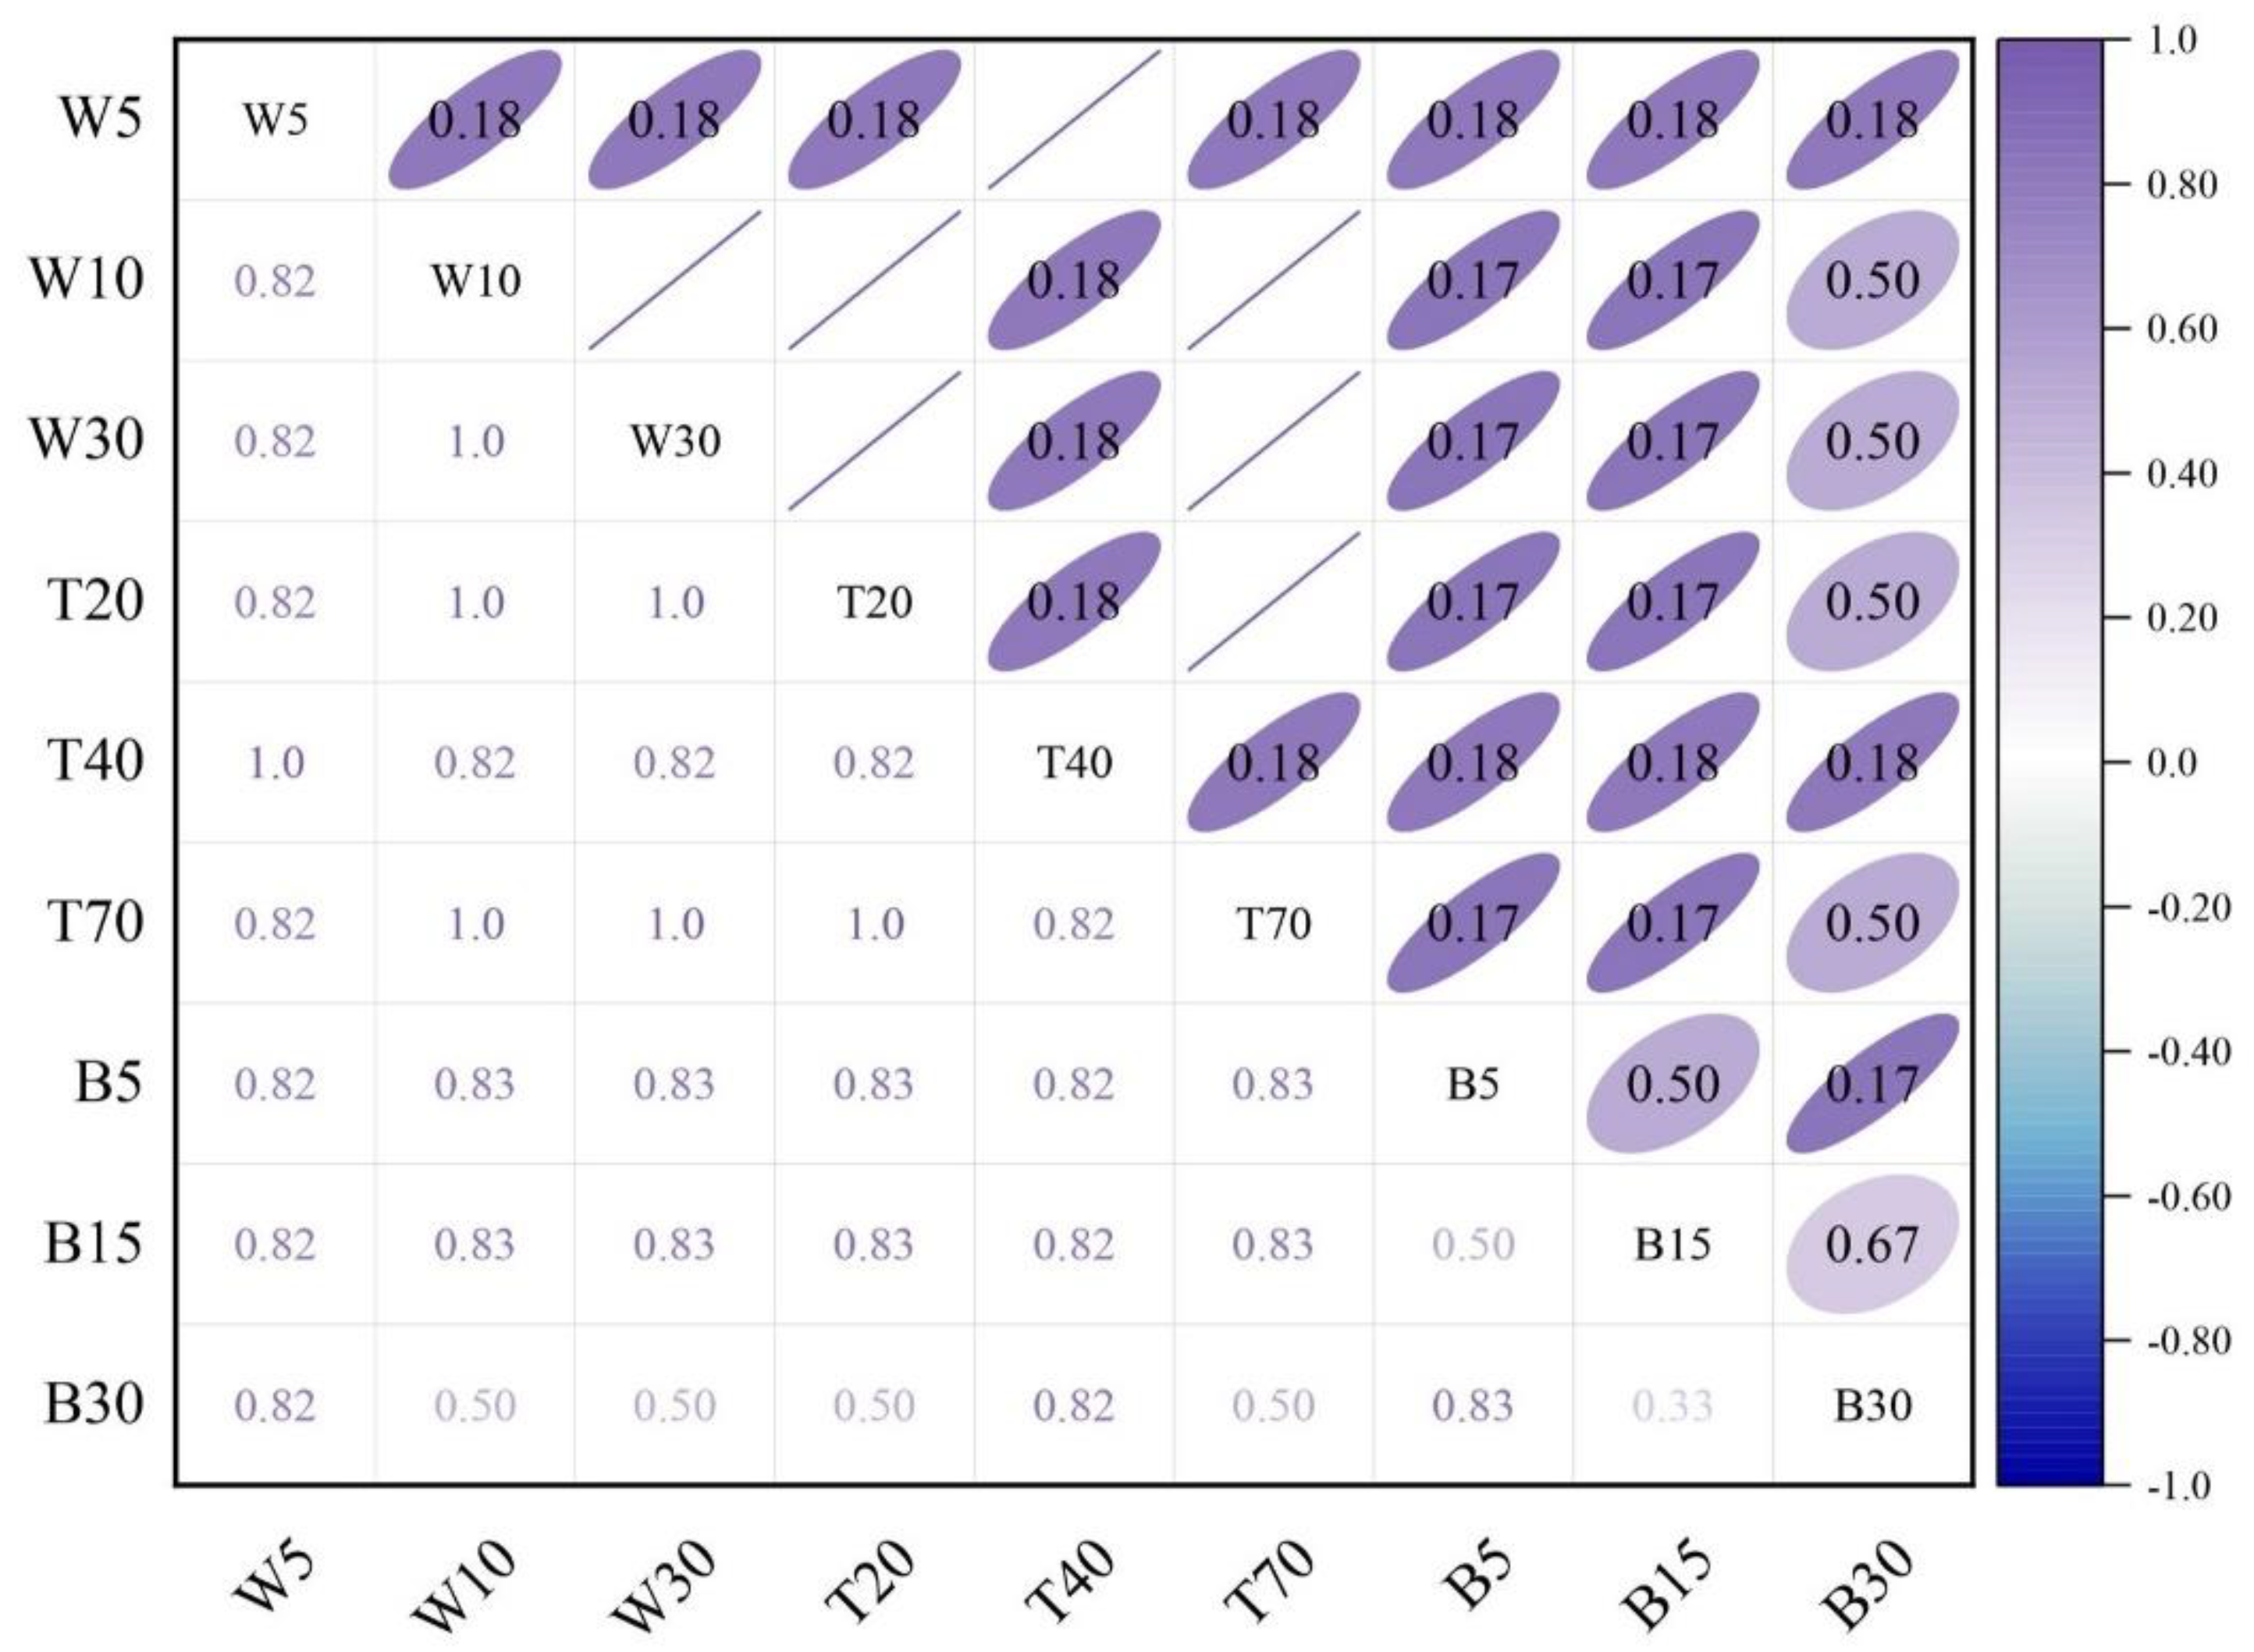
3.5. Internal Mechanics
4. Discussion
5. Conclusions
- (1)
- Modified boundary conditions allow ENVI-met simulations to achieve convincing simulation accuracy in urban squares in cold climate areas (R2 > 0.78, RMSE < 2).
- (2)
- Increasing vegetation coverage is the most effective strategy to improve microclimate and thermal comfort, followed by increasing water coverage and modest increasing building height and density. The ranking of important landscape elements that affect thermal comfort in summer is vegetation, water bodies and buildings.
- (3)
- There is a correlation between different types of landscape elements for thermal comfort enhancement (|ρ| ≥ 0.5), so they should be considered together. This method of arrangement can be used by designers in the pre-planning and project renovation stages.
Author Contributions
Funding
Institutional Review Board Statement
Informed Consent Statement
Data Availability Statement
Conflicts of Interest
Nomenclature
| UHI | Urban heat island |
| IPCC | Intergovernmental Panel on Climate Change |
| °C | Degrees Celsius |
| M | Meter |
| m2 | Square meter |
| AT | Air temperature (°C) |
| RH | Relative humidity (%) |
| WS | Wind speed (m/s) |
| A.D. | Anno Domini |
| RMSE | Root-mean-square deviation |
| R2 | Coefficient of determination |
| W | Water body |
| T | Vegetation |
| B | Buildings |
| SET* | Standard Effective Temperature |
| PMV | Predicted Mean Vote |
| UTCI | Universal Thermal Climate Index |
| PET | Physiological equivalent temperature |
| Spearman’s ρ | Spearman’s correlation coefficient |
References
- Goodess, C.; Berk, S.; Ratna, S.B.; Brousse, O.; Davies, M.; Heaviside, C.; Moore, G.; Pineo, H. Climate change projections for sustainable and healthy cities. Build. Cities 2021, 2, 812. [Google Scholar] [CrossRef]
- Chaturvedi, S.; Cheong, T.S.; Luo, Y.; Singh, C.; Shaw, R. IPCC Sixth Assessment Report (AR6): Climate Change 2022-Impacts, Adaptation and Vulnerability: Regional Factsheet Asia; IPCC: Geneva, Switzerland, 2022. [Google Scholar]
- Zheng, T.; Qu, K.; Darkwa, J.; Calautit, J.K. Evaluating urban heat island mitigation strategies for a subtropical city centre (a case study in Osaka, Japan). Energy 2022, 250, 123721. [Google Scholar] [CrossRef]
- Molina-Gómez, N.I.; Varon-Bravo, L.M.; Sierra-Parada, R.; López-Jiménez, P.A. Urban growth and heat islands: A case study in micro-territories for urban sustainability. Urban Ecosyst. 2022. [Google Scholar] [CrossRef]
- Yang, X.; Gao, W.; Zhang, Q.; Li, S.; Fu, F.; Li, N. Analyzing the Environment Characteristics of Heat Exposure Spaces from the Humanistic Perspective and Spatial Improvement Approaches in Central Beijing, China. Buildings 2022, 12, 138. [Google Scholar] [CrossRef]
- Hou, H.; Su, H.; Liu, K.; Li, X.; Chen, S.; Wang, W.; Lin, J. Driving forces of UHI changes in China’s major cities from the perspective of land surface energy balance. Sci. Total Environ. 2022, 829, 154710. [Google Scholar] [CrossRef]
- Ozarisoy, B. Energy effectiveness of passive cooling design strategies to reduce the impact of long-term heatwaves on occupants’ thermal comfort in Europe: Climate change and mitigation. J. Clean. Prod. 2022, 330, 129675. [Google Scholar] [CrossRef]
- Nasrollahi, N.; Ghosouri, A.; Khodakarami, J.; Taleghani, M. Heat-Mitigation Strategies to Improve Pedestrian Thermal Comfort in Urban Environments: A Review. Sustainability 2020, 12, 10000. [Google Scholar] [CrossRef]
- Lin, T.-P. Thermal perception, adaptation and attendance in a public square in hot and humid regions. Build. Environ. 2009, 44, 2017–2026. [Google Scholar] [CrossRef]
- Kariminia, S.; Ahmad, S.S. Dependence of Visitors’ Thermal Sensations on Built Environments at an Urban Square. Procedia-Soc. Behav. Sci. 2013, 85, 523–534. [Google Scholar] [CrossRef] [Green Version]
- Kim, H.; Kim, S.W.; Jo, Y.; Kim, E.J. Findings from a field study of urban microclimate in Korea using mobile meteorological measurements. Open House Int. 2022. Epub ahead of printing. [Google Scholar] [CrossRef]
- Battista, G.; de Lieto Vollaro, R.; Zinzi, M. Assessment of urban overheating mitigation strategies in a square in Rome, Italy. Sol. Energy 2019, 180, 608–621. [Google Scholar] [CrossRef]
- Elnabawi, M.H.; Hamza, N. Outdoor Thermal Comfort: Coupling Microclimatic Parameters with Subjective Thermal Assessment to Design Urban Performative Spaces. Buildings 2020, 10, 238. [Google Scholar] [CrossRef]
- Gagge, A.P.; Fobelets, A.P.; Berglund, L. A standard predictive index of human response to the thermal environment. ASHRAE trans. 1986, 92, 709–731. [Google Scholar]
- Höppe, P. The physiological equivalent temperature–A universal index for the biometeorological assessment of the thermal environment. Int. J. Biometeorol. 1999, 43, 71–75. [Google Scholar] [CrossRef]
- Sun, S.; Yu, Y. Dimension and formation of placeness of commercial public space in city center: A case study of Deji Plaza in Nanjing. Front. Arch. Res. 2021, 10, 229–239. [Google Scholar] [CrossRef]
- Liu, S.; Zhao, J.; Xu, M.; Ahmadian, E. Effects of landscape patterns on the summer microclimate and human comfort in urban squares in China. Sustain. Cities Soc. 2021, 73, 103099. [Google Scholar] [CrossRef]
- Zölch, T.; Rahman, M.A.; Pfleiderer, E.; Wagner, G.; Pauleit, S. Designing public squares with green infrastructure to optimize human thermal comfort. Build. Environ. 2019, 149, 640–654. [Google Scholar] [CrossRef]
- McRae, I.; Freedman, F.R.; Rivera, A.; Li, X.; Dou, J.; Cruz, I.; Ren, C.; Dronova, I.; Fraker, H.; Bornstein, R. Integration of the WUDAPT, WRF, and ENVI-met models to simulate extreme daytime temperature mitigation strategies in San Jose, California. Build. Environ. 2020, 184, 107180. [Google Scholar] [CrossRef]
- Stocco, S.; Cantón, M.A.; Correa, E. Evaluation of design schemes for urban squares in arid climate cities, Mendoza, Argentina. Build. Simul. 2021, 14, 763–777. [Google Scholar] [CrossRef]
- Ma, X.; Leung, T.; Chau, C.; Yung, E.H. Analyzing the influence of urban morphological features on pedestrian thermal comfort. Urban Clim. 2022, 44, 101192. [Google Scholar] [CrossRef]
- Yang, Y.; Zhang, X.; Lu, X.; Hu, J.; Pan, X.; Zhu, Q.; Su, W. Effects of Building Design Elements on Residential Thermal Environment. Sustainability 2017, 10, 57. [Google Scholar] [CrossRef] [Green Version]
- Shareef, S.; Abu-Hijleh, B. The effect of building height diversity on outdoor microclimate conditions in hot climate. A case study of Dubai-UAE. Urban Clim. 2020, 32, 100611. [Google Scholar] [CrossRef]
- Perini, K.; Magliocco, A. Effects of vegetation, urban density, building height, and atmospheric conditions on local temperatures and thermal comfort. Urban For. Urban Green. 2014, 13, 495–506. [Google Scholar] [CrossRef]
- Gaitani, N.; Spanou, A.; Saliari, M.; Synnefa, A.; Vassilakopoulou, K.; Papadopoulou, K.; Pavlou, K.; Santamouris, M.; Papaioannou, M.; Lagoudaki, A. Improving the microclimate in urban areas: A case study in the centre of Athens. Build. Serv. Eng. Res. Technol. 2011, 32, 53–71. [Google Scholar] [CrossRef]
- Zhang, T.; Hong, B.; Su, X.; Li, Y.; Song, L. Effects of tree seasonal characteristics on thermal-visual perception and thermal comfort. Build. Environ. 2022, 212, 108793. [Google Scholar] [CrossRef]
- Hong, B.; Lin, B. Numerical study of the influences of different patterns of the building and green space on micro-scale outdoor thermal comfort and indoor natural ventilation. Build. Simul. 2014, 7, 525–536. [Google Scholar] [CrossRef]
- Cong, Y.; Zhu, R.; Yang, L.; Zhang, X.; Liu, Y.; Meng, X.; Gao, W. Correlation Analysis of Thermal Comfort and Landscape Characteristics: A Case Study of the Coastal Greenway in Qingdao, China. Buildings 2022, 12, 541. [Google Scholar] [CrossRef]
- Jacobs, C.; Klok, L.; Bruse, M.; Cortesão, J.; Lenzholzer, S.; Kluck, J. Are urban water bodies really cooling? Urban Clim. 2020, 32, 100607. [Google Scholar] [CrossRef]
- Ma, X.; Fukuda, H.; Zhou, D.; Wang, M. Study on outdoor thermal comfort of the commercial pedestrian block in hot-summer and cold-winter region of southern China-a case study of The Taizhou Old Block. Tour. Manag. 2019, 75, 186–205. [Google Scholar] [CrossRef]
- Lai, D.; Lian, Z.; Liu, W.; Guo, C.; Liu, W.; Liu, K.; Chen, Q. A comprehensive review of thermal comfort studies in urban open spaces. Sci. Total Environ. 2020, 742, 140092. [Google Scholar] [CrossRef]
- Lai, D.; Liu, W.; Gan, T.; Liu, K.; Chen, Q. A review of mitigating strategies to improve the thermal environment and thermal comfort in urban outdoor spaces. Sci. Total Environ. 2019, 661, 337–353. [Google Scholar] [CrossRef]
- Xi, T.; Wang, Q.; Qin, H.; Jin, H. Influence of outdoor thermal environment on clothing and activity of tourists and local people in a severely cold climate city. Build. Environ. 2020, 173, 106757. [Google Scholar] [CrossRef]
- Jia, S.; Wang, Y. Effect of heat mitigation strategies on thermal environment, thermal comfort, and walkability: A case study in Hong Kong. Build. Environ. 2021, 201, 107988. [Google Scholar] [CrossRef]
- Li, J.; Liu, N. The perception, optimization strategies and prospects of outdoor thermal comfort in China: A review. Build. Environ. 2020, 170, 106614. [Google Scholar] [CrossRef]
- Gao, Y.; Gao, W.; Meng, X.; Long, E. Code for Thermal Design of Civil Buildings; China Planning Press: Beijing, China, 1993. [Google Scholar]
- Hui, Z.; Zeng, B. Research on Approaches and Significance of Great Wild Goose Pagoda Tourism under the Guidance of “the Belt and Road” Strategy. In Proceedings of the 2nd International Conference on Contemporary Education, Social Sciences and Humanities (ICCESSH 2017), Moscow, Russia, 14–15 June 2017; Atlantis Press: Amsterdam, The Netherlands, 2017. [Google Scholar]
- Bruse, M.; Fleer, H. Simulating surface–plant–air interactions inside urban environments with a three dimensional numerical model. Environ. Model. Softw. 1998, 13, 373–384. [Google Scholar] [CrossRef]
- Karimi, A.; Sanaieian, H.; Farhadi, H.; Norouzian-Maleki, S. Evaluation of the thermal indices and thermal comfort improvement by different vegetation species and materials in a medium-sized urban park. Energy Rep. 2020, 6, 1670–1684. [Google Scholar] [CrossRef]
- Chen, Z.J. Research of Vegetation System’s Effects on Outdoor Thermal Environment of Residential Communities in Hot-Humid Climate; South China University of Technology: Guangzhou, China, 2010. [Google Scholar]
- Salata, F.; Golasi, I.; de Lieto Vollaro, R.; de Lieto Vollaro, A. Urban microclimate and outdoor thermal comfort. A proper procedure to fit ENVI-met simulation outputs to experimental data. Sustain. Cities Soc. 2016, 26, 318–343. [Google Scholar] [CrossRef]
- Yang, S.; Zhou, D.; Wang, Y.; Li, P. Comparing impact of multi-factor planning layouts in residential areas on summer thermal comfort based on orthogonal design of experiments (ODOE). Build. Environ. 2020, 182, 107145. [Google Scholar] [CrossRef]
- Zhang, H.; Chen, B.; Sun, Z.; Bao, Z. Landscape perception and recreation needs in urban green space in Fuyang, Hangzhou, China. Urban For. Urban Green. 2013, 12, 44–52. [Google Scholar] [CrossRef]
- Theeuwes, N.E.; Solcerová, A.; Steeneveld, G.J. Modeling the influence of open water surfaces on the summertime temperature and thermal comfort in the city. J. Geophys. Res. Atmos. 2013, 118, 8881–8896. [Google Scholar] [CrossRef] [Green Version]
- Liu, B.; Lian, Z.; Brown, R.D. Effect of Landscape Microclimates on Thermal Comfort and Physiological Wellbeing. Sustainability 2019, 11, 5387. [Google Scholar] [CrossRef] [Green Version]
- CJJT 85-2017; Classification Standard of Urban Green Space (CJJT 85-2017). Code of China: Beijing, China, 2019.
- Chen, G.; Rong, L.; Zhang, G. Unsteady-state CFD simulations on the impacts of urban geometry on outdoor thermal comfort within idealized building arrays. Sustain. Cities Soc. 2021, 74, 103187. [Google Scholar] [CrossRef]
- Hong, B.; Lin, B. Numerical studies of the outdoor wind environment and thermal comfort at pedestrian level in housing blocks with different building layout patterns and trees arrangement. Renew. Energy 2015, 73, 18–27. [Google Scholar] [CrossRef]
- Olesen, B.W.; Brager, G.S. A Better Way to Predict Comfort: The New ASHRAE Standard 55-2004; UC Berkeley: Berkeley, CA, USA, 2004. [Google Scholar]
- Auliciems, A.; Szokolay, S.V. Thermal Comfort. PLEA sl. 1997. Available online: https://labeee.ufsc.br/sites/default/files/disciplinas/Szokolay%20e%20Auliciems,%201997.pdf (accessed on 4 June 2022).
- Migliari, M.; Babut, R.; De Gaulmyn, C.; Chesne, L.; Baverel, O. The Metamatrix of Thermal Comfort: A compendious graphical methodology for appropriate selection of outdoor thermal comfort indices and thermo-physiological models for human-biometeorology research and urban planning. Sustain. Cities Soc. 2022, 81, 103852. [Google Scholar] [CrossRef]
- Yao, R.; Zhang, S.; Du, C.; Schweiker, M.; Hodder, S.; Olesen, B.W.; Toftum, J.; D’Ambrosio, F.R.; Gebhardt, H.; Zhou, S.; et al. Evolution and performance analysis of adaptive thermal comfort models—A comprehensive literature review. Build. Environ. 2022, 217, 109020. [Google Scholar] [CrossRef]
- Coccolo, S.; Kämpf, J.; Scartezzini, J.-L.; Pearlmutter, D. Outdoor human comfort and thermal stress: A comprehensive review on models and standards. Urban Clim. 2016, 18, 33–57. [Google Scholar] [CrossRef]
- Zhang, Y.; Liu, C. Digital Simulation for Buildings’ Outdoor Thermal Comfort in Urban Neighborhoods. Buildings 2021, 11, 541. [Google Scholar] [CrossRef]
- Jendritzky, G.; Maarouf, A.; Fiala, D.; Staiger, H. An update on the development of a Universal Thermal Climate Index. In Proceedings of the 15th Conference on Biometeorology/Aerobiology and 16th International Congress of Biometeorology, Kansas City, MO, USA, 29 October 2002. [Google Scholar]
- Kumar, P.; Sharma, A. Study on importance, procedure, and scope of outdoor thermal comfort—A review. Sustain. Cities Soc. 2020, 61, 102297. [Google Scholar] [CrossRef]
- Fischereit, J.; Schlünzen, K.H. Evaluation of thermal indices for their applicability in obstacle-resolving meteorology models. Int. J. Biometeorol. 2018, 62, 1887–1900. [Google Scholar] [CrossRef] [Green Version]
- Yu, H.; Fukuda, H. A Review of Outdoor Thermal Comfort Indices in Northern China (Urban Built Environment beyond the Global Pandemic). In Proceedings of the 17th International Conference of Asia Institute of Urban Environment, Virtual, 19–20 December 2020; pp. 177–180. [Google Scholar]
- Xu, M.; Hong, B.; Mi, J.; Yan, S. Outdoor thermal comfort in an urban park during winter in cold regions of China. Sustain. Cities Soc. 2018, 43, 208–220. [Google Scholar] [CrossRef]
- Tian, Y.; Hong, B.; Zhang, Z.; Wu, S.; Yuan, T. Factors influencing resident and tourist outdoor thermal comfort: A comparative study in China’s cold region. Sci. Total Environ. 2022, 808, 152079. [Google Scholar] [CrossRef] [PubMed]
- Ozarisoy, B.; Altan, H. Regression forecasting of ‘neutral’ adaptive thermal comfort: A field study investigation in the south-eastern Mediterranean climate of Cyprus. Build. Environ. 2021, 202, 108013. [Google Scholar] [CrossRef]
- Chen, Q.; Lin, C.; Guo, D.; Hou, Y.; Lai, D. Studies of outdoor thermal comfort in northern China. Build. Environ. 2014, 77, 110–118. [Google Scholar]
- Yang, J.; Hu, X.; Feng, H.; Marvin, S. Verifying an ENVI-met simulation of the thermal environment of Yanzhong Square Park in Shanghai. Urban For. Urban Green. 2021, 66, 127384. [Google Scholar] [CrossRef]
- Al-Bdour, M.; Baranyai, B. An overview of microclimate tools for predicting the thermal comfort, meteorological parameters and design strategies in outdoor spaces. Pollack Period. 2019, 14, 109–118. [Google Scholar] [CrossRef]
- Tsoka, S.; Tsikaloudaki, A.; Theodosiou, T. Analyzing the ENVI-met microclimate model’s performance and assessing cool materials and urban vegetation applications–A review. Sustain. Cities Soc. 2018, 43, 55–76. [Google Scholar] [CrossRef]
- Sodoudi, S.; Zhang, H.; Chi, X.; Müller, F.; Li, H. The influence of spatial configuration of green areas on microclimate and thermal comfort. Urban For. Urban Green. 2018, 34, 85–96. [Google Scholar] [CrossRef]
- de Freitas, W.K.; Magalhães, L.M.S.; de Santana, C.A.A.; Junior, E.R.P.; de Souza, L.D.C.M.; Toledo, R.A.B.; Garção, B.R. Tree composition of urban public squares located in the Atlantic Forest of Brazil: A systematic review. Urban For. Urban Green. 2020, 48, 126555. [Google Scholar] [CrossRef]
- Morakinyo, T.E.; Kong, L.; Lau, K.K.L.; Yuan, C.; Ng, E. A study on the impact of shadow-cast and tree species on in-canyon and neighborhood’s thermal comfort. Build. Environ. 2017, 115, 1–17. [Google Scholar] [CrossRef]
- Morakinyo, T.E.; Lam, Y.F. Simulation study on the impact of tree-configuration, planting pattern and wind condition on street-canyon’s micro-climate and thermal comfort. Build. Environ. 2016, 103, 262–275. [Google Scholar] [CrossRef]
- Hong, B.; Lin, B.; Qin, H. Numerical investigation on the coupled effects of building-tree arrangements on fine particulate matter (PM2.5) dispersion in housing blocks. Sustain. Cities Soc. 2017, 34, 358–370. [Google Scholar] [CrossRef]
- Spearman’s Rank Correlation Coefficient. 1988. Available online: https://en.wikipedia.org/wiki/Spearman%27s_rank_correlation_coefficient (accessed on 5 May 2022).
- Gauthier, T.D. Detecting trends using Spearman’s rank correlation coefficient. Environ. Forensics 2001, 2, 359–362. [Google Scholar] [CrossRef]


| Item | AT (°C) | RH (%) | WS (m/s) | Hours of Daylight (h) |
|---|---|---|---|---|
| Avg | 15.5 | 61 | 2.1 | 12 |
| Min | −10.0 | 19 | 0.1 | 9 |
| Max | 38.5 | 88 | 9 | 14 |
| Variable | Sensor | Accuracy | Range | Interval | Mode |
|---|---|---|---|---|---|
| Anemoscope | DS-2 | ±0.3 m/s | 0–70 m/s | 1 min | Automatic |
| Air temperature | TR-72wf | ±0.5 °C | 0–±55 °C | 1 min | Automatic |
| Relative humidity | TR-72wf | ±5% | 10–95% | 1 min | Automatic |
| Parameters | Values Used |
|---|---|
| Simulation Date | 28 July 2020 |
| Simulation Time | 2:00 a.m.–6:00 p.m. |
| Total Simulation Time | 18 h |
| Simulation Level | Intermediate |
| Boundary Condition | Simple Forcing |
| Wind Speed at 10 m | 4 m/s |
| Wind Direction | 45 Northeaster |
| Roughness Length | 0.01 |
| Initial Air Temperature Range | Modified weather station data |
| Initial Relative Humidity Range | Modified weather station data |
| Thermal Sensation | PET Range (°C) |
|---|---|
| Very cold | <−16 |
| Cold | −16 to −11 |
| Cool | −11 to −6 |
| Slightly cool | −6 to 11 |
| Neutral | 11 to 24 |
| Slightly warm | 24 to 31 |
| Warm | 31 to 36 |
| Hot | 36 to 46 |
| Very hot | >46 |
| Variable Xi | Rank xi | di |
|---|---|---|
| 45.55 | 4 | 4 |
| 45.92 | 3 | 3 |
| 48 | 2 | 2 |
| 48.22 | 1 | 1 |
| 42.4 | 5 | 5 |
Publisher’s Note: MDPI stays neutral with regard to jurisdictional claims in published maps and institutional affiliations. |
© 2022 by the authors. Licensee MDPI, Basel, Switzerland. This article is an open access article distributed under the terms and conditions of the Creative Commons Attribution (CC BY) license (https://creativecommons.org/licenses/by/4.0/).
Share and Cite
Yu, H.; Fukuda, H.; Zhou, M.; Ma, X. Improvement Strategies for Microclimate and Thermal Comfort for Urban Squares: A Case of a Cold Climate Area in China. Buildings 2022, 12, 944. https://doi.org/10.3390/buildings12070944
Yu H, Fukuda H, Zhou M, Ma X. Improvement Strategies for Microclimate and Thermal Comfort for Urban Squares: A Case of a Cold Climate Area in China. Buildings. 2022; 12(7):944. https://doi.org/10.3390/buildings12070944
Chicago/Turabian StyleYu, Haiming, Hiroatsu Fukuda, Mengyuan Zhou, and Xuan Ma. 2022. "Improvement Strategies for Microclimate and Thermal Comfort for Urban Squares: A Case of a Cold Climate Area in China" Buildings 12, no. 7: 944. https://doi.org/10.3390/buildings12070944