1. Introduction
The outdoor thermal environment has received noticeable attention, especially in major cities due to global climate change [
1] and rapid urbanization [
2]. According to the statistics, 165 thermal indices have been developed all over the world to assess the thermal conditions for humans [
3]. As a result, some indices such as the predicted mean vote (PMV) [
4], physiologically equivalent temperature (PET) [
5], standard effective temperature (SET*) [
6], and universal thermal climate index (UTCI) [
7] are widely used for outdoor thermal perception studies. Furthermore, a deep learning artificial intelligence model for predicting the thermal performance of evaporative cooling systems was developed in a recent study [
8]. However, the zone of thermal comfort is subject to geography and seasonality [
9]. Hence, it is essentially important to define human comfort according to unified bioclimatic criteria while taking into account the local thermal perception [
10,
11].
The thermal neutral range, thermal acceptable range, and thermal comfort range are commonly determined in empirical studies to understand people’s thermal perception [
12]. These ranges of the thermal indices ideally must be regionally adjusted based on subjective votes obtained from on-site surveys [
13]. A review paper pointed out that the thermal neutral ranges in hot-humid regions based on 31 calibration studies were 21.0~30.0 °C for PET and 19.7~28.5 °C for UTCI [
14]. Valuable references could be offered by these ranges for urban planners and designers to develop strategies to optimize the outdoor thermal environment to meet the user requirements [
15]. Another review article based on different climatic zones found that for the PET index, the thermal neutral range for hot climates of 24~26 °C was agreed upon by 95% of the studies, whereas for cold climates, the range of 15~20 °C was agreed upon by 89% of the studies, and there is no interfacing between the agreed neutral sensation of the cold zones and the hot zones [
3]. From this point of view, seasonal differences in the ranges of outdoor thermal perception should be given more attention.
Outdoor thermal perception is a complex physical, physiological, and psychological adaptation [
16,
17]. It can be affected by a wide range of parameters. Above all, environmental factors play the most important role in thermal perception. However, it has been revealed that microclimatic parameters contribute only approximately 50% of the variation between objective and subjective comfort evaluations [
18]. Personal parameters such as gender and age were also examined. Some studies have found that gender has a significant impact on thermal perception [
19,
20]. However, another study identified the gender effects to be insignificant, whereas age was an important variable [
21]. In addition, psychological factors such as naturalness, experience, perceived control, time of exposure, environmental stimulation, and expectations have been tested [
18]. As a result, adaptive models are always formulated to reveal the main parameters that influence outdoor thermal perception [
22,
23,
24,
25]. Although the application of these models is very rare, they can complement existing knowledge and help us better understand outdoor thermal perception.
A broad scope is available to quantify the outdoor thermal environment and make the outdoor spaces usable to society, which would promote sustainable development [
14]. As a developing country with rapid urbanization and diverse climates, China is trying to solve the increasingly prominent contradiction between the deterioration of the urban climate and the people’s pursuit of a healthy and comfortable outdoor environment. Therefore, outdoor thermal perception in specific regions has been a focus of researchers across the nation in recent years. Different types of modified thermal neutral ranges have been obtained from the region of hot summer and cold winter (HSCW), according to the China building climate demarcation. In terms of PET, the thermal neutral range in Changsha is 24~31 °C for summer [
26] and 15~22 °C for the whole year [
27]. This reminds us to pay attention to the seasonal difference in the outdoor thermal perception ranges once again. Important studies in Shanghai include Chen et al. [
28], Yao et al. [
29], and Xue et al. [
30]. These provide extensive knowledge of people’s thermal perception in the outdoor spaces of Shanghai. Unfortunately, the discussion of the thermal perception ranges of Shanghai is mainly on a single season, and there is still a lack of research specifically mentioning the thermal perception ranges for each season to determine the bias pattern of thermal perception ranges in Shanghai.
This paper hypothesizes that in the region of hot summer and cold winter, predicting the thermal comfort of outdoor space requires multi-seasonal research. The research described in this paper, therefore, employs meteorological data (air temperature, relative humidity, wind speed, and solar radiation) combined with a questionnaire survey of users on two squares to examine outdoor thermal perception in three seasons as well as the effects of microclimate and human parameters on it. The results should serve to inform future local outdoor thermal comfort standards and the establishment of government thermal comfort guidelines, leading to more human- and comfort-centered future urban development in China.
2. Materials and Methods
2.1. Study Area Overview
Shanghai, a mega-city with a resident population of 24,870,900 people [
31], is located in the eastern coastal region of China and has a subtropical monsoon climate, which is representative of mid-latitude cities in terms of meteorological conditions. Spring and autumn are short, summer and winter are long, and the annual average temperature is 17 °C. The temperature in January is the lowest, with an average temperature of 4 °C, where the temperatures in July and August is the highest, with an average temperature of 28 °C.
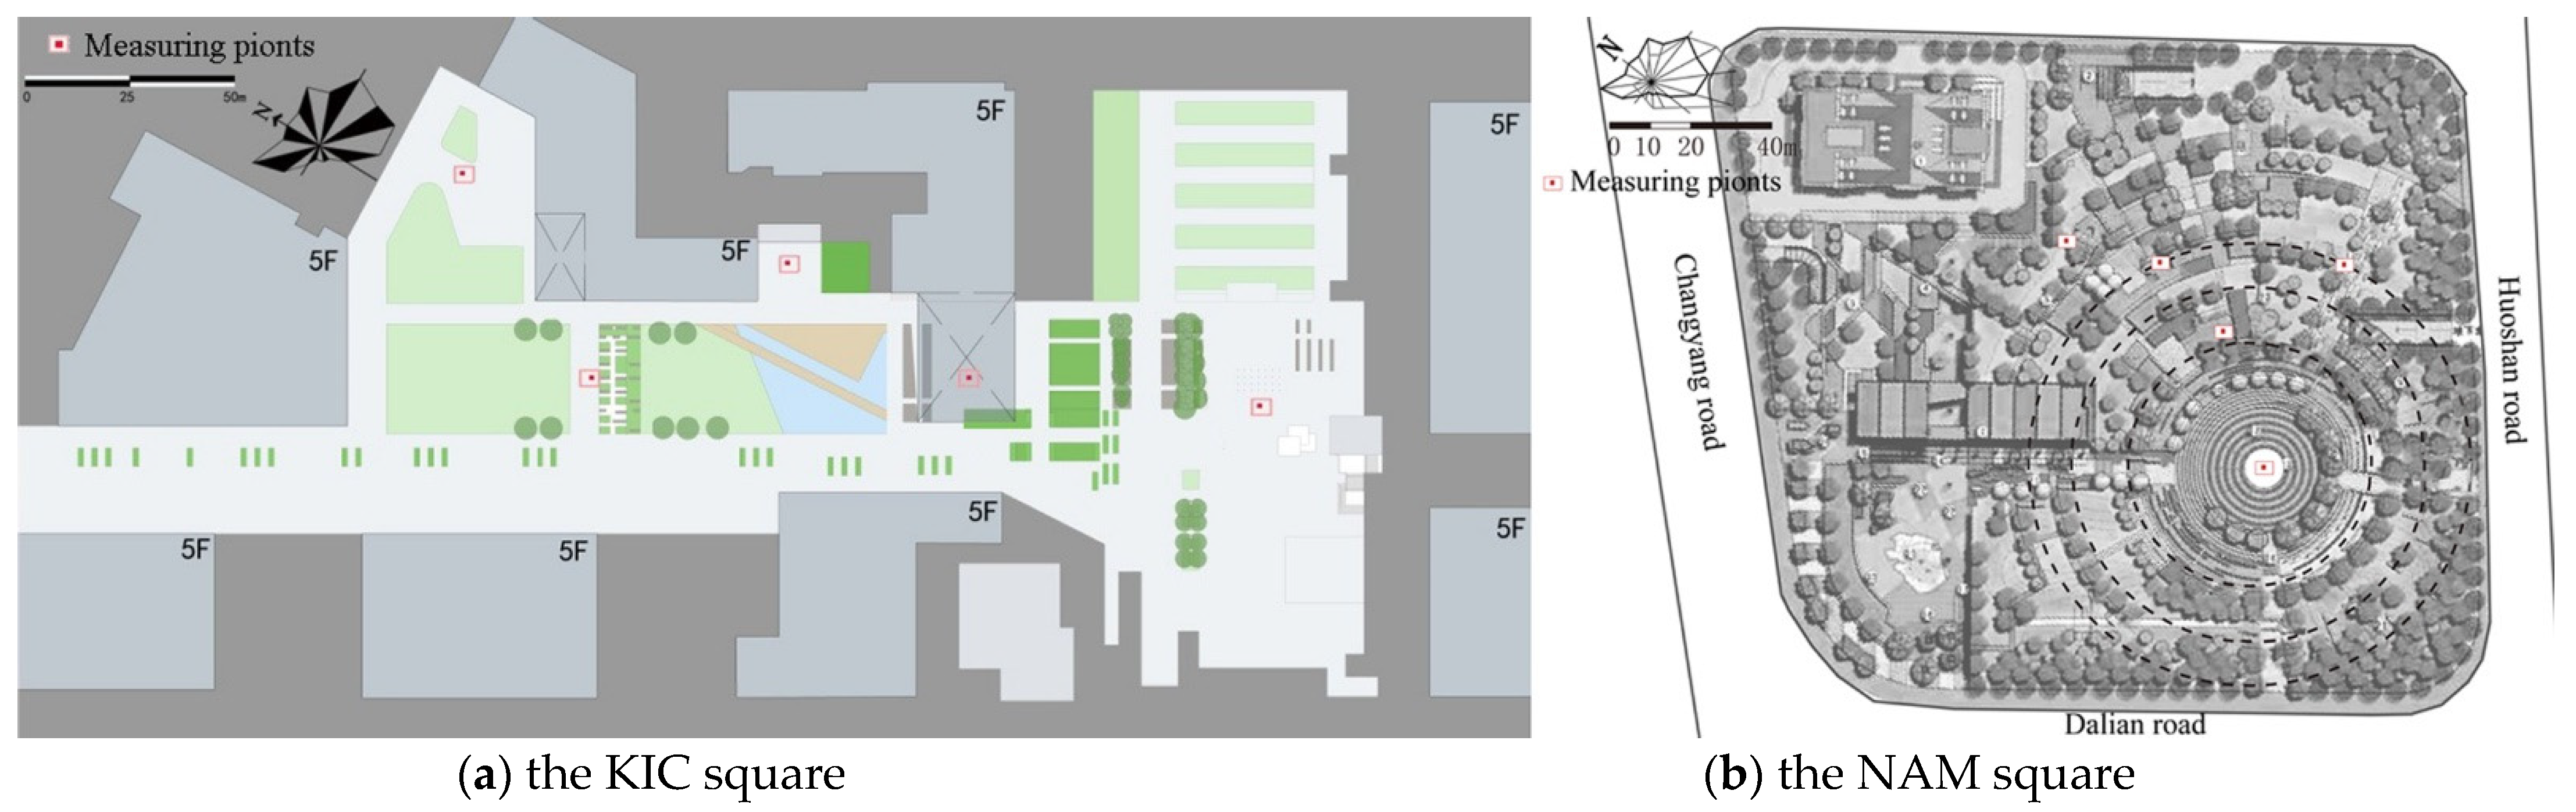
Two urban squares (i.e., the Knowledge & Innovation Community (KIC) square enclosed by buildings and the National Anthem Memorial (NAM) square covered by trees) were selected as experimental sites. Both squares are located in Yangpu District, which has a similar urban texture and local climate. The KIC square is T-shaped, with a total area of about 1.5 hm2. The square sink is 4 m, and the surrounding commercial office buildings are approximately 25 m high. The KIC square takes simple and smooth geometric lines as its basic elements. Linear tree arrays, long benches, geometric waterscapes, stepped lawns and an architectural overhang provide people with vibrant and open leisure places. The NAM square is surrounded by urban roads, with a total area of 2.7 hm2. A 12 m high national flag-themed sculpture stands at the edge of the circular site in the center of the square. The arbor coverage of the NAM square exceeded 60%, attracting many surrounding residents to come for leisure and exercise.
2.2. Micrometeorological Measurement
The microclimate parameters include air temperature (Ta), relative humidity (RH), wind speed (WS), and solar radiation (SR). The Watchdog 2000 meteorological station was placed at a height of 1.1 m [
32] from the ground with the aid of a tripod. As shown in
Figure 1, the measurements were performed at five different sites in each square, with a total of ten measuring points. Their selection criteria were based on different microclimatic characteristics (i.e., shaded, semi-shaded, unshaded areas) and the daily number of people visiting the place.
Due to the similar climatic conditions in spring and autumn, this study was conducted in summer, autumn, and winter, from the hottest month (July, 2016) to the coldest month (January, 2017). As shown in
Table 1, the summer experiment lasted for 15 days, the autumn experiment lasted for 9 days, and the winter experiment lasted for 10 days. Days of measuring excluded rain and presented usually clear-sky conditions. Measurements were taken from 7:00 in the morning, and the end time was 18:30 in summer, 18:00 in autumn, and 17:30 in winter.
2.3. Questionnaire Survey
The questionnaire was carried out in parallel with micrometeorological measurements. The interviews were conducted with randomly selected people who were passing by or visiting the measurement sites. In particular, the time of residency was used as a criterion for exclusion when the value was lower than 1 year.
The questionnaire was divided into three parts and could be completed in approximately 3 min. The first part was about the thermal perceptions including thermal sensation and thermal comfort, whereas the second part concerned the interviewees’ perception of air temperature, relative humidity, wind speed, and solar radiation. The third part investigated the interviewees’ personal parameters (height, weight, age, gender, clothing, length of outdoor activities, and activity status).
For the evaluation of thermal sensation, the so-called ISO 10551 (1995) 9-point scale [
33] was used (very cold (−4), cold (−3), cool (−2), slightly cool (−1), neutral (0), slightly warm (1), warm (2), hot (3), and very hot (4)), while for thermal comfort, the 4-point break scale [
34] (very uncomfortable (−2), uncomfortable (−1), comfortable (1), and very comfortable (2)) was used to help the interviewees make a clear choice.
2.4. PET Analysis
PET, expressed in degrees Celsius, is defined as the temperature corresponding to the human skin temperature and body temperature reaching the same thermal state as the typical indoor environment in a certain indoor or outdoor environment [
5]. Since it is considered the most widely used objective evaluation index with the highest frequency of up to 30.4% [
3], it will provide common protocols for a comparison between different studies. Hence, PET was chosen for the analysis of outdoor thermal perception in this study.
The PET value was calculated by Rayman software [
35], with input time–space values (longitude, latitude, and altitude), microclimate parameters (air temperature, relative humidity, wind speed, and solar radiation), and personal factors (gender, height, weight, clothing, and metabolism) [
36].
3. Results and Discussion
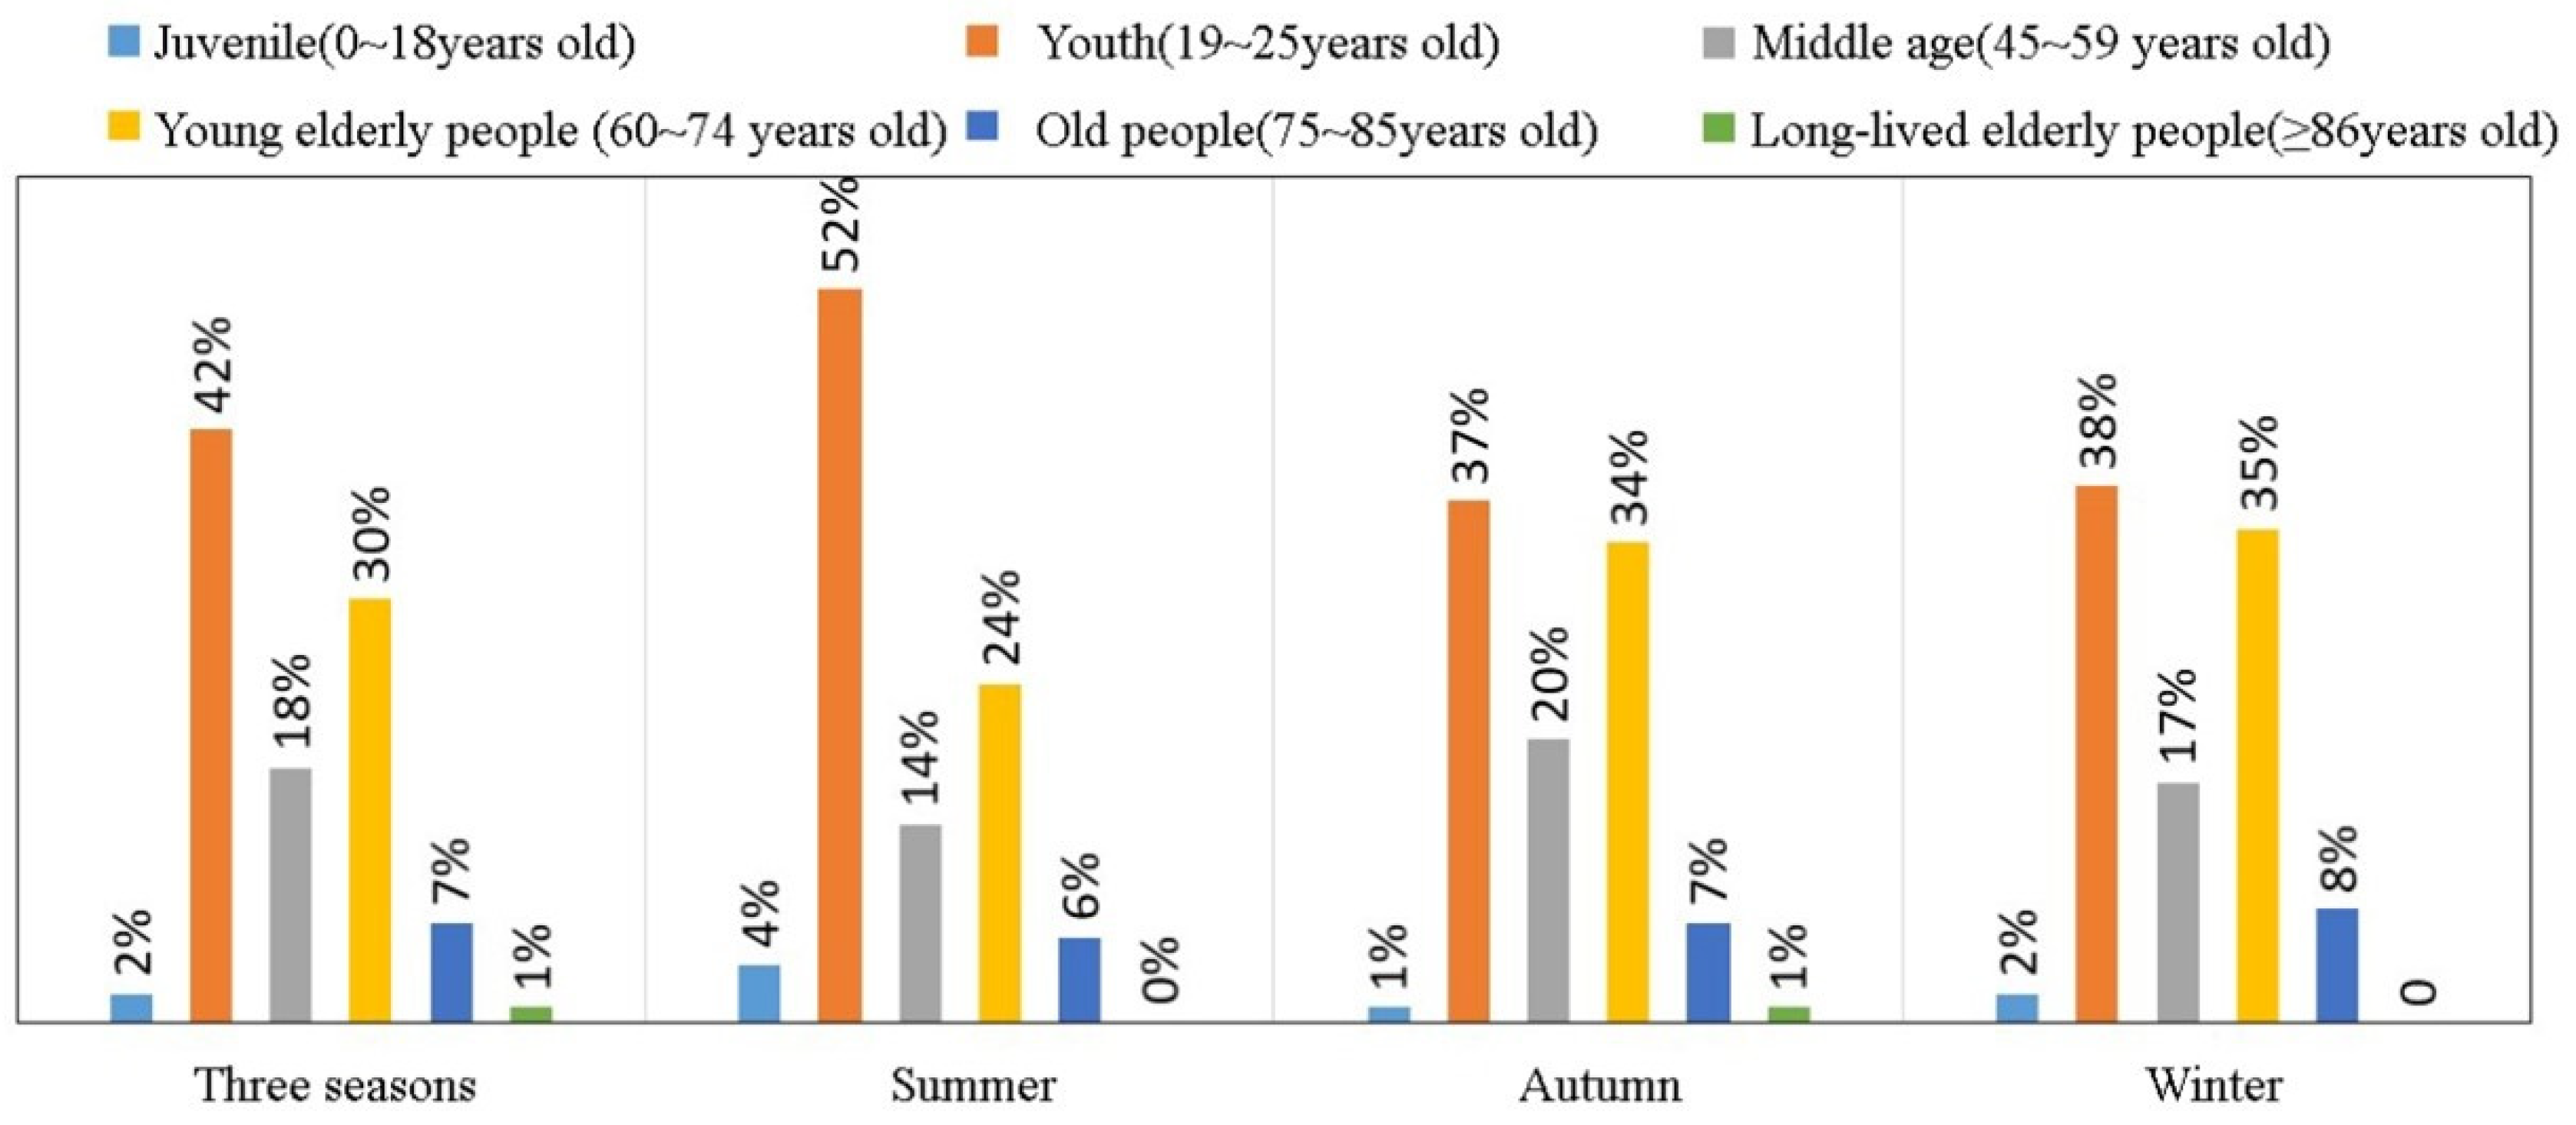
A total of 1748 valid questionnaires were collected, of which 564 were in summer, 684 were in autumn, and 500 were in winter. In terms of gender, the proportions of men and women were similar in every season. In terms of age, the youngest respondent was 10 years old and the largest respondent was 92 years old. From
Figure 2, it was observed that more than 90% of the sample were aged 19~74 years.
The interviews were conducted over a wide range of temperatures (0~36.6 °C), relative humidities (11~97%), wind speeds (0~3.1 m/s), and solar radiations (0~1047 w/m
2). This wide fluctuation in climate conditions corresponded to the typical weather patterns in Shanghai.
Table 2 summarizes the mean, maximum, and minimum values of the four microclimate parameters corresponding to the questionnaire survey in different seasons. From summer to winter, the average values of temperature, wind speed, and relative humidity decreased. However, the average value of solar radiation showed an increasing trend. It is worth noting that the average solar radiation in summer was only 89 w/m
2 because most of the questionnaires in summer occurred in shaded spaces or in the periods with low solar radiation in the morning or afternoon.
3.1. Thermal Sensation Votes and Thermal Comfort Votes
3.1.1. Thermal Sensation Votes
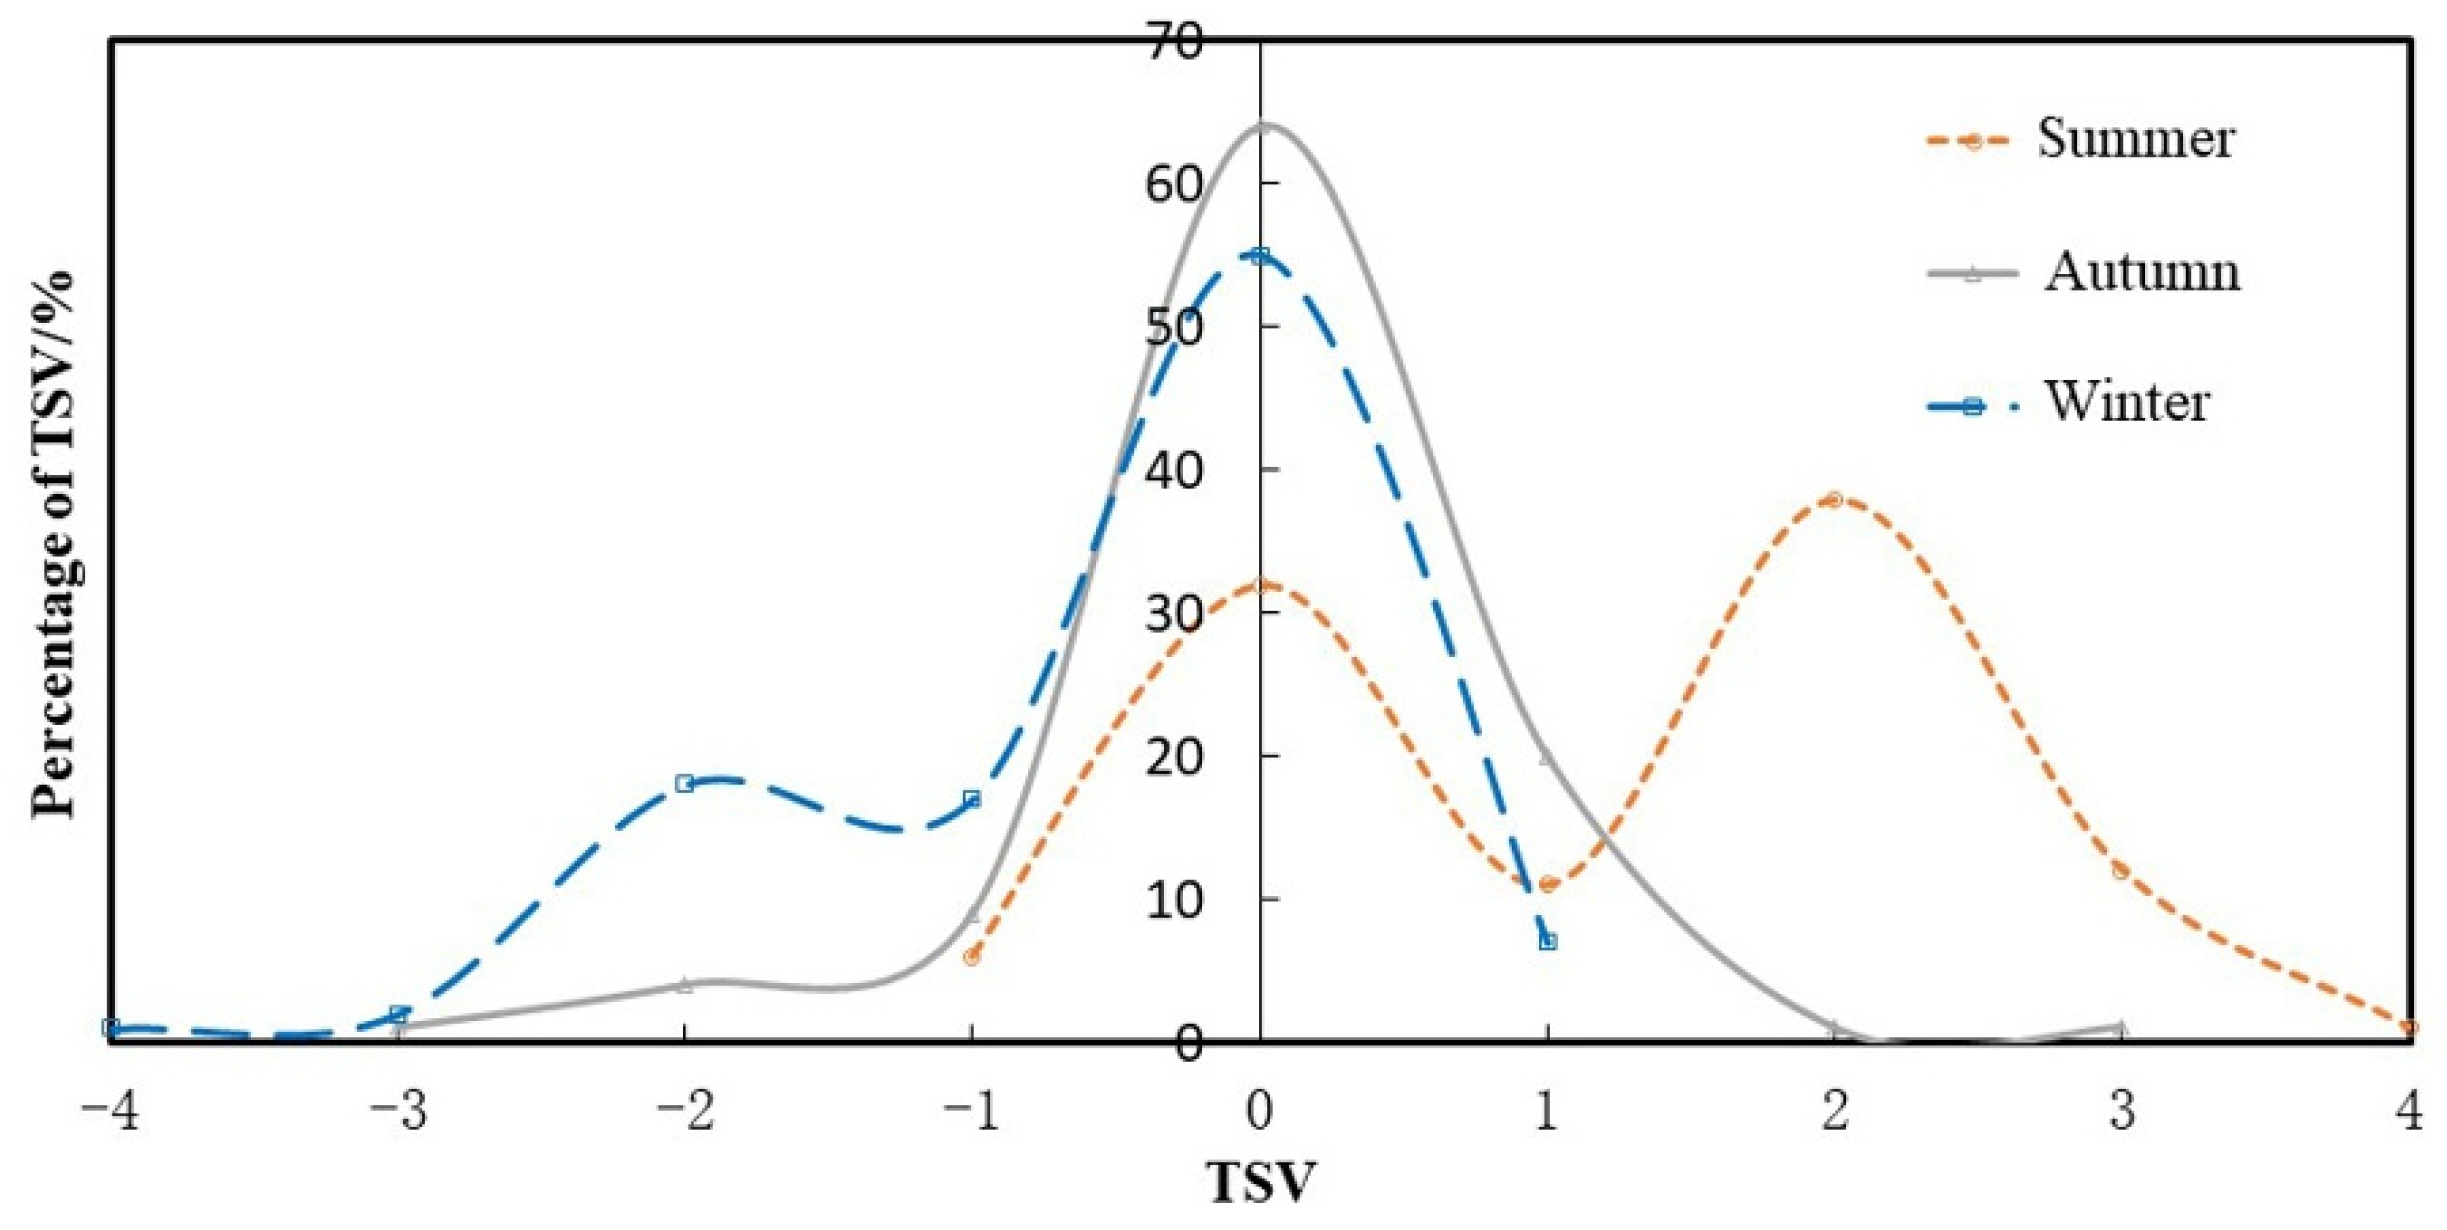
The TSV covered the entire range of the 9-point scale. As shown in
Figure 3, in summer, 61% of the responses ranged from +2 to +4; in autumn, 93% ranged from −1 to +1; and in winter, only 21% of the votes ranged from −2 to −4. The percentage of interviewees whose thermal sensation was ‘neutral’ (TSV = 0) was the highest in autumn (64%), followed by winter (55%), and the lowest in summer (32%). The results agree with the common knowledge that people become more adapted to coldness in the cold season.
3.1.2. Thermal Comfort Votes
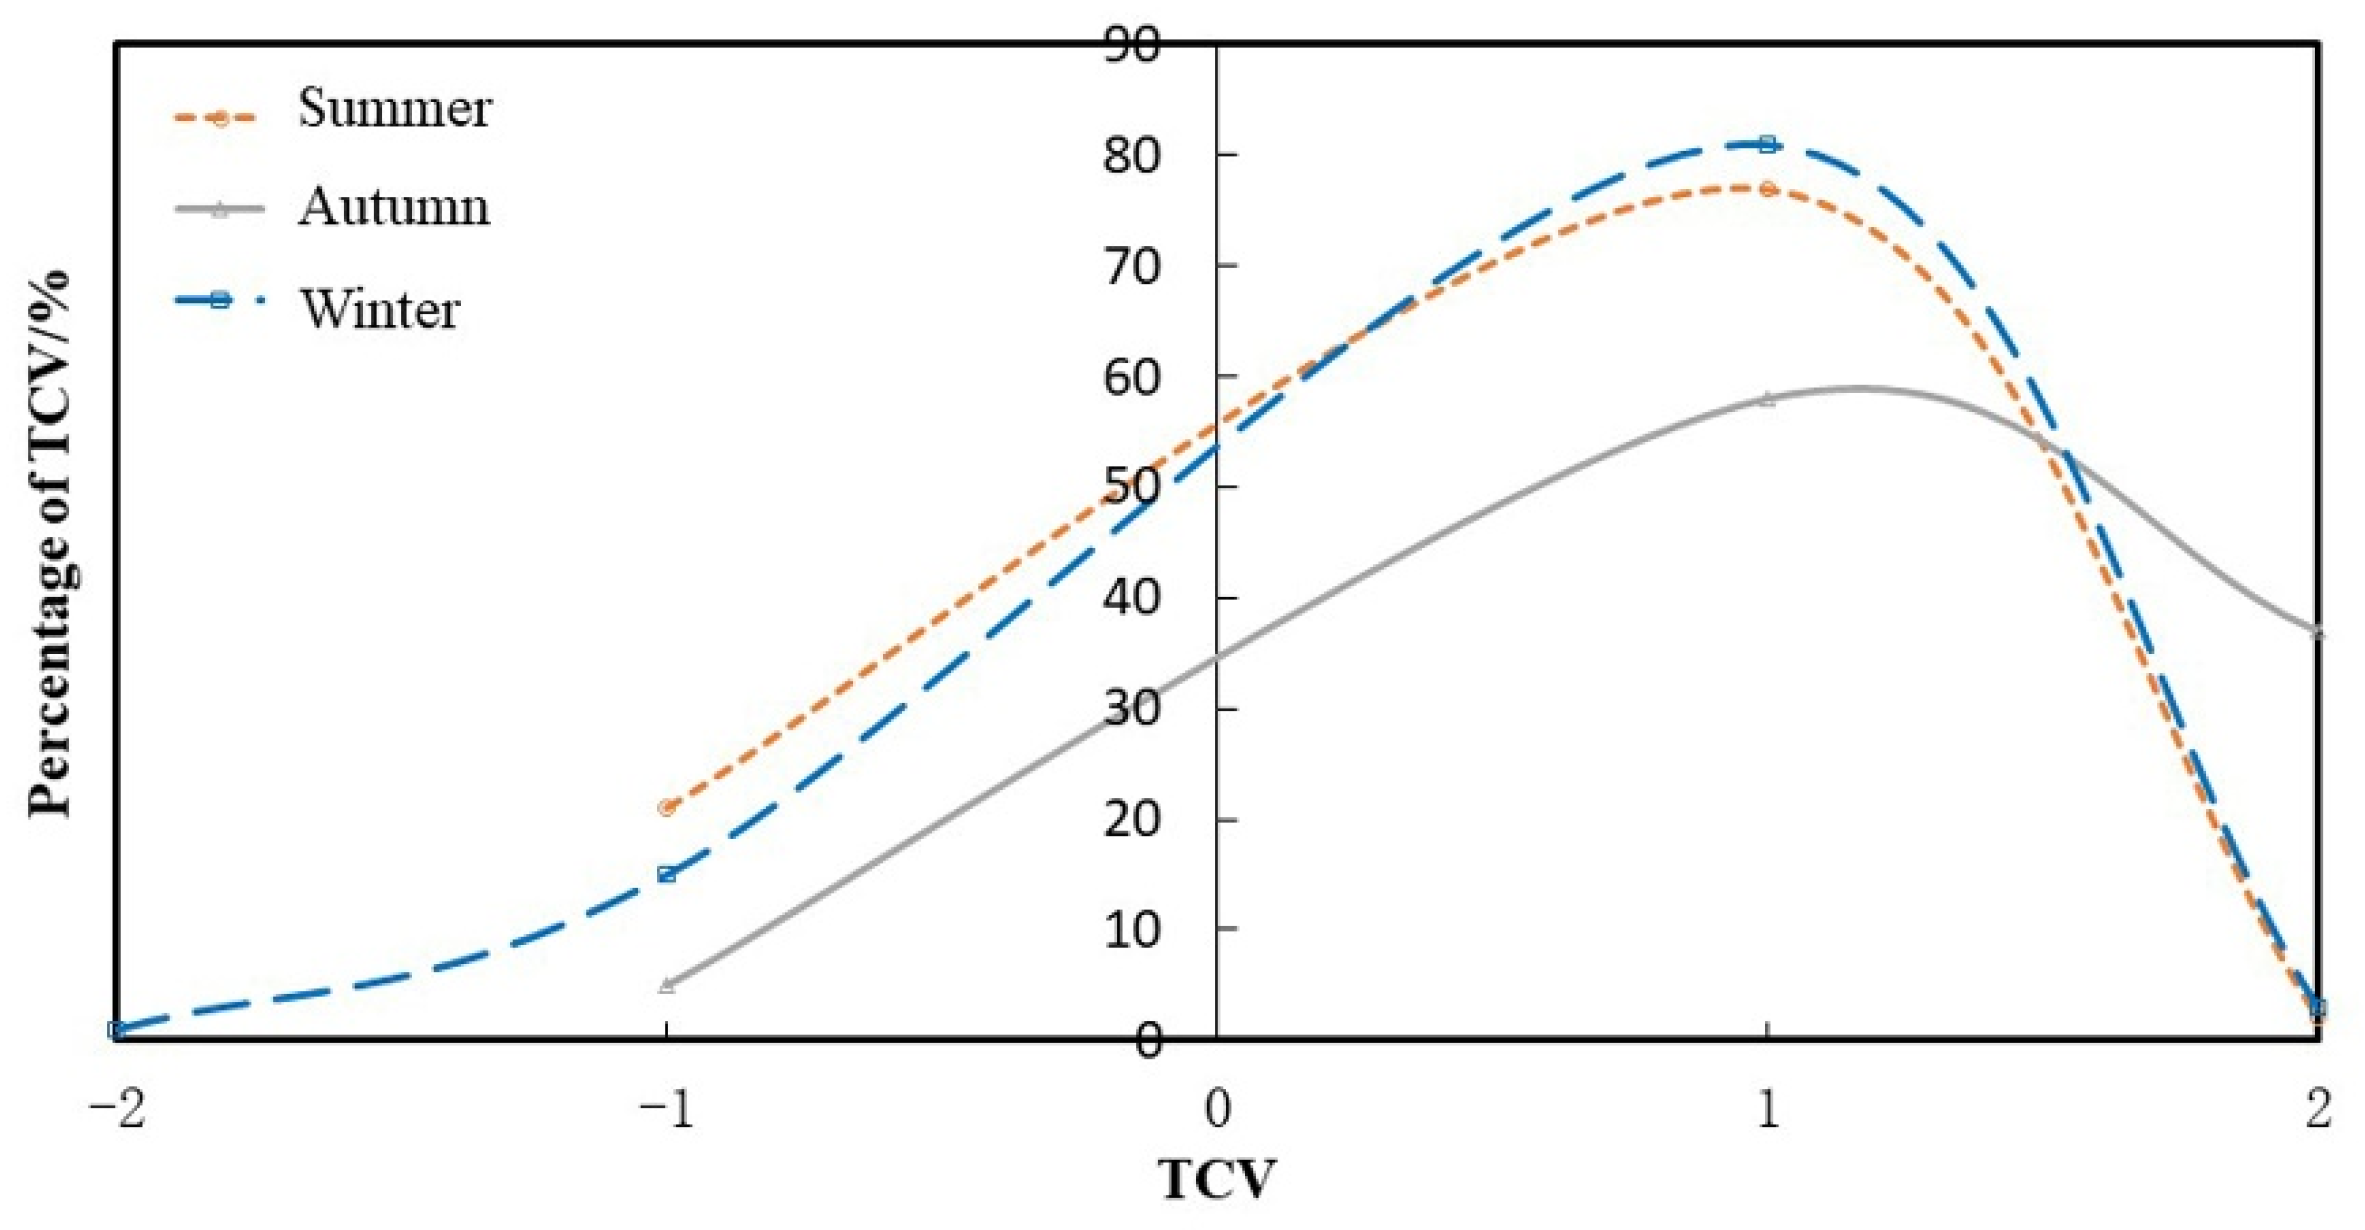
Figure 4 shows the percentage distribution of the thermal comfort votes (TCV). In summer, 73% of the respondents felt comfortable (TCV > 0), and only 27% of them felt uncomfortable (TCV < 0); in autumn, 95% of the respondents felt comfortable, and only 5% of them felt uncomfortable; in winter, 84% of the respondents felt comfortable, and only 16% of them felt uncomfortable. It can be inferred that the two squares have the worst thermal comfort in summer.
3.2. Thermal Neutral Ranges and Thermal Comfort Ranges
The interviewees’ thermal perceptions were characterized by TSV and TCV, and the objective estimation of their thermal comfort level was calculated by PET. The regression method was applied to determine the thermal neutral range and thermal comfort range.
3.2.1. Thermal Neutral Ranges
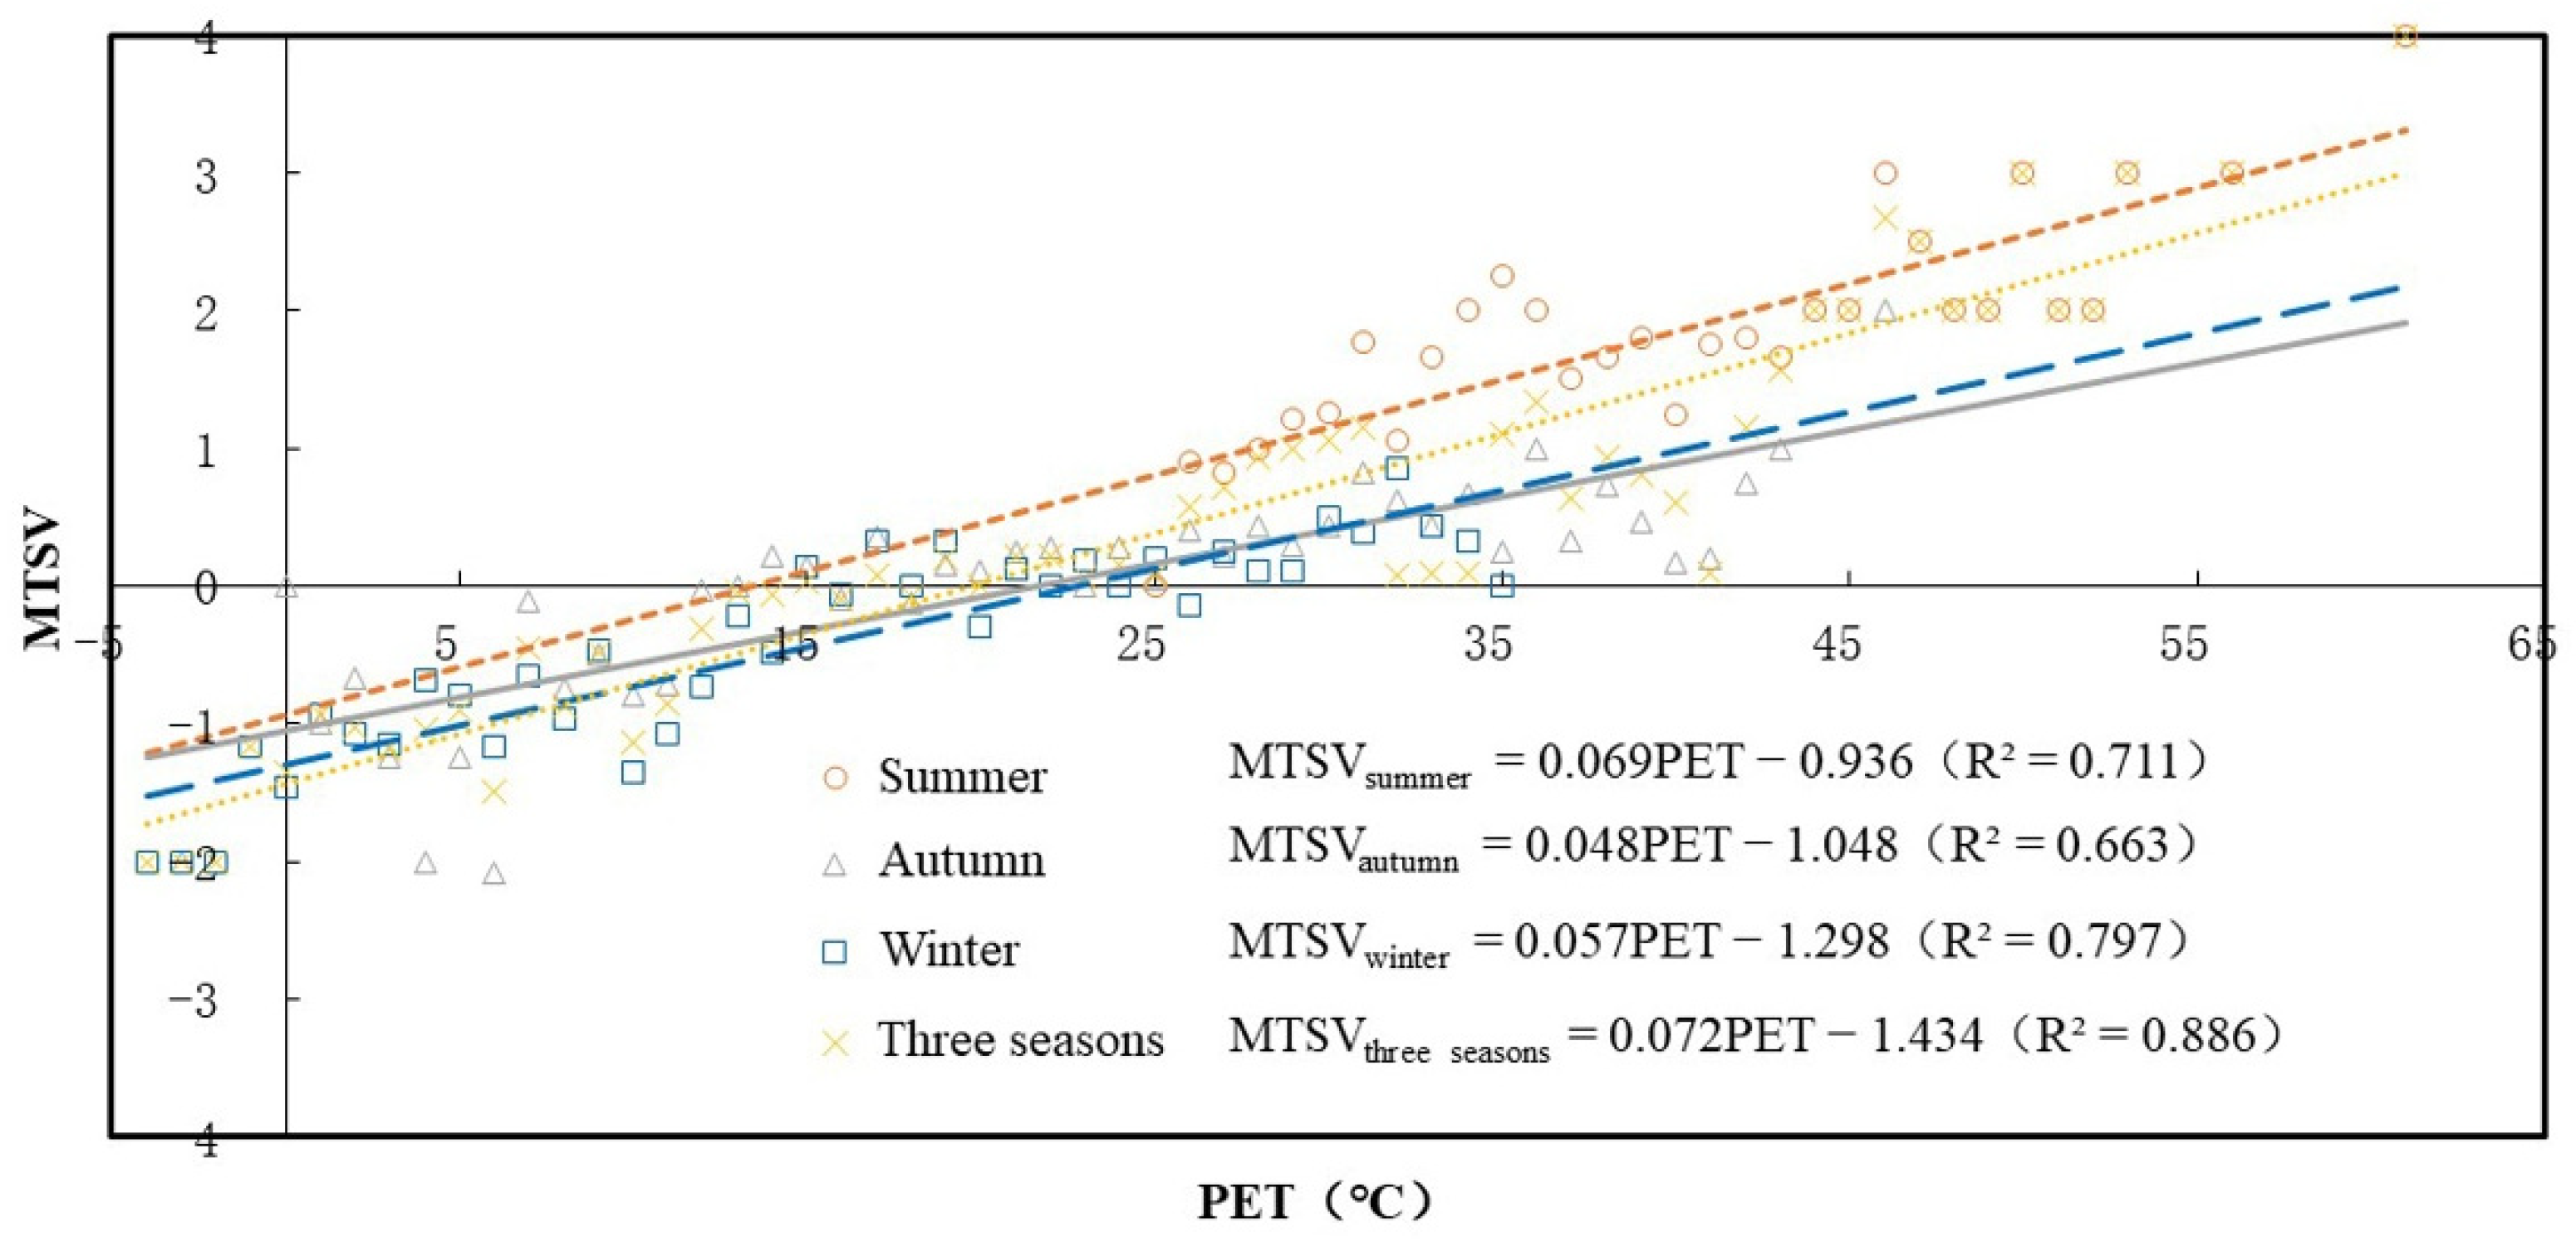
A large number of studies have used a linear regression between binned mean thermal sensation votes (MTSV) and PET to quantify the thermal neutral range [
37,
38,
39]. The PET was divided into data bins of 1 °C interval, and the MTSV was calculated for each bin. As shown in
Figure 5, the regression coefficients were 0.069 in summer, 0.048 in autumn, and 0.057 in winter. Accordingly, the PET values corresponding to the unit change in TSV were 14.5 °C in summer, 20.8 °C in autumn, and 17.6 °C in winter. Obviously, the larger the regression coefficient, the smaller the change in the PET value corresponding to the unit TSV. Hence, it could be observed that the change in the TSV of interviewees was the most sensitive in summer.
Thermal neutral value, also called “thermal neutrality”, is defined as the thermal condition at which people feel neither cool nor warm [
4]. That is, the corresponding PET value when MTSV is equal to 0. By calculation, thermal neutrality (
n = 1748) across all seasons corresponds to a PET value of 19.9 °C. Additionally, a seasonal analysis of the thermal responses revealed that thermal neutrality corresponded to a PET of 13.6 °C in summer, 21.8 °C in autumn, and 22.8 °C in winter. Seasonal differences in thermal neutrality have been confirmed [
40,
41], and the thermal neutrality in this study also changes seasonally. The thermal neutrality in summer is lower than that in winter, which reflects that in the hot season, a cooler sensation was considered to be more comfortable than a warm sensation, and vice versa in the cold season. This finding verifies that synesthesia [
42] plays an important role in thermal psychological perception.
The thermal neutral range is associated with a thermal neutral sensation. It is assumed that the neutral range of the 9-point scale equals the TSV from −0.5 to + 0.5 [
27]. The regression results show that the thermal neutral ranges were 6.4~20.8 °C in summer, 11.4~32.2 °C in autumn, 14~31.6 °C in winter, and 13~26.8 °C in the three seasons. The thermal neutral range of this study in winter (PET 14~32 °C) was slightly wider than that obtained in Shanghai Fuxing Park (PET 15~29 °C) [
28]. Furthermore, the thermal neutral range of the three seasons (PET 13~27 °C) in this study was still wider than that of Changsha (PET 15~22 °C) [
27], which is also a hot summer and cold winter region. The wider PET ranges demonstrated a higher tolerance to variations in the outdoor thermal conditions among the respondents.
3.2.2. Thermal Comfort Ranges
The majority of studies regarded thermal neutrality (−0.5 ≤ TSV ≦ 0.5) as thermal comfort [
27,
28,
41]. However, the thermal sensation is mainly the response of skin receptors under cold and hot stimulation, while thermal comfort is generated by the integrated excitation of various receptors [
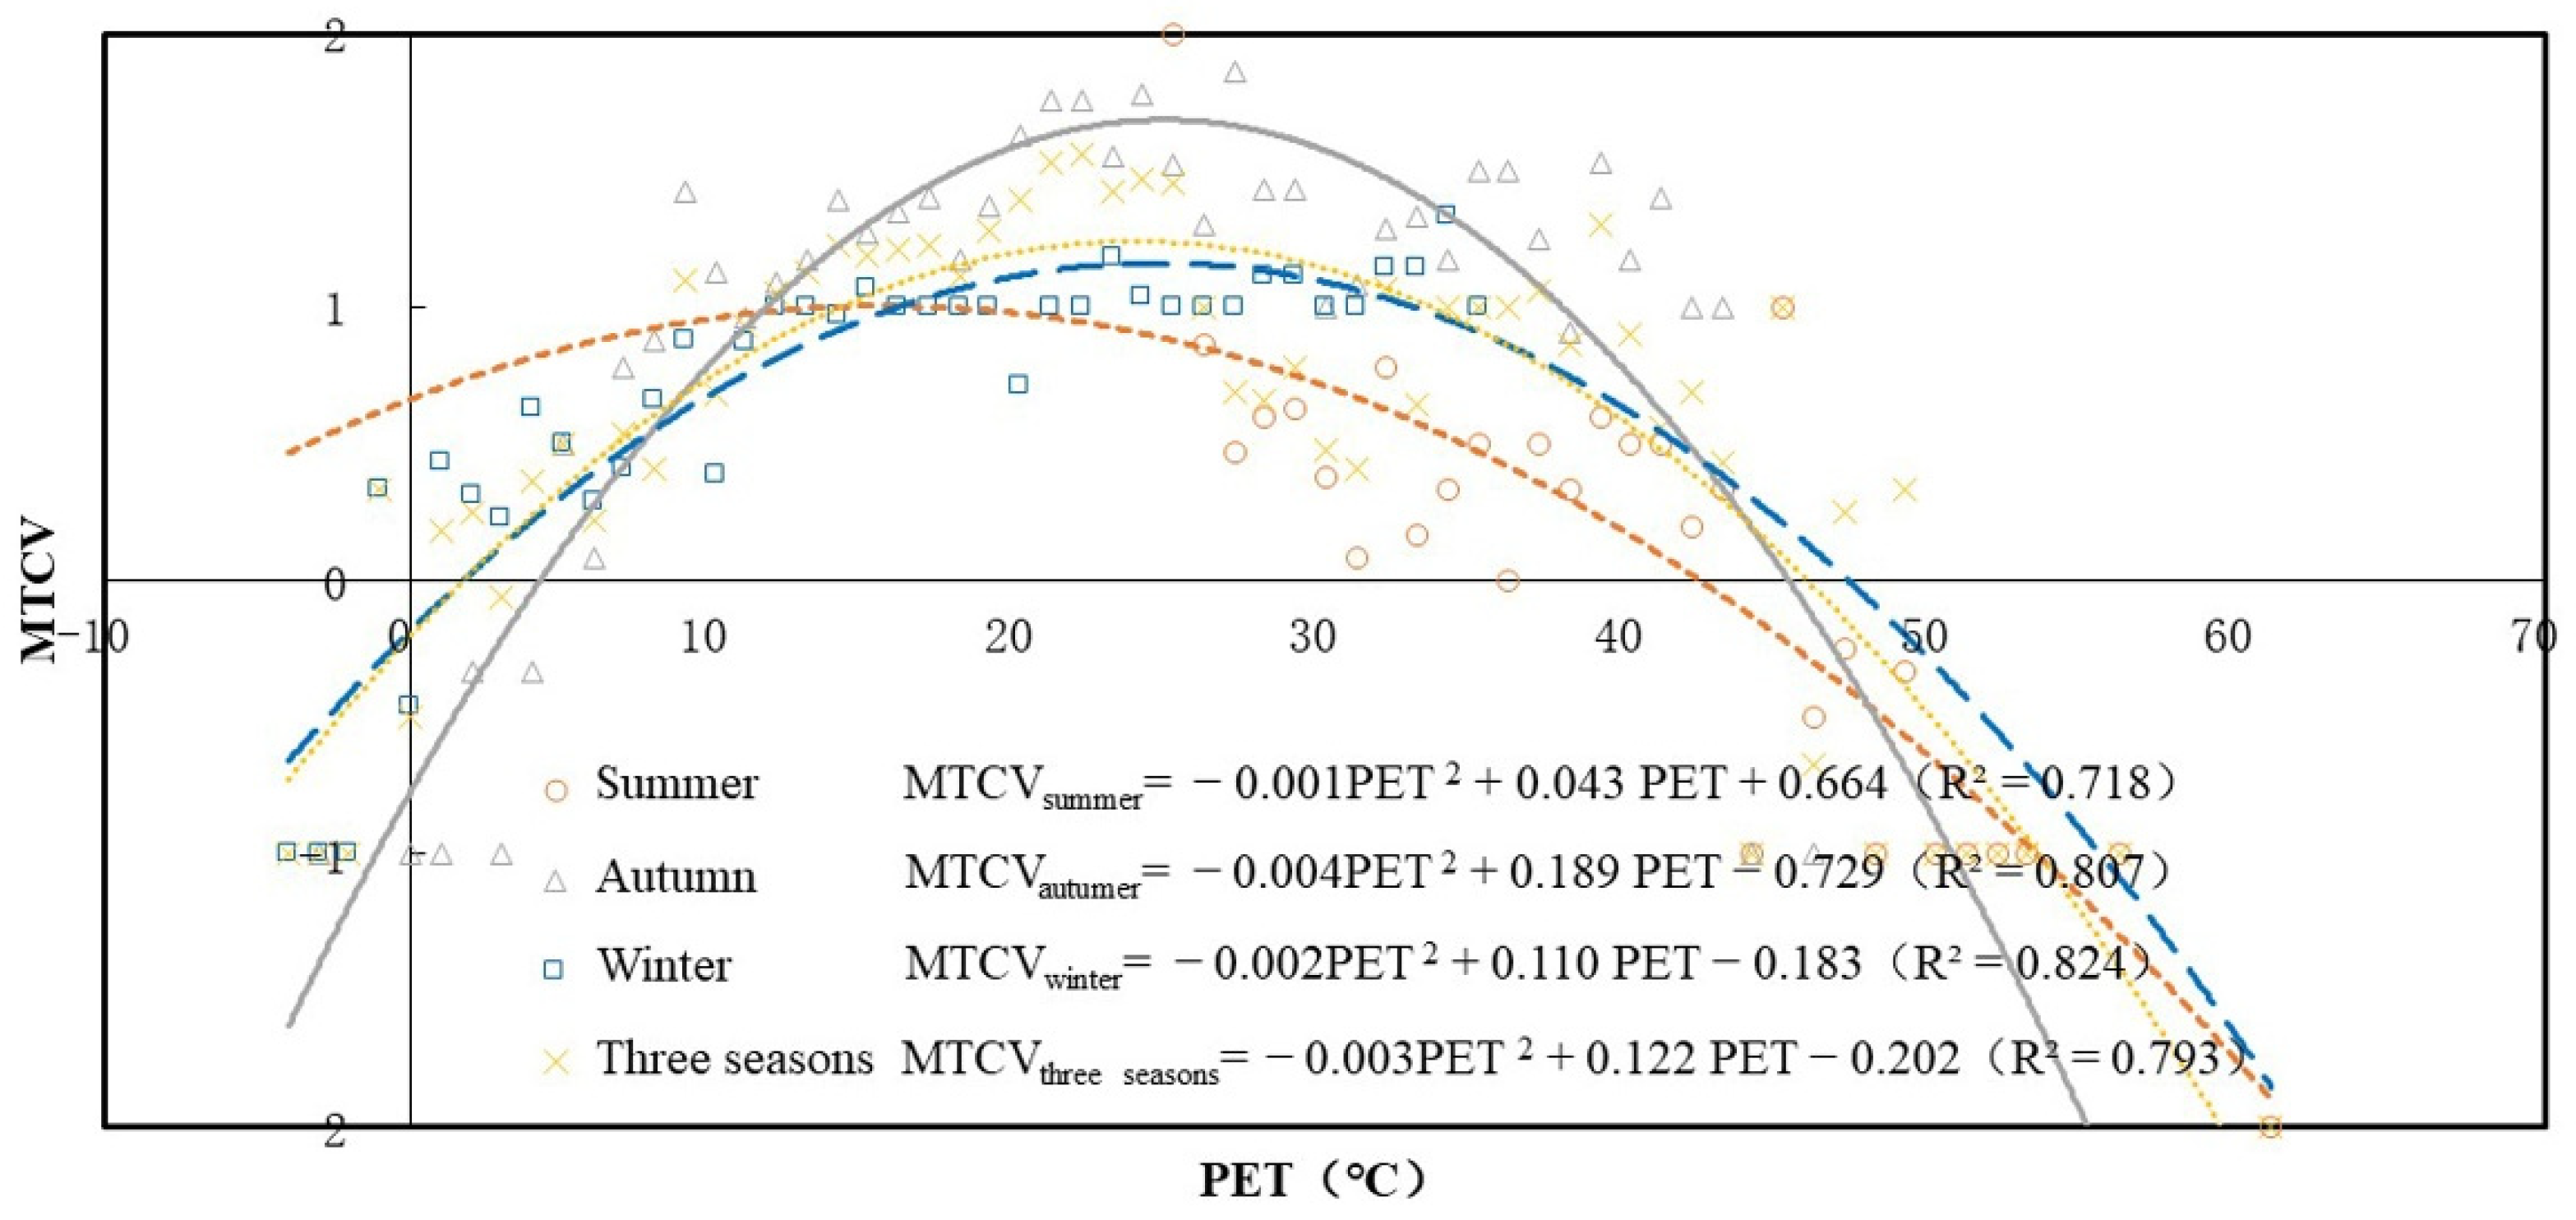
43]. Thus, a direct assessment of thermal comfort is recommended. Similarly, the mean thermal comfort votes (MTCV) corresponding to PET at 1 °C in summer, autumn, winter, and the three seasons were calculated, and the quadratic regression lines and equations of MTCV and PET were obtained.
The thermal comfort value is defined as the value corresponding to the highest level in a quadratic regression between the thermal comfort vote and the objective evaluation index [
44]. The calculation results are shown in
Figure 6. The most comfortable thermal condition was at a PET of 21.5 °C for summer, 23.6 °C for autumn, 27.5 °C for winter, and 23.4 °C for the three seasons, which indicates that the thermal comfort value also varies with season and is affected by synesthesia.
The thermal comfort range is defined as the PET value corresponding to TCV greater than 0.5 in the current study. Accordingly, the thermal comfort ranges were 10.3~32.7 °C in summer, 12.4~34.8 °C in autumn, 14.7~40.3 °C in winter, and 6.9~33.7 °C across all seasons. As shown in
Table 3, the thermal comfort ranges in summer, autumn, winter, and all seasons were much wider than the thermal neutral ranges. The upper limit of thermal comfort was higher than that of thermal neutrality.
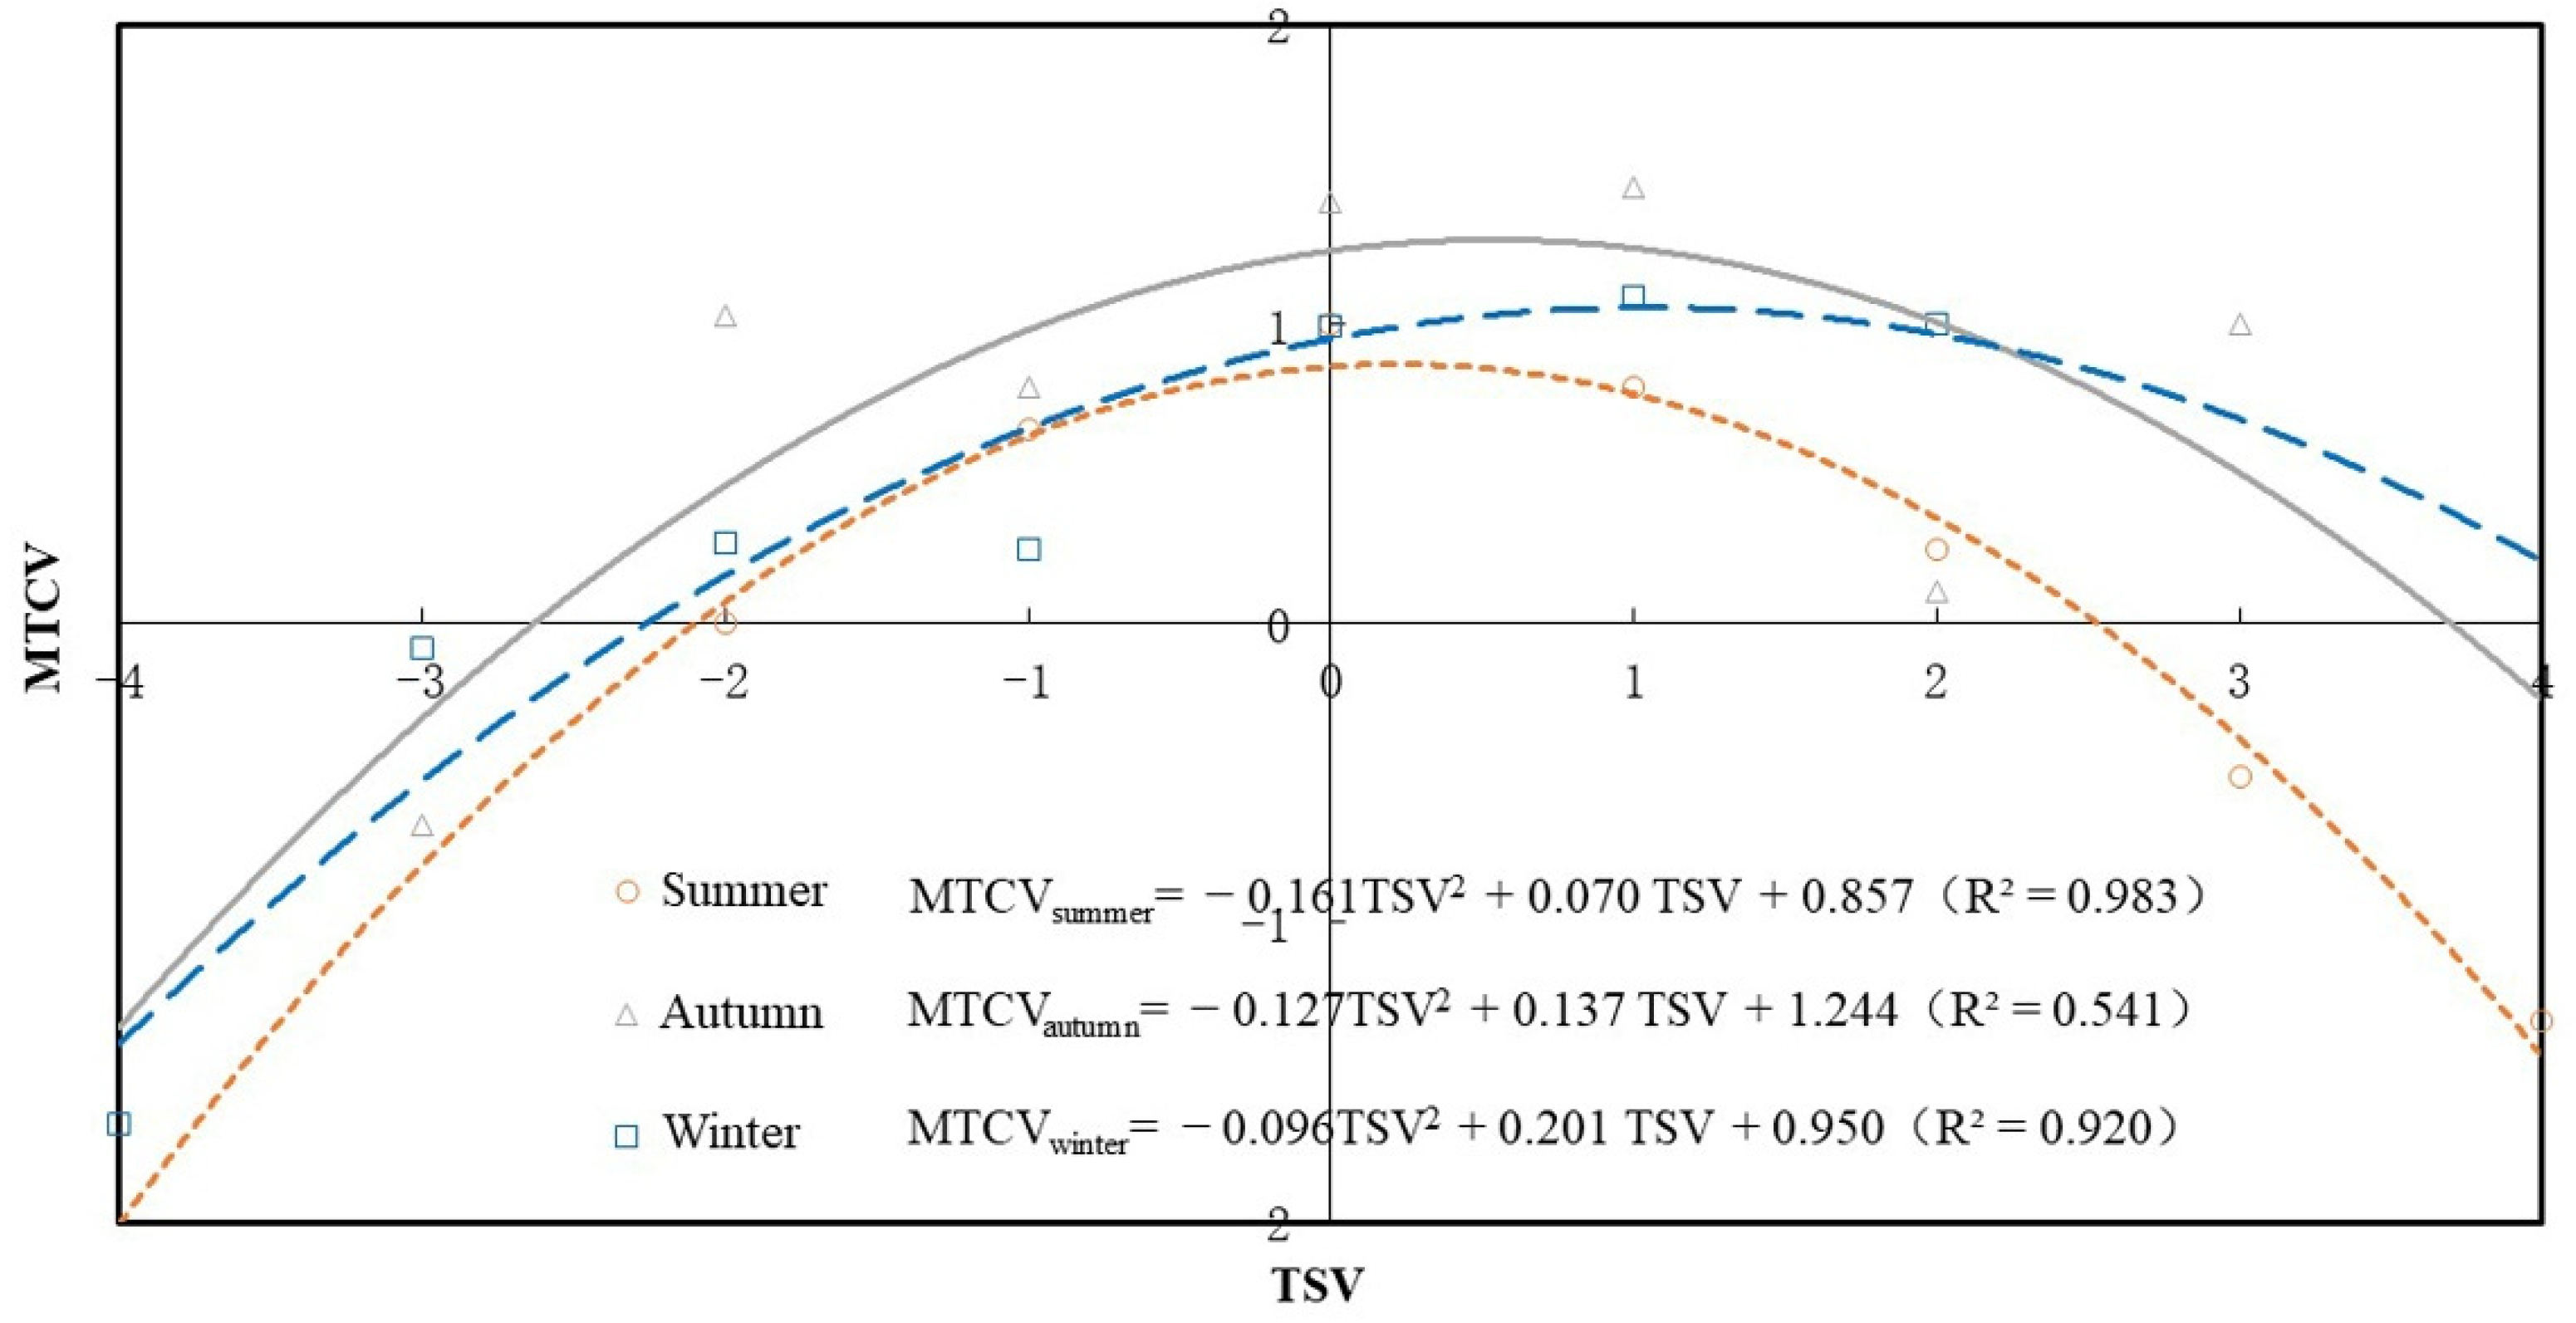
To reveal the relationship between TSV and TCV, quadratic regression lines and equations of MTCV and TSV were examined.
Figure 7 shows that the regression coefficients were 0.983 in summer and 0.920 in winter, and 0.541 in autumn. The stronger significance demonstrated a higher thermal sensitivity. Furthermore, it could be observed that when the MTCV was the largest, the TSV scales were 0.22 in summer, 0.53 in autumn, and 1.05 in winter. That is, from summer to winter, when the thermal sensation tends to be slightly warm, people can feel more comfortable. These findings verified that thermal neutrality is not equal to thermal comfort. The difference between the two thermal comfort benchmarks in this study revealed that the thermal benchmarks of psychological comfort needs the support and verification of physiological and behavioral levels.
3.3. Regression Models of TSV and TCV
Multivariate analysis has been adopted by several previous studies in the literature to determine the main factors affecting thermal perception. For example, Pantavou and Lykoudis [
22] used air temperature, relative humidity, and wind speed along with solar radiation and atmospheric pressure in a linear model. Similarly, Sharmin et al. [
25] included air temperature, the mean radiant temperature, vapor pressure, and wind speed in a multiple regression model to determine TSV. Similarly, multiple linear regression was used to examine the influence of the microclimate and personal factors on thermal perception in this study.
Before the regression analysis, the Spearman correlation analysis among these variables was calculated to obtain some ideas of the correlation of the variables.
Table 4 shows that air temperature, wind speed, and solar radiation were the main microclimatic parameters affecting the TSV and TCV. Meanwhile, TSV and TCV were highly correlated with age in autumn. However, relative humidity and gender had a statistically insignificant effect on thermal perception. The result that relative humidity has an insignificant effect on TSV and TCV reflects that the respondents had good physiological adaptability to relative humidity, which is in agreement with previous research conducted in Shanghai [
29,
30]. The research described in this paper is consistent with research conducted in Athens [
22] and Brazil [
45], where gender was found to have no or insignificant impact on thermal perception. Hence, relative humidity and gender were excluded from the multiple regression models.
3.3.1. Regression Models of TSV
The TSV regression models for summer, autumn, and winter are shown in Equations (1)–(3). Variables with
p values greater than or equal to 0.001 were excluded from the model. The R
2 values of the independent variables explained approximately 12.4%, 30.8%, and 25.9% of the variation in the TSV for the summer model, autumn model, and winter model, respectively. Since
Table 5 shows that F was significant at
p < 0.000, the regression models were significant.
Equations (1) and (2) show that only wind speed had a negative impact on TSV, while air temperature, and solar radiation both had a positive linear correlation with TSV in summer and autumn. Previous studies have found that the major factors affecting outdoor thermal sensation are air temperature and solar radiation [
27,
46,
47]. However, due to the behavioral adaptation of the respondents, the periods and space points with low air temperature and solar radiation were preferentially selected. Therefore, wind speed has become a key factor affecting people’s thermal sensation in the current study. It has been proven that people perceive the optimal wind speed from 1 m/s to 2 m/s when the PET rises from 24 °C to 36 °C [
26]. Similarly, people’s thermal sensation can be reduced by 0.4 units when the wind speed is increased by 1 m/s in this study. That is, increasing the wind speed can significantly reduce the thermal sensation in summer.
Equation (3) shows that air temperature, solar radiation, and age all have a positive effect on the TSV in winter, among them, air temperature is the factor that has the greatest influence on TSV. It has been proven by Yao et al. that wind speed increases by 1 m/s, and a 0.22 °C increase in air temperature results in the same proportion of pedestrians perceiving neutral conditions in the Lujiazui CBD of Shanghai [
29]. However, the effect of wind speed on the thermal sensation in winter was not significant in this case. This may be the result of the respondents preferentially choosing the activity space with low wind speed. Therefore, it can be inferred that behavioral adaptation plays a very important role in thermal perception. In addition, age has a positive effect on the TSV in winter, which may be the result of the physiological adaptation of the respondents [
22,
45].
3.3.2. Regression Models of TCV
The TCV regression models for summer, autumn, and winter are shown in Equations (4)–(6). Although the R-squared value of each equation was small,
Table 6 shows that the regression models were still significant.
In summer, wind speed had the most important effect on thermal comfort and was the only variable with a positive effect. People’s thermal comfort can be increased by 0.3 units when wind speed was decreased by 1 m/s. This was also the result of the respondent’s behavioral adaptation, because half of the questionnaires were conducted before 9 am and after 5 pm, while most of the other questionnaires were conducted in the shadow of buildings and trees. The air temperature and solar radiation at these periods and space points were relatively low. However, air temperature becomes the key microclimate factor that affects people’s thermal comfort in autumn and winter. This is because people who went to the square for activities had chosen the midday period when the solar radiation was strong or the space had a light wind but was sunny. Thus, it can be concluded that due to the diversity spaces of the square and the behavior adaptation of the interviewees, the main microclimate parameter that affect the thermal perceptions of respondents change seasonally.
It should be noted that a small R
2 does not necessarily imply that estimates of models are biased. Many studies with microclimate elements and personal parameters as variables have low R-square values. For meteorological models, the R
2 value of the OLR model for predicting TSV was found to 0.331 in Bhopal, India, [
23] which suggests that microclimatic variables alone are not enough to explain human thermal perception. Moreover, in a similar study, the model was developed using both meteorological and personal parameters, and the R
2 value for predicting TSV was found to be 0.543 in Tianjin, China. [
22]. It can be inferred that R
2 values may be different and smaller due to behavioral adjustment and psychological and physiological adaptation. These variables are also more difficult to measure.
4. Conclusions
This paper presents the early results of an outdoor thermal perception survey aiming to enrich our knowledge of the relationship between subjective thermal perception and the outdoor thermal environment. Since thermal adaptation, the outcome of this study could be considered indicative of subtropical climates.
In this study, questionnaire surveys and in situ meteorological measurements in two urban squares in Shanghai were conducted during summer, autumn, and winter under normal meteorological conditions for each season. The regression lines between MTSV, MTCV, and PET in the three seasons were estimated. These relations allowed for the determination of a neutral PET range of 13.0~28.6 °C and a comfortable PET range of 14.2~32.6 °C for three seasons.
This research also evaluated the effect of personal and microclimatic variables on the observed TSV and TCV. Seasonal differences were highlighted. Wind speed had the greatest effect on the TSV and TCV in summer, while air temperature had the greatest influence on the TSV and TCV in winter. The results also showed that relative humidity had a statistically negligible influence on TSV and TCV in all seasons, which revealed the visitors’ physiological adaptation to relative humidity.
The research had two important limitations. First, it was conducted only in ten sites of two squares, and second, the questionnaire research was based on subjective perceptions. Therefore, suggestions for future research include (a) a broader study exploring urban outdoor comfort in more diverse sites with various micrometeorological conditions and (b) research that combines subjective perceptions with physiological measurements and behavioral observation.
The results provided by this study can be useful to the development of urban outdoor spaces by local authorities. Urban planners and urban designers are encouraged to incorporate local thermal comfort criteria in multiple seasons into the development of sustainable urban outdoor spaces. Furthermore, regarding the divergence of TSV and TCV, further research should be undertaken in the case of a subtropical climate to inquire into the prediction of thermal perception.


