Article

Modelling Residential Outdoor Thermal Sensation in Hot Summer Cities: A Case Study in Chongqing, China

1
Joint International Research Laboratory of Green Building and Built Environment, Ministry of Education, Chongqing University, Chongqing 400044, China
2
Data-Centric Engineering, The Alan Turing Institute, The British Library, 96 Euston Road, London NW1 2DB, UK
3
Division of Building Science and Technology, City University of Hong Kong, Hong Kong, China
*
Author to whom correspondence should be addressed.
Buildings 2022, 12(10), 1564; https://doi.org/10.3390/buildings12101564
Submission received: 1 September 2022 / Revised: 16 September 2022 / Accepted: 21 September 2022 / Published: 29 September 2022
(This article belongs to the Special Issue Thermal Comfort in Built Environment)

Abstract

:
Exposure to extreme heat is a significant public health problem and the primary cause of weather-related mortality, which can be anticipated by accurately predicting outdoor thermal sensation. Empirical models have shown better accuracy in predicting thermal sensation than the most frequently used theoretical thermal indices, which have ignored adaptability to local climate and resulted in underestimating or overestimating the neutral levels of residents. This study proposes a scheme to build an empirical model by considering the multiple linear regression of thermal sensation and microclimatic parameters during summer in Chongqing, China. Thermal environment parameters (air temperature, relative humidity, wind speed, and surface temperature) were recorded and analyzed, together with 375 questionnaire survey responses referring to different underlying surfaces. The results found that the proposed model predicted neutral sensations as warm and 19.4% of warm sensations as hot, indicating that local residents adapted to warm or even hot sensations. In addition, the empirical model could provide references for local pedestrians’ daytime path choices. Residents might feel more comfortable staying beside a pond from 8:00 to 11:00 or sheltering under trees from 08:00 to 14:00 and 17:00 to 19:00. Masonry offered a comfortable microclimate between 10:15 and 11:00, and residents on the lawns were comfortable from 17:30 to 19:00. However, asphalt should be equipped with cooling infrastructures in order to cool thermal sensation.

1. Introduction

The frequency, intensity, and duration of global extreme heat events are expected to increase considerably, resulting in greater impact on population health, especially for vulnerable groups including the elderly, children, and those with underlying cardiovascular and respiratory diseases [1,2]. Extreme heat conditions lead to dangerous heat stresses and health risks by restraining heat convection [3]. Some regions that suffer intense heat waves, such as Northeast India and West Africa, are densely populated with limited cooling infrastructures and poor public health facilities, and have comparatively high heat-related mortality and morbidity [4]. Considering recent history and the information available in the literature, it is essential to quantify the heat burden in summer to improve responses to possible extreme heat events.
Since the 1920s, many researchers have studied human perceptions of thermal environments and have developed various thermal indices, mainly based on air temperature [5]. In the 1970s, Fanger [6] developed a physiological index, predicted mean vote (PMV), to quantify thermal sensation based on a physiological equilibrium temperature under a given environment [7]. Other thermal indices, such as standard effective temperature (SET*) [8], physiological equivalent temperature (PET) [9,10] and the Universal Thermal Climate Index (UTCI), have been proposed based on micrometeorological measurements of thermal environments and human physiological responses [11,12]. In particular, theoretical thermal indices should be calibrated before being used to evaluate outdoor thermal sensation [13,14]. However, these thermal indices consider purely physiological approaches [15], and other factors can affect thermal comfort, such as psychological factors, historical climates, and cultures [16,17]. As a result, physiological approaches lead to about 50% of the variation between objective and subjective outdoor thermal perception [15]. Nowadays, another approach for predicting the local thermal sensation is the adoption of empirical models, which assess outdoor microclimatic parameters based on regression analysis [18]. Outdoor thermal sensation is mainly affected by meteorological factors such as air temperature [19,20], relative humidity [20], wind speed [20], solar radiation [20], and mean radiant temperature [19,20]. Nevertheless, the existing empirical models are case-specific, hence, it is better to propose a universal approach with a broader range of application for predicting outdoor thermal sensation [11].
Various underlying surfaces produce different thermal environments, causing diverse thermal sensation [20], therefore encouraging different usage in outdoor spaces [20,21]. As a dominant feature of open spaces, the underlying surface was the key point of focus for researchers [22]. Previous studies revealed that urban vegetation and water bodies could improve outdoor spaces, especially in summer [21,22], and these two underlying surfaces offer excellent adjustment potential to attain comfortable outdoor thermal conditions. Kong et al. [23] reported that densely growing trees could cool thermal sensation in their surroundings by reducing mean radiant temperature and air temperature reduction, which were preferable to those in open zones. Because of shading by the canopy and the evapotranspiration effect, trees decrease the air temperature, accompanied by a rise in relative humidity [24]. While leaves prevent a large amount of solar radiation from penetrating, trees also act as windbreaks leading to low wind speeds in summer [25]. Chokhachian et al. [26] believed that low solar radiation intensity and ventilation could promote a comfortable microclimate. Water bodies not only improve thermal conditions through evaporation [21], but they also delay air temperature peaks due to their large thermal capacities [11]. The above characteristics contribute the cooling of open waterfront spaces in the daytime [27], and increase the surrounding air temperature at night [28]. Notably, most studies considered the improvement in cooling effects and thermal sensation caused by beneficial underlying surfaces, while failing fully utilize other outdoor spaces or even disregarding them [20]. Thus, it is urgent to elucidate the spatiotemporal distributions of common underlying surfaces in existing residential regions, to make full use of the outdoor environment by enabling comfortable thermal microclimates.
All the existing thermal indices described in the above review have limitations, resulting in inaccuracies in predicting outdoor thermal sensation. For ensuring the accuracy of a thermal index in predicting human outdoor thermal sensation and offering reliable optimal path planning for residents, a comparison of accuracies between the empirical model and the theoretical thermal indices is needed. Nevertheless, evaluation of the spatiotemporal outdoor thermal sensation, considering various common underlying surfaces in residential regions, has rarely been studied. According to the mean thermal sensation vote values for different underlying surfaces that are predicted to form the most accurate model, the coolest location can be confirmed, and optimal summertime path planning can be provided for residents and visitors.
A universal approach for predicting the mean thermal sensation vote (MTSVNEW) is proposed in this study. Applying the universal approach, this study took Chongqing as an example, and an empirical model suitable for a Chongqing residential estate (MTSVCQ) was built based on microclimatic parameters and questionnaires. Then, the most accurate thermal index was selected after comparing the accuracies of PET, SET*, UTCI, and the empirical model. Furthermore, based on the most accurate thermal index for finding the most comfortable locations and corresponding periods, the spatiotemporal distributions of residents’ thermal sensations were obtained, aiming to offer residents optimal outdoor path planning and provide designers with advice about the landscape.

2. Methodology

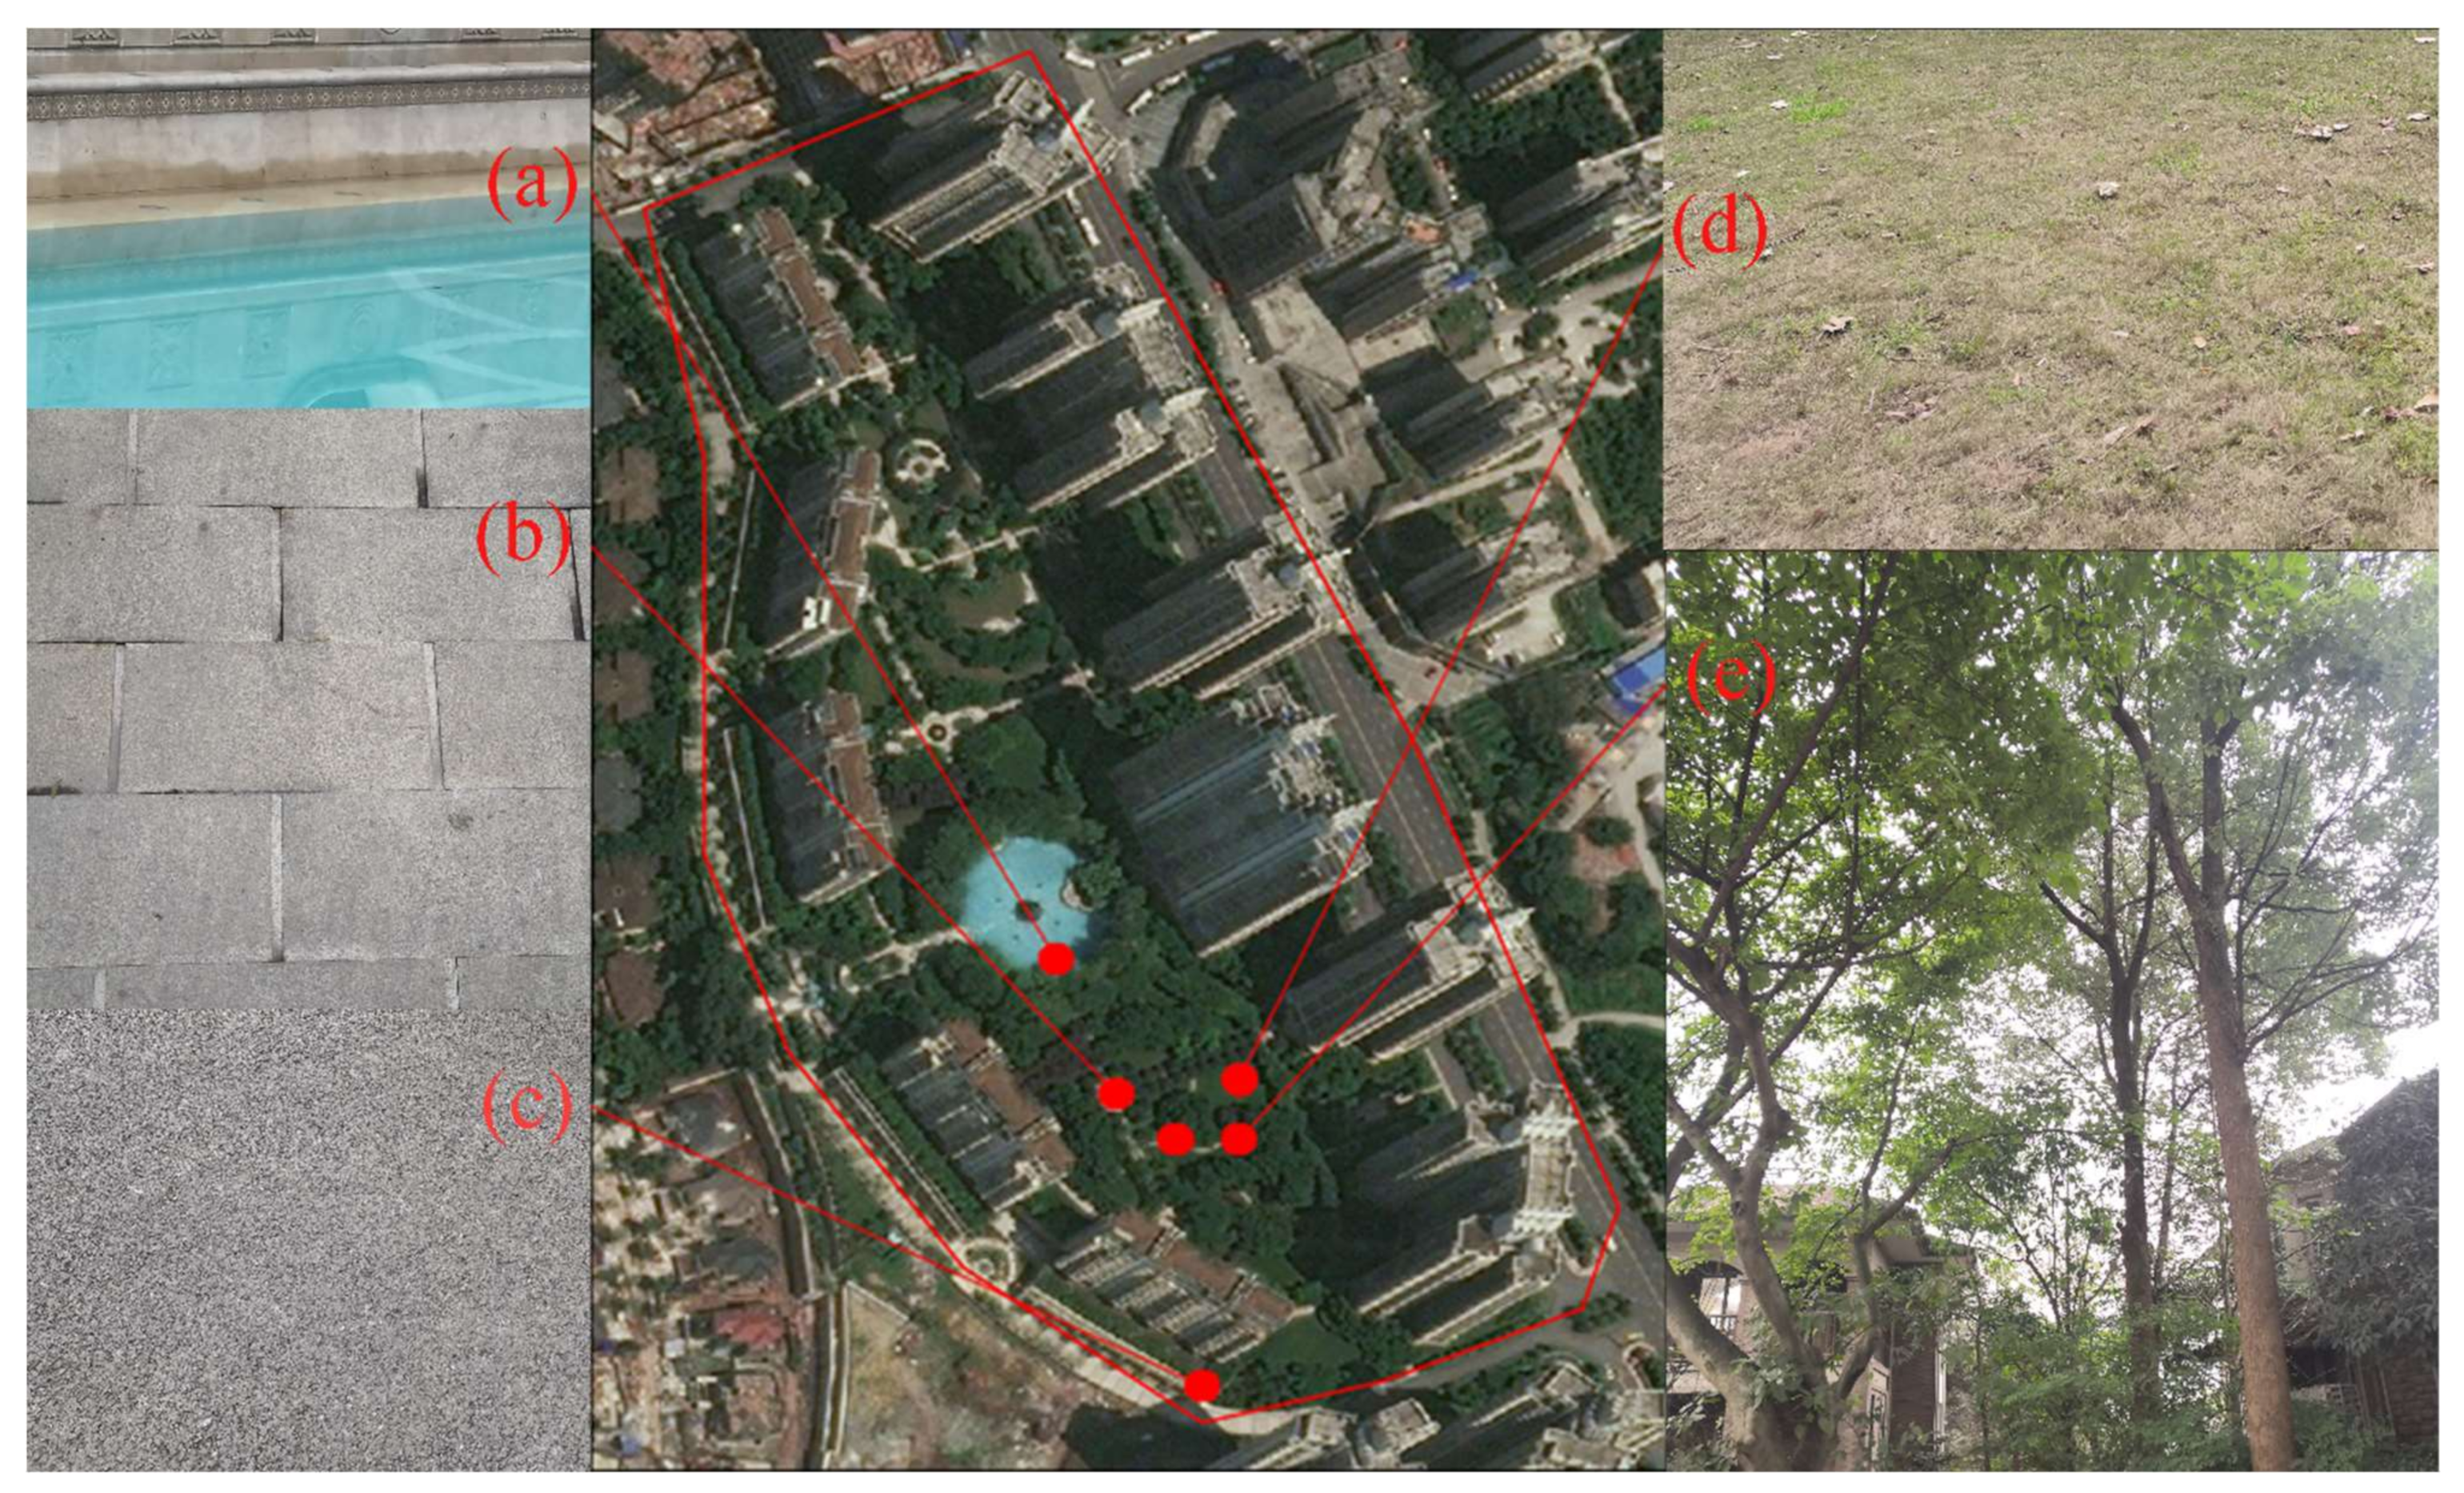
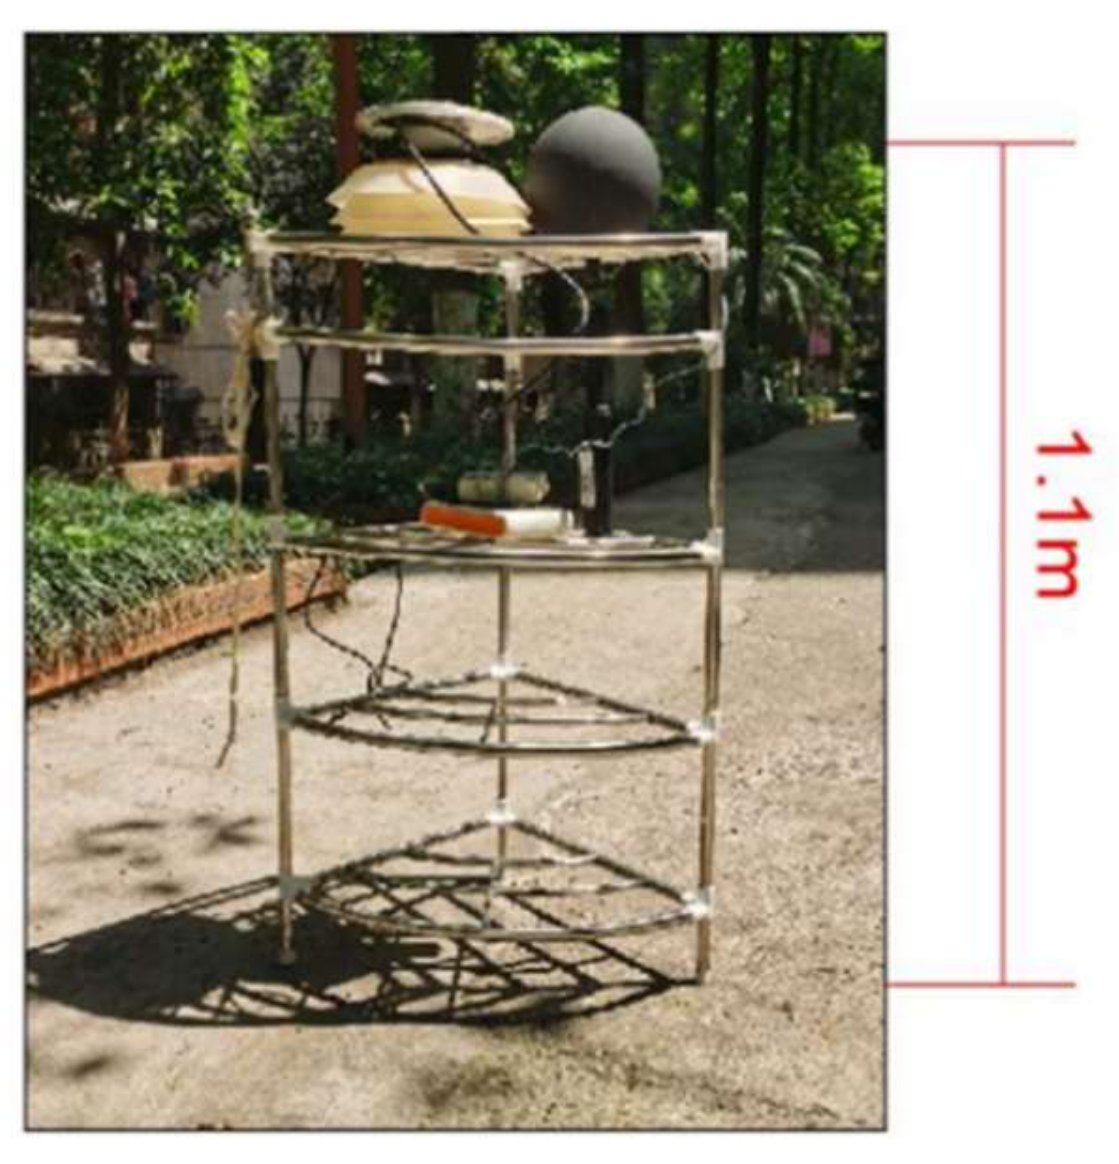
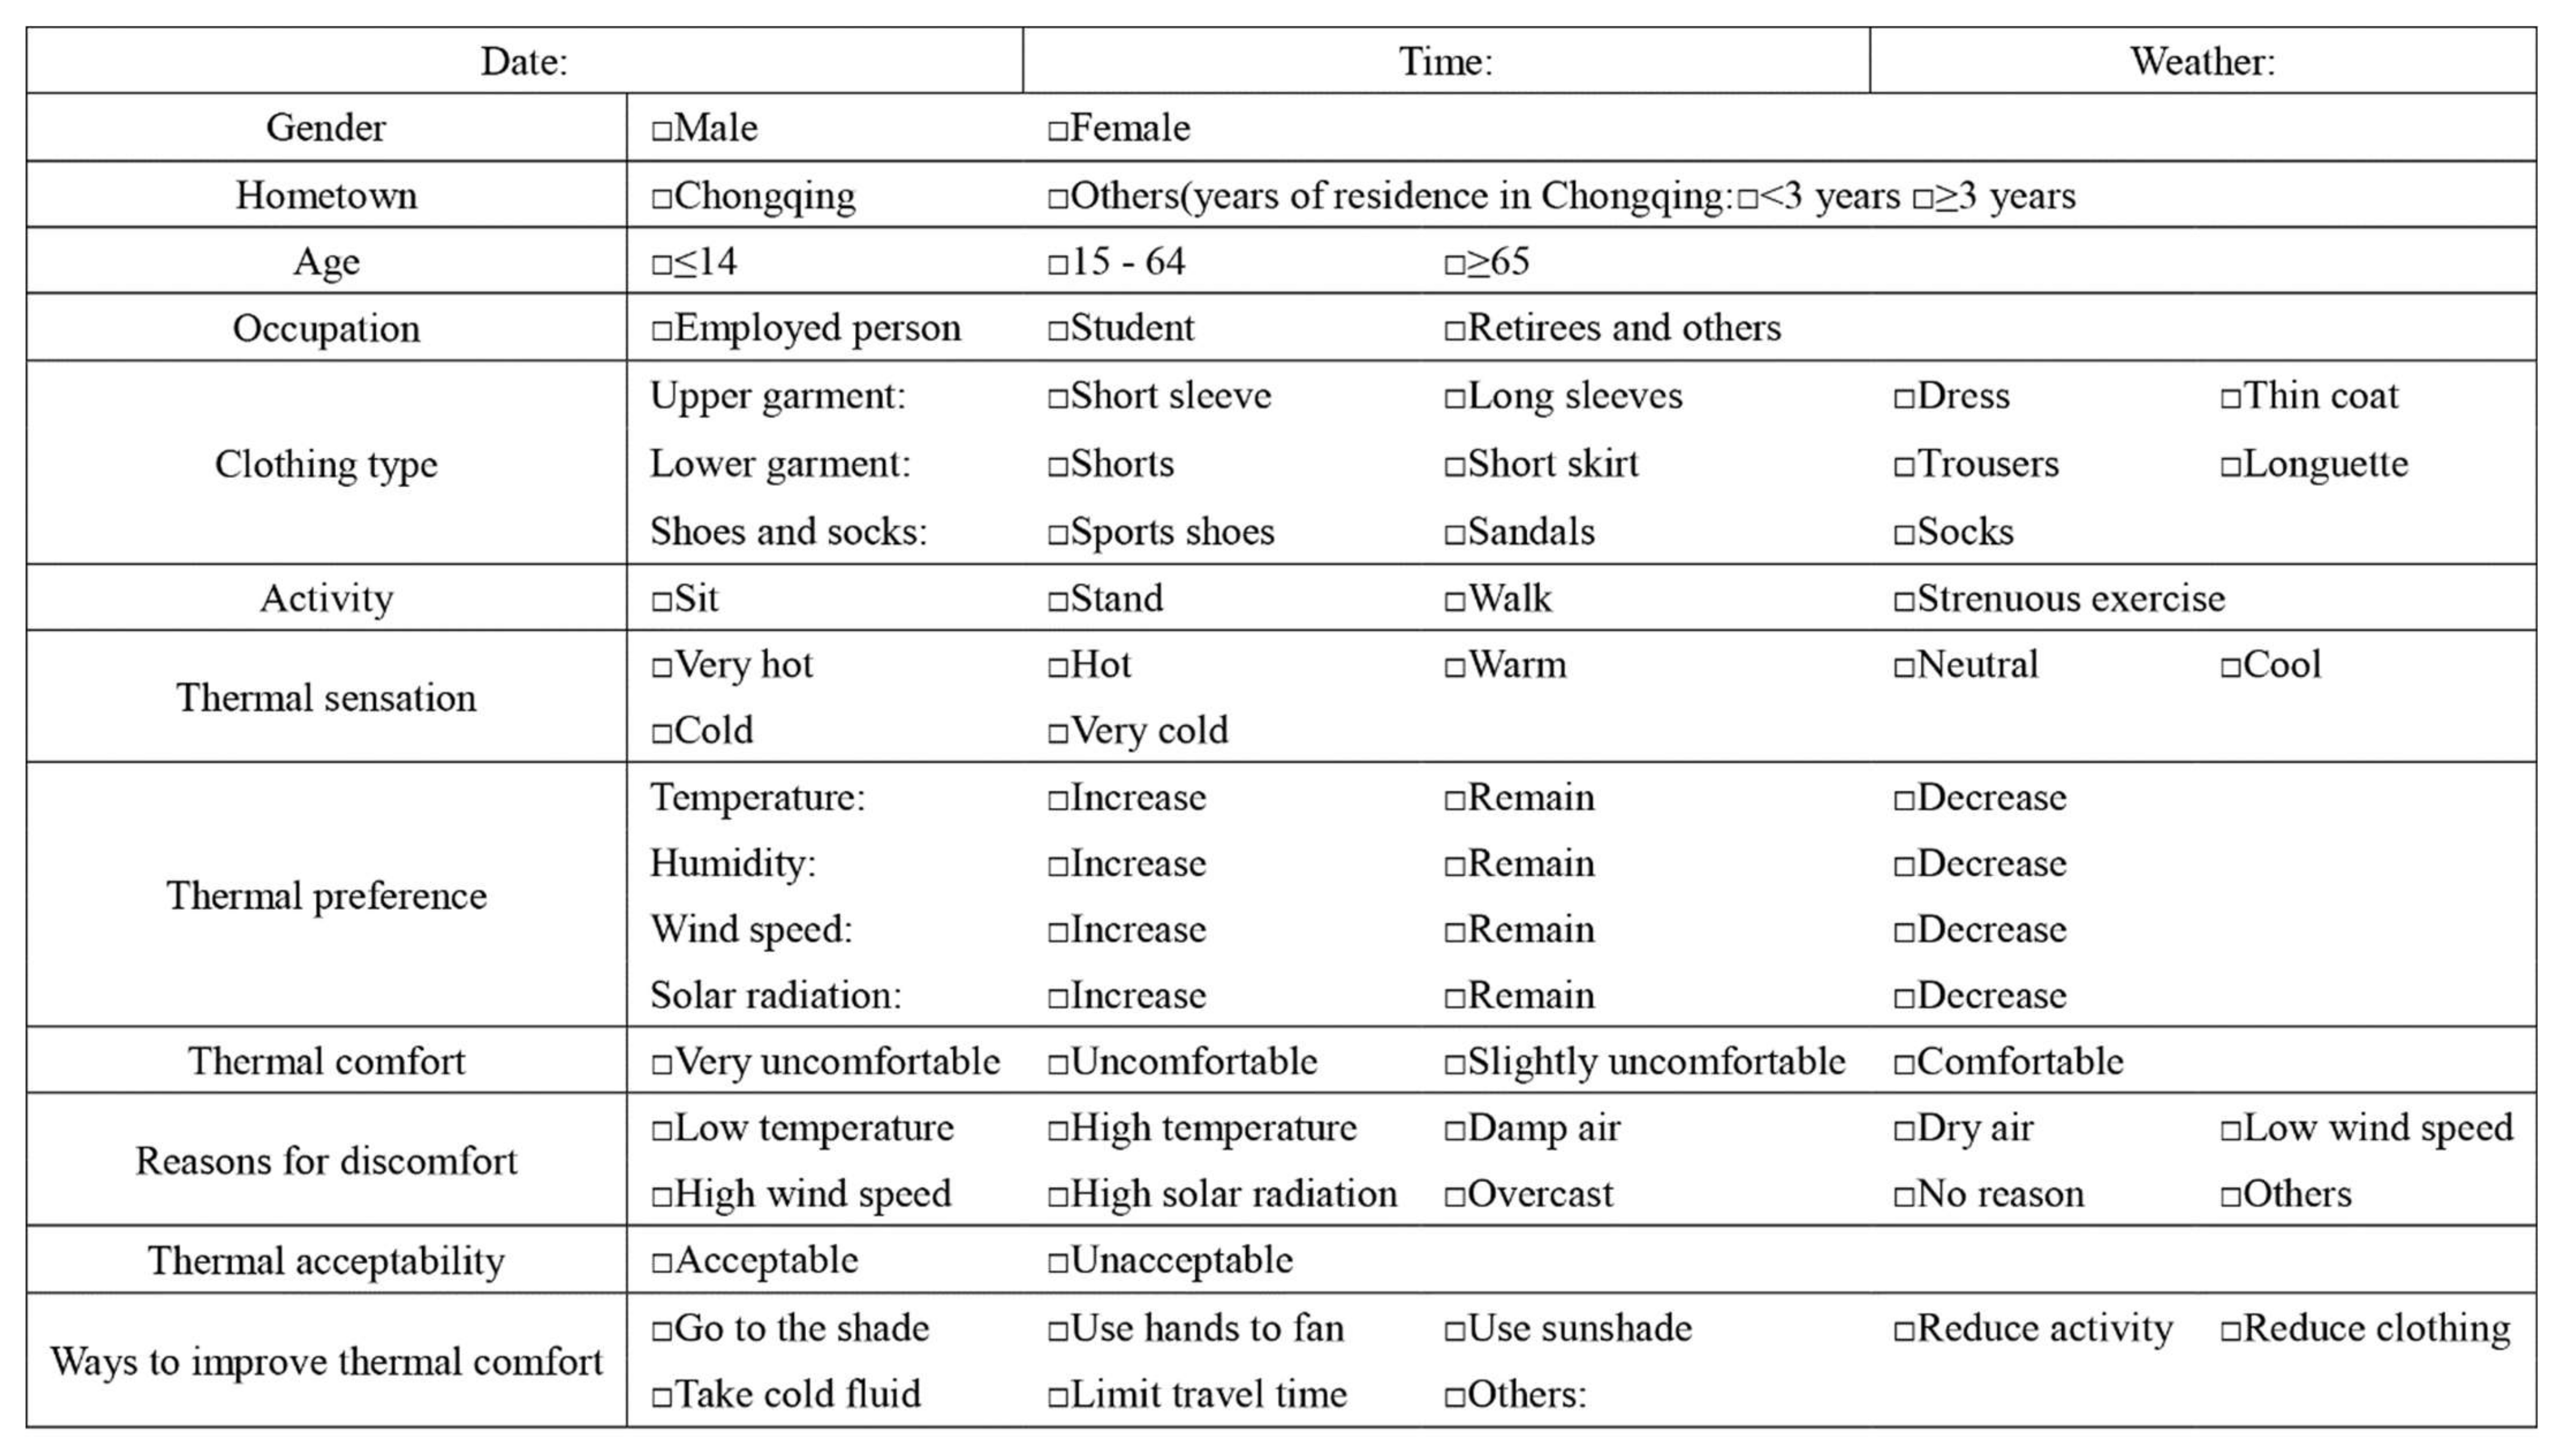
2.1. Study Area and Field Measurement

The field survey was conducted within a residential estate at 88 Jinkai Avenue, Yubei District, Chongqing, China. Chongqing is located between longitudes 105°11′ E and 110°11′ E, and latitudes 28°10′ N and 32°13′ N, in a climatic zone with hot summers and cold winters. According to meteorological data of the past 10 years from the City Proper of Chongqing, the average number of days when the daily mean air temperature (Ta) exceeded 35 °C was as high as 16 days in the hottest month. There were 17 consecutive days with a daily average Ta over 35 °C in 2012 and in 2016 (according to http://cq.cma.gov.cn/ (accessed on 22 May 2021)). A long-term hot environment may lead to extreme thermal disorders in the human body, where the body’s core temperature is higher than its normal value, increasing heat-related morbidity [3]. To further clarify the thermal sensation, five common locations in a representative residential community were selected, as shown in Figure 1.
The outdoor field survey was conducted from 22 July 2018 to 14 August 2018. To assess the outdoor thermal sensation of residents and the relevant microclimatic parameters, these field measurements were obtained by questionnaire surveys and microclimatic monitoring. There were two researchers at each measuring site: one randomly distributed the questionnaires to the subjects, and ensured subjects did not complete the questionnaire more than once, while the other monitored the instruments to prevent disturbance by residents. The microclimatic monitoring was conducted automatically at 5 min intervals between 8:00 and 19:00, to record five microclimatic parameters (Ta, RH: relative humidity, va: wind speed, Tg: black globe temperature, and SR: solar radiation intensity) [29]. Simultaneously, questionnaires were randomly distributed to residents near the measuring sites to obtain subjective data for the previous 5 min.
All measuring instruments were shown in Table 1. According to Standard GB/T 35221-2017 (2017), [30] meteorological parameters at 1.5 m were measured with TRM-ZS2. In the fixed-point test of the outdoor thermal environment, the Ta and RH were recorded with an Apresys TM Temp. and RH Data Logger placed in the ventilation louver box. Before using the data logger, a mercury thermometer was employed to verify the accuracy of the data logger using the method for measuring the mixing temperature of ice and water. The va was measured with a WFWZY-1 Wind Automatic Recorder [31] and the instrument was vertical to the open ground. The Tg was obtained using the HQZY-1 Automatic Black Globe Temperature Recorder [32,33]. The SR was obtained with an TPJ-24-G Total Radiation Recorder with the functions of transmission and displayed location. All these microclimatic parameters were measured at 1.1 m (standing) [34] as shown in Figure 2. Three sets of measuring instruments were respectively placed in the centers of the asphalt, masonry, and lawn areas, located more than 10 m away from the surrounding buildings. The other two sets were placed under the arbor and beside the pond, respectively. After collecting the microclimatic data, the mean radiant temperature (Tmrt), one of the most essential variables for evaluating outdoor thermal sensation especially on sunny days [23,35], was calculated with Equation (1) based on ISO 7726 [36]:
T mrt = T g + 273 4 + 1 . 1 × 10 8 × v a 0 . 6 ε g × D 0 . 4 × T g T a 1 4 273
where εg is the globe emissivity (0.95) and D denotes the globe diameter (0.15 m) [36].
The questionnaires were composed of three parts, as shown in Figure A1. The first part recorded basic information, including gender, hometown, age, and employment. The second part obtained personal information about activity and location. The third part consisted of subjective data related to thermal sensation (subjective description of the thermal microclimate), thermal comfort (a psychological state with the thermal environment assessed by subjective evaluation), reasons for discomfort, thermal acceptability, and ways to improve thermal comfort. According to ASHRAE 55-2017, the measurement of thermal sensation adopted a seven-point scale (−3 for very cold; −2 for cold; −1 for cool; 0 for neutral; 1 for warm; 2 for hot; 3 for very hot) [34]. According to ISO 10551-2019, a four-point scale was utilized to assess thermal comfort (0 for neutral; 1 for slightly uncomfortable; 2 for uncomfortable; 3 for very uncomfortable), and a two-point scale was applied for thermal acceptability (0 for acceptable, 1 for unacceptable) [37].

2.2. Outdoor Thermal Sensation Model and Comparison of Accuracy for Predicting Outdoor Thermal Sensation

To ensure the high accuracy of the thermal index for predicting human outdoor thermal sensation, and to offer optimal path planning for local residents, a universal evaluation is needed to quantify outdoor thermal sensation. The model can be called universal only when the sample quantity is large enough to represent the thermal sensation of the local people and the significance level of the empirical model is less than 0.01 [38]. The sample size should be larger than was used in previous investigations such as that by Cheng et al. [39] (288 samples), which also proposed models for predicting outdoor thermal sensation [38]. Assuming the five microclimatic parameters (Ta, va, RH, Tmrt, and SR) as independent variables, and the actual mean thermal sensation vote (MTSV) values as dependent variables, a universal model for outdoor thermal sensation prediction is proposed through multiple linear regressions. This method is supported by previous analytical studies [18,40]. The MTSVNEW can be expressed with Equation (2):
MTSV NEW = F 1 × T a + F 2 × v a + F 3 × RH + F 4 × T mrt + F 5 × SR + F 6
where F1, F2, F3, F4, and F5 are the regression constants, and F6 is the intercept of the regression model.
However, the universal model should avoid multiple collinearities by ensuring that the VIF (variance inflation factor) is less than 10. When the VIF is greater than 10, the independent variables with Pearson product–moment correlation coefficients between them exceeding 0.9 should be marked. After comparing the Pearson product–moment correlation coefficients between the marked variables and MTSV, the regression constants of the marked variables with smaller coefficients should be set to 0 until the VIF is less than 10. Following the above steps, the MTSVNEW can be obtained. Before using the above methodology, a composite variable, operative temperature (To), was applied to analyze whether there were multiple meteorological influences on the MTSV [41], quantified by Equation (3):
T o = h r × T mrt + 10 . 3 × v a 0 . 6 × T a h r + 10 . 3 × v a 0 . 6
where hr denotes the radiant heat transfer coefficient (4.71 W/(m2·K)) [34].
After determining which microclimatic parameters jointly affected the MTSV, this research took the 357 valid questionnaires and daytime (08:00–19:00) microclimatic parameters collected during the monitoring period, to develop a model suitable for Chongqing residential estates in summer, using SPSS. In order to select the most suitable thermal index for predicting residents’ outdoor thermal sensation in Chongqing, it was necessary to compare the accuracies of the MTSVCQ and three theoretical thermal indices (the SET*, PET, and UTCI) [42], which have generally been used to predict outdoor thermal sensation [43,44]. The accuracies of the four thermal indices for predicting outdoor thermal sensation were calculated with Equation (4):
Accuracy = TP TP + FP
For the binary type, the model had two possible outputs: true prediction (TP) and false prediction (FP). True prediction indicated that cases were labelled correctly, which meant the predictive MTSV values matched the recorded thermal sensation classifications. False prediction represented cases that were labelled incorrectly. Importantly, this method indicated an appropriate model when the value was close to 1 and an inadequate model when it was close to 0. According to the accuracies of the four thermal indices in predicting different thermal sensations, the most accurate thermal index was selected. To provide residents with path planning to ensure comfortable outdoor thermal sensation, it was essential to quantify the MTSV of five underlying surfaces by using the most accurate thermal index.

3. Results and Discussion

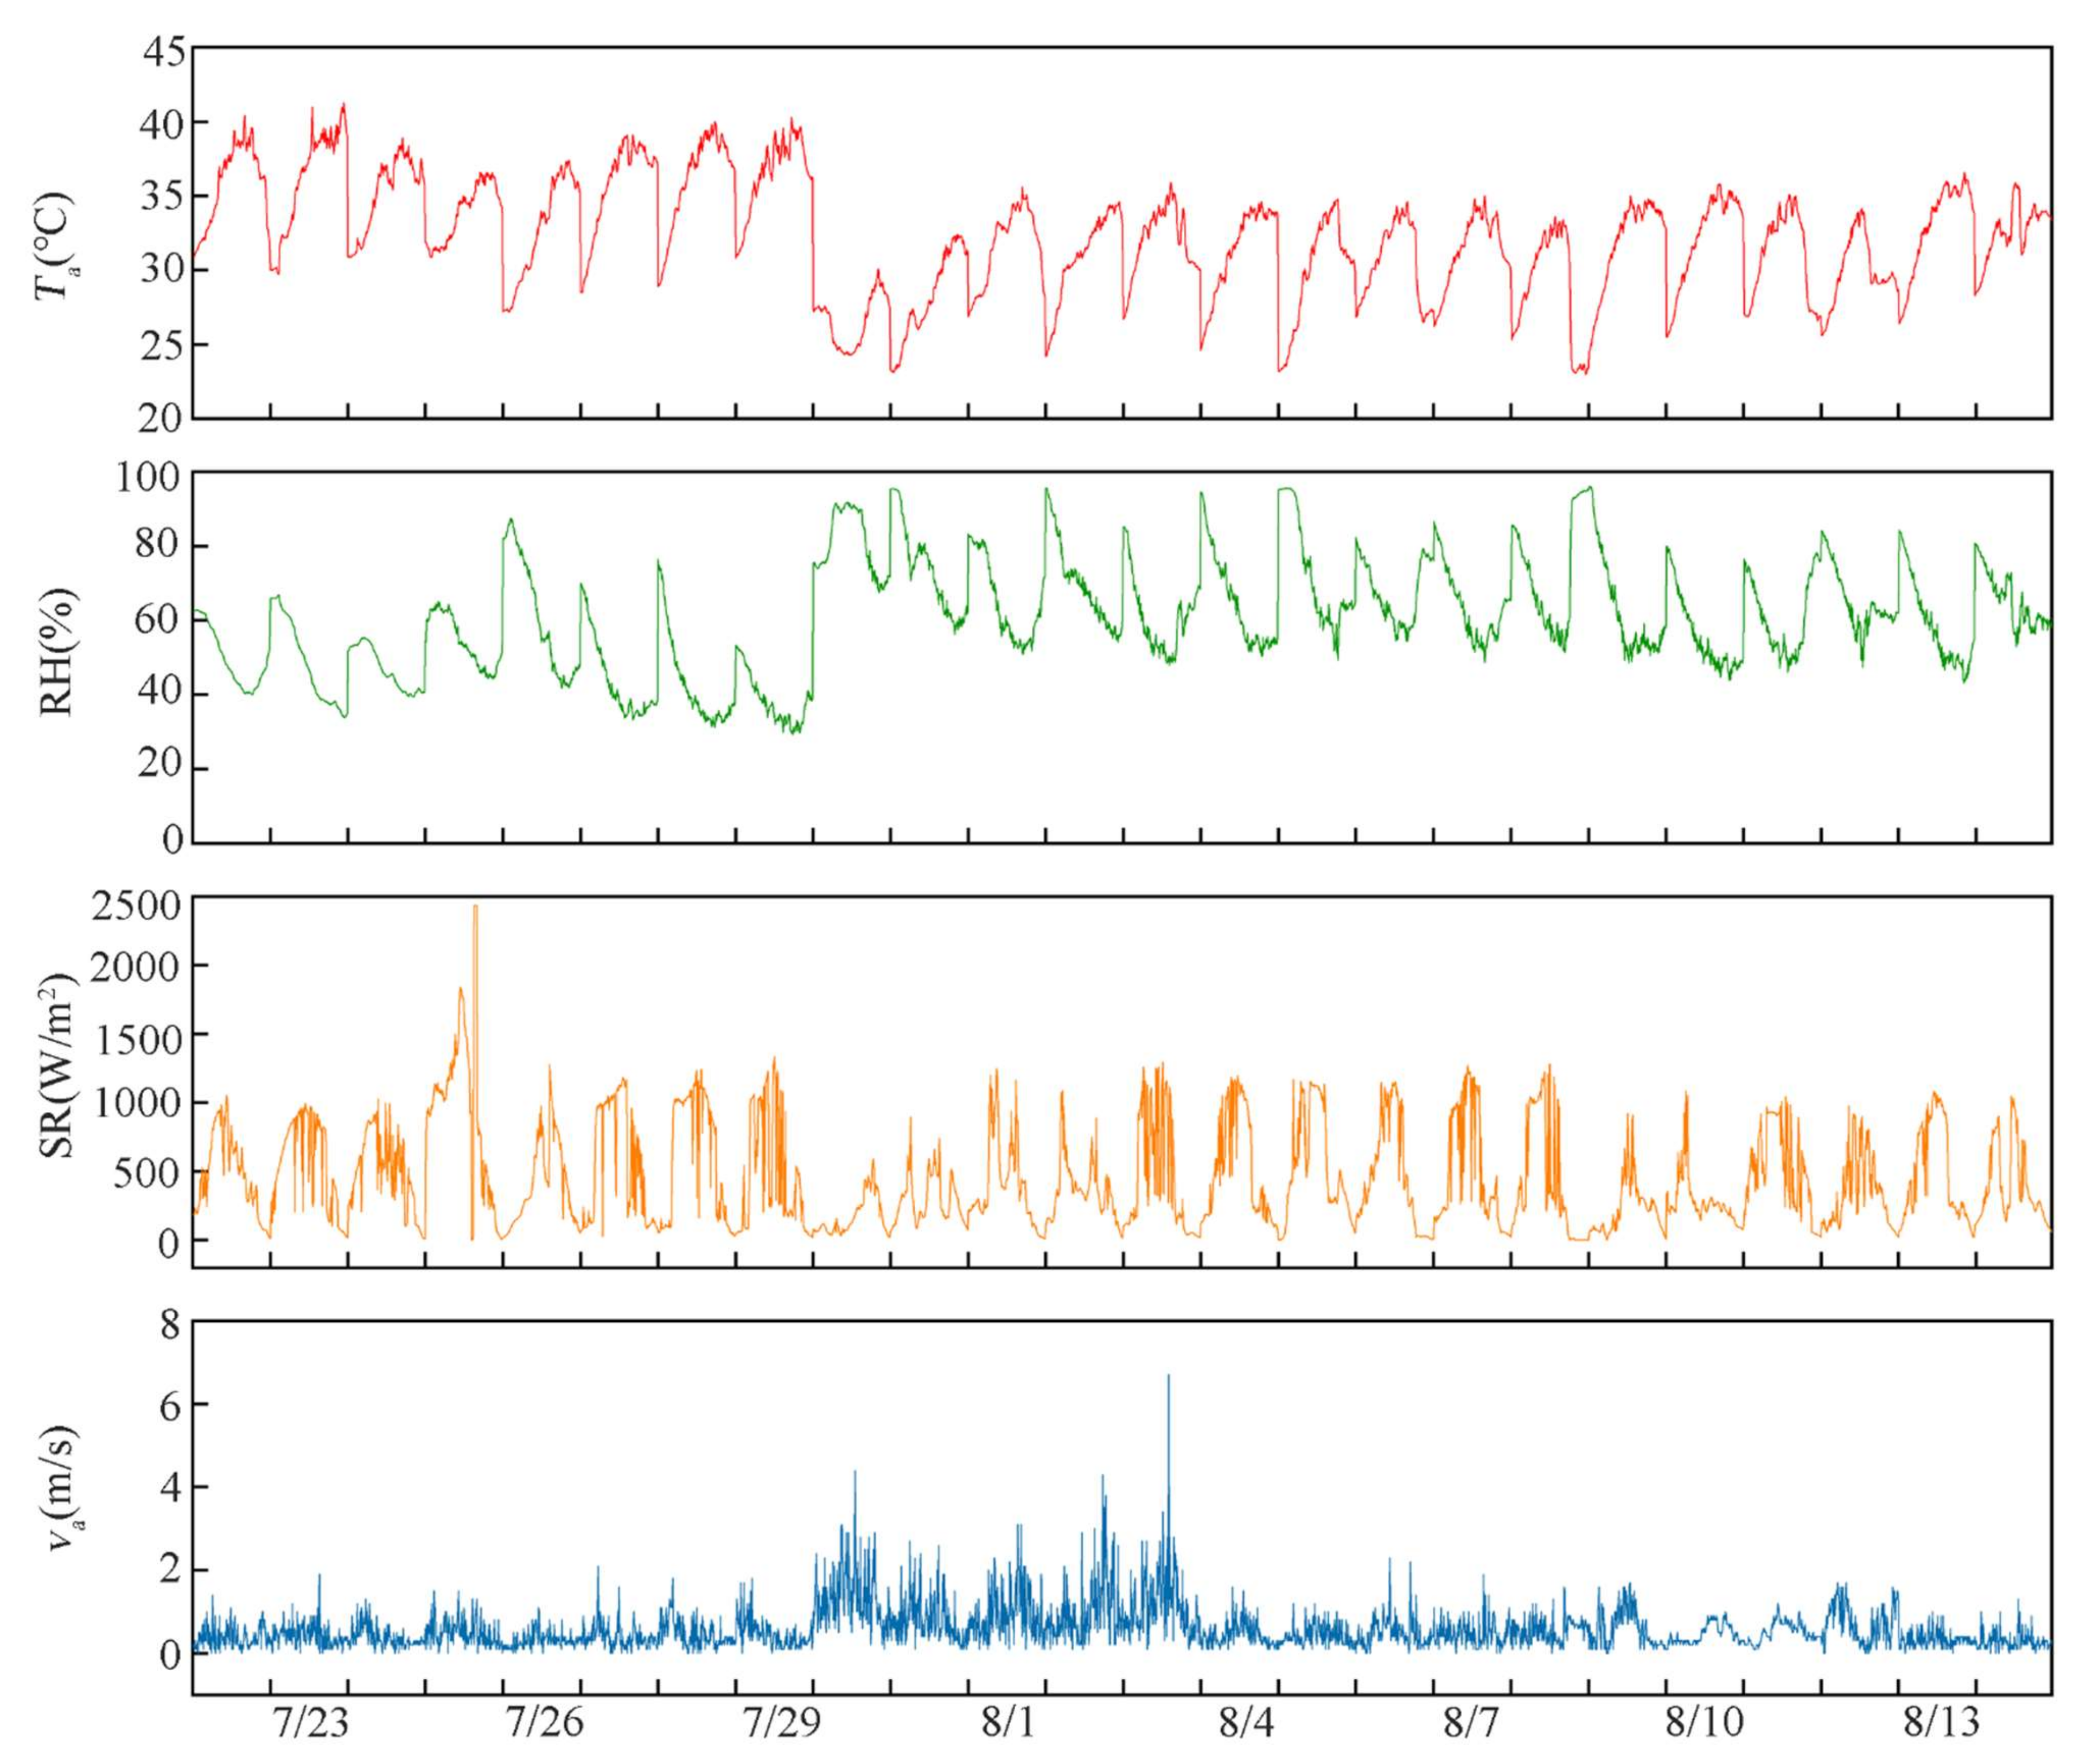
3.1. Weather Conditions

22 July to 14 August were picked as representative summer days in the selected region. Sunny and overcast days each accounted for half of the period, respectively, and relevant daytime meteorological parameters (Ta, RH, SR, and va) were measured at 5 min intervals from 08:00 to 19:00, as shown in Figure 3. Notably, 22 July to 29 July and 3 August to 8 August were sunny days. The diurnal outdoor Ta fluctuated between 23.0 °C and 41.3 °C, and outdoor RH oscillated from 29.2% to 96.1%. Mean SR varied from 174 W/m2 to 941 W/m2, and outdoor va was up to 6.7 m/s.

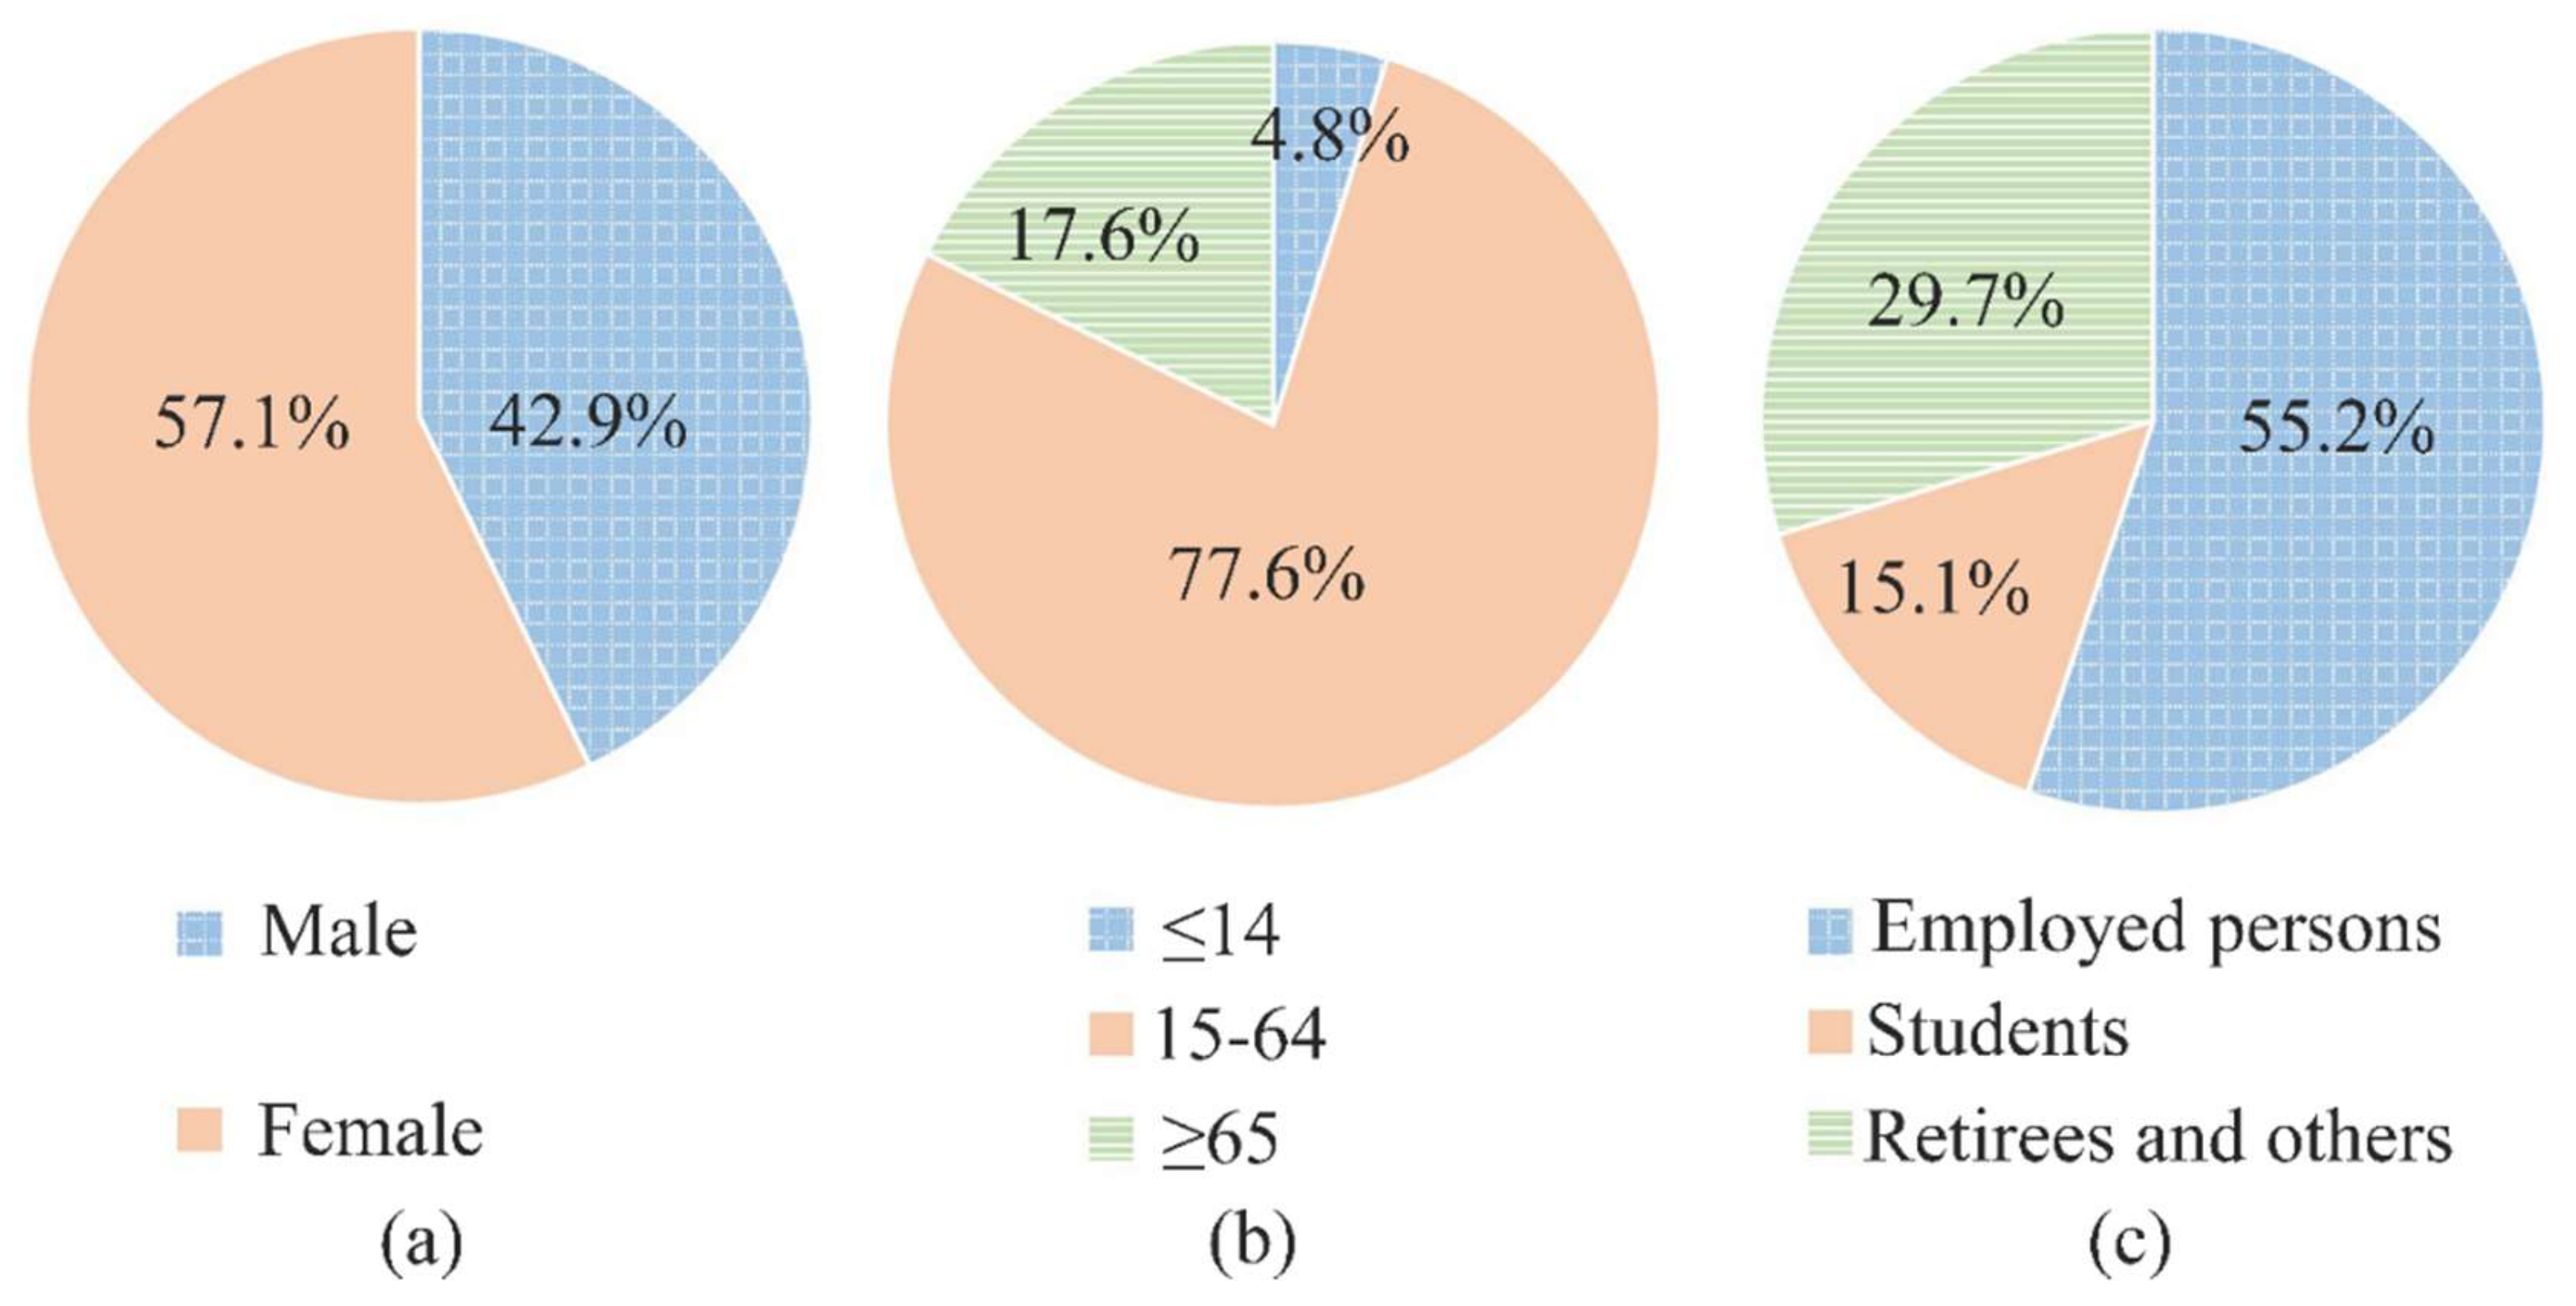
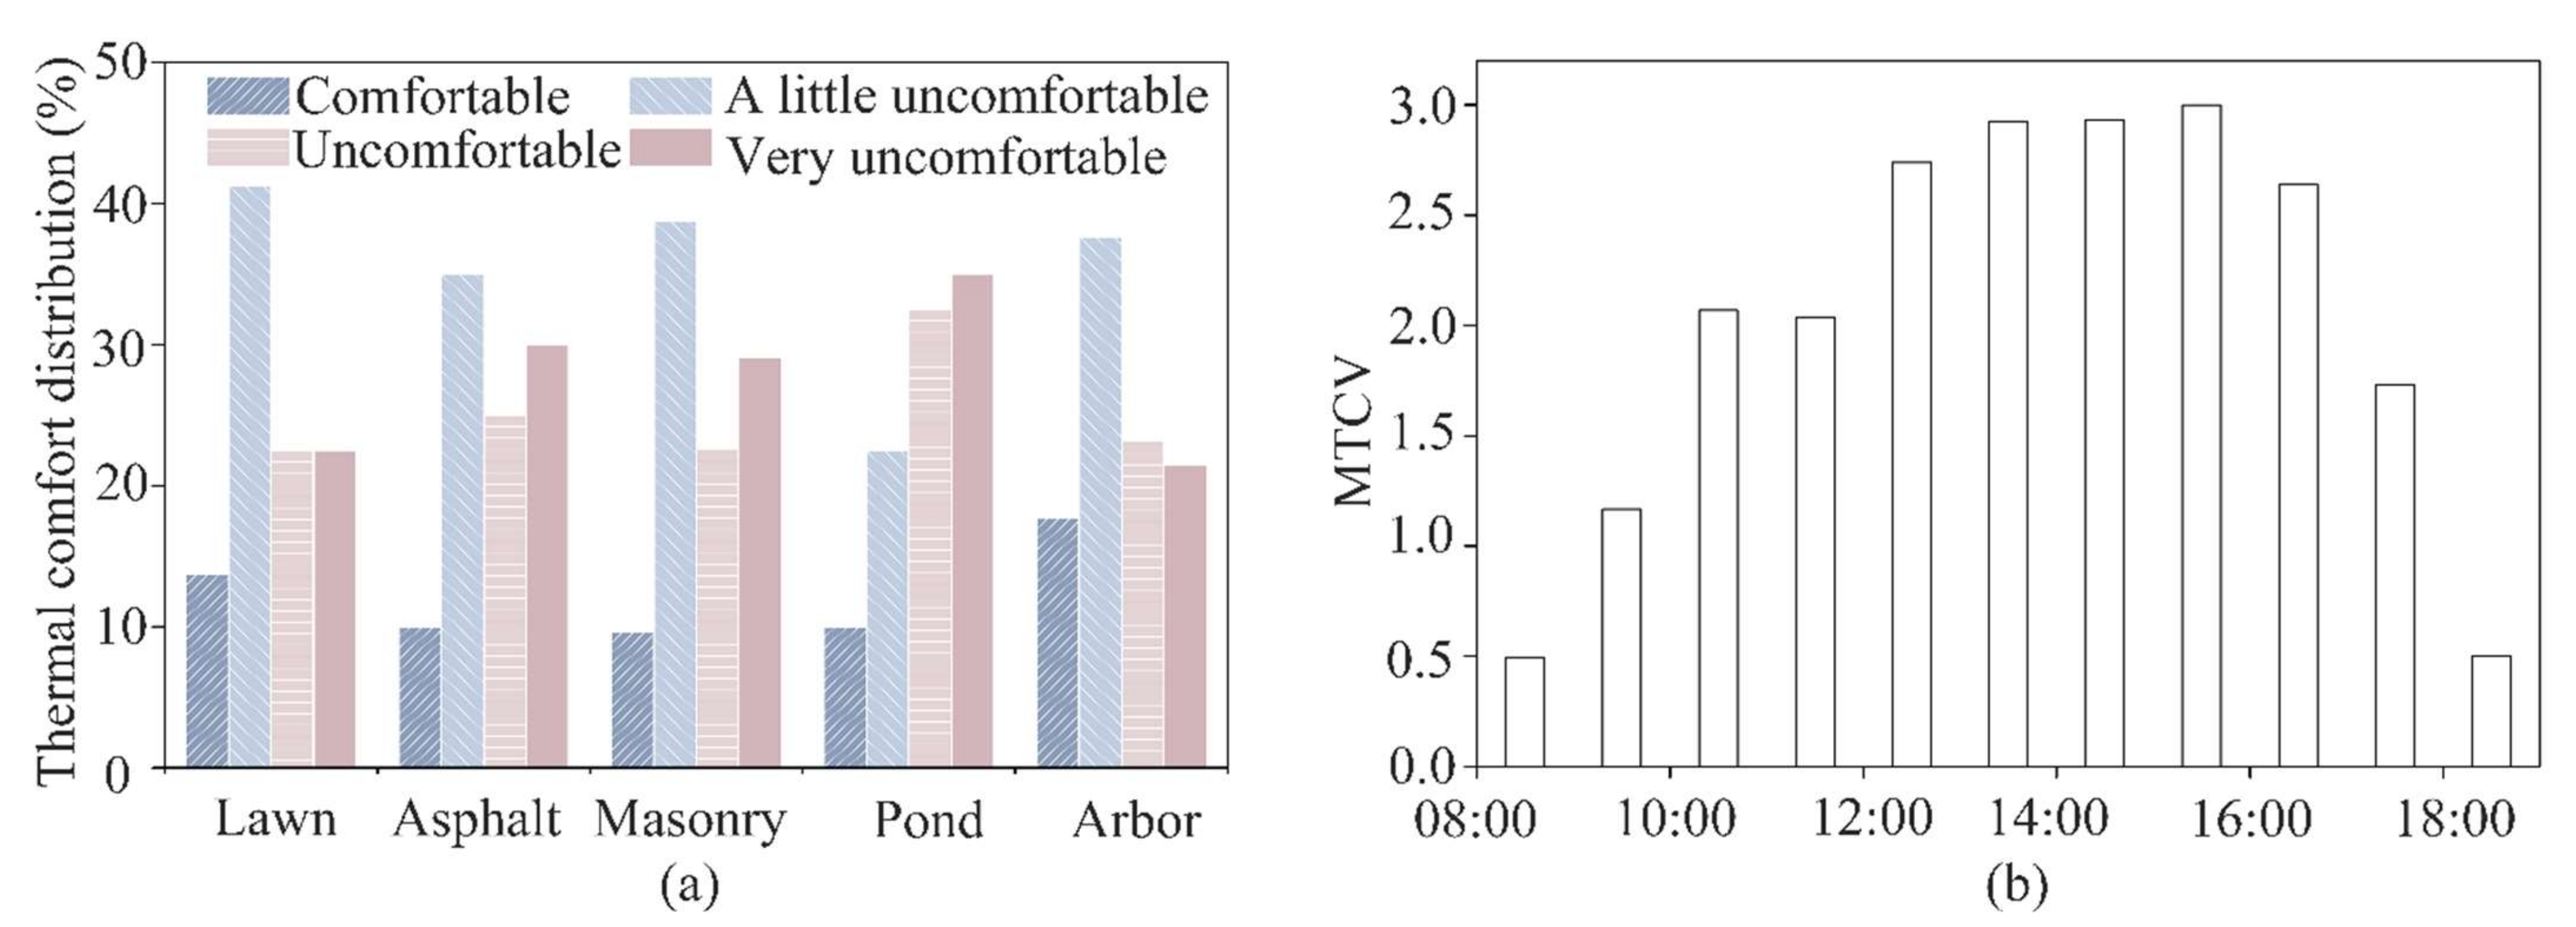
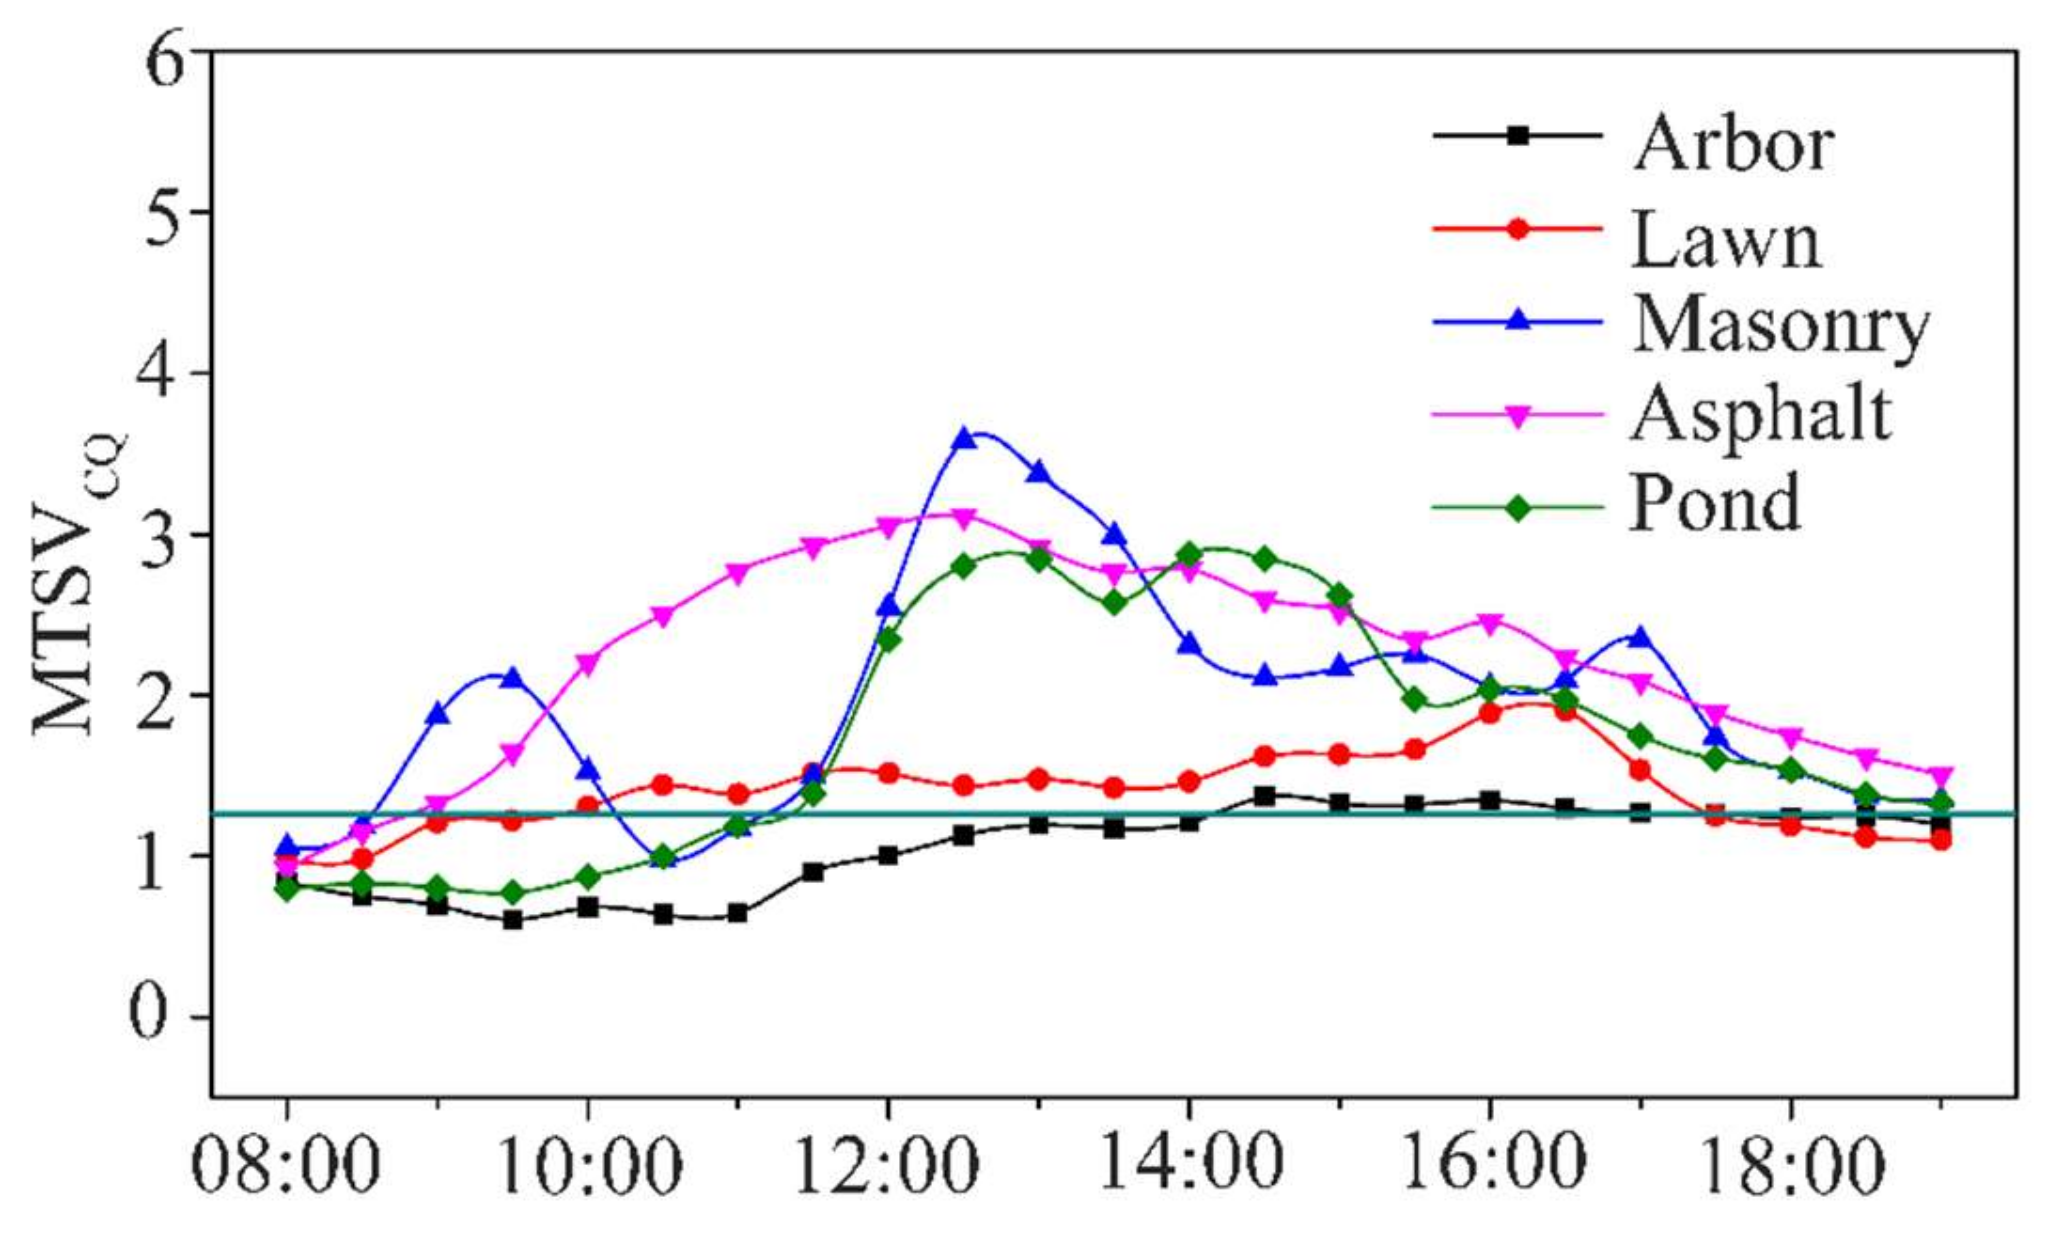
3.2. Thermal Sensation of Residents

This study further analyzed 357 valid questionnaires, reflecting the characteristics of residential outdoor areas. As shown in Figure 4, a total of 57.14% of the respondents were female, and they reported being more willing than males to carry out outdoor activities in the residential community, because they often looked after children. Interviewees aged from 15 to 64 constituted the sample majority, accounting for 77.59%. The reason for this was that some older people and younger children had limited writing ability, and teenagers preferred staying indoors in summer. More than half of the interviewees were employed, and had to go outside because of their jobs, while others preferred staying indoors to protect themselves against extreme thermal conditions.
According to the spatial mean thermal comfort vote (MTCV), 17.7% of the respondents under the arbors felt comfortable, while 44.6% of those interviewees felt uncomfortable or very uncomfortable. Arbors provided the largest proportion of comfortable respondents, and the smallest uncomfortable and very uncomfortable proportions, compared with the other underlying surfaces. It was found that 67.5% of respondents indicated they were uncomfortable or very uncomfortable, as reflected in Figure 5a, and that overall the respondents beside the pond felt the most uncomfortable. Figure 5b shows the temporal distributions of the MTCV; it was found that the MTCV returned low values in the periods 8:00–10:00 and 18:00–19:00, indicating that residents were obviously comfortable at these times.

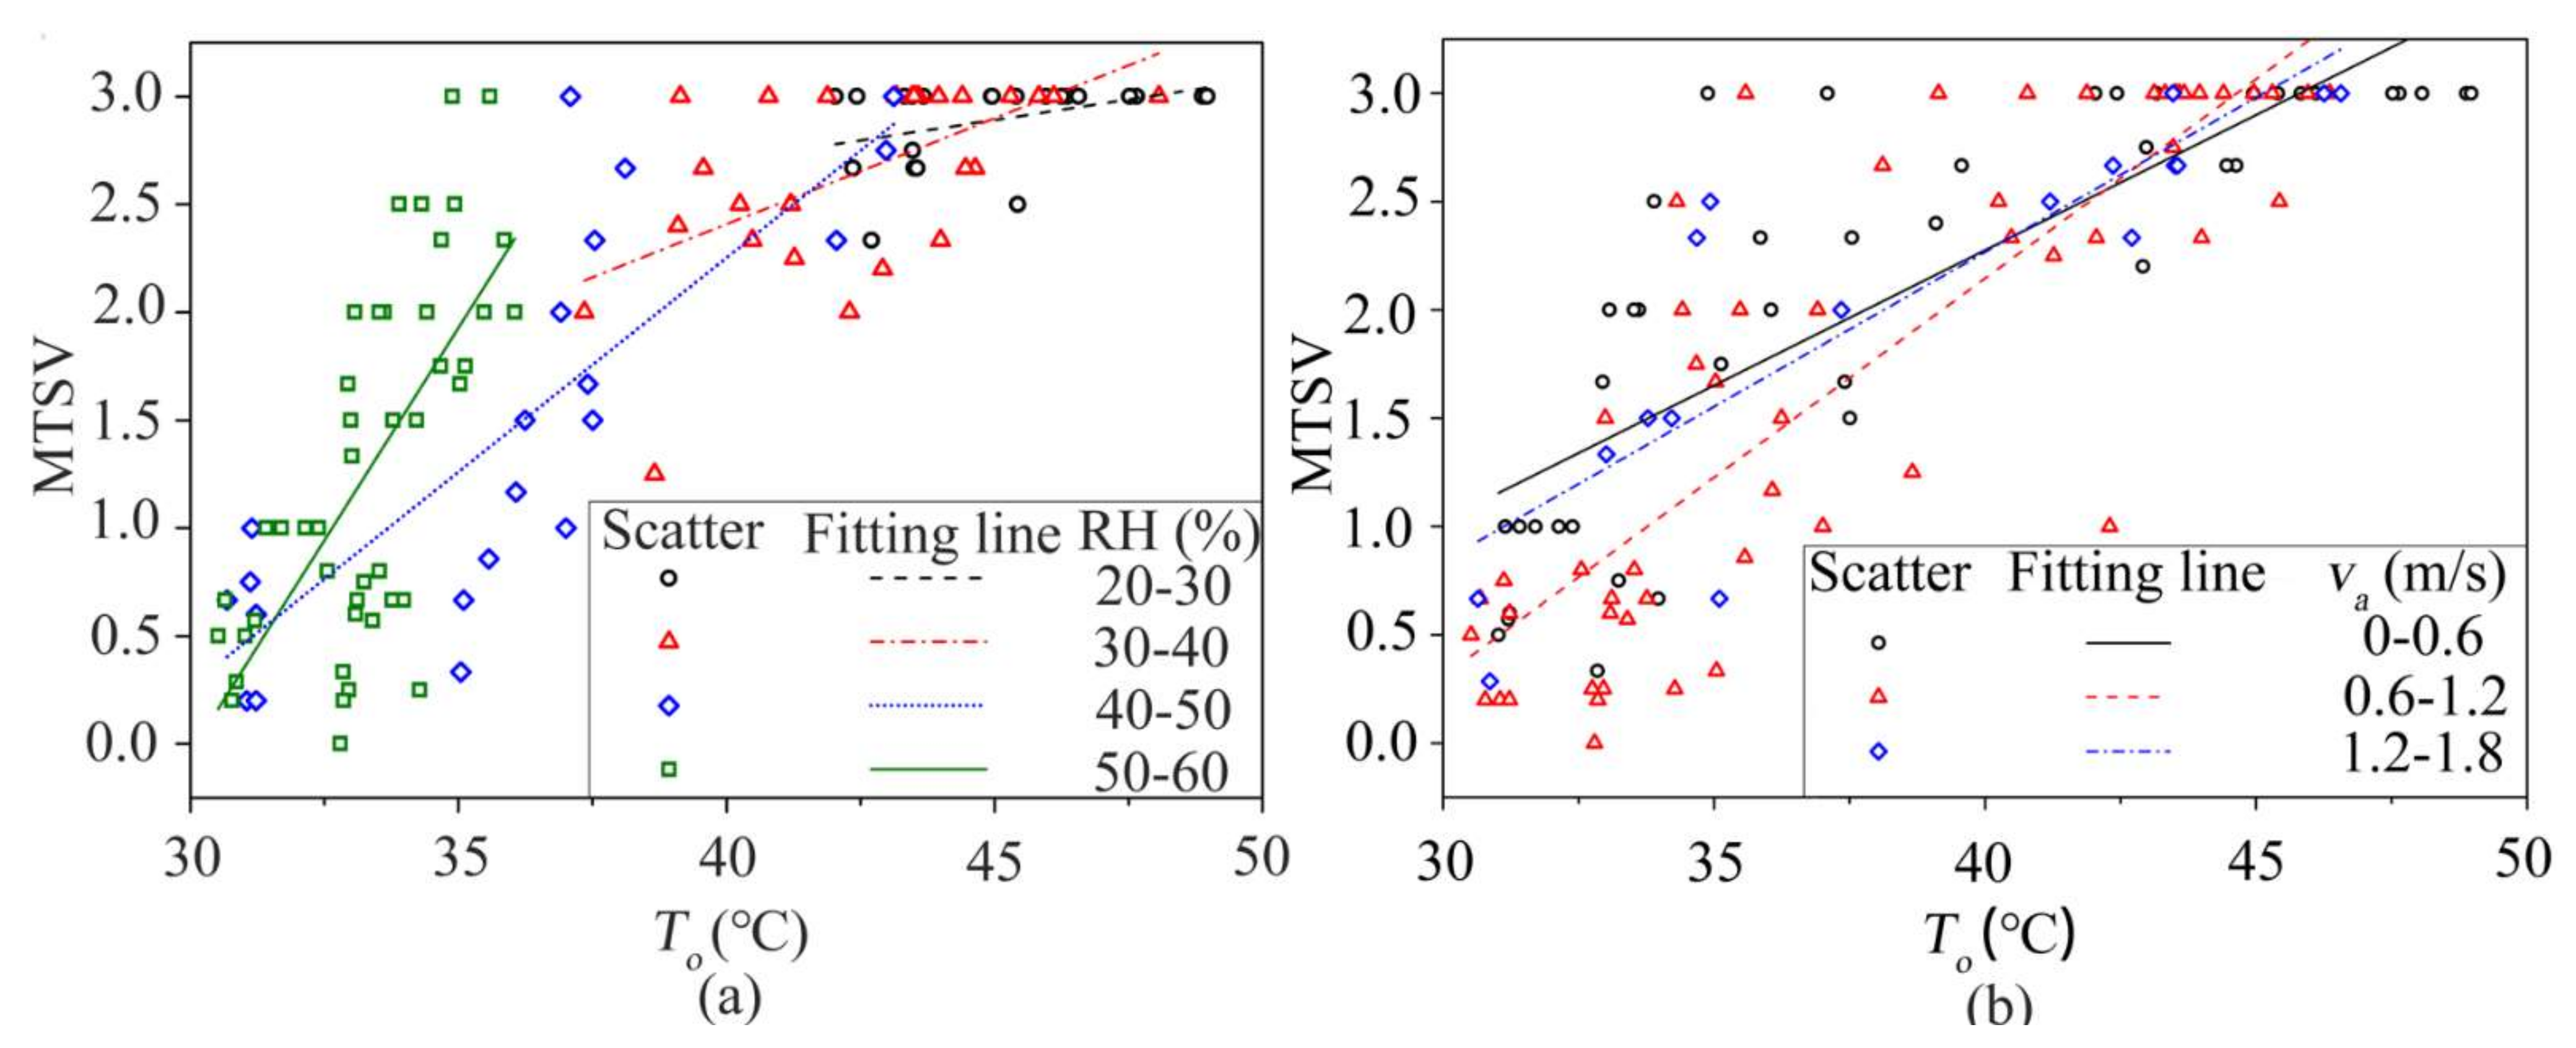
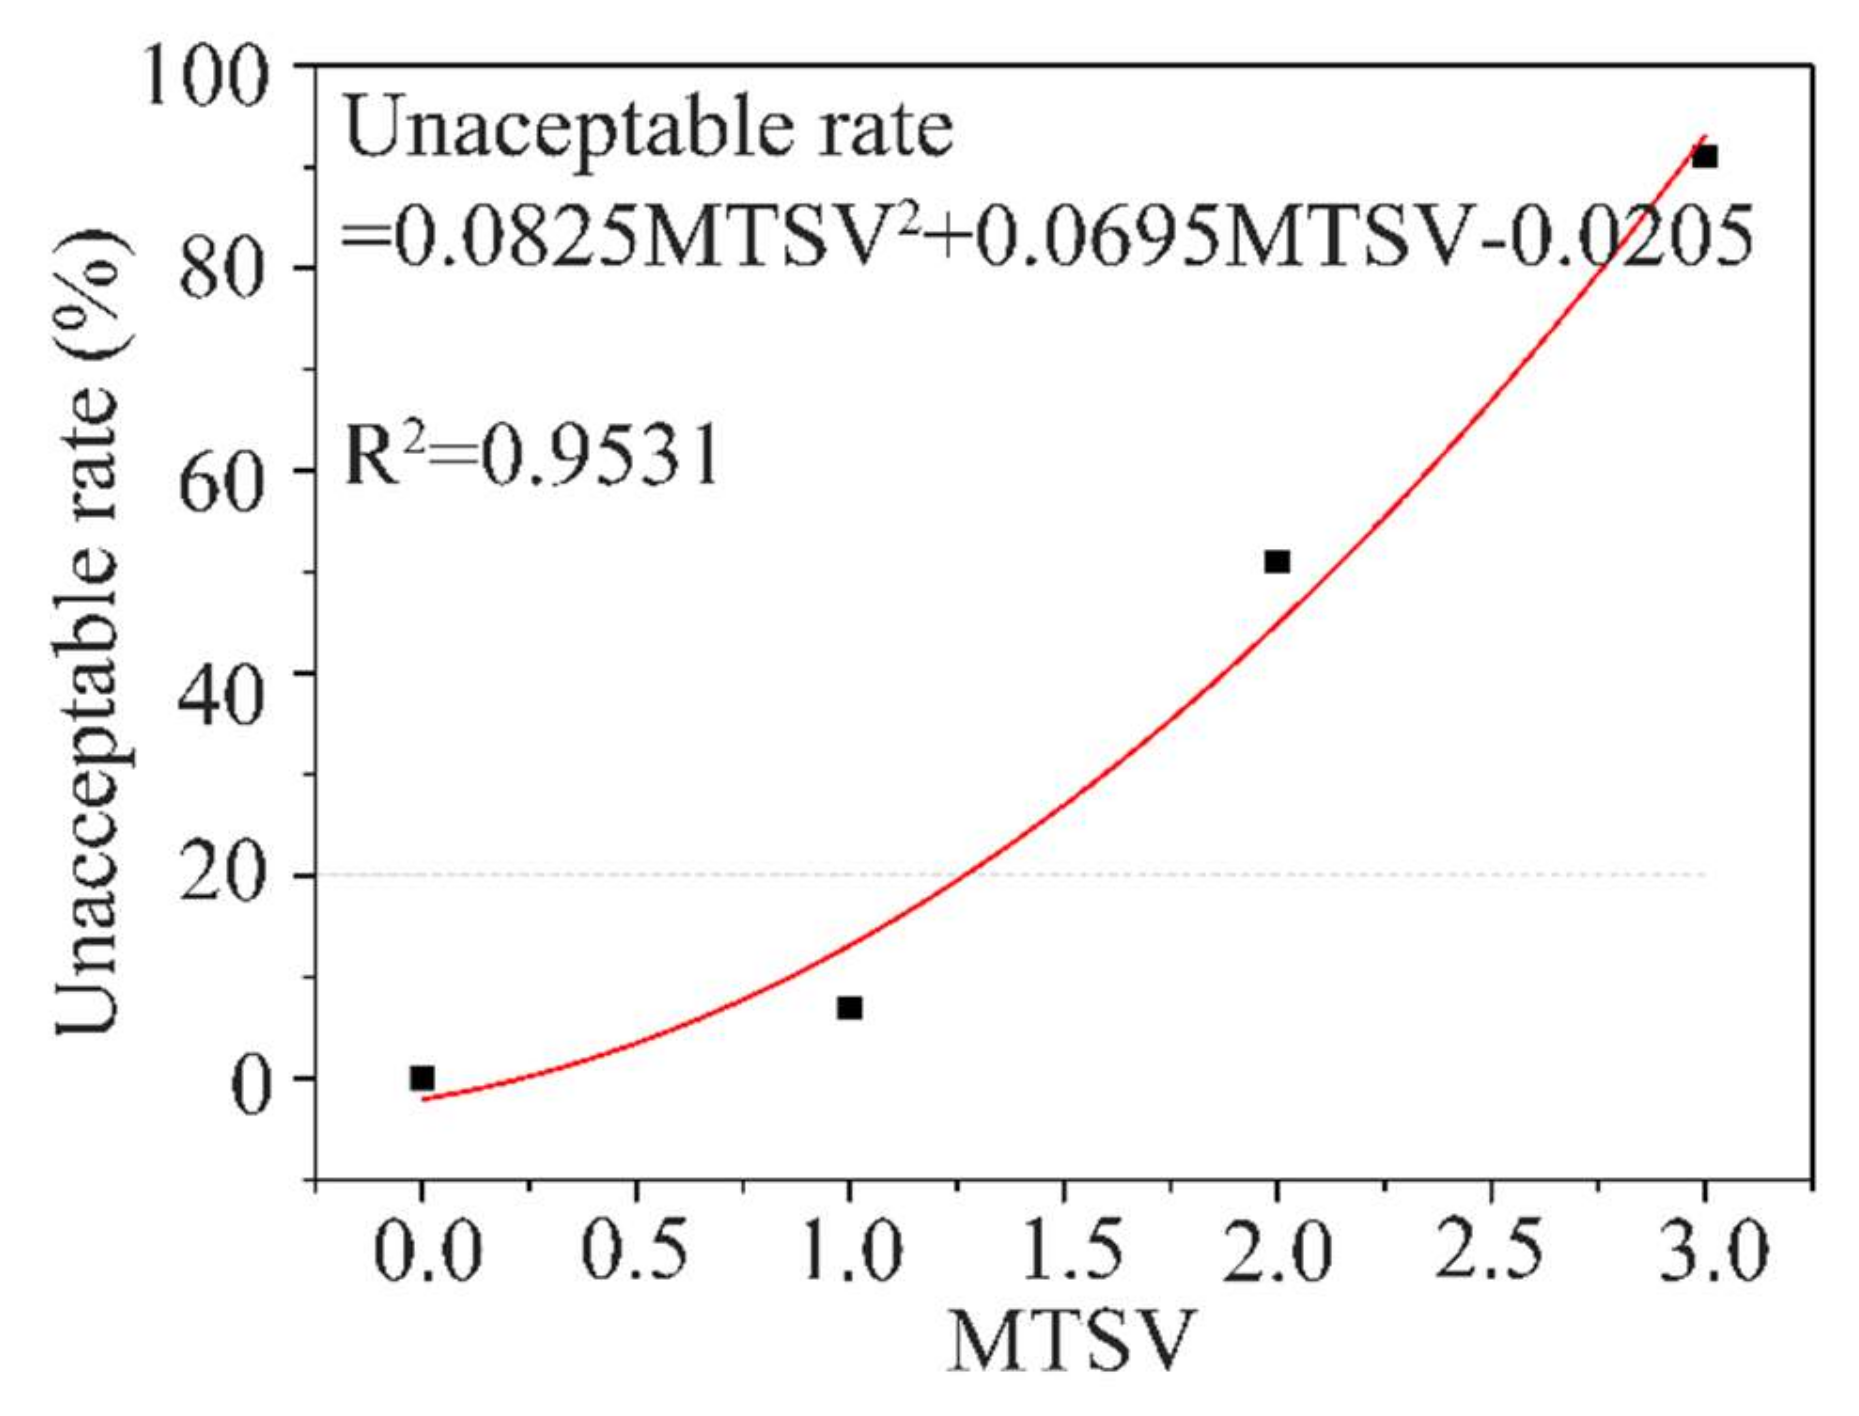
3.3. Empirical Model Establishment

The To value was used to identify multiple meteorological relations. It can be seen from Figure 6a that the higher the RH, the stronger the linear relationship between the To and MTSV, and that faster increase in MTSV accompanied the increase of To. The RH had a more obvious impact on outdoor thermal sensation than was reported in the results of Fang et al. [14]. People from Guangzhou may have adapted to an environment with high RH, so they were not so sensitive to changes in RH as Chongqing residents. Figure 6b clarifies the relationship between To and MTSV. When the To was less than 42 °C, the MTSV decreased with the increase of the va; when the To was higher than 42 °C, the MTSV rose with an increase in the va. This trend indicates that the weakening effect on the outdoor thermal sensation due to va had a threshold of To (To = 42 °C) in summer. Over this threshold (To > 42 °C), the weakening effect reversed, because hot wind transferred heat to human bodies when the To was at a high level [45]. Notably, with the increasing va, the influence of To on the MTSV became significant, which conformed to the results of Fang et al. [14]. Therefore, the interfering factors affecting MTSV were the multiple microclimatic factors.
It was essential to assess thermal sensation by combining questionnaires with microclimatic parameters [46]. The SR, an independent variable with multicollinearity, requires elimination to ensure the precision of the empirical model. In this study, the empirical model for evaluation of outdoor thermal sensation in summer was obtained based on multiple linear regression after removing variables with multicollinearity. Table 2 reveals that the correlation coefficients of SR with RH and Ta were above 0.9. It could be judged that multicollinearity was present between the SR and the other two variables. Moreover, SR had the least absolute value of correlation with the MTSV among the three parameters (RH, Ta, and SR).
Taking the Tmrt, Ta, RH, and va as the independent variables and the MTSV as the dependent variable, the empirical model of Chongqing residents’ outdoor thermal sensation in summer was exported with multiple linear regression using SPSS. The model without multicollinearity reached a significant level, since its significance level was 0.0000 (<0.0100), as shown in Table 3. Based on Table 4, the empirical model suitable for Chongqing residents was obtained as shown in Equation (5). According to the empirical model, a change of 1.6 °C in mean radiant temperature or a change of 0.3 m/s in wind speed would have the same effect as a change of 19.8% in relative humidity or a change of 1 °C in air temperature. However, the impact of RH on the MTSV was observed to be negative in Wuhan [18]. Lai et al. [18] considered autumn climate conditions, and the RH in Chongqing was much higher than in Wuhan in general. Chongqing residents prefer low RH to cool their thermal sensation, and high RH reduces the heat dissipation rate due to the reduced vapor pressure difference between the skin surface and the air [14]. Moreover, the empirical model obtained from Hadianpour et al. [40] was similar to Equation (5). The Ta has more influence on the MTSV in Tehran [40], due to the large Ta difference between day and night in summer, and local people are sensitive to the Ta.
MTSV CQ = 0 . 0990 T a 0 . 3020 v a + 0 . 0050 RH + 0 . 0620 T mrt 4 . 2490   ( R 2   = 0.6990 )

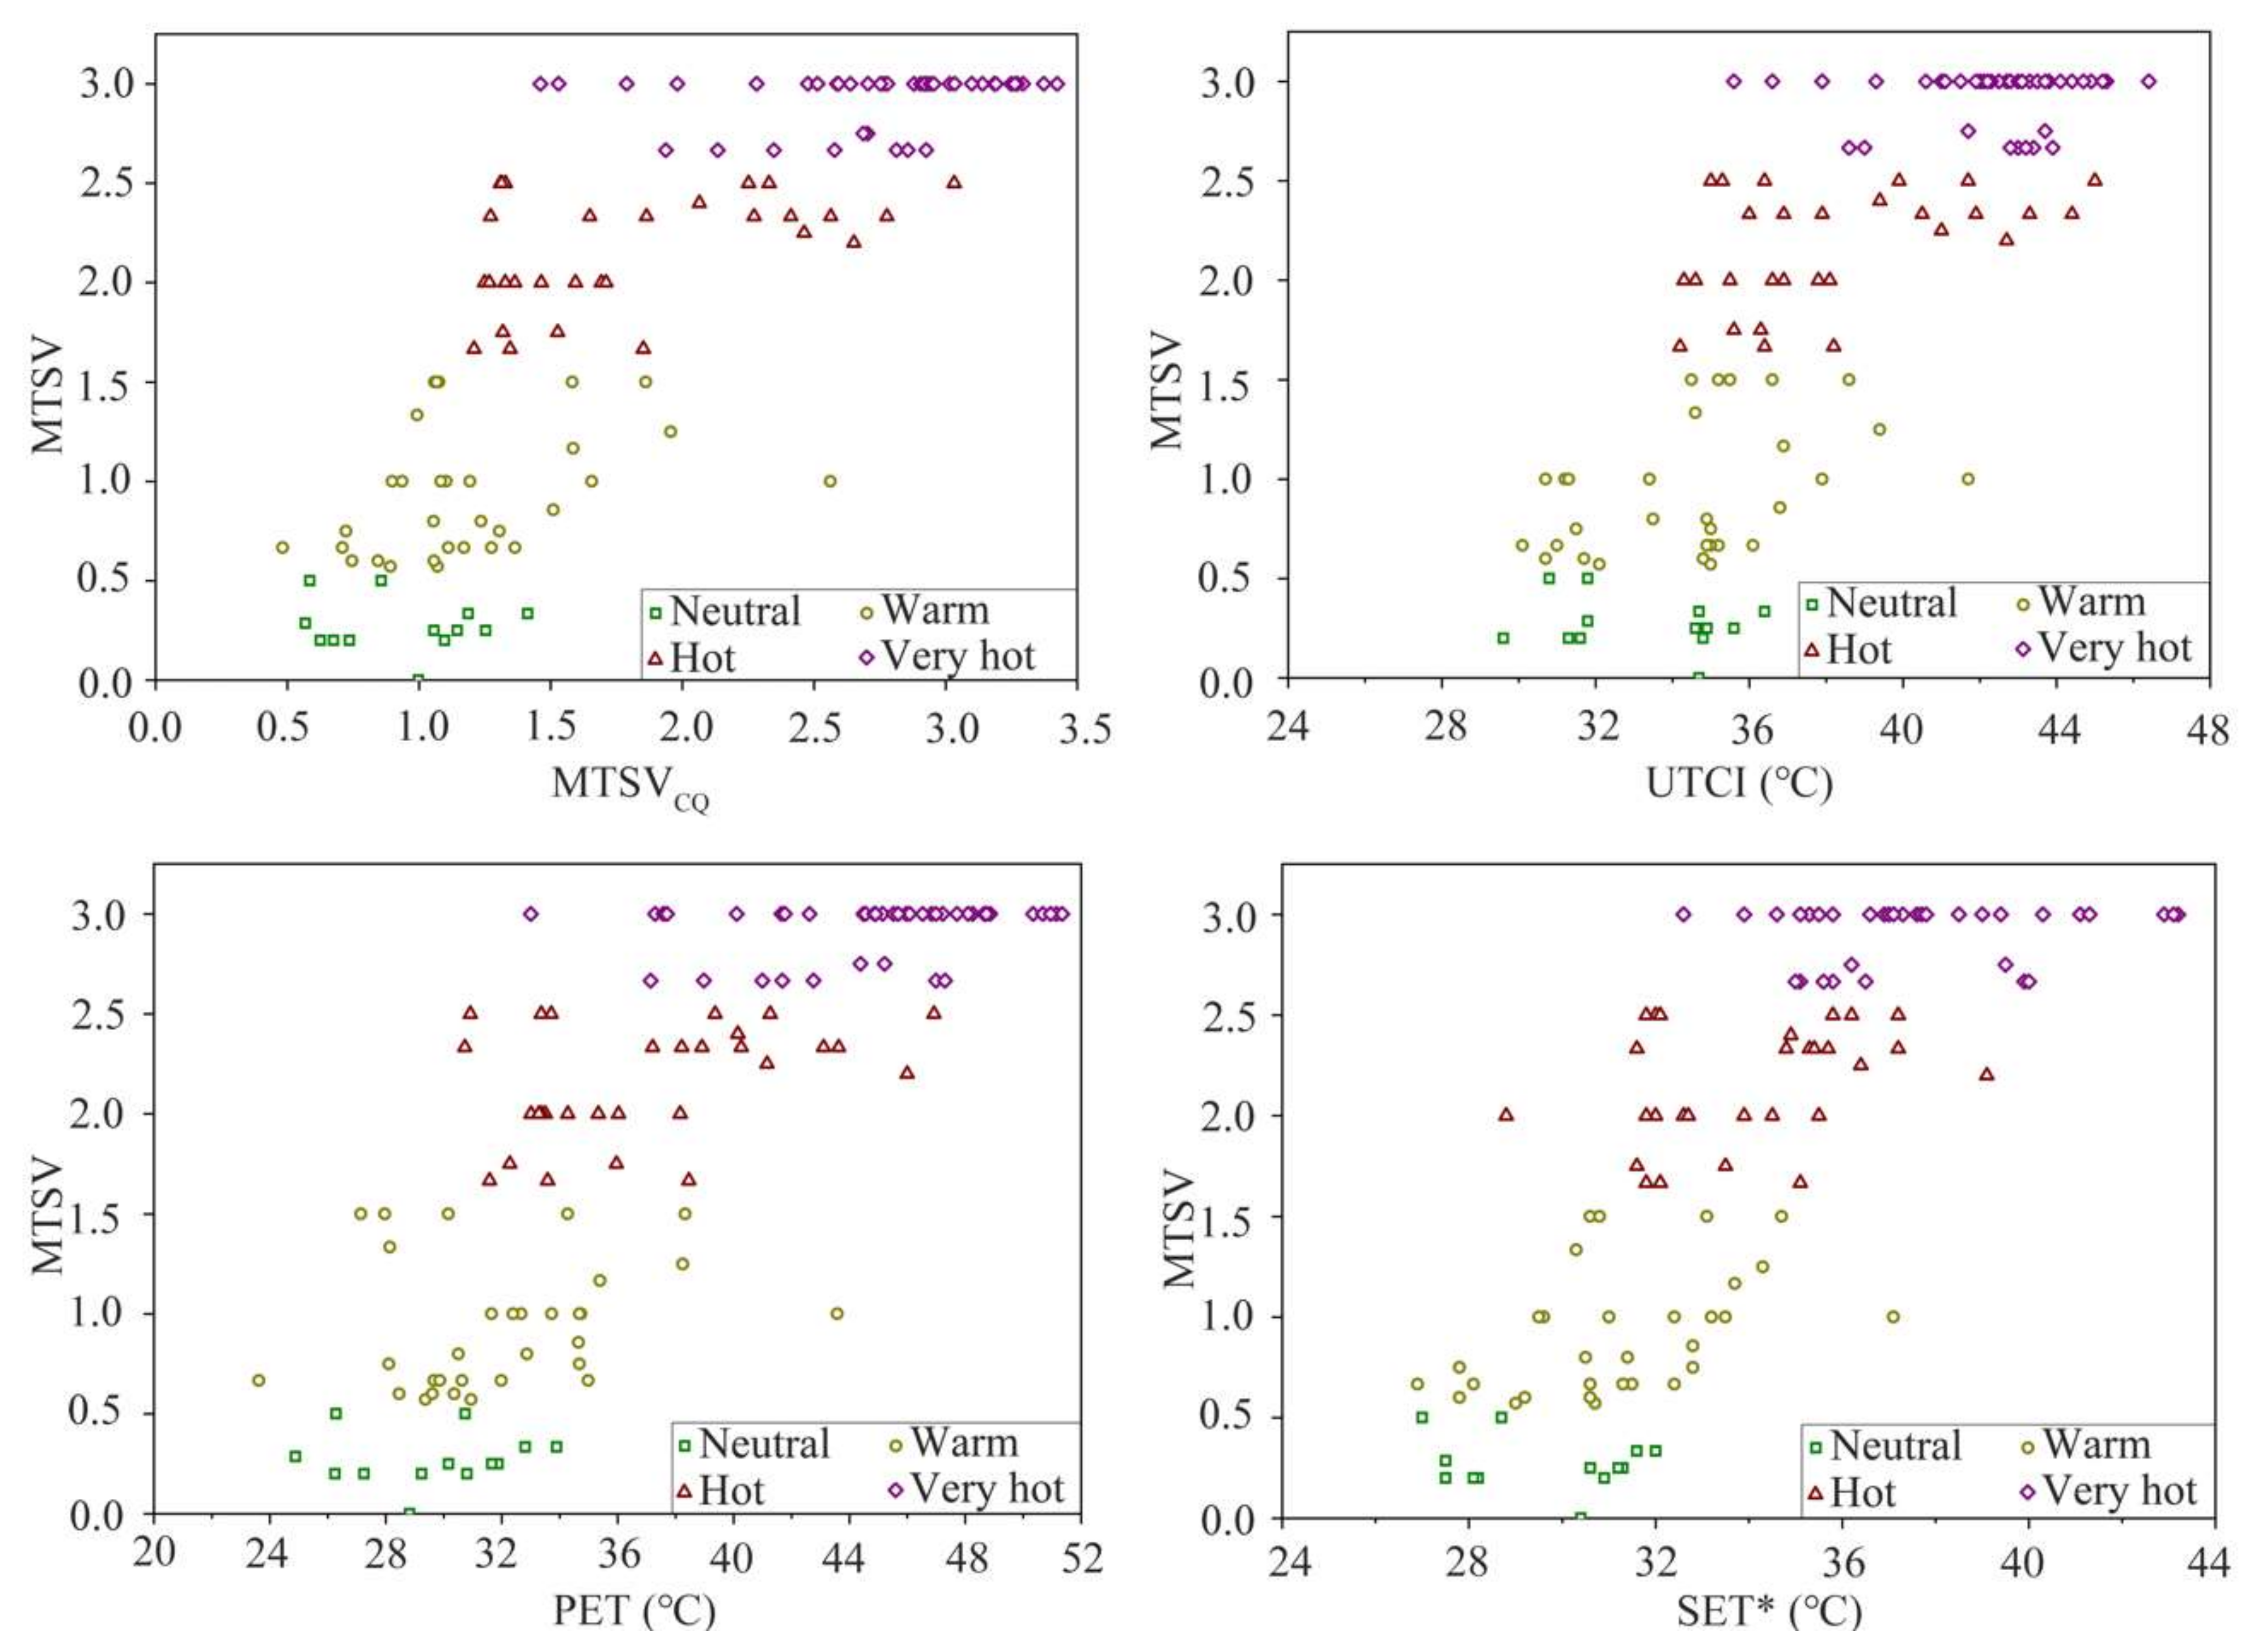
3.4. The Accuracies of Thermal Indices

The R2 of the MTSVCQ was 0.6990, indicating that about 30% of the thermal sensation vote could not be precisely explained. It was unclear whether this empirical model was best suited for predicting the thermal sensation of Chongqing residents. Some researchers found that theoretical thermal indices showed inaccuracies in predicting outdoor thermal sensation [47]. For instance, Chen et al. [43] discovered that accuracies were below 32.8% when using SET*, PET, and UTCI for predicting thermal sensation [43,44]. Golasi et al. [44] found that the accurately prediction rate of PET (25.4%) was higher than that of UTCI (23.0%) in Rome, Italy. Lucchese et al. [48] reported that in Campo Grande, Brazil the predictive abilities of PET and UTCI were 44 and 43%, respectively. Therefore, it is essential to choose a suitable thermal index for correctly evaluating residents′ thermal sensation [14]. Table 5 shows the range of theoretical indices’ values in relation to outdoor thermal sensation. Figure 7 indicates the classification applied to select the most appropriate thermal index by comparing the models’ accuracies.
Using thermal classifications to judge that the thermal sensation was acceptable and convenient, it was not necessary to obtain an accurate MTSV value to predict thermal sensation. Equation (4) was used to quantify the accuracies of the four thermal indices for predicting thermal sensation. The MTSVCQ could predict outdoor thermal sensation with 60.3% accuracy, which was 6.9%, 8.6%, and 6.0% higher than the UTCI, PET, and SET* models, respectively. When the sensation was neutral, all thermal indices predicted the neutral sensation as hotter. MTSVCQ had the highest predictions (74.1%) of a warm sensation, while UTCI (25.8%), PET (19.4%), and SET* (25.8%) showed significantly less predictive accuracy. The inaccuracy was mostly due to the four thermal indices treating a warm sensation as a hot or even very hot sensation. Especially, the MTSVCQ predicted 19.4% of warm sensations as hot, although this tendency changed with the rising values of the thermal indices. The UTCI had the highest accuracy in predicting hot sensations (58.6%), and this index was 13.8% higher than the MTSVCQ. The MTSVCQ consistently predicted a hot sensation as warm, while the UTCI and the other two theoretical thermal indices always predicted a hot sensation as very hot. PET was the most accurate predictor of very hot sensation (97.7%), 18.6% higher than the MTSVCQ. These inaccuracies were caused by predictions of a very hot sensation as a hot sensation.
The MTSVCQ showed better performance in predicting the outdoor thermal sensation of Chongqing residents. The MTSVCQ was highly accurate when the real thermal sensation was warm, but when the outdoor microclimate was hot or very hot the thermal sensation prediction became slightly weaker than the other three theoretical indices. However, when the real thermal sensation was neutral, all of the thermal indices predicted neutral sensations to be warm or even hot, due to their failure to consider local climatic adaptability. Repeated exposure to a given thermal stimulus results in a decline in the human body’s sensitivity [51], and people are generally better fitted in their local environment. This explains why thermal indices predicted neutral or warm sensations as hotter for Chongqing residents in summer. The above results demonstrate that Chongqing residents are more suited to a neutral or warm environment, and were less adaptable to microclimates when the outdoor thermal environment was hot or very hot. Nevertheless, it was possible for the models to predict very hot sensations as hot sensations, due to the absence of an upper limit for the thermal classification of very hot sensations.

3.5. Path Planning

After gathering from questionnaires information about unacceptable thermal rates in relation to four MTSV values, it was found that the unacceptability of the outdoor thermal rate had a quadratic relationship with the MTSV, as shown in Figure 8. According to ASHRAE 55-2017, the outdoor thermal environment can meet the respondents’ thermal comfort requirements when the rejective rate is less than 20% [34]. Consequently, Figure 8 demonstrates that the outdoor thermal environment of Chongqing residential districts in summer was comfortable when MTSV < 1.27. The outdoor thermal environment in residential areas could be evaluated to identify the spatiotemporal distribution of comfortable thermal sensation, based on the above MTSV interval.
For determining the optimal planning of outdoor paths in residential areas, including zones and corresponding time periods, it was necessary to obtain the spatiotemporal distribution of thermal sensation [52]. This could be predicted by the MTSVCQ, the most accurate thermal index. According to the MTSVCQ, higher va, lower Tmrt, lower Ta, and lower RH led to a more neutral thermal sensation. After inputting into the MTSVCQ model the average microclimatic parameters recorded from 22 July 2018, to 14 August 2018, the daytime predictive MTSV was calculated for each of the five underlying surfaces, as shown in Figure 9.
In the daylight, despite its properties of adjusting temperature and humidity, excellent ventilation, transpiration, and shade [53,54], the arbor stopped providing a comfortable thermal microclimatic for residents from 14:00 to 17:00, when the thermal sensation slightly exceeded the comfortable state. Residents could carry out activities beside the pond between 08:00 and 11:00, because this underlying surface showed the advantages of a comfortable thermal environment. However, the respondents who stayed beside the pond voted most frequently for the ‘uncomfortable’ or ‘very uncomfortable’ option, as shown in Figure 5a. Because the water’s temperature rose slowly in the morning due to heat storage and thermal inertia [11], and the time that the questionnaires were distributed beside the pond was mainly during the afternoon, the largest proportion of residents there felt uncomfortable or very uncomfortable. Moreover, masonry might only offer a comfortable microclimate between 10:15 and 11:00, because of the shielding of high-rise buildings resulting in the Tmrt and Ta. In the evening (17:30–19:00), the lawns reached comfortable states for residents to remain outdoors as the lack of shelter around them made it easy for heat to dissipate. Only the asphalt failed to achieve a comfortable state for residents to remain outdoors.
However, no designer had provided signs to notify the residents of the optimal paths available, thus the comfortable thermal environments provided by the various underlying surfaces were typically underutilized [52]. For facilitating outdoor activities in a comfortable outdoor environment, residents should make full use of this path planning to obtain comfortable thermal sensation as often as possible. Thus, people could move along the path recommended, as shown in Table 6. Residents could stay beside ponds or under arbors from 08:00 to 11:00. In addition, moving on the lawns in the evening (17:30–19:00) might also make residents feel comfortable. It might be suggested that residents stay indoors instead of going out between 14:00 and 17:00, or they could carry out activities under the arbors unless they had to go elsewhere, because this zone had the minimum values of MTSVCQ during that period.
In addition, designers could make improvements to the original underlying surfaces or pay attention to the setting of the underlying surfaces [52]. For example, to reduce SR and to cool the outdoor thermal sensation, trees could be planted beside the other underlying surfaces, and the designers should ensure that as much shade as possible covers the roads under the arbors. Furthermore, designers could add fountains to lawns, since irrigated lawns have strong transpiration in summer that might cool the environment and make residents more comfortable. Asphalt should be equipped with cooling infrastructures.

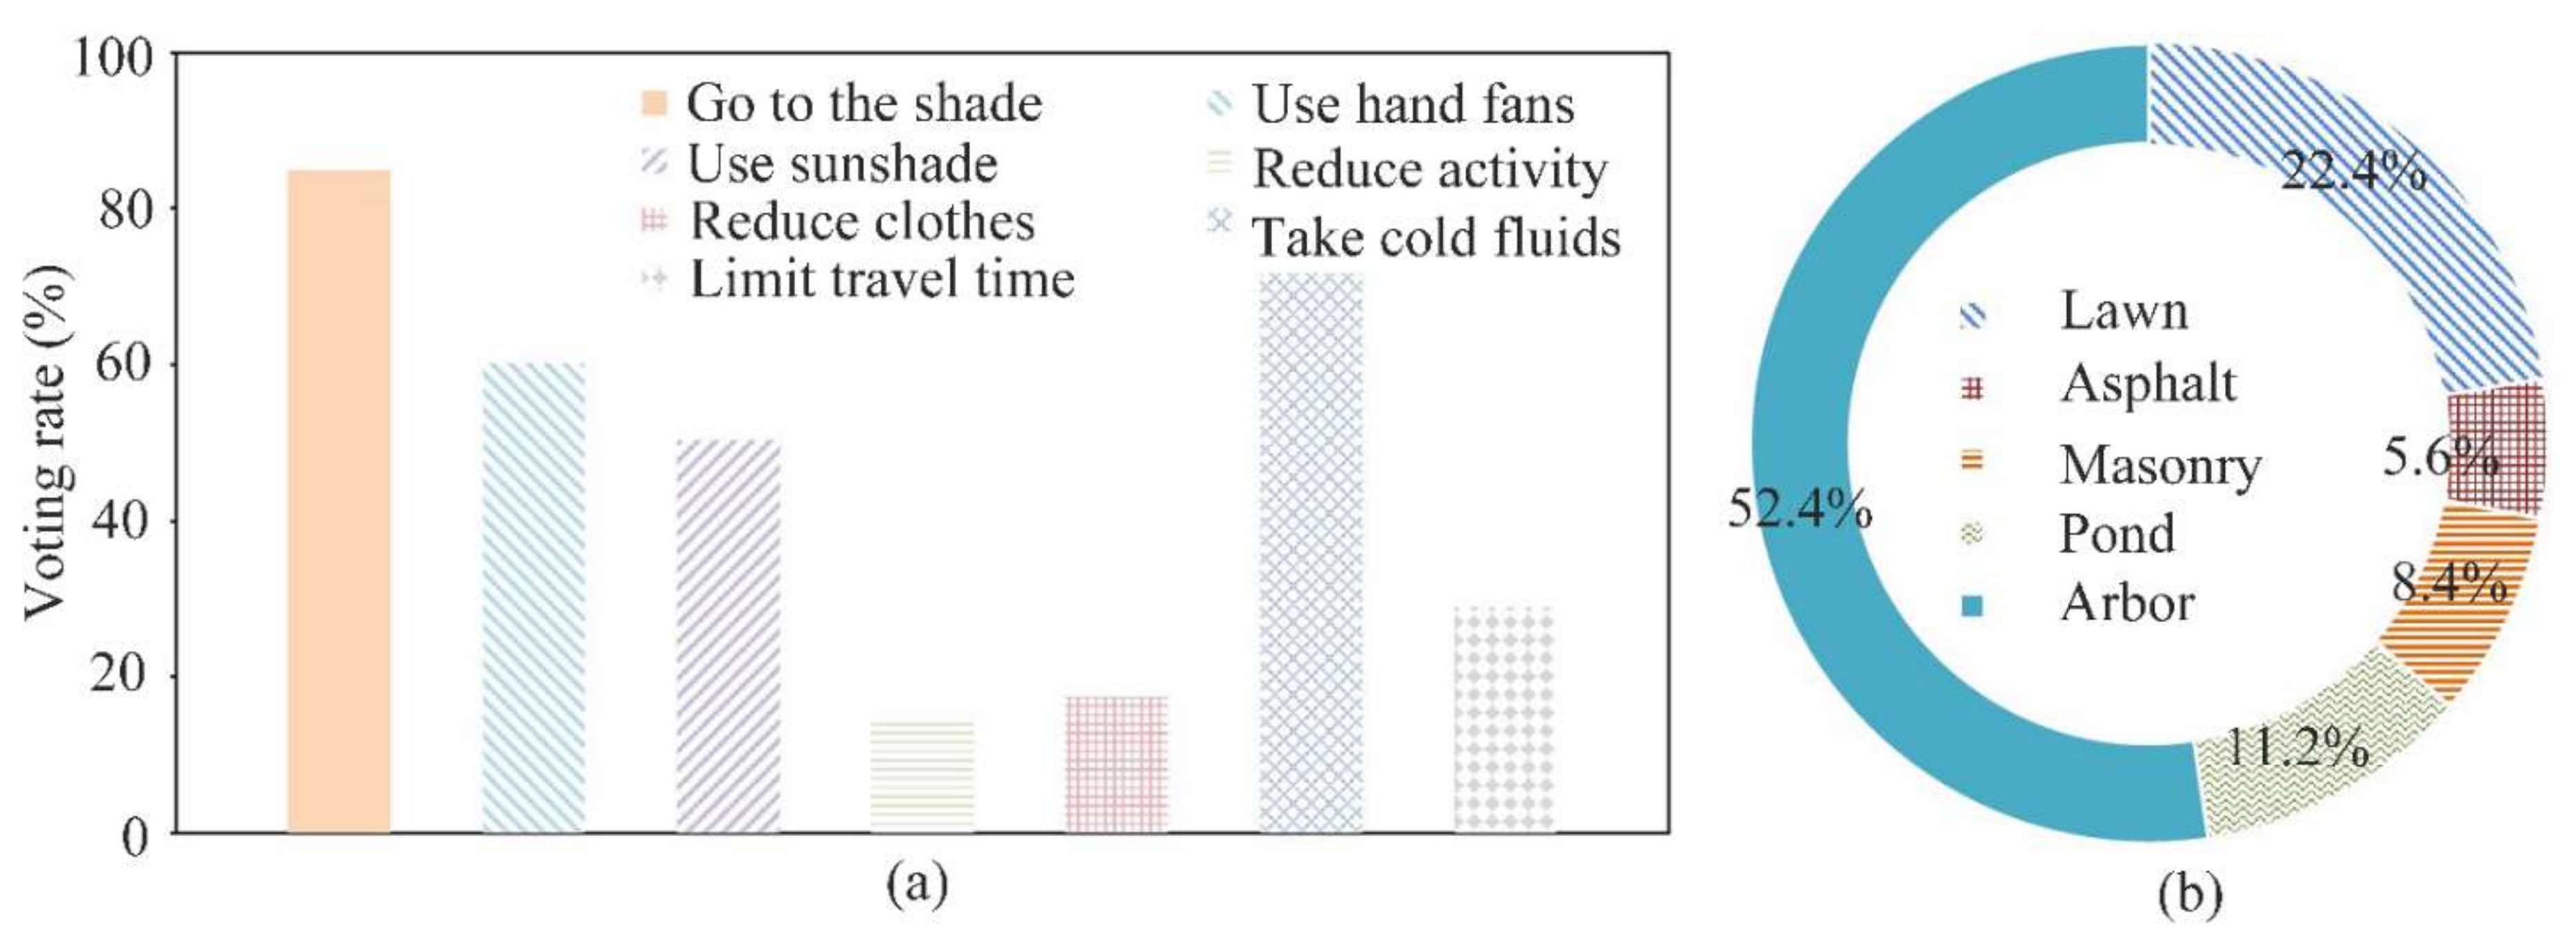
3.6. Thermal Adaptation

Residents′ adaptation to and perception of the thermal environment are the overall effects of thermal adaptation. People instinctively try to avoid uncomfortable external stimulation by thermal adaptation, including physiological, psychological, and behavioral adaptations [55]. Humans are not passive recipients of the external environment. Thus, we adopt coping measures as our capacity allows when we feel thermally uncomfortable because of extreme weather. Hence, behavioral adaptations are used, i.e., people take steps to modify heat exchange to ensure thermal comfort. Physiological adaptation alters physiological reactions towards microclimates to mitigate heat strain. In a given thermal environment, sweating, vasoconstriction, vasodilation, and other physiological responses can be regarded as physiological adaptations [56], which play an essential role in maintaining the core temperature of the human body at a reasonable level [57,58]. Psychological adaptation affects habituation and the expectation of thermal sensation [59], but it cannot be measured or quantified directly.
In this context, it was generally believed that behavioral influences were more significant than physiological and psychological adaptations [60]. The choices of the interviewees supported this view because they chose some options represented in the questionnaires, and added nothing in the blank space after ‘others’. It was found that all the respondents adjusted their behaviors to adapt to the microclimate. This also demonstrated that behavioral adaptation was the most popular and effective way for residents to maintain comfortable states. Figure 10a shows that remaining in the shade was the most efficient way to cool down. Of the five underlying surfaces, most people chose to go to the shaded area provided by arbors to avoid exposure to sunlight, because the Ta and SR there were obviously lower than in other places [61]. Figure 9 also illustrates that staying under the arbors was the most thermally comfortable option. Respondents were thus unwilling to stay on the masonry or asphalt, or close to the pond.
Furthermore, some people preferred to walk on the lawn, providing an appropriate regulation of humidity and temperature [62,63]. This finding was consistent with Figure 5a. About 60% of residents expected the wind to cool the thermal sensation, and they often used hand fans to cool themselves. The effect of reduction of wind speed on outdoor thermal sensation in summer was minimal, and even had an adverse effect when Ta and Tmrt reached high levels. Therefore, people adjusted the times when they went outside in such extreme weather. They chose to go out in the mornings or evenings when the microclimate reached a comfortable state. When they stayed outdoors under extreme weather, they preferred drinking cold drinks to cool themselves down, because they failed to maintain thermal comfort whatever else they did.

3.7. Limitations and Future Work

The empirical model only considered the effect of microclimatic parameters on outdoor thermal sensation. In fact, personal factors also had obvious influences on thermal sensation, including metabolism [38], clothing resistance [38,64], and thermal adaptation [55].
There was no bench near to the measuring sites and the questionnaire only recorded the subjects’ activities within the past 5 min, thus leaving no one to select the sitting option. Fang et al. [38] suggested when people moved at a speed of less than 3.2 km/h, their metabolic rate had a negligible effect on thermal sensation. Importantly, residents always carry out their various activities whilst maintaining their own unique metabolisms. Future research could concentrate on how outdoor thermal sensation changes with various metabolic rates. Furthermore, all the residents wore low-resistance clothing in summer, and different clothing resistance significantly changes human thermal sensation [64]. Therefore, the empirical model should consider these personal objective parameters.
It is generally considered that perception and response to sensory information changes due to past subjective experiences and expectations [59]. Yao et al. [55] explained that people establish their behaviors and psychological thermal expectations based on their previous thermal experience, which could affect physiological thermal responses to physical stimulation from the outdoor environment. After adjusting for behavior, physiology, and psychology, human outdoor thermal sensations were stable and could be presented as a value and regarded as a thermal experience [55]. People’s physiological, psychological, and behavioral responses are complex, so the reaction of thermal sensation to the environment remains unknown, which makes it complicated to quantify. Therefore, the empirical model had a limited capacity to predict thermal sensations accurately. The Black Box method, reflecting the system’s control mechanism, is widely used in cybernetics [55]. The Black Box system can obtain the logical and mathematical relationship between the input information and the output instructions, while all details of the black box remain unknown [55]. In the future, it might be worth gaining an understanding of how to deal with climate, thermal history, expectations, psychology, behavior, and other factors within the black box, to improve the accuracy of the empirical model.

4. Conclusions

An approach for predicting outdoor thermal sensation was introduced, to build a universal empirical model. For investigation of the most accurate thermal index for predicting local outdoor thermal sensation, the MTSVCQ was established based on the universal approach with multiple linear regression. The MTSVCQ had better accuracy compared with PET, UCTI, and SET*. The MTSVCQ predicted all the neutral sensations as warm, 19.4% of the warm sensations as hot, 41.4% of the hot sensations as warm, and 20.9% of the very hot sensations as cooler. These inaccuracies indicated that Chongqing residents had limited heat tolerance. The MTSVCQ was employed to evaluate the spatiotemporal thermal sensation associated with five common underlying surfaces. According to the comfortable state when MTSV < 1.27, based on arthe rejective rate less than 20%, the arbors provided residents with a comfortable thermal microclimate from 08:00 to 14:00 and 17:00 to 19:00, as did the pond between 08:00 and 11:00. Masonry offered a comfortable microclimate between 10:15 and 11:00, and the lawns reached comfortable states in the evening (17:30–19:00), while only the asphalt never created a comfortable thermal microclimate. These findings can guide optimal path planning for occupants.

Author Contributions

Conceptualization, Y.L., Y.G., D.S., C.Z., Z.L. and Z.H.; methodology, Y.L., D.S., C.Z., Z.L. and Z.H.; software, Y.L.; validation, Y.L. and D.S.; formal analysis, Y.L., D.S. and C.Z.; investigation, D.S. and Z.H.; resources, Y.G.; data curation, Y.L., Y.G. and Z.H.; writing—original draft preparation, Y.L., D.S., C.Z., Z.L. and Z.H.; writing—review and editing, Y.L., D.S. and C.Z.; visualization, Y.L.; supervision, Y.G., D.S. and C.Z.; project administration, Y.G. and Z.H.; funding acquisition, Y.G. All authors have read and agreed to the published version of the manuscript.

Funding

This research was funded by [National Key R&D Program of China] grant number [2017YFC0702900].

Informed Consent Statement

Informed consent was obtained from all subjects involved in the study.

Acknowledgments

Authors are thankful to respondents of the field survey, for useful data and valuable information on our research. The authors would like to acknowledge the National Key R&D Program of China, for financially supporting this work.

Conflicts of Interest

The authors declare no conflict of interest.

Nomenclature

DGlobe Diameter, 0.15 m
FPFalse prediction
F1Regression Constant of Air Temperature
F2Regression Constant of Wind Speed
F3Regression Constant of Relative Humidity
F4Regression Constant of Mean Radiant Temperature
F5Regression Constant of Solar Radiation Intensity
F6Intercept of the Regression Model
hrRadiant heat transfer coefficient, 4.71 W/(m2·K)
MTCVMean Thermal Comfort Vote
MTSVMean Thermal Sensation Vote
MTSVCQPredictive Chongqing Mean Thermal Sensation Vote
MTSVNEWUniversal Predictive Mean Thermal Sensation Vote
PETPhysiological Equivalent Temperature (°C)
PMVPredicted Mean Vote
RHRelative Humidity (%)
SET*Standard Effective Temperature (°C)
SRSolar Radiation Intensity (W/m2)
TaAir Temperature (°C)
TgBlack Globe Temperature (°C)
TmrtMean Radiant Temperature (°C)
ToOperative Temperature (°C)
TPTrue Prediction
UTCIUniversal Thermal Climate Index
VIFVariance Inflation Factor
vaWind Speed (m/s)
εgglobe emissivity, 0.95

Appendix A

Figure A1. Questionnaire.
Buildings 12 01564 g0a1

References

  1. Åström, D.O.; Bertil, F.; Joacim, R. Heat wave impact on morbidity and mortality in the elderly population: A review of recent studies. Maturitas 2011, 69, 99–105. [Google Scholar] [CrossRef] [PubMed]
  2. Rosenthal, J.K.; Kinney, P.L.; Metzger, K.B. Intra-urban vulnerability to heat-related mortality in New York City, 1997–2006. Health Place 2014, 30, 45–60. [Google Scholar] [CrossRef] [PubMed]
  3. Epstein, Y.; Moran, D.S. Thermal comfort and the heat stress indices. Ind. Health 2006, 44, 388–398. [Google Scholar] [CrossRef] [PubMed]
  4. Coffel, E.D.; Horton, R.M.; de Sherbinin, A. Temperature and humidity based projections of a rapid rise in global heat stress exposure during the 21st century. Environ. Res. Lett. 2018, 13, 014001. [Google Scholar] [CrossRef] [PubMed]
  5. Zheng, Z.; Zhang, Y.; Mao, Y.; Yang, Y.; Fu, C.; Fang, Z. Analysis of SET* and PMV to evaluate thermal comfort in prefab construction site offices: Case study in South China. Case Stud. Therm. Eng. 2021, 26, 101137. [Google Scholar] [CrossRef]
  6. Fanger, P.O. Thermal Comfort: Analysis and Applications in Environmental Engineering; Copenhagen Danish Technical Press: Copenhagen, Denmark, 1970; p. 244. [Google Scholar]
  7. Huang, Z.; Gou, Z.; Cheng, B. An investigation of outdoor thermal environments with different ground surfaces in the hot summer-cold winter climate region. J. Build. Eng. 2020, 27, 100994. [Google Scholar] [CrossRef]
  8. Gagge, A.P.; Fobelets, A.P.; Berglund, L.G. A standard predictive index of human response to the thermal environment. ASHRAE Trans. 1986, 92, 709–731. [Google Scholar]
  9. Mayer, H.; Höppe, P. Thermal comfort of man in different urban environments. Theor. Appl. Climatol. 1987, 38, 43–49. [Google Scholar] [CrossRef]
  10. Matzarakis, A.; Mayer, H.; Iziomon, M. Applications of a universal thermal index: Physiological equivalent temperature. Int. J. Biometeorol. 1999, 43, 76–84. [Google Scholar] [CrossRef]
  11. Höppe, P. Different aspects of assessing indoor and outdoor thermal comfort. Energy Build. 2002, 34, 661–665. [Google Scholar] [CrossRef]
  12. Lenzholzer, S.; Klemm, W.; Vasilikou, C. Qualitative methods to explore thermo-spatial perception in outdoor urban spaces. Urban Clim. 2016, 23, 231–249. [Google Scholar] [CrossRef] [Green Version]
  13. Cheung, P.K.; Jim, C. Subjective outdoor thermal comfort and urban green space usage in humid-subtropical Hong Kong. Energy Build. 2018, 173, 150–162. [Google Scholar] [CrossRef]
  14. Fang, Z.; Feng, X.; Liu, J.; Lin, Z.; Mak, C.M.; Niu, J.; Tse, K.-T.; Xu, X. Investigation into the differences among several outdoor thermal comfort indices against field survey in subtropics. Sustain. Cities Soc. 2019, 44, 676–690. [Google Scholar] [CrossRef]
  15. Nikolopoulou, M.; Baker, N.; Steemers, K. Thermal comfort in outdoor urban spaces: Understanding the human parameter. Sol. Energy 2001, 70, 227–235. [Google Scholar] [CrossRef]
  16. Ghani, S.; Mahgoub, A.O.; Bakochristou, F.; ElBialy, E.A. Assessment of thermal comfort indices in an open air-conditioned stadium in hot and arid environment. J. Build. Eng. 2021, 40, 102378. [Google Scholar] [CrossRef]
  17. Knez, I.; Thorsson, S.; Eliasson, I.; Lindberg, F. Psychological mechanisms in outdoor place and weather assessment: Towards a conceptual model. Int. J. Biometeorol. 2009, 53, 101–111. [Google Scholar] [CrossRef]
  18. Lai, D.; Zhou, C.; Huang, J.; Jiang, Y.; Long, Z.; Chen, Q. Outdoor space quality: A field study in an urban residential community in central China. Energy Build. 2014, 68 Pt. B, 713–720. [Google Scholar] [CrossRef]
  19. Zhang, X.; Wang, Y.; Zhou, D.; Yang, C.; An, H.; Teng, T. Comparison of Summer Outdoor Thermal Environment Optimization Strategies in Different Residential Districts in Xi’an, China. Buildings 2022, 12, 1332. [Google Scholar] [CrossRef]
  20. Mi, J.; Hong, B.; Zhang, T.; Huang, B.; Niu, J. Outdoor thermal benchmarks and their application to climate-responsive designs of residential open spaces in a cold region of China. Build. Environ. 2020, 169, 106592. [Google Scholar] [CrossRef]
  21. Sayad, B.; Alkama, D.; Ahmad, H.; Baili, J.; Aljahdaly, N.H.; Menni, Y. Nature-based solutions to improve the summer thermal comfort outdoors. Case Stud. Therm. Eng. 2021, 28, 101399. [Google Scholar] [CrossRef]
  22. Yu, H.; Fukuda, H.; Zhou, M.; Ma, X. Improvement Strategies for Microclimate and Thermal Comfort for Urban Squares: A Case of a Cold Climate Area in China. Buildings 2022, 12, 944. [Google Scholar] [CrossRef]
  23. Kong, L.; Lau, K.K.-L.; Yuan, C.; Chen, Y.; Xu, Y.; Ren, C.; Ng, E.Y.Y. Regulation of outdoor thermal comfort by trees in Hong Kong. Sustain. Cities Soc. 2017, 31, 12–25. [Google Scholar] [CrossRef]
  24. Cong, Y.; Zhu, R.; Yang, L.; Zhang, X.; Liu, Y.; Meng, X.; Gao, W. Correlation Analysis of Thermal Comfort and Landscape Characteristics: A Case Study of the Coastal Greenway in Qingdao, China. Buildings 2022, 12, 541. [Google Scholar] [CrossRef]
  25. Abaas, Z.R. Impact of development on Baghdad’s urban microclimate and human thermal comfort. Alex. Eng. J. 2020, 59, 275–290. [Google Scholar] [CrossRef]
  26. Chokhachian, A.; Lau, K.K.-L.; Perini, K.; Auer, T. Sensing transient outdoor comfort: A georeferenced method to monitor and map microclimate. J. Build. Eng. 2018, 20, 94–104. [Google Scholar] [CrossRef]
  27. Han, G.; Chen, H.; Yuan, L.; Cai, Y.; Han, M. Field measurements on micro-climate and cooling effect of river wind on urban blocks in Wuhan city. In Proceedings of the 2011 International Conference on Multimedia Technology, Hangzhou, China, 26–28 July 2011; pp. 4446–4449. [Google Scholar] [CrossRef]
  28. Steeneveld, G.; Koopmans, S.; Heusinkveld, B.; Theeuwes, N. Refreshing the role of open water surfaces on mitigating the maximum urban heat island effect. Landsc. Urban Plan. 2014, 121, 92–96. [Google Scholar] [CrossRef]
  29. Min, Y.; Chen, Y.; Shi, W.; Yang, H. Applicability of indirect evaporative cooler for energy recovery in hot and humid areas: Comparison with heat recovery wheel. Appl. Energy 2021, 287, 116607. [Google Scholar] [CrossRef]
  30. Standard GB/T35221-2017; Specifications for Surface Meteorological Observation-General. General Administration of Quality Supervision, Inspection and Quarantine of the People’s Republic of China. Standardization Administration of the People’s Republic of China: Beijing, China, 2017. (In Chinese)
  31. Standard GB/T50785-2012; Evaluation Standard for Indoor Thermal Environment in Civil Buildings. Ministry of Housing and Urban-Rural Development of the People’s Republic of China: Beijing, China, 2012. (In Chinese)
  32. Standard GB/T17244-1998; Hot-Environments—Estimation of the Heat Stress on Working Man based on the WBGT-Index (Wet Bulb Globe Temperature). The State Bureau of Quality and Technical Supervision: Beijing, China, 1998. (In Chinese)
  33. Standard GB/T4200-2008; Classified Standard of Working in the Hot Environment. General Administration of Quality Supervision, Inspection and Quarantine of the People’s Republic of China & Standardization Administration of the People’s Republic of China: Beijing, China, 2008. (In Chinese)
  34. ANSI ASHRAE Standard 55; Thermal Environmental Conditions for Human Occupancy. ANSI ASHRAE: Atlanta, GA, USA, 2017.
  35. Srivanit, M.; Jareemit, D. Modeling the influences of layouts of residential townhouses and tree-planting patterns on outdoor thermal comfort in Bangkok suburb. J. Build. Eng. 2020, 30, 101262. [Google Scholar] [CrossRef]
  36. ISO 7726; Ergonomics of the Thermal Environment—Instruments for Measuring Physical Quantities. Danish Standards Association: Copenhagen, Denmark, 2001.
  37. ISO 10551; Ergonomics of the Physical Environment—Subjective Judgement Scales for Assessing Physical Environments. ISO: Geneva, Switzerland, 2019.
  38. Fang, Z.; Zheng, Z.; Feng, X.; Shi, D.; Lin, Z.; Gao, Y. Investigation of outdoor thermal comfort prediction models in South China: A case study in Guangzhou. Build. Environ. 2020, 188, 107424. [Google Scholar] [CrossRef]
  39. Cheng, V.; Ng, E.; Chan, C.; Givoni, B. Outdoor thermal comfort study in a sub-tropical climate: A longitudinal study based in Hong Kong. Int. J. Biometeorol. 2012, 56, 43–56. [Google Scholar] [CrossRef]
  40. Hadianpour, M.; Mahdavinejad, M.; Bemanian, M.; Nasrollahi, F. Seasonal differences of subjective thermal sensation and neutral temperature in an outdoor shaded space in Tehran, Iran. Sustain. Cities Soc. 2018, 39, 751–764. [Google Scholar] [CrossRef]
  41. Broday, E.E.; Ruivo, C.R.; da Silva, M.G. The use of Monte Carlo method to assess the uncertainty of thermal comfort indices PMV and PPD: Benefits of using a measuring set with an operative temperature probe. J. Build. Eng. 2021, 35, 101961. [Google Scholar] [CrossRef]
  42. Chen, J.; Augenbroe, G.; Wang, Q.; Song, X. Uncertainty analysis of thermal comfort in a prototypical naturally ventilated office building and its implications compared to deterministic simulation. Energy Build. 2017, 146, 283–294. [Google Scholar] [CrossRef]
  43. Chen, X.; Gao, L.; Xue, P.; Du, J.; Liu, J. Investigation of outdoor thermal sensation and comfort evaluation methods in severe cold area. Sci. Total Environ. 2020, 749, 141520. [Google Scholar] [CrossRef] [PubMed]
  44. Golasi, I.; Salata, F.; Vollaro, E.D.L.; Coppi, M. Complying with the demand of standardization in outdoor thermal comfort: A first approach to the Global Outdoor Comfort Index (GOCI). Build. Environ. 2018, 130, 104–119. [Google Scholar] [CrossRef]
  45. Yan, H.; Liu, Q.; Zhao, W.; Pang, C.; Dong, M.; Zhang, H.; Gao, J.; Wang, H.; Hu, B.; Yang, L.; et al. The coupled effect of temperature, humidity, and air movement on human thermal response in hot–humid and hot–arid climates in summer in China. Build. Environ. 2020, 177, 106898. [Google Scholar] [CrossRef]
  46. Rocha, A.; Pinto, D.; Ramos, N.M.; Almeida, R.M.; Barreira, E.; Simões, M.L.; Martins, J.P.; Pereira, P.F.; Sanhudo, L. A case study to improve the winter thermal comfort of an existing bus station. J. Build. Eng. 2020, 29, 101123. [Google Scholar] [CrossRef]
  47. Wang, J.; Wang, Z.; de Dear, R.; Luo, M.; Ghahramani, A.; Lin, B. The uncertainty of subjective thermal comfort measurement. Energy Build. 2018, 181, 38–49. [Google Scholar] [CrossRef]
  48. Lucchese, J.R.; Mikuri, L.P.; de Freitas, N.V.S.; Andreasi, W.A. Application of selected indices on outdoor thermal comfort assessment in Midwest Brazil. Int. J. Energy Environ. 2016, 7, 291–302. [Google Scholar]
  49. Auliciems, A.; Szokolay, S.V. Thermal Comfort; PLEA: Brisbane, Australia, 2007. [Google Scholar]
  50. Wei, D.; Yang, L.; Bao, Z.; Lu, Y.; Yang, H. Variations in outdoor thermal comfort in an urban park in the hot-summer and cold-winter region of China. Sustain. Cities Soc. 2022, 77, 103535. [Google Scholar] [CrossRef]
  51. Edholm, O.G. The Physiological Basis of Habituation. Proc. R. Soc. Med. 1966, 35, 113. [Google Scholar] [CrossRef] [Green Version]
  52. Zhuang, C.; Shan, K.; Wang, S. Coordinated demand-controlled ventilation strategy for energy-efficient operation in multi-zone cleanroom air-conditioning systems. Build. Environ. 2021, 191, 107588. [Google Scholar] [CrossRef]
  53. Ballinas, M.; Barradas, V.L. Transpiration and stomatal conductance as potential mechanisms to mitigate the heat load in Mexico City. Urban For. Urban Green. 2016, 20, 152–159. [Google Scholar] [CrossRef]
  54. Hong, B.; Lin, B.; Hu, L.; Li, S. Study on the Impacts of Vegetation on Wind Environment in Residential District Combined Numerical Simulation and Field Experiment. Procedia Environ. Sci. 2012, 13, 1708–1717. [Google Scholar] [CrossRef]
  55. Yao, R.; Li, B.; Liu, J. A theoretical adaptive model of thermal comfort—Adaptive Predicted Mean Vote (aPMV). Build. Environ. 2009, 44, 2089–2096. [Google Scholar] [CrossRef]
  56. De Dear, R.J.; Brager, G.S. Developing an adaptive model of thermal comfort and preference. ASHREA Trans. 1998, 104, 145–167. [Google Scholar] [CrossRef]
  57. Easter School in Agricultural Science; Monteith, J.L.; Mount, L.E. Heat Loss from Animals and Man: Assessment and Control: Proceedings of the Twentieth Easter School in Agricultural Science 1973; University of Nottingham: Nottingham, UK, 1974; ISBN 040870652X. [Google Scholar]
  58. Wyndham, C.H. Adaptation to heat and cold. Environ. Res. 1969, 2, 442–469. [Google Scholar] [CrossRef]
  59. Jian, Y.; Liu, J.; Pei, Z.; Chen, J. Occupants’ tolerance of thermal discomfort before turning on air conditioning in summer and the effects of age and gender. J. Build. Eng. 2022, 50, 104099. [Google Scholar] [CrossRef]
  60. Brager, G.S.; de Dear, R.J. Thermal adaptation in the built environment: A literature review. Energy Build. 1998, 27, 83–96. [Google Scholar] [CrossRef]
  61. Gachkar, D.; Taghvaei, S.H.; Norouzian-Maleki, S. Outdoor thermal comfort enhancement using various vegetation species and materials (case study: Delgosha Garden, Iran). Sustain. Cities Soc. 2021, 75, 103309. [Google Scholar] [CrossRef]
  62. Francoeur, X.W.; Dagenais, D.; Paquette, A.; Dupras, J.; Messier, C. Complexifying the urban lawn improves heat mitigation and arthropod biodiversity. Urban For. Urban Green. 2021, 60, 127007. [Google Scholar] [CrossRef]
  63. Shi, D.; Song, J.; Huang, J.; Zhuang, C.; Guo, R.; Gao, Y. Synergistic cooling effects (SCEs) of urban green-blue spaces on local thermal environment: A case study in Chongqing, China. Sustain. Cities Soc. 2020, 55, 102065. [Google Scholar] [CrossRef]
  64. Mijorski, S.; Cammelli, S.; Green, J. A hybrid approach for the assessment of outdoor thermal comfort. J. Build. Eng. 2019, 22, 147–153. [Google Scholar] [CrossRef]
Figure 1. Residential community with five common underlying surfaces: (a) pond, (b) masonry, (c) asphalt, (d) lawn, and (e) arbor.
Buildings 12 01564 g001
Figure 2. The locations of measuring instruments.
Buildings 12 01564 g002
Figure 3. Daytime meteorological parameters measured with an automatic weather station.
Buildings 12 01564 g003
Figure 4. Distribution of respondents’ (a) gender, (b) age, and (c) employment.
Buildings 12 01564 g004
Figure 5. (a) Spatial and (b) temporal distributions of thermal comfort vote value.
Buildings 12 01564 g005
Figure 6. Relationship between To and MTSV in different (a) RH or (b) va.
Buildings 12 01564 g006
Figure 7. Accuracies of four thermal indices in predicting outdoor MTSV of Chongqing residents.
Buildings 12 01564 g007
Figure 8. Thermal comfort interval.
Buildings 12 01564 g008
Figure 9. The MTSVCQ of five different zones.
Buildings 12 01564 g009
Figure 10. (a) External manifestation of thermal adaptation and (b) the most popular cool place according to respondents’ votes.
Buildings 12 01564 g010
Table 1. Main parameters of the measuring instruments.
Instrument NameModelRangeResolutionPrecisionMeasurement Parameters
Automatic Weather StationTRM-ZS2−50–80 °C0.1 °C0.1 °CAir temperature
0–100%0.1%5%Relative humidity
0–60 m/s0.01 m/s0.2 m/sWind speed
0–2000 W/m21 W/m2≤5%Solar radiation
Temp. and RH Data LoggerApresysTM−20–60 °C0.01 °C0.5 °CAir temperature
0–100%1%3%Relative humidity
Wind Automatic Recorder WFWZY-1−20–80 °C0.1 °C0.3 °CWind temperature
0–20 m/s0.01 m/s0.03 m/sWind speed
Automatic Black Globe RecorderHQZY-1−40–80 °C0.1 °C0.2 °CBlack globe temperature
Total Radiation RecorderTPJ-24-G0–2000 W/m21 W/m27–14 W/m2Total solar radiation
Table 2. Pearson product–moment correlation coefficient matrix.
MTSVRHTavaTmrtSR
MTSV1−0.7170.763−0.0880.8110.707
RH−0.7171−0.890−0.027−0.821−0.913
Ta0.763−0.89010.0150.8240.974
va−0.088−0.0270.01510.0370.019
Tmrt0.811−0.8210.8240.03710.785
SR0.707−0.9130.9740.0190.7851
Table 3. Variance analysis of the MTSVCQ in summer.
Sum of SquaresFree DegreeMean SquareFSignificance Level
Regression82.0180420.504064.47600.0000
Residuals35.30001110.3180
Sum117.3170115
Table 4. Regression coefficient of the MTSVCQ.
BStandard ErrorTVIFR2
Constant−4.24901.6440−2.5850 0.6990
Ta0.09900.03702.66905.5180
va−0.30200.1390−2.16901.0020
RH0.00500.01100.47305.4130
Tmrt0.06200.01006.06703.5290
Table 5. Thermal sensation classification.
Thermal SensationMTSVCQSET* (°C) [49]PET (°C) [50]UTCI (°C) [50]
Neutral−0.5–0.522.2–25.618.0–23.09.0–26.0
Warm0.5–1.525.6–30.023.0–29.026.0–32.0
Hot1.5–2.530.0–34.529.0–35.032.0–38.0
Very hot>2.5>34.5>35.0>38.0
Table 6. Recommended path planning during the day.
TimePath Planning
First ChoiceSecond ChoiceThird Choice
08:00–10:00Tracks under arborsRoads besides pondsTrails on lawns
10:00–10:15Tracks under arborsRoads besides ponds-
10:15–11:00Tracks under arborsRoads besides pondsRoads on masonry
11:00–17:30---
17:30–19:00Trails on lawns Tracks under arbors-
Publisher’s Note: MDPI stays neutral with regard to jurisdictional claims in published maps and institutional affiliations.

