


The Impacts of Urban Configurations on Outdoor Thermal Perceptions: Case Studies of Flat Bandar Tasik Selatan and Surya Magna in Kuala Lumpur

Abstract
:1. Introduction
- (a)
- To assess the impact of urban configurations on outdoor comfort.
- (b)
- To examine thermal perceptions and discuss the impact in the study location
- (c)
- To discuss the applications and recommendations based on the outcomes of the research.
2. Literature Review
3. Materials and Methods
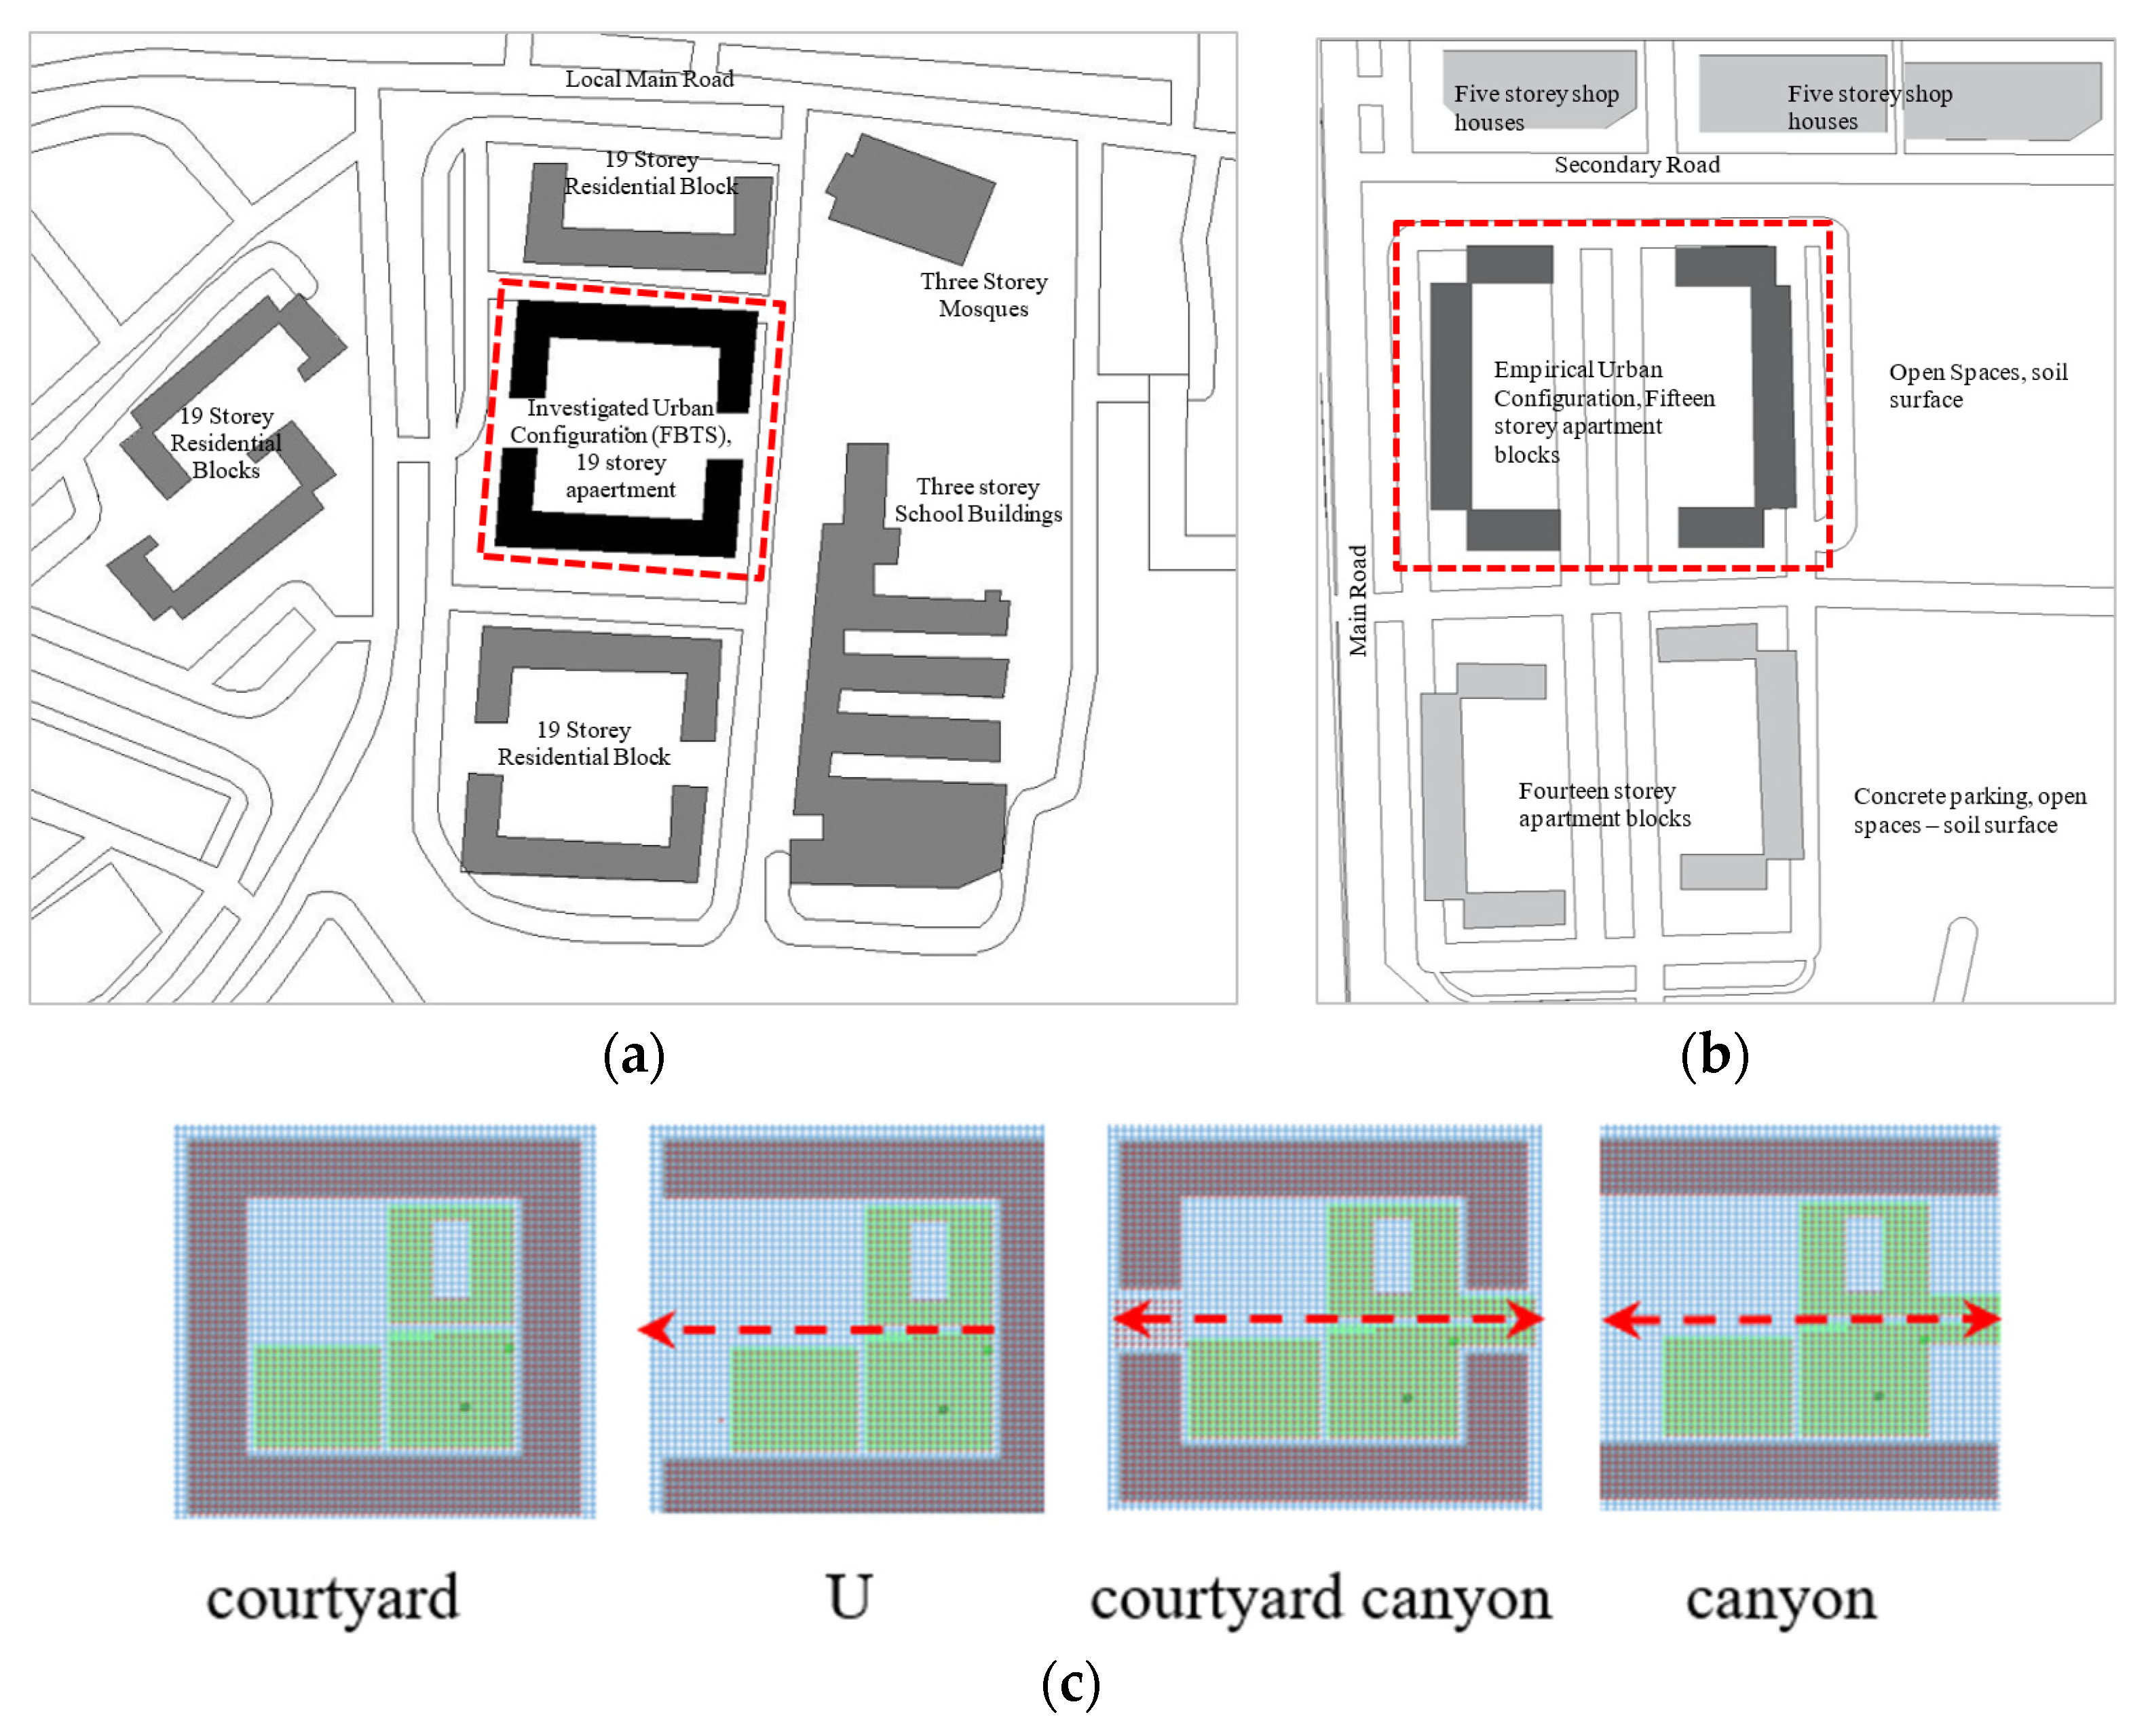
3.1. Description of Case Studies
3.2. Research Methodology
- Mapping of the case studies to understand the configurations. The information gathered and mapping of the sites helped us to determine the configurations, including hypothetical and non-hypothetical scenarios. The thermophysical properties of the building blocks and other urban elements modelled for the simulation are presented in Table 3.
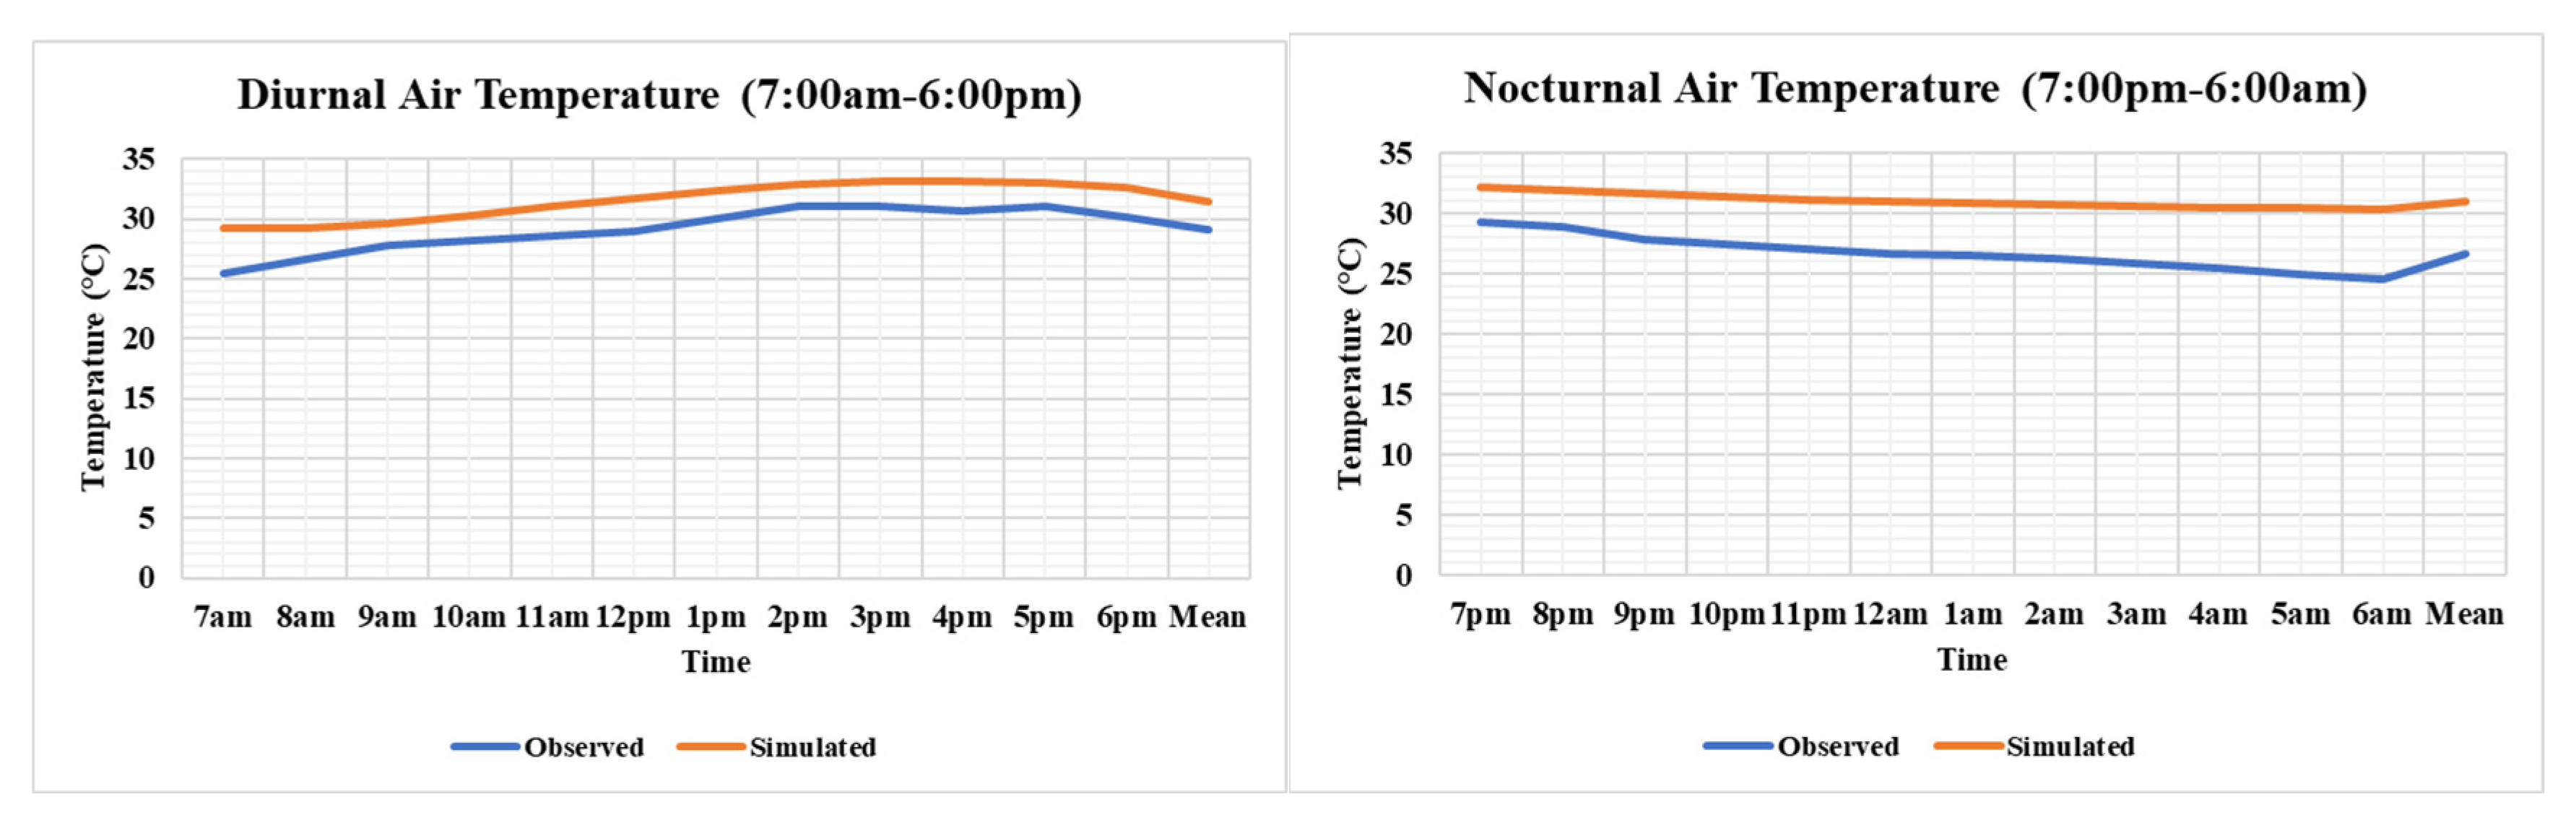
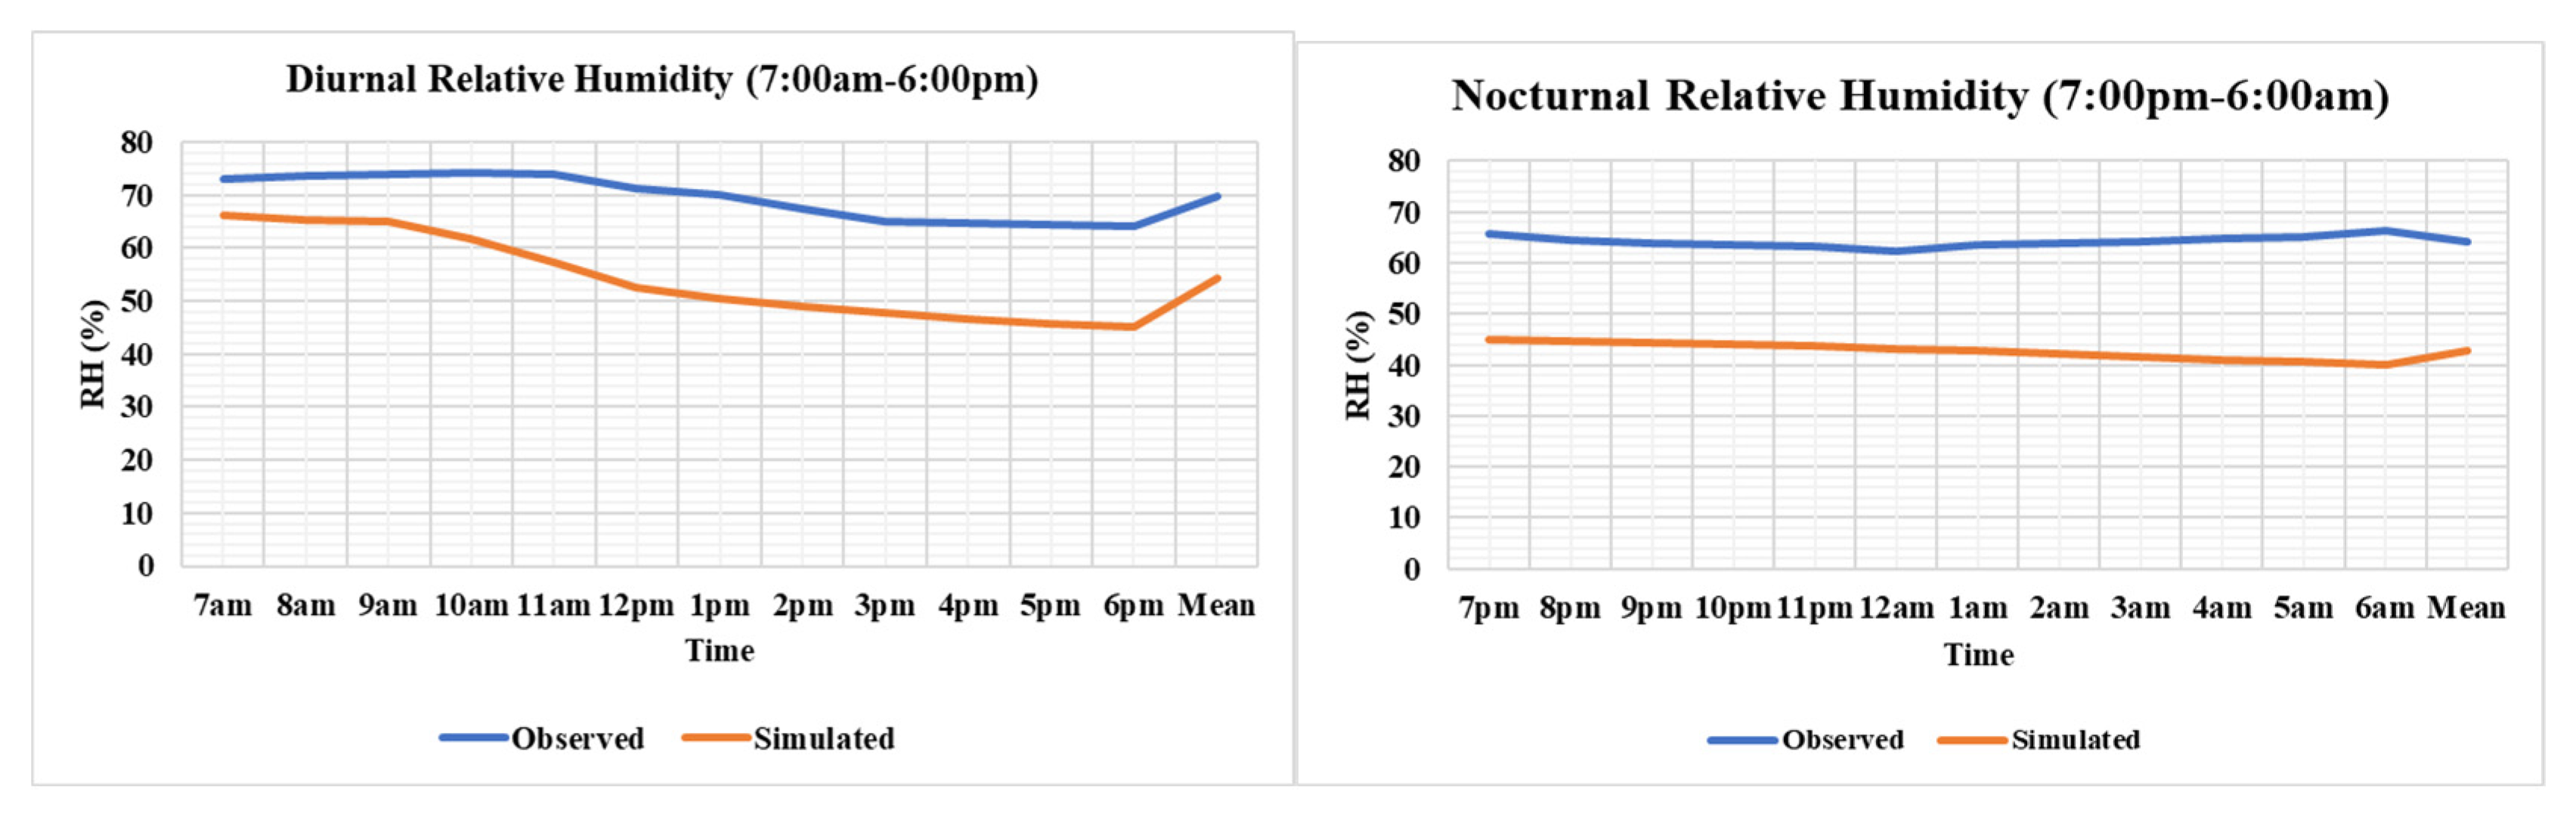
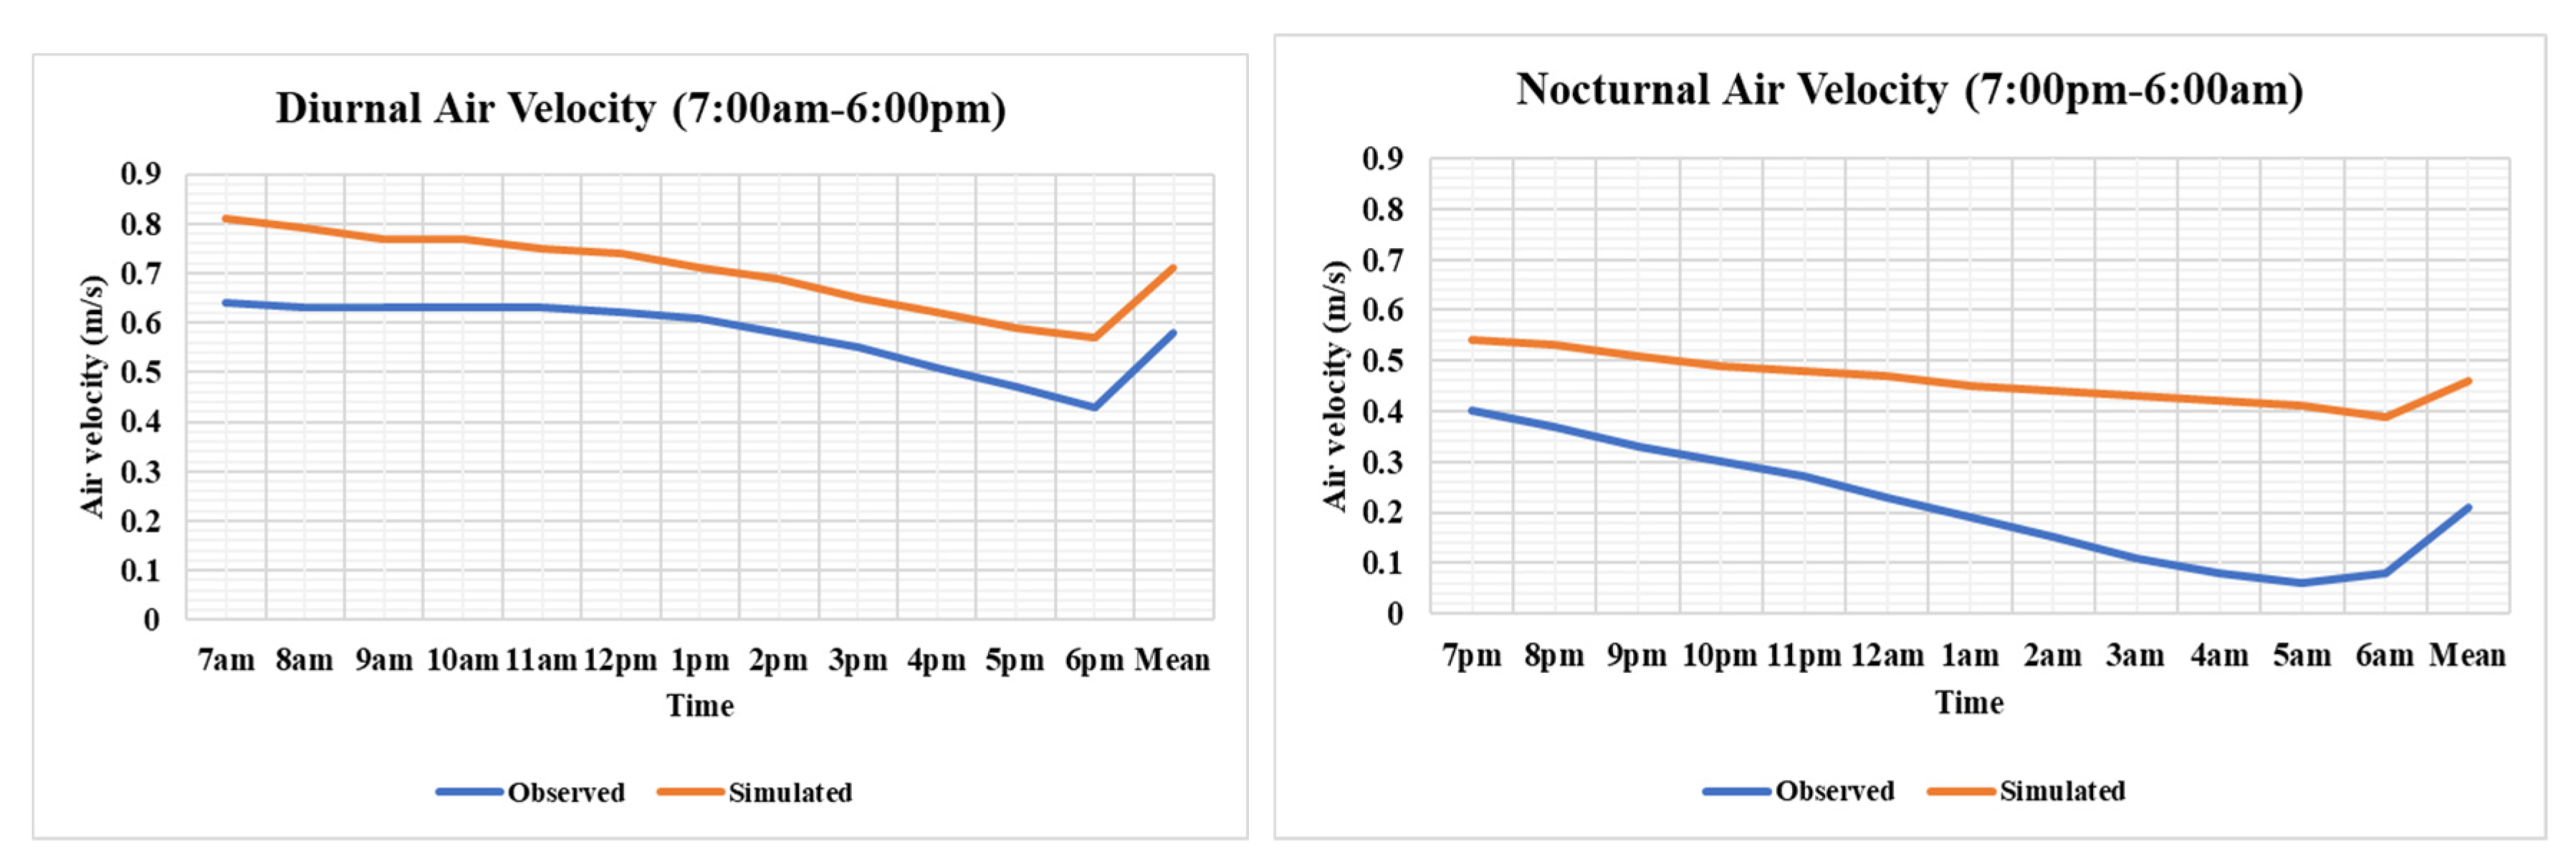
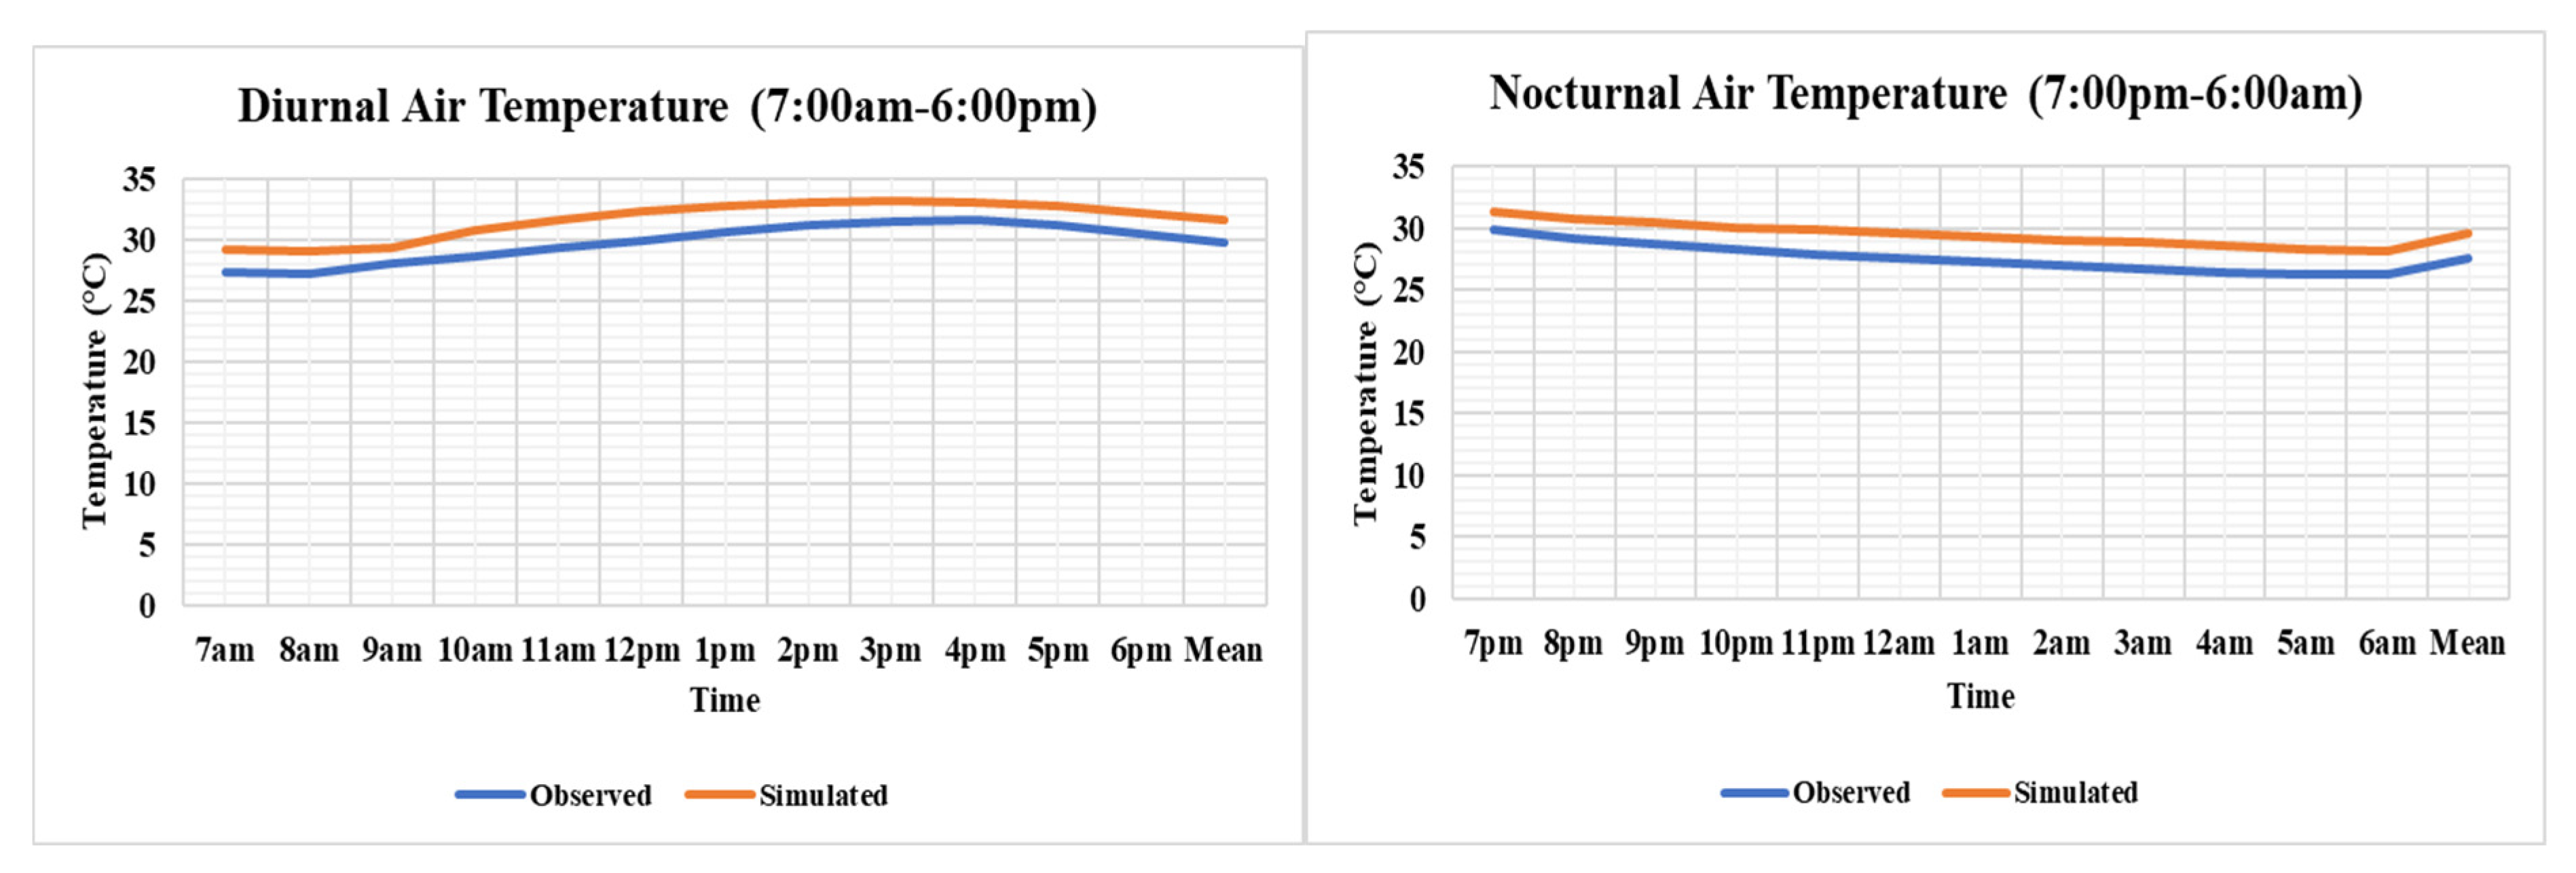
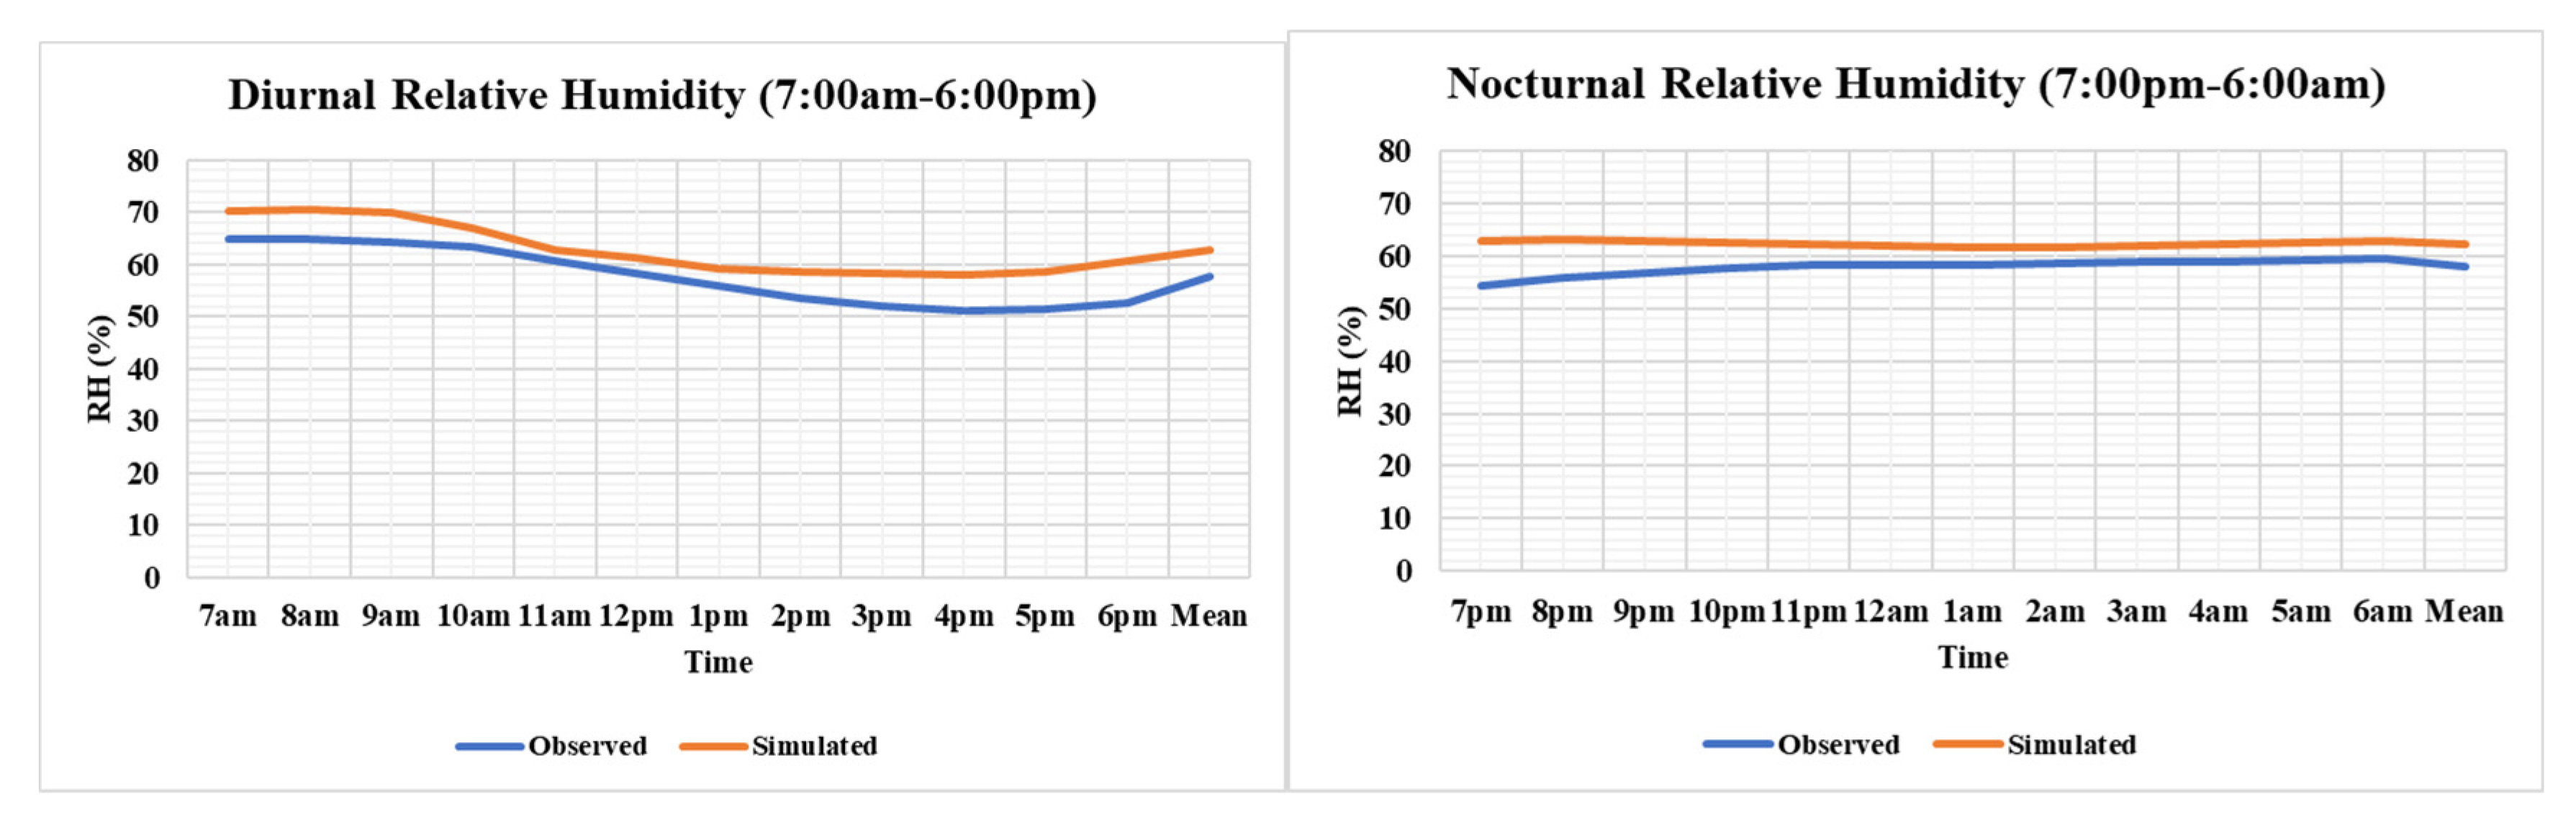
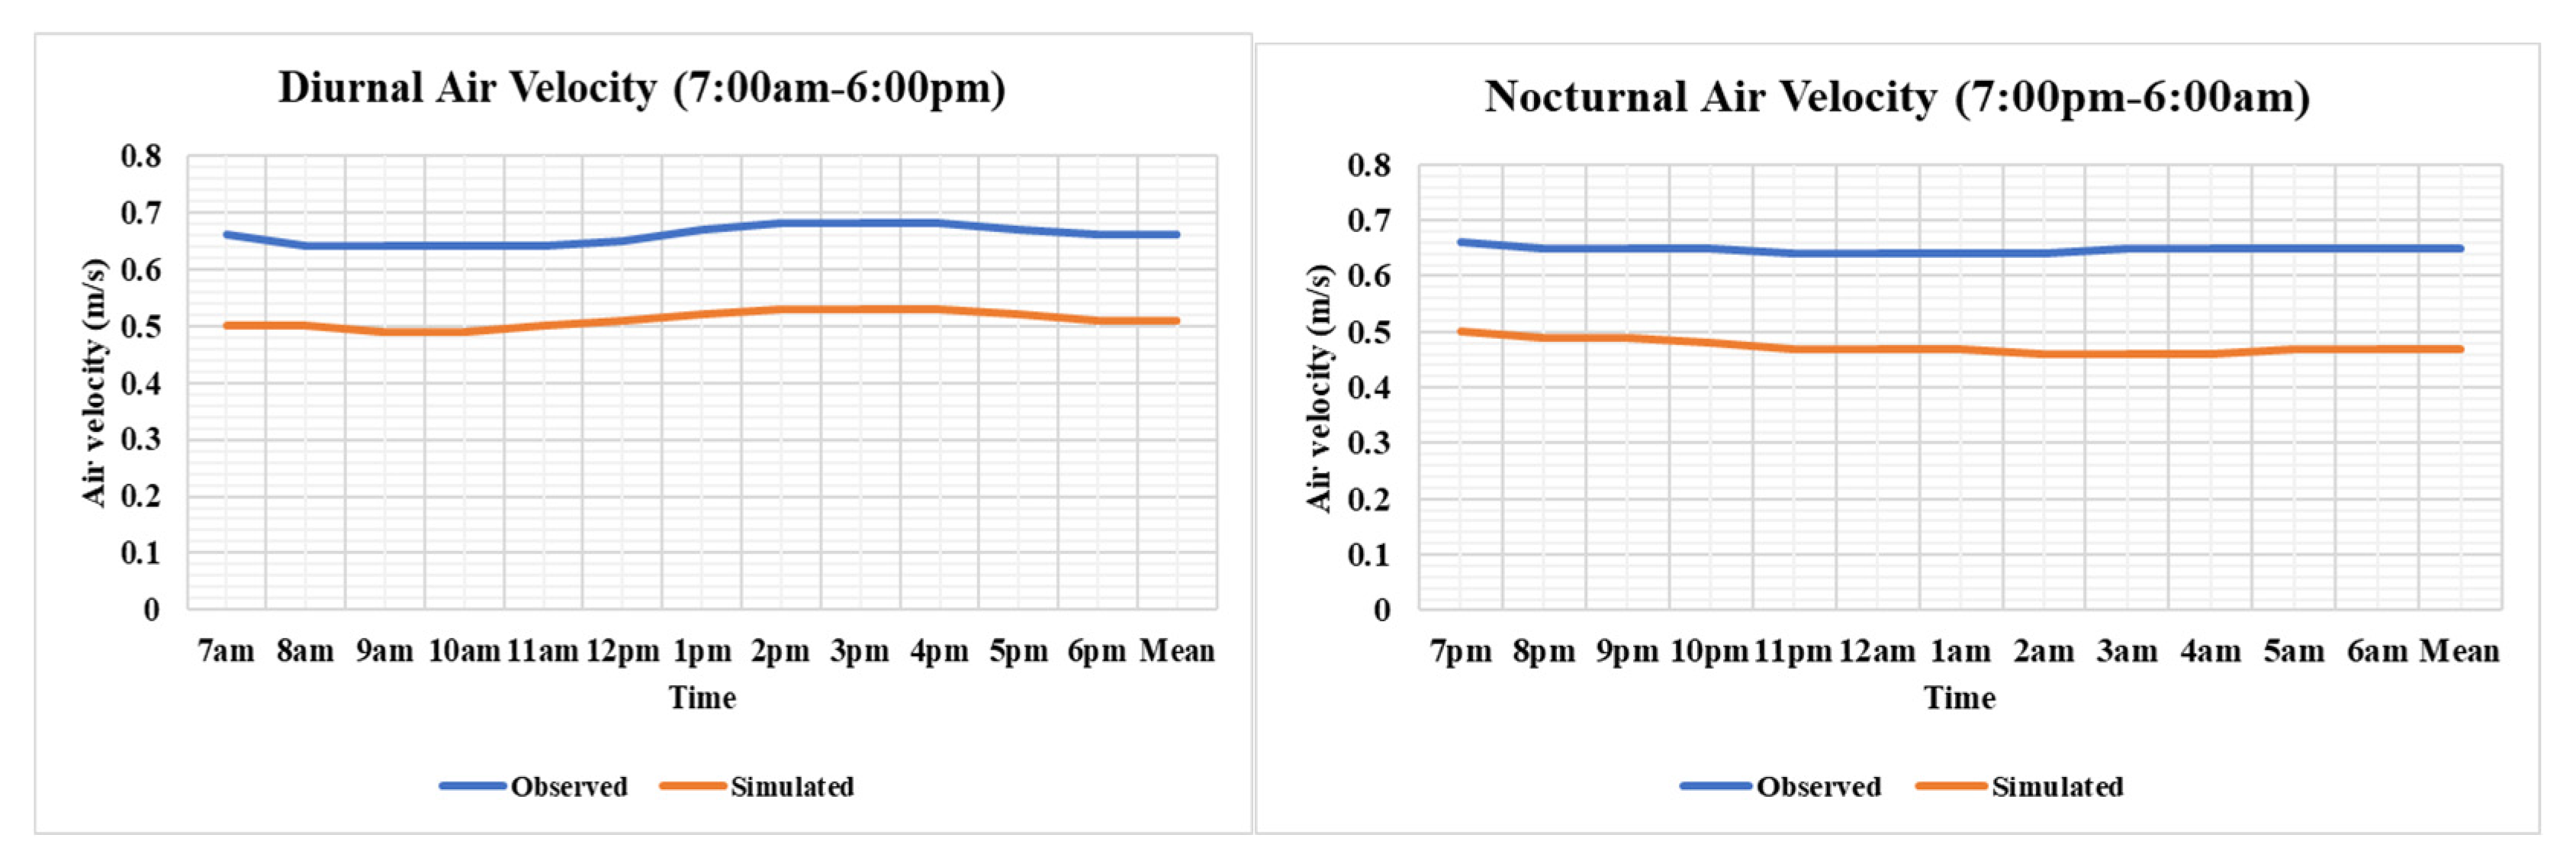
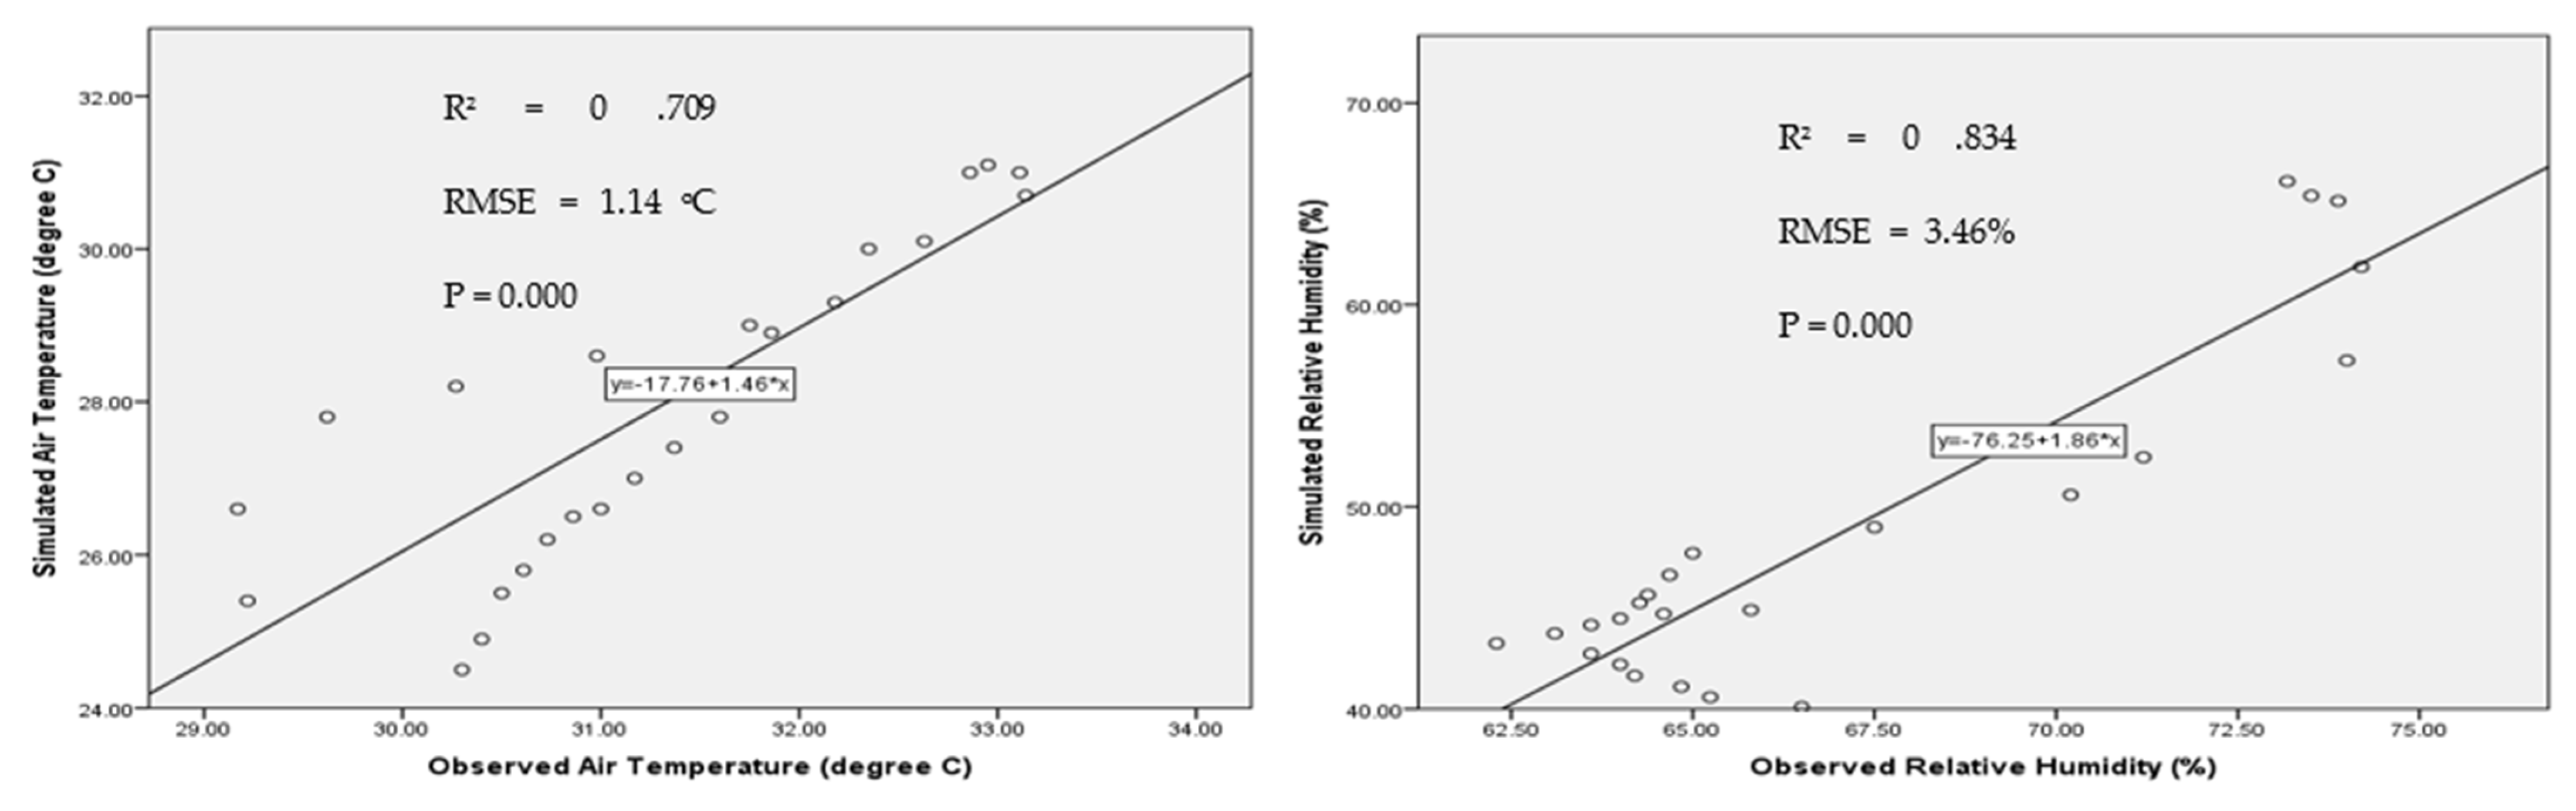
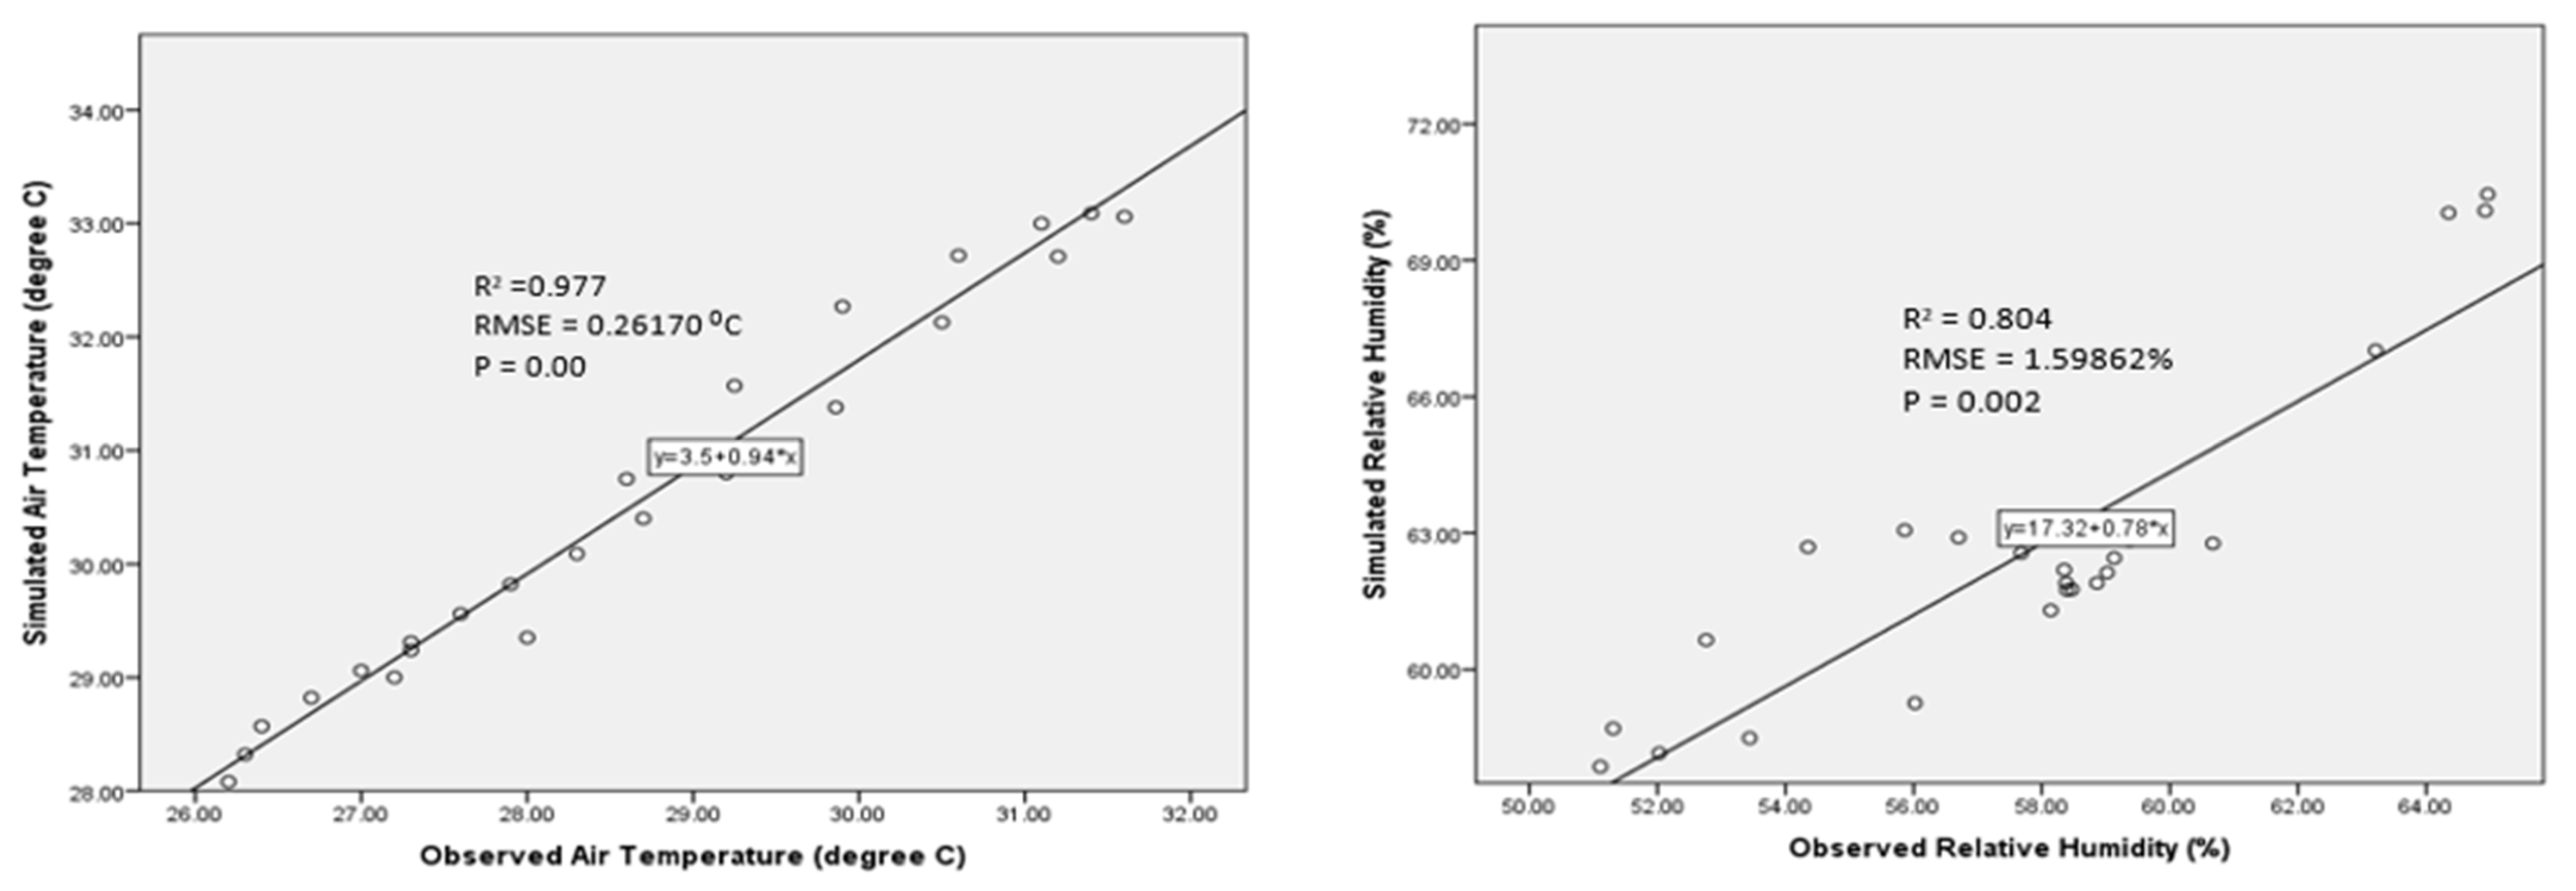
- Field measurements of environmental parameters were carried out to assess the outdoor thermal environmental conditions of the locations. Some of the environmental variables that were measured included air temperature, solar radiation, air velocity, surface temperature, mean radiant temperature, humidity, and others. Existing research has examined the reliability of urban microclimate modelling [101,102]. A similar approach was also adopted in this study.
- Recent studies [102,103] have reviewed and recommended the need for an empirical simulation approach. Such an approach is also considered in the present study. We used the ENVI-met V3.1 Beta version as the 3D non-hydrostatic microclimate computer simulation for the experimental setup. We selected ENVI-met simulation because it is a reliable tool that suits the objective of our research to investigate both microclimate and thermal comfort variables with different parameters and determine the gaps. ENVI-met not only generates the statistical results of parameters, but also presents 2D and 3D graphics at high resolution. Moreover, ENVI-met simulation has a strong focus on microscale urban space investigation. Some significant studies regarding the reliability and scope of ENVI-met were reviewed [104,105,106,107]. We applied the grid cells of x = 210, y = 210, and z = 30, with a nesting grid of 6. The main ENVI-met model domain in this study was set in three dimensions, with two horizontal dimensions of x and y and one vertical dimension of z. In general, ENVI-met V3.1 Beta version offered three sizes of simulation sections: 100 × 100 × 300, 180 × 180 × 30, and 250 × 250 × 30. Based on the consideration of the size of the model domain, simulation duration, and minimising the errors in the microscale simulation, we applied the 250 × 250 × 30 grid setting. However, the analysis of this study focused on the horizontal dimensions of x and y at the pedestrian-height microclimate and outdoor thermal comfort indices. To ensure the proper height of the actual building and the model, a telescoping method was used with a 20% factor that started at 2 m. The model was rotated 5° from the north direction to set the actual direction of the site. The geographical location was set in Kuala Lumpur, Malaysia (3°08’0.5” N, 101°041’0.36” E), for the sites.
- As it is geographically located in a tropical region, Malaysia has constant high-intensity solar radiation throughout the year, causing its significant hot and humid climate characteristics. The solar radiation pattern is different each year, and the highest solar radiation may fall in any of the months throughout the year [108]. Solar radiation is the main source of heat stress in the modification of thermal indices (i.e., microclimate and thermal comfort) in the context of tropical regions. This study was conducted in June—a month with stable global radiation and one of the hottest of the year. The uniform high solar radiation throughout the year is consistent with the uniform high temperature in Malaysia. In this study, 21 June was chosen as the simulation date because it is the longest day of the year for the area north of the equator.
4. Results
5. Discussion
6. Conclusions
- (1)
- Do urban configurations influence outdoor occupants’ comfort in the study locations?
- Our research revealed that urban geometries influence occupants’ comfort in the thermal environment.
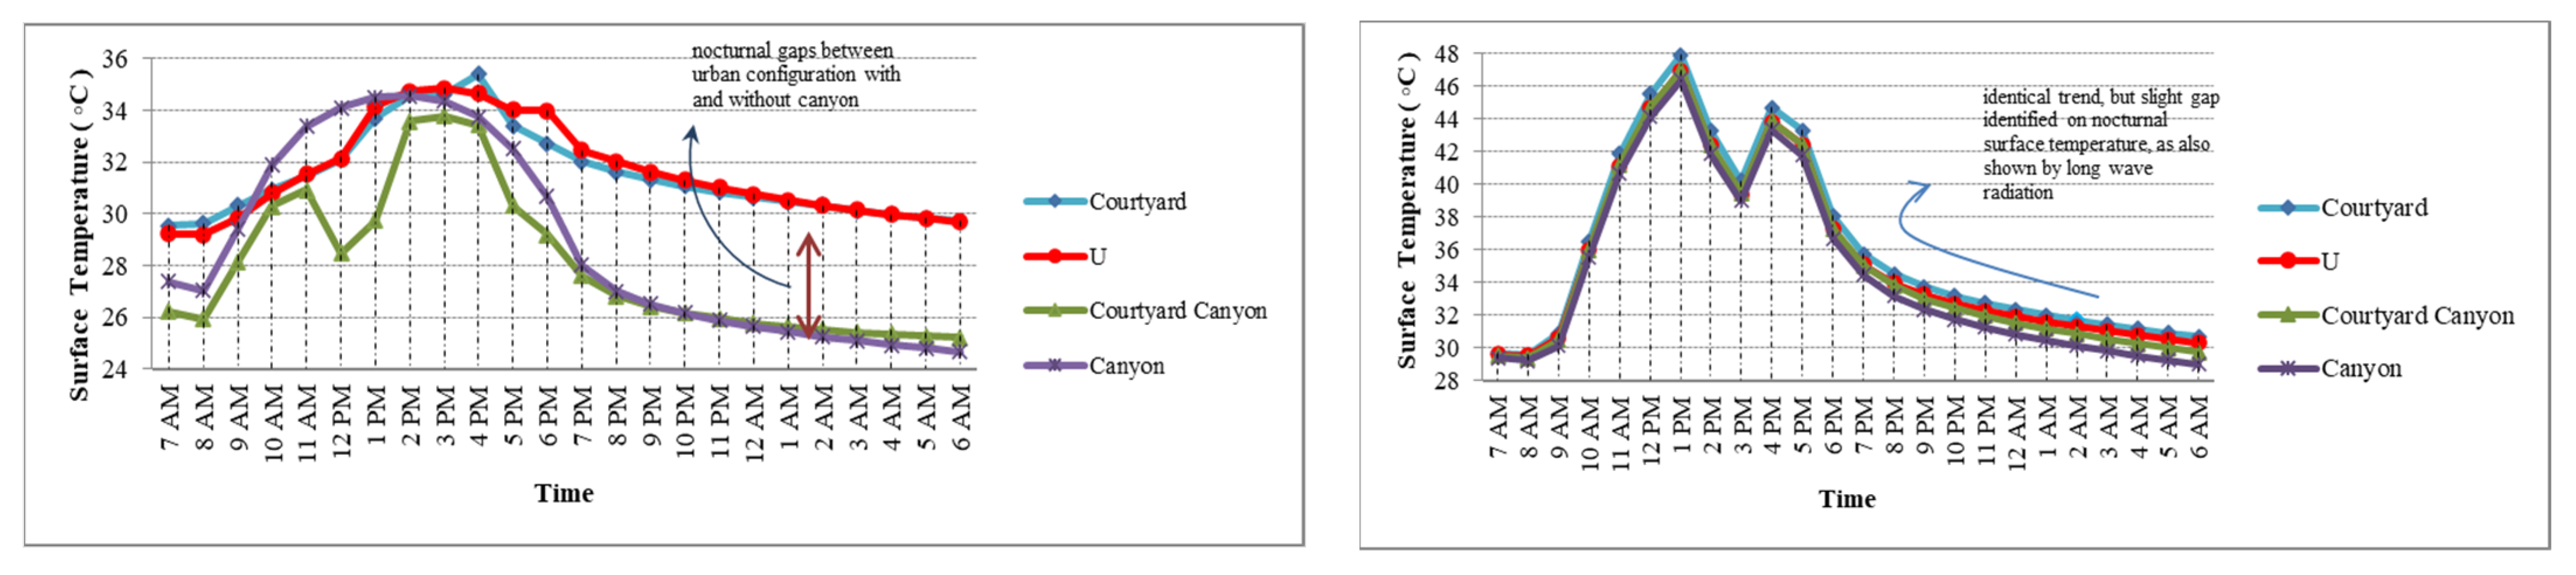
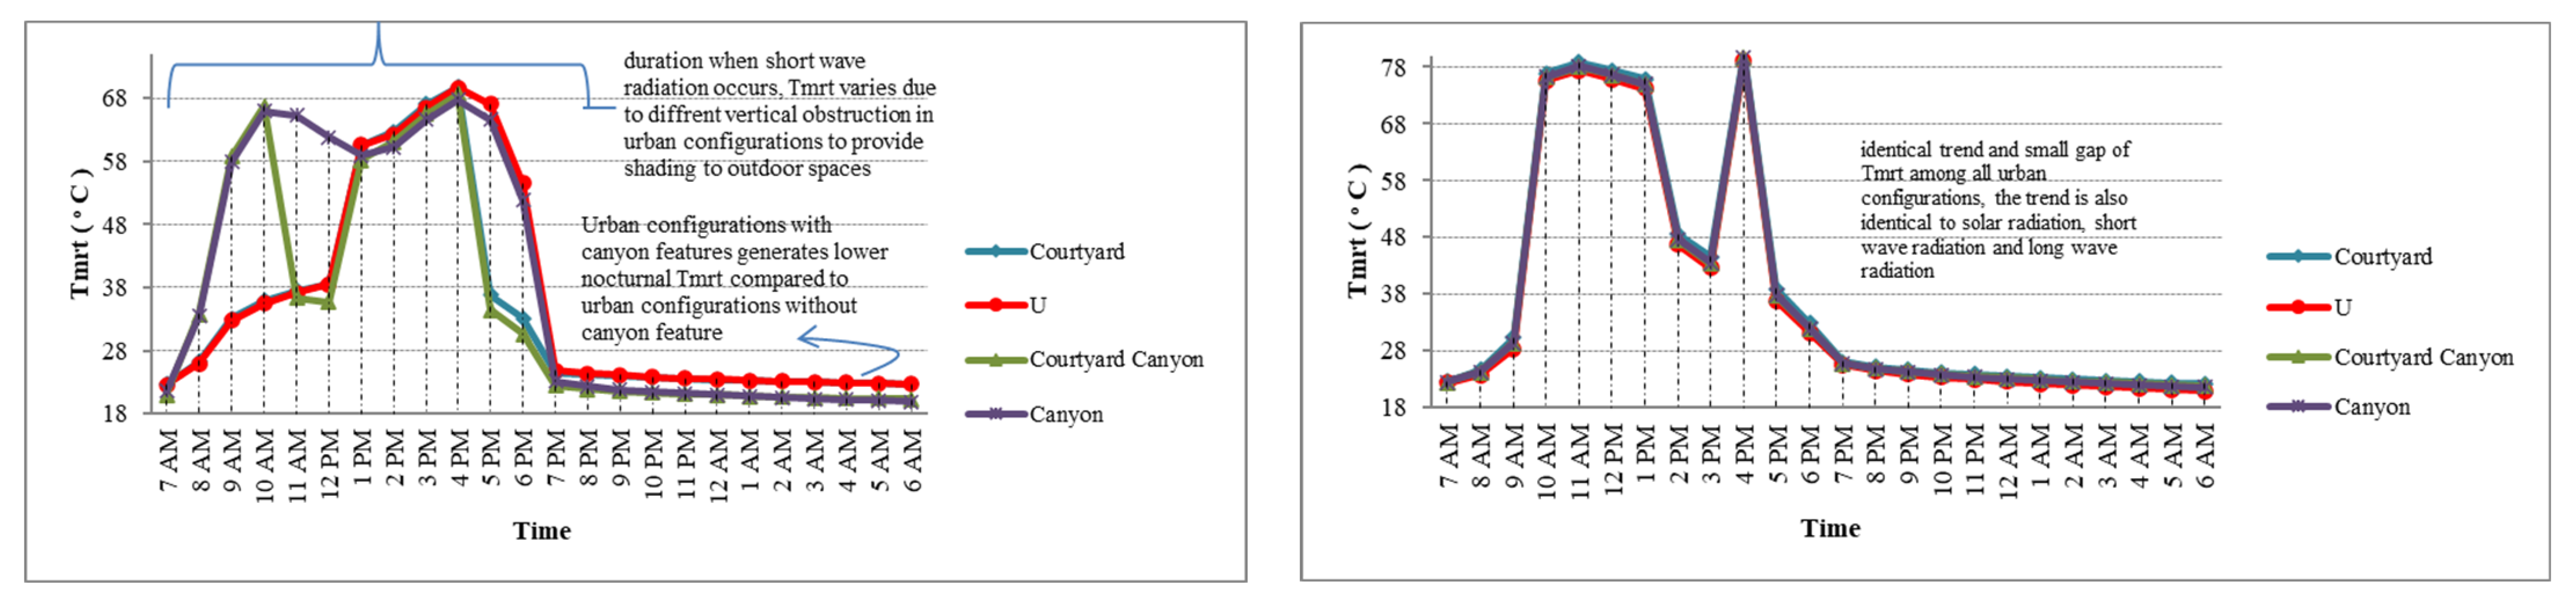
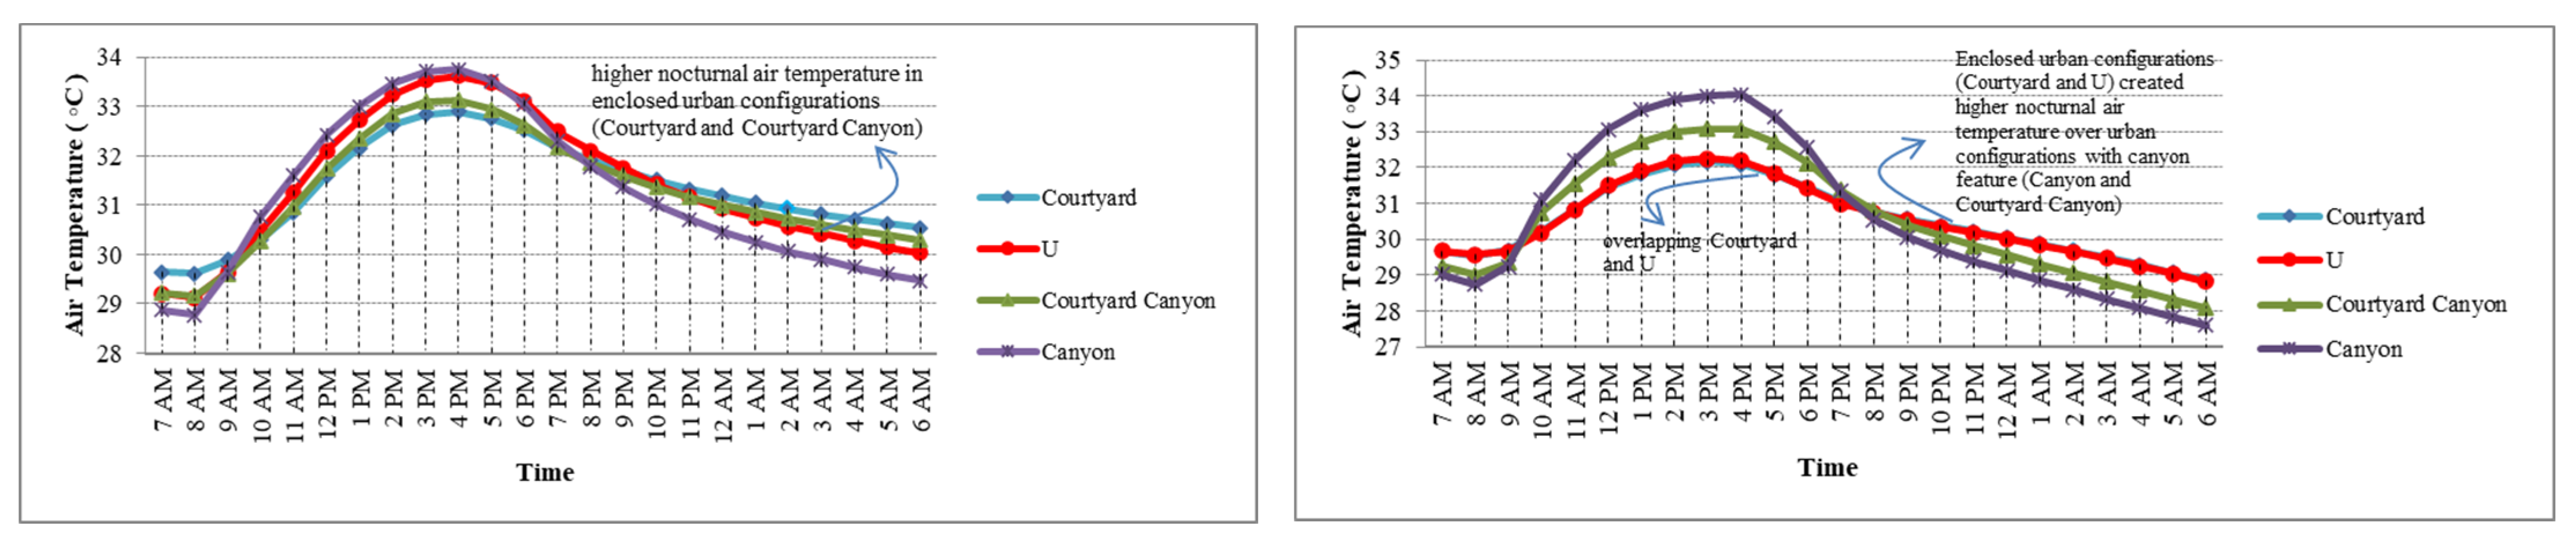
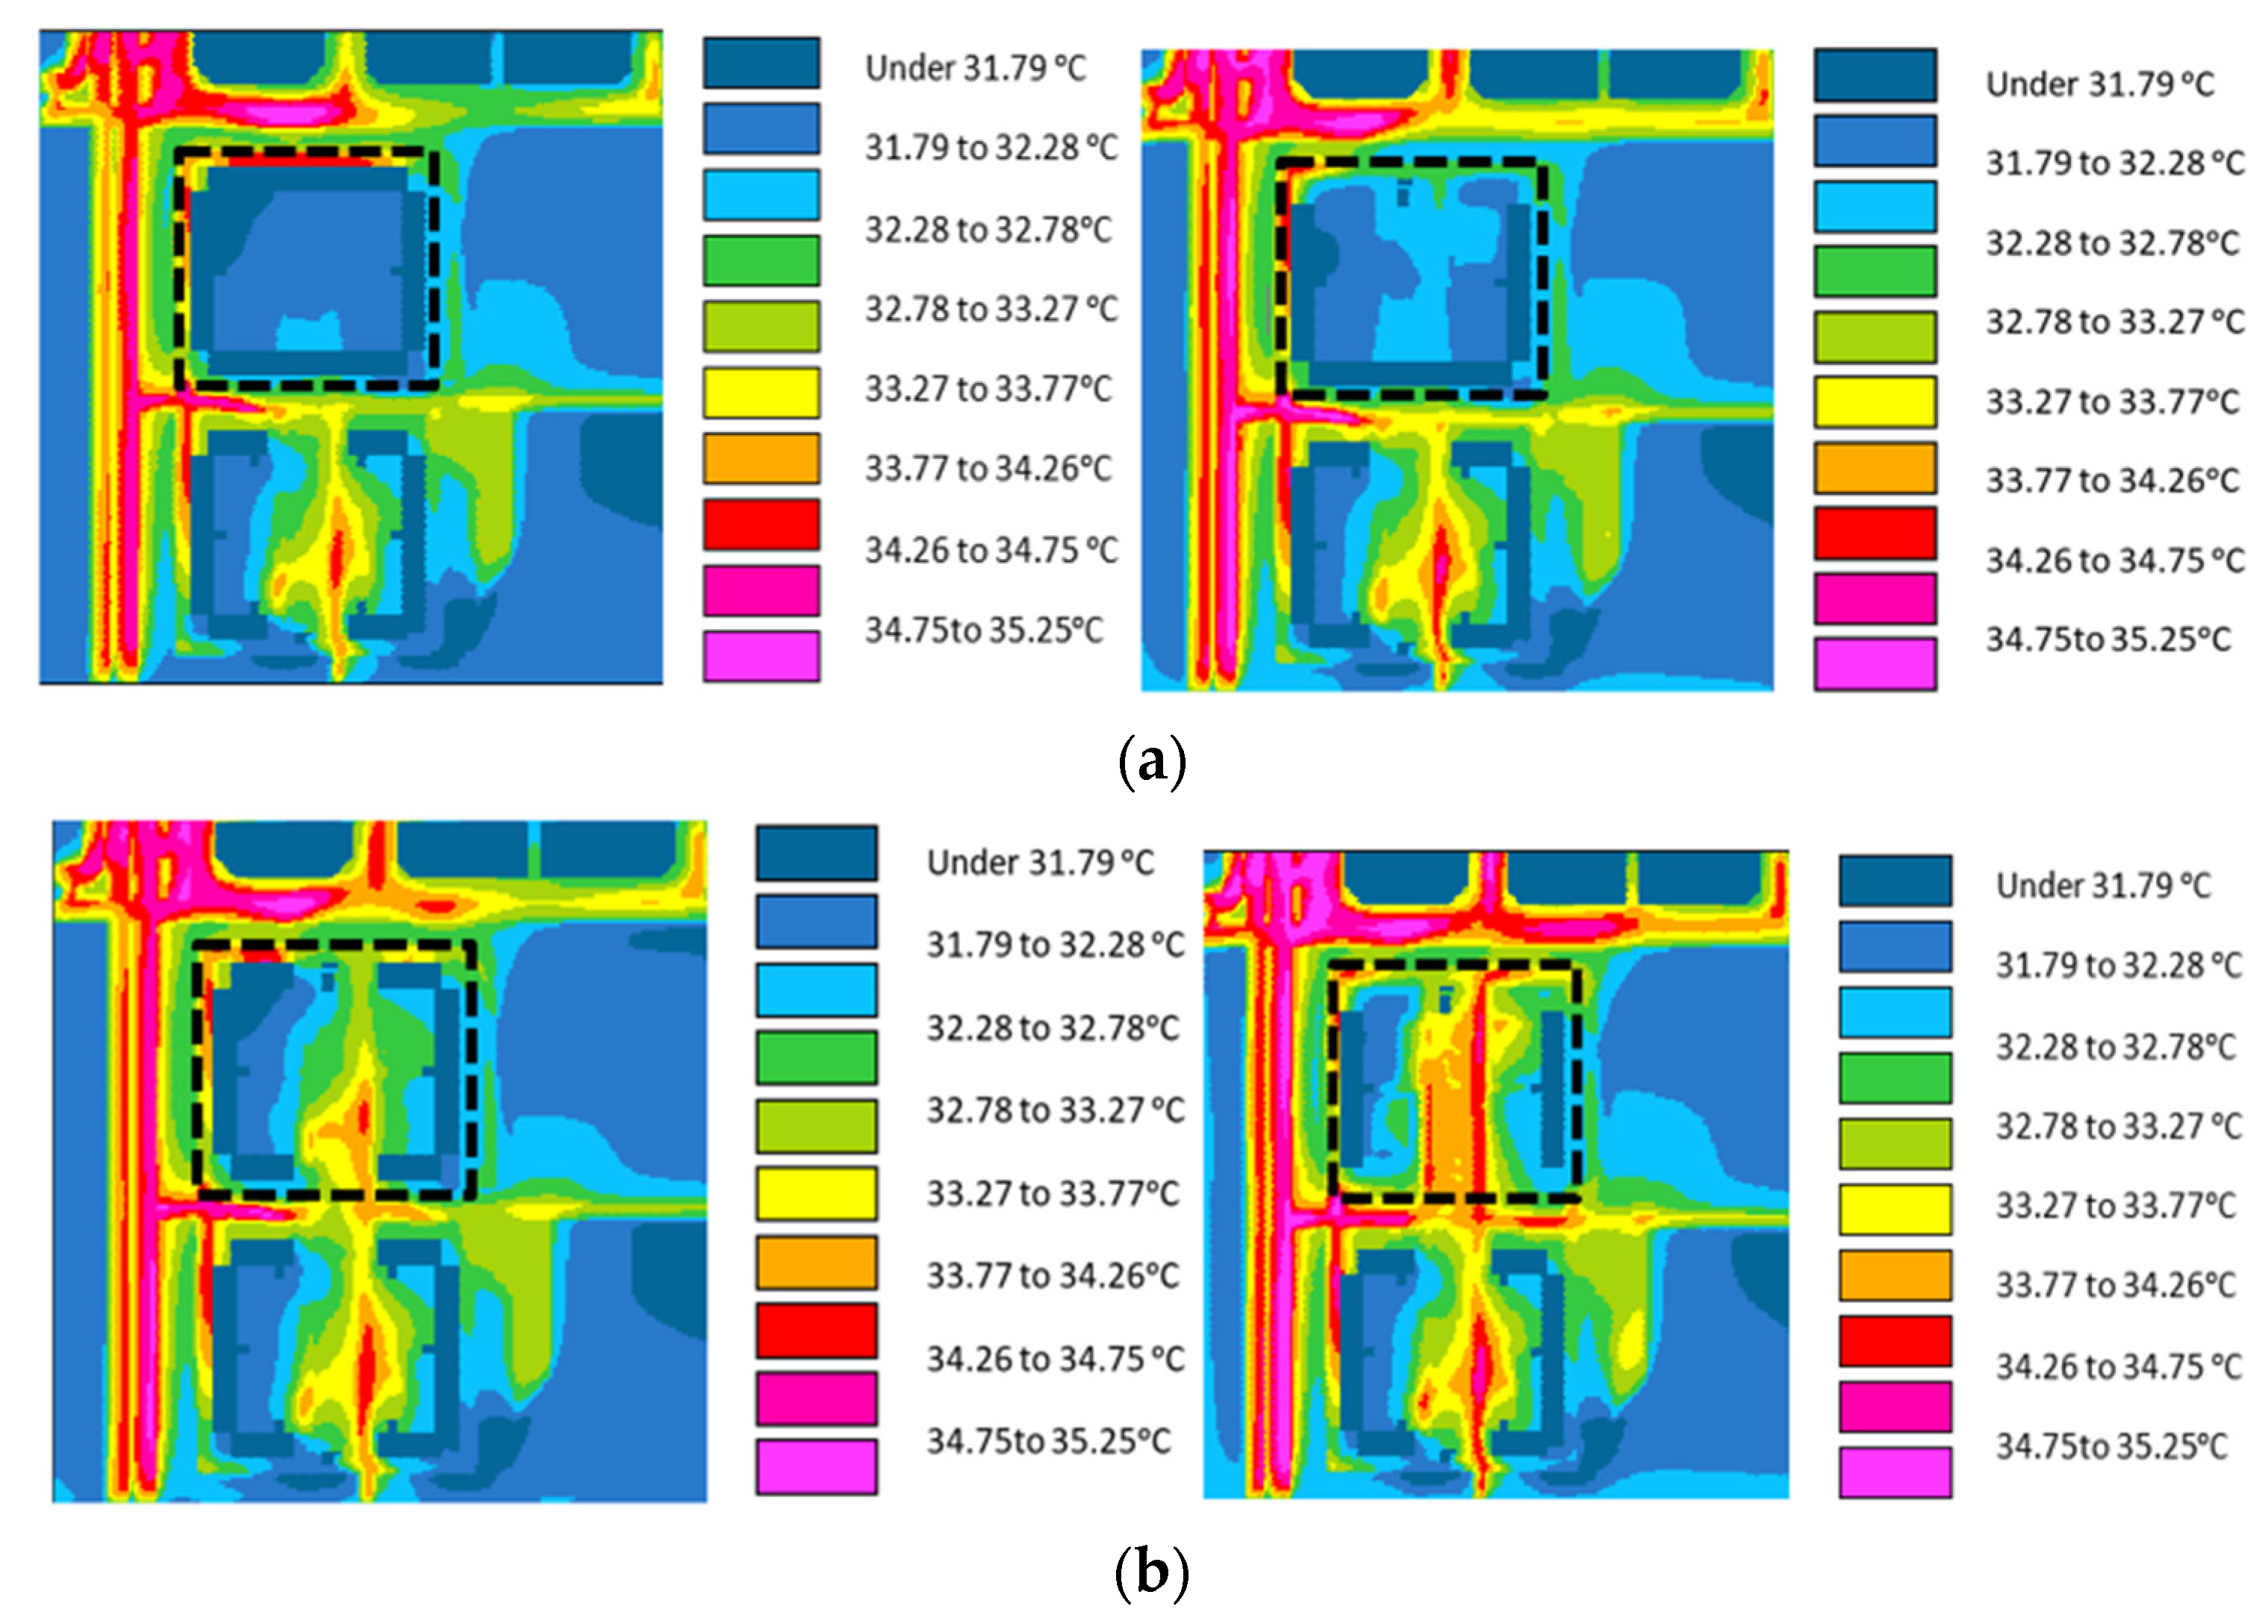
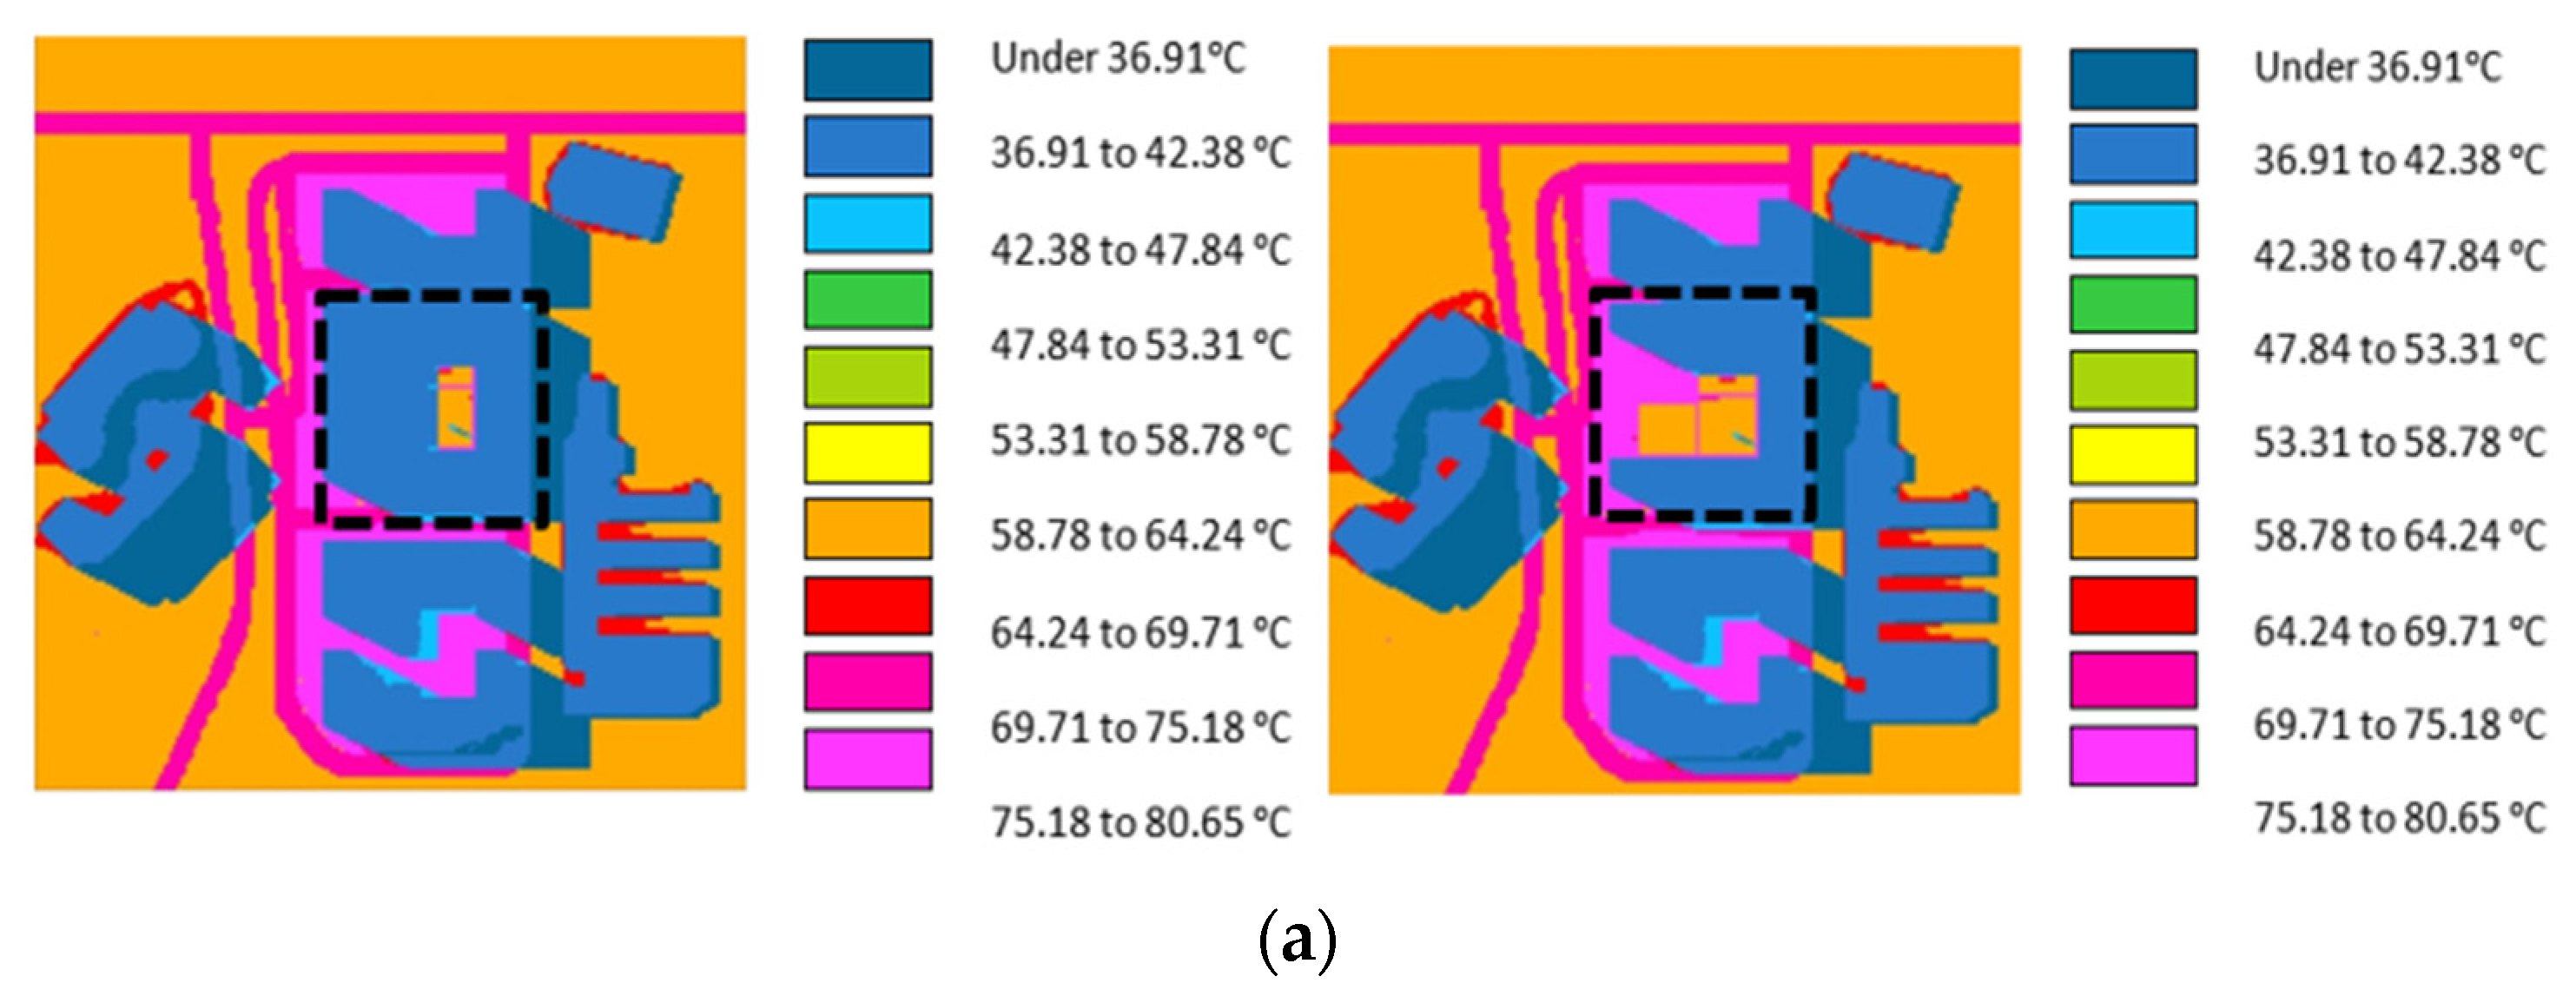
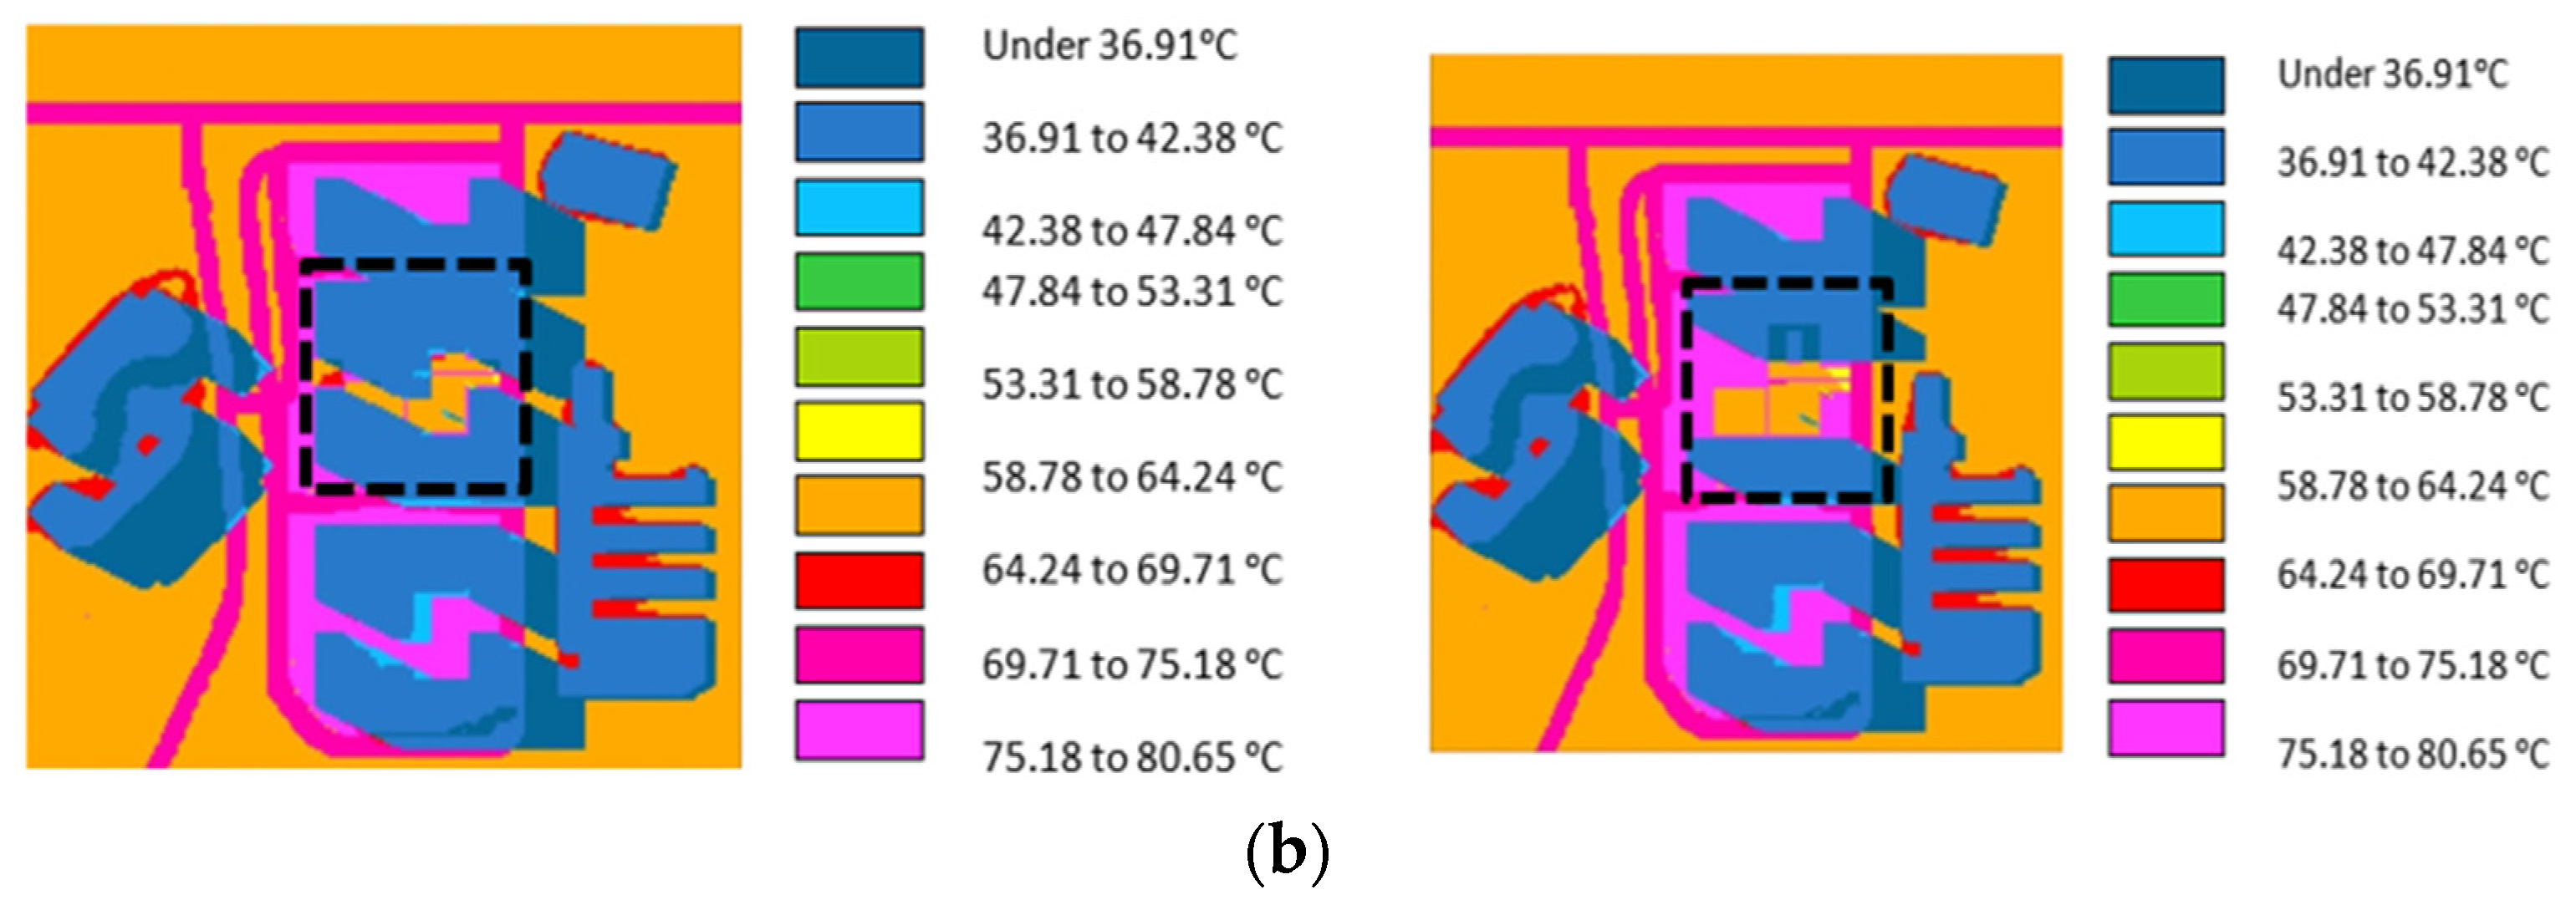
- We noted that lower air temperatures, mean radiant temperatures, and surface temperatures were predicted in the courtyard canyon and canyon models than the values obtained in the courtyard and U models—especially at FBTS.
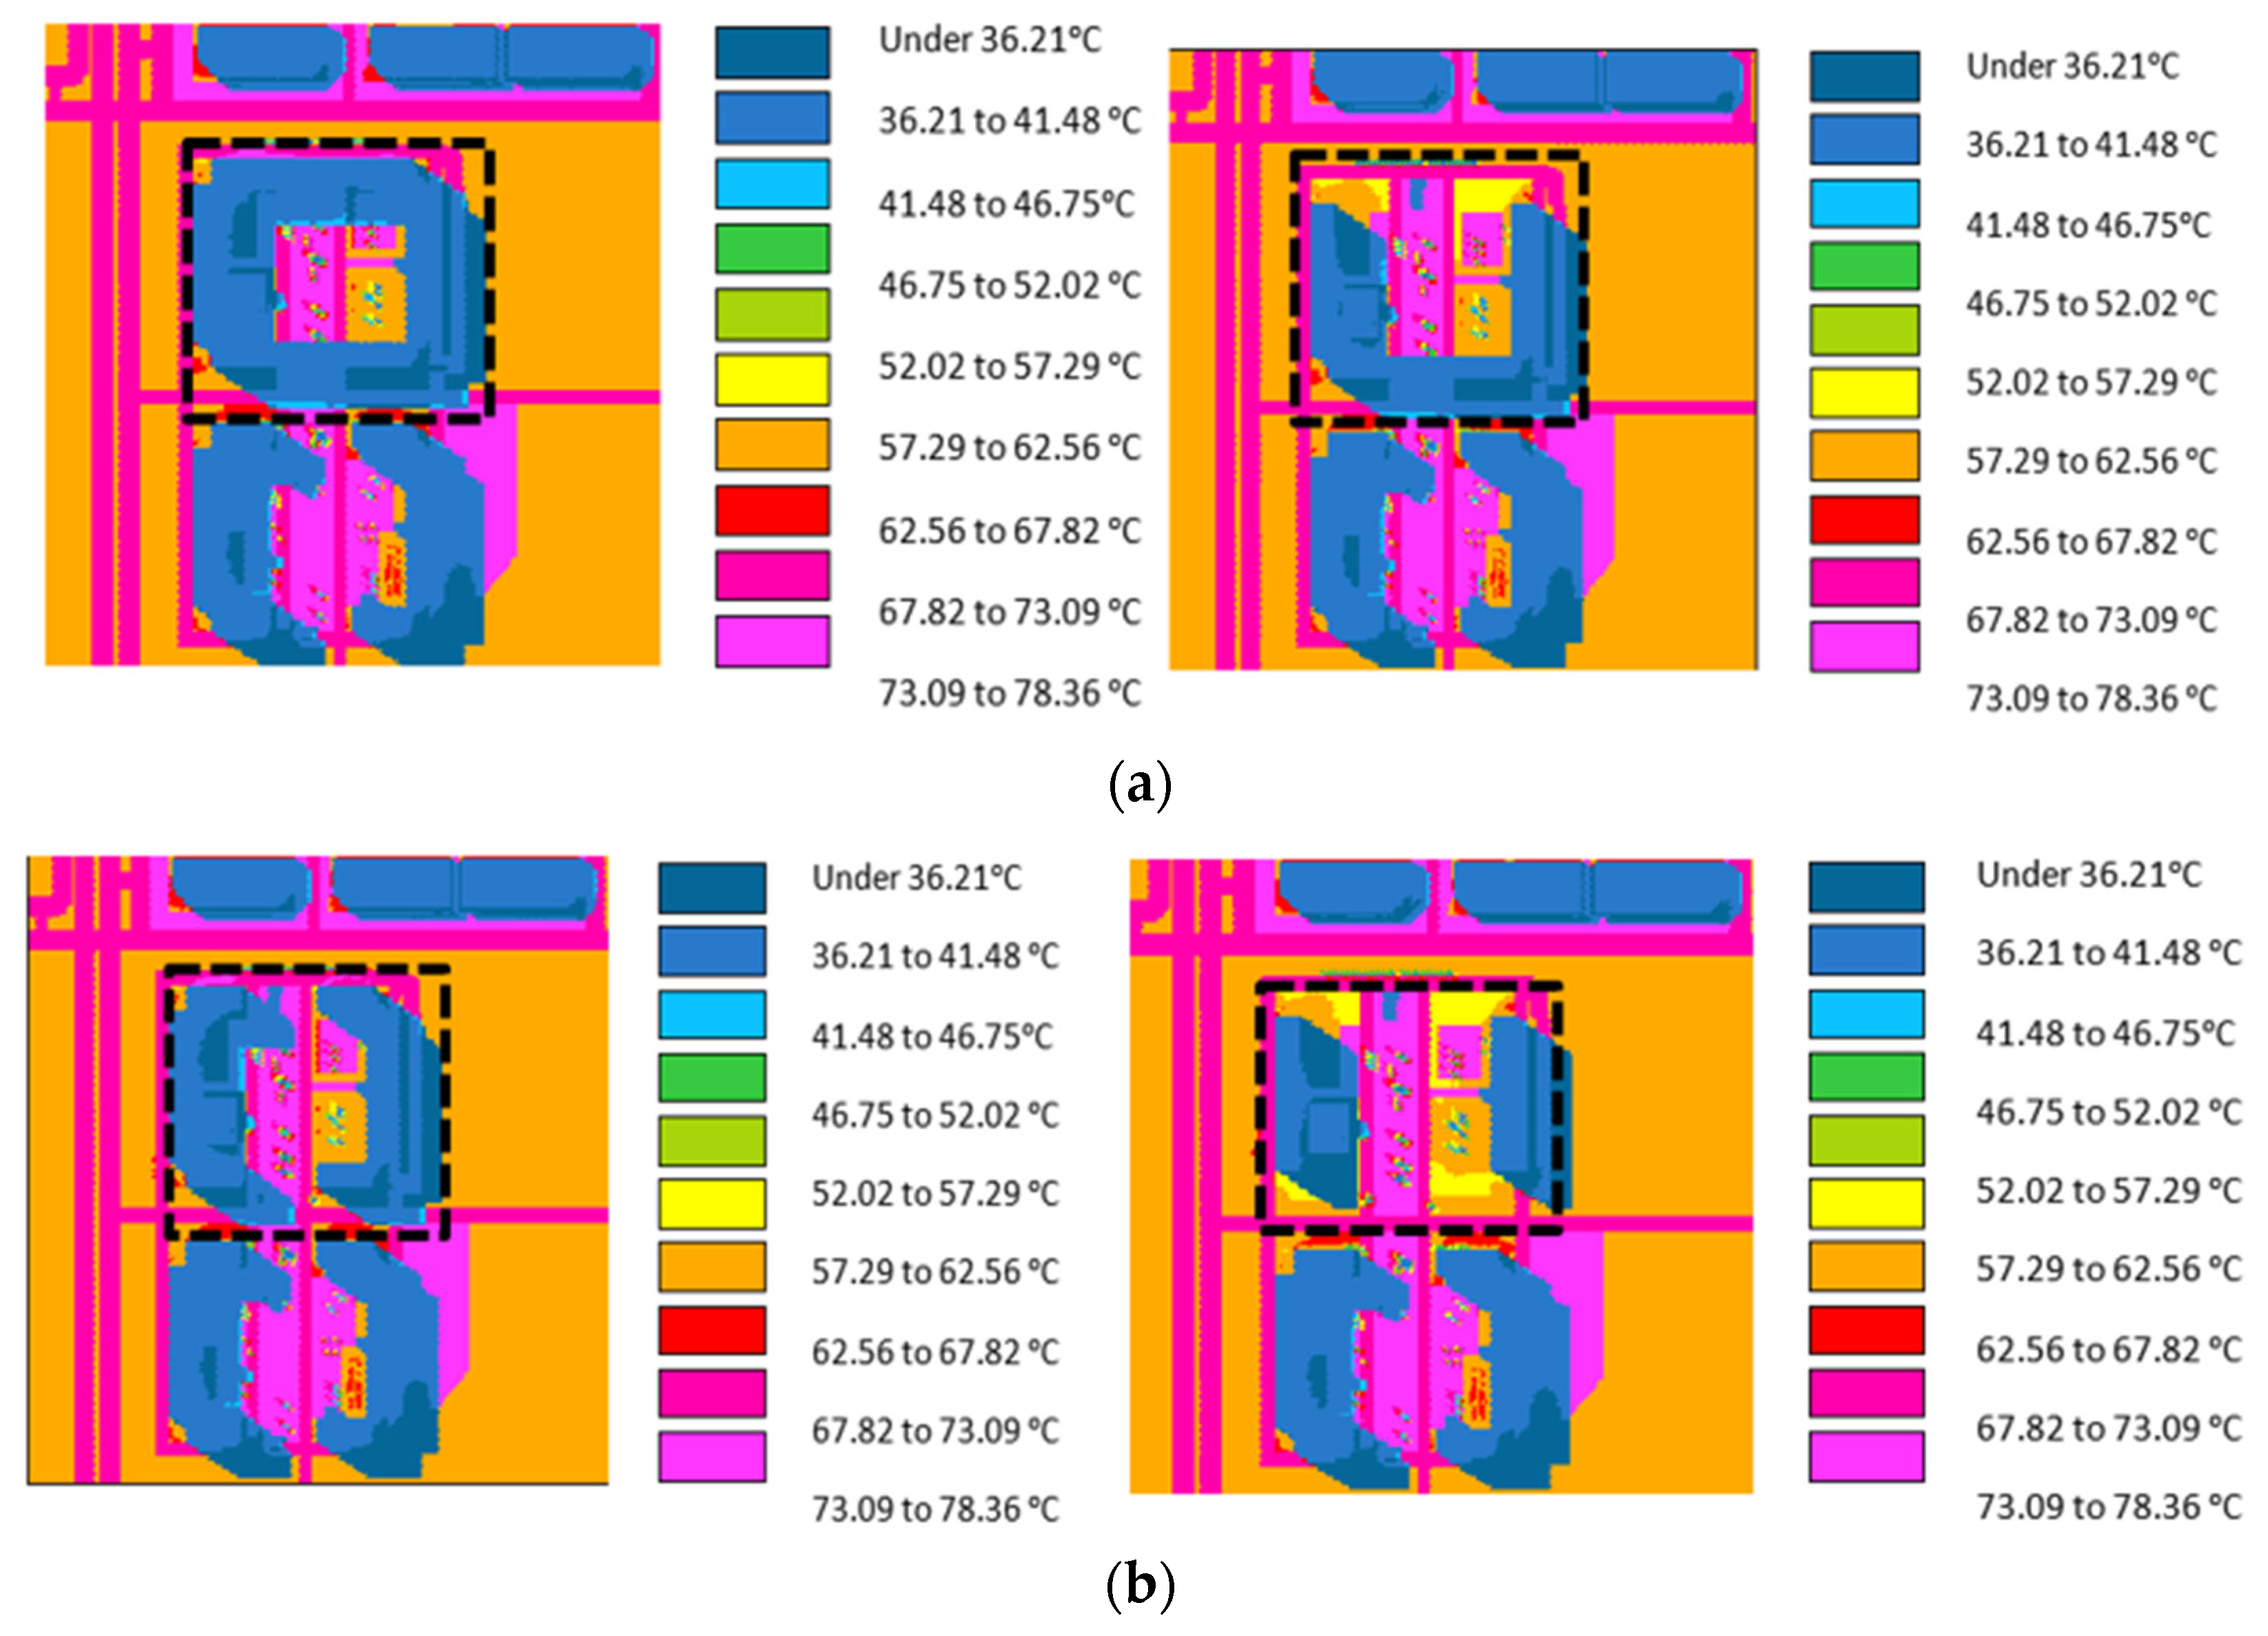
- At SM, the mean values of mean radiant temperatures were lower in the courtyard canyon and canyon models than the values predicted in the other models.
- The highest mean values of solar radiation were noted in the canyon models.
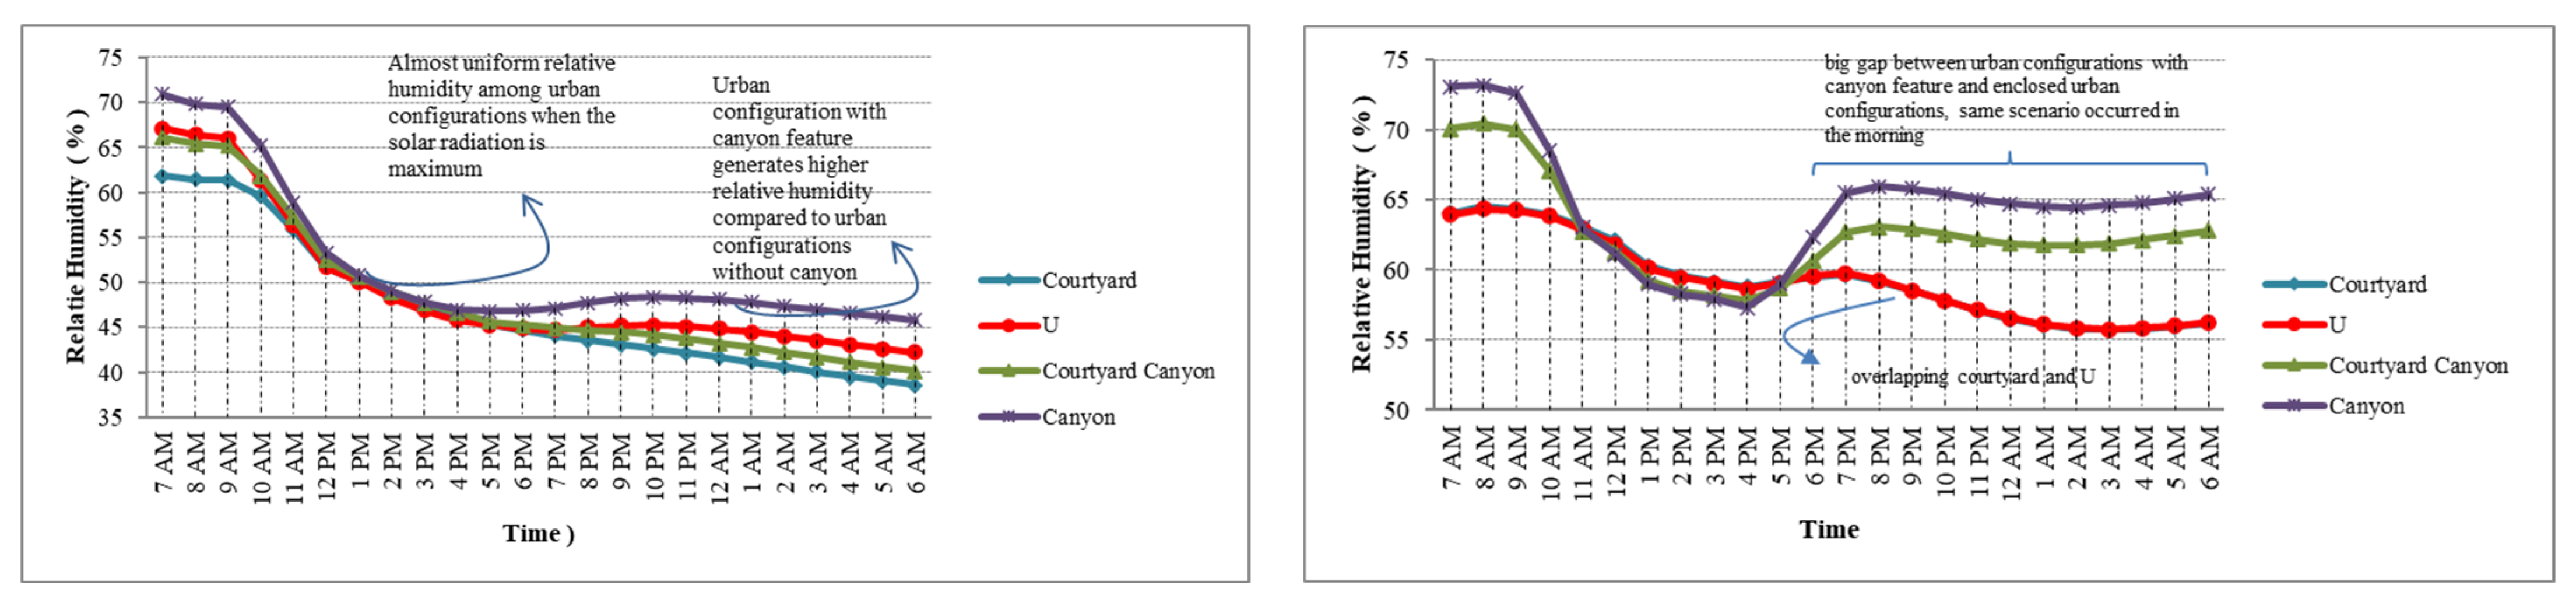
- At both locations, the mean values of air velocity and RH were higher in the courtyard canyon and canyon models than the values obtained in the remaining models.
- The geometries, orientations, and SVFs of the courtyard canyon and canyon models appear to be the contributing factors influencing the outcomes obtained in these models.
- (2)
- Do urban configurations also have significant impacts on thermal perceptions in the study areas?
- Our findings showed that air velocity has a minimal impact on WBGT, because higher values of this variable predicted in the canyon models did not significantly reduce the WBGT.
- An increase in RH tended to significantly increase the values of WBGT across the different models at FBTS and SM—especially in the canyon models.
- We also found that an increase in SVF can influence the thermal indices—especially WBGT.
- Our findings showed that urban configurations, in addition to other parameters, can have a significant impact on thermal perceptions in urban areas.Concerning the implications of the study, this investigation revealed the following:
- Continuous exposure of urban areas in tropical regions to high solar radiation can impact the thermal comfort of people. Therefore, appropriate design interventions can reduce the impact of high solar radiation and other variables in outdoor spaces.
- Our findings also indicate that the outcomes can provide insight on how to assess people’s vulnerability to thermal stress in outdoor spaces.
Author Contributions
Funding
Data Availability Statement
Conflicts of Interest
Abbreviations
| Height-to-Width | H/W |
| Wet-Bulb Globe Temperature | WBGT |
| Universal Thermal Climate Index | UTCI |
| Standard Effective Temperature | SET |
| Urban Heat Island | UHI |
| Mean radiant temperature | Tmrt |
| Sky View Factor | SVF |
| Relative Humidity | RH |
References
- Lomas, K.J.; Kane, T. Summertime temperatures and thermal comfort in UK homes. Build. Res. Inf. 2013, 41, 259–280. [Google Scholar] [CrossRef] [Green Version]
- Adekunle, T.O. Thermal performance and apparent temperature in school buildings: A case of cross-laminated timber (CLT) school development. J. Build. Eng. 2021, 33, 101731. [Google Scholar] [CrossRef]
- Nikolopoulou, M.; Baker, N.; Steemers, K. Thermal comfort in outdoor urban spaces: Understanding the human parameter. Sol. Energy 2001, 70, 227–235. [Google Scholar] [CrossRef]
- Pyrgou, A.; Castaldo, V.L.; Pisello, A.L.; Cotana, F.; Santamouris, M. Differentiating responses of weather files and local climate change to explain variations in building thermal-energy performance simulations. Sol. Energy 2017, 153, 224–237. [Google Scholar] [CrossRef]
- Santamouris, M.; Ding, L.; Fiorito, F.; Oldfield, P.; Osmond, P.; Paolini, R.; Prasad, D.; Synnefa, A. Passive and active cooling for the outdoor built environment—Analysis and assessment of the cooling potential of mitigation technologies using performance data from 220 large scale projects. Sol. Energy 2017, 154, 14–33. [Google Scholar] [CrossRef]
- Abdollahzadeh, N.; Biloria, N. Outdoor thermal comfort: Analyzing the impact of urban configurations on the thermal performance of street canyons in the humid subtropical climate of Sydney. Front. Arch. Res. 2020, 10, 394–409. [Google Scholar] [CrossRef]
- Adekunle, T.O. Developing Resilience to Emergencies: Evaluation of Thermal Indices and Outdoor Comfort Before and During the COVID-19 Pandemic. Front. Built Environ. 2021, 7, 765752. [Google Scholar] [CrossRef]
- Lai, D.; Zhou, C.; Huang, J.; Jiang, Y.; Long, Z.; Chen, Q. Outdoor space quality: A field study in an urban residential community in central China. Energy Build. 2014, 68, 713–720. [Google Scholar] [CrossRef]
- Emmanuel, R. Urban Climate Challenges in the Tropics: Rethinking Planning and Design Opportunities; Imperial College Press: London, UK, 2016. [Google Scholar]
- Zhao, Q.; Sailor, D.J.; Wentz, E.A. Impact of tree locations and arrangements on outdoor microclimates and human thermal comfort in an urban residential environment. Urban For. Urban Green. 2018, 32, 81–91. [Google Scholar] [CrossRef] [Green Version]
- Kantzioura, A.; Kosmopoulos, P.; Dimoudi, A.; Zoras, S. Experimental investigation of microclimatic conditions in relation to the built environment in a central urban area in Thessaloniki (Northern Greece): A case study. Sustain. Cities Soc. 2015, 19, 331–340. [Google Scholar] [CrossRef]
- Akbari, H.; Cartalis, C.; Kolokotsa, D.; Muscio, A.; Pisello, A.L.; Rossi, F.; Santamouris, M.; Synnefa, A.; Wong, N.H.; Zinzi, M. Local Climate Change and Urban Heat Island Mitigation Techniques—The State of the Art. J. Civ. Eng. Manag. 2016, 22, 1–16. [Google Scholar] [CrossRef] [Green Version]
- Piselli, C.; Castaldo, V.; Pigliautile, I.; Pisello, A.; Cotana, F. Outdoor comfort conditions in urban areas: On citizens’ perspective about microclimate mitigation of urban transit areas. Sustain. Cities Soc. 2018, 39, 16–36. [Google Scholar] [CrossRef]
- Bluyssen, P.M. Towards new methods and ways to create healthy and comfortable buildings. Build. Environ. 2010, 45, 808–818. [Google Scholar] [CrossRef]
- Klemm, W.; Heusinkveld, B.G.; Lenzholzer, S.; Jacobs, M.H.; Van Hove, B. Psychological and physical impact of urban green spaces on outdoor thermal comfort during summertime in The Netherlands. Build. Environ. 2015, 83, 120–128. [Google Scholar] [CrossRef]
- World Population Review. Kuala Lumpur Population 2021. Available online: https://worldpopulationreview.com/world-cities/kuala-lumpur-population (accessed on 19 December 2021).
- Yola, L. Canyon effects in urban configurations: Tropical context study. In IOP Conference Series: Earth and Environmental Science, International Conference on Sustainable Design, Engineering, Management and Sciences (ICSDEMS 2019), Kuala Lumpur, Malaysia, 16–17 October 2019; IOP Publishing: Bristol, UK, 2020; Volume 436, p. 012028. [Google Scholar] [CrossRef]
- Hendel, M.; Azos-Diaz, K.; Tremeac, B. Behavioral adaptation to heat-related health risks in cities. Energy Build. 2017, 152, 823–829. [Google Scholar] [CrossRef]
- Ge, Q.; Kong, Q.; Xi, J.; Zheng, J. Application of UTCI in China from tourism perspective. Arch. Meteorol. Geophys. Bioclimatol. Ser. B 2017, 128, 551–561. [Google Scholar] [CrossRef]
- Huang, Z.; Cheng, B.; Gou, Z.; Zhang, F. Outdoor thermal comfort and adaptive behaviors in a university campus in China’s hot summer-cold winter climate region. Build. Environ. 2019, 165, 106414. [Google Scholar] [CrossRef]
- Baruti, M.M.; Johansson, E.; Åstrand, J. Review of studies on outdoor thermal comfort in warm humid climates: Challenges of informal urban fabric. Int. J. Biometeorol. 2019, 63, 1449–1462. [Google Scholar] [CrossRef] [Green Version]
- Adekunle, T.O. Occupants’ comfort and stress indices in a structural timber school building in the Northeast US in different seasons. Build. Res. Inf. 2020, 48, 331–348. [Google Scholar] [CrossRef]
- Lin, T.-P.; Tsai, K.-T.; Hwang, R.-L.; Matzarakis, A. Quantification of the effect of thermal indices and sky view factor on park attendance. Landsc. Urban Plan. 2012, 107, 137–146. [Google Scholar] [CrossRef]
- Lenzholzer, S. Research and design for thermal comfort in Dutch urban squares. Resour. Conserv. Recycl. 2012, 64, 39–48. [Google Scholar] [CrossRef]
- Keivani, R. A review of the main challenges to urban sustainability. Int. J. Urban Sustain. Dev. 2010, 1, 5–16. [Google Scholar] [CrossRef]
- Gaitani, N.; Spanou, A.; Saliari, M.; Synnefa, A.; Vassilakopoulou, K.; Papadopoulou, K.; Pavlou, K.; Santamouris, M.; Papaioannou, M.; Lagoudaki, A. Improving the microclimate in urban areas: A case study in the centre of Athens. Build. Serv. Eng. Res. Technol. 2011, 32, 53–71. [Google Scholar] [CrossRef]
- Wong, P.P.-Y.; Lai, P.-C.; Low, C.T.; Chen, S.; Hart, M. The impact of environmental and human factors on urban heat and microclimate variability. Build. Environ. 2016, 95, 199–208. [Google Scholar] [CrossRef] [Green Version]
- Tsoka, S.; Tsikaloudaki, K.; Theodosiou, T.; Bikas, D. Urban Warming and Cities’ Microclimates: Investigation Methods and Mitigation Strategies—A Review. Energies 2020, 13, 1414. [Google Scholar] [CrossRef] [Green Version]
- Yola, L.; Siong, H.C.; Djaja, K.K. Impact of Urban Configurations on Airflow: Tropical Context Study. In ICSDEMS 2019; Emamian, S., Adekunle, T., Nangkula, U., Awang, M., Eds.; Springer: Singapore, 2021. [Google Scholar] [CrossRef]
- Ichinose, T.; Shimodozono, K.; Hanaki, K. Impact of anthropogenic heat on urban climate in Tokyo. Atmos. Environ. 1999, 33, 3897–3909. [Google Scholar] [CrossRef]
- Tumini, I.; García, E.H.; Rada, S.B. Urban microclimate and thermal comfort modelling: Strategies for urban renovation. Int. J. Sustain. Build. Technol. Urban Dev. 2016, 7, 22–37. [Google Scholar] [CrossRef] [Green Version]
- Tsoka, S.; Tsikaloudaki, K.; Theodosiou, T. Urban space’s morphology and microclimatic analysis: A study for a typical urban district in the Mediterranean city of Thessaloniki, Greece. Energy Build. 2017, 156, 96–108. [Google Scholar] [CrossRef]
- Martins, T.A.; Adolphe, L.; Bonhomme, M.; Bonneaud, F.; Faraut, S.; Ginestet, S.; Michel, C.; Guyard, W. Impact of Urban Cool Island measures on outdoor climate and pedestrian comfort: Simulations for a new district of Toulouse, France. Sustain. Cities Soc. 2016, 26, 9–26. [Google Scholar] [CrossRef]
- Xu, J.; Wei, Q.; Huang, X.; Zhu, X.; Li, G. Evaluation of human thermal comfort near urban waterbody during summer. Build. Environ. 2010, 45, 1072–1080. [Google Scholar] [CrossRef]
- Taleghani, M.; Sailor, D.J.; Tenpierik, M.; Dobbelsteen, A.V.D. Thermal assessment of heat mitigation strategies: The case of Portland State University, Oregon, USA. Build. Environ. 2014, 73, 138–150. [Google Scholar] [CrossRef] [Green Version]
- Manteghi, G.; Bin Limit, H.; Remaz, D. Water Bodies an Urban Microclimate: A Review. Mod. Appl. Sci. 2015, 9, 1–12. [Google Scholar] [CrossRef] [Green Version]
- Brans, K.I.; Engelen, J.M.; Souffreau, C.; De Meester, L. Urban hot-tubs: Local urbanization has profound effects on average and extreme temperatures in ponds. Landsc. Urban Plan. 2018, 176, 22–29. [Google Scholar] [CrossRef]
- Shahmohamadi, P.; Che-Ani, A.I.; Maulud, K.N.A.; Tawil, N.M.; Abdullah, N.A.G. The Impact of Anthropogenic Heat on Formation of Urban Heat Island and Energy Consumption Balance. Urban Stud. Res. 2011, 2011, 1–9. [Google Scholar] [CrossRef] [Green Version]
- Yola, L.; Siong, H.C.; Djaja, K. Climatically responsive urban configuration in residential area: Research gaps. In AIP Conference Proceedings, Proceedings of the 4th International Tropical Renewable Energy Conference, Bali, Indonesia, 14–16 August 2020; Kusrini, E., Nugraha, I.G.D., Eds.; American Institute of Physics: College Park, MD, USA, 2020; Volume 2255. [Google Scholar] [CrossRef]
- Oke, T.R. Review of Urban Climatology, 1973–1976; WMO Technical Note No. 169, WMo No. 539; World Meteorological Organization: Geneva, Switzerland, 1979. [Google Scholar]
- Gupta, V.K. Solar radiation and urban design for hot climates. Environ. Plan. B Plan. Des. 1984, 11, 435–454. [Google Scholar] [CrossRef]
- Arnfield, A. Street design and urban canyon solar access. Energy Build. 1990, 14, 117–131. [Google Scholar] [CrossRef]
- Givoni, B. Climate Considerations in Buildings and Urban Design; Van Nostrand Reinhold: New York, NY, USA, 1998. [Google Scholar]
- Elhanas, M.M. The Effects of Urban Configuration on Urban Air Temperatures. Archit. Sci. Rev. 2003, 46, 2003. [Google Scholar]
- Ng, E. Designing for Daylighting—Designing High-Density Cities for Social and Environmental Sustainability; Earthscan: London, UK, 2010. [Google Scholar]
- Erell, E.; Pearlmutter, D.; Wiliamson, T. Urban Microclimate: Designing the Spaces between Buildings; Earthscan: London, UK, 2011. [Google Scholar]
- Priyadarsini, R.; Wong, N.H. Building Surfaces and their Effect on the Urban Thermal Environment. Archit. Sci. Rev. 2011, 48, 345–356. [Google Scholar] [CrossRef]
- Yuan, C.; Ng, E. Building porosity for better urban ventilation in high-density cities—A computational parametric study. Build. Environ. 2012, 50, 176–189. [Google Scholar] [CrossRef] [PubMed]
- Allegrini, J.; Dorer, V.; Carmeliet, J. Influence of Morphologies on the Microclimate in Urban Neighborhoods. J. Wind. Eng. Ind. Aerodyn. 2015, 144, 108–117. [Google Scholar] [CrossRef]
- Kariminia, S.; Ahmad, S.S.; Saberi, A. Microclimatic Conditions of an Urban Square: Role of Built Environment and Geometry. Procedia-Soc. Behav. Sci. 2015, 170, 718–727. [Google Scholar] [CrossRef] [Green Version]
- Rodríguez Algeciras, J.A.; Gómez Consuegra, L.; Matzarakis, A. Spatial-temporal study on the effects of urban street configurations on human thermal comfort in the world heritage city of Camagüey-Cuba. Build. Environ. 2016, 101, 85–101. [Google Scholar] [CrossRef]
- Taleghani, M.; Kleerekoper, L.; Tenpierik, M.; van den Dobbelsteen, A. Outdoor thermal comfort within five different urban forms in the Netherlands. Build. Environ. 2015, 83, 65–78. [Google Scholar] [CrossRef]
- Ghaffarianhoseini, A.; Berardi, U.; Ghaffarianhoseini, A. Thermal performance characteristics of unshaded courtyards in hot and humid climates. Build. Environ. 2015, 87, 154–168. [Google Scholar] [CrossRef]
- Abdallah, A.S.H. The Influence of Urban Geometry on Thermal Comfort and Energy Consumption in Residential Building of Hot Arid Climate, Assiut, Egypt. Procedia Eng. 2015, 121, 158–166. [Google Scholar] [CrossRef] [Green Version]
- Ndetto, E.L.; Matzarakis, A. Effects of Urban Configuration on Human Thermal Conditions in a Typical Tropical African Coastal City. Adv. Meteorol. 2013, 2013, 549096. [Google Scholar] [CrossRef] [Green Version]
- Martins, T.; Adolphe, L.; Krause, C. Microclimate Effects of Urban Geometry on Outdoor Thermal Comfort in the Brazilian Tropical Semi-arid Climate. In Proceedings of the PLEA2012—28th 2012 Opportunities, Limits & Needs towards an Environmentally Responsible Architecture Conference, Lima, Peru, 7–9 November 2012. [Google Scholar]
- Krüger, E.L.; Minella, F.O.; Rasia, F. Impact of urban geometry on outdoor thermal comfort and air quality from field measurements in Curitiba, Brazil. Build. Environ. 2011, 46, 621–634. [Google Scholar] [CrossRef]
- Herrmann, J.; Matzarakis, A. Influence of Mean Radiant Temperature on Thermal Comfort Of Humans In Idealized Urban Environments. In Proceedings of the 7th Conference on Biometeorology, Freiburg, Germany, 11–14 April 2010. [Google Scholar]
- Johansson, E. Influence of urban geometry on outdoor thermal comfort in a hot dry climate: A study in Fez, Morocco. Build. Environ. 2006, 41, 1326–1338. [Google Scholar] [CrossRef]
- Muhaisen, A.S.; Abed, H.M. Effect of Urban Geometry and Spacing on the Thermal Performance in the Mediterranean Climate of the Gaza Strip. J. Archit. Plan. 2014, 26, 1–14. [Google Scholar]
- Alznafer, B.M.S. The Impact of Neighbourhood Geometries on Outdoor Thermal Comfort and Energy Consumption from Urban Dwellings: A Case Study of The Riyadh City, The Kingdom Of Saudi Arabia. Ph.D. Thesis, Cardiff University, Cardiff, UK.
- LSE Cities Cities and Energy: Urban Morphology and Heat Energy Demand—Final Report; LSE Cities: London, UK; EIFER: Karlsruhe, Germany, 2014.
- Futcher, J.A.; Mills, G. The role of urban form as an energy management parameter. Energy Policy 2013, 53, 218–228. [Google Scholar] [CrossRef]
- Dorer, V.; Allegrini, J.; Orehounig, K.; Moonen, P.; Upadhyay, G.; Kampf, J.; Carmeliet, J. Modelling The Urban Microclimate And Its Impact On The Energy Demand Of Buildings And Building Clusters. In Proceedings of the 13th Conference of International Building Performance Simulation Association, Chambéry, France, 26–28 August 2013; Volume 13, pp. 3483–3489. [Google Scholar] [CrossRef]
- Abed, H.M.H. Effect of Building Form on the Thermal Performance of Residential Complexes in the Mediterranean Climate of the Gaza Strip. Master’s Thesis, The Islamic University of Gaza, Gaza, Palestine, 2012. [Google Scholar]
- Creswell-Wells, T.; Donn, M.; Cory, S. Christchurch Urban Form and Energy (Bees Interim Report); Branz: Judgeford, UK, 2012. [Google Scholar]
- Hachem, C.; Athienitis, A.; Fazio, P. Parametric investigation of geometric form effects on solar potential of housing units. Sol. Energy 2011, 85, 1864–1877. [Google Scholar] [CrossRef]
- Oke, T.R. Urban Environments. In The Surface Climates of Canada, (303–327); Bailey, W.G., Oke, T.R., Rouse, W.R., Eds.; McGill-Queen’s University Press: Montreal, Canada, 1997. [Google Scholar]
- Yola, L.; Siong, H.C. Solar Radiation and Urban Wind Effect on Urban Canyon in Hot, Humid Regions. Environ. Proc. J. 2016, 1, 220–229. [Google Scholar] [CrossRef] [Green Version]
- Berardi, U.; Graham, J. Investigation of the impacts of microclimate on PV energy efficiency and outdoor thermal comfort. Sustain. Cities Soc. 2020, 62, 102402. [Google Scholar] [CrossRef]
- Binarti, F.; Koerniawan, M.D.; Triyadi, S.; Utami, S.S.; Matzarakis, A. A review of outdoor thermal comfort indices and neutral ranges for hot-humid regions. Urban Clim. 2020, 31, 100531. [Google Scholar] [CrossRef]
- Ye, G.; Yang, C.; Chen, Y.; Li, Y. A new approach for measuring predicted mean vote (PMV) and standard effective temperature (SET∗). Build. Environ. 2003, 38, 33–44. [Google Scholar] [CrossRef]
- Wang, Y.; Ni, Z.; Peng, Y.; Xia, B. Local variation of outdoor thermal comfort in different urban green spaces in Guangzhou, a subtropical city in South China. Urban For. Urban Green. 2018, 32, 99–112. [Google Scholar] [CrossRef]
- Sharmin, T.; Steemers, K.; Humphreys, M. Outdoor thermal comfort and summer PET range: A field study in tropical city Dhaka. Energy Build. 2019, 198, 149–159. [Google Scholar] [CrossRef]
- Kandjov, I.; Ivancheva, J.; Tzenkova, A.; Ivancheva, J. Some biometeorological aspects of urban climate in Sofia. Proc. Fifth Int. Conf. Urban Clim. Lodz. Pol. 2003, 2, 103–106. [Google Scholar]
- Fong, C.S.; Aghamohammadi, N.; Ramakreshnan, L.; Sulaiman, N.M.; Mohammadi, P. Holistic recommendations for future outdoor thermal comfort assessment in tropical Southeast Asia: A critical appraisal. Sustain. Cities Soc. 2019, 46, 101428. [Google Scholar] [CrossRef]
- Deng, J.-Y.; Wong, N.H. Impact of urban canyon geometries on outdoor thermal comfort in central business districts. Sustain. Cities Soc. 2020, 53, 101966. [Google Scholar] [CrossRef]
- Elnabawi, M.H.; Hamza, N. Behavioural Perspectives of Outdoor Thermal Comfort in Urban Areas: A Critical Review. Atmosphere 2019, 11, 51. [Google Scholar] [CrossRef] [Green Version]
- Matallah, M.E.; Alkama, D.; Ahriz, A.; Attia, S. Assessment of the Outdoor Thermal Comfort in Oases Settlements. Atmosphere 2020, 11, 185. [Google Scholar] [CrossRef] [Green Version]
- Nazarian, N.; Acero, J.A.; Norford, L. Outdoor thermal comfort autonomy: Performance metrics for climate-conscious urban design. Build. Environ. 2019, 155, 145–160. [Google Scholar] [CrossRef]
- Potchter, O.; Cohen, P.; Lin, T.-P.; Matzarakis, A. Outdoor human thermal perception in various climates: A comprehensive review of approaches, methods and quantification. Sci. Total Environ. 2018, 631, 390–406. [Google Scholar] [CrossRef]
- Yaglou, C.P.; Minaed, D. Control of heat casualties at military training centers. Arch. Industr. Health 1957, 16, 302–316. [Google Scholar]
- Budd, G.M. Wet-bulb globe temperature (WBGT)—Its history and its limitations. J. Sci. Med. Sport 2008, 11, 20–32. [Google Scholar] [CrossRef] [PubMed]
- Lemke, B.; Kjellstrom, T. Calculating Workplace WBGT from Meteorological Data: A Tool for Climate Change Assessment. Ind. Health 2012, 50, 267–278. [Google Scholar] [CrossRef] [Green Version]
- ANSI/ASHRAE Standard-55; Thermal Environmental Conditions for Human Occupancy. The American Society of Heating Refrigerating and Air-Conditioning Engineers: Atlanta, GA, USA, 2017.
- Climate Adapt. Thermal Comfort Indices—Universal Thermal Climate Index, 1979–2020. The European Climate Adaptation Platform Climate-ADAPT. The European Commission and the European Environment Agency. Available online: https://climate-adapt.eea.europa.eu/metadata/indicators/thermal-comfort-indices-universal-thermal-climate-index-1979-2019 (accessed on 7 August 2022).
- Bröde, P.; Fiala, D.; Blazejczyk, K.; Epstein, Y.; Holmér, I.; Jendritzky, G.; Kampmann, B.; Richards, M.; Rintamäki, H.; Shitzer, A.; et al. Calculating UTCI Equivalent Temperature. In Proceedings of the 13th International Conference on Environmental Ergonomics, Boston, MA, USA, 2–7 August 2009. [Google Scholar]
- Adekunle, T.O.; Nikolopoulou, M. Winter performance, occupants’ comfort and cold stress in prefabricated timber buildings. Build. Environ. 2019, 149, 220–240. [Google Scholar] [CrossRef]
- Guo, F.; Wang, Z.; Dong, J.; Zhang, H.; Lu, X.; Lau, S.S.Y.; Miao, Y. Spatial Differences in Outdoor Thermal Comfort during the Transition Season in Cold Regions of China. Buildings 2022, 12, 720. [Google Scholar] [CrossRef]
- Amirtham, L.R.; Horrison, E.; Rajkumar, S. Study on the Microclimatic Conditions and Thermal Comfort in an Institutional Campus in Hot Humid Climate. In Proceedings of the 30th International PLEA Conference, Ahmedabad, India, 16–18 December 2014. [Google Scholar]
- Chen, L.; Ng, E. Outdoor thermal comfort and outdoor activities: A review of research in the past decade. Cities 2012, 29, 118–125. [Google Scholar] [CrossRef]
- Dalman, M.; Salleh, E.; Sapian, A.R.; Tahir, O.M.; Dola, K.; Saadatian, O. Micro-climate and Thermal Comfort of Urban Forms and Canyons in Traditional and Modern Residential Fabrics in Bandar Abbas, Iran. J. Mod. Appl. Sci. 2011, 5, 43–56. [Google Scholar]
- Lazaridis, M. First Principles of Meteorology and Air Pollution; Springer: Dordrecht, Germany, 2010. [Google Scholar] [CrossRef]
- Lan, L.; Wargocki, P.; Lian, Z. Optimal Thermal Environment Improves Performance of Office Work. REHVA Eur. HVAC J. 2012, 49, 12–17. [Google Scholar]
- Matzarakis, A. Die Thermische Komponente des Stadtklimas. Ph.D. Thesis, Habilitationsschrift, Albert-Ludwigs-Universität, Freiburg, Germany, 2001. [Google Scholar]
- Thorsson, S.; Lindberg, F.; Eliasson, I.; Holmer, B. Different methods for estimating the mean radiant temperature in an outdoor urban setting. Int. J. Climatol. 2013, 27, 1983–1993. [Google Scholar] [CrossRef]
- Kántor, N.; Unger, J. The most problematic variable in the course of human-biometeorological comfort assessment—The mean radiant temperature. Open Geosci. 2011, 3, 90–100. [Google Scholar] [CrossRef] [Green Version]
- Krüger, E.L.; Minella, F.O.; Matzarakis, A. Analysis of Different Input Data for Assessing Mean Radiant Temperature as Relevant Human-Biometeorological Factor in Thermal Comfort Issues. In Proceedings of the PLEA2013–29th Conference on Sustainable Architecture for a Renewable Future, Munich, Germany, 10–12 September 2013. [Google Scholar]
- Honjo, T. Thermal Comfort in Outdoor Environment. Glob. Environ. Res. 2009, 13, 43–47. [Google Scholar]
- Yola, L. Influence of Urban Canyon Direction on Long Wave Radiation Pattern in a Tropical Context. In Sustainable Development Approaches. Lecture Notes in Civil Engineering; Nia, E.M., Farshchi, I., Yola, L., Awang, M., Eds.; Springer: Cham, Switzerland, 2022; Volume 243. [Google Scholar] [CrossRef]
- Yola, L.; Ayegbusi, O.G.; Saiya, H.G.; Djaja, K. Empirical and Numerical Approaches in Urban Microclimate ModelingInvestigation on the Reliability. In Sustainable Architecture and Building Environment; Springer: Singapore, 2022; pp. 51–57. [Google Scholar] [CrossRef]
- Yola, L.; Siong, H.C. Computer simulation as an alternative approach in climatically responsive urban configuration study. Chem. Eng. Trans. 2017, 56, 505–510. [Google Scholar] [CrossRef]
- Shahidan, M.F.; Salleh, E.; Mustafa, K.M.S. Effect of tree canopies on solar radiation infiltration in a tropical microclimatic environment. In Proceedings of the 24th Conference on Passive and Low Energy Architecture (PLEA), Singapore, 22–24 November 2007. [Google Scholar]
- Middel, A.; Häb, K.; Brazel, A.J.; Martin, C.A.; Guhathakurta, S. Impact of urban form and design on mid-afternoon microclimate in Phoenix Local Climate Zones. Landsc. Urban Plan. 2014, 122, 16–28. [Google Scholar] [CrossRef]
- Elnabawi, M.H.; Hamza, N.; Dudek, S. Numerical modelling evaluation for the microclimate of an outdoor urban form in Cairo, Egypt. HBRC J. 2015, 11, 246–251. [Google Scholar] [CrossRef] [Green Version]
- Paramita, B.; Fukuda, H. Study on the Effect of Aspect Building Form and Layout—Case Study: Honjo Nishi Danchi, Yahatanishi, Kitakyushu—Fukuoka. In Proceedings of the 3th International Conference on Sustainable Future for Human Security, Kyoto, Japan, 3–5 November 2012. [Google Scholar]
- Bruse, M. Modelling and Strategies for Improved Urban Climate. In Proceedings of the International Conference on Urban Climatology & International Congress of Biometeorology, Sydney, Australia, 8–12 November 1999. [Google Scholar]
- Qaid, A.; Ossen, D.R. Effect of asymmetrical street aspect ratios on microclimates in hot, humid regions. Int. J. Biometeorol. 2014, 59, 657–677. [Google Scholar] [CrossRef] [PubMed]
- Malaysian Meteorology Department. 2015. Available online: http://www.met.gov.my/ (accessed on 19 December 2021).
- Baharun, A.; Ibrahim, S.H.; Abdullah, M.O.; Beng, O.K. A Passive Malaysian Residential Building with a Hydronic Radiator. IJRRAS 2011, 7, 380–389. [Google Scholar]
- Al-Obaidi, K.M.; Ismail, M.; Rahman, A.M.A. A study of the impact of environmental loads that penetrate a passive skylight roofing system in Malaysian buildings. Front. Arch. Res. 2014, 3, 178–191. [Google Scholar] [CrossRef]
- Makaremi, N.; Salleh, E.; Jaffar, M.Z.; Gaffarianhoseini, A. Thermal Comfort Conditions of Shaded Outdoor Spaces in Hot and Humid Climate of Malaysia. Build. Environ. 2012, 48, 7–14. [Google Scholar] [CrossRef]


| Research Areas | Researchers, Year |
|---|---|
| Impact of urban configurations on microclimate | Oke, 1979 [40]; Gupta, 1984 [41]; Arnfield, 1990 [42]; Givoni, 1998 [43]; Elhanas, 2003 [44]; Ng, 2010 [45]; Erell et al., 2011 [46]; Priyadarsini and Wong, 2011 [47]; Yuan and Ng, 2012 [48]; Allegrini et al., 2015 [49]; Kariminia et al., 2015 [50]. |
| Impact of urban configurations on thermal comfort | Algeciras et al., 2016 [51]; Taleghani et al., 2015 [52]; Ghaffarianhoseini et al., 2015 [53]; Abdallah, 2015 [54]; Ndetto and Matzarakis, 2013 [55]; Martins et al., 2012 [56]; Krüger et al., 2011 [57]; Herrmann and Matzarakis, 2010 [58]; Johansson, 2006 [59]. Muhaisen and Abed, 2014 [60]; Alznafer, 2014 [61]; LSE Cities, 2014 [62]; Futcher and Mills, 2013 [63]; Dorer et al., 2013 [64]; Abed, 2012 [65]; Creswell-Wells et al., 2012 [66]; Hachim et al., 2011 [67]. |
| WBGT Indices | Period | UTCI Indices | * Classes of the Indices |
|---|---|---|---|
| Temperature less than 28.6 °C | Less than 60 min per hour | Temperature less than −40 °C | Extreme cold stress |
| Very strong cold stress | |||
| Temperature equals 29.3 °C | Less than 45 min per hour | Temperature equals −27 °C | |
| Strong cold stress | |||
| Temperature equals 30.6 °C | Less than 30 min per hour | Temperature equals −13 °C | |
| Moderate cold stress | |||
| Temperature equals 31.8 °C | Less than 15 min per hour | Temperature equals 0 °C | |
| Slight cold stress | |||
| Temperature that exceeds 38 °C | Less than 0 min per hour | Temperature equals 9 °C | |
| No heat stress | |||
| Temperature equals 26 °C | |||
| Moderate heat stress | |||
| Temperature equals 32 °C | |||
| Strong heat stress | |||
| Temperature equals 38 °C | |||
| Very strong heat stress | |||
| Temperature that exceeds 46 °C | |||
| Extreme heat stress |
| Case Study/Description | Configurations without Canyon Feature | Configurations with Canyon Feature |
|---|---|---|
| Case 1—Flat Bandar Tasik Selatan (FTBS): The site is located in the Cheras residential area, Kuala Lumpur. It consists of 19-storey apartments (60 m height) with the surrounding residential blocks of different heights. The outdoor space is usually shaded by a change in the Sun’s altitude, and it mainly functions as a hub for the residents’ social outdoor activities. The outdoor space surface consists of grass, trees, concrete pavement, and asphalt. | ENVI-met model of four urban configurations situated at the Flat Bandar Tasik Selatan site (highlighted in red) | |
 (a) Courtyard (hypothetical)—left (b) U (hypothetical)—right |  (a) Courtyard canyon (existing)—left (b) Canyon (hypothetical)—right | |
| RayMan-generated fisheye SVF hemispheres of four urban configurations in the east–west canyon direction (Flat Bandar Tasik Selatan) | ||
 | ||
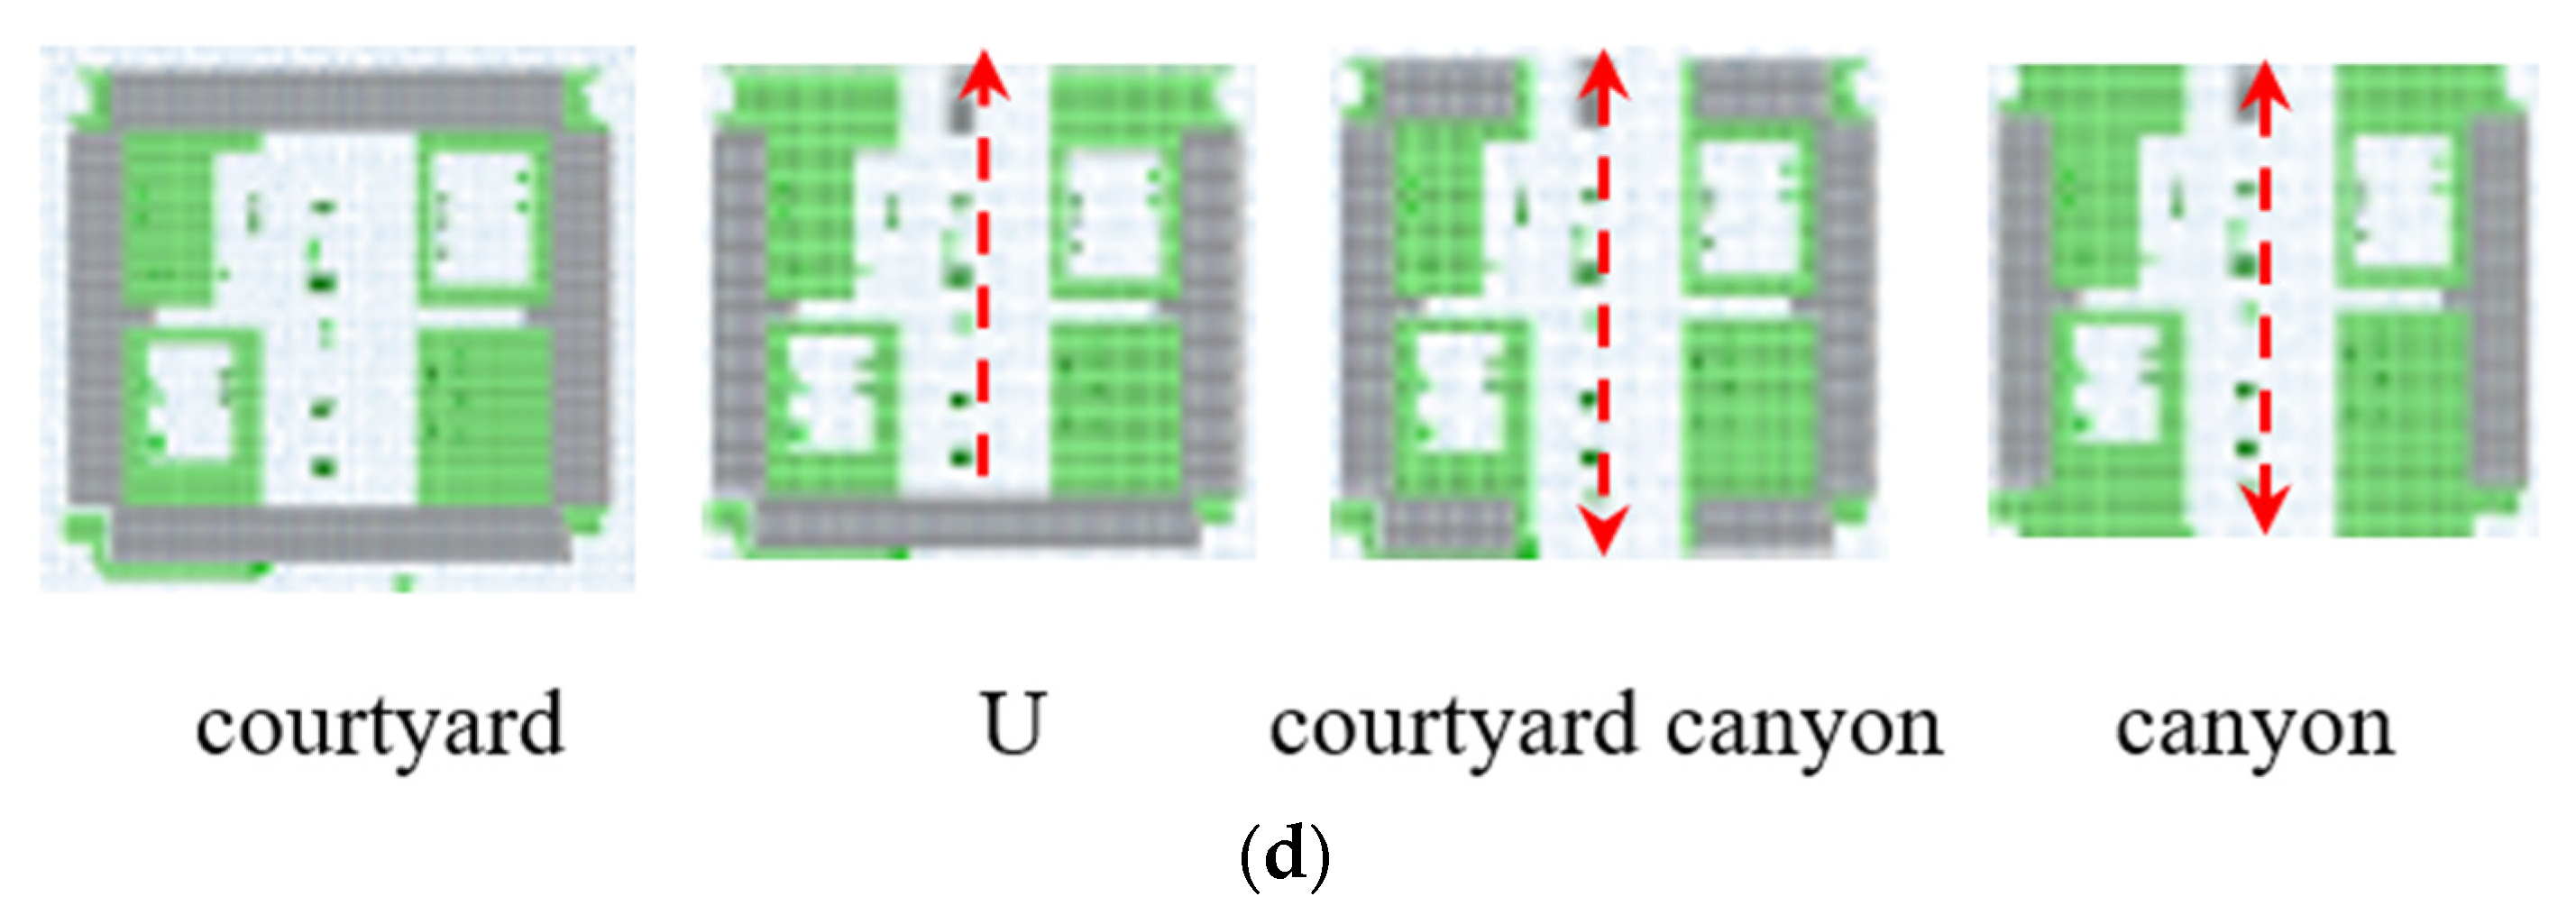
| Case 2—Surya Magna (SM): Surya Magna (SM) is located in Kepong, Kuala Lumpur. It is a 15-storey apartment (45 m) surrounded by dense residential and commercial areas. The outdoor open space is mainly used for sitting and playground areas. The ground surface includes grass, dense trees, and concrete pavement. | ENVI-met model of four urban configurations situated at the Surya Magna site (highlighted in red) | |
 (a) Courtyard (hypothetical)—top  (b) U (hypothetical)—below |  (a) Courtyard canyon (existing)—top  (b) Canyon (hypothetical)—below | |
| RayMan-generated fisheye SVF hemispheres of four urban configurations in the north–south canyon direction (Surya Magna) | ||
 | ||
| Variables | Corresponding Values |
|---|---|
| The start date of the simulation | 21 June |
| The start time of the simulation | 06.00.00 |
| Total simulation time (hours) | 24.0 |
| Save model duration (min) | 60.0 |
| Wind speed in (m/s) | 1.4 |
| Wind direction | 225 (Southwest) |
| Roughness length z0 at the reference point | 0.1 |
| Initial temperature atmosphere (K) | 303.15 |
| Specific humidity in 2500 m | 4.0 |
| Relative humidity in 2 m (%) | 83.0 |
| Initial upper-layer temperature (0–20 cm) (K) | 303.15 |
| Relative upper-layer humidity (0–20 cm) (%) | 83.0 |
| Internal temperature of building (K) | 293.0 |
| Heat transmission—walls (W/m²K) | 1.94 |
| Heat transmission—rooves (W/m²K) | 6.0 |
| Albedo walls | 0.3 |
| Albedo roofs | 0.5 |
| Walking speed (m/s) (for PMV) | 0.0 |
| Energy exchange (Col. 2 M/A) (for PMV) | 70.0 |
| Mechanical factor (for PMV) | 0.0 |
| Heat transfer resistance of clothes (for PMV) | 0.5 |
| Urban Configurations/Variables | Mean Air Temp. (°C) | Mean Solar Radiation (W/m2) | Mean Radiant Temp. (°C) | Mean Surf. Temp. (°C) | Mean Oper. Temp. (°C) | Mean RH (%) | Mean Air Vel. (m/s) | Mean WBGT (°C) | Mean SET (°C) | Mean UTCI (°C) | |
| Diurnal | |||||||||||
| Courtyard (SVF: 0.275) | Case Study 1—FBTS | 31.48 | 812.70 | 43.69 | 32.37 | 38.35 | 52.83 | 0.06 | 26.34 | 38.60 | 35.40 |
| U (SVF: 0.309) | 31.79 | 905.64 | 47.76 | 32.43 | 42.10 | 54.16 | 0.03 | 26.77 | 42.90 | 36.81 | |
| Courtyard canyon (SVF: 0.438) | 31.50 | 935.86 | 47.59 | 30.01 | 35.89 | 54.41 | 0.71 | 26.54 | 33.80 | 36.52 | |
| Canyon (SVF: 0.676) | 31.88 | 1204.90 | 56.16 | 31.96 | 39.04 | 56.31 | 0.57 | 27.15 | 37.70 | 31.22 | |
| Courtyard (SVF: 0.611) | Case Study 2—SM | 31.07 | 998.49 | 52.66 | 39.31 | 39.64 | 61.53 | 0.23 | 27.08 | 40.80 | 37.33 |
| U (SVF: 0.694) | 31.10 | 2077.23 | 51.86 | 38.66 | 38.14 | 61.41 | 0.38 | 27.09 | 38.20 | 37.35 | |
| Courtyard canyon (SVF: 0.707) | 31.57 | 3075.72 | 51.93 | 38.66 | 37.82 | 62.90 | 0.51 | 27.67 | 37.70 | 37.96 | |
| Canyon (SVF: 0.793) | 32.08 | 1005.82 | 51.19 | 38.20 | 37.35 | 63.76 | 0.69 | 28.18 | 36.90 | 38.57 | |
| Urban configurations/variables | Mean Air Temp. (°C) | Mean Solar Radiation (W/m2) | Mean Radiant Temp. (°C) | Mean Surf. Temp. (°C) | Mean Oper. Temp. (°C) | Mean RH (%) | Mean Air Vel. (m/s) | Mean WBGT (°C) | Mean SET (°C) | Mean UTCI (°C) | |
| Nocturnal | |||||||||||
| Courtyard (SVF: 0.275) | Case Study 1-FBTS | 31.21 | 483.06 | 23.41 | 30.66 | 27.31 | 41.33 | 0.10 | 24.53 | 26.80 | 29.01 |
| U (SVF: 0.309) | 31.01 | 483.99 | 23.50 | 30.80 | 26.92 | 44.16 | 0.07 | 24.78 | 26.60 | 29.08 | |
| Courtyard canyon (SVF: 0.438) | 31.05 | 453.67 | 21.06 | 25.93 | 27.87 | 42.76 | 0.46 | 24.61 | 25.20 | 28.36 | |
| Canyon (SVF: 0.676) | 30.56 | 452.78 | 21.08 | 25.78 | 27.67 | 47.36 | 0.52 | 24.83 | 25.00 | 28.28 | |
| Courtyard (SVF: 0.611) | Case Study 2-SM | 29.94 | 495.10 | 23.67 | 32.53 | 27.01 | 57.02 | 0.13 | 25.43 | 27.20 | 29.24 |
| U (SVF: 0.694) | 29.91 | 492.08 | 23.34 | 32.06 | 27.27 | 57.07 | 0.22 | 25.41 | 26.40 | 29.13 | |
| Courtyard canyon (SVF: 0.707) | 29.52 | 987.18 | 23.17 | 31.71 | 27.78 | 62.34 | 0.47 | 25.74 | 25.80 | 29.21 | |
| Canyon (SVF: 0.793) | 29.12 | 485.40 | 22.71 | 31.02 | 27.41 | 65.10 | 0.76 | 25.69 | 24.70 | 28.96 | |
| Urban Configurations/Variables | Mean Air Temp. (°C) | Mean Solar Radiation (W/m2) | Mean Radiant Temp. (°C) | Mean Surf. Temp. (°C) | Mean Oper. Temp. (°C) | Mean RH (%) | Mean air Vel. (m/s) | Mean WBGT (°C) | Mean SET (°C) | Mean UTCI (°C) | |
|---|---|---|---|---|---|---|---|---|---|---|---|
| Courtyard (SVF: 0.275) | Case Study 1—FBTS | 31.34 | 647.88 | 33.60 | 31.51 | 32.83 | 47.08 | 0.08 | 25.44 | 32.55 | 32.21 |
| U (SVF: 0.309) | 31.40 | 694.82 | 35.60 | 31.62 | 34.51 | 49.16 | 0.05 | 25.78 | 34.75 | 32.95 | |
| Courtyard canyon (SVF: 0.438) | 31.28 | 694.76 | 34.30 | 27.97 | 31.88 | 48.60 | 0.58 | 25.58 | 29.50 | 32.44 | |
| Canyon (SVF: 0.676) | 31.22 | 828.84 | 38.60 | 28.87 | 33.36 | 51.83 | 0.54 | 25.99 | 31.35 | 29.75 | |
| Courtyard (SVF: 0.611) | Case Study 2—SM | 30.50 | 746.79 | 38.16 | 35.92 | 33.33 | 59.27 | 0.18 | 26.23 | 34.00 | 33.29 |
| U (SVF: 0.694) | 30.50 | 1284.66 | 37.60 | 35.36 | 32.71 | 59.24 | 0.30 | 26.25 | 32.30 | 33.24 | |
| Courtyard canyon (SVF: 0.707) | 30.55 | 2031.45 | 37.55 | 35.18 | 32.80 | 62.62 | 0.49 | 26.71 | 31.75 | 33.59 | |
| Canyon (SVF: 0.793) | 30.60 | 745.61 | 36.95 | 34.61 | 32.38 | 64.43 | 0.72 | 26.94 | 30.80 | 33.77 | |
| Urban Configurations/Variables | Estimated dTmax = 15.3 − 13.9 (* SVF)—°C | Diurnal Temp. (°C) | Nocturnal Temp. (°C) | Difference between Diurnal and Nocturnal Temp. (°C) | Notes | |
|---|---|---|---|---|---|---|
| Courtyard (SVF: 0.275) | Case Study 1—FBTS | 11.5 | 31.5 | 31.2 | 0.3 | Previous research showed the smallest SVF compared to the current study. Furthermore, the smallest change between diurnal and nocturnal temperatures was observed |
| U (SVF: 0.309) | 11.0 | 31.8 | 31.0 | 0.8 | A decrease in the nocturnal temperature should be lower than the value obtained for the courtyard canyon, which has a larger SVF. The results were consistent with those of previous research | |
| Courtyard canyon (SVF: 0.438) | 9.2 | 31.5 | 31.1 | 0.5 | The diurnal and nocturnal temperatures were within the same range as the values obtained for the courtyard. The difference between the diurnal and nocturnal temperature was 0.2 °C higher than the value obtained for the courtyard. The findings were consistent with those of the previous model | |
| Canyon (SVF: 0.676) | 5.9 | 31.9 | 30.6 | 1.3 | In this model, the largest value of SVF was noted. Likewise, the largest difference between the diurnal and nocturnal temperatures was also predicted | |
| Courtyard (SVF: 0.611) | Case Study 2—SM | 6.8 | 31.1 | 29.9 | 1.2 | In this model, the smallest difference between the diurnal and nocturnal temperatures and the smallest SVF were noted |
| U (SVF: 0.694) | 5.6 | 31.1 | 29.9 | 1.2 | Similar results to those obtained in the courtyard model were obtained in this model, with a higher SVF. The results were consistent with previous research | |
| Courtyard canyon (SVF: 0.707) | 5.5 | 31.6 | 29.5 | 2.1 | An increase (from 1.2 to 2.1 °C) in the difference between the diurnal and nocturnal temperatures was noted when compared to the values noted in the courtyard and U models. The result was also consistent with the previous model analysed in this study | |
| Canyon (SVF: 0.793) | 4.3 | 32.1 | 29.1 | 3.0 | The model revealed the highest value for SVF. Likewise, the highest difference between the diurnal and nocturnal temperatures was also noted, as observed in the previous model | |
Publisher’s Note: MDPI stays neutral with regard to jurisdictional claims in published maps and institutional affiliations. |
© 2022 by the authors. Licensee MDPI, Basel, Switzerland. This article is an open access article distributed under the terms and conditions of the Creative Commons Attribution (CC BY) license (https://creativecommons.org/licenses/by/4.0/).
Share and Cite
Yola, L.; Adekunle, T.O.; Ayegbusi, O.G. The Impacts of Urban Configurations on Outdoor Thermal Perceptions: Case Studies of Flat Bandar Tasik Selatan and Surya Magna in Kuala Lumpur. Buildings 2022, 12, 1684. https://doi.org/10.3390/buildings12101684
Yola L, Adekunle TO, Ayegbusi OG. The Impacts of Urban Configurations on Outdoor Thermal Perceptions: Case Studies of Flat Bandar Tasik Selatan and Surya Magna in Kuala Lumpur. Buildings. 2022; 12(10):1684. https://doi.org/10.3390/buildings12101684
Chicago/Turabian StyleYola, Lin, Timothy O. Adekunle, and Olutobi G. Ayegbusi. 2022. "The Impacts of Urban Configurations on Outdoor Thermal Perceptions: Case Studies of Flat Bandar Tasik Selatan and Surya Magna in Kuala Lumpur" Buildings 12, no. 10: 1684. https://doi.org/10.3390/buildings12101684