Article

Coupled Effect of Granite Sand and Calcium Lignosulphonate on the Strength Behavior of Cohesive Soil

1
Department of Civil Engineering, National Institute of Technology Warangal, Warangal 506004, India
2
Department of Civil Engineering, Indian Institute of Technology, Hyderabad 502284, India
3
Department of Civil Engineering, College of Engineering, King Saud University, P.O. Box 800, Riyadh 11421, Saudi Arabia
*
Author to whom correspondence should be addressed.
Buildings 2022, 12(10), 1687; https://doi.org/10.3390/buildings12101687
Submission received: 30 September 2022 / Revised: 9 October 2022 / Accepted: 11 October 2022 / Published: 13 October 2022
(This article belongs to the Collection Utilization of Waste Materials in Building Engineering)

Abstract

:
This paper assesses the significance of stabilizing clay soil with calcium lignosulphonate (CLS) and granite sand (GS). Unconfined compressive strength ( q c ) and hydraulic conductivity (K) are taken as performance indicators and the effect of varying dosages of GS (30%, 40%, and 50%) and CLS (0.5%, 1%, 1.5%, and 2%) at different curing periods on q c and K are examined. The best fit regression equations have been proposed to relate q c and K of untreated clay soil and stabilized clay using GS and CLS. The proposed nonlinear regression equations provide details of experimental data and aid in estimating q c and K very efficiently and reliably for targeted geotechnical applications from a sustainable perspective.

1. Introduction and Background

The presence of poor soils leads to damage to the structures. Soil cannot be replaced in large volumes for construction purposes. Replacing these materials with high-performance materials requires earthwork and may affect stability, leveling, and excavation. To overcome this problem, treating the soils at the field level results in less manpower, less treatment area, and better results in the line of performance. Soil stabilization technology is a cost-effective way to improve poor soils [1]. It is categorized into two major techniques, mechanical stabilization, and chemical stabilization. Chemical stabilization works on variant chemical reactions where the chemical additive reacts with soil composition and minerals, enhancing engineering properties [2]. Conventional chemical additives, such as cement and lime, are the most used materials to enhance weak soils to improve their engineering properties, such as strength and compressibility, by changing the mineralogical structure. Taha et al. [3] used type 1 Portland cement along with reclaimed asphalt pavement (RAP) to improve the base layer of pavement. The thickness of the base layer is reduced by 50 mm when the cement is mixed with RAP. However, the presence of cement on the ground surface contributes to 0.2–0.3% of global CO2 emissions [2]. Sarkar et al. [4] worked on pond ash by adding lime to improve the California bearing ratio (CBR). The results were promising, leading to a decrease in the angle of internal friction. Though the mixing enhanced the engineering properties, the pH of the soil increased due to the solubility of soil minerals after lime stabilization [5]. The compounds formed from cement and lime stabilization create a threat to soil beds in terms of pH, brittleness, and occupational issues [6].
The above limitations encouraged the research and development leading to bio-inspired materials, fibers, pozzolanic materials, and industrial byproducts such as microbially induced calcite precipitation (MICP), biopolymer, geopolymer, calcium carbide residue (CCR), fly ash, coal gangue, and granite dust [7,8,9,10,11,12,13,14,15,16]. Silty clay is stabilized using CCR and fly ash to examine the soil’s durability [10]. Moghal et al. [14,15,16,17,18] worked on semiarid soil treated with lime in the presence of polypropylene fibers. The soil was tested for UCS, hydraulic conductivity, and resilient modulus to determine the influence of the tensile elements that are in the form of fiber cast and fiber mesh. The rate of gain in strength is remarkable with an increase in curing periods. Arulrajah [9] improved construction and demolition wastes by taking ground granulated blast furnace slag (GGBS) and fly ash (FA) as geopolymer materials, and recycled crushed aggregate and reclaimed asphalt as pavement materials. The geopolymer, stabilized recycled aggregate, and reclaimed asphalt pavement were examined for their efficacy as base/subbase material in terms of strength, ductility, and resilient modulus. This work is limited to a decrease in ductility due to the presence of slag. Rong et al. [7] worked on loose fine-grained particles to induce cementation with the help of bacteria under controlled conditions. Despite the successful work, this MICP technique is not very effective in the case of stiff clays. Biopolymer-treated soils show high strength with good particle–particle bonds and variant effects on the angle of internal friction depending on the type and dosage of biopolymer. Though it is a zero-carbon-emitting material, it is hydrophilic in nature, capable of swelling but also improving shrinkage [2,8]. Simatupang et al. [11] stabilized sand with fly ash to improve its strength and stiffness. The stabilization was achieved on coarse and fine sand. The dosage ranged from 5–30% and curing periods of 0, 7, 14, 28, and 56 days. This work concluded that the fine fraction of sand had a negative effect on fly ash stabilization. Ashfaq and Moghal [12] examined the behavior of expansive soil by adding lime and coal gangue. It was observed that the presence of coal gangue alone increased the CBR of the soil from 4–23% but in the presence of lime, the binary blended soil improved to 100%. The soil underwent mechanical stabilization with coal gangue, and the addition of chemicals imparts bonding [19,20]. Nwaiwu et al. [13] studied the effect of change in compaction effort on the CBR of quarry dust-stabilized black cotton soil. The quarry dust was added in dosages of 20–60% to examine the response of the soil. The CBR yielded a high value for BS heavyweight compaction that had the highest compaction effort. Kufre Etim et al. [21] examined the variation in strength and CBR characteristics of cement-modified lateritic soil in the presence of quarry dust with dosages of 0–8% and 0–10%, respectively. Their study reported that modified lateritic soil satisfied the strength requirements for 6% cement and 8% quarry dust. Emeka et al. [22] stabilized erodible soil with cement and quarry dust where quarry dust was added to reduce the brittleness. The deformation behavior of the stabilized soil is determined by finite element analysis upon the application of load.
Though the above materials have good efficiency in improving soil properties, they have their own set of drawbacks, which leave ample scope for research in the area. Lignin-based compounds are one of the non-cementitious materials that improve strength, ductility, and cohesion along with zero CO2 emission and low pH value. Lignosulphonates are lignin-based compounds derived as an industrial byproduct from the wood and paper processing industry. Around 15 to 40% of the dry weight of wood is occupied by lignin. It is the third most abundant fraction of plants apart from cellulose and hemicellulose. CLS is obtained from the sulfite pulping process in the wood industry. This product has molecular weight ranges from 40,000 to 65,000. The sulphonate groups are attached to the alkane units to confer water solubility. The calcium content is set to a maximum of 5% [23]. CLS is used to stabilize soils ranging from cohesive to non-cohesive [24].
Chavali and Reshmarani [25] studied the characterization of two expansive soils collected from Amaravathi and Vijayawada regions of Andhra Pradesh, India. Their study revealed that at higher percentages of CLS, the clay particles were aggregated along with the polymer chain. The optimum amount of CLS required to treat and to observe the improvement after the treatment is based on the fine fractions present in the base soil. Li et al. [26] evaluated the effect of lignosulphonate on silty soil and concluded that the strength improvement and durability criteria were satisfied at a lower dosage of calcium lignosulphonate. Dajiang et al. [27] worked on expansive sensitive soil mixed with calcium lignosulphonate. They stated that the cation ion exchange between the calcium ions and the monovalent ions in the soil minerals decreased the diffused double layer. Zhang et al. [28] conducted a comparative study on lignin-stabilized silty sand, and quick lime-stabilized silty sand with a dosage range of 2–12%. This study stated that the engineering performance of the lignin-based silty sand at 12% dosage is higher than that of quicklime-based silty sand at 8%. Alazigha et al. [29] conducted a comparative study on expansive soil treated with CLS and cement. They observed that there was no significant difference in the unconfined compressive strength of the soil at 2% CLS and 2% cement. However, the addition of CLS increased the ductile behavior and decreased the pH of the soil, unlike its effect on cement.
This paper aims to assess the strength and permeability performance of GS mixed clay in the presence of CLS at varying dosages of each. The clay–GS and clay–GS–CLS mixes were evaluated for q c and k in the current study.

2. Materials and Methodology

2.1. Clay

Soil was obtained from Bhattupally lake at Darga Road, Hanumkonda region of Telangana in India. The soil was collected at a depth of 3 ft from the ground level. The geographical coordinates are 17.9737° N 79.5352° E. The soil chosen was tested for its physical, chemical, and index properties. The chemical composition was explored using the EDS technique and the results are shown in Table 1. The soil is classified as an intermediate plastic clay as per the Unified Soil Classification System according to ASTM D2487 [30]. Figure 1 displays the fabric texture of clay obtained from a scanning electron microscope. The surface of untreated clay is flaky with many voids.

2.2. Mechanical Stabilizer (GS)

GS is a byproduct obtained from the primary crushing stage of aggregates. It is a non-plastic material that is deposited in large quantities near quarry sites. In the present study, GS was sourced from a quarry industry in the Gudipadu region of Telangana State, India (18.83793° N and 79.424954° E). The characterization and chemical composition of GS are provided in Table 2. GS is classified as poorly graded sand (SP) as per the Unified Soil system according to ASTM D2487 [30]. The texture of GS is granular, irregular, and angular as seen from the scanning electron micrograph in Figure 2.

2.3. Chemical Stabilizer (CLS)

CLS was purchased from the local dealer Aditya Chemicals, Hanamkonda region of Warangal, Telangana. The chemical formula of CLS is C20H24CaO10S2 and it comprises both hydrophilic and hydrophobic groups. CLS is a non-toxic, non-corrosive, non-alkaline material and does not produce harmful compounds following chemical reactions [31]. The physicochemical properties of the CLS used in the study are provided in Table 3.

2.4. Atterberg Limits and Differential Free Swell (DFS)

GS is mixed with clay in replacements of 30%, 40%, and 50% dosages of the total mass of the soil measured according to ASTM D4318-17el [32] and IS 2720 part 40 [33] standards, respectively. The addition of GS beyond 50% suppresses the effect of virgin soil and required plasticity [13].

2.5. UCS

2.5.1. Sampling with GS

Samples for the UCS test (38 mm diameter and 76 mm length) were prepared by mixing clay with varying dosages of GS at maximum dry density (MDD) and the optimum moisture content (OMC) of clay was obtained from the standard Proctor test according to ASTM D698-12e2 [34]. Each sample was prepared by replacing the clay with 30%, 40%, and 50% dosage of GS to obtain the total measured mass of the soil calculated from the MDD. The mix was compacted in layers, and each layer was scarified to a depth of 3 mm for proper interaction between the layers. The extracted specimens were tested on the compression device and sheared at a strain rate of 0.06 mm/min as per ASTM D2166M-13 [35] using AIMIL, New Delhi, India, AIM 074-1. A minimum of three specimens were tested for repeatability and reproducibility.

2.5.2. Sampling with GS and CLS

Samples were prepared by mixing clay with varying dosages of GS, and to each clay–GS mix was added a 0.5%, 1%, 1.5%, and 2% dosage of CLS based on previous works [24,25,26,27,28,29]. The quantity of CLS is the weighted percentage of clay–GS mix, which is added to the measured water content. The aliquot is mixed thoroughly with the dry soil and the mixture is allowed to mellow for a period of 24 h [29]. However, the mellowing period differs with the dosage of clay content. These samples were prepared using a similar procedure and allowed to cure for 0, 7, 14, 28, and 90 days in double-sealed plastic bags. Three specimens are molded for each curing period to ensure the repeatability and reproducibility of test results. The samples are tested for their weight before testing for any loss in moisture content. The samples were rejected if the change in weight following a specific curing period was found to be greater than 5%.

2.5.3. Pre-Compaction Mellowing Technique

The mixed soil was allowed to mellow (at constant water content) for a period of 24 h or more before the mix was compacted. Dry soil was mixed with an aliquot and placed in a sealed bag to maintain humidity (relative humidity > 90%). This pre-compaction mellowing time allows the soil additive interaction, which creates additional voids that contribute to efficient compaction and increase the strength [36].

2.6. Hydraulic Conductivity (K)

2.6.1. Sampling with GS

The samples were prepared along similar lines to UCS, but with a constant volume (10 cm diameter and 12.5 cm height) of falling head permeameter supplied by AIMIL, New Delhi, India, AIM 131, in accordance with ASTM D5856-15 [37]. Each sample was adequately compacted to acquire a constant density (contribution of total measured mass) and was placed between two filter papers. These two individual filter papers were overtopped with porous stones on either side of the sample. The sample was fully saturated prior to the commencement of the test.

2.6.2. Sampling with GS and CLS

Samples were mixed for all dosages of GS and CLS as explained in the case of UCS. Each sample was mellowed for a period of 24 h in an airtight bag. The mellowed sample was subjected to the saturated condition and tested for conductivity. The binary blended clay samples were compacted in layers to attain the specified density (acquired 36 mm diameter and 76 mm length) and cured for 7 days and 28 days. Curing was achieved by placing the rubber cork into the standard tubes and leaving it undisturbed throughout the period.

3. Results and Discussions

3.1. Variation in Atterberg Limits and DFS

The effect of clay–GS mixes on consistency limits and DFS was explored. Table 4 shows the response to the tests. The liquid limit, plastic limit, plasticity index, and DFS of the mix is decreased with an increase in dosage of GS, which was due to a decrease in shearing resistance with an increase in coarse fraction [38]. Soosan et al. [39] stabilized red earth and kaolinite clay with quarry dust and observed a minimum rate of improvement in the Atterberg limits. This was due to the modified particle size distribution. Besides this, the shrinkage limit of the clay–GS mix is increased with the addition of GS, which is due to the decrease in clay fraction [40]. In contrast to the existing result, Nayak and Sarvade [41] worked on lithomargic clay where the shrinkage limit is reduced when it is stabilized with quarry dust.

3.2. Response of UCS

3.2.1. In the Presence of GS

The response of the UCS test performed on clay–GS mixes is depicted in Table 5. The q c of the mechanically stabilized samples is decreased with an increase in the dosage of GS. But there was a slight increase i.e., 27% at the initial dosage of GS which may be due to the addition of inert material at a lower dosage. Since there is a cumulative increment of GS beyond 30%, a notable decrease in strength is also observed. The presence of GS improves the matrix’s coarser fraction, which is less susceptible to the UCS and may also lead to bond breakage [42]. Despite the significant decrease in liquid limit and plasticity index as shown in Table 4, the strength of the GS-stabilized soil failed to resist the uniaxial compressive load due to the low level of densification. Priyankara et al. [43] stabilized the high plastic silt using quarry dust and observed a significant improvement in the shear strength of the stabilized soil. On the other hand, Oyediran and Idowu [42] treated a set of residual soils with quarry dust and observed an uncommon response in UCS in all the cases. However, there was a significant increase in strength at 10% and 20% quarry dust addition for all treated residual soils.

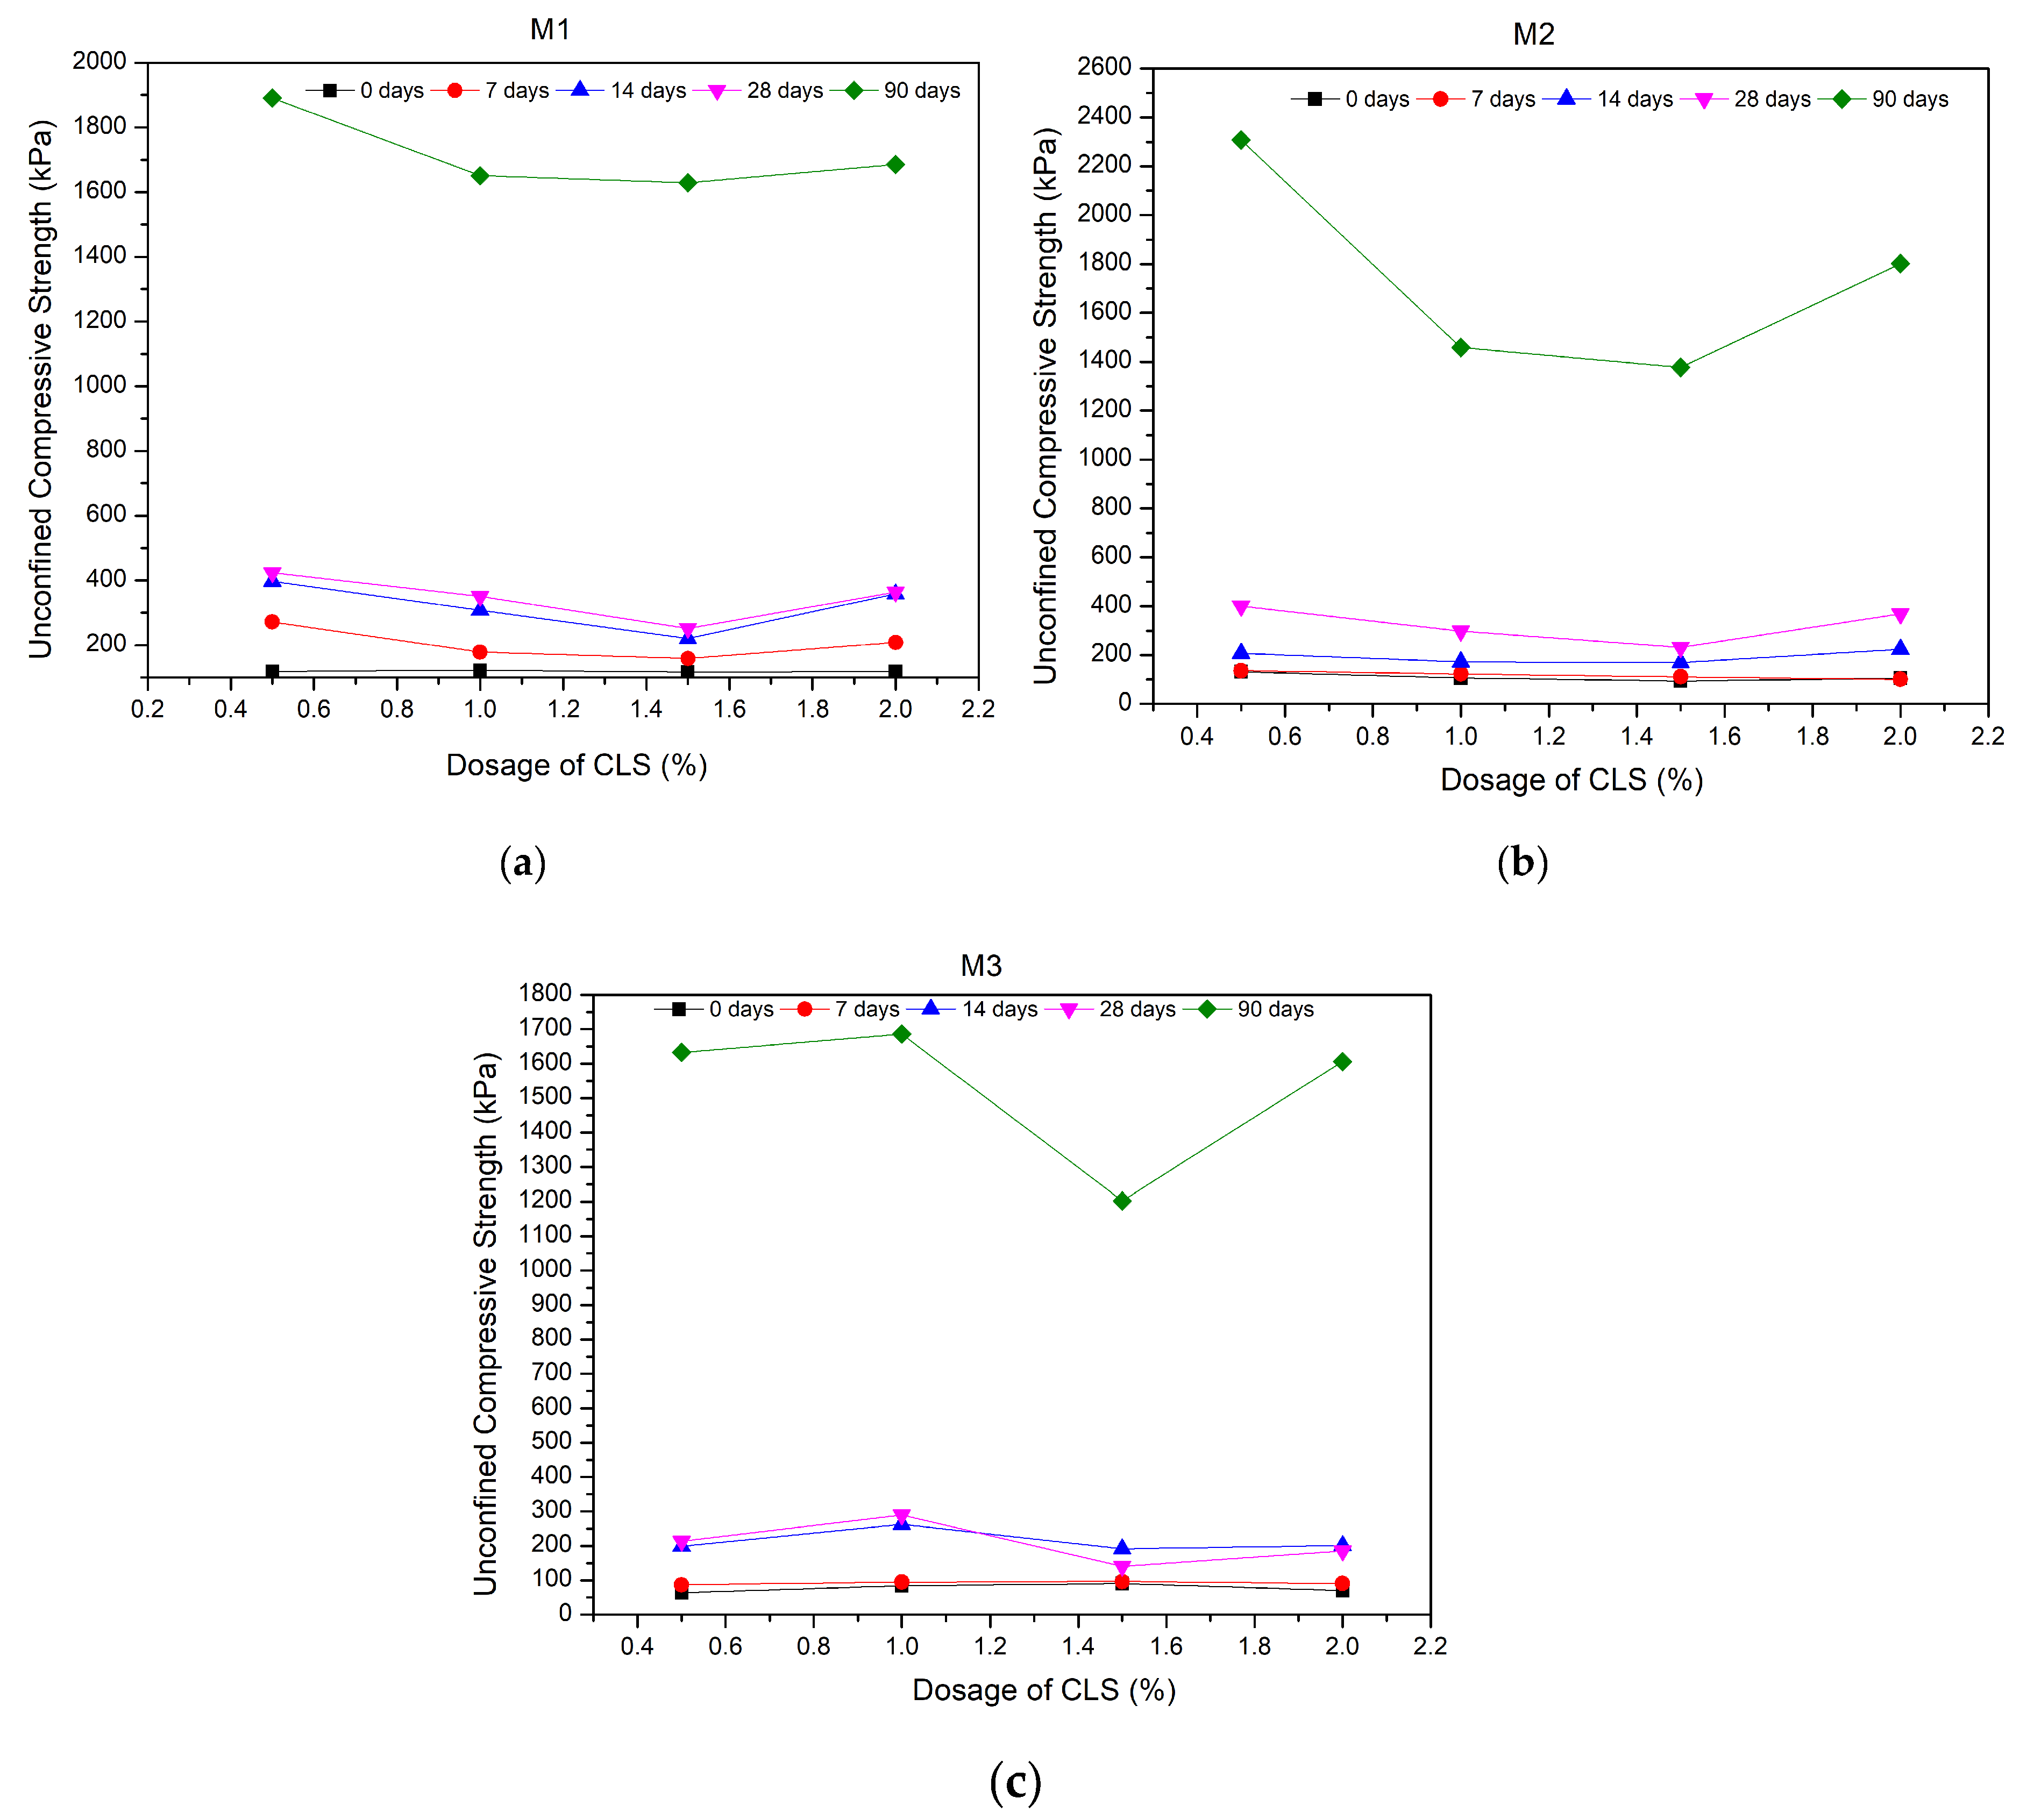
3.2.2. In the Presence of GS and CLS

UCS tests were performed on clay–GS–CLS mixes at different curing periods of 0, 7, 14, 28, and 90 days. Figure 3 shows the behavior of q c for all combinations of clay–GS–CLS mix. For all GS dosages, 0.5% CLS yields a higher q c   than other CLS dosages. But, at 2% CLS there is a slight increase in the strength prominently for 28 days and 90 days of curing for all dosages of GS. Besides this, M1 (Figure 3a) gains relatively higher strength when compared to M2 (Figure 3b) and M3 (Figure 3c) at all dosages of CLS.
In addition, the q c of the clay–GS–CLS mixes is decreased with an increase in the dosage of GS which is ascribed to the decrease in basal bonding and increase in the peripheral bonding, as depicted in Figure 4 and Figure 5. An increase in the dosage of GS decreases the clay fraction, which in turn reduces the fraction of expansive minerals, and hence the basal bonding is decreased [44]. Peripheral bonding is accompanied by expansive minerals, predominant in the higher dosages of GS, which is weaker than the basal bond as seen in Figure 5. The strength of the binary blended soil is greater at the initial dosages of CLS i.e., M1, M2, and M3 mixed with 0.5% CLS. With an increase in the dosage of CLS, the strength of the mix decreased. At constant water content, an increase in the dosage of CLS replaces the soil with finer lignosulphonate in spite of the electrostatic interaction [40]. At 2% CLS, for all clay–GS mixes, a slight development in strength is observed due to the floc formation [29]. The strength of the stabilized soil is increased with an increase in the curing period, which is attributed to the adsorption of CLS on clay particles. Adsorption of CLS neutralizes the negative charges on the surface of clay particles and forms a polymer chain by hydrogen bond and covalent bond, which further agglomerates the particles, as described in Figure 4 and Figure 5 [31,45]. Relevant to the current work, an improvement in UCS is observed in the work of Mudgal et al. [46], where black cotton soil was treated with lime and stone dust. The ettringite formed out of lime assists in reaching higher strengths according to the field requirement.
The treated soils were subjected to a gradual compressive load that fails by producing a distant failure pattern [47]. Figure 6 describes the different failure patterns of the binary blended clay at varying dosages of GS. Samples mixed with 30% GS failed under lateral bulging. For 40% GS, the sample failed by producing a small network-type pattern along the vertical axis. For 50% GS, the samples make visible network type patterns due to comparatively higher coarser fractions’ presence.

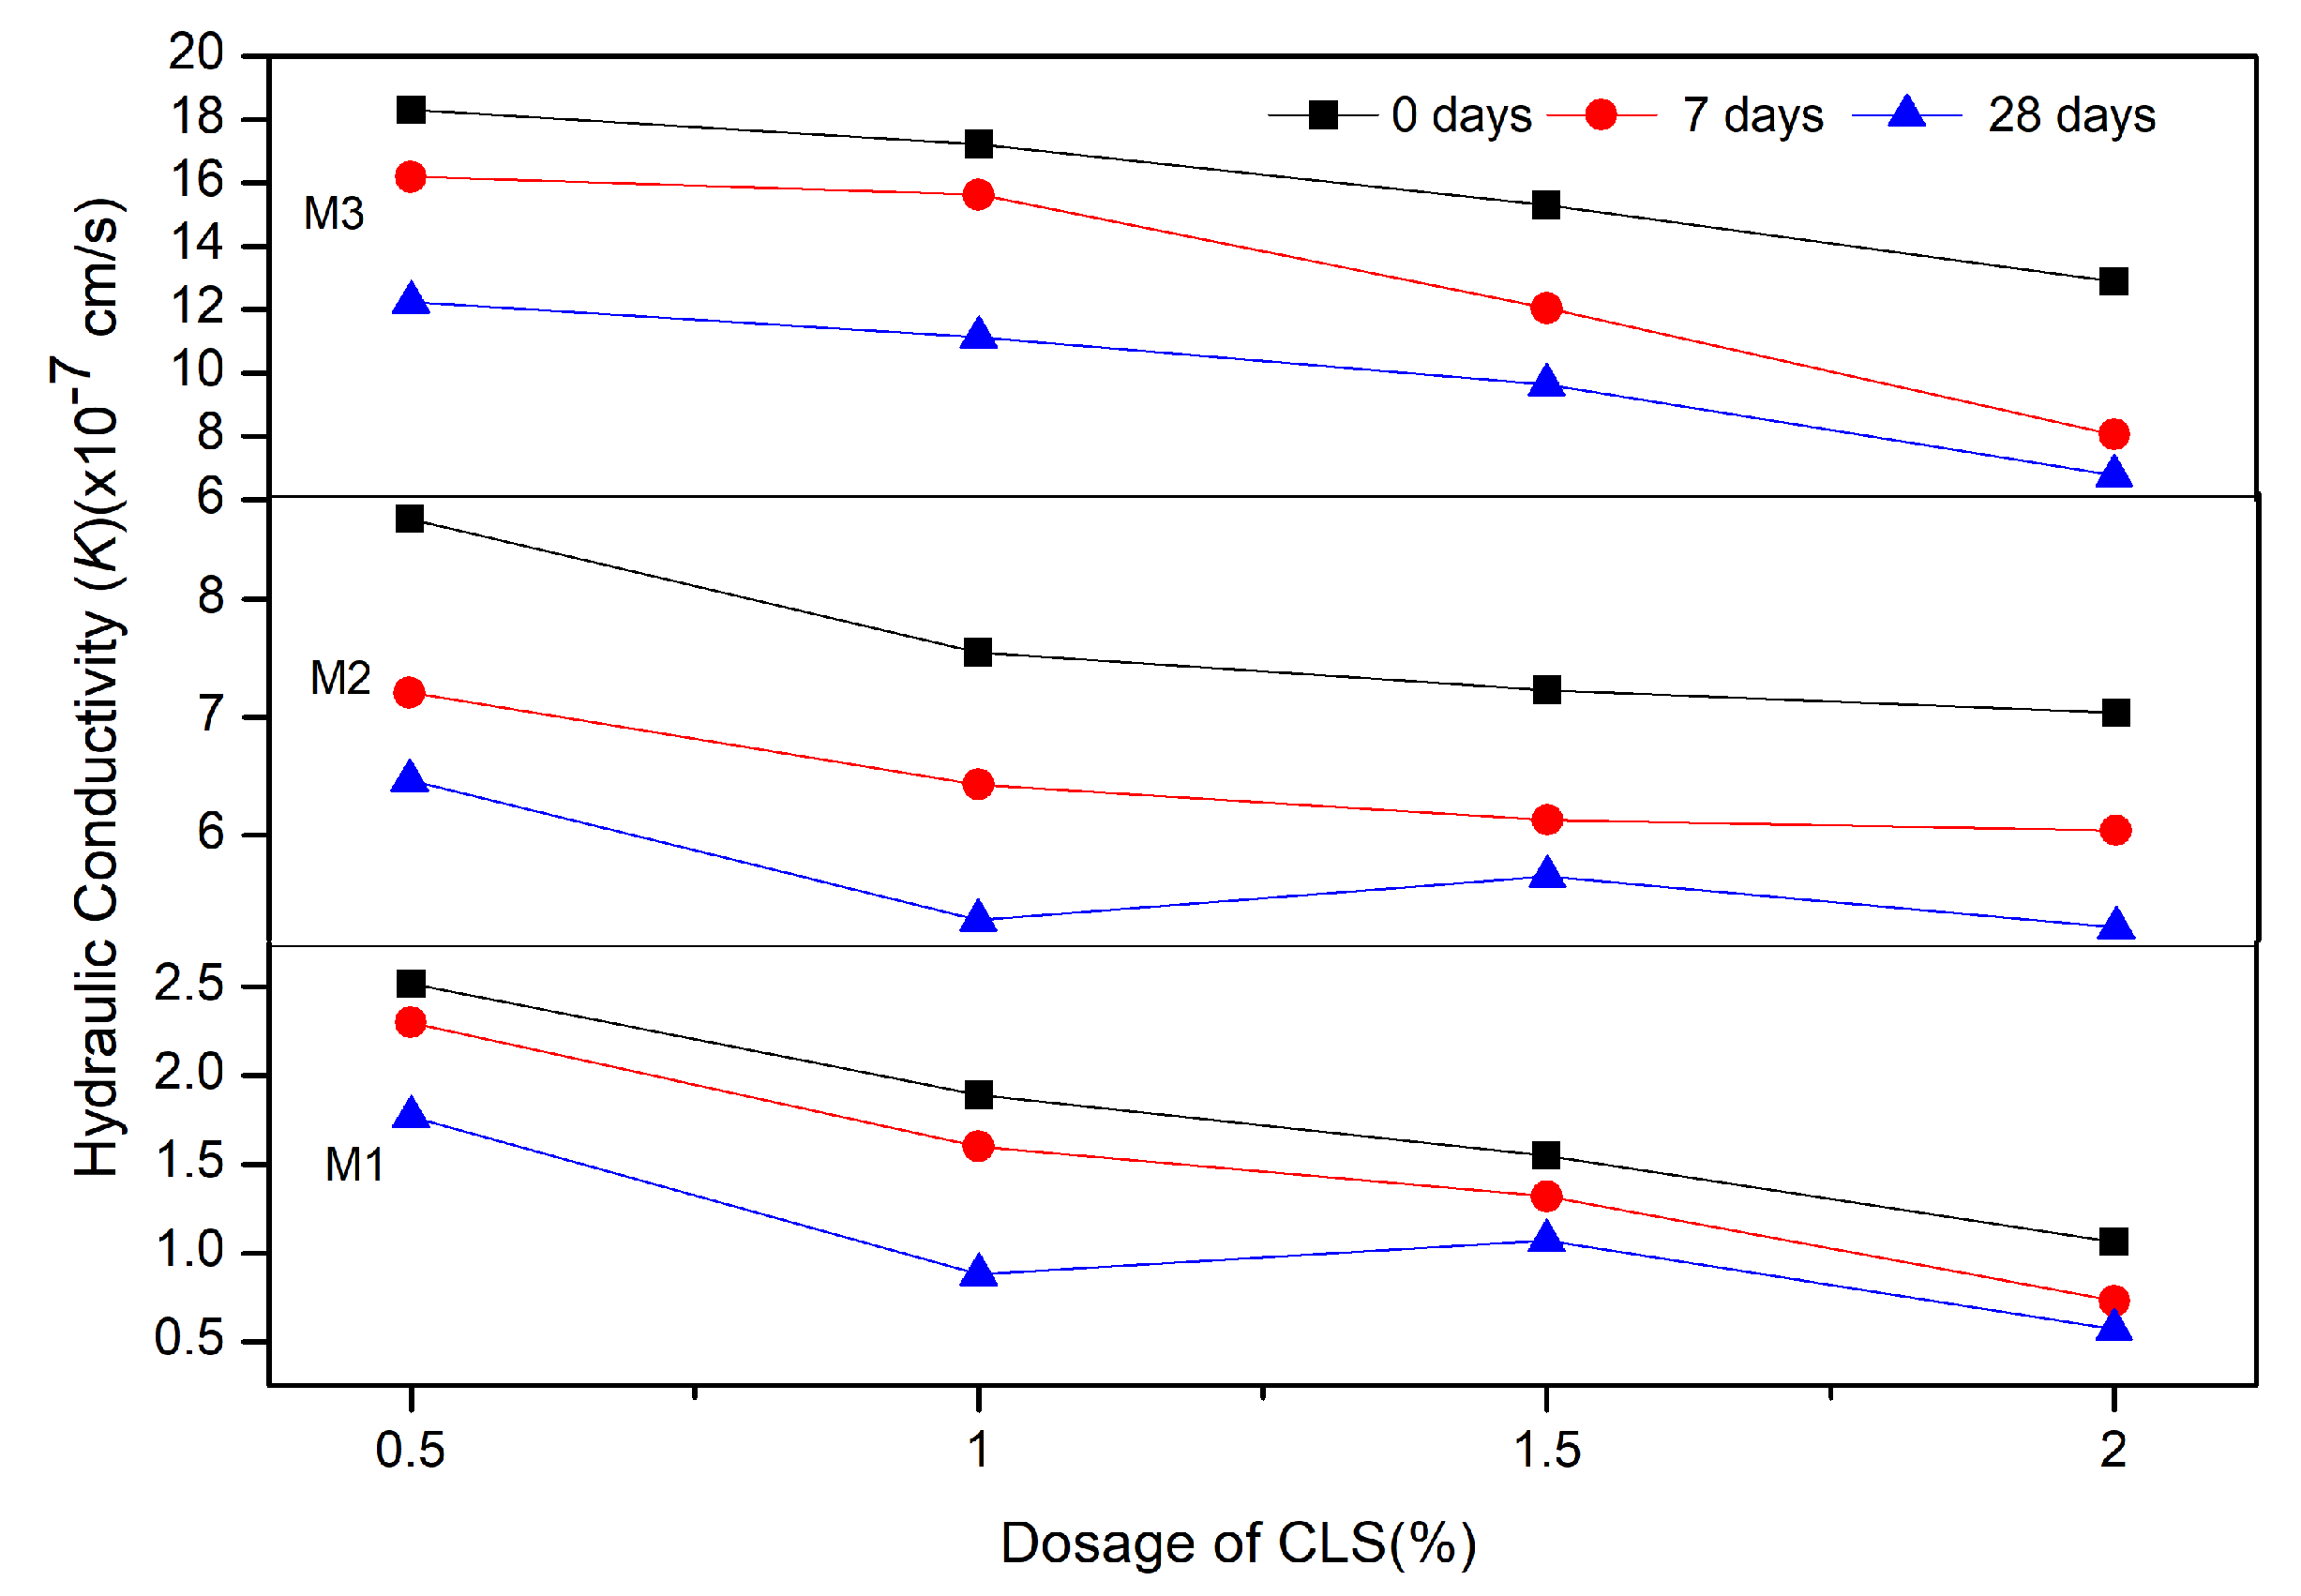
3.3. Response of Hydraulic Conductivity (K)

3.3.1. In the Presence of GS

Series of hydraulic conductivity tests were performed on clay–GS mixes to know the rate of flow of water through the stabilized matrix. With an increase in dosage of GS, K values were found to increase due to the changes in the soil–GS microstructure and the gradation [41,48,49]. Table 5 shows the response of mechanically stabilized clay on K.

3.3.2. In the Presence of GS and CLS

The hydraulic conductivity differs from the chemistry of infusing fluid [29]. The effect of CLS on varying clay–GS–CLS mixes is presented in Figure 7. The permeability of clay–GS–CLS mixes decreases with an increase in the dosage of CLS and the curing period. Simultaneously, an increase in the dosage of GS increases the conductivity. GS changes the particle distribution of the matrix, whereas CLS changes the soil structure [29,49,50]. With an increase in the curing period, the conductivity of binary blended clay is decreased as the CLS makes the matrix less compressible upon curing by binding the soil particles with a polymer chain, as depicted in Figure 4 and Figure 5. The aliquot fills the voids in the clay–GS matrix with the elapse of time by holding the clay–GS particles together with the polymer chain [27]. Similar work was performed by Nayak and Sarvade [41] where the permeability behavior of cement and quarry dust added to lithomargic clay was examined. The permeability of the treated soil was improved by 81% due to the 10% cement and 50% quarry dust. This work revealed that 30% GS and 0.5% CLS improve the permeability by 15 times, which is comparable to the calcium-based stabilizers wherein calcium salts of chloride, hydroxide, and carbonate are employed [51,52,53]; and non-calcium-based stabilizers involving biopolymers etc. [54,55].

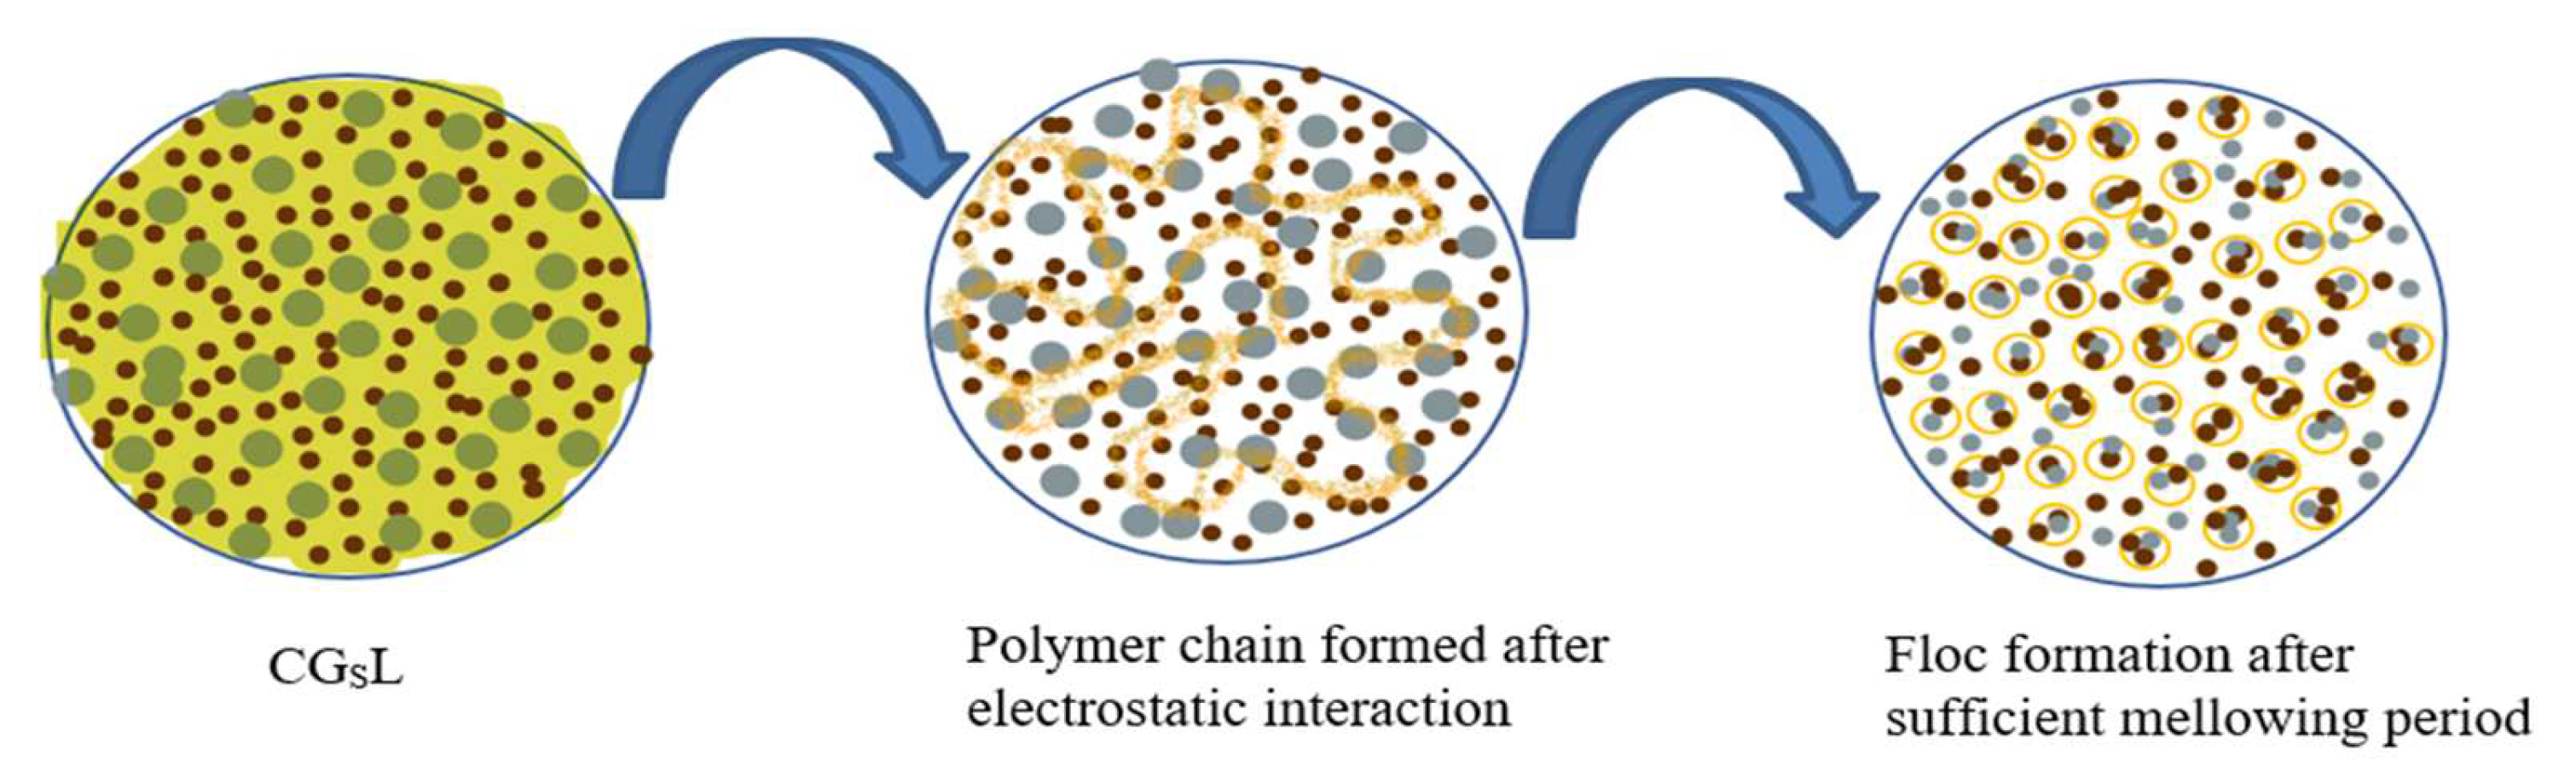
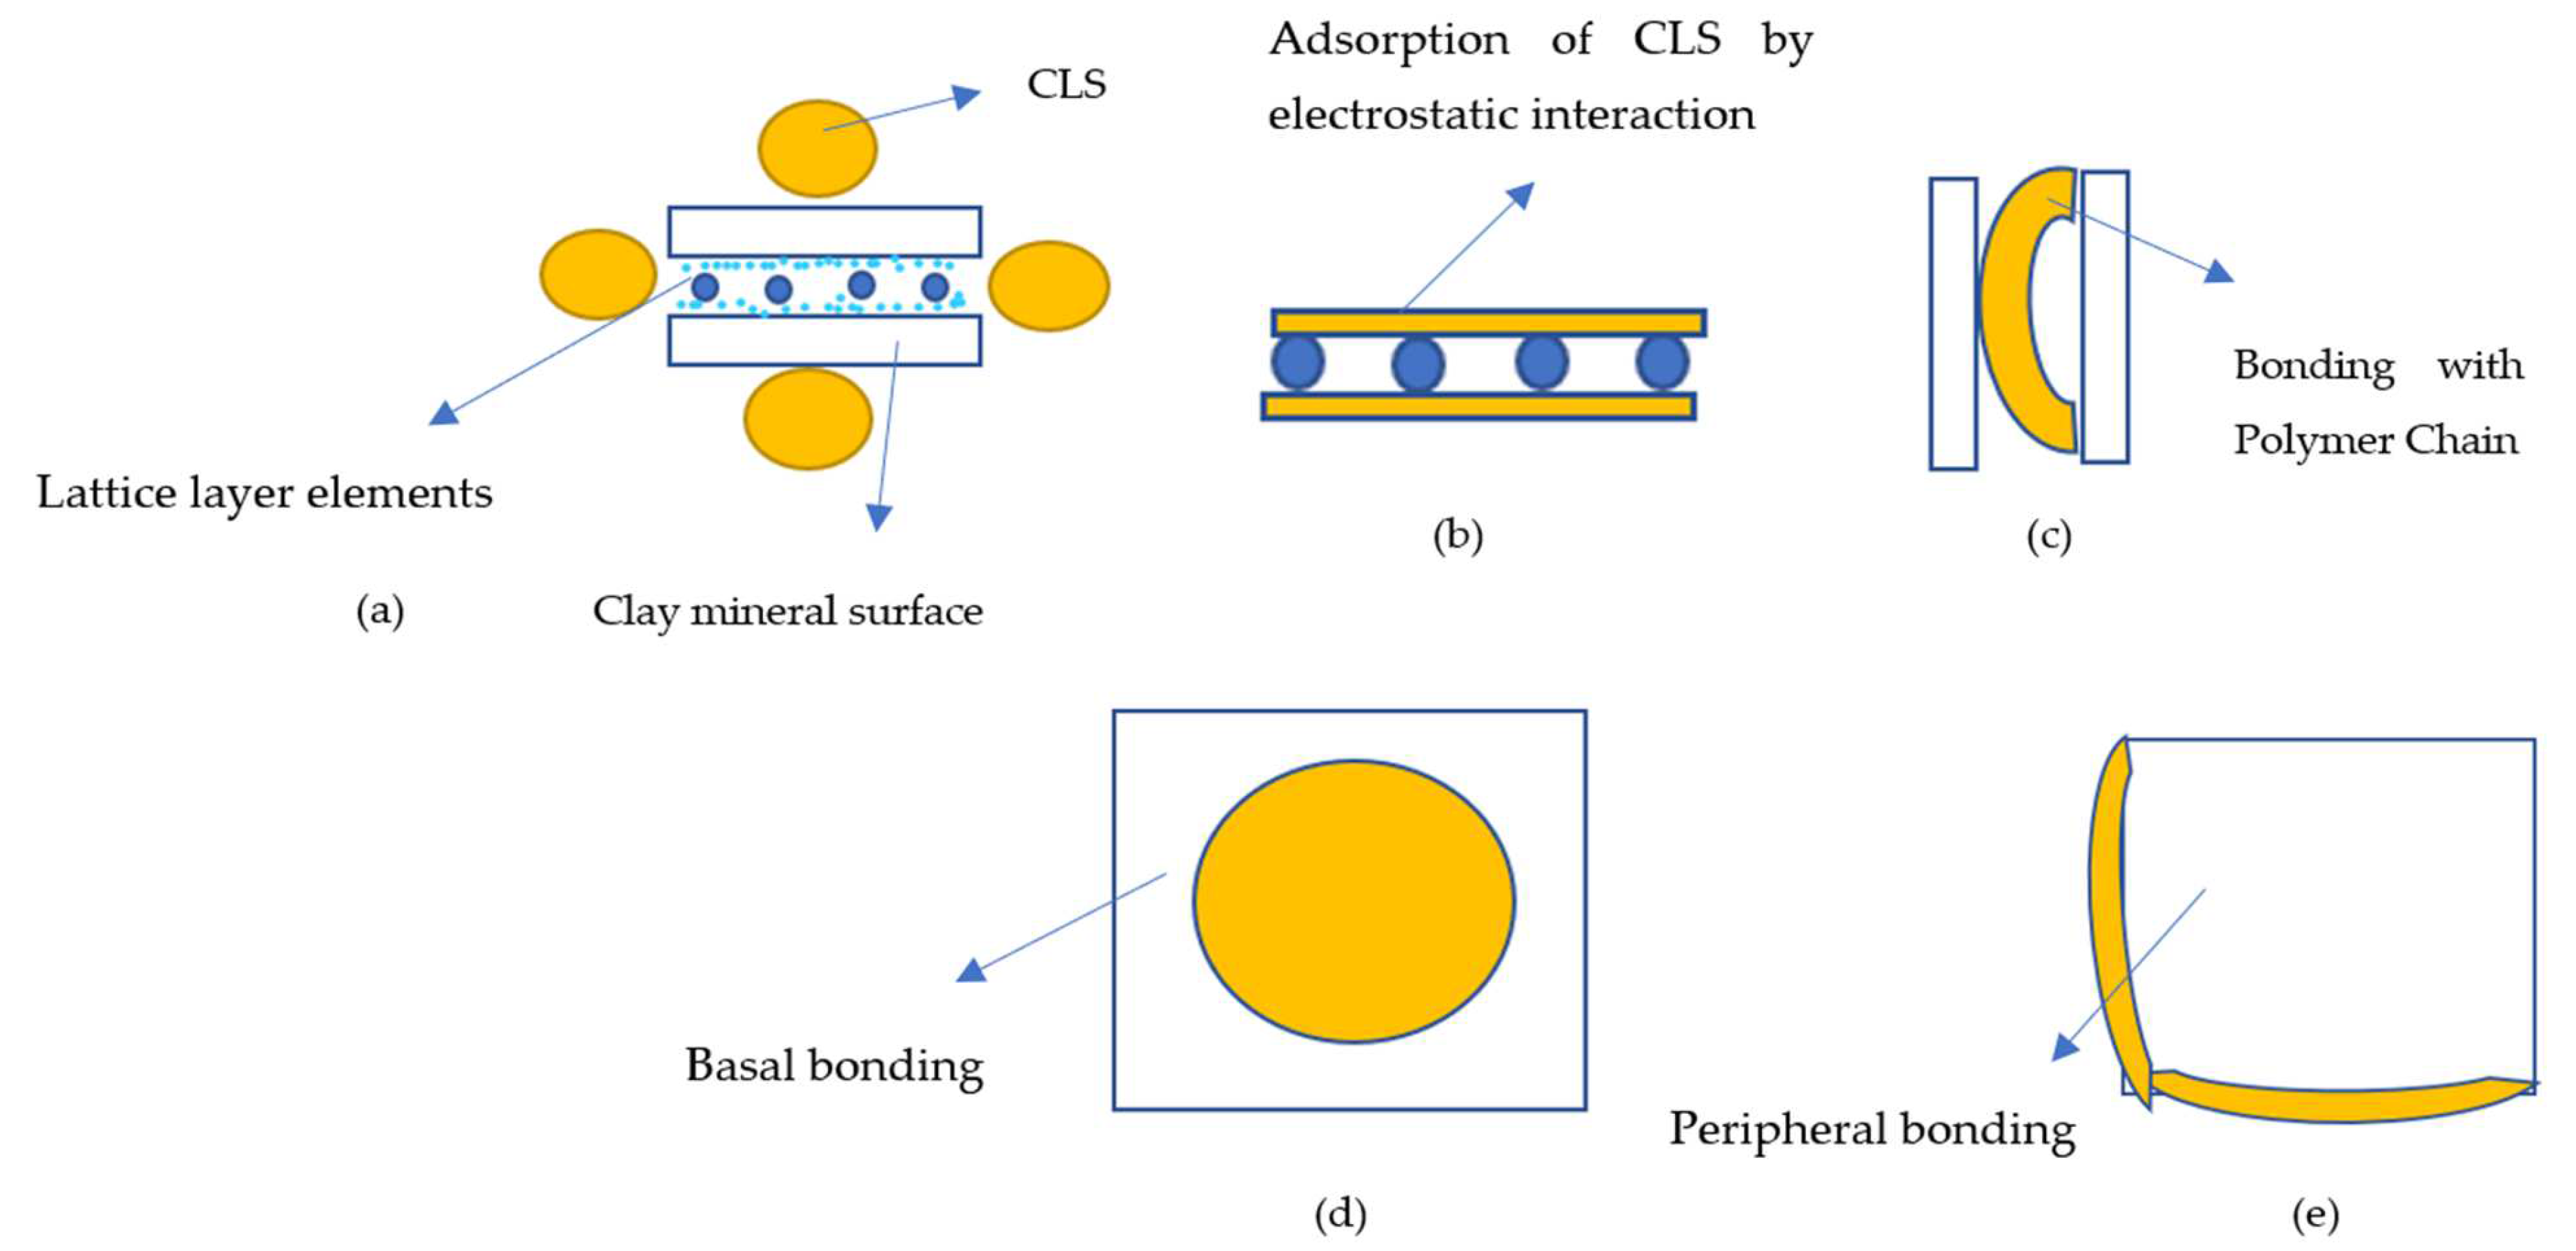
4. Critical Inference behind the Existing Mechanism

The hydrophilic compound CLS adsorbs the lattice elements of the clay mineral surface by electrostatic interaction (hydrogen bond, covalent bond, and cation exchange). CLS adsorbs on the mineral lattice elements and forms a polymer chain that binds the clay particles together and further agglomerates, as shown in Figure 4 and Figure 5 [29,31,36]. This phenomenon makes the virgin soil enhance less when added to the CLS compared to the working mechanism of the traditional stabilizers (lime, cement, and pozzolanic). These undergo a strong exothermic chemical reaction by forming calcium–silica compounds, which in turn increase the engineering properties of virgin soil. However, in both cases the microstructure of the treated soil changes to resist compressive loads [3,5].

5. Regression Analysis of the Experimental Data

Besides practical study, the statistical approach discloses the relationship between independent variables and dependent variables, and the influence of independent variables over dependent variables. From the practical data, empirical equations are established for dependent variables using simple regression methods, and the accuracy is tested by the R2 method [56]. In the present study, the dosage of GS, CLS, and curing time contribute to the independent variables, while the UCS and hydraulic conductivity are considered as dependent variables. The effects of dosages of GS and CLS on unconfined compressive strength ( q c ) and hydraulic conductivity (K) values of treated clay soil were expressed using nonlinear regression equations. Regression analysis was performed based on the experimental data measured after 7-, 14-, 28-, and 90-day curing periods (CP). The unconfined compressive strength ( q c ) and hydraulic conductivity (K) values obtained from laboratory tests are better represented by nonlinear equations than the linear models [8,14,15,16,19]. These nonlinear regression equations produce relatively good estimates of q c and K with 24 data points. The following forms of nonlinear equations were adopted for regression analysis of stabilized clay:
q c _ f i t = exp a × D G S + b × D C L S + c × C P + d
K f i t = exp a 1 × D G S + b 1 × D C L S + c 1 × C P + d 1
where, a, b, c, d, a1, b1, c1, and d1 are regression coefficients and D G S and D C L S are dosages of granite sand (GS) and calcium lignosulphonate (CLS), respectively. The following equations are proposed for unconfined compressive strength ( q c ) and hydraulic conductivity (K) of treated clayey soil:
q c _ f i t kPa = exp 0 . 00648 × D G S 0 . 12232 × D C L S + 0 . 02740 × C P + 5 . 35614   with   R 2 = 0.96  
K f i t cm / s = exp 0 . 08311 × D G S 0 . 34480 × D C L S 0 . 011863 × C P 1 . 08333 × 10 7   with   R 2 = 0.95
Similarly, the following equations are proposed for unconfined compressive strength ( q c ) and hydraulic conductivity (K) of untreated clay:
q c _ f i t kPa = 4 . 07401 × 10 - 5 × C P 3 - 6 . 79667 × 10 - 3 × C P 2 + 0 . 421004 × C P + 105 . 062   with   R 2 = 0.99
K f i t cm / s =   0.1602 × ( 1 + C P ) - 0.34 × 10 7   with   R 2 = 0.99
Table 6, Table 7, Table 8, Table 9 and Table 10 provide details of the regression analysis. Table 6 shows the regression analysis for the UCS ( q c _ f i t ) of untreated clay measured after 0, 7, 14, 28, and 90 days of curing. Table 9 depicts the regression analysis for the hydraulic conductivity ( K f i t ) of untreated clay measured after 0, 7, and 28 days of curing. Additionally, Table 7 and Table 8 show the details of the regression analysis for the UCS ( q c _ f i t ) of treated soil with granite sand (GS) and calcium lignosulphonate (CLS) measured after 7 and 14 days of curing. Further, Table 10 shows the details of the regression analysis for the hydraulic conductivity ( K f i t ) of treated soil with GS and CLS measured after 7 and 28 days of curing.
The coefficient of determination (R2) value of each equation is shown in Equations (3)–(6). The regression Equations (3)–(6) presented for q c _ f i t and K f i t have relatively good fit to the experimental data measured for correlating the unconfined compressive strength ( q c ) and hydraulic conductivity (K). This important observation can also be made from Table 6, Table 7, Table 8, Table 9 and Table 10. Therefore, the unconfined compressive strength ( q c ) and hydraulic conductivity (K) can be predicted with an acceptable accuracy with the proposed nonlinear equations as the R2 value is greater than 0.95 when expansive clays are treated with GS and CLS.

6. Summary and Conclusions

In the present study, the effect of varying the dosages of CLS on GS-stabilized clay at different replacements is examined. A good performing mix was determined from the UCS of clay–GS mix and clay–GS–CLS mix at different curing periods of 7, 14, 28, and 90 days. The hydraulic conductivity of the clay-GS mix and clay–GS–CLS mixes were computed after a 7- and 28-day curing period. The following are the important observations emerging from the study:
  • The UCS of the clay–GS matrix is dependent on the dosage of GS. The presence of GS changes the particle size distribution of the matrix, which improves density by filling the voids, decreases cohesion due to increased silt fraction, and increases the shearing resistance.
  • At constant water content and uniform density, an increase in dosage of GS from 30–50% reduces the UCS by 36% for 40%, 56% for 50% replacement, and a slight increase of 27% is found after the initial dosage i.e., at 30%.
  • The combined effect of GS and CLS on clay improved the UCS performance. As the curing period increases, the strength of the clay–GS–CLS mix increases at a slow rate. The maximum strength achieved after 28 days of curing is 423.8 kPa for M1L0.5 and after 90 days of curing, it is 2.3 MPa for M2 with 0.5% CLS. Moreover, the response of UCS is more significant for the initial dosage of CLS, i.e., 0.5% for all the GS replacements. The UCS yielded lower values for 1–1.5% even with the elapse of time, and increased slightly for 2%.
  • A total of 50% GS in clay–GS mixes enhances the permeability by 30 times. For clay–GS–CLS mixes, the permeability decreases with an increased dosage of CLS and curing period. An average decrement of 30% is observed for the clay–GS–CLS mix when cured for 28 days.
  • The proposed nonlinear regression equations correlating dosages of granite sand (GS) and calcium lignosulphonate (CLS) and curing period (CP) to unconfined compressive strength ( q c ) and hydraulic conductivity (K) may be used to obtain the amounts of GS and CLS for the satisfactory performance of subgrade, subbase, and base layers of low volume roads in terms of compressive strength and permeability.
The presence of inferior soil hinders rapid urbanization. When such soils are encountered, sustainable stabilization techniques must be relied upon to enhance their geotechnical properties. The present study has disclosed that the usage of sustainable binders, such as GS and CLS, stabilizes cohesive soil and has the potential to address distress-related issues of other problematic soils.

Author Contributions

Conceptualization, methodology, G.A. and A.A.B.M.; software, B.M.B.; validation, G.A., A.A.B.M., and B.M.B.; formal analysis, investigation, G.A.; resources, A.A.B.M. and A.A.; data curation, G.A. and A.A.B.M.; writing—original draft preparation, G.A. and A.A.B.M.; writing—review and editing, G.A., A.A.B.M., A.A., and B.M.B.; visualization, A.A.B.M.; supervision, A.A.B.M.; project administration, funding acquisition, A.A.B.M. All authors have read and agreed to the published version of the manuscript.

Funding

This research was funded by the National Institute of Technology Warangal, Warangal, India under “Research Seed Grant No. P1015” and the Ministry of Education (Formerly known as Ministry of Human Resource and Development), Government of India. The APC was funded by A.A.B.M.

Data Availability Statement

Not applicable.

Acknowledgments

The authors would like to acknowledge the National Institute of Technology, Warangal, Warangal, India for providing the experimental facilities to carry out the research work. The authors would like to thank M Raja Viswanathan for proofreading the article. The authors would like to thank the reviewers for their constructive comments which helped the cause of the manuscript.

Conflicts of Interest

The authors declare no conflict of interest.

Nomenclature

The following symbols are used in the study.
GS Granite sand
CLS Calcium lignosulphonate
CP (days) Curing period
M1 70% clay and 30% GS
M2 60% clay and 40% GS
M3 50% clay and 50% GS
D G S (%) Dosage of GS
D C L S (%) Dosage of CLS
q c (kPa) Unconfined compressive strength of soil
q c _ e x p (kPa) Unconfined compressive strength of soil obtained from experiment
q c _ f i t (kPa) Unconfined compressive strength of soil obtained from curve fitting
K (×10−7 cm/s) Hydraulic conductivity of soil
K e x p ( × 10 7 ) (cm/s) Hydraulic conductivity of soil obtained from experiment
K f i t ( × 10 7 ) (cm/s) Hydraulic conductivity of soil obtained from curve fitting
R2Coefficient of multiple determination

References

  1. Kukko, H. Stabilization of Clay with Inorganic By-Products. J. Mater. Civ. Eng. 2000, 12, 307–309. [Google Scholar] [CrossRef]
  2. Chang, I.; Lee, M.; Tran, A.T.P.; Lee, S.; Kwon, Y.-M.; Im, J.; Cho, G.-C. Review on Biopolymer-Based Soil Treatment (BPST) Technology in Geotechnical Engineering Practices. Transp. Geotech. 2020, 24, 100385. [Google Scholar] [CrossRef]
  3. Taha, R.; Al-Harthy, A.; Al-Shamsi, K.; Al-Zubeidi, M. Cement Stabilization of Reclaimed Asphalt Pavement Aggregate for Road Bases and Subbases. J. Mater. Civ. Eng. 2002, 14, 239–245. [Google Scholar] [CrossRef]
  4. Sarkar, R.; Abbas, S.M.; Shahu, J.T. Study of Geotechnical Behavior of Pond Ash Mixed with Marble Dust. Int. J. Adv. Technol. Civ. Eng. 2012, 1, 8. [Google Scholar] [CrossRef]
  5. Taha Jawad, I.; Raihan Taha, M.; Hameed Majeed, Z.; Khan, T.A. Soil Stabilization Using Lime: Advantages, Disadvantages and Proposing a Potential Alternative. RJASET 2014, 8, 510–520. [Google Scholar] [CrossRef]
  6. Hunter, D. Lime-induced heave in sulfate bearing clay soils. J. Geotech. Eng. 1988, 114, 150–167. [Google Scholar] [CrossRef]
  7. Rong, H.; Qian, C.; Wang, R. A Cementation Method of Loose Particles Based on Microbe-Based Cement. Sci. China Technol. Sci. 2011, 54, 1722–1729. [Google Scholar] [CrossRef]
  8. Venkata Vydehi, K.; Moghal, A.A.B.; Basha, B.M. Reliability-Based Design Optimization of Biopolymer-Amended Soil as an Alternative Landfill Liner Material. J. Hazard. Toxic Radioact. Waste 2022, 26, 04022011. [Google Scholar] [CrossRef]
  9. Arulrajah, A.; Mohammadinia, A.; Phummiphan, I.; Horpibulsuk, S.; Samingthong, W. Stabilization of Recycled Demolition Aggregates by Geopolymers Comprising Calcium Carbide Residue, Fly Ash and Slag Precursors. Constr. Build. Mater. 2016, 114, 864–873. [Google Scholar] [CrossRef]
  10. Kampala, A.; Horpibulsuk, S.; Prongmanee, N.; Chinkulkijniwat, A. Influence of Wet-Dry Cycles on Compressive Strength of Calcium Carbide Residue–Fly Ash Stabilized Clay. J. Mater. Civ. Eng. 2014, 26, 633–643. [Google Scholar] [CrossRef]
  11. Simatupang, M.; Mangalla, L.K.; Edwin, R.S.; Putra, A.A.; Azikin, M.T.; Aswad, N.H.; Mustika, W. The Mechanical Properties of Fly-Ash-Stabilized Sands. Geosciences 2020, 10, 132. [Google Scholar] [CrossRef] [Green Version]
  12. Ashfaq, M.; Moghal, A.A.B. Influence of Lime and Coal Gangue on the CBR Behavior of Expansive Soil. In Advanced Geotechnical and Structural Engineering in the Design and Performance of Sustainable Civil Infrastructures; Neves, J., Zhu, B., Rahardjo, P., Eds.; Springer International Publishing: Cham, Switzerland, 2021; pp. 102–113. [Google Scholar] [CrossRef]
  13. Nwaiwu, C.; Mshelia, S.; Durkwa, J. Compactive Effort Influence on Properties of Quarry Dust-Black Cotton Soil Mixtures. Int. J. Geotech. Eng. 2012, 6, 91–101. [Google Scholar] [CrossRef]
  14. Moghal, A.A.B.; Chittoori, B.C.S.; Basha, B.M.; Al-Shamrani, M.A. Target Reliability Approach to Study the Effect of Fiber Reinforcement on UCS Behavior of Lime Treated Semiarid Soil. J. Mater. Civ. Eng. 2017, 29, 04017014. [Google Scholar] [CrossRef] [Green Version]
  15. Moghal, A.A.B.; Chittoori, B.C.S.; Basha, B.M. Effect of Fibre Reinforcement on CBR Behaviour of Lime-Blended Expansive Soils: Reliability Approach. Road Mater. Pavement Des. 2018, 19, 690–709. [Google Scholar] [CrossRef]
  16. Moghal, A.A.B.; Basha, B.M.; Chittoori, B.; Al-Shamrani, M.A. Effect of Fiber Reinforcement on the Hydraulic Conductivity Behavior of Lime-Treated Expansive Soil-Reliability-Based Optimization Perspective. In Proceedings of the Fourth Geo-China International Conference, Shandong, China, 25–27 July 2016; pp. 25–34. [Google Scholar] [CrossRef]
  17. Shaker, A.A.; Al-Shamrani, M.A.; Moghal, A.A.B.; Vydehi, K.V. Effect of Confining Conditions on the Hydraulic Conductivity Behavior of Fiber-Reinforced Lime Blended Semiarid Soil. Materials 2021, 14, 3120. [Google Scholar] [CrossRef]
  18. Al-Mahbashi, A.M.; Al-Shamrani, M.A.; Moghal, A.A.B.; Vydehi, K.V. Correlation-Based Studies on Resilient Modulus Values for Fiber-Reinforced Lime-Blended Clay. Int. J. Geosynth. Ground Eng. 2021, 7, 59. [Google Scholar] [CrossRef]
  19. Ashfaq, M.; Moghal, A.A.B.; Munwar Basha, B. Reliability-Based Design Optimization of Chemically Stabilized Coal Gangue. J. Test. Eval. 2022, 50, 20210176. [Google Scholar] [CrossRef]
  20. Ashfaq, M.; Moghal AA, B.; Basha, B.M. The Sustainable Utilization of Coal Gangue in Geotechnical and Geoenvironmental Applications. J. Hazard. Toxic Radioact. Waste 2022, 26, 03122003. [Google Scholar] [CrossRef]
  21. Kufre Etim, R.; Ufot Ekpo, D.; Christopher Attah, I.; Chibuzor Onyelowe, K. Effect of Micro Sized Quarry Dust Particle on the Compaction and Strength Properties of Cement Stabilized Lateritic Soil. Clean. Mater. 2021, 2, 100023. [Google Scholar] [CrossRef]
  22. Emeka, A.E.; Jonah Chukwuemeka, A.; Benjamin Okwudili, M. Deformation Behaviour of Erodible Soil Stabilized with Cement and Quarry Dust. Emerg Sci J. 2018, 2, 383. [Google Scholar] [CrossRef] [Green Version]
  23. Toledo, M.C.F.; Kuznesof, P.M. Calcium Lignosulfonate (40-65). Chemical and Technical Assessment, draft CTA provided by DSM Nutritional Products. In Proceedings of the 69th JECFA Meeting, Rome, Italy, 17–26 June 2008; 2008. [Google Scholar]
  24. Puppala, A.J.; Hanchanloet, S. Evaluation of a New Chemical Treatment Method on Strength and Resilient Properties of a Cohesive Soil. In Proceedings of the 78th Annual Meeting of the Transportation Research Board; Transportation Research Board: Washington, DC, USA, 1999; Paper No. 990389. [Google Scholar]
  25. Chavali, R.V.P.; Reshmarani, B. Characterization of Expansive Soils Treated with Lignosulfonate. Geo-Engineering 2020, 11, 17. [Google Scholar] [CrossRef]
  26. Li, Y.; Zhang, Y.; Ceylan, H.; Kim, S. Laboratory Evaluation of Silty Soils Stabilized with Lignosulfonate. In Airfield and Highway Pavements 2019; American Society of Civil Engineers: Chicago, IL, USA, 2019; pp. 531–540. [Google Scholar] [CrossRef]
  27. Wu, D.; She, W.; Wei, L.; Zuo, W.; Hu, X.; Hong, J.; Miao, C. Stabilization Mechanism of Calcium Lignosulphonate Used in Expansion Sensitive Soil. J. Wuhan Univ. Technol. Mat. Sci. Edit. 2020, 35, 847–855. [Google Scholar] [CrossRef]
  28. Zhang, T.; Cai, G.; Liu, S. Application of Lignin-Stabilized Silty Soil in Highway Subgrade: A Macroscale Laboratory Study. J. Mater. Civ. Eng. 2018, 30, 04018034. [Google Scholar] [CrossRef]
  29. Alazigha, D.P.; Vinod, J.S.; Indraratna, B.; Heitor, A. Potential Use of Lignosulfonate for Expansive Soil Stabilisation. Environ. Geotech. 2019, 6, 480–488. [Google Scholar] [CrossRef] [Green Version]
  30. ASTM-D2487; Standard Practice for Classification of Soils for Engineering Purposes (Unified Soil Classification System). ASTM: West Conshohocken, PA, USA, 2017. Available online: https://www.astm.org/d2487-11.html (accessed on 29 September 2022).
  31. Vinod, J.S.; Indraratna, B.; Mahamud, M.A.A. Stabilisation of an Erodible Soil Using a Chemical Admixture. Proc. Inst. Civ. Eng. Ground Improv. 2010, 163, 43–51. [Google Scholar] [CrossRef] [Green Version]
  32. ASTM-D4318; Standard Test Methods for Liquid Limit, Plastic Limit, and Plasticity Index of Soils. ASTM: West Conshohocken, PA, USA, 2017. Available online: https://www.astm.org/d4318-17e01.html (accessed on 29 September 2022).
  33. IS: 2720 (Part 40); Methods of Test for Soils: Determination of Free Swell Index of Soils. Bureau of Indian Standards: New-Delhi, India, 1977. Available online: https://standardsbis.bsbedge.com/BIS_searchstandard.aspx?Standard_Number=IS+2720+%3a+Part+40&id=19139 (accessed on 29 September 2022).
  34. ASTM-D698; Standard Test Methods for Laboratory Compaction Characteristics of Soil Using Standard Effort (12,400 ft-lbf/ft3 (600 kN-m/m3)). ASTM: West Conshohocken, PA, USA, 2012. Available online: https://www.astm.org/d0698-12r21.html (accessed on 29 September 2022).
  35. ASTM-D2166M; Standard Test Method for Unconfined Compressive Strength of Cohesive Soil. ASTM: West Conshohocken, PA, USA, 2013. Available online: https://www.astm.org/d2166_d2166m-13.html (accessed on 29 September 2022).
  36. Sharmila, B.; Bhuvaneshwari, S.; Landlin, G. Application of Lignosulphonate—A Sustainable Approach towards Strength Improvement and Swell Management of Expansive Soils. Bull Eng Geol Environ. 2021, 80, 6395–6413. [Google Scholar] [CrossRef]
  37. ASTM-D5856; Standard Test Method for Measurement of Hydraulic Conductivity of Saturated Porous Materials Using Rigid Wall Compaction-Mold Permeameter. ASTM: West Conshohocken, PA, USA, 2015. Available online: https://www.astm.org/d5856-15.html (accessed on 29 September 2022).
  38. Sridharan, A.; Rao, G.V. Mechanism of controlling liquid limit of clays. In Proceedings of the Istanbul Conference on Soil Mechanics and Foundation Engineering, Istanbul, Turkey, 31 March–4 April 1975; Volume 1, pp. 75–84. [Google Scholar]
  39. Soosan, T.; Sridharan, A.; Jose, B.; Abraham, B. Utilization of Quarry Dust to Improve the Geotechnical Properties of Soils in Highway Construction. Geotech. Test. J. 2005, 28, 11768. [Google Scholar] [CrossRef]
  40. Sabitha, B.S.; Sheela Evangeline, Y. Stabilisation of Kuttanad Soil Using Calcium and Sodium Lignin Compounds. In Proceedings of the Indian Geotechnical Conference 2019; Patel, S., Solanki, C.H., Reddy, K.R., Shukla, S.K., Eds.; Springer: Singapore, 2021; pp. 249–258. [Google Scholar] [CrossRef]
  41. Nayak, S.; Sarvade, P.G. Effect of Cement and Quarry Dust on Shear Strength and Hydraulic Characteristics of Lithomargic Clay. Geotech Geol Eng 2012, 30, 419–430. [Google Scholar] [CrossRef]
  42. Oyediran, I.A.; Idowu, O.D. Performance Analysis of some Quarry dust treated soils. J. Min. Geol. 2017, 53, 45–53. [Google Scholar]
  43. Priyankara, N.H.; Wijesooriya, R.M.S.D.; Jayasinghe, S.N.; Wickramasinghe, W.R.M.B.E.; Yapa, S.T.A.J. Suitability of Quarry Dust in Geotechnical Applications to Improve Engineering Properties. Engineer 2009, 42, 7. [Google Scholar] [CrossRef] [Green Version]
  44. Alazigha, D.P.; Indraratna, B.; Vinod, J.S.; Ezeajugh, L.E. The Swelling Behaviour of Lignosulfonate-Treated Expansive Soil. Proc. Inst. Civ. Eng. -Ground Improv. 2016, 169, 182–193. [Google Scholar] [CrossRef] [Green Version]
  45. Ta’negonbadi, B.; Noorzad, R. Stabilization of Clayey Soil Using Lignosulfonate. Transp. Geotech. 2017, 12, 45–55. [Google Scholar] [CrossRef]
  46. Mudgal, A. Effect of Lime and Stone Dust in the Geotechnical Properties of Black Cotton Soil. Int. J Geomate 2014, 7, 1033–1039. [Google Scholar] [CrossRef]
  47. Güneyli, H.; Rüşen, T. Effect of Length-to-Diameter Ratio on the Unconfined Compressive Strength of Cohesive Soil Specimens. Bull. Eng. Geol. Environ. 2016, 75, 793–806. [Google Scholar] [CrossRef]
  48. Chetia, M.; Baruah, M.P.; Sridharan, A. Effect of Quarry Dust on Compaction Characteristics of Clay. In Contemporary Issues in Geoenvironmental Engineering; Singh, D.N., Galaa, A., Eds.; Sustainable Civil Infrastructures; Springer International Publishing: Cham, Switzerland, 2018; pp. 78–100. [Google Scholar] [CrossRef]
  49. Amulya, G.; Moghal, A.A.B.; Almajed, A. A State-of-the-Art Review on Suitability of Granite Dust as a Sustainable Additive for Geotechnical Applications. Crystals 2021, 11, 1526. [Google Scholar] [CrossRef]
  50. Chetia, M.; Sridharan, A.A. A Review on the Influence of Rock Quarry Dust on Geotechnical Properties of Soil. In Geo-Chicago 2016; American Society of Civil Engineers: Chicago, IL, USA, 2016; pp. 179–190. [Google Scholar] [CrossRef]
  51. Sivapullaiah, P.V.; Moghal, A.A.B. Role of gypsum in the strength development of fly ashes with lime. J. Mater. Civ. Eng. 2011, 23, 197–206. [Google Scholar] [CrossRef]
  52. Moghal, A.A.B.; Vydehi, V.; Moghal, M.B.; Almatrudi, R.; Almajed, A.; Al-Shamrani, M.A. Effect of calcium-based derivatives on consolidation, strength, and lime-leachability behavior of expansive soil. J. Mater. Civ. Eng. 2020, 32, 04020048. [Google Scholar] [CrossRef]
  53. Yıldız, M.; Sogancı, A.S. Effect of freezing and thawing on strength and permeability of lime-stabilized clays. Sci. Iran. 2012, 19, 1013–1017. [Google Scholar] [CrossRef] [Green Version]
  54. Behnood, A. Soil and clay stabilization with calcium-and non-calcium-based additives: A state-of-the-art review of challenges, approaches, and techniques. Transp. Geotech. 2018, 17, 14–32. [Google Scholar] [CrossRef]
  55. Almajed, A.; Lateef, M.A.; Moghal, A.A.B.; Lemboye, K.K. State-of-the-Art Review of the Applicability and Challenges of Microbial-Induced Calcite Precipitation (MICP) and Enzyme-Induced Calcite Precipitation (EICP) Techniques for Geotechnical and Geoenvironmental Applications. Crystals 2021, 11, 370. [Google Scholar] [CrossRef]
  56. Sharma, L.K.; Singh, T.N. Regression-Based Models for the Prediction of Unconfined Compressive Strength of Artificially Structured Soil. Eng. Comput. 2018, 34, 175–186. [Google Scholar] [CrossRef]
Figure 1. SEM image of clay.
Buildings 12 01687 g001
Figure 2. SEM image of GS.
Buildings 12 01687 g002
Figure 3. Variation of q c with changes in dosage of CLS for (a) M1 (b) M2 (c) M3 mixes.
Buildings 12 01687 g003
Figure 4. The mechanism behind the strength improvement of clay–GS–CLS mixtures.
Buildings 12 01687 g004
Figure 5. Detailed interaction mechanism involved with CLS. (a) CLS intact with clay particle (b) Adsorption of CLS over clay particle (c) Polymer chain formation (d) Basal bonding (e) Peripheral bonding.
Buildings 12 01687 g005
Figure 6. Failure response of (a) M1 (b) M2 (c) M3 samples mixed with 1.5% CLS.
Buildings 12 01687 g006
Figure 7. Variation in K with change in dosage of clay–GS–CLS mixes.
Buildings 12 01687 g007
Table 1. Basic Characteristics and Chemical composition of clay.
CharacteristicsValueChemical CompositionValue (%)
ColorGreyish blackSilica (SiO2)55.34
Specific Gravity2.62Alumina (Al2O3)9.92
Liquid limit (%)45.13Ferric Oxide (Fe2O3)8.15
Plastic limit (%)22.34Calcium Oxide (CaO)1.06
Plasticity Index (%)22.79Magnesium Oxide (MgO)1.97
Shrinkage limit (%)13Titanium Oxide (TiO2)1.13
% Fines63Sodium Oxide (Na2O)0.31
USCS classificationCI
Differential free swell (%)33
Maximum Dry Density (kg/m3)1750
Optimum Moisture content (%)16.3
pH7.7
Electrical conductivity (milli S/m)1.05
Table 2. Basic Characteristics and Chemical Composition of GS.
CharacteristicValueChemical CompositionValue (%)
ColorGreySilica (SiO2)53.06
Specific Gravity2.72Alumina (Al2O3)6.16
Sand fraction (%)90Ferric Oxide (Fe2O3)9.06
Coarse sand (%)19Calcium Oxide (CaO)1.64
Medium Sand (%)32Magnesium Oxide (MgO)5.86
Fine Sand (%)39Titanium Oxide (TiO2)0.32
Mean particle size (µ)600Sodium Oxide (Na2O)1.37
Zone3
USCS classificationSP
Maximum Dry Density (kg/m3)2100
Optimum Moisture content (%)8.3
pH7.36
Table 3. Properties of CLS.
PropertyValues
ColorYellow brown
Molar mass528.61 g/mol
pH4.3
SolubilitySoluble in water
Table 4. Variation in Index properties of clay–GS mixes.
S. NoMixturesLiquid Limit (%)Plastic Limit (%)Plasticity Index (%)Shrinkage Limit (%)DFS (%)
1.Clay45.1322.3422.791333
2.M135.7913.1422.8513.20
3.M229.5613.9315.6321.920
4.M325.6413.1412.524.50
M1: 70% Clay and 30% GS; M2: 60% Clay and 40% GS; M3: 50% Clay and 50% GS.
Table 5. Variation of UCS and Hydraulic Conductivity of clay–GS mixes.
Combinations UCS   ( q c )
(kPa)
Hydraulic Conductivity (K)
(×10−7 cm/s)
Clay105.30.16
M1133.82.93
M266.393.64
M345.35.06
Table 6. The nonlinear equations for the UCS ( q c _ f i t ) of untreated clay measured after 0, 7, 14, 28, and 90 days of curing.
C P
(Days)
q c _ e x p
(kPa)
q c _ f i t
(kPa)
Residual
(kPa)
% Error
0105.30105.060.240.23
7107.00107.69−0.69−0.64
14110.30109.740.560.51
28112.30112.42−0.12−0.10
90117.60117.600.000.00
Table 7. The nonlinear equation for the UCS ( q c _ f i t ) of treated soil with granite sand (GS) and calcium lignosulphonate (CLS) measured after 7 and 14 days of curing.
C P
(Days)
D G S
(%)
D C L S
(%)
q c _ e x p
(kPa)
q c _ f i t
(kPa)
Residual
(kPa)
% Error
7300.5271.48198.8472.6426.76
301.0178.40187.05−8.65−4.85
301.5158.50175.95−17.45−11.01
302.0208.13165.5142.6220.48
400.5135.70186.37−50.67−37.34
401.0123.10175.32−52.22−42.42
401.5111.00164.92−53.92−48.57
402.0100.60155.13−54.53−54.21
500.586.80174.69−87.89−101.25
501.094.63164.32−69.69−73.65
501.596.35154.57−58.22−60.43
502.090.50145.40−54.90−60.67
14300.5396.80240.89155.9139.29
301.0307.77226.6081.1726.37
301.5220.23213.167.073.21
302.0357.90200.51157.3943.98
400.5206.47225.78−19.31−9.35
401.0173.14212.39−39.25−22.67
401.5169.48199.79−30.31−17.88
402.0223.40187.9335.4715.88
500.5198.30211.63−13.33−6.72
501.0262.35199.0763.2824.12
501.5191.37187.264.112.15
502.0200.50176.1524.3512.14
Table 8. The nonlinear equation for the UCS ( q c _ f i t ) of treated soil with granite sand (GS) and calcium lignosulphonate (CLS) measured after 28 and 90 days of curing.
C P
(Days)
D G S
(%)
D C L S
(%)
q c _ e x p
(kPa)
q c _ f i t
(kPa)
Residual
(kPa)
% Error
28300.5423.80353.5470.2616.58
301.0350.80332.5718.235.20
301.5251.60312.83−61.23−24.34
302.0363.60294.2769.3319.07
400.5400.60331.3769.2317.28
401.0298.40311.71−13.31−4.46
401.5231.96293.22−61.26−26.41
402.0368.40275.8292.5825.13
500.5213.50310.59−97.09−45.48
501.0290.20292.16−1.96−0.68
501.5140.30274.83−134.53−95.89
502.0184.80258.52−73.72−39.89
90300.51890.701933.41−42.71−2.26
301.01651.101818.70−167.60−10.15
301.51628.801710.80−82.00−5.03
302.01685.901609.3076.604.54
400.52306.801812.16494.6421.44
401.01458.001704.65−246.65−16.92
401.51376.501603.51−227.01−16.49
402.01801.801508.38293.4216.29
500.51632.801698.52−65.72−4.03
501.01686.211597.7588.465.25
501.51202.201502.95−300.75−25.02
502.01605.901413.79192.1111.96
Table 9. The nonlinear equations for the hydraulic conductivity ( K f i t ) of untreated clay measured after 0, 7, and 28 days of curing.
C P
(Days)
K e x p   ( × 10 7 )
(cm/s)
K f i t   ( × 10 7 )
(cm/s)
Residual
(cm/s)
% Error
0105.30105.060.240.23
7107.00107.69−0.69−0.64
28112.30112.42−0.12−0.10
Table 10. The nonlinear equation for the hydraulic conductivity ( K f i t ) of treated soil with granite sand (GS) and calcium lignosulphonate (CLS) measured after 7 and 14 days of curing.
C P
(Days)
D G S
(%)
D C L S
(%)
K e x p   ( × 10 7 )
(cm/s)
K f i t   ( × 10 7 )   ( × 10 7 )
(cm/s)
Residual
(kPa)
% Error
7300.52.303.17−0.87−37.93
301.01.602.67−1.07−66.88
301.51.322.25−0.93−70.25
302.00.731.89−1.16−159.09
400.57.217.28−0.07−1.02
401.06.436.130.304.66
401.56.135.160.9715.83
402.06.044.341.7028.11
500.516.2016.72−0.52−3.22
501.015.6214.071.559.90
501.512.0411.840.201.62
502.08.059.97−1.92−23.84
28300.51.772.47−0.70−39.71
301.00.882.08−1.20−136.51
301.51.071.75−0.68−63.71
302.00.571.47−0.90−158.65
400.56.475.680.7912.25
401.05.284.780.509.50
401.55.654.021.6328.82
402.05.223.381.8435.16
500.512.2413.03−0.79−6.49
501.011.1210.970.151.35
501.59.639.230.404.12
502.06.767.77−1.01−14.95
Publisher’s Note: MDPI stays neutral with regard to jurisdictional claims in published maps and institutional affiliations.

