
Fragility Curves of Existing RC Buildings Accounting for Bidirectional Ground Motion


Abstract
:1. Introduction
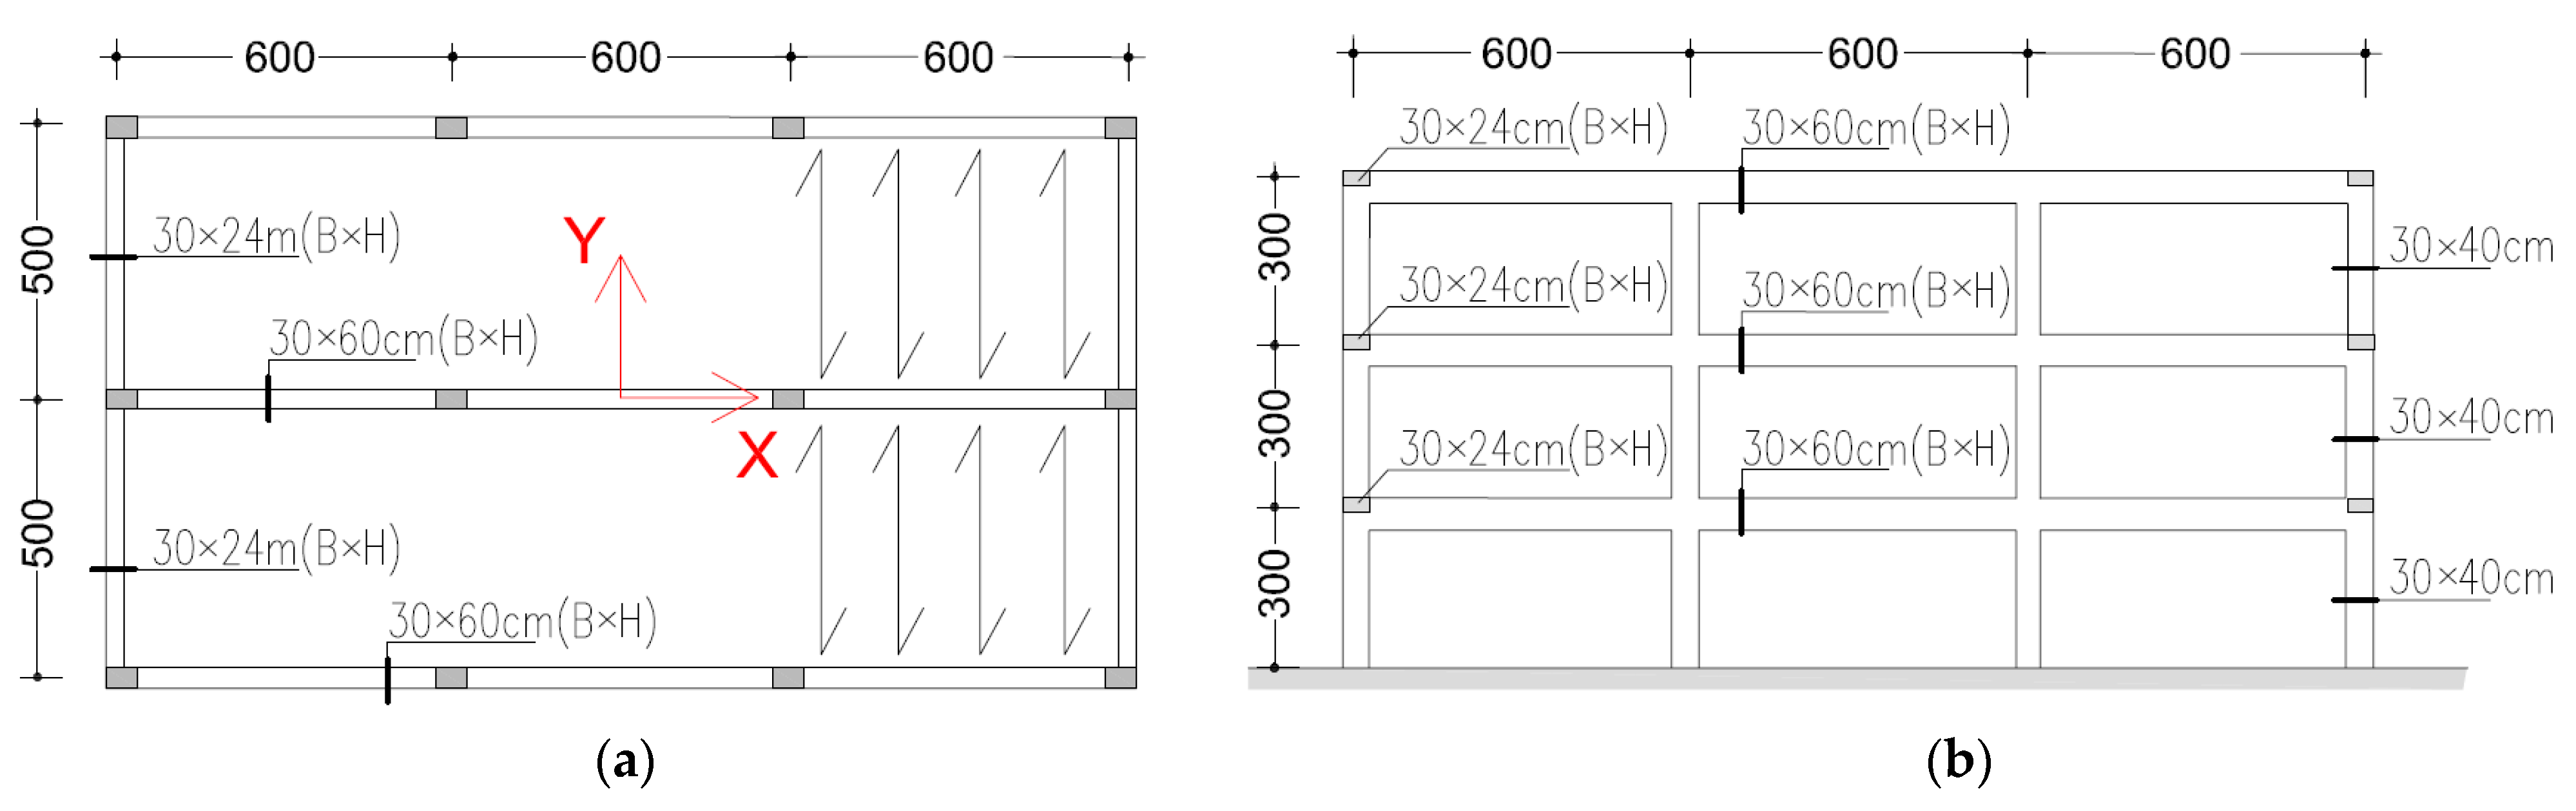
2. The Case Study
- the lack or the total absence of capacity design provisions and details;
- realized with the philosophy of strong-beams and weak-columns;
- the presence of vertical loads resisting frames in only one of the main directions of the building;
- the lack of confinement effects in the panel joint regions;
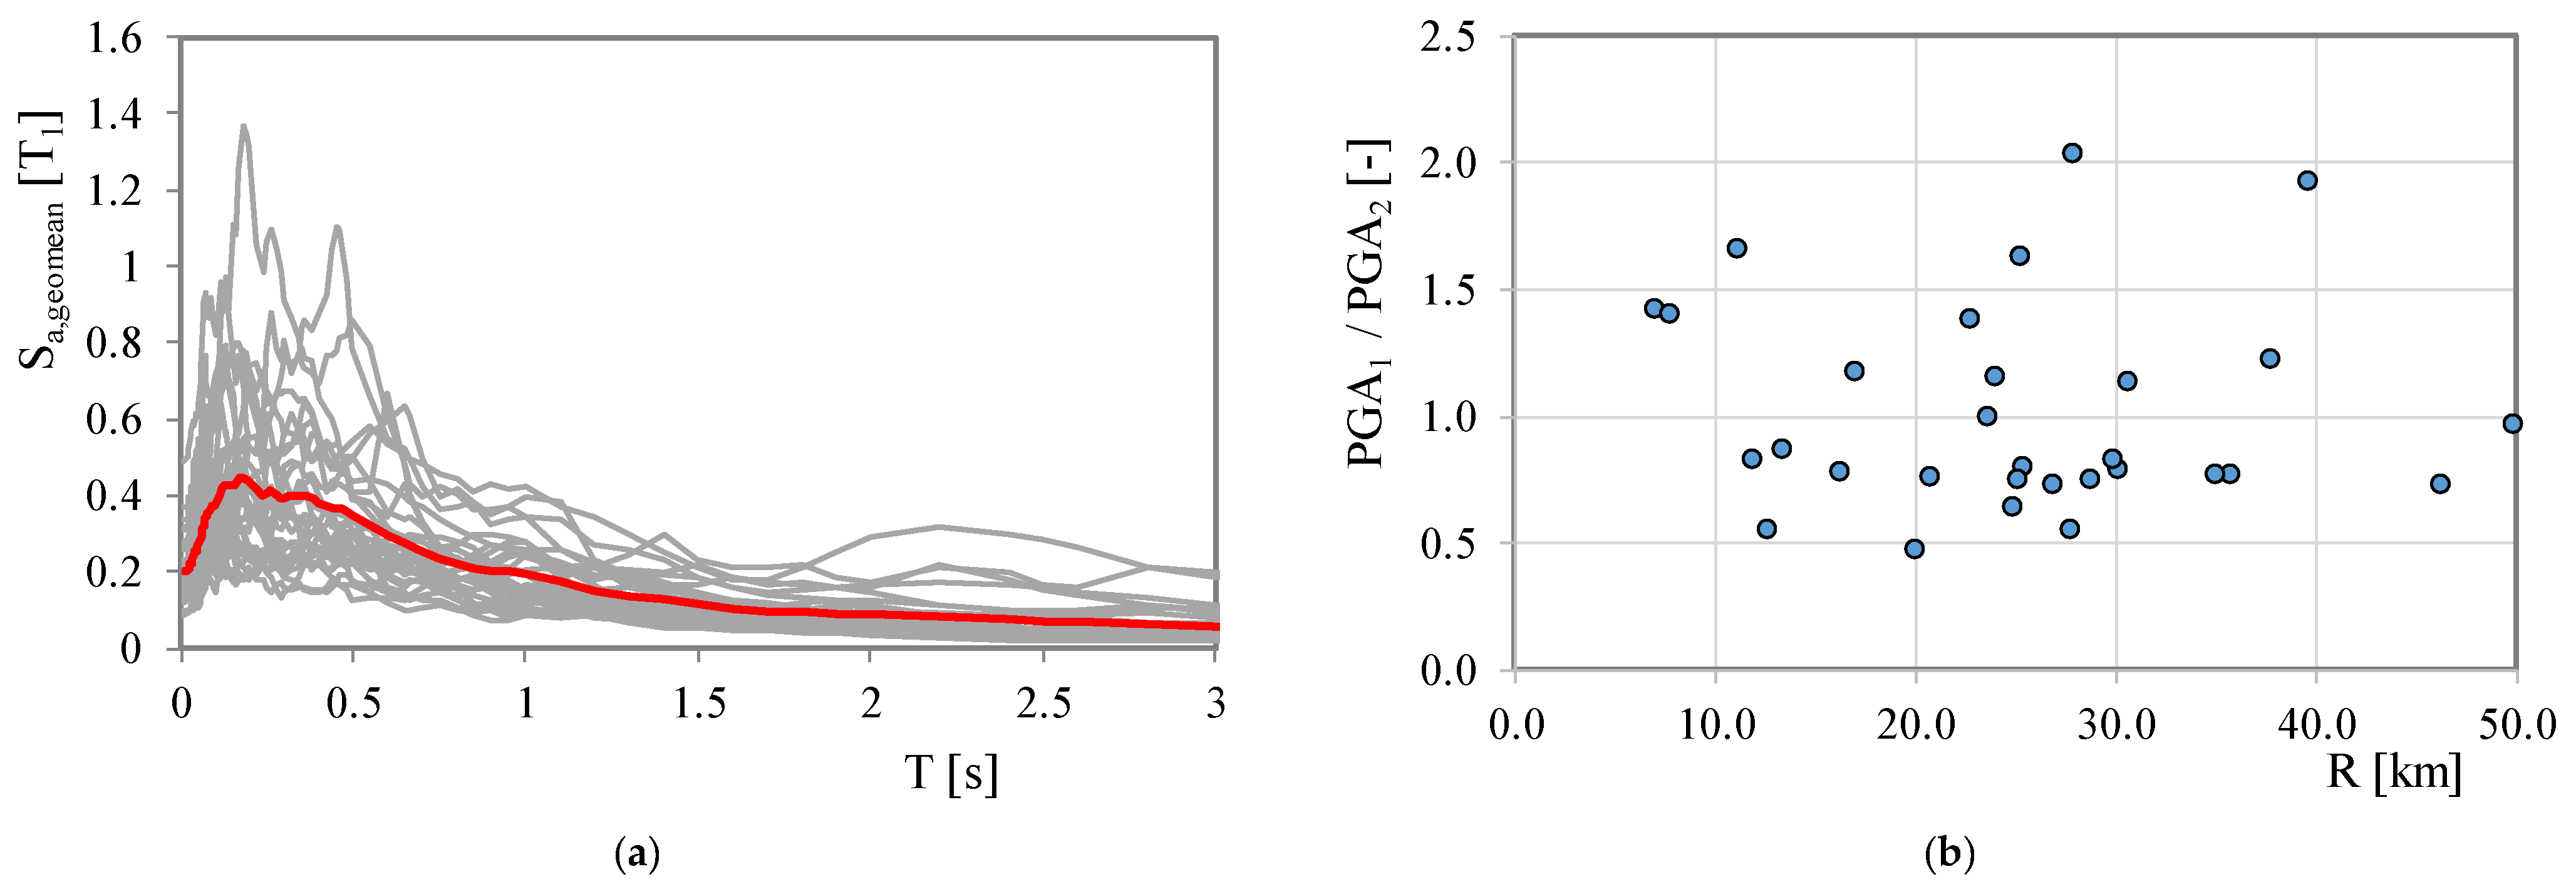
3. Ground Motion Selection and Scaling
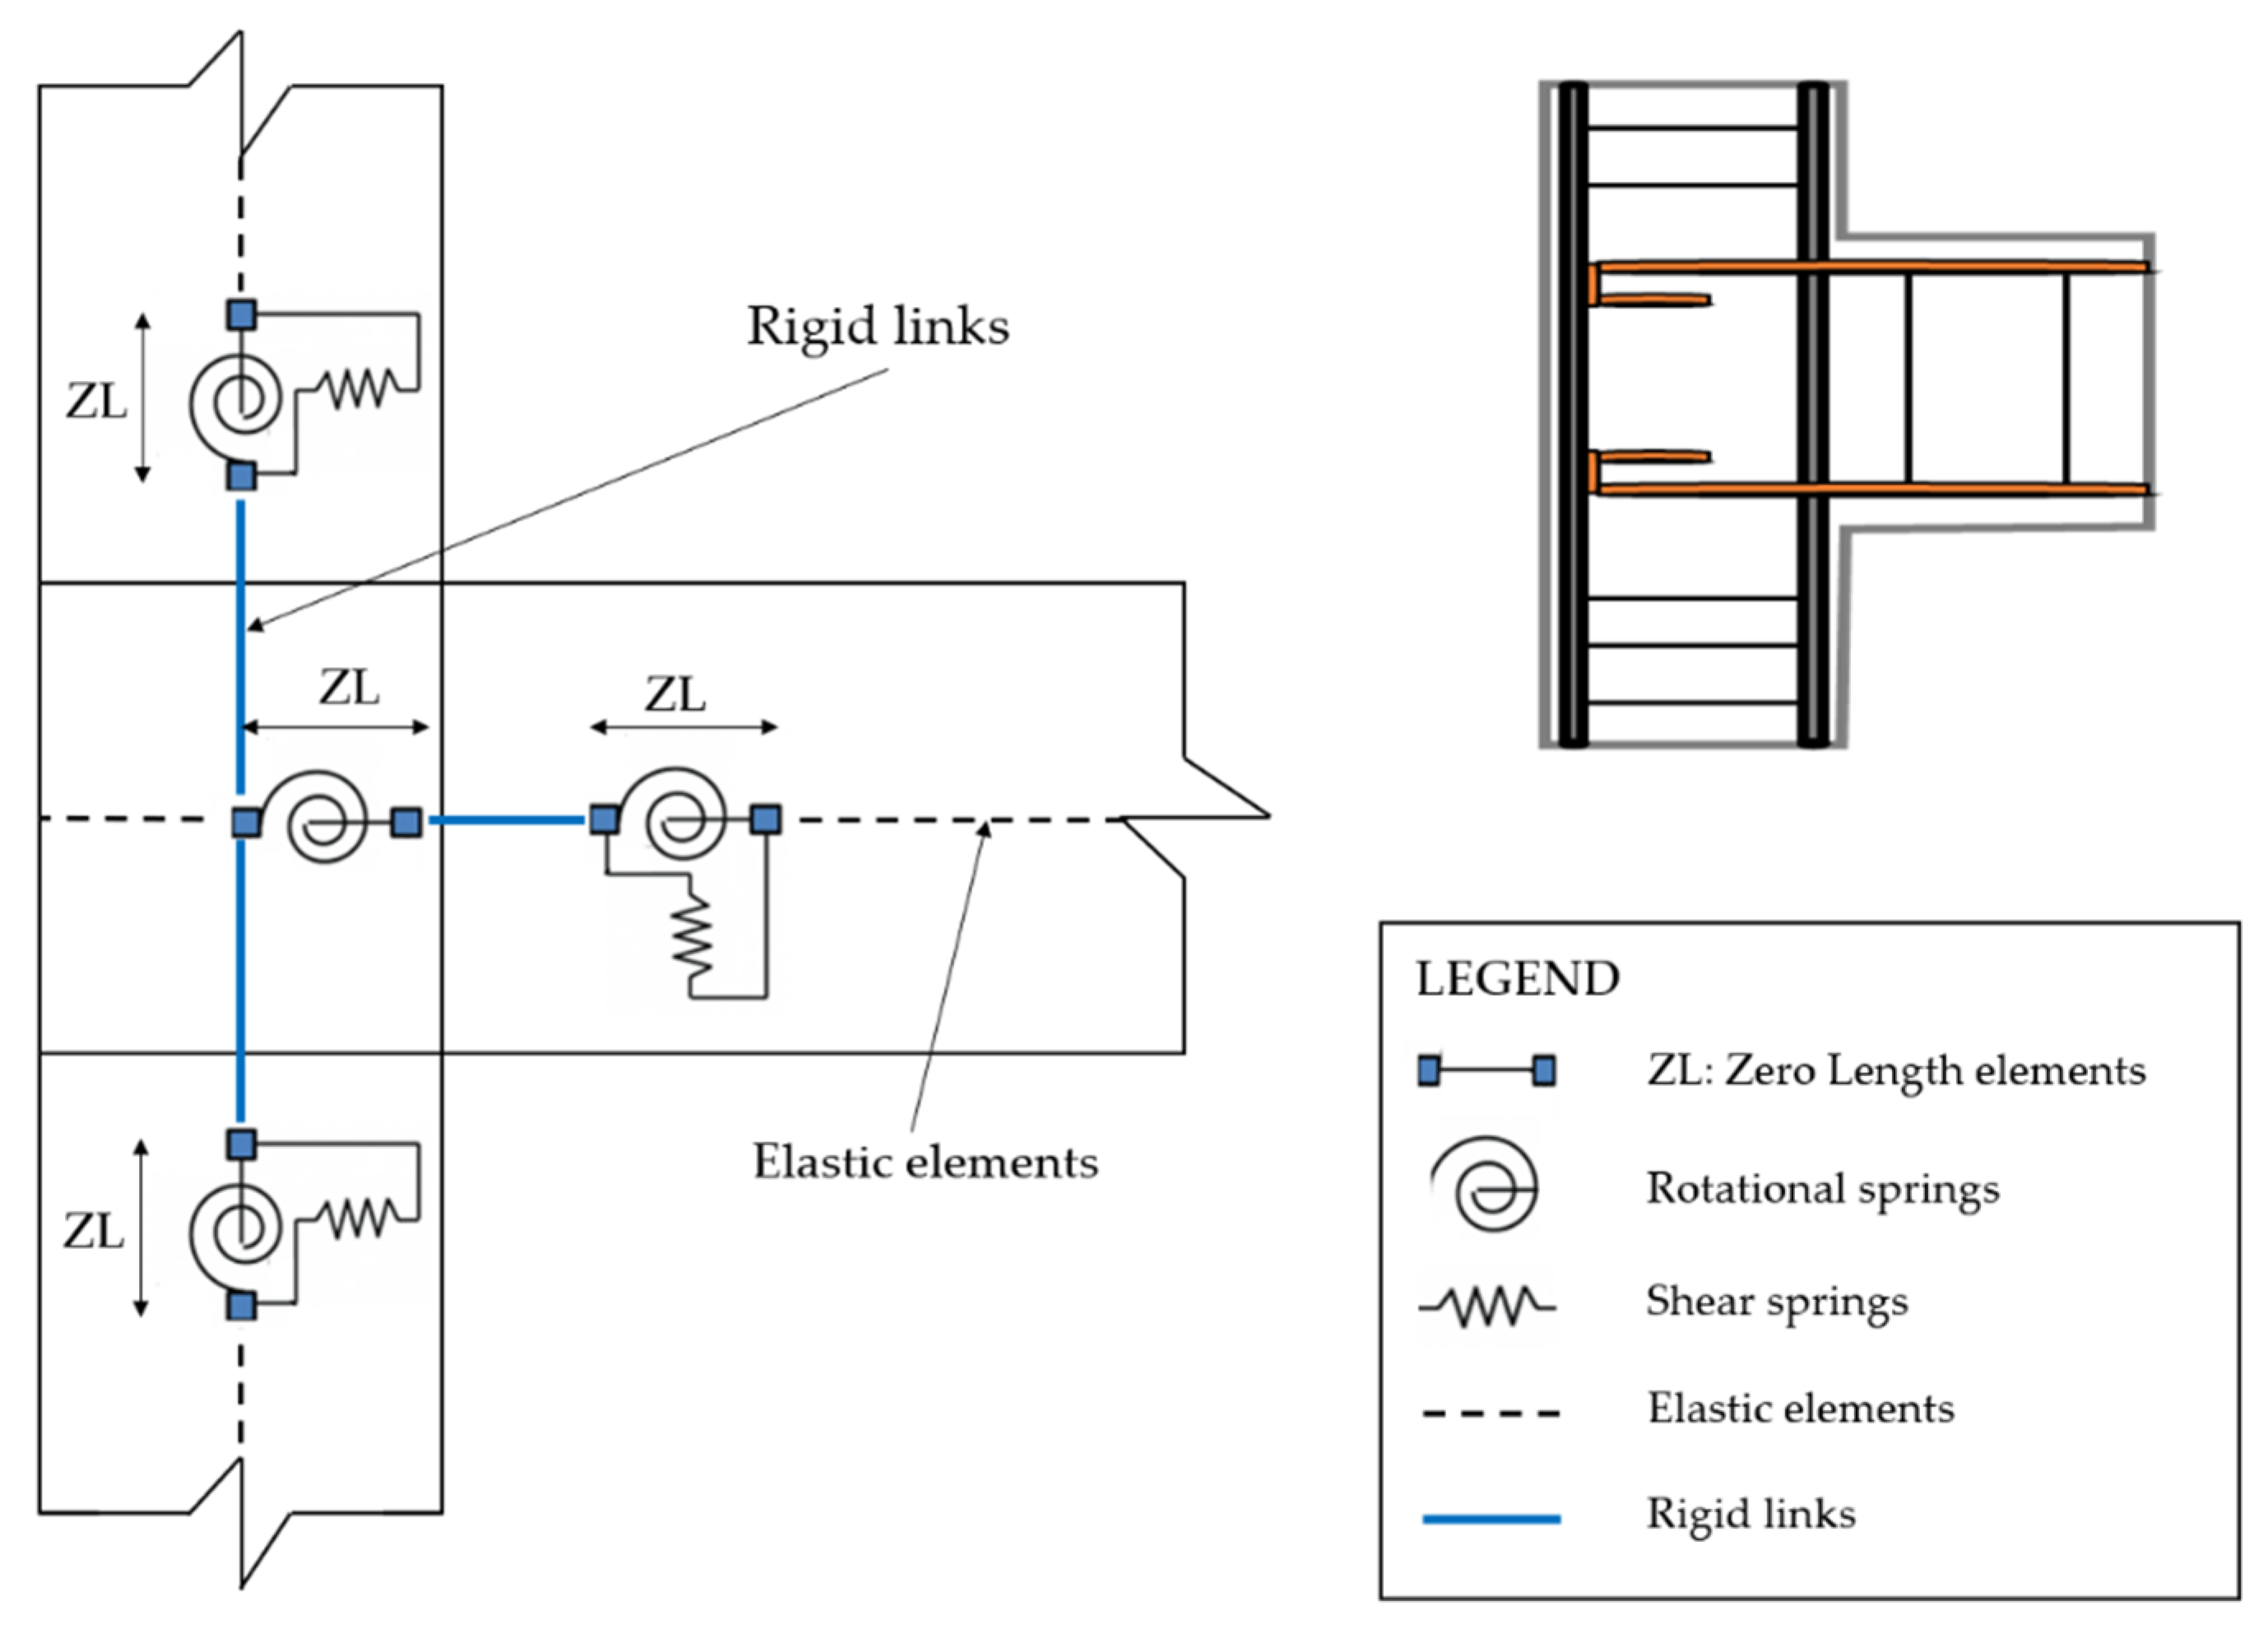
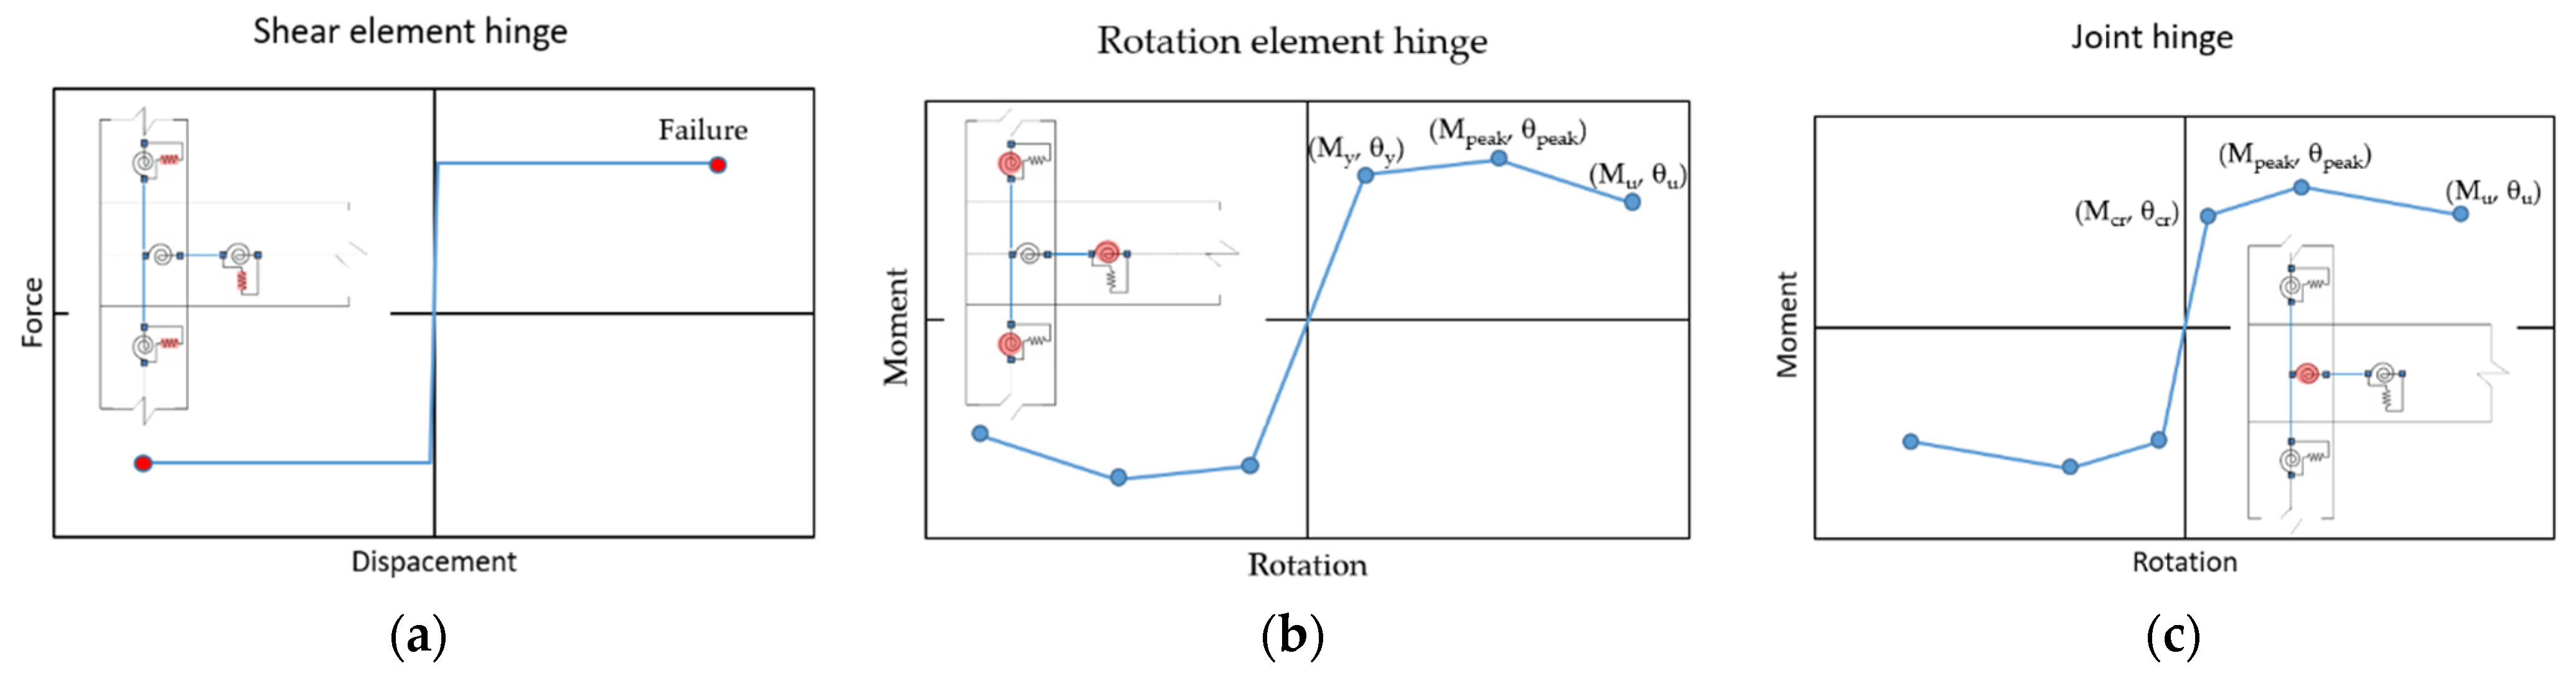
4. Finite Element Modelling
- the ultimate rotation for a column;
- the ultimate rotation for a beam;
- the displacement capacity in one of the shear sliding hinges;
- an interstorey drift ratio equal to 5%.
5. Structural Analysis Results
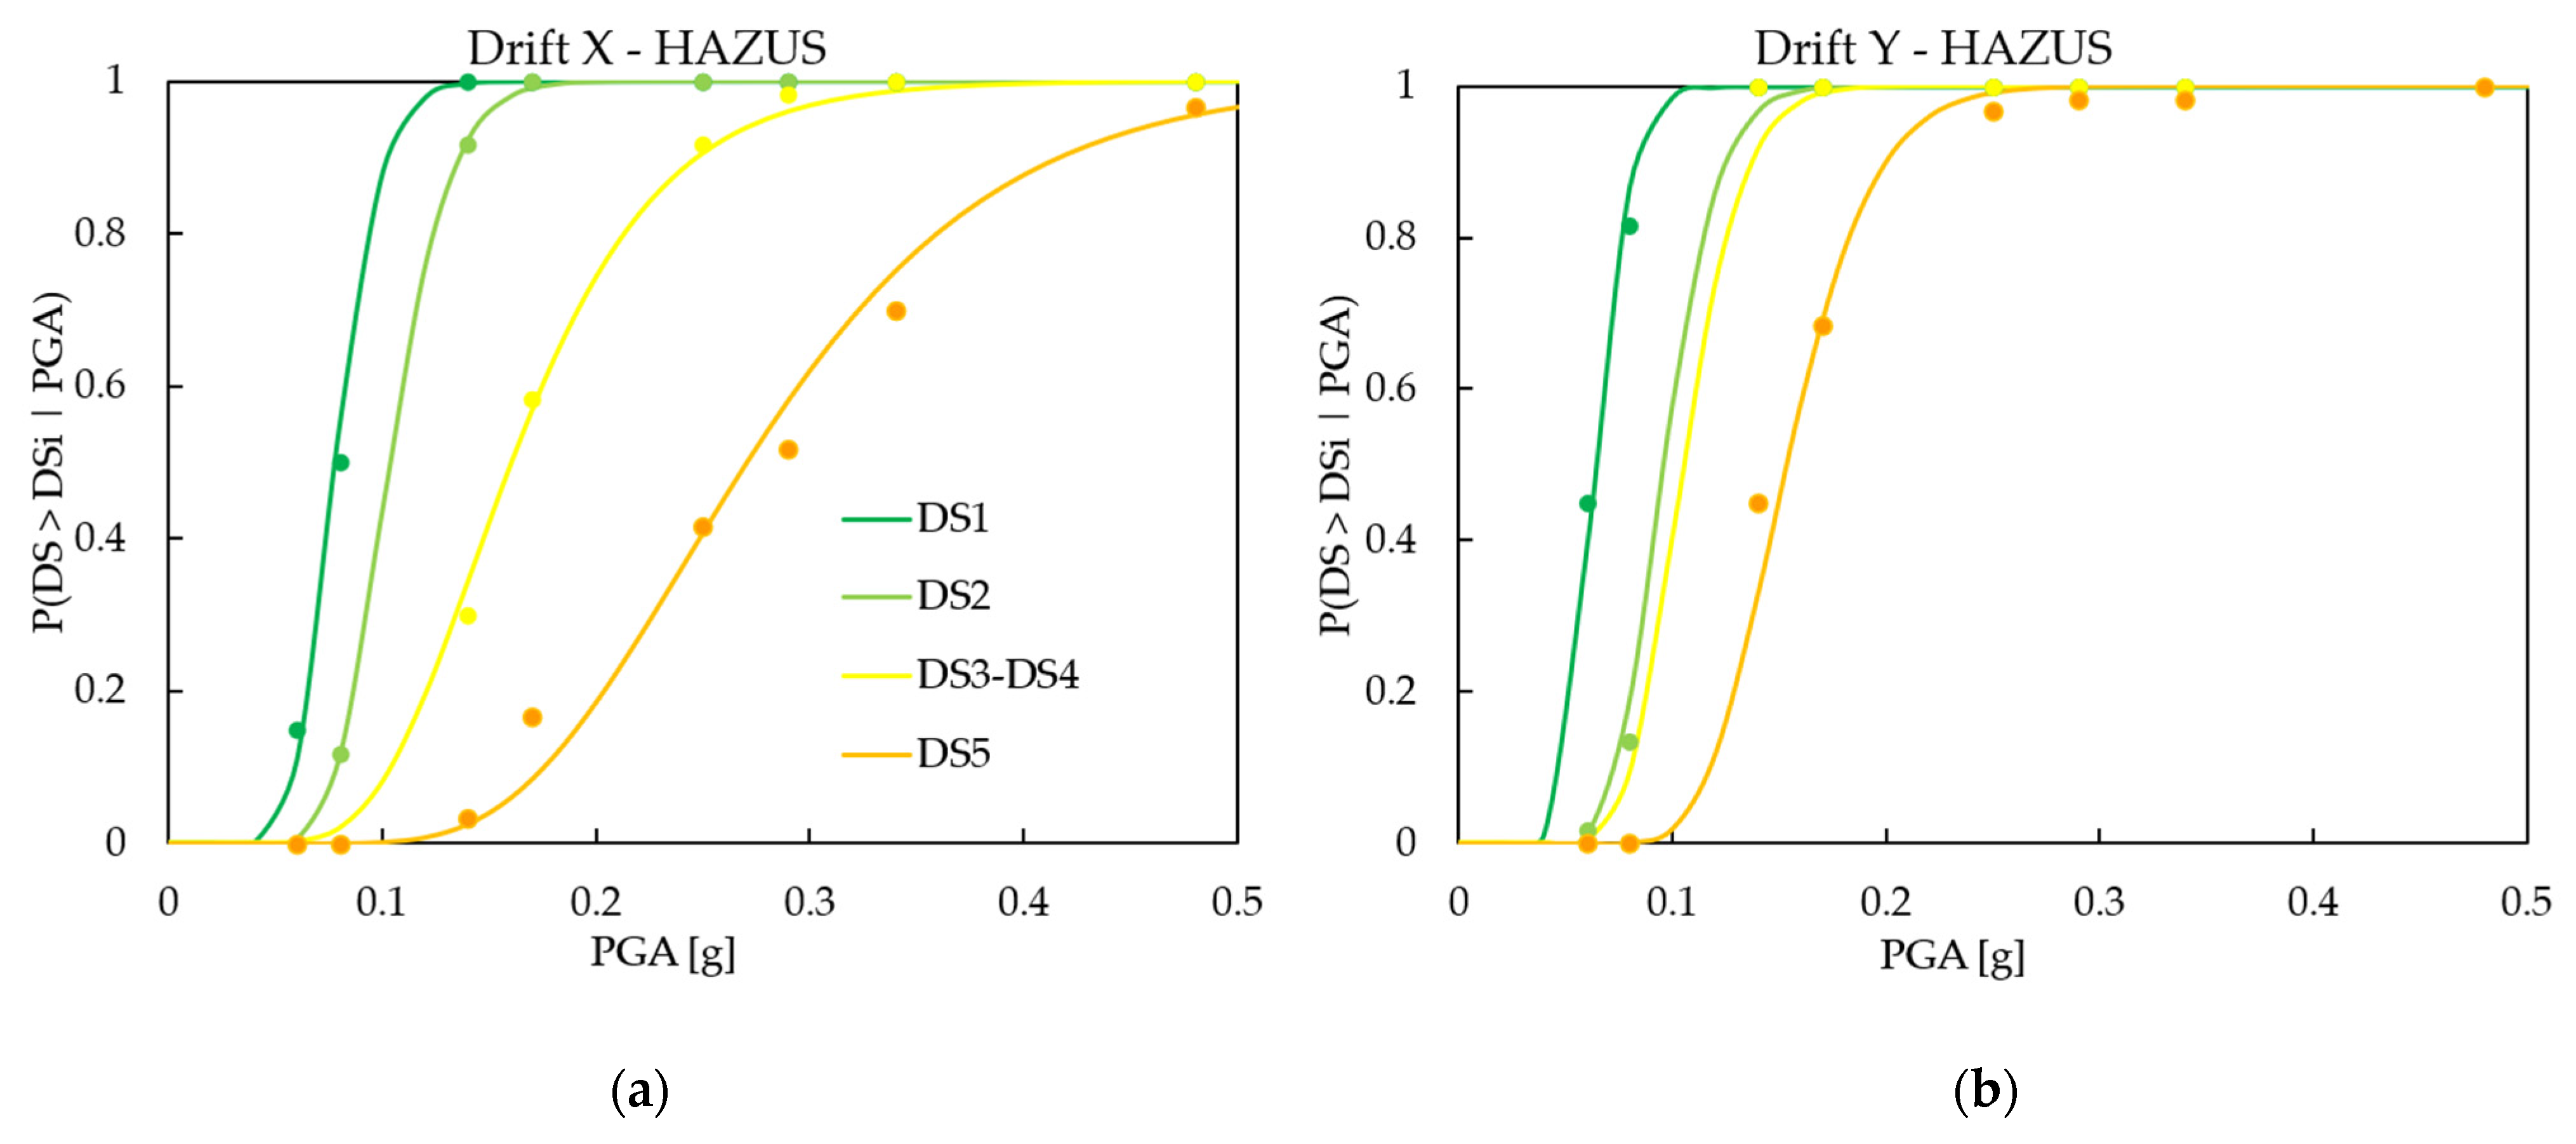
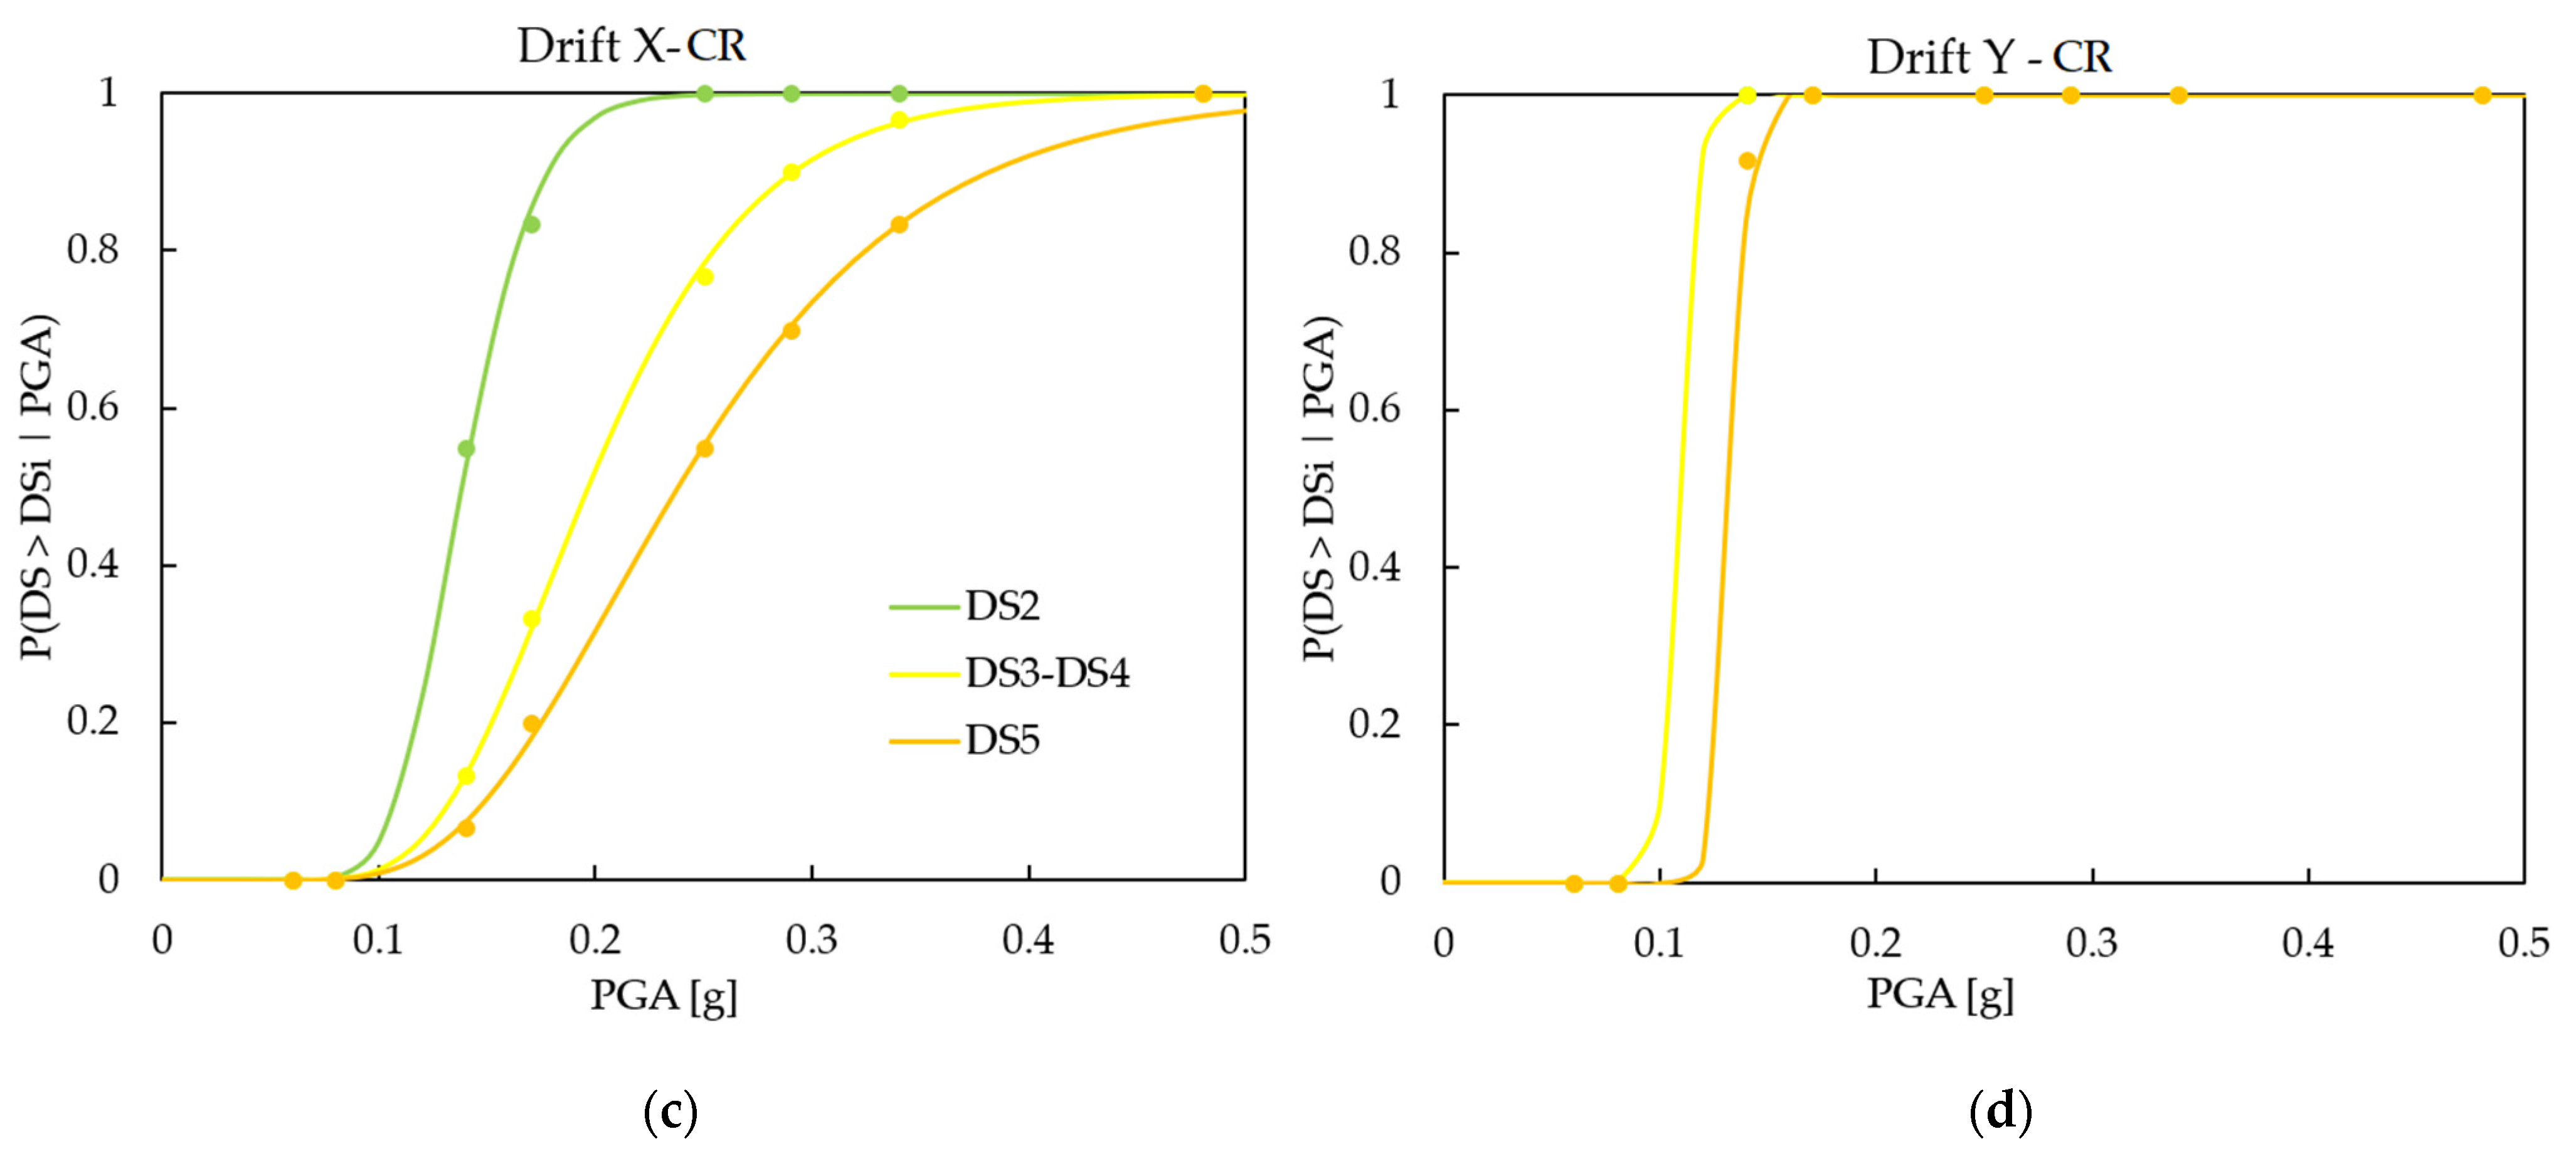
6. Damage States and Fragility Curves
7. Conclusions
- The non-linear three-dimensional model together with the bi-directional ground motion allowed for highlighting a different seismic behavior of the structure in the two main directions (X and Y), revealing a higher vulnerability in the Y direction with respect to X. The RC bare frame in the Y direction reaches collapse at 30% in 50 years of HLs, whereas in the X direction, at the same HLs, the first cracking condition in some external joints is achieved.
- The non-linear behaviours attributed to structural elements account for shear and flexural behavior of beams and columns, and the moment-rotation relationship attributed to the joint panel allowed us to underline the different activation sequences in the two main directions of the building. In particular, it is possible to identify a structural behavior governed by the bending failure of beams and columns in the Y direction and a behavior controlled by the shear failure of the joint in the Y direction.
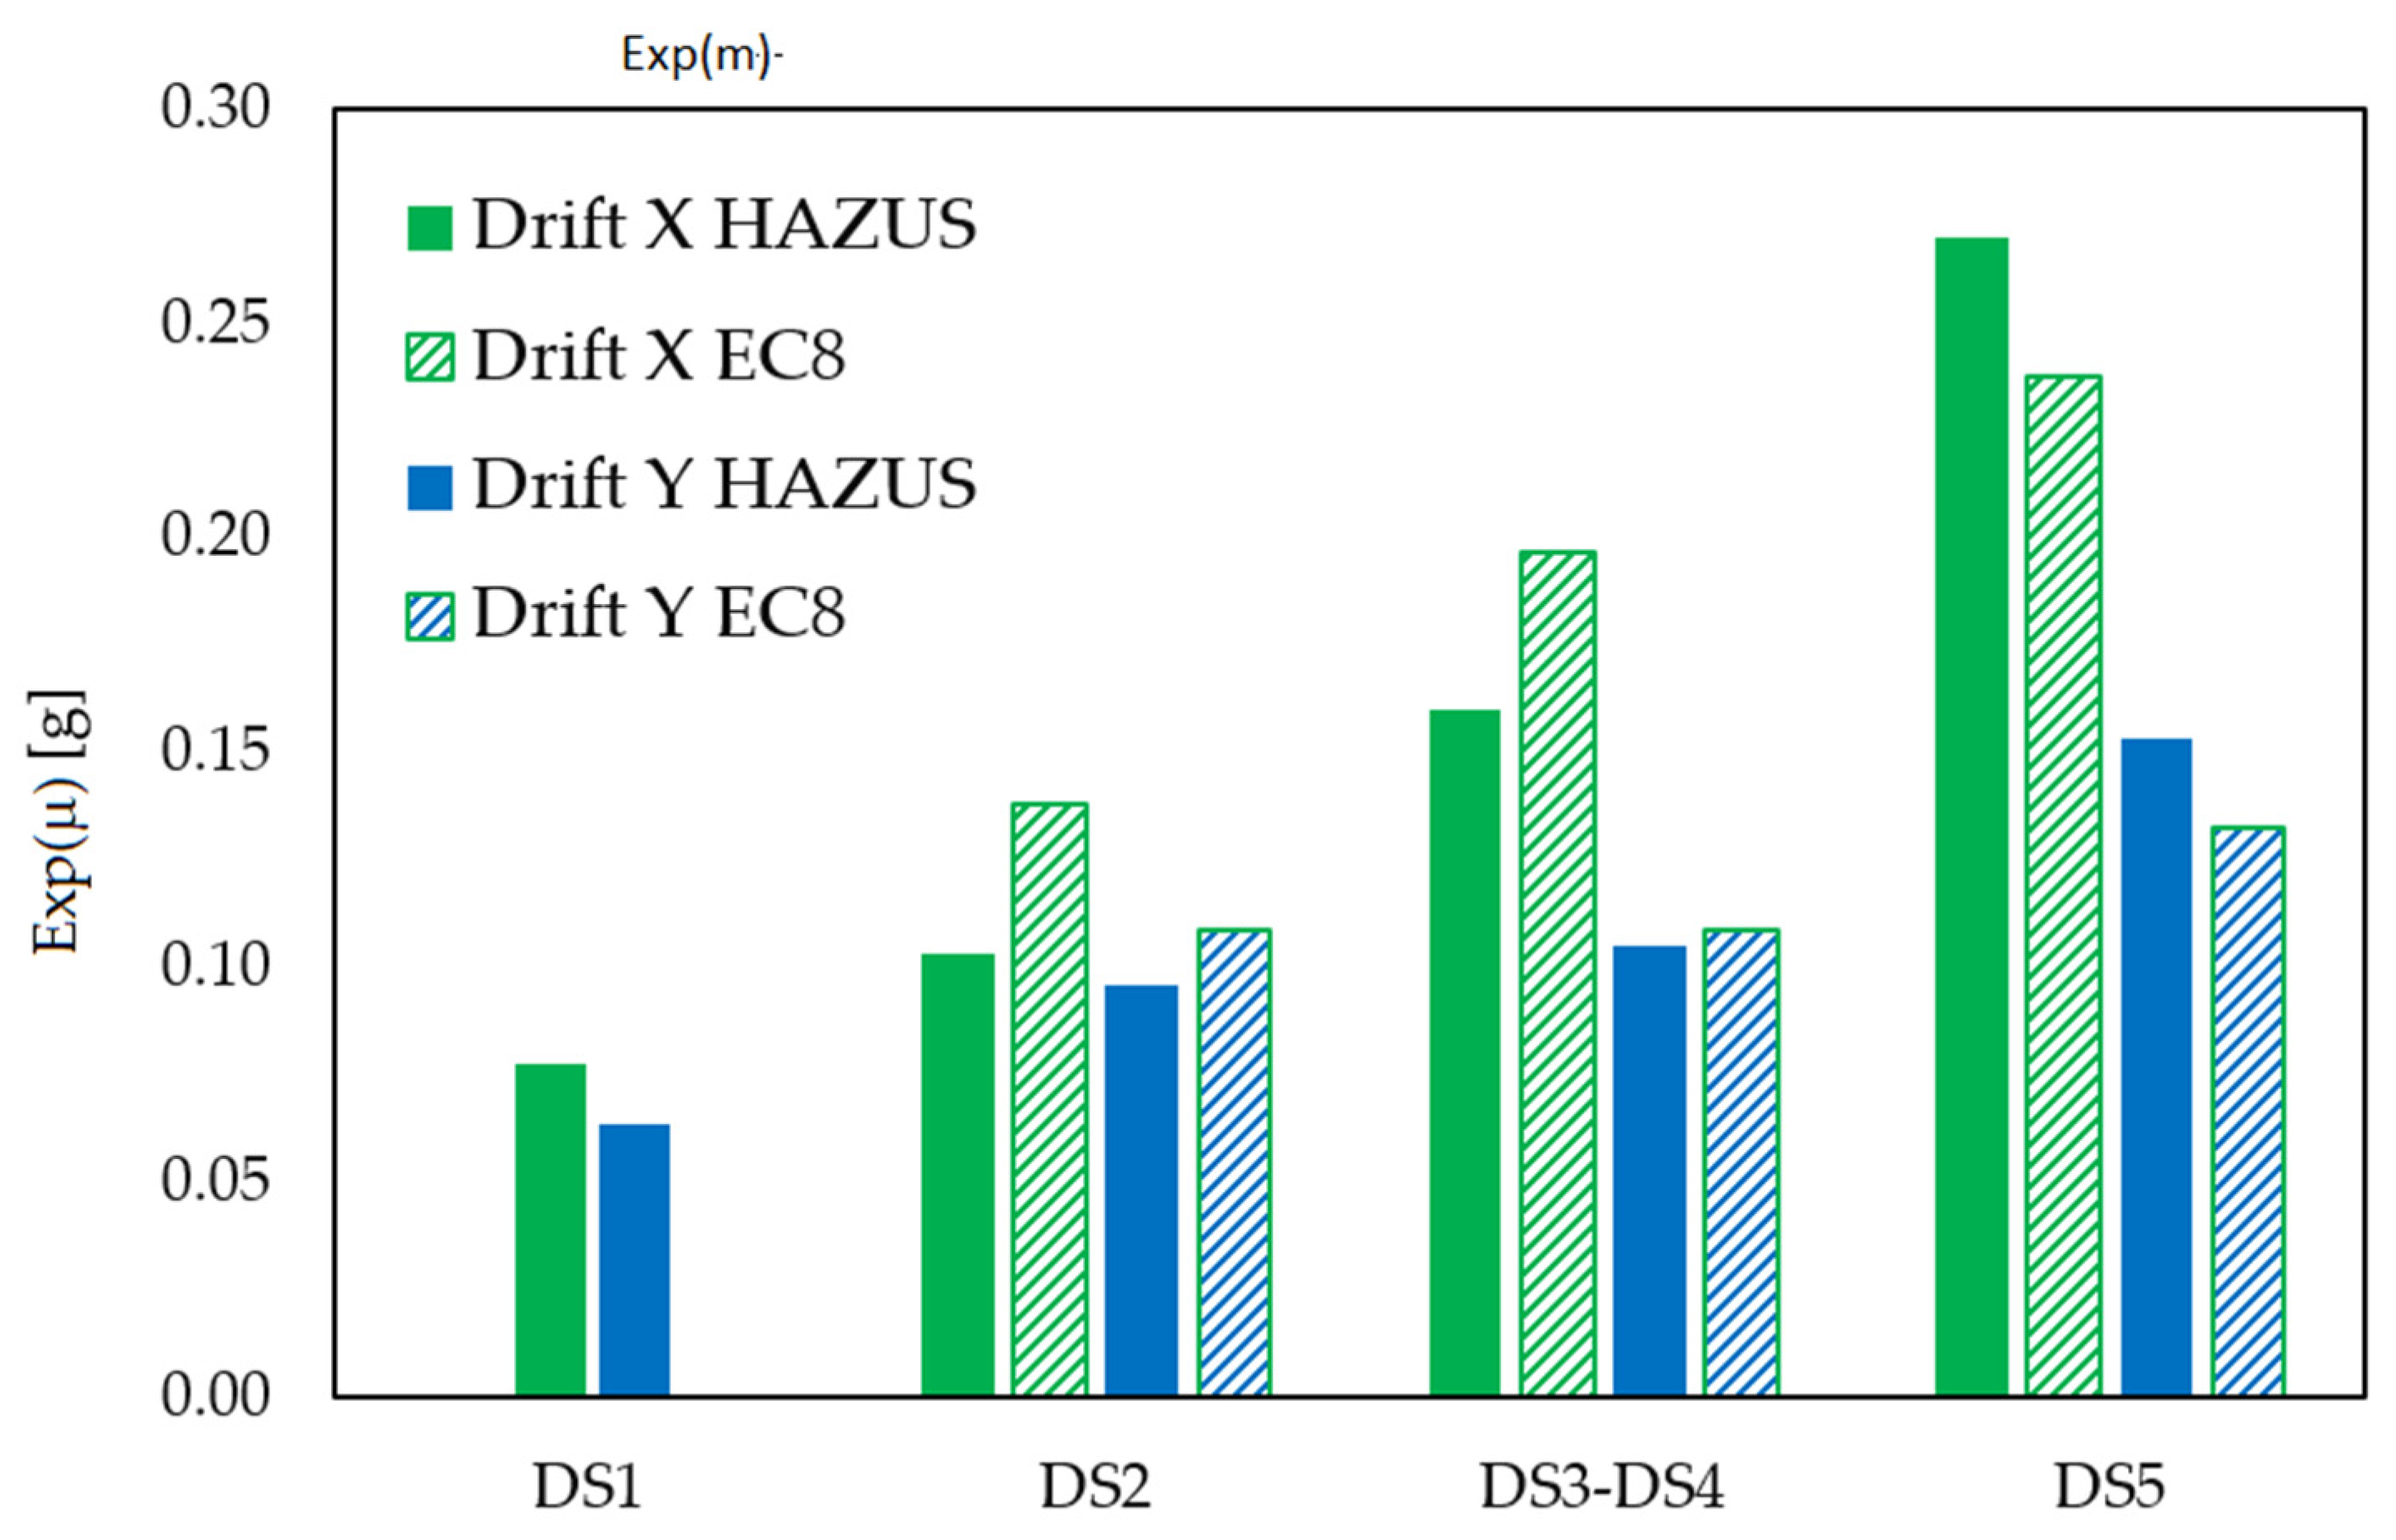
- The damage thresholds are defined following two criteria: the first one proposed by HAZUS-MH MR5 (2009), with given values of IDR depending on the different classes of RC frame buildings; the second one [46] is a local criterion in which the thresholds are defined on the basis of the ultimate and yielding rotation of columns. The adopted criteria significantly affect the fragility curves shape and the parameters values of the lognormal distribution adopted to fit the numerical points. In particular, for the damage state DS2–DS3 and DS4, the HAZUS criterion is more conservative, leading to a higher vulnerability characterized by lower median values of the parameter distribution. Contrarily, for DS5, the local criterion is more restrictive.
- Consistent with the numerical results, the fragility curves show a higher vulnerability for the Y direction of the building, with lognormal distribution median values lower than in X direction for both damage thresholds criteria. Nevertheless, with the local criterion, the slope of the functions is more marked, showing that the overcoming of the damage state occurs nearly always for the various time-history analyses and the different HLs.
Author Contributions
Funding
Data Availability Statement
Acknowledgments
Conflicts of Interest
References and Notes
- Masi, A.; Lagomarsino, S.; Dolce, M.; Manfredi, V.; Ottonelli, D. Towards the Updated Italian Seismic Risk Assessment: Exposure and Vulnerability Modelling; Springer: Dordrecht, The Netherlands, 2021; ISBN 0123456789. [Google Scholar]
- Ministero Infrastrutture e Trasporti Aggiornamento Delle Norme Tecniche per Le Costruzioni, di cui al Decreto 17 Gennaio 2018 (In Italian). 2018.
- EC8-3; Eurocode 8: Design of Structures for Earthquake Resistance—Part 3: Assessment and Retrofitting of Buildings. Comité Européen de Normalisation: Brussels, Belgium, 2005; ISBN 5935522004.
- Seismic, I.; Provisions, S. 2000 Edition Nehrp Recommended Provisions For Seismic Regulations For New Buildings; Commentary; Federal Emergency Management Agency, Government Printing Office: Washington, DC, USA, 2000; Volume 9.
- Cardone, D.; Perrone, G. Damage and Loss Assessment of Pre-70 RC Frame Buildings with FEMA P-58. J. Earthq. Eng. 2017, 21, 23–61. [Google Scholar] [CrossRef]
- Romano, F.; Faggella, M.; Gigliotti, R.; Zucconi, M.; Ferracuti, B. Comparative Seismic Loss Analysis of an Existing Non-Ductile RC Building Based on Element Fragility Functions Proposals. Eng. Struct. 2018, 177, 707–723. [Google Scholar] [CrossRef]
- De Risi, M.T.; Del Gaudio, C.; Verderame, G.M. Evaluation of Repair Costs for Masonry Infills in RC Buildings from Observed Damage Data: The Case-Study of the 2009 L’Aquila Earthquake. Buildings 2019, 9, 122. [Google Scholar] [CrossRef] [Green Version]
- Romano, F.; Alam, M.S.; Zucconi, M.; Faggella, M.; Barbosa, A.R.; Ferracuti, B. Seismic Demand Model Class Uncertainty in Seismic Loss Analysis for a Code-Designed URM Infilled RC Frame Building. Bull. Earthq. Eng. 2021, 19, 429–462. [Google Scholar] [CrossRef]
- Ligabue, V.; Pampanin, S.; Savoia, M. Seismic Performance of Alternative Risk-Reduction Retrofit Strategies to Support Decision Making. Bull. Earthq. Eng. 2018, 16, 3001–3030. [Google Scholar] [CrossRef]
- Ferracuti, B.; Savoia, M.; Zucconi, M. RC Frame Structures Retrofitted by FRP-Wrapping: A Model for Columns under Axial Loading and Cyclic Bending. Eng. Struct. 2020, 207, 110243. [Google Scholar] [CrossRef]
- Dolce, M.; Prota, A.; Borzi, B.; da Porto, F.; Lagomarsino, S.; Magenes, G.; Moroni, C.; Penna, A.; Polese, M.; Speranza, E.; et al. Seismic Risk Assessment of Residential Buildings in Italy. Bull. Earthq. Eng. 2020, 19, 2999–3032. [Google Scholar] [CrossRef]
- Zucconi, M.; Sorrentino, L. Census-Based Typological Damage Fragility Curves and Seismic Risk Scenarios for Unreinforced Masonry Buildings. Geosciences 2022, 12, 45. [Google Scholar] [CrossRef]
- Zucconi, M.; Di Ludovico, M.; Sorrentino, L. Census-Based Typological Usability Fragility Curves for Italian Unreinforced Masonry Buildings. Bull. Earthq. Eng. 2022, 1–20. [Google Scholar] [CrossRef]
- Sabene, M.; Zucconi, M.; Pampanin, S.; Ferracuti, B. Calibration and Numerical Modeling of Rc Beam-Column Joints Designed for Gravity Loads. In Proceedings of the COMPDYN 2021 8th International Conference on Computational Methods in Structural Dynamics and Earthquake Engineering Methods in Structural Dynamics and Earthquake Engineering, Athens, Greece, 28–30 June 2021; pp. 1085–1096. [Google Scholar]
- Zucconi, M.; Sabene, M.; Pampanin, S.; Ferracuti, B. Seismic Assessment of a RC Frame Building Designed for Gravity Loads Including Joint Deformation Capacity Model. In Proceedings of the 13th Fib International PhD Symposium in Civil Engineering, Paris, France, 21–22 July 2021; Gatuingt, F., Torrenti, J.-M., Eds.; pp. 218–225. [Google Scholar]
- Nguyen, P.-C.; Tran, T.-T.; Nghia-Nguyen, T. Nonlinear Time-History Earthquake Analysis for Steel Frames. Heliyon 2021, 7, e06832. [Google Scholar] [CrossRef]
- Sharma, A.; Eligehausen, R.; Reddy, G.R. A New Model to Simulate Joint Shear Behavior of Poorly Detailed Beam–Column Connections in RC Structures under Seismic Loads, Part I: Exterior Joints. Eng. Struct. 2011, 33, 1034–1051. [Google Scholar] [CrossRef]
- Sabene, M.; Zucconi, M.; Ferracuti, B.; Pampanin, S. Open Issues on Testing and Modeling Existing RC Beam—Column Joints. In Proceedings of the ICNAAM 2019—17th International Conference of Numerical Analysis and Applied Mathematics, Rhodes, Greece, 23–28 September 2019; AIP Conference Proceeding: Melville, NY, USA, 2019; pp. 5–8. [Google Scholar]
- Ozer, E.; Kamal, M.; Cayci, B.T.; Inel, M. Seismic Demand Estimates of Mid-Rise Rc Building Subjected To Code Compliant Earthquake Records. In Proceedings of the 16th European Conference on Earthquake Engineering, Thessaloniki, Greece, 18–21 June 2018; pp. 1–11. [Google Scholar]
- Unutmaz, B.; Sandikkaya, A.; Toker, K. Empirical Prediction Models for the Seismic Response. In Proceedings of the 16th European Conference on Earthquake Engineering, Thessaloniki, Greece, 18–21 June 2018; pp. 1–11. [Google Scholar]
- Baker, J.W. Measuring Bias in Structural Response Caused by Ground Motion Scaling. In Proceedings of the 8th Pacific Conference on Earthquake Engineering, Singapore, 5–7 December 2007; pp. 1–6. [Google Scholar] [CrossRef]
- Bovo, M.; Buratti, N. Evaluation of the Variability Contribution Due to Epistemic Uncertainty on Constitutive Models in the Definition of Fragility Curves of RC Frames. Eng. Struct. 2019, 188, 700–716. [Google Scholar] [CrossRef]
- De Stefano, M.; Faella, G. An Evaluation of the Inelastic Response of Systems under Biaxial Seismic Excitations. Eng. Struct. 1996, 18, 724–731. [Google Scholar] [CrossRef]
- Akkar, S.D.; Miranda, E. Statistical Evaluation of Approximate Methods for Estimating Maximum Deformation Demands on Existing Structures. J. Struct. Eng. 2005, 131, 160–172. [Google Scholar] [CrossRef] [Green Version]
- Bovo, M.; Savoia, M.; Praticò, L. Seismic Performance Assessment of a Multistorey Building Designed with an Alternative Capacity Design Approach. Adv. Civ. Eng. 2021, 2021, 5178065. [Google Scholar] [CrossRef]
- Baltzopoulos, G.; Baraschino, R.; Iervolino, I.; Vamvatsikos, D. SPO2FRAG: Software for Seismic Fragility Assessment Based on Static Pushover. Bull. Earthq. Eng. 2017, 15, 4399–4425. [Google Scholar] [CrossRef]
- Motamed, H.; Calderon, A.; Silva, V.; Costa, C. Development of a Probabilistic Earthquake Loss Model for Iran. Bull. Earthq. Eng. 2019, 17, 1795–1823. [Google Scholar] [CrossRef]
- Salman, K.; Tran, T.-T.; Kim, D. Seismic Capacity Evaluation of NPP Electrical Cabinet Facility Considering Grouping Effects. J. Nucl. Sci. Technol. 2020, 57, 800–812. [Google Scholar] [CrossRef]
- Vamvatsikos, D.; Cornell, C.A. Applied Incremental Dynamic Analysis. Earthq. Spectra 2004, 20, 523–553. [Google Scholar] [CrossRef]
- O’Reilly, G.J.; Sullivan, T.J. Modeling Techniques for the Seismic Assessment of the Existing Italian RC Frame Structures. J. Earthq. Eng. 2019, 23, 1262–1296. [Google Scholar] [CrossRef]
- Calvi, G.M.; Magenes, G.; Pampanin, S. Relevance of Beam-Column Joint Damage and Collapse in RC Frame Assessment. J. Earthq. Eng. 2002, 6, 75–100. [Google Scholar] [CrossRef]
- Pampanin, S.; Calvi, G.M. Seismic Behaviour of R.C. Beam-Column Joints Designed for Gravity Loads. In Proceedings of the 12th European Conference on Earthquake Engineering, London UK, 9–13 September 2002; Volume 726, pp. 1–10. [Google Scholar]
- Ruiz-Pinilla, J.G.; Adam, J.M.; Pérez-Cárcel, R.; Yuste, J.; Moragues, J.J. Learning from RC Building Structures Damaged by the Earthquake in Lorca, Spain, in 2011. Eng. Fail. Anal. 2016, 68, 76–86. [Google Scholar] [CrossRef]
- Jeon, J.-S.; Park, J.-H.; DesRoches, R. Seismic Fragility of Lightly Reinforced Concrete Frames with Masonry Infills. Earthq. Eng. Struct. Dyn. 2015, 44, 1783–1803. [Google Scholar] [CrossRef]
- Mohammad, A.F.; Faggella, M.; Gigliotti, R.; Spacone, E. Seismic Performance of Older R/C Frame Structures Accounting for Infills-Induced Shear Failure of Columns. Eng. Struct. 2016, 122, 1–13. [Google Scholar] [CrossRef]
- Ministero Infrastrutture e Trasporti Regio Decreto 16/11/1939 n. 2229—Norme per La Esecuzione Delle Opere in Conglomerato Cementizio Semplice Od Armato (In Italian). 1939.
- Pacific Earthquake Engineering Research Center (PEER) PEER Ground Motion Database. Available online: https://ngawest2.berkeley.edu/ (accessed on 1 May 2021).
- Mazzoni, S.; McKenna, F.; Scott, M.H.; Fenves, G.L. OpenSees Command Language Manual. Pacific Earthq. Eng. Res. Cent. 2006, 264, 137–158. [Google Scholar]
- Elwood, K.J.; Moehle, J.P. Shake Table Tests and Analytical Studies on the Gravity Load Collapse of Reinforced Concrete Frames. Ph.D. Thesis, University of California, Berkeley, CA, USA, November 2003. [Google Scholar]
- Pampanin, S.; Magenes, G.; Carr, A.J. Modelling of Shear Hinge Mechanism in Poorly Detailed RC Beam-Column Joints. In Proceedings of the FIB Symposium 2003: Concrete Structures in Seismic Regions, Athens, Greece, 6–8 May 2003; p. 171. [Google Scholar]
- Saiidi, M. Modeling of R/C Joints under Cyclic Excitations. J. Struct. Eng. 1984, 110, 3068–3070. [Google Scholar] [CrossRef]
- Masi, A.; Santarsiero, G.; Lignola, G.P.; Verderame, G.M. Study of the Seismic Behavior of External RC Beam-Column Joints through Experimental Tests and Numerical Simulations. Eng. Struct. 2013, 52, 207–219. [Google Scholar] [CrossRef]
- Baker, J.W. Efficient Analytical Fragility Function Fitting Using Dynamic Structural Analysis. Earthq. Spectra 2015, 31, 579–599. [Google Scholar] [CrossRef]
- Iervolino, I. Estimation Uncertainty for Some Common Seismic Fragility Curve Fitting Methods. Soil Dyn. Earthq. Eng. 2022, 152, 107068. [Google Scholar] [CrossRef]
- Buratti, N.; Minghini, F.; Ongaretto, E.; Savoia, M.; Tullini, N. Empirical Seismic Fragility for the Precast RC Industrial Buildings Damaged by the 2012 Emilia (Italy) Earthquakes. Earthq. Eng. Struct. Dyn. 2017, 46, 2317–2335. [Google Scholar] [CrossRef]
- Porter, K. A Beginner ’s Guide to Fragility, Vulnerability, and Risk; University of Colorado: Boulder, CO, USA, 2020; Volume 16, ISBN 9780387938363. [Google Scholar]
- Zucconi, M.; Ferlito, R.; Sorrentino, L. Typological Damage Fragility Curves for Unreinforced Masonry Buildings Affected by the 2009 L’Aquila, Italy Earthquake. Open Civ. Eng. J. 2021, 15, 117–134. [Google Scholar] [CrossRef]
- FEMA. Hazus—MH MR5 Technical Manual; Federal Emergency Management Agency: Washington, DC, USA, 2009. [Google Scholar]
- Borzi, B.; Pinho, R.; Crowley, H. Simplified Pushover-Based Vulnerability Analysis for Large-Scale Assessment of RC Buildings. Eng. Struct. 2008, 30, 804–820. [Google Scholar] [CrossRef]


| No. | Event Name | Station | M * | R ** [km] | Mech. *** | PGA1 [g] | PGA2 [g] |
|---|---|---|---|---|---|---|---|
| 1 | San Fernando, 1971 | LA-Hollywood Stor FF | 6.61 | 22.77 | R | 0.225 | 0.163 |
| 2 | Imperial Valley-06, 1979 | Parachute Test Site | 6.53 | 12.69 | SS | 0.113 | 0.206 |
| 3 | Superstition Hills-02, 1987 | Brawley Airport | 6.54 | 17.03 | SS | 0.131 | 0.111 |
| 4 | Superstition Hills-02, 1987 | Poe Road (temp) | 6.54 | 11.16 | SS | 0.475 | 0.286 |
| 5 | Spitak_Armenia, 1988 | Gukasian | 6.77 | 23.99 | RO | 0.200 | 0.174 |
| 6 | Loma Prieta, 1989 | Coyote Lake Dam-SW | 6.93 | 19.97 | RO | 0.132 | 0.280 |
| 7 | Loma Prieta, 1989 | Fremont—Emerson Court | 6.93 | 39.66 | RO | 0.192 | 0.099 |
| 8 | Landers, 1992 | Mission Creek Fault | 7.28 | 26.96 | SS | 0.097 | 0.132 |
| 9 | Northridge-01, 1994 | LA—Pico & Sentous | 6.69 | 27.82 | R | 0.103 | 0.186 |
| 10 | Northridge-01, 1994 | LA—S. Vermont Ave | 6.69 | 27.89 | R | 0.137 | 0.068 |
| 11 | Northridge-01, 1994 | LA—Temple & Hope | 6.69 | 28.82 | R | 0.124 | 0.165 |
| 12 | Kobe_Japan, 1995 | Abeno | 6.90 | 24.85 | SS | 0.149 | 0.231 |
| 13 | Denali_Alaska, 2002 | Carlo (temp) | 7.90 | 49.94 | SS | 0.081 | 0.084 |
| 14 | San Simeon_CA, 2003 | Cambria-Hwy1 Caltrans Bridge | 6.52 | 6.97 | R | 0.179 | 0.126 |
| 15 | Niigata_Japan, 2004 | FKS028 | 6.63 | 30.11 | R | 0.135 | 0.170 |
| 16 | Niigata_Japan, 2004 | NIG023 | 6.63 | 25.33 | R | 0.405 | 0.248 |
| 17 | Chuetsu-oki_Japan, 2007 | Nadachiku Joetsu City | 6.80 | 35.79 | R | 0.119 | 0.155 |
| 18 | Chuetsu-oki_Japan, 2007 | Tokamachi Chitosecho | 6.80 | 25.35 | R | 0.201 | 0.251 |
| 19 | Chuetsu-oki_Japan, 2007 | Kawaguchi | 6.80 | 23.63 | R | 0.147 | 0.147 |
| 20 | Chuetsu-oki_Japan, 2007 | NIG022 | 6.80 | 37.79 | R | 0.155 | 0.126 |
| 21 | Iwate_Japan, 2008 | IWT010 | 6.90 | 16.26 | R | 0.226 | 0.289 |
| 22 | Iwate_Japan, 2008 | Kami_ Miyagi Miyazaki City | 6.90 | 25.15 | R | 0.117 | 0.156 |
| 23 | Iwate_Japan, 2008 | Iwadeyama | 6.90 | 20.77 | R | 0.269 | 0.354 |
| 24 | Iwate_Japan, 2008 | Oomagari Hanazono-cho_Daisen | 6.90 | 46.32 | R | 0.093 | 0.127 |
| 25 | Iwate_Japan, 2008 | Mizusawaku Interior O ganecho | 6.90 | 7.82 | R | 0.361 | 0.257 |
| 26 | Darfield_New Zealand, 2010 | DFHS | 7.00 | 11.86 | SS | 0.275 | 0.333 |
| 27 | Darfield_New Zealand, 2010 | DORC | 7.00 | 29.96 | SS | 0.070 | 0.084 |
| 28 | Darfield_New Zealand, 2010 | OXZ | 7.00 | 30.63 | SS | 0.119 | 0.105 |
| 29 | Darfield_New Zealand, 2010 | RKAC | 7.00 | 13.37 | SS | 0.167 | 0.191 |
| 30 | Cucapah_Mexico, 2010 | El Centro Array #4 | 7.20 | 35.08 | SS | 0.238 | 0.310 |
| Reference | DS1 | DS2 | DS3–DS4 | DS5 |
|---|---|---|---|---|
| HAZUS MH-MR5 TM (2009) | 0.4% | 0.6% | 1.6% | 4.0% |
| Chord Rotation CR [49] | - | 1.1% (θy) | 2.5% (3/4 θu) | 3.3% (θu) |
| HAZUS | CR Criterion | |||||||
|---|---|---|---|---|---|---|---|---|
| Damage State | Drift X | Drift Y | Drift X | Drift Y | ||||
| Exp(μ) [g] | β | Exp(μ) [g] | β | Exp(μ) [g] | β | Exp(μ) [g] | β | |
| DS1 | 0.078 | 0.213 | 0.064 | 0.207 | - | - | - | - |
| DS2 | 0.103 | 0.213 | 0.096 | 0.207 | 0.138 | 0.196 | 0.109 | 0.067 |
| DS3–DS4 | 0.160 | 0.338 | 0.105 | 0.207 | 0.197 | 0.306 | 0.109 | 0.067 |
| DS5 | 0.270 | 0.338 | 0.153 | 0.207 | 0.238 | 0.368 | 0.133 | 0.054 |
Publisher’s Note: MDPI stays neutral with regard to jurisdictional claims in published maps and institutional affiliations. |
© 2022 by the authors. Licensee MDPI, Basel, Switzerland. This article is an open access article distributed under the terms and conditions of the Creative Commons Attribution (CC BY) license (https://creativecommons.org/licenses/by/4.0/).
Share and Cite
Zucconi, M.; Bovo, M.; Ferracuti, B. Fragility Curves of Existing RC Buildings Accounting for Bidirectional Ground Motion. Buildings 2022, 12, 872. https://doi.org/10.3390/buildings12070872
Zucconi M, Bovo M, Ferracuti B. Fragility Curves of Existing RC Buildings Accounting for Bidirectional Ground Motion. Buildings. 2022; 12(7):872. https://doi.org/10.3390/buildings12070872
Chicago/Turabian StyleZucconi, Maria, Marco Bovo, and Barbara Ferracuti. 2022. "Fragility Curves of Existing RC Buildings Accounting for Bidirectional Ground Motion" Buildings 12, no. 7: 872. https://doi.org/10.3390/buildings12070872