
Flange Contribution to the Shear Strength of RC T-Beams with Flange in Compression


Abstract
:1. Introduction
2. Research Significance
3. Experimental Work
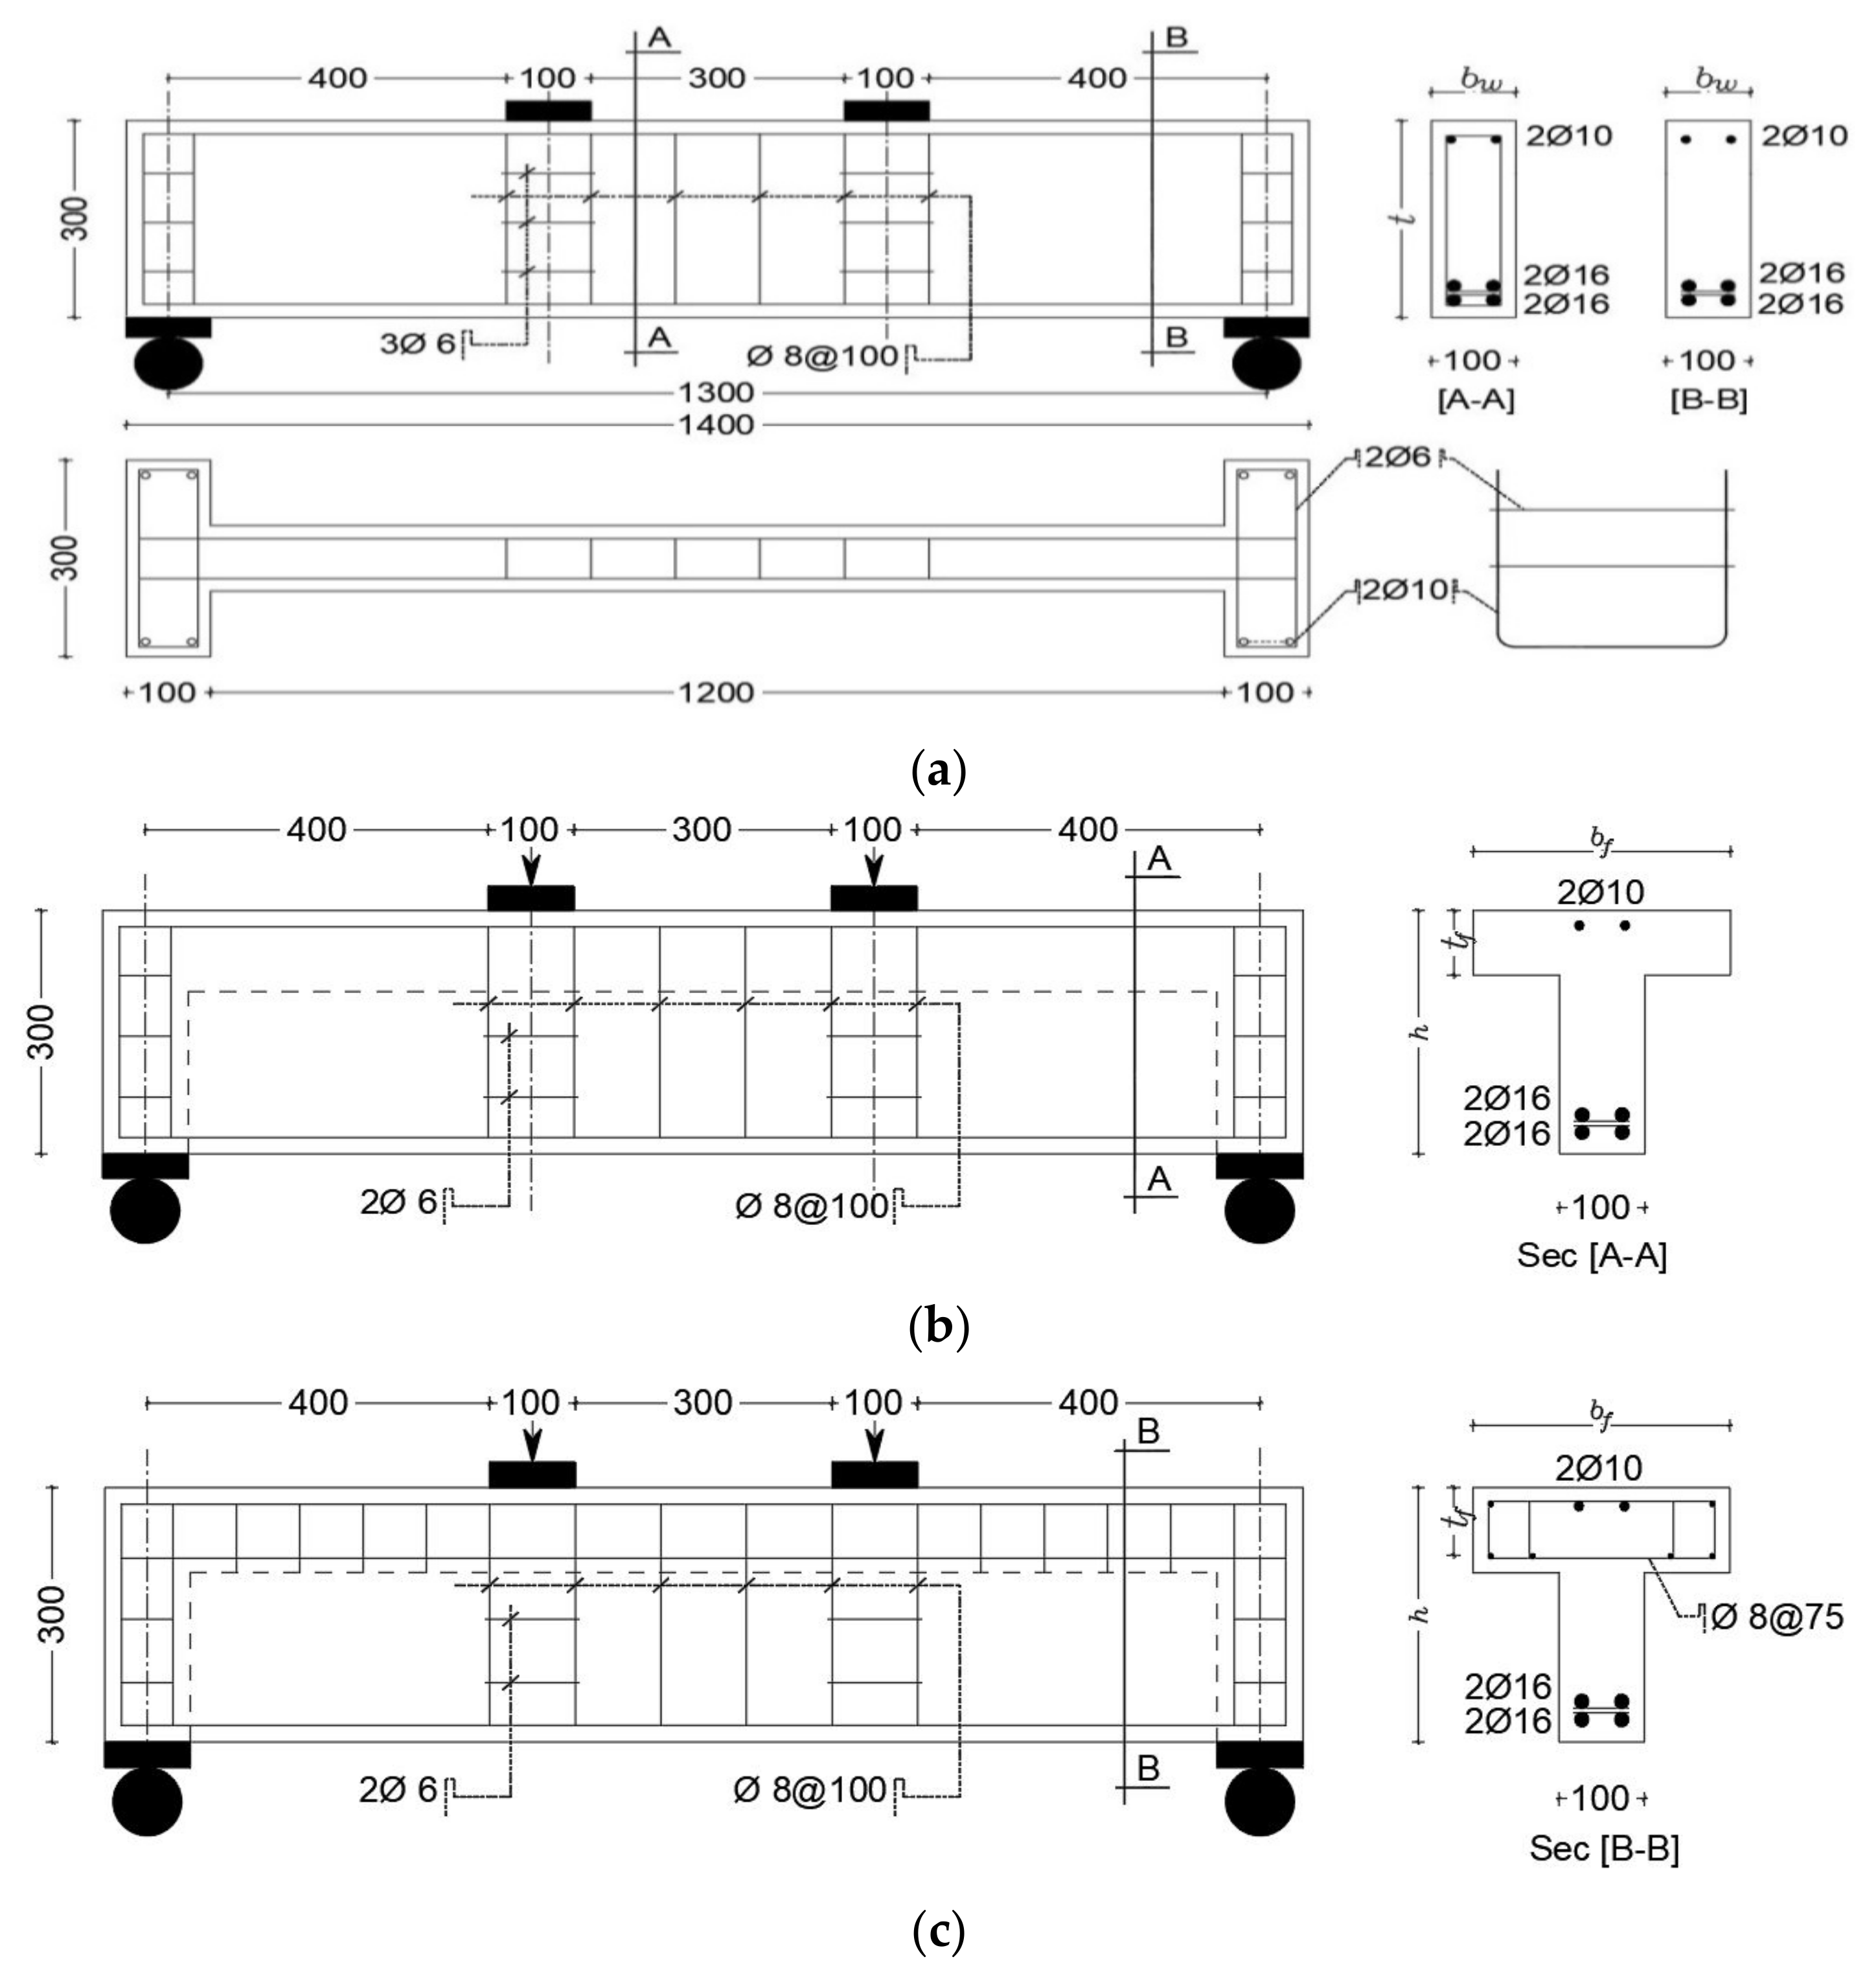
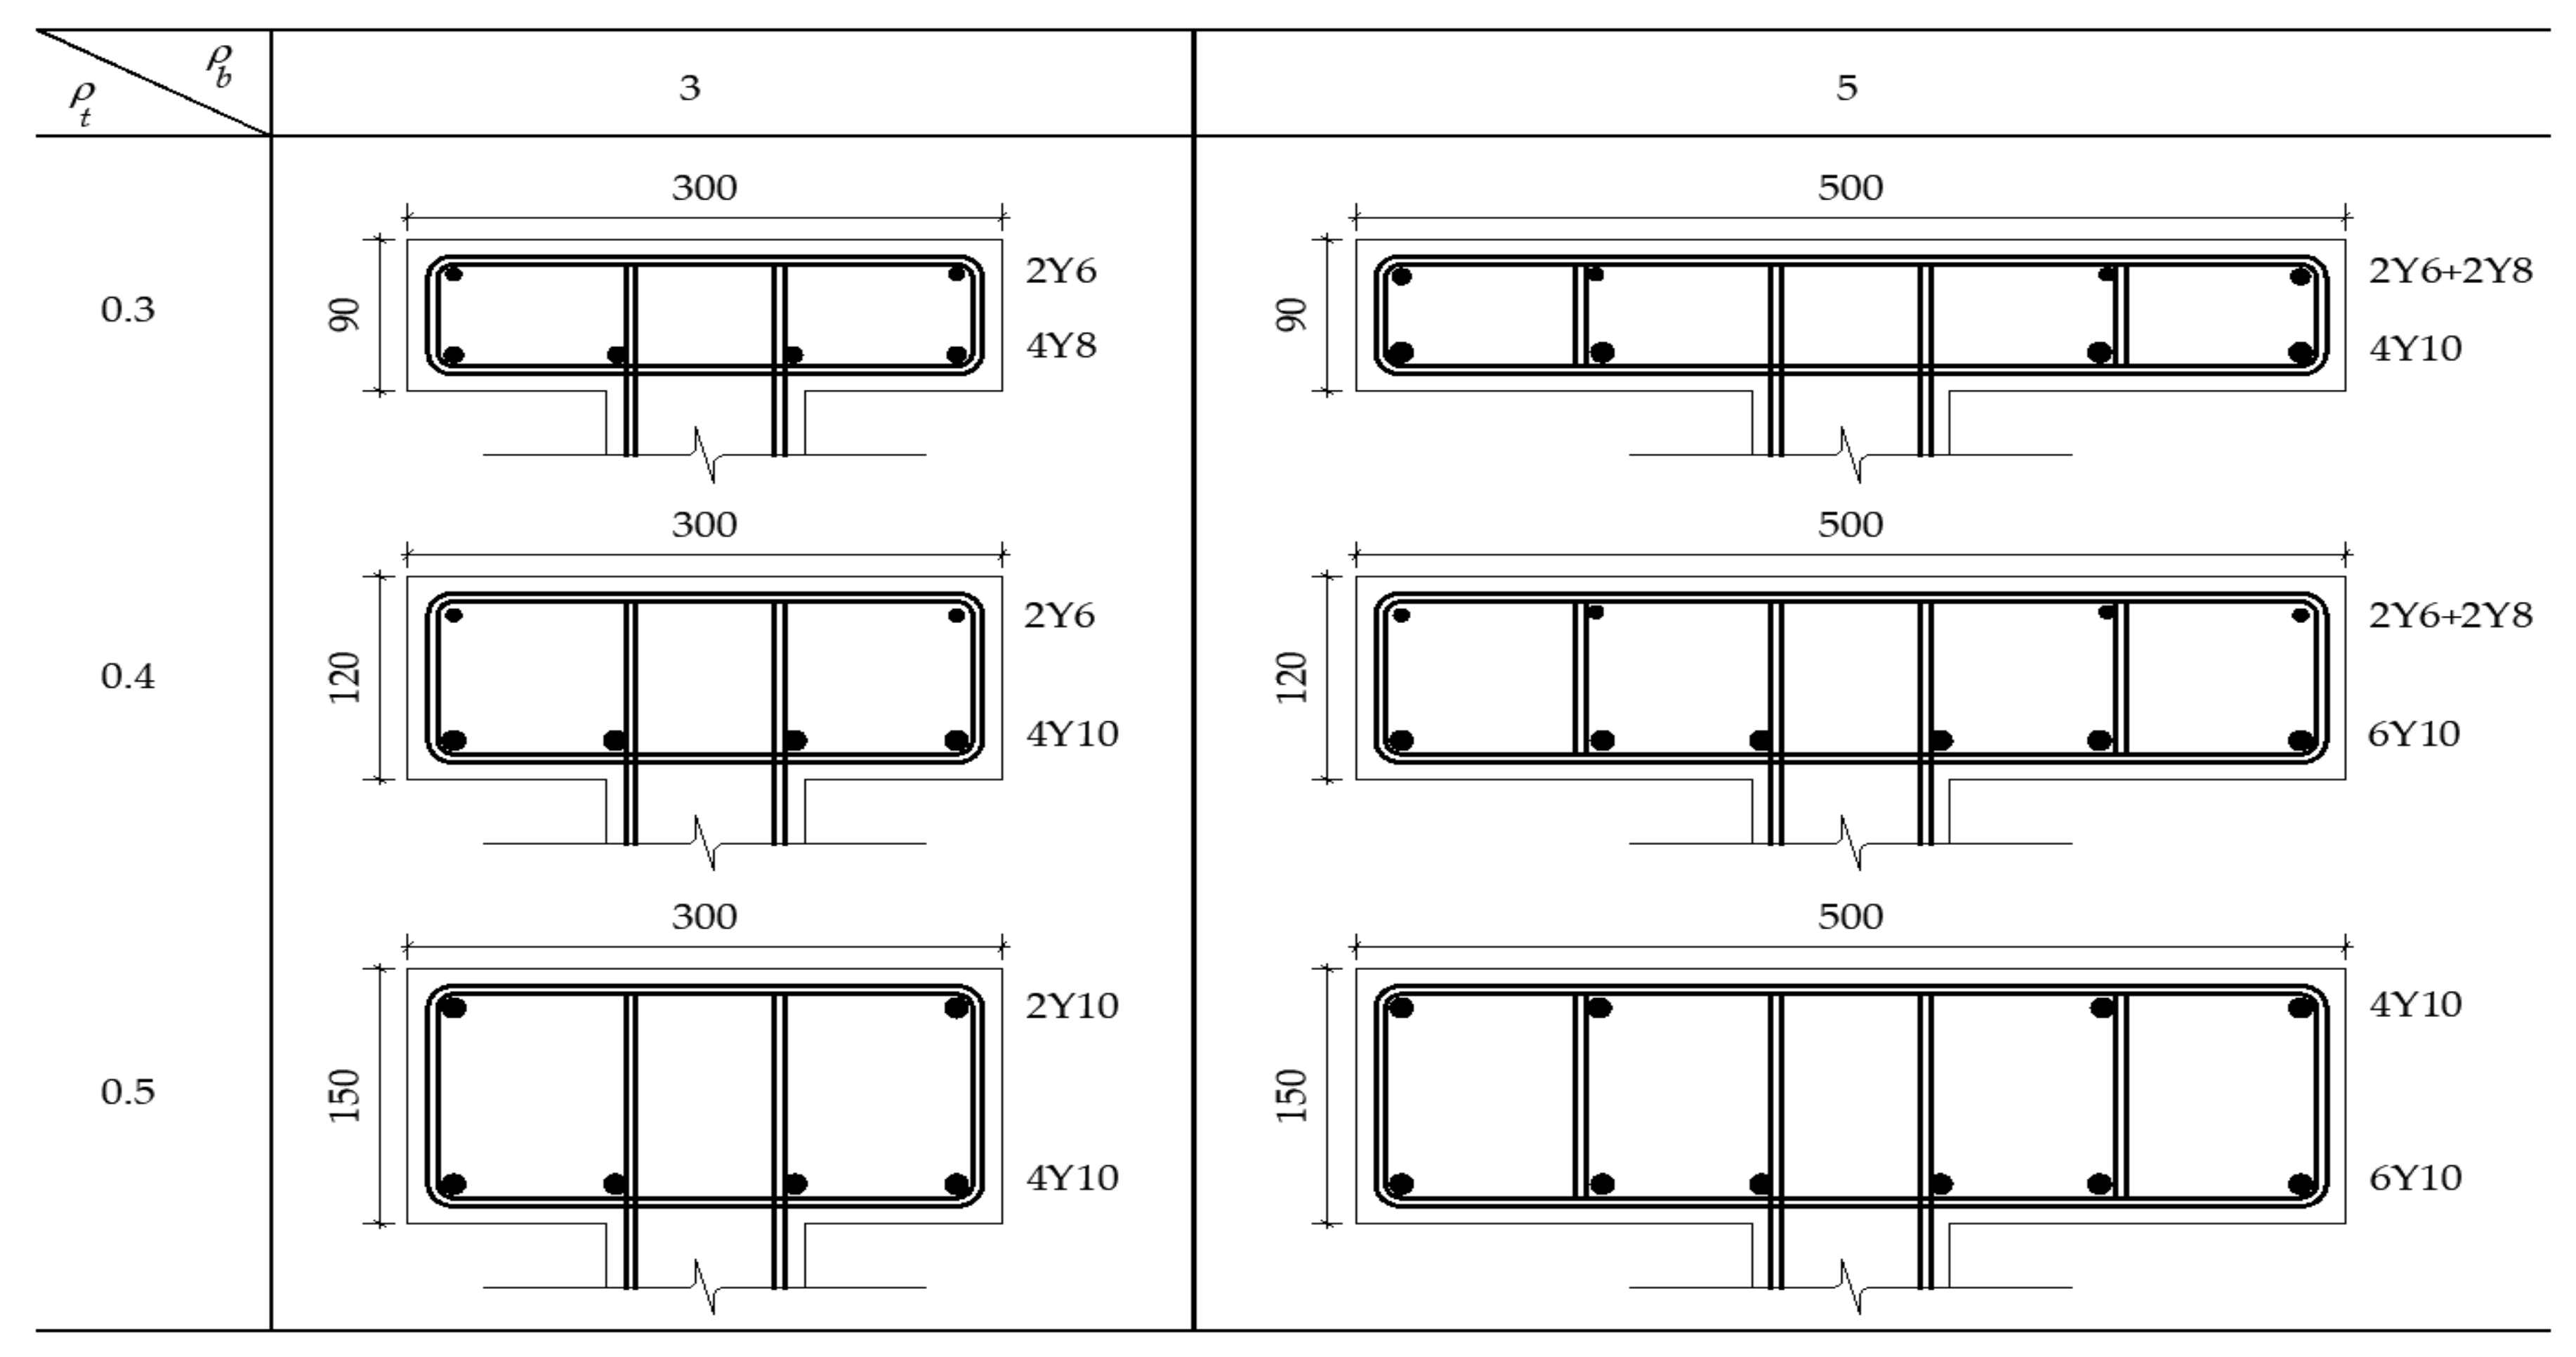
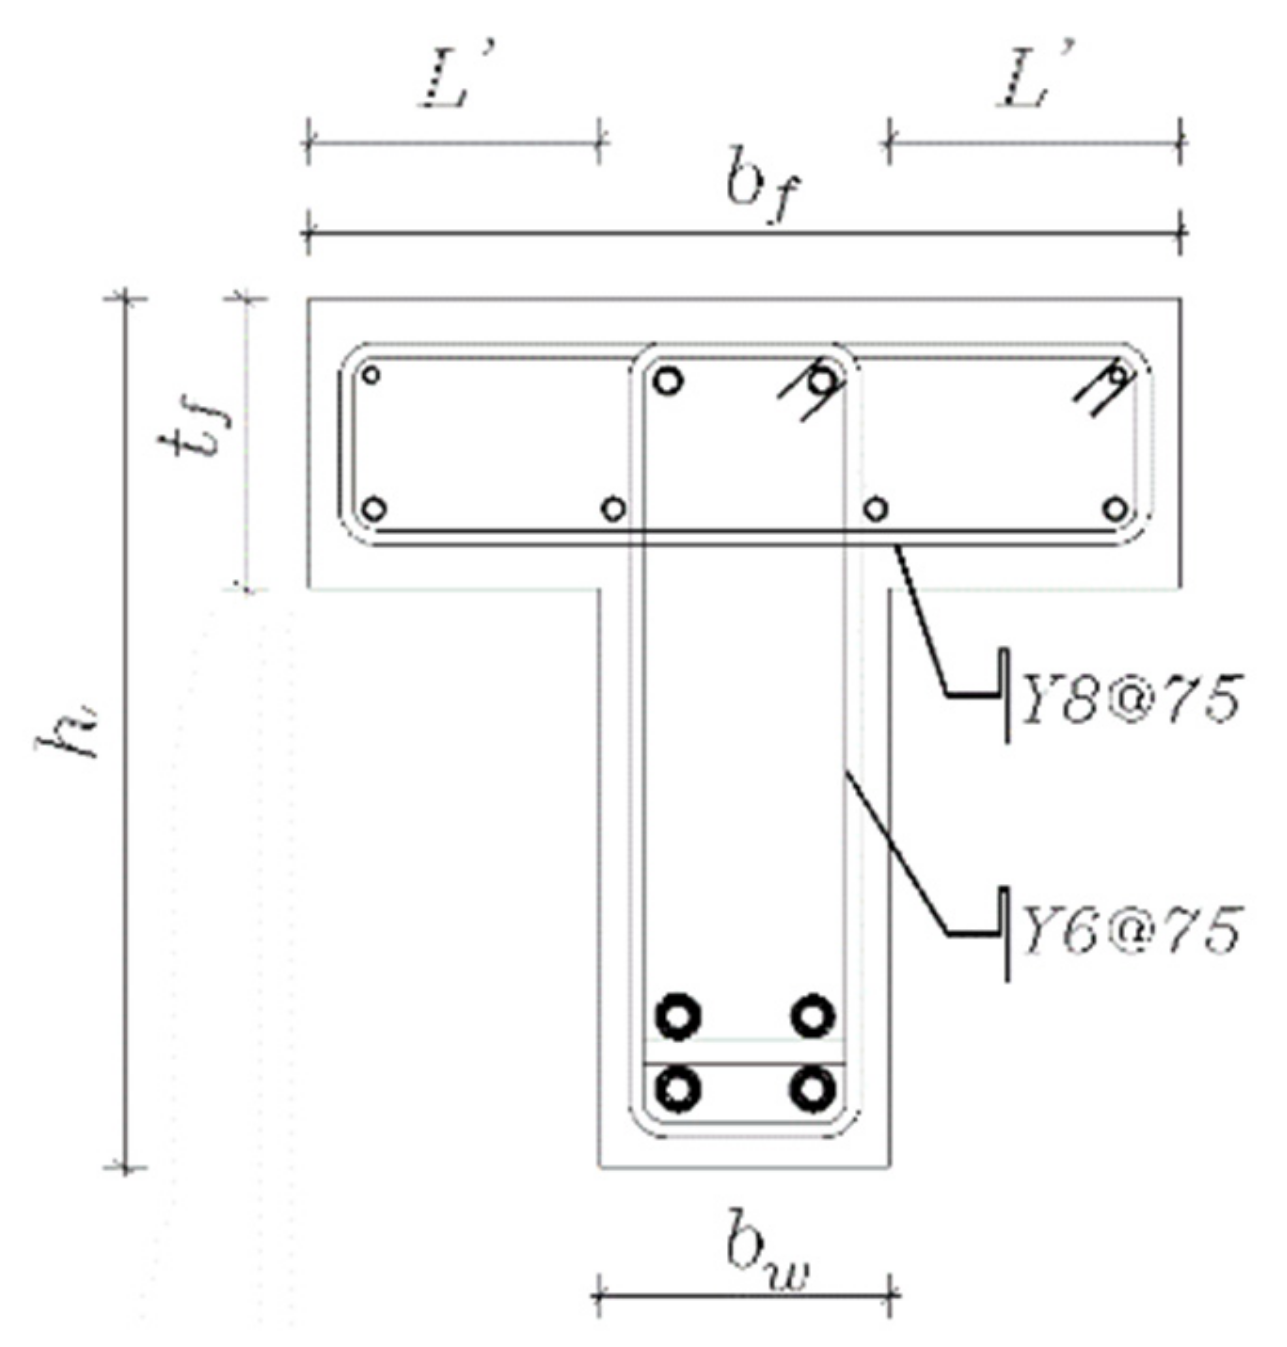
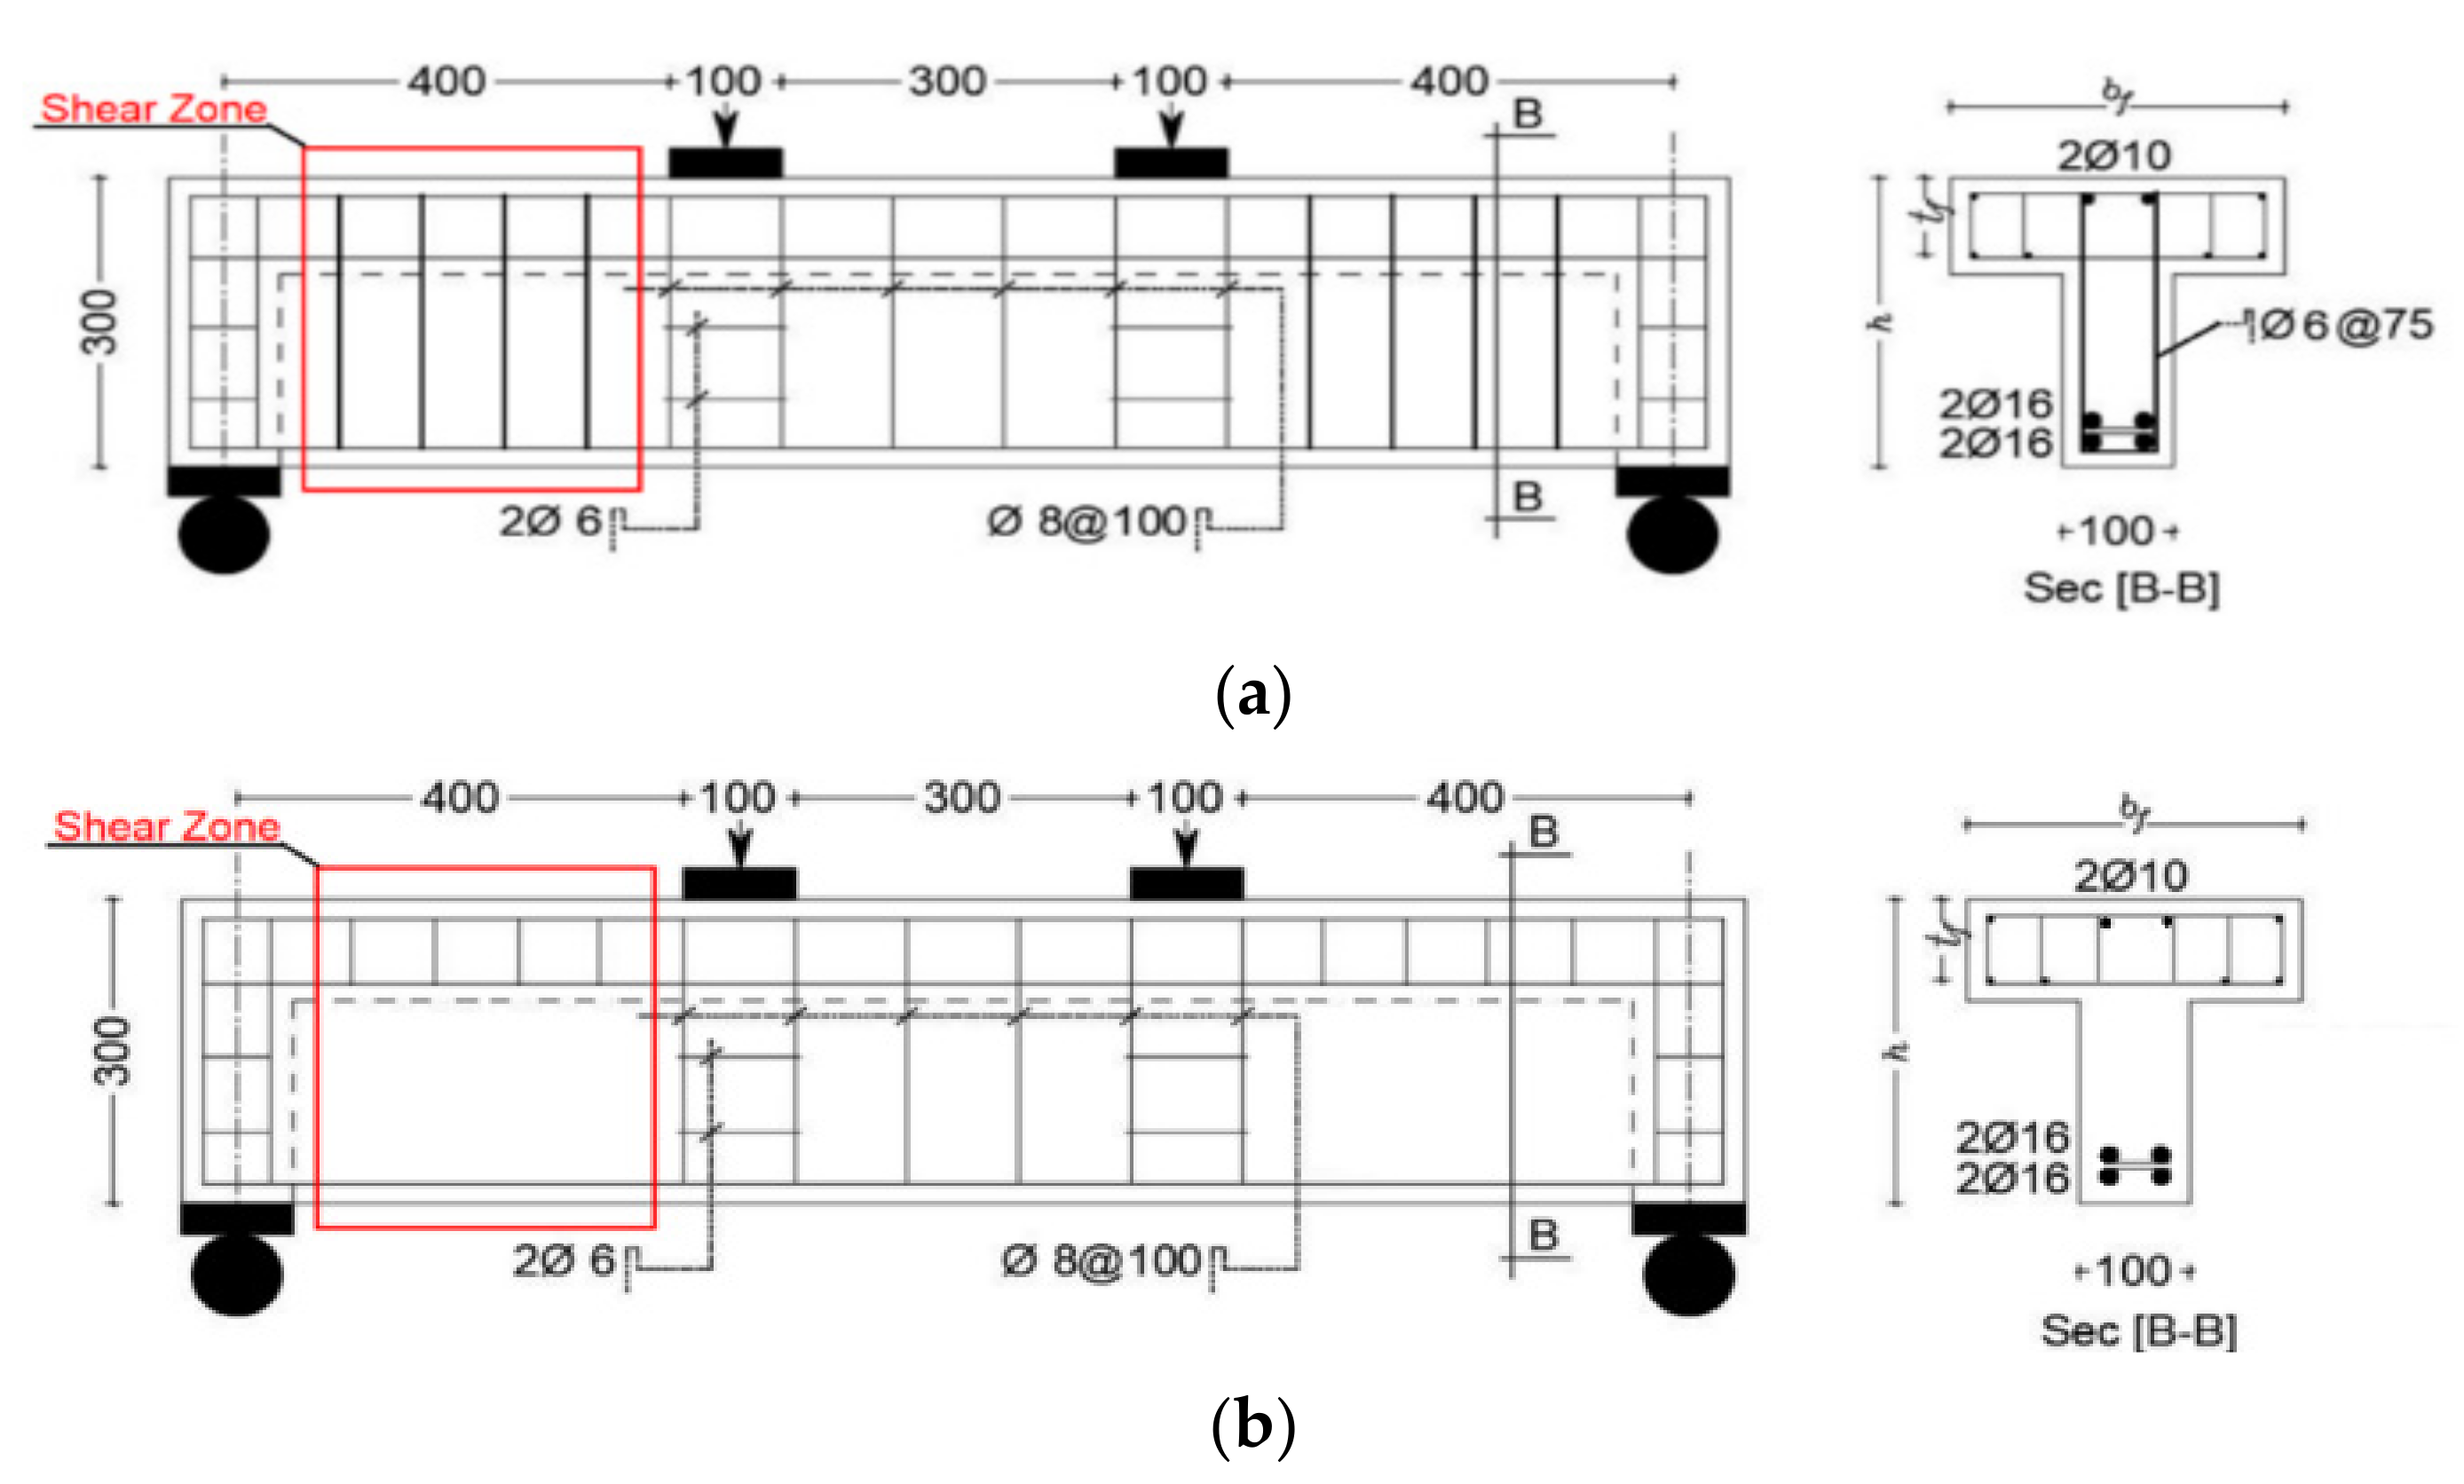
3.1. Test Program
3.2. Material Properties
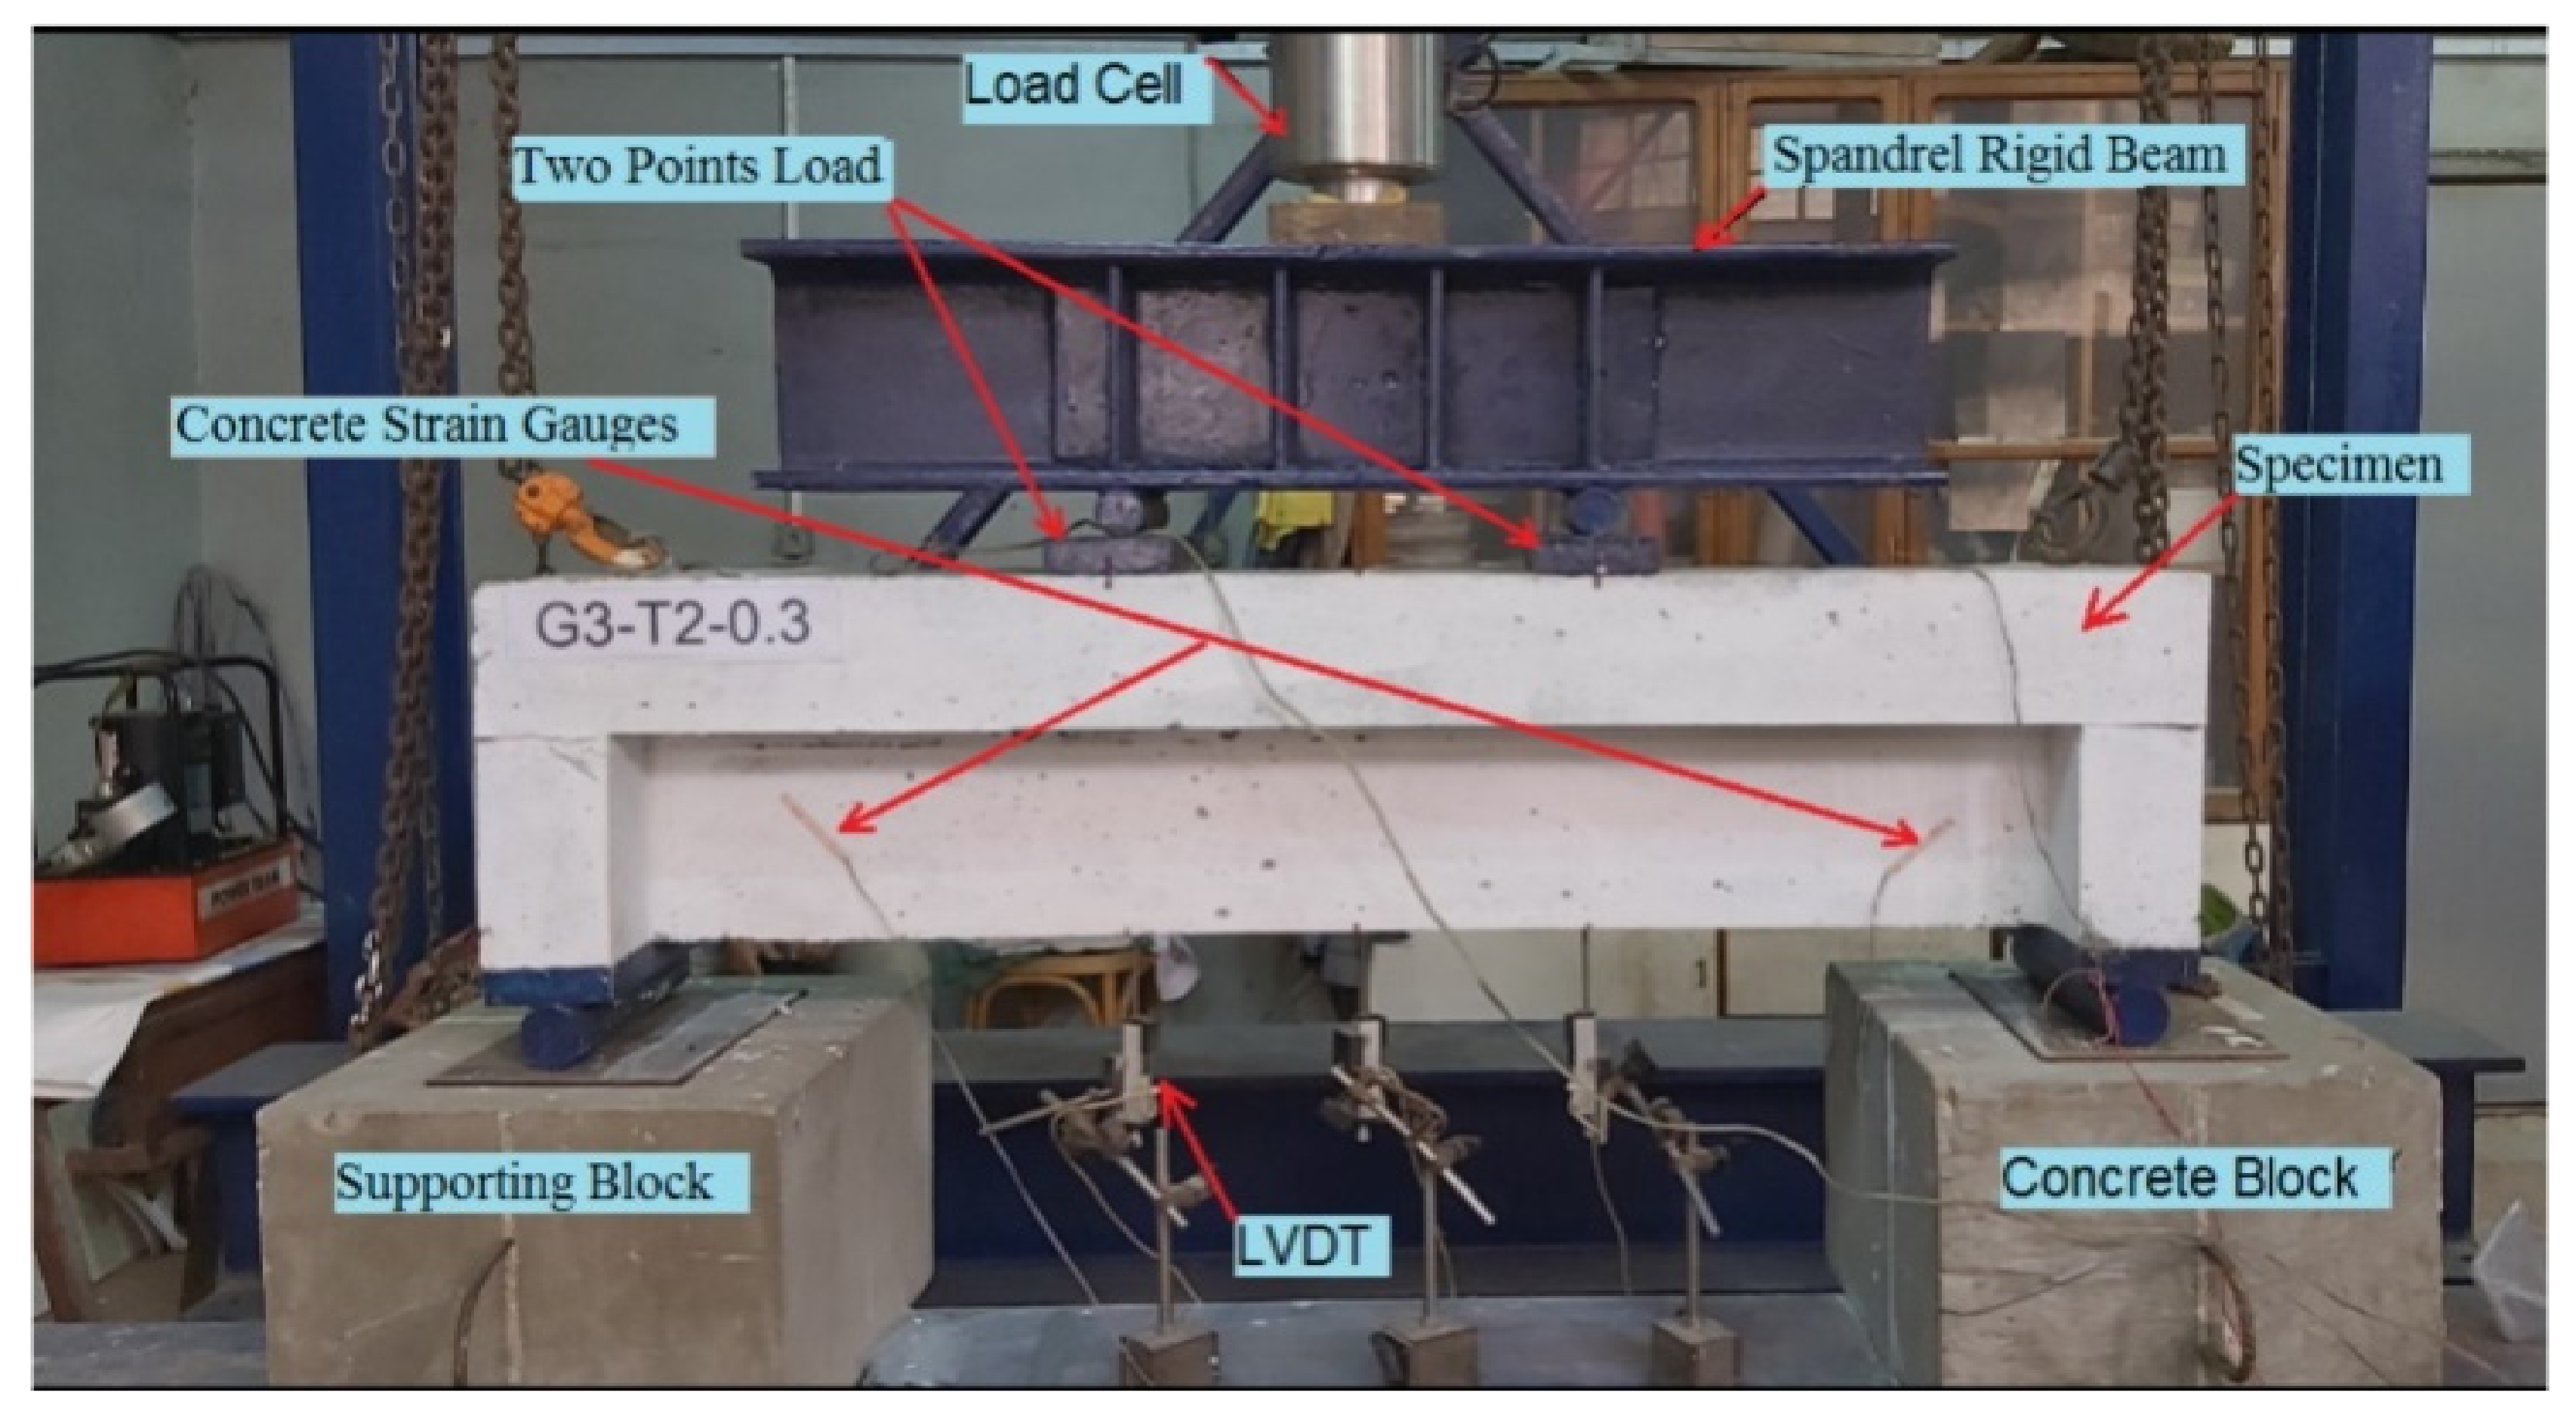
3.3. Test Setup and Instrumentation
4. Results
- The load at collapse and the profit in capacity due to the flange dimensions and reinforcement.
- The load versus deflection relationship.
- The cracking pattern and failure modes.
- The strains in the concrete and in flange longitudinal steel.
4.1. The Effect of Web Reinforcement
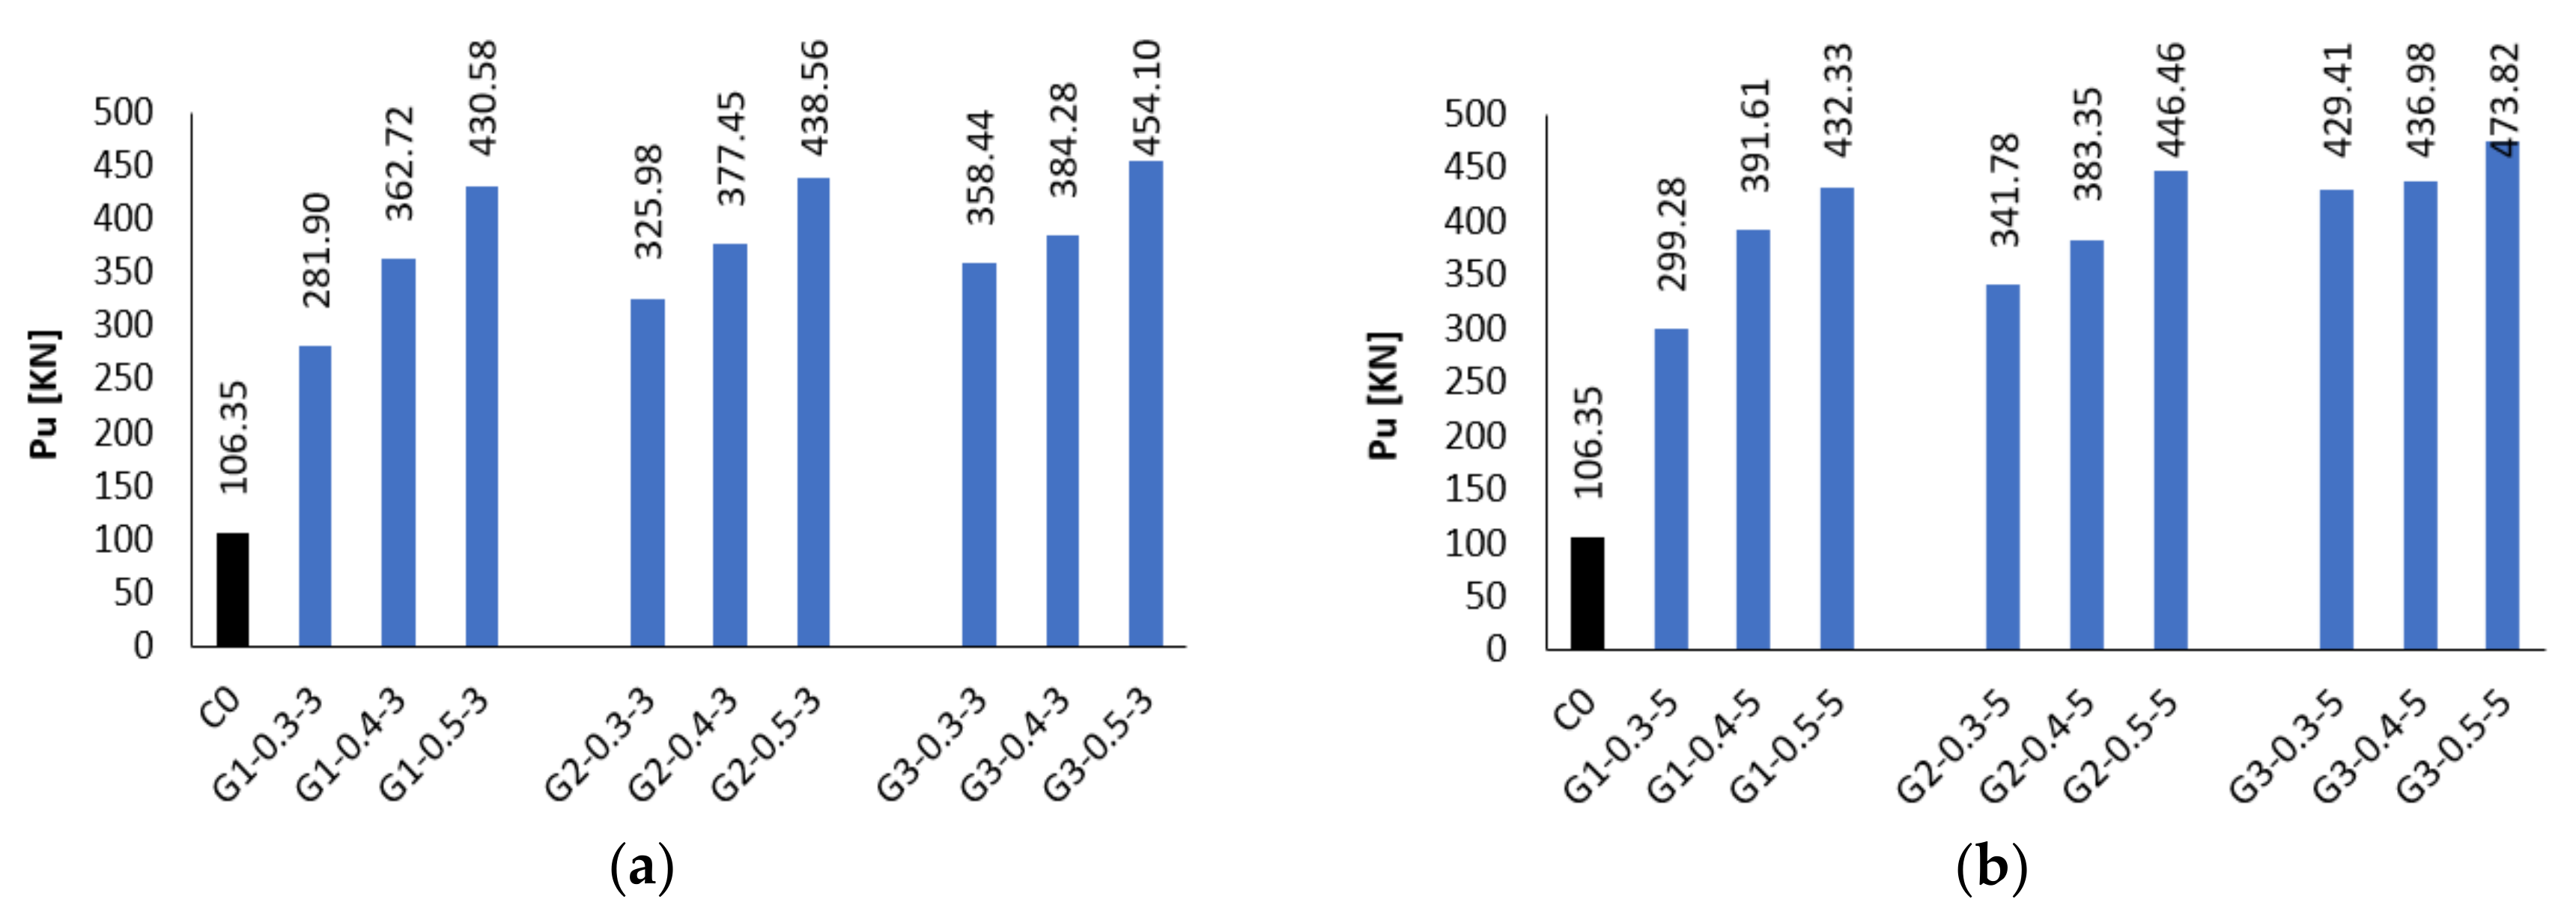
4.2. Ultimate Load
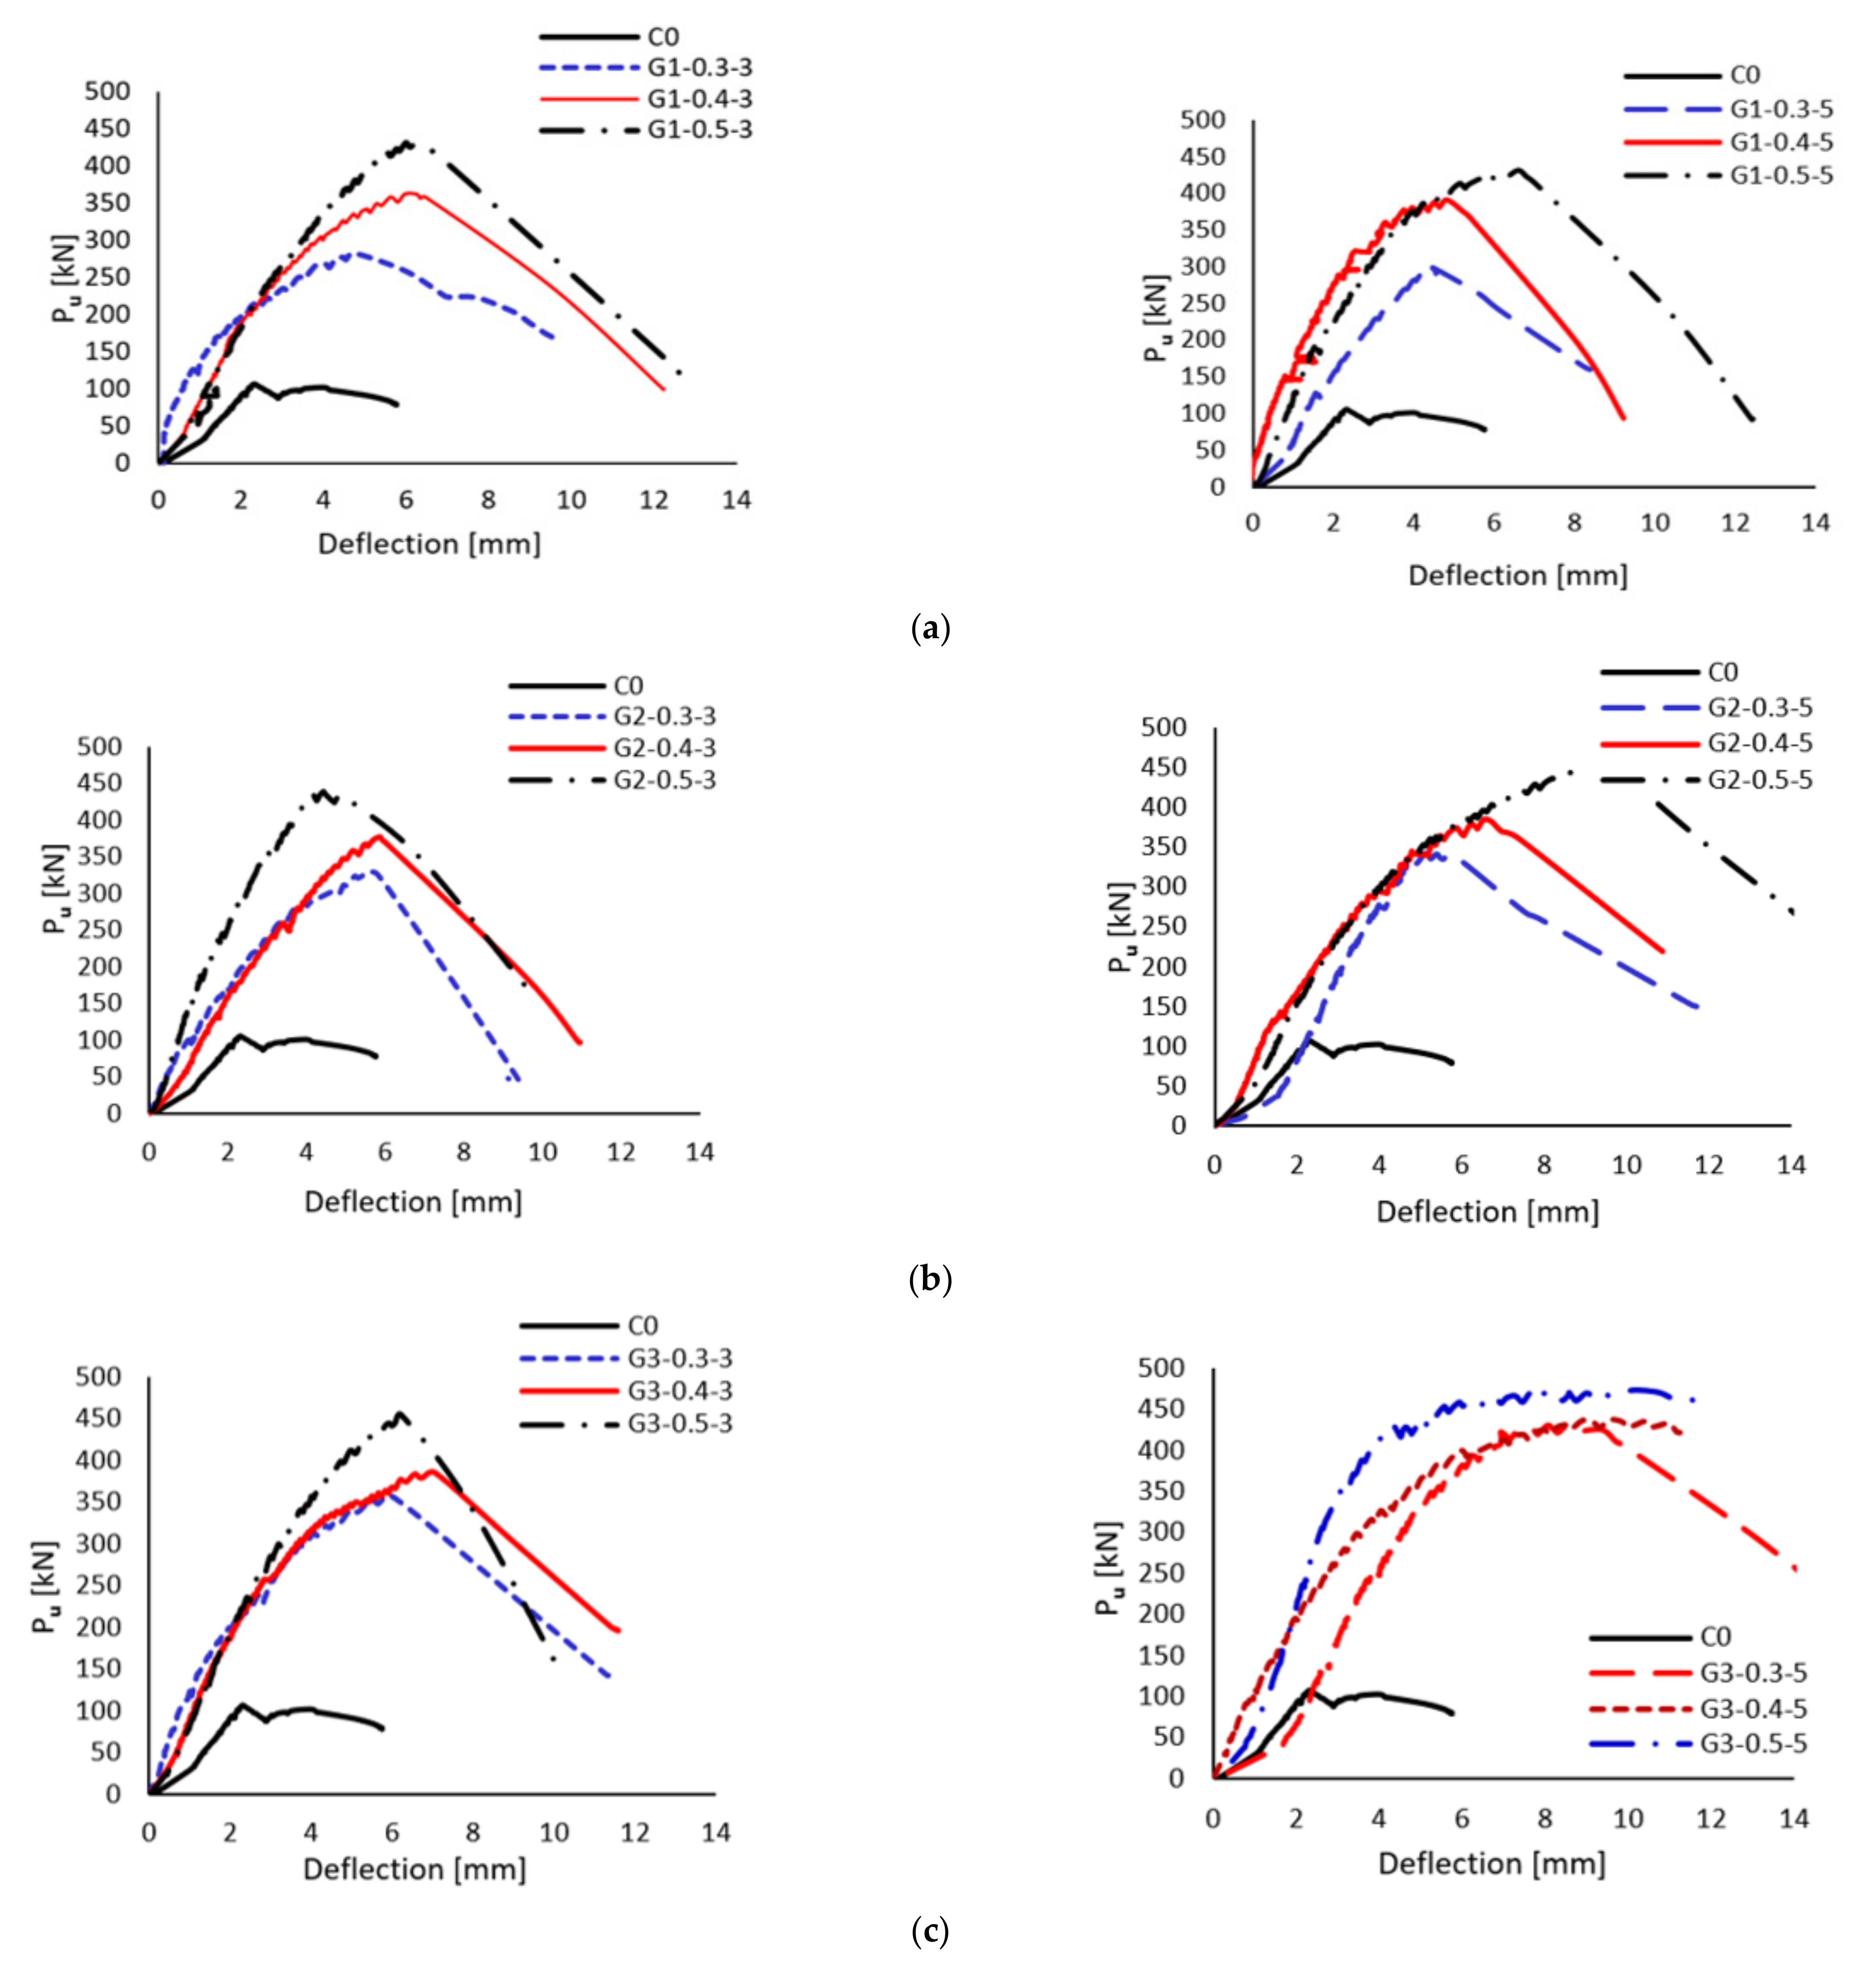
4.3. Load–Deflection Relationship
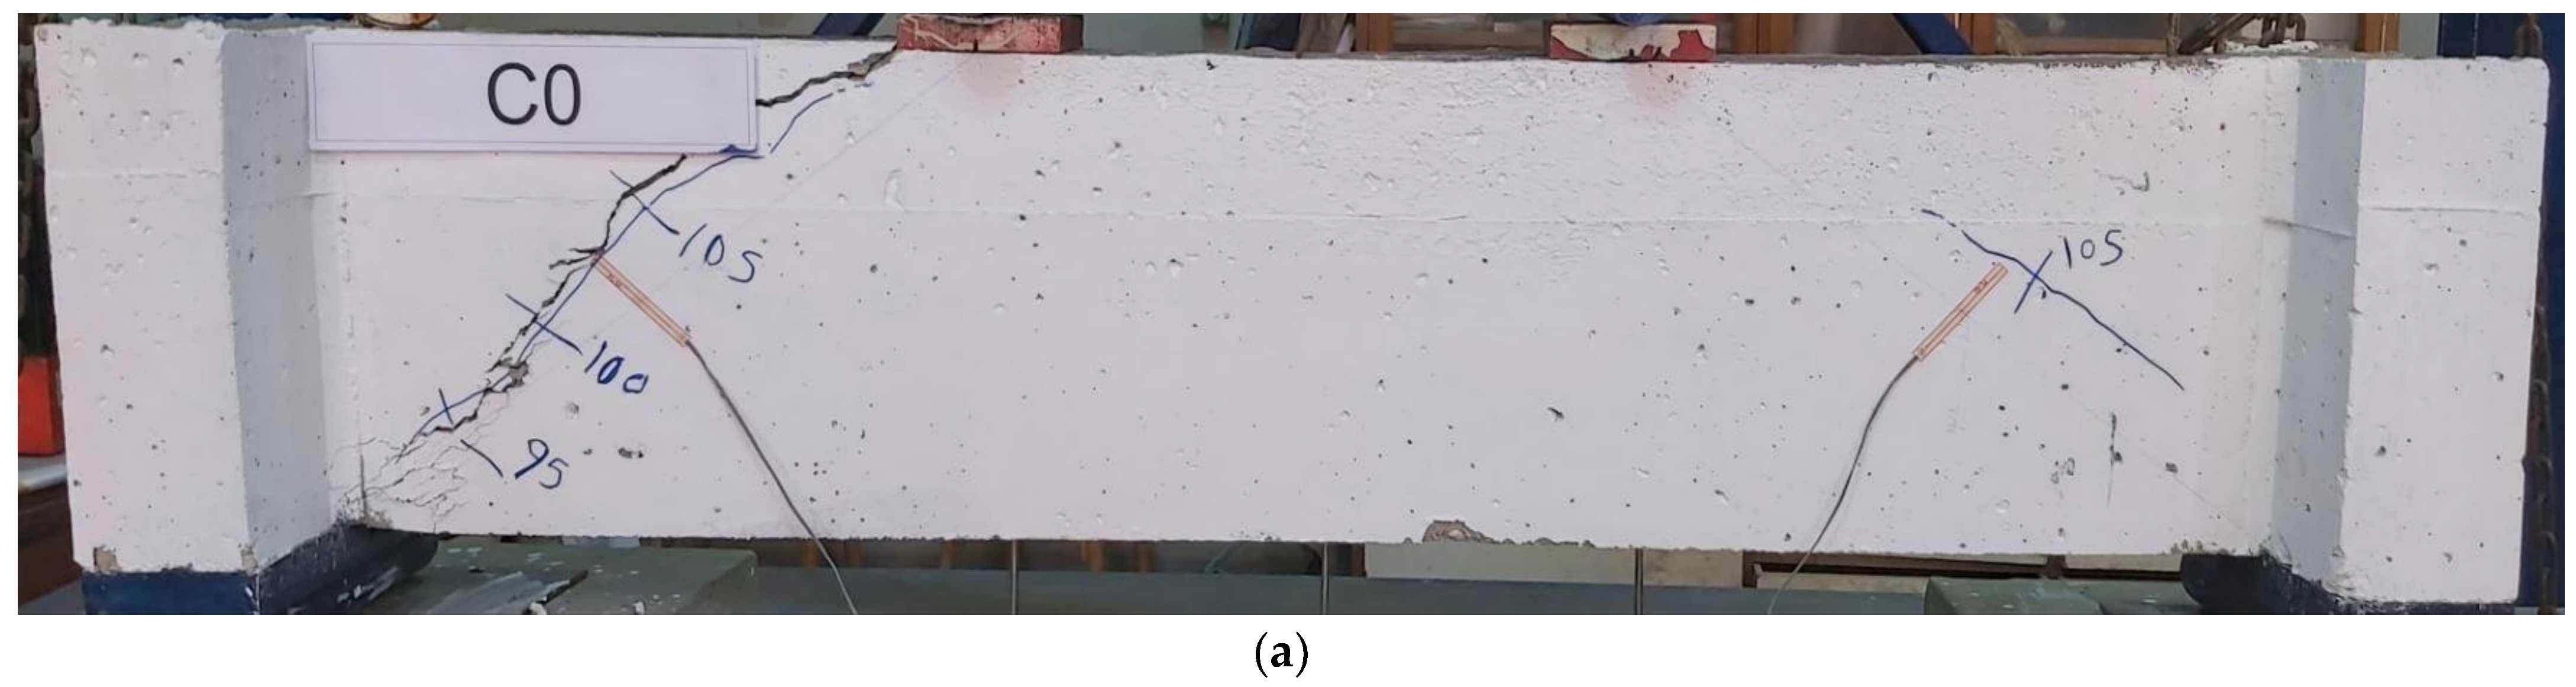
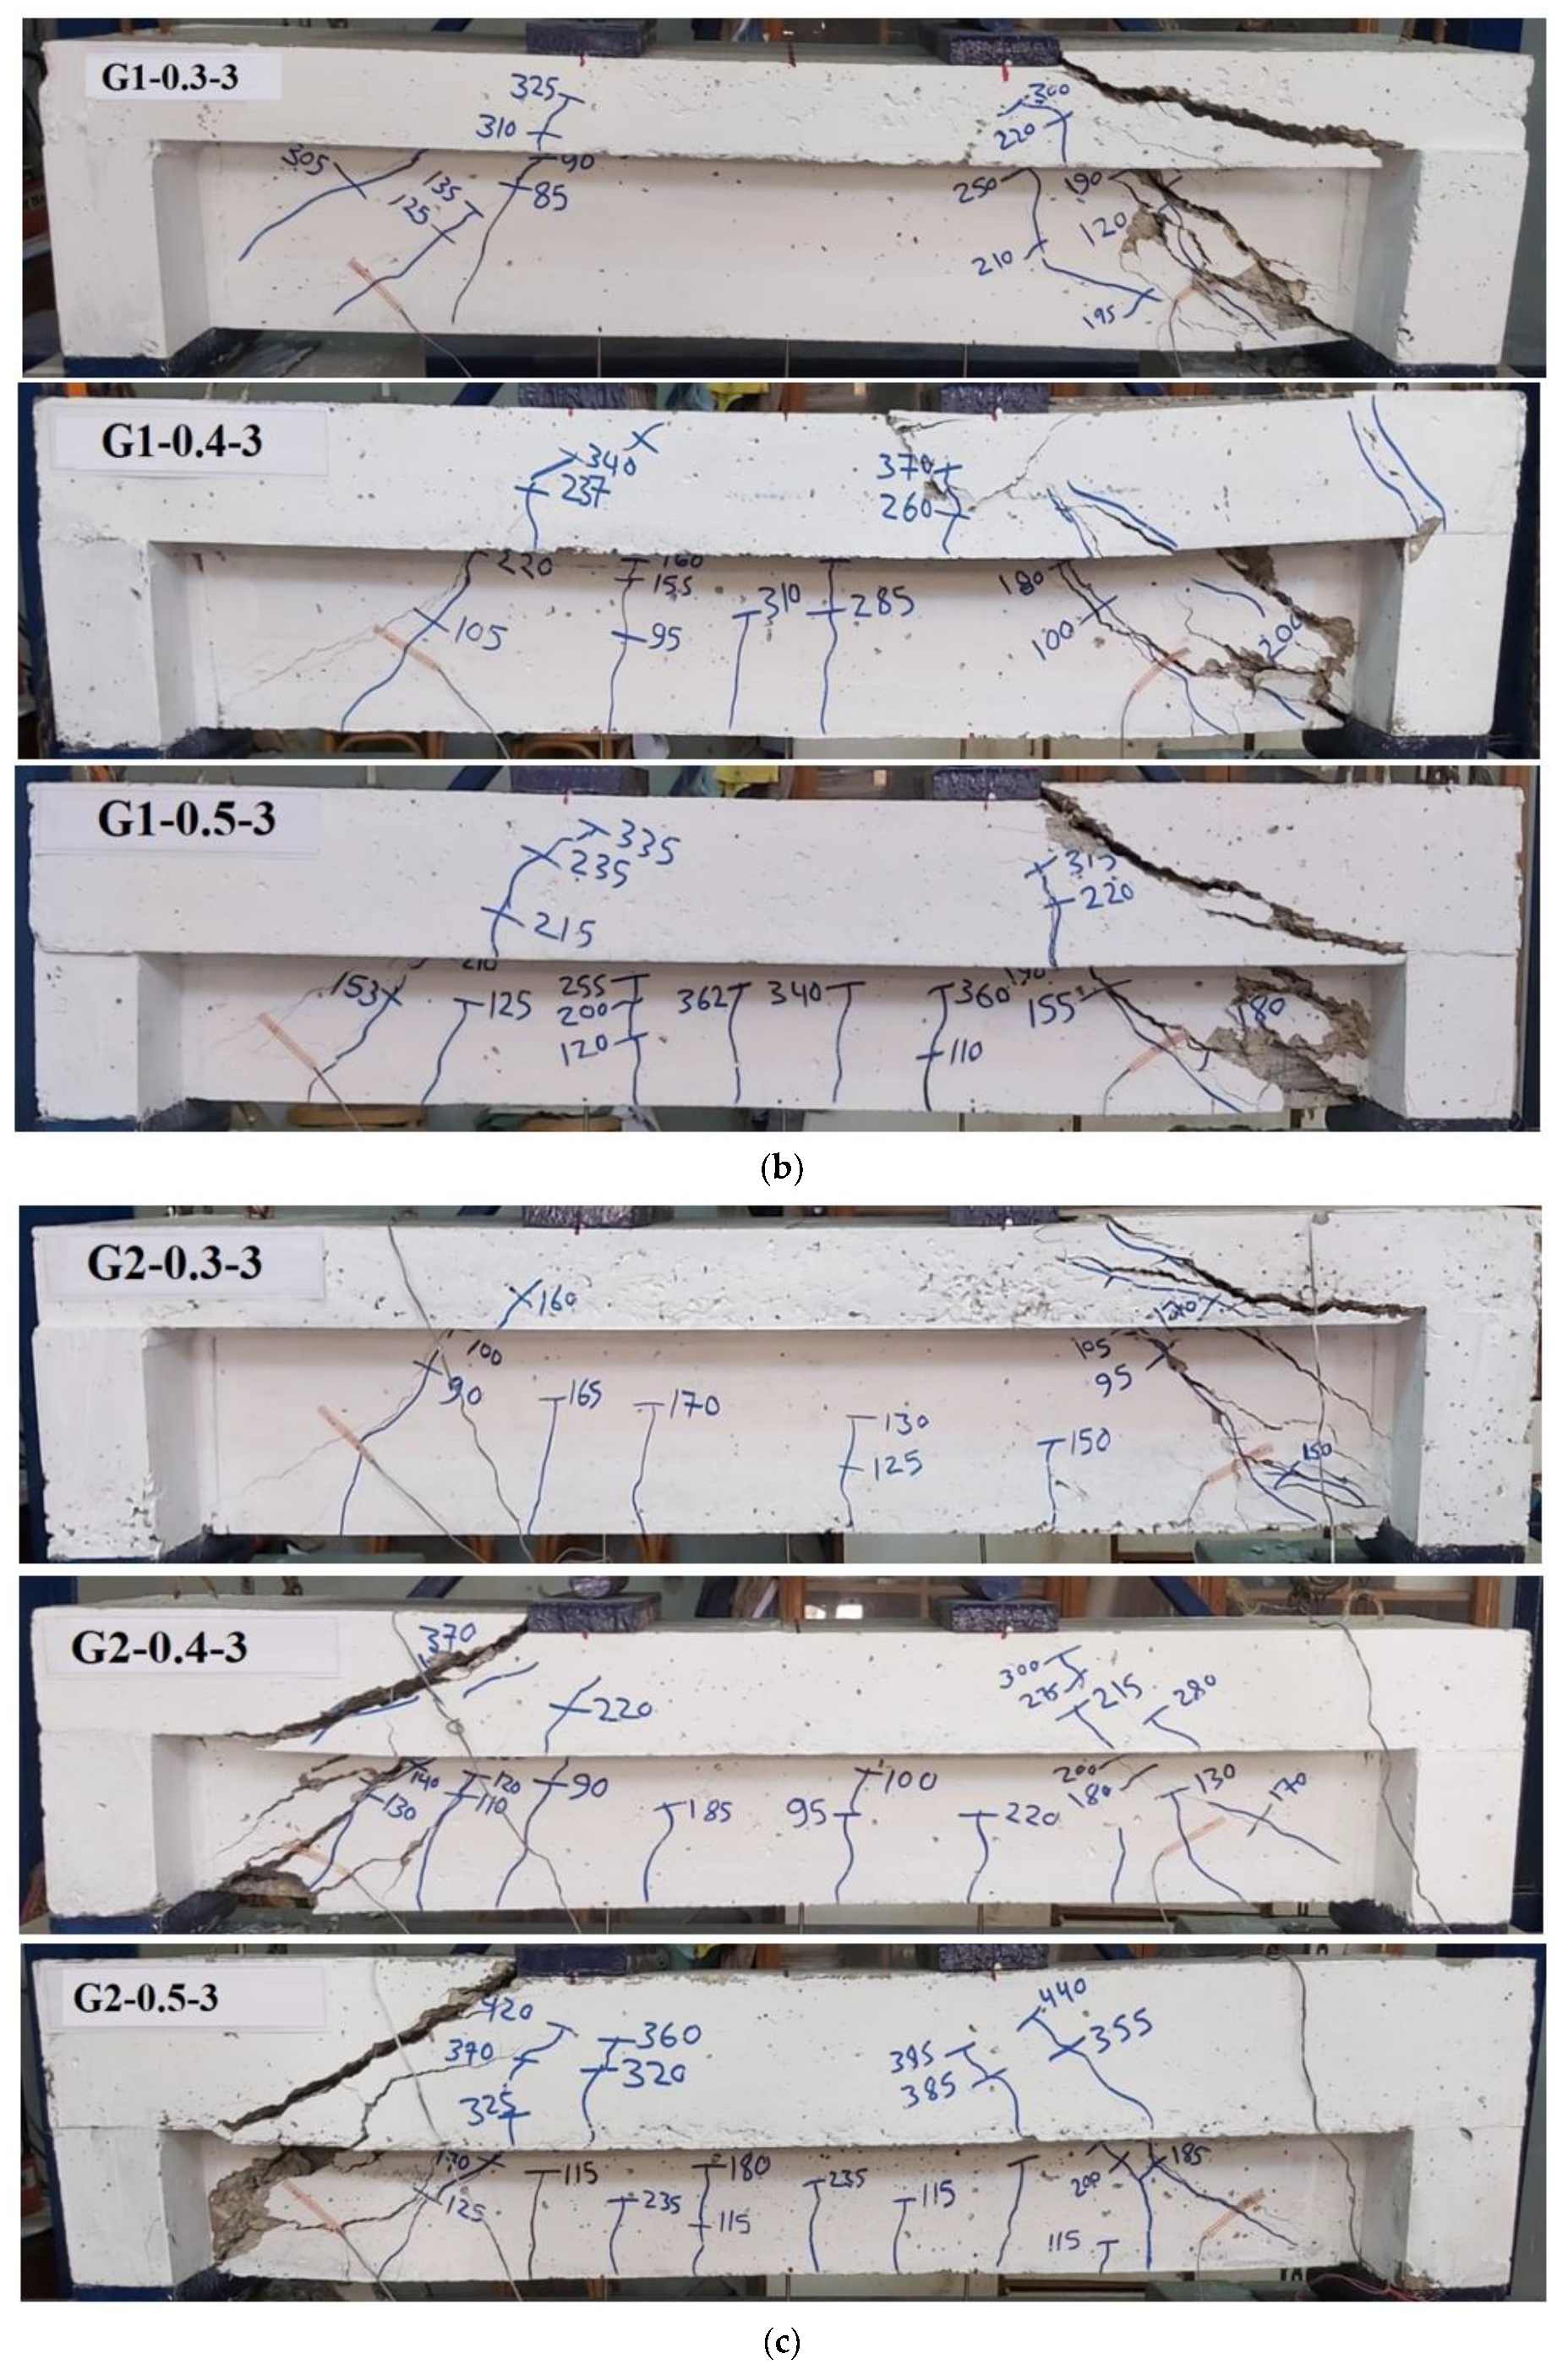
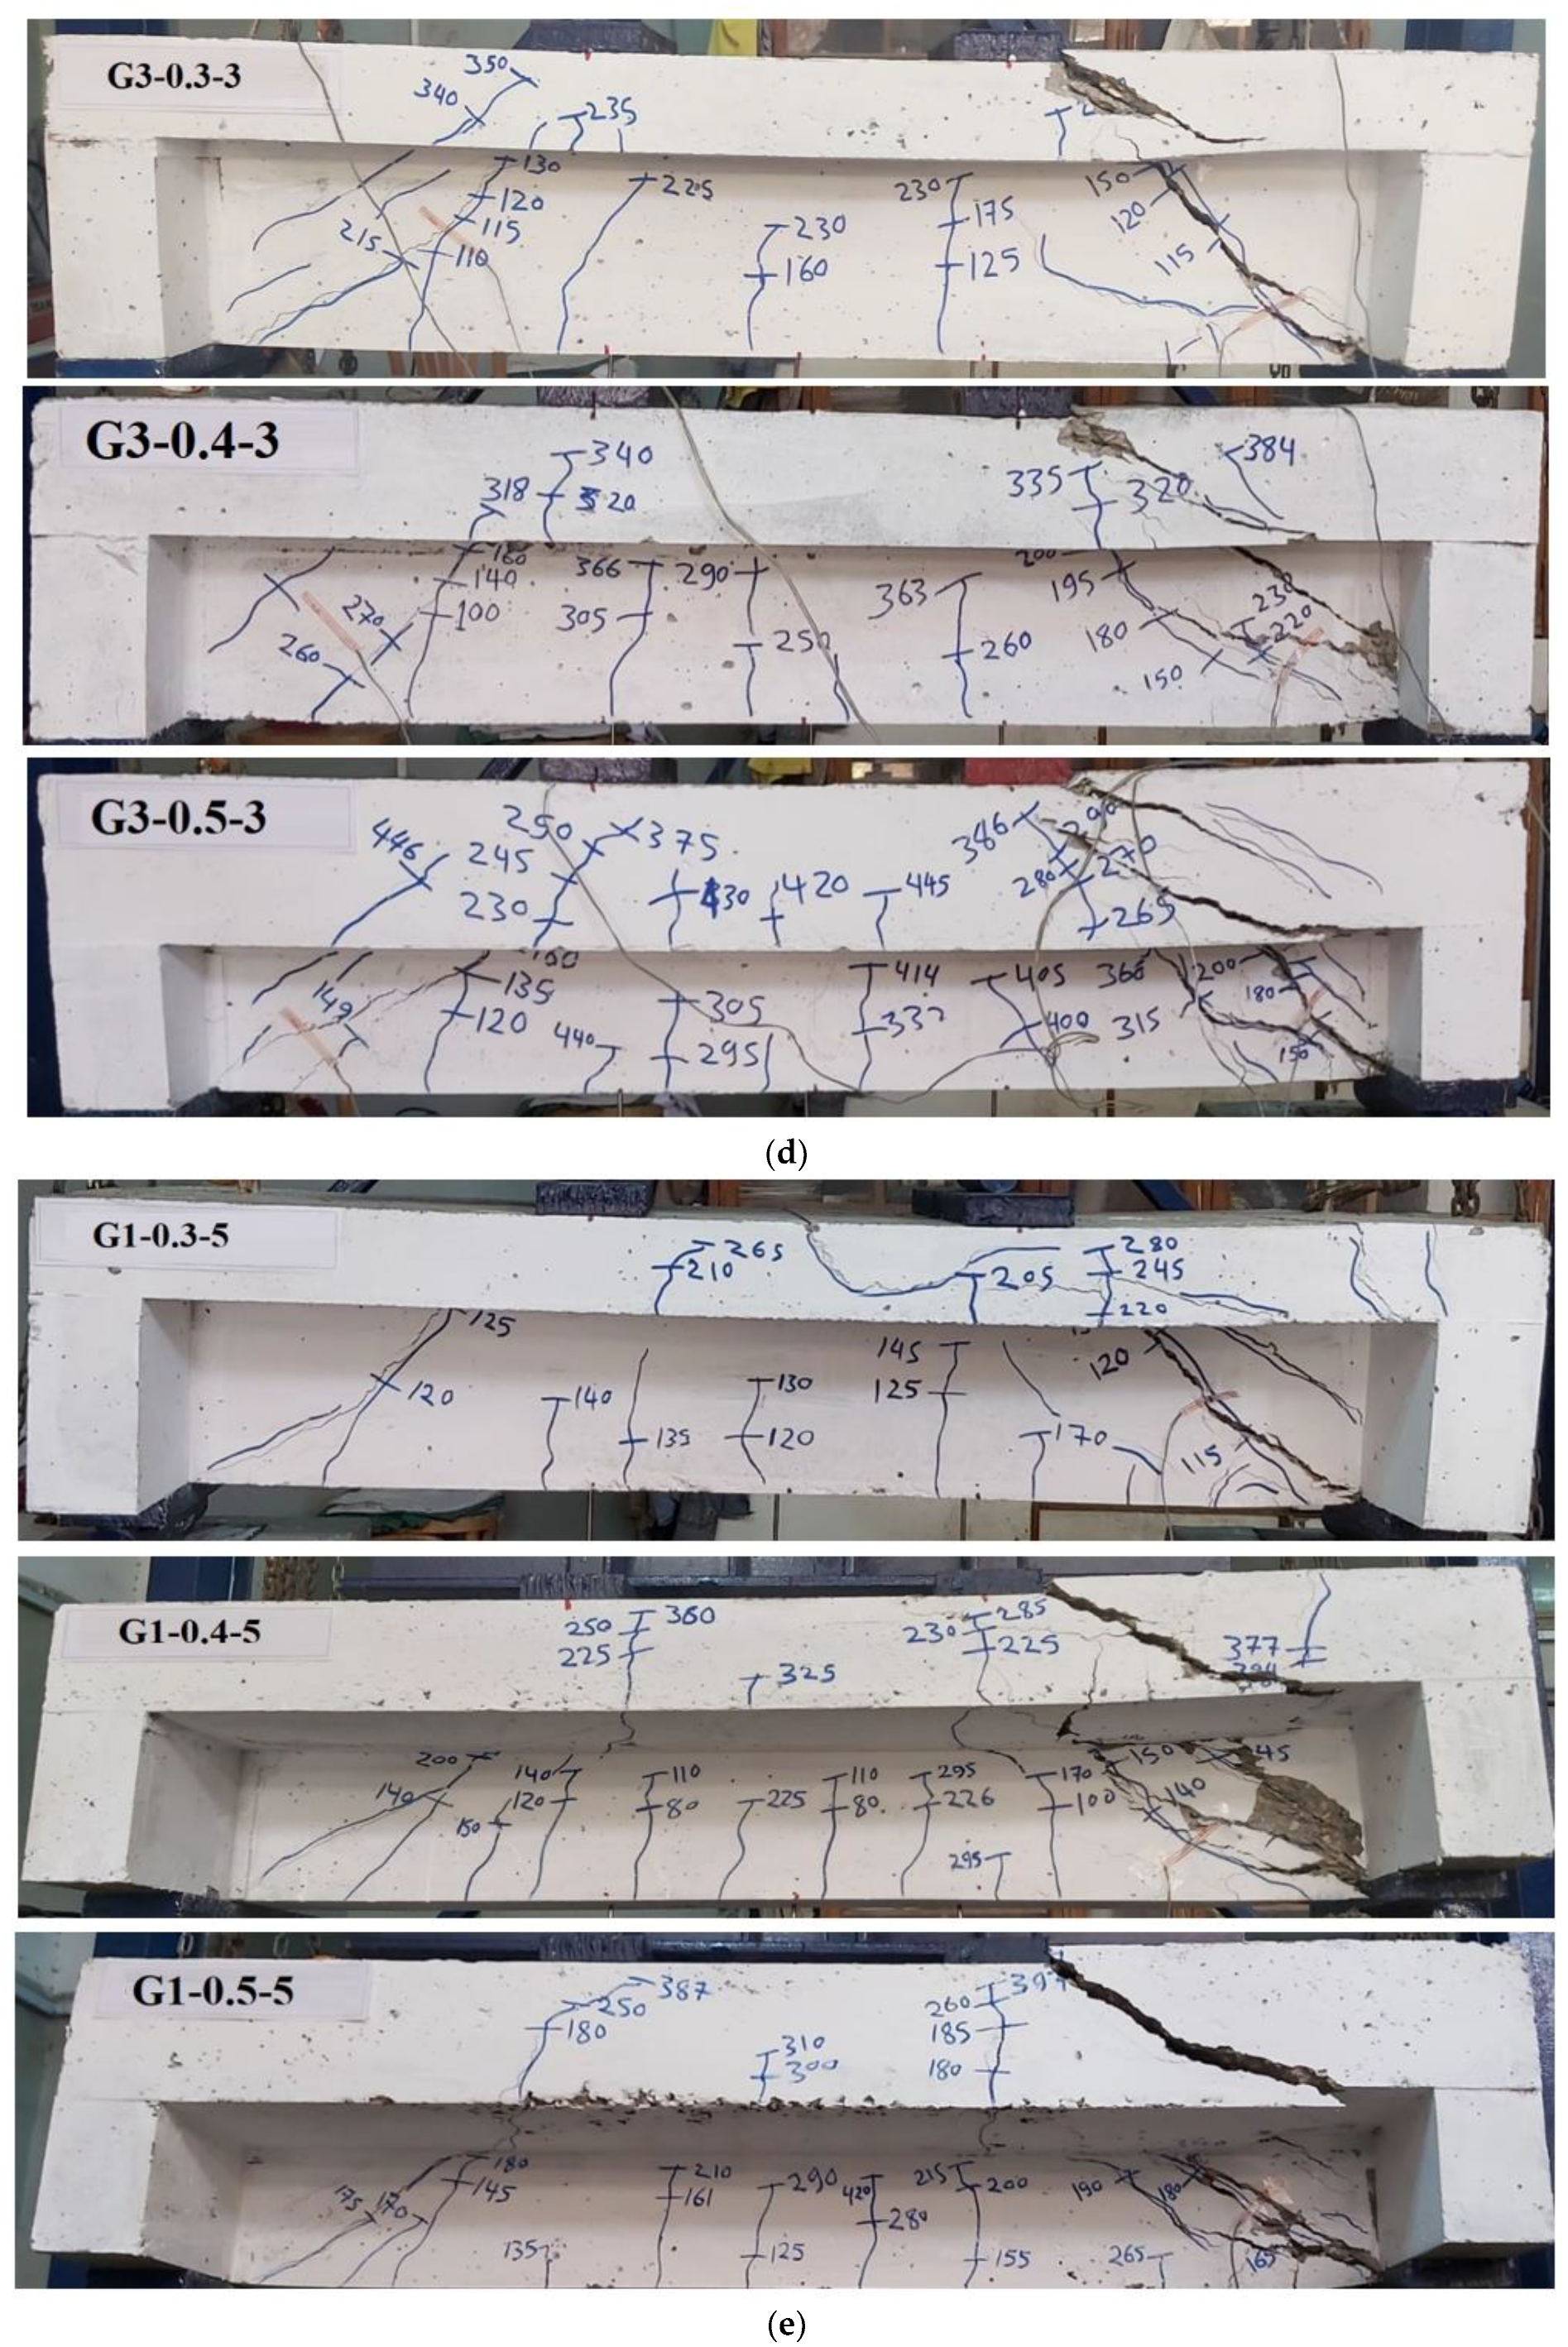
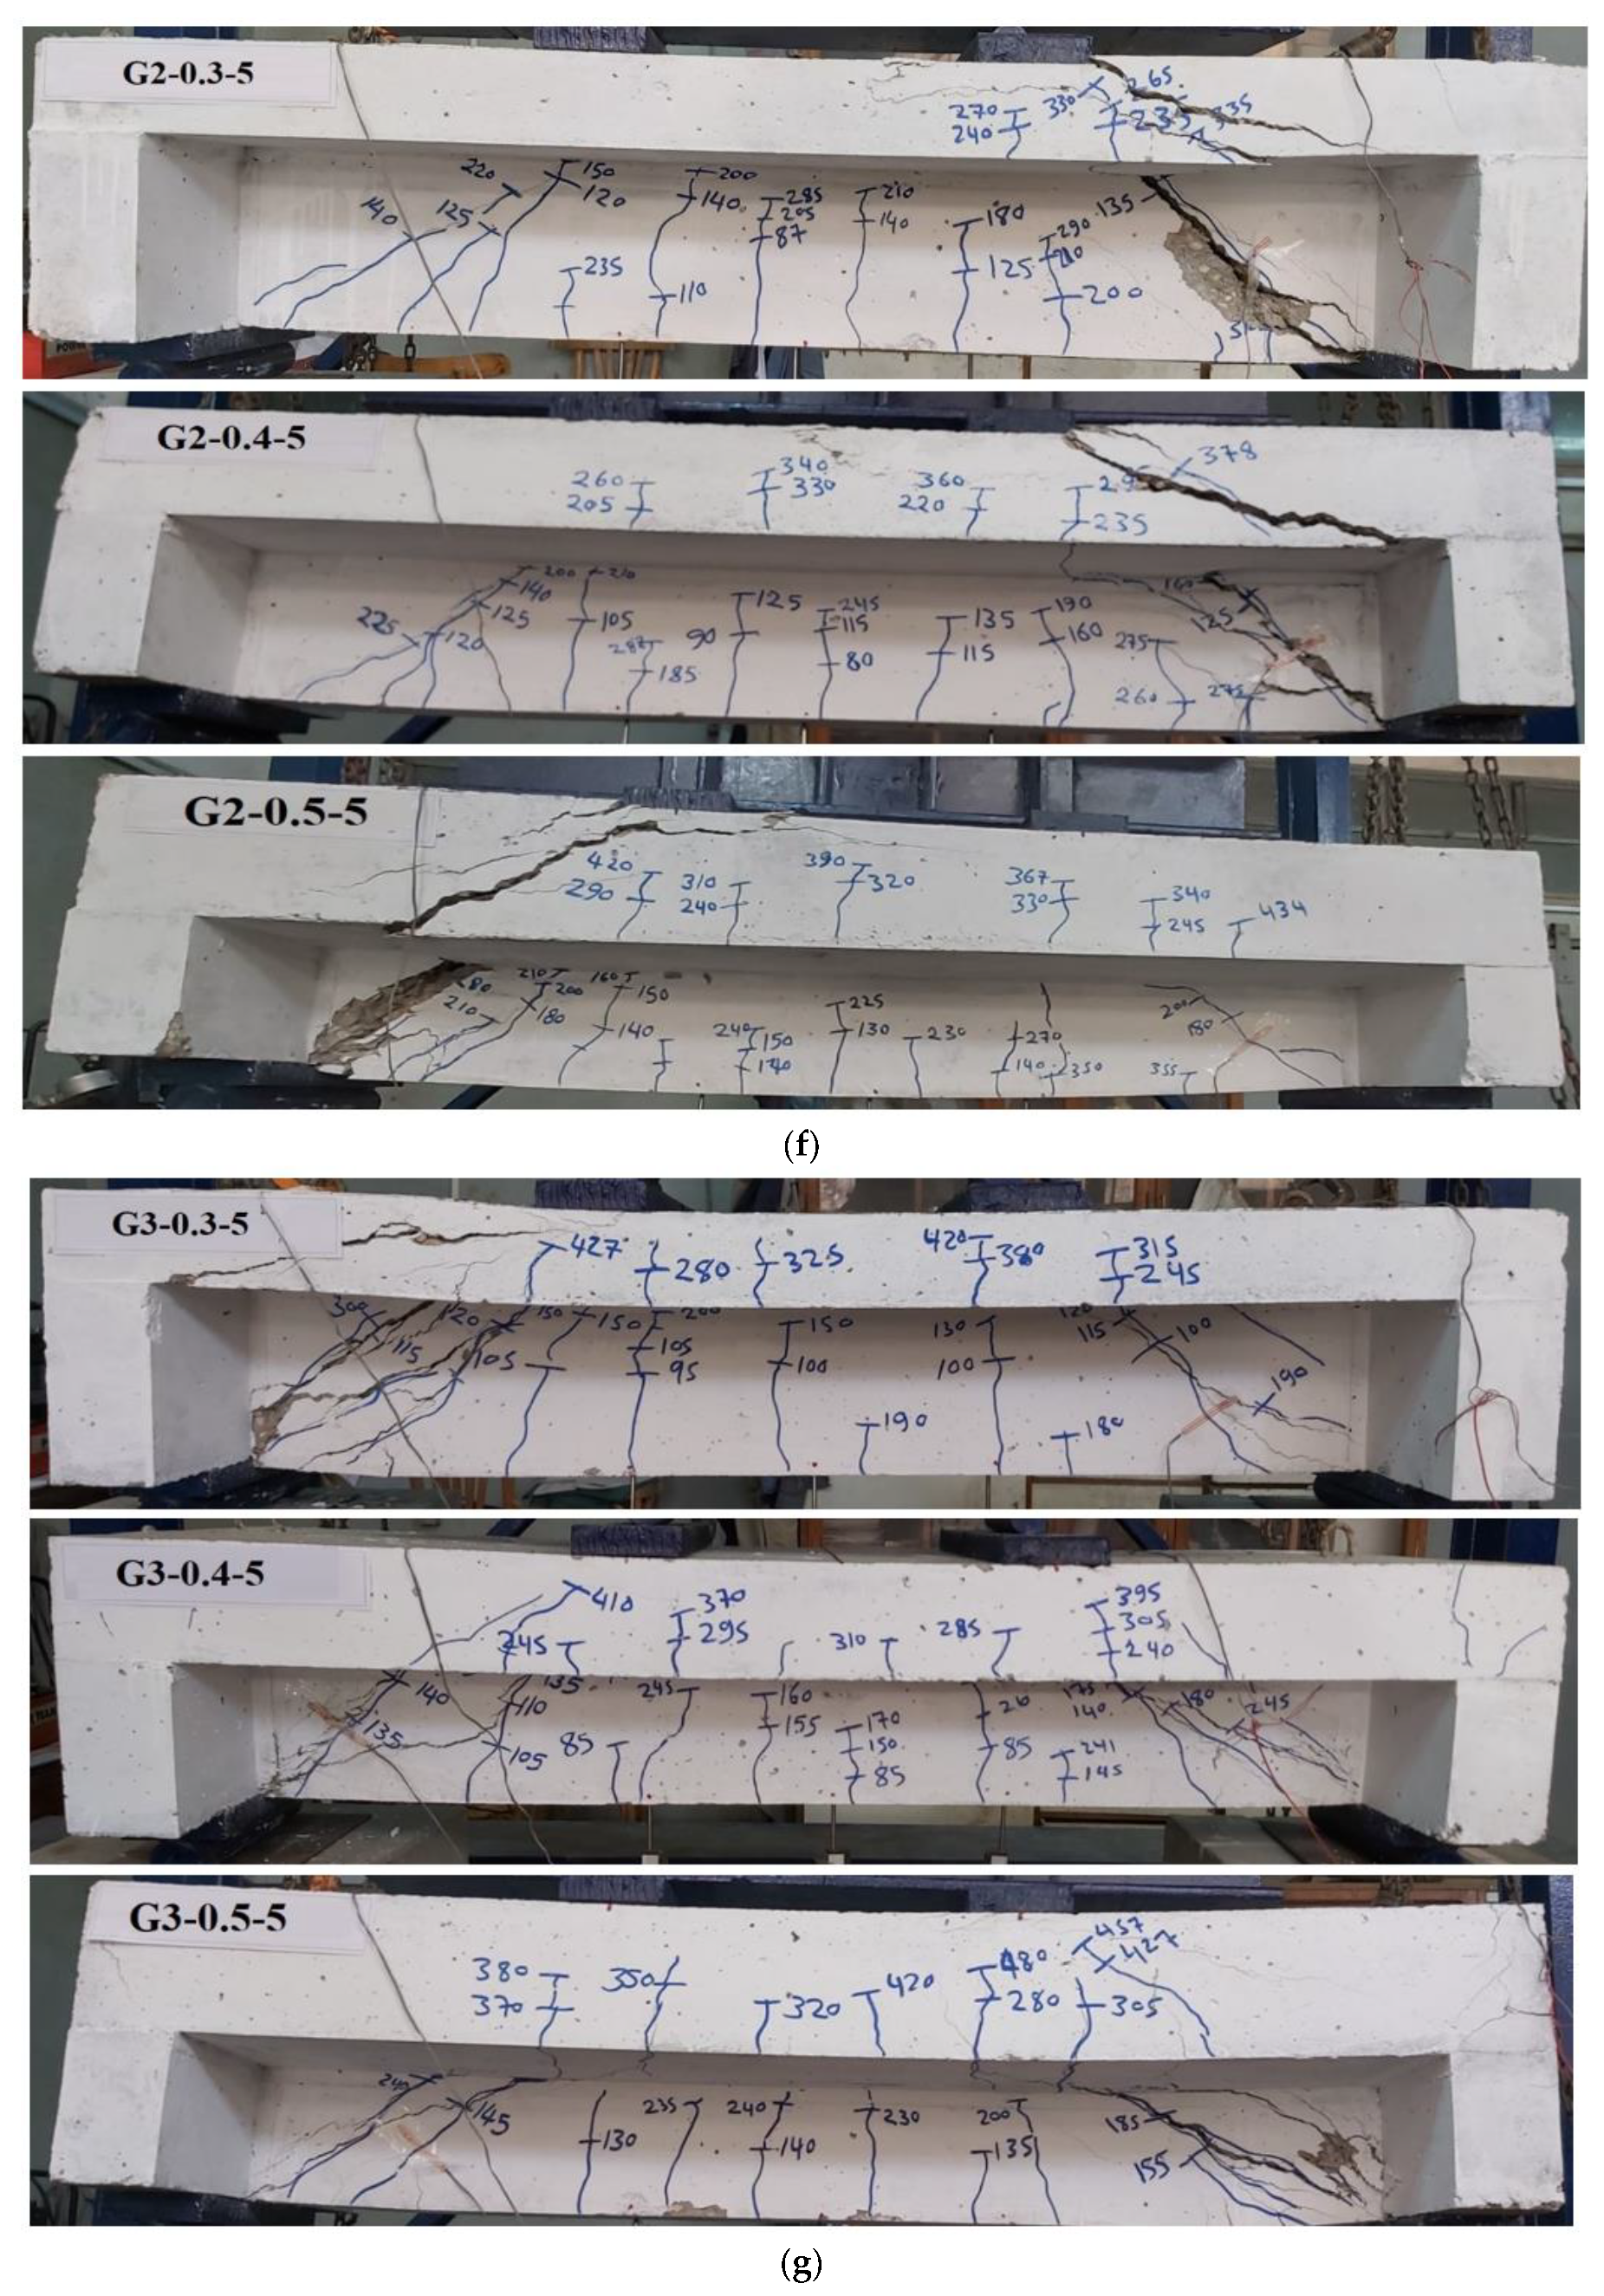
4.4. Cracking Pattern and Modes of Failure
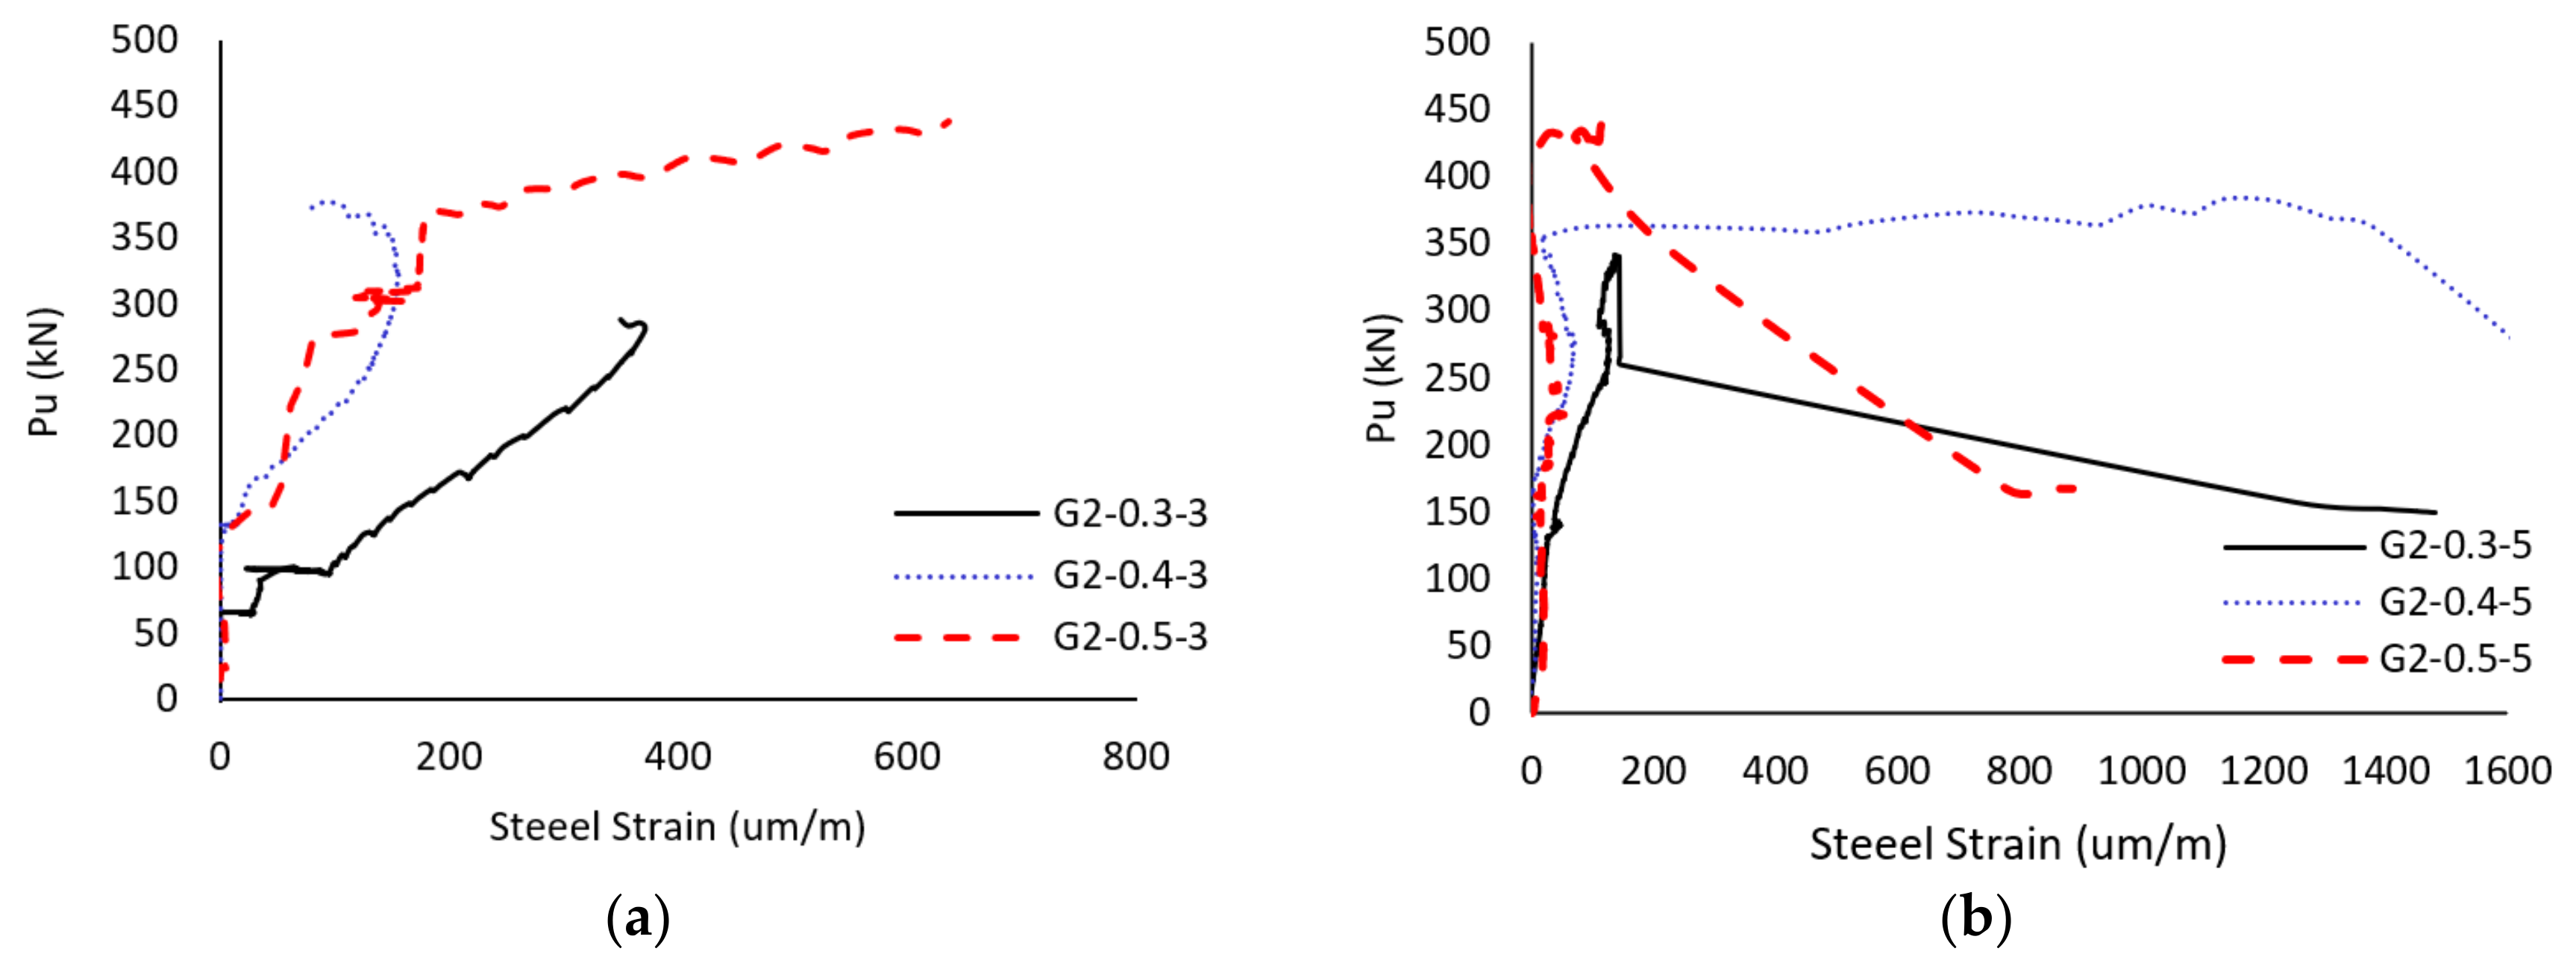
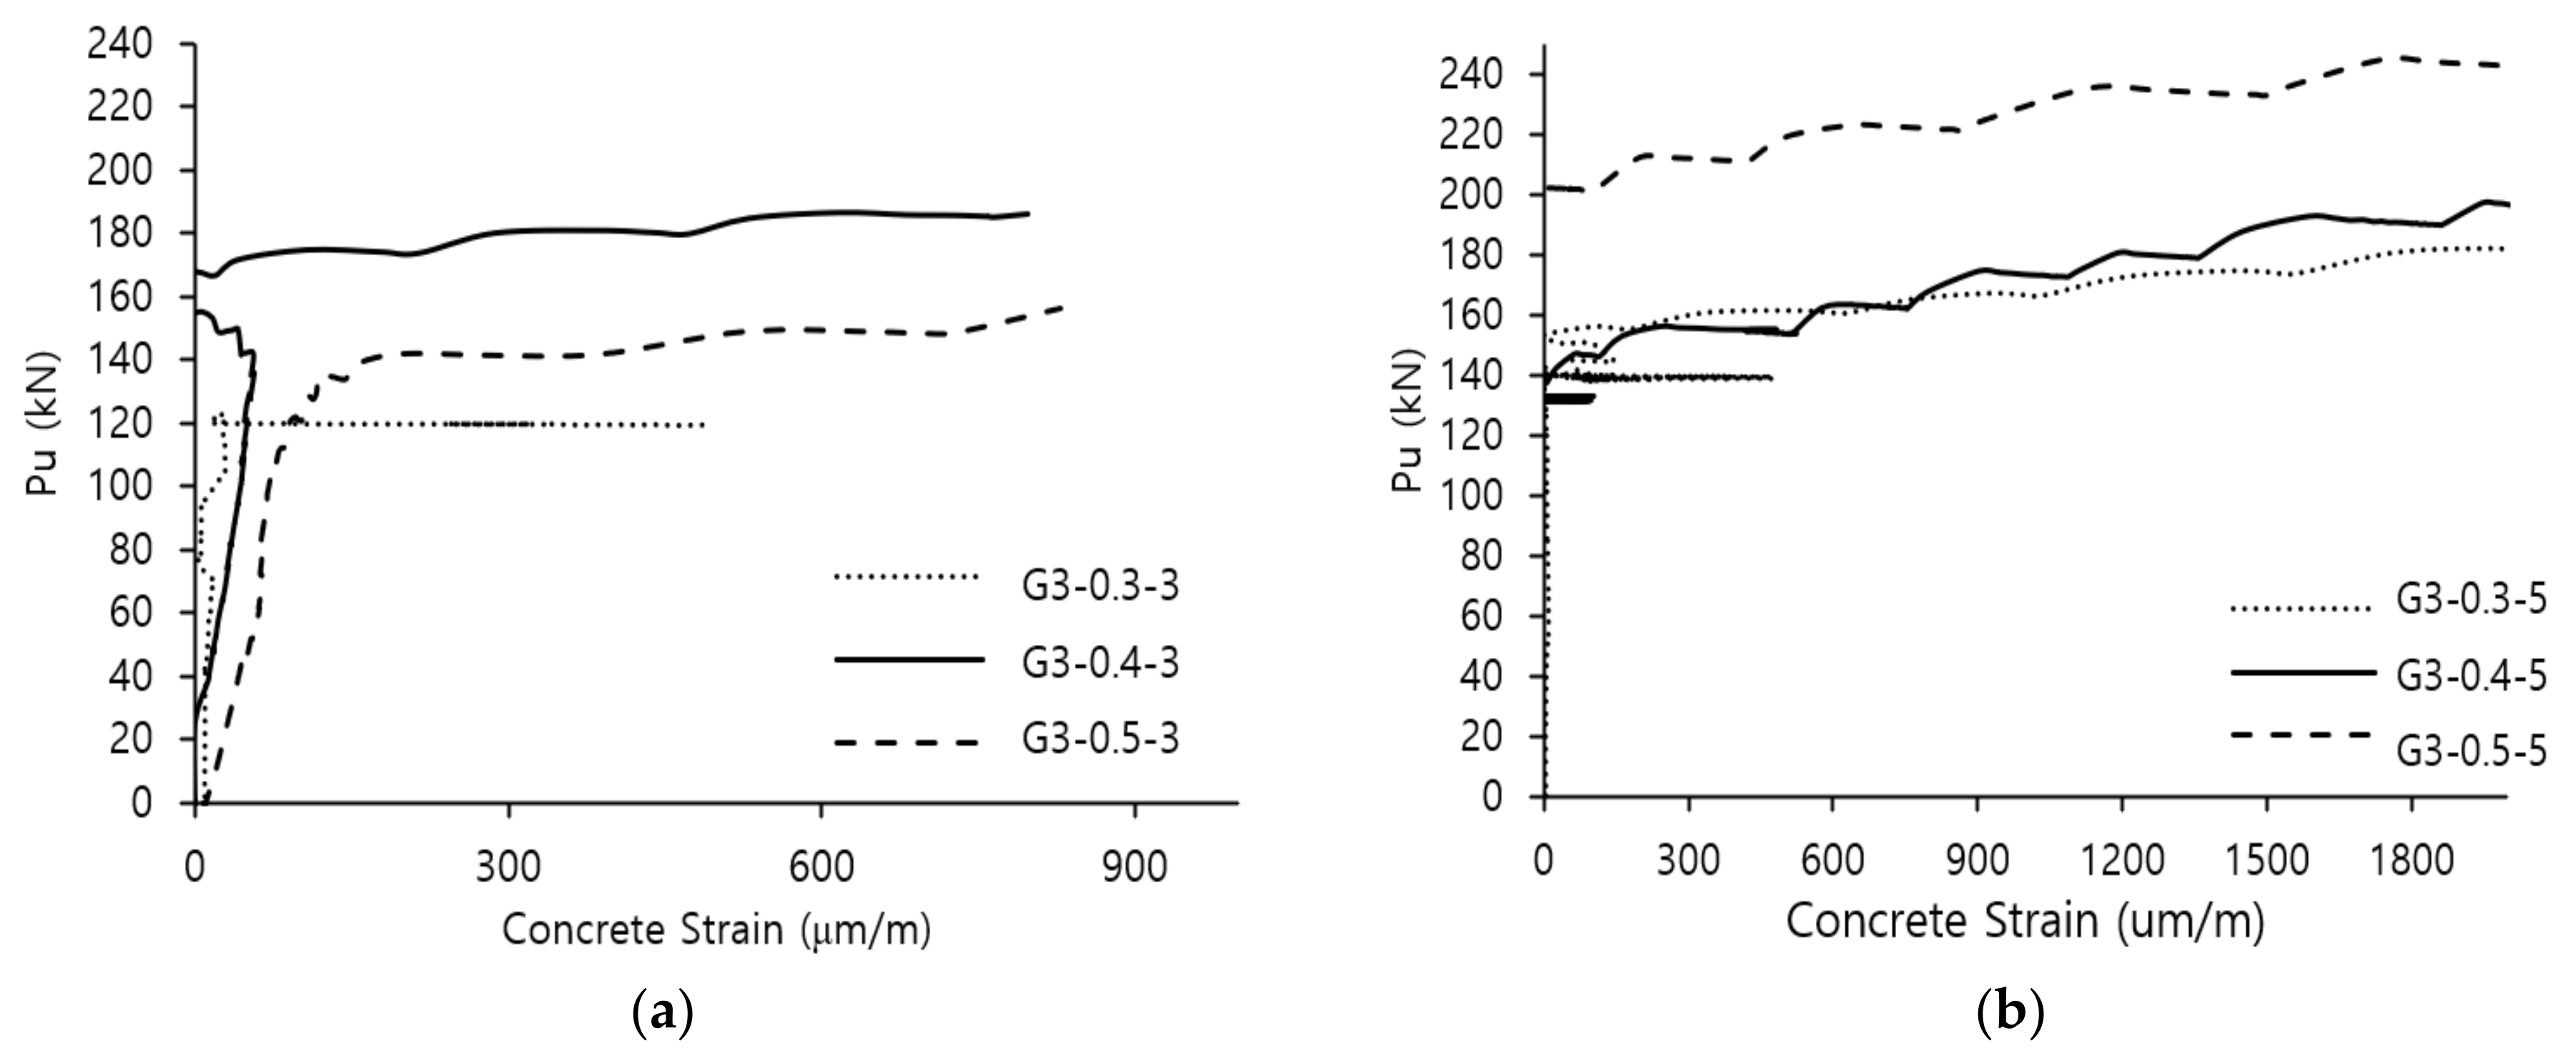
4.5. Strain Analysis
4.5.1. Strain in Longitudinal Reinforcement in Flange
4.5.2. Concrete Tensile Strain in Web
5. Proposed Simplified Calculations
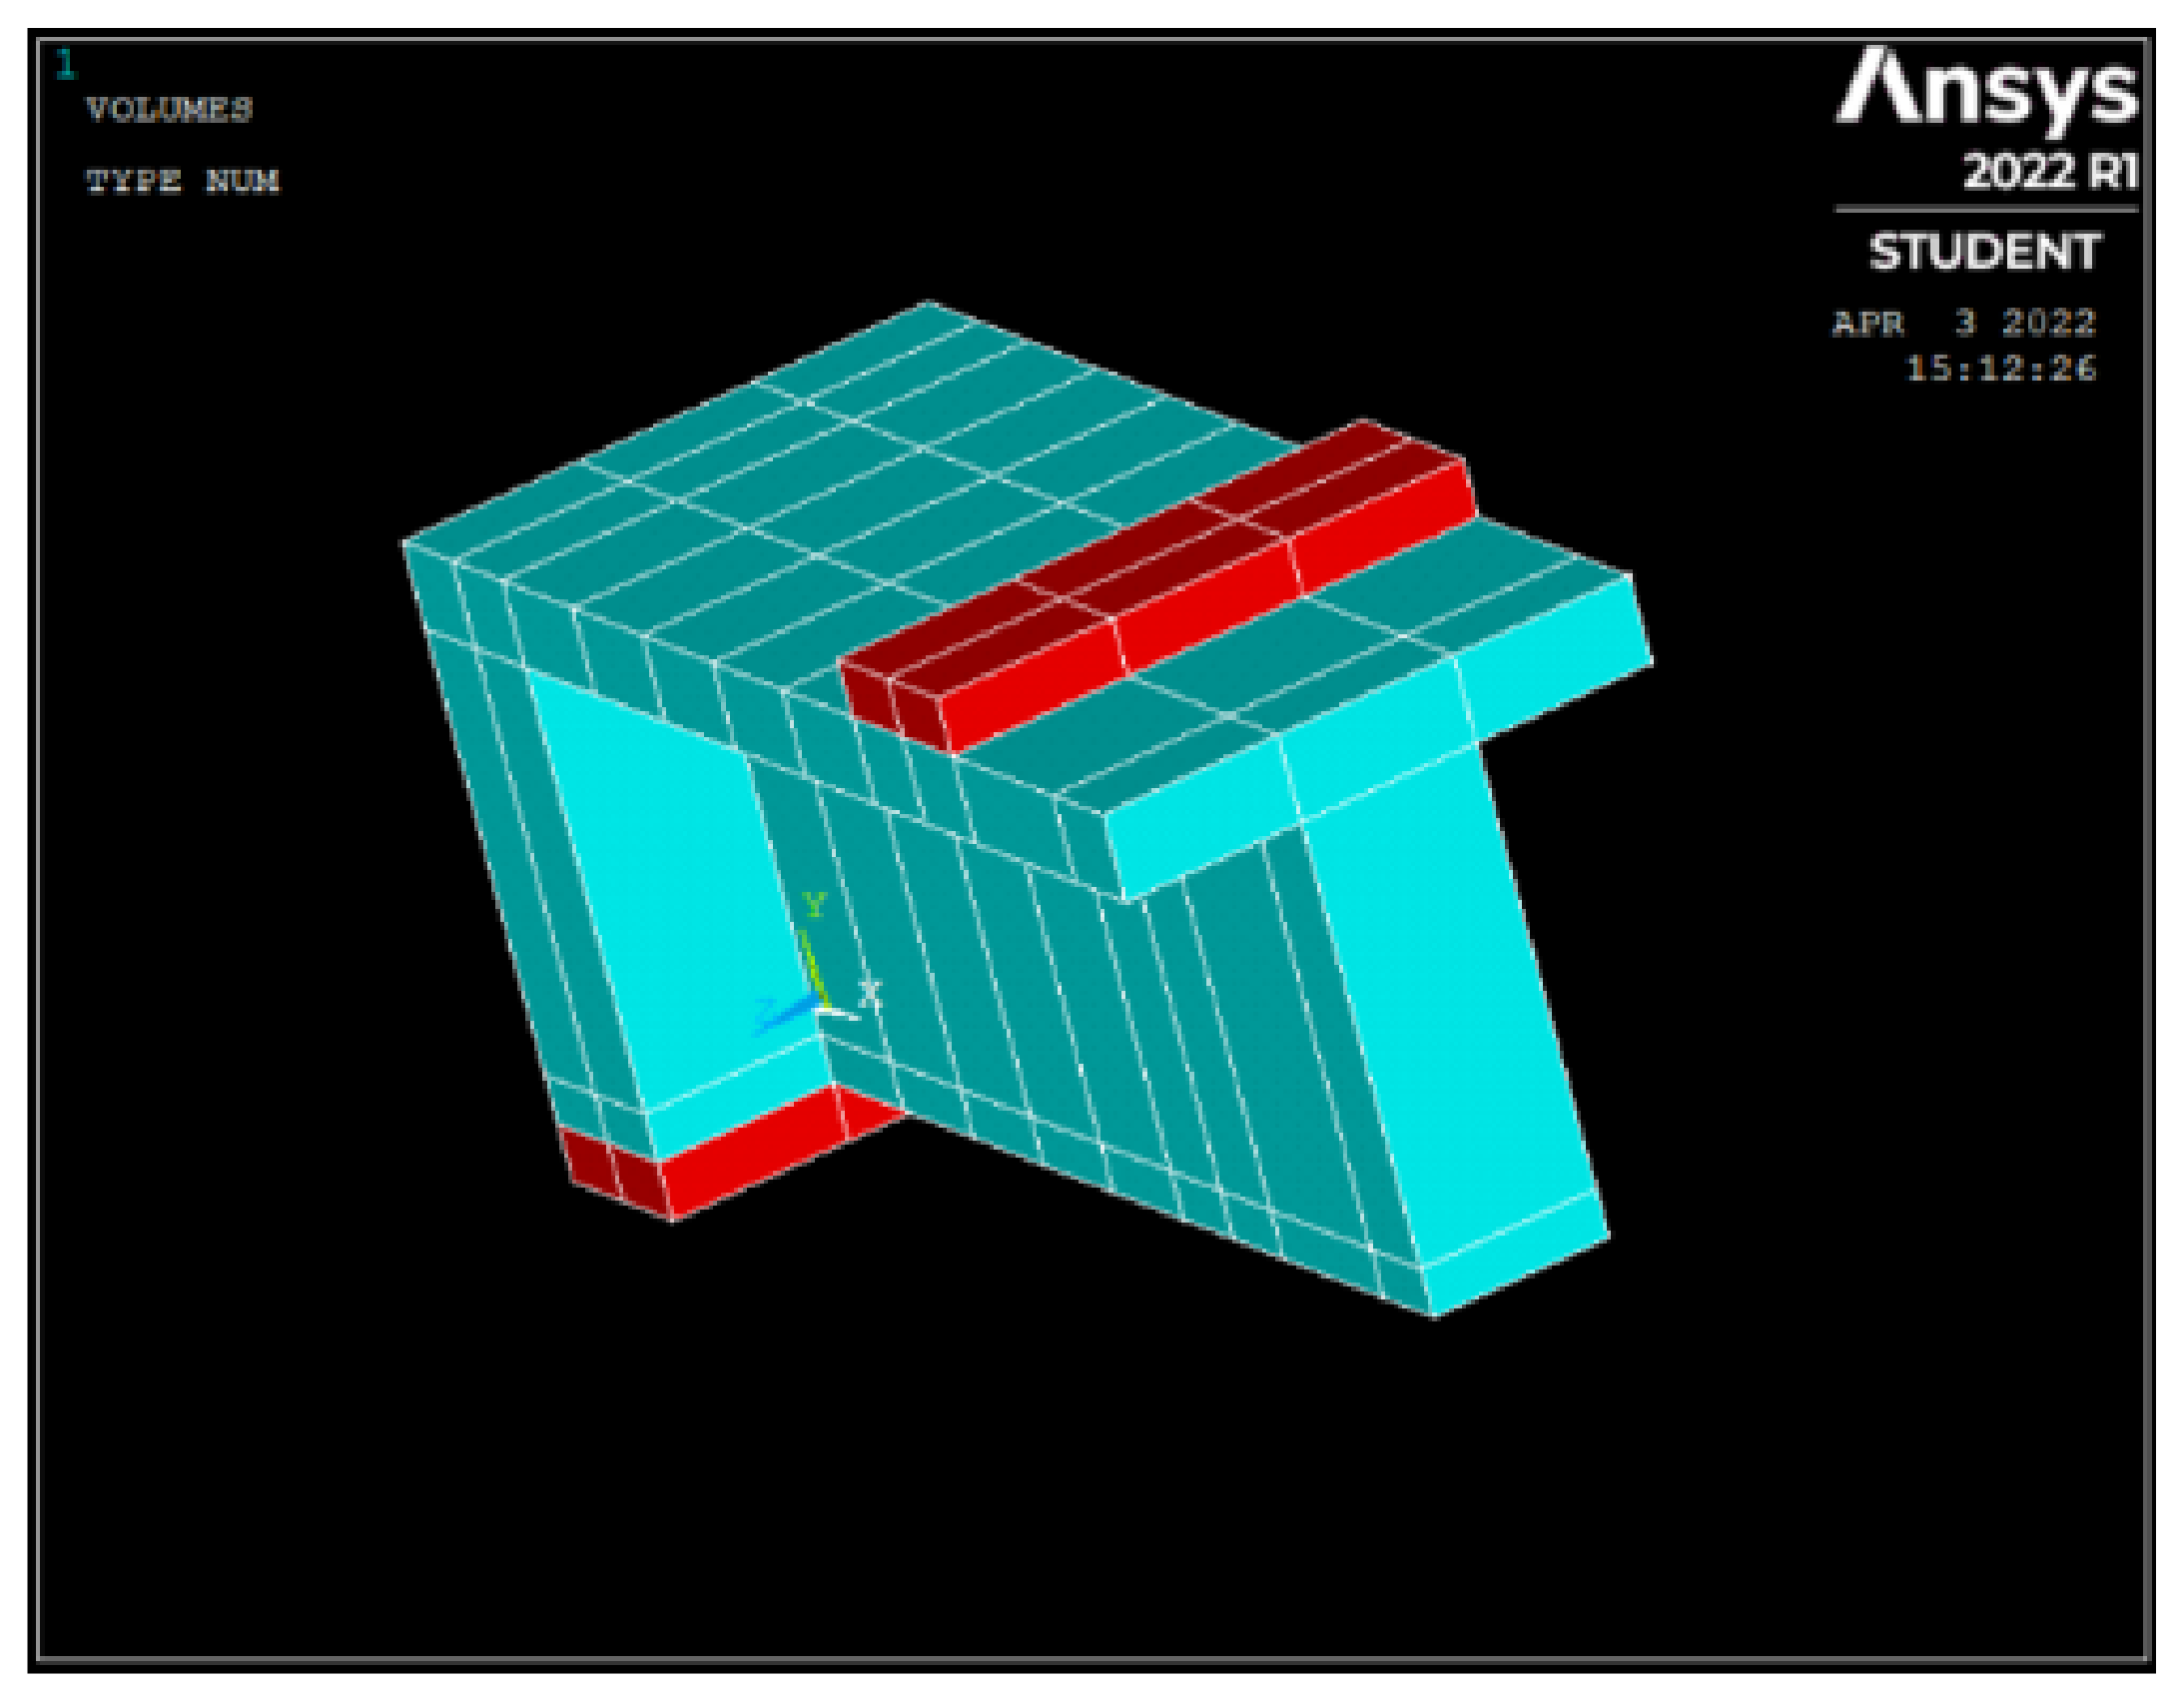
6. Numerical Analysis
6.1. Model Validation
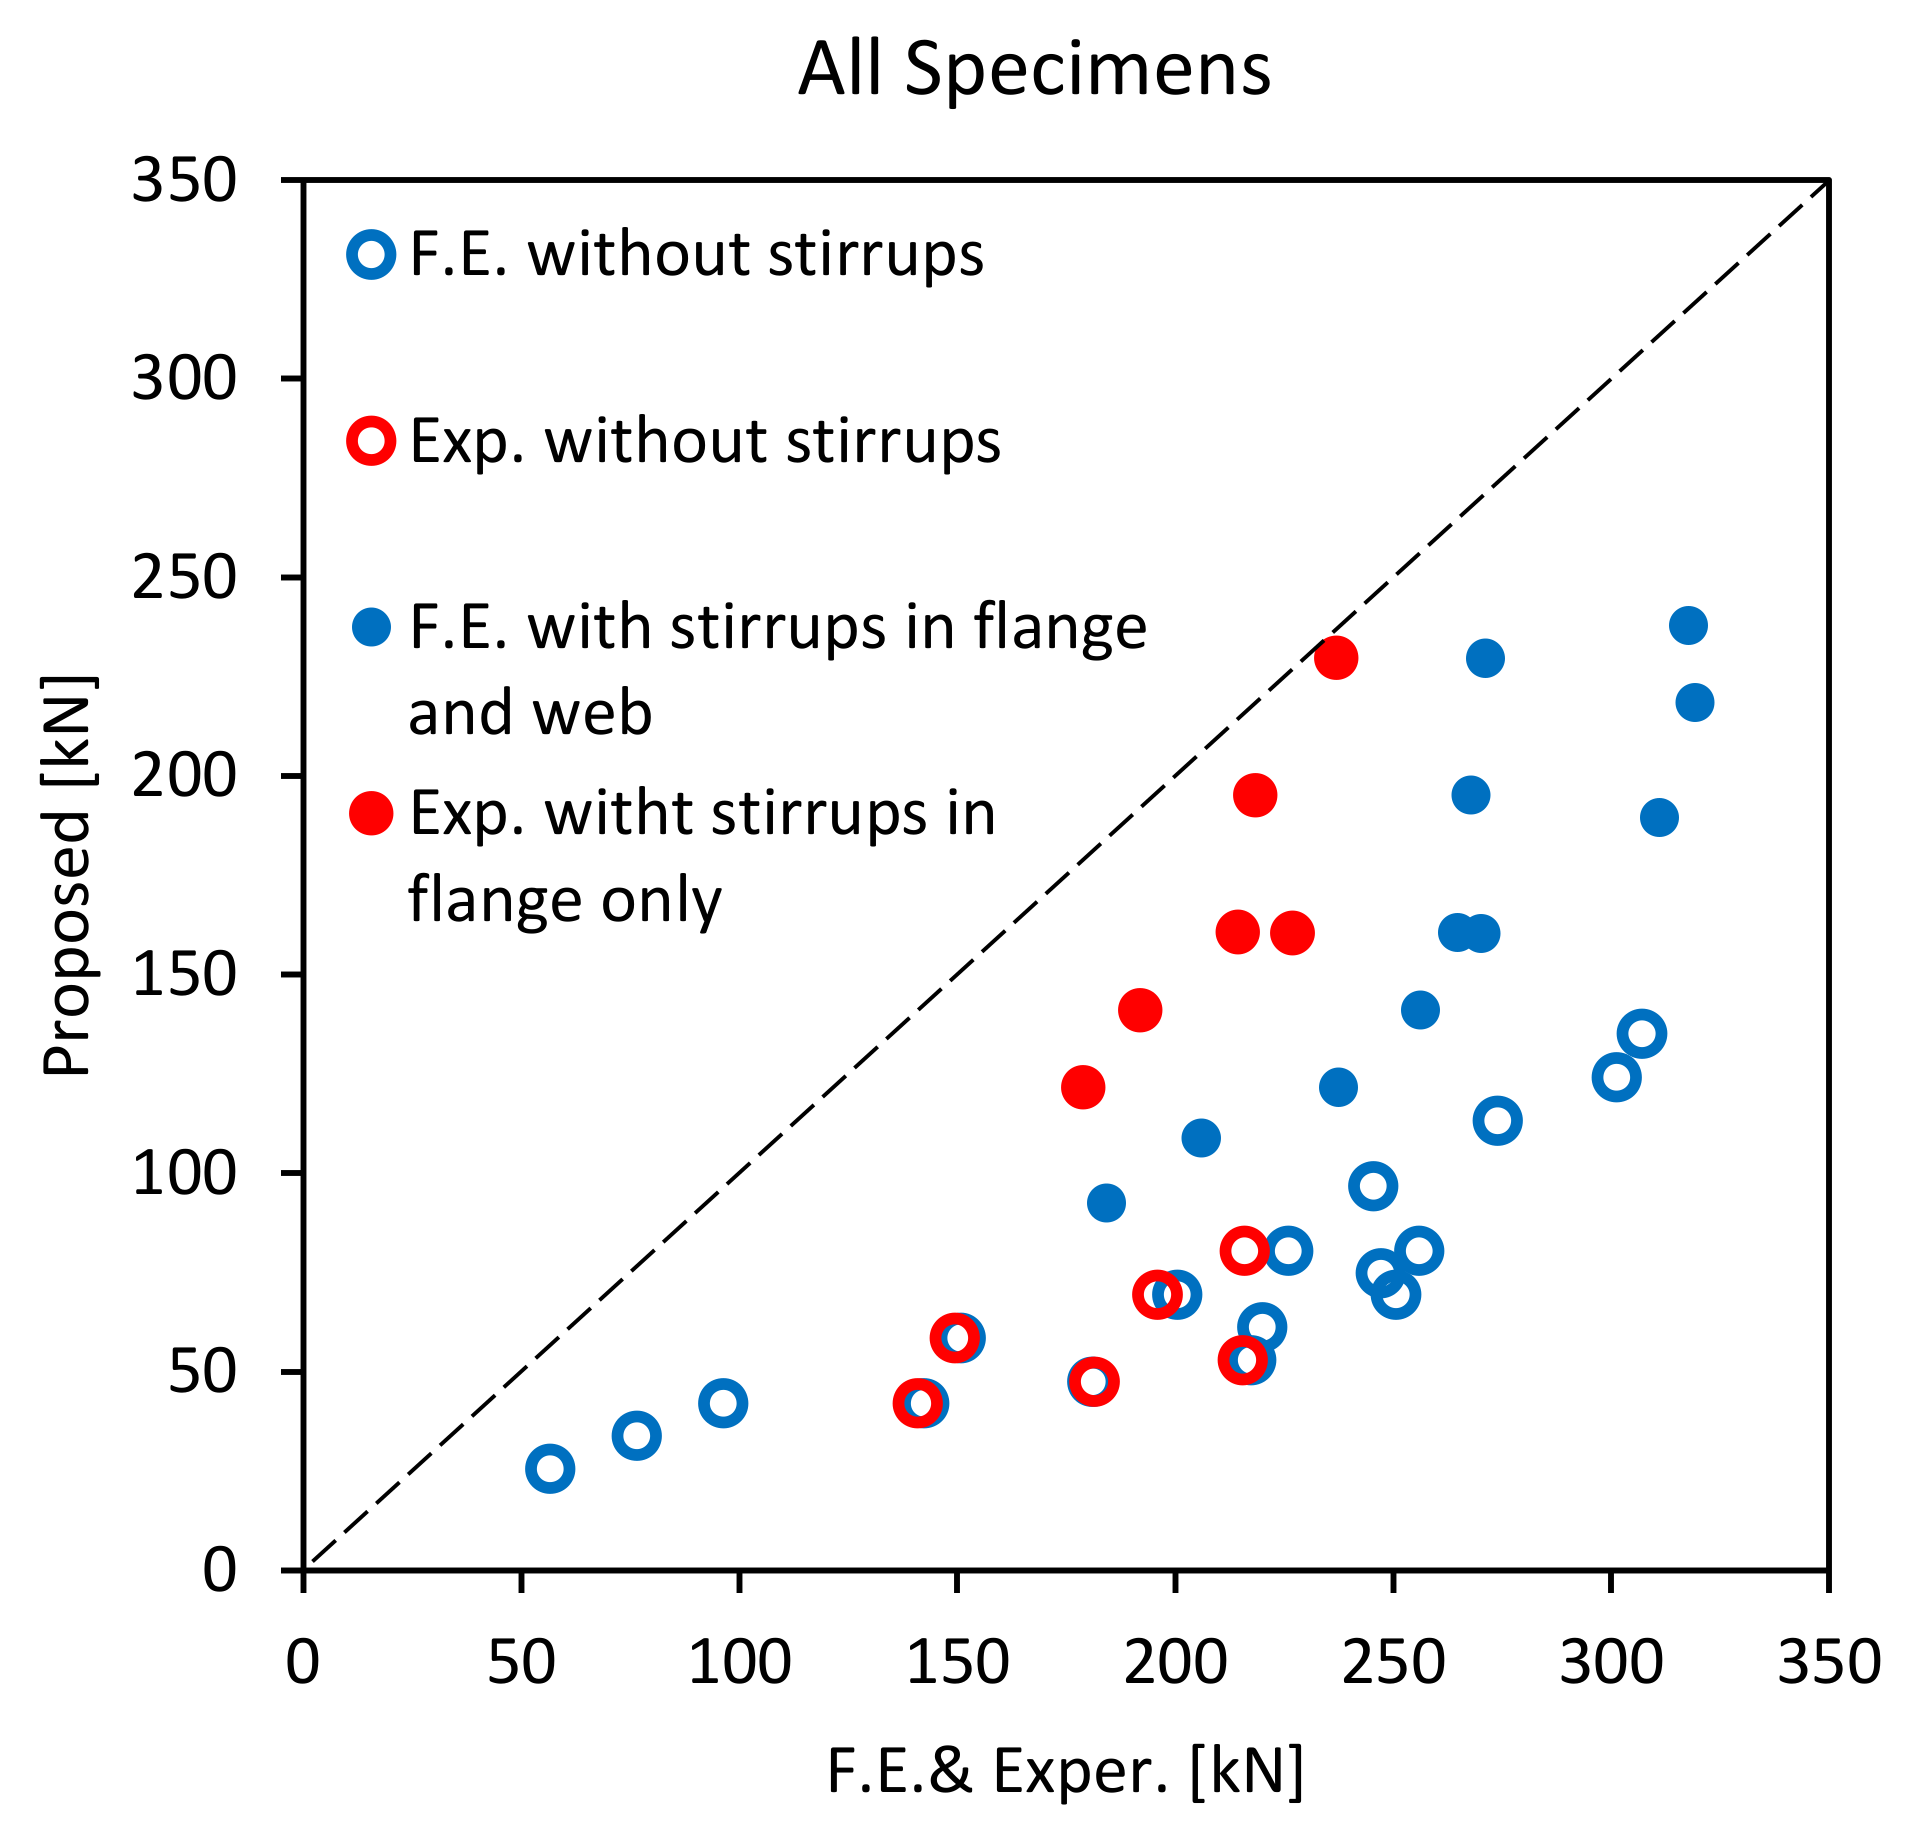
6.2. Discussion of Results

| Specimens | Pu(kN) Ansys | Without Stirrups (∆w) kN | With Stirrups (∆s) kN | |
|---|---|---|---|---|
| ∆w = Pu T − Pu C0 | ∆s = PuT − Pu C0 | |||
| C0 | 113.40 | |||
| with stir. | 232.90 | |||
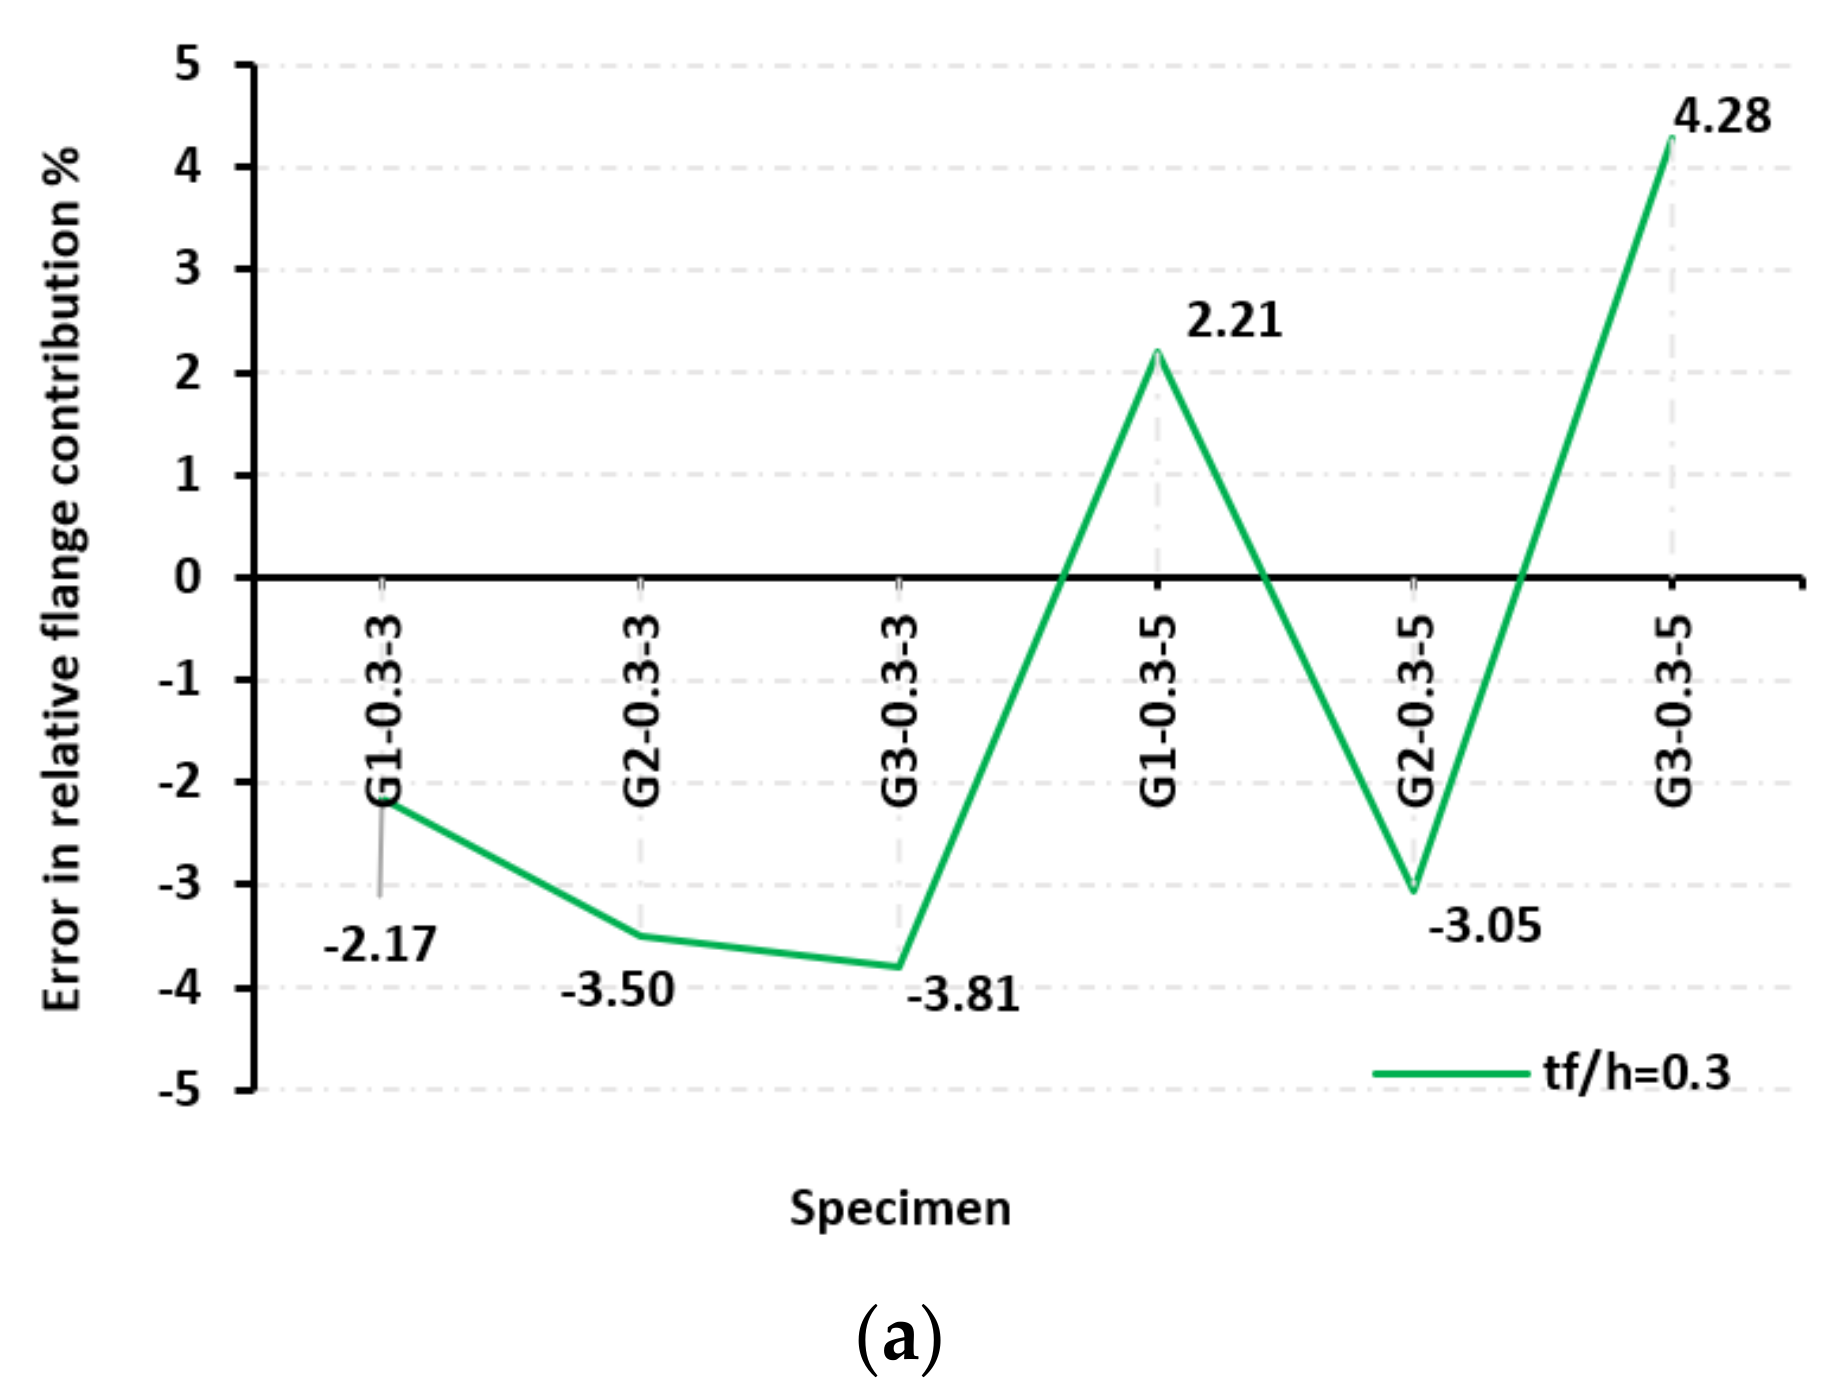
| G1-0.3-3 | 275.00 | 161.60 | −2.17 | |
| with stir. | 398.00 | 165.10 | ||
| G2-0.3-3 | 304.00 | 190.60 | −3.50 | |
| with stir. | 430.16 | 197.26 | ||
| G3-0.3-3 | 346.70 | 233.30 | −3.81 | |
| with stir. | 475.08 | 242.18 | ||
| G1-0.3-5 | 301.77 | 188.37 | 2.21 | |
| with stir. | 417.11 | 184.21 | ||
| G2-0.3-5 | 364.38 | 250.99 | −3.05 | |
| with stir. | 491.53 | 258.64 | ||
| G3-0.3-5 | 423.32 | 309.92 | 4.28 | |
| with stir. | 529.56 | 296.66 | ||
| G1-0.4-3 | 358.46 | 245.06 | −3.58 | |
| with stir. | 486.73 | 253.83 | ||
| G2-0.4-3 | 368.78 | 255.38 | −3.46 | |
| with stir. | 497.12 | 264.22 | ||
| G3-0.4-3 | 375.70 | 262.30 | −6.65 | |
| with stir. | 512.64 | 279.74 | ||
| G1-0.4-5 | 401.11 | 287.71 | 2.53 | |
| with stir. | 513.32 | 280.42 | ||
| G2-0.4-5 | 382.55 | 269.15 | −4.86 | |
| with stir. | 515.13 | 282.23 | ||
| G3-0.4-5 | 431.55 | 318.15 | 4.76 | |
| with stir. | 535.52 | 302.62 | ||
| G1-0.5-3 | 434.9 | 321.50 | 10.22 | |
| with stir. | 521.54 | 288.64 | ||
| G2-0.5-3 | 437.392 | 323.99 | 9.42 | |
| with stir. | 526.356 | 293.46 | ||
| G3-0.5-3 | 452.94 | 339.54 | 9.41 | |
| with stir. | 540.478 | 307.58 | ||
| G1-0.5-5 | 420.36 | 306.96 | 14.01 | |
| with stir. | 496.87 | 263.97 | ||
| G2-0.5-5 | 445.85 | 332.45 | 9.91 | |
| with stir. | 532.39 | 299.49 | ||
| G3-0.5-5 | 474.9 | 361.50 | 14.39 | |
| with stir. | 542.39 | 309.49 |


7. Conclusions
- The shear capacity of T-beams was notably higher than that of rectangular beams with the same web size. The actual increase depended on the flange dimensions and the amount of reinforcement in the flange. Moreover, the cracking load of T-beams was slightly higher than that of beams without the flange.
- The flange thickness was the most effective factor in increasing the shear capacity. Increasing the ratio of the flange thickness to total depth (ρt) from 0.3 to 0.5 increased the shear capacity by 54%, 35%, and 27% for beams without reinforcement, beams with longitudinal reinforcement only, and beams with longitudinal as well as transverse reinforcement, respectively (all refer to flange reinforcement while the web had no shear reinforcement).
- Increasing the width of the flange had less effect on the shear capacity of T-beams compared to increasing its thickness. For instance, increasing the ratio of the flange width to web width (ρb) from 3 to 5 increased the shear capacity by 6% to 19%.
- The use of longitudinal reinforcement in the flange increased its shear strength, and this increase was more pronounced for thinner flanges. In particular, flange reinforcement increased the shear strength by 14% to 43%, 4% to 12%, and 2% to 10% for flange thickness-to-total depth ratios, ρt, of 0.3, 0.4, and 0.5, respectively.
- The presence of flanges delayed crack propagation, especially for flanges with longitudinal reinforcement.
- For beams with T-shaped sections with the flange in the compression side, it is conservative to calculate the shear strength of concrete based on the area of the full cross-section. This is true for the assumed limit of ρb ≤ 5.
- The results of this study help in saving construction costs by utilizing the flange’s contribution to shear strength for flanged beams with thick flanges in the compression side such as the case of double-cantilevered cap beams with inverted T sections.
Author Contributions
Funding
Institutional Review Board Statement
Informed Consent Statement
Data Availability Statement
Acknowledgments
Conflicts of Interest
References
- Ayensa, A.; Oller, E.; Beltrán, B.; Ibarz, E.; Marí, A.; Gracia, L. Influence of the flange’s width and thickness on the shear strength of reinforced concrete beams with T-shaped cross section. Eng. Struct. 2019, 188, 506–518. [Google Scholar] [CrossRef]
- Amna, H.A.; Monstaser, W.M. Shear behavior of reinforced lightweight concrete T-beams. Life Sci. J. 2019, 16, 11–31. [Google Scholar]
- Sarsam, K.; Khalel, R.I.; Mohammed, N. Influence of flange on the shear capacity of reinforced concrete beams. MATEC Web Conf. 2018, 162, 04003. [Google Scholar] [CrossRef]
- Wakjira, T.G.; Ebead, U. Shear span-to-depth ratio effect on steel reinforced grout strengthened reinforced concrete beams. Eng. Struct. 2020, 216, 110737. [Google Scholar] [CrossRef]
- Tetta, Z.C.; Koutas, L.N.; Bournas, D.A. Shear strengthening of concrete members with TRM jackets: Effect of shear span-to-depth ratio, material and amount of external reinforcement. Compos. Part B Eng. 2018, 137, 184–201. [Google Scholar] [CrossRef]
- Hu, B.; Wu, Y.-F. Effect of shear span-to-depth ratio on shear strength components of RC beams. Eng. Struct. 2018, 168, 770–783. [Google Scholar] [CrossRef]
- Samad, A.A.A.; Mohamad, N.; Al-Qershi, M.A.H.; Jayaprakash, J.; Mendis, P. Shear Mechanism and Shear Strength Prediction of Reinforced Concrete T-Beams. J. Teknol. 2016, 78, 471–476. [Google Scholar] [CrossRef]
- Thamrin, R.; Tanjung, J.; Aryanti, R.; Nur, F.; Devinus, A. Shear strength of reinforced concrete T-Beam without stirrups. J. Eng. Sci. Technol. 2016, 11, 548–562. [Google Scholar]
- Mari, A.; Bairan, M.; Cladera, A.; Oller, E.; Rivas, C. Shear flexural strength mechanical model for the design and assessment of reinforced concrete beams Subjected to point or distributed loads. Front. Struct. Civ. Eng. 2014, 8, 337–353. [Google Scholar] [CrossRef]
- Elgohary, A.; Abdelhafiez, A.; Asran, A. Effect of flange width on shear strength of R.C T-beams. J. Al Azhar 2019, 14, 875–882. [Google Scholar]
- Chalioris, C.E.; Zapris, A.G.; Karayannis, C.G. U-Jacketing Applications of Fiber-Reinforced Polymers in Reinforced Con-crete T-Beams against Shear—Tests and Design. Fibers 2020, 8, 13. [Google Scholar] [CrossRef]
- Foster, R.M.; Morley, C.T.; Lees, J.M. Shear Capacity of Reinforced Concrete T-Beams Retrofit with Externally Bonded CFRP Fabric: A New Perspective. J. Struct. Eng. 2020, 146, 04020253. [Google Scholar] [CrossRef]
- Etman, E. External bonded shear reinforcement for T-section beams. Struct. Concr. 2011, 12, 198–209. [Google Scholar] [CrossRef]
- Pohoryles, D.A.; Melo, J.; Rossetto, T. Combined Flexural and Shear Strengthening of RC T-Beams with FRP and TRM: Experimental Study and Parametric Finite Element Analyses. Buildings 2021, 11, 520. [Google Scholar] [CrossRef]
- ACI Committee Building Code Requirements for Structural Concrete (ACI 318-08) and Commentary (318R-08); American Concrete Institute: Farmington Hills, MI, USA, 2008.
- CSA Committee A23; Design of Concrete Structure. Canadian Standards Association: Mississauga, ON, Canada, 2004.
- European Committee for Standardization. CEN, EN 1992-1-Eurocode 2: Design of Concrete Structures—Part 1-1: General Rules and Rules for Buildings; European Committee for Standardization: Brussels, Belgium, 2004. [Google Scholar]
- Ioannis, Z.; Maria, K.; Prodromos, Z. Shear Strength of Reinforced Concrete T-Beams. ACI J. 2006, 103, 693–700. [Google Scholar]
- Sahoo, D.R.; Bhagat, S.; Reddy, T.C.V. Experimental study on shear-span to effective-depth ratio of steel fiber reinforced concrete T-beams. Mater. Struct. Constr. 2016, 49, 3815–3830. [Google Scholar] [CrossRef]
- Yehia, B.; Wahab, M. Fracture mechanics of flanged reinforced concrete sections. Eng. Struct. 2007, 29, 2334–2343. [Google Scholar] [CrossRef]
- Pansuk, W.; Sato, Y. Shear Mechanism of Reinforced Concrete T-Beam with Stirrups. J. Adv. Concr. Technol. 2007, 5, 395–408. [Google Scholar] [CrossRef]
- Deifalla, A.; Ghobarah, A. Behavior and analysis of inverted T-shaped RC beams under shear and torsion. Eng. Struct. 2014, 68, 57–70. [Google Scholar] [CrossRef]
- Cladera, A.; Marí, A.; Ribas, C.; Bairán, J.; Oller, E. Predicting the shear–flexural strength of slender reinforced concrete T and I shaped beams. Eng. Struct. 2015, 101, 386–398. [Google Scholar] [CrossRef]
- Ribas Gonzalez, C.R.; Fernández Ruiz, M. Influence of flanges on the shear-carrying capacity of reinforced concrete beams without web reinforcement. Struct. Concr. 2017, 18, 720–732. [Google Scholar] [CrossRef]
- Eswaramoorthi, P.; Prabhu, S.; Palanisamy, M. Experimental Study of Reinforced Concrete Continuous Rectangular and Flanged Beams at Support Region. Int. J. Civ. Eng. Technol. 2017, 8, 706–713. [Google Scholar]
- Huber, P.; Huber, T.; Kollegger, J. Experimental and theoretical study on the shear behavior of single-and multi-span T-and I-shaped post-tensioned beams. Struct. Concr. 2020, 21, 393–408. [Google Scholar] [CrossRef]
- Cavagnis, F.; Ruiz, M.F.; Muttoni, A. An analysis of the shear-transfer actions in reinforced concrete members without transverse reinforcement based on refined experimental measurements. Struct. Concr. 2017, 19, 49–64. [Google Scholar] [CrossRef]
- Premalatha, J.; Shanthi Vengadeshwari, R.; Srihari, P. Finite element modeling and analysis of RC beams with GFRP and steel bars. Int. J. Civ. Eng. Technol. 2017, 8, 671–679. [Google Scholar]
- Montava, I.; Irles, R.; Segura, J.; Gadea, J.M.; Juliá, E. Numerical Simulation of Steel Reinforced Concrete (SRC) Joints. Metals 2019, 9, 131. [Google Scholar] [CrossRef]
- El-Azab, I.A. Behavior of Flanged Reinforced Concrete Beams Subjected to Shear Force. Ph.D. Thesis, Benha University, Benha, Egypt, 2022. “to appear”. p. 115. [Google Scholar]


| Specimen | fcu, (Mpa) | Cross-Sectional Area (cm2) | Cross-Sec. Area Increasing (%) | Flange Dim. | Stirrups in Flange | Longitudinal Reinforcement in Flange | Longitudinal Reinforcement % | ||
|---|---|---|---|---|---|---|---|---|---|
| ρt | ρb | Bottom | Top | ||||||
| C0 | 36.4 | 300 | ------ | ------ | ------ | ------ | ------ | ||
| G1-0.3-3 | 36.4 | 480 | 60% | 90/h = 0.3 | 3 | ------ | ------ | ------ | |
| G2-0.4-3 | 36.4 | ------ | 4 Ø 8 | 3 Ø 6 | 1.055% | ||||
| G3-0.5-3 | 36.4 | Ø8@75 | |||||||
| G1-0.3-3 | 34.2 | 540 | 80% | 120/h = 0.4 | ------ | ------ | ------ | ||
| G2-0.4-3 | 34.2 | ------ | 4 Ø 10 | 2 Ø 6 | 1.029% | ||||
| G3-0.5-3 | 34.2 | Ø8@75 | |||||||
| G1-0.3-3 | 34.2 | 600 | 100% | 150/h = 0.5 | ------ | ------ | ------ | ||
| G2-0.4-3 | 36.8 | ------ | 4 Ø 10 | 2 Ø 10 | 1.047% | ||||
| G3-0.5-3 | 36.8 | Ø8@75 | |||||||
| G1-0.3-5 | 36.8 | 660 | 120% | 90/h = 0.3 | 5 | ------ | ------ | ------ | |
| G2-0.4-5 | 35.6 | ------ | 4 Ø 10 | 2 Ø 6 + 2 Ø 8 | 1.046% | ||||
| G3-0.5-5 | 35.6 | Ø8@75 | |||||||
| G1-0.3-5 | 35.6 | 780 | 160% | 120/h = 0.4 | ------ | ------ | ------ | ||
| G2-0.4-5 | 35.6 | ------ | 6 Ø 10 | 2 Ø 8 + 2 Ø 6 | 1.046% | ||||
| G3-0.5-5 | 35.6 | Ø8@75 | |||||||
| G1-0.3-5 | 34.8 | 900 | 200% | 150/h = 0.5 | ------ | ------ | ------ | ||
| G2-0.4-5 | 34.8 | ------ | 6 Ø 10 | 4 Ø 10 | 1.046% | ||||
| G3-0.5-5 | 34.8 | Ø8@75 | |||||||
| Specimen | fcu, (Mpa) | ρt | ρb | ζ | Cracking Load Pcr (kN) | Ultimate Load Pu (kN) | Max. Recorded Deflection (mm) | Mode of Failure | |
|---|---|---|---|---|---|---|---|---|---|
| C0 | 36.4 | --- | -- | --- | 95 | 106 | 0 | 2.33 | |
| G1-0.3-3 | 36.4 | 0.3 | 3 | --- | 100 | 282 | 165 | 4.74 | |
| G1-0.4-3 | 36.4 | 0.4 | --- | 105 | 363 | 241 | 5.97 | ||
| G1-0.5-3 | 36.4 | 0.5 | --- | 110 | 431 | 305 | 5.98 | ||
| G2-0.3-3 | 34.2 | 0.3 | 1.055 | 90 | 326 | 207 | 5.80 | Shear | |
| G2-0.4-3 | 34.2 | 0.4 | 1.029 | 105 | 377 | 255 | 5.87 | ||
| G2-0.5-3 | 34.2 | 0.5 | 1.047 | 115 | 439 | 312 | 4.43 | ||
| G3-0.3-3 | 34.2 | 0.3 | 1.055 | 110 | 358 | 237 | 5.89 | ||
| G3-0.4-3 | 36.8 | 0.4 | 1.029 | 100 | 384 | 261 | 7.07 | ||
| G3-0.5-3 | 36.8 | 0.5 | 1.047 | 115 | 454 | 327 | 6.22 | ||
| G1-0.3-5 | 36.8 | 0.3 | 5 | --- | 115 | 299 | 181 | 4.49 | |
| G1-0.4-5 | 35.6 | 0.4 | --- | 120 | 392 | 268 | 4.79 | ||
| G1-0.5-5 | 35.6 | 0.5 | --- | 115 | 432 | 307 | 6.59 | ||
| G2-0.3-5 | 35.6 | 0.3 | 1.046 | 110 | 342 | 221 | 5.11 | ||
| G2-0.4-5 | 35.6 | 0.4 | 1.046 | 120 | 383 | 260 | 6.51 | Shear | |
| G2-0.5-5 | 35.6 | 0.5 | 1.046 | 115 | 446 | 320 | 9.11 | ||
| G3-0.3-5 | 34.8 | 0.3 | 1.046 | 95 | 429 | 304 | 8.05 | ||
| G3-0.4-5 | 34.8 | 0.4 | 1.046 | 85 | 437 | 311 | 9.56 | ||
| G3-0.5-5 | 34.8 | 0.5 | 1.046 | 125 | 474 | 346 | 10.13 |
| Specimen | fc’ (Mpa) | fyt (Mpa) | Dimensions [mm] | Av (mm2) | F.E. Method | Proposed Method (kN) | VP/VF.E. | ||||||||
|---|---|---|---|---|---|---|---|---|---|---|---|---|---|---|---|
| bw | dw | L’ | tf | df | Av.w | Av.f | VF.E (kN) | Vc | Vs-w | Vs-f | VP | ||||
| C0 | 28.8 | 240 | 100 | 280 | 0 | 0 | 0 | 0.00 | 0.00 | 56.7 | 25.54 | 0.00 | 0.00 | 25.54 | 0.45 |
| G1-0.15-3 | 100 | 45 | 25 | 76.5 | 33.76 | 33.76 | 0.44 | ||||||||
| G1-0.30-3 | 90 | 70 | 142.4 | 41.97 | 41.97 | 0.29 | |||||||||
| G1-0.40-3 | 120 | 100 | 181.0 | 47.44 | 47.44 | 0.26 | |||||||||
| G1-0.50-3 | 150 | 130 | 217.5 | 52.91 | 52.91 | 0.24 | |||||||||
| G1-0.65-3 | 195 | 175 | 220.1 | 61.13 | 61.13 | 0.28 | |||||||||
| G1-0.80-3 | 240 | 220 | 250.8 | 69.34 | 69.34 | 0.28 | |||||||||
| G1-0.90-3 | 270 | 250 | 247.3 | 74.81 | 74.81 | 0.30 | |||||||||
| G1-1-3 | 300 | 280 | 256.0 | 76.63 | 76.63 | 0.30 | |||||||||
| G1-0.15-5 | 200 | 45 | 25 | 96.4 | 41.97 | 41.97 | 0.44 | ||||||||
| G1-0.30-5 | 90 | 70 | 150.9 | 58.39 | 58.39 | 0.39 | |||||||||
| G1-0.40-5 | 120 | 100 | 200.6 | 69.34 | 69.34 | 0.35 | |||||||||
| G1-0.50-5 | 150 | 130 | 226.0 | 80.28 | 80.28 | 0.36 | |||||||||
| G1-0.65-5 | 195 | 175 | 245.5 | 96.71 | 96.71 | 0.39 | |||||||||
| G1-0.80-5 | 240 | 220 | 274.0 | 113.13 | 113.13 | 0.41 | |||||||||
| G1-0.90-5 | 270 | 250 | 301.4 | 124.07 | 124.07 | 0.41 | |||||||||
| G1-1-5 | 300 | 280 | 307.2 | 127.72 | 127.72 | 0.42 | |||||||||
| C0-S | 280 | 0 | 0 | 0 | 56.6 | 0 | 116.50 | 25.54 | 50.71 | 0.00 | 76.26 | 0.65 | |||
| G3-0.15-3 | 235 | 100 | 45 | 25 | 56.6 | 201 | 184.28 | 33.76 | 42.56 | 16.10 | 92.41 | 0.50 | |||
| G3-0.30-3 | 190 | 90 | 70 | 237.50 | 41.97 | 34.41 | 45.07 | 121.45 | 0.51 | ||||||
| G3-0.40-3 | 160 | 120 | 100 | 256.30 | 47.44 | 28.98 | 64.38 | 140.80 | 0.55 | ||||||
| G3-0.50-3 | 130 | 150 | 130 | 270.20 | 52.91 | 23.55 | 83.70 | 160.16 | 0.59 | ||||||
| G3-0.65-3 | 85 | 195 | 175 | 311.12 | 61.13 | 15.40 | 112.67 | 189.19 | 0.61 | ||||||
| G3-0.80-3 | 40 | 240 | 220 | 319.25 | 69.34 | 7.24 | 141.64 | 218.23 | 0.68 | ||||||
| G3-0.90-3 | 10 | 270 | 250 | 317.78 | 74.81 | 1.81 | 160.96 | 237.58 | 0.75 | ||||||
| G3-1-3 | 0 | 300 | 280 | 350.56 | 76.63 | 0.00 | 180.28 | 256.91 | 0.73 | ||||||
| G3-0.15-5 | 235 | 200 | 45 | 25 | 302 | 205.95 | 41.97 | 42.56 | 24.14 | 108.67 | 0.53 | ||||
| G3-0.30-5 | 190 | 90 | 70 | 264.80 | 58.39 | 34.41 | 67.60 | 160.40 | 0.61 | ||||||
| G3-0.40-5 | 160 | 120 | 100 | 267.80 | 69.34 | 28.98 | 96.58 | 194.89 | 0.73 | ||||||
| G3-0.50-5 | 130 | 150 | 130 | 271.20 | 80.28 | 23.55 | 125.55 | 229.38 | 0.85 | ||||||
| G3-0.65-5 | 85 | 195 | 175 | 356.74 | 96.71 | 15.40 | 169.01 | 281.11 | 0.79 | ||||||
| G3-0.80-5 | 40 | 240 | 220 | 369.52 | 113.13 | 7.24 | 212.47 | 332.84 | 0.90 | ||||||
| G3-0.90-5 | 10 | 270 | 250 | 392.70 | 124.07 | 1.81 | 241.44 | 367.33 | 0.94 | ||||||
| G3-1-5 | 0 | 300 | 280 | 411.71 | 127.72 | 0.00 | 270.41 | 398.14 | 0.97 | ||||||
| Specimen | fc’ (Mpa) | fyt (Mpa) | Dimensions [mm] | Av (mm2) | ACI | Proposed Method (kN) | VP/VACI | ||||||||
|---|---|---|---|---|---|---|---|---|---|---|---|---|---|---|---|
| bw | dw | L’ | tf | df | Av.w | Av.f | VACI (kN) | Vc | Vs-w | Vs-f | VP | ||||
| C0 | 28.8 | 240 | 100 | 280 | 0 | 0 | 0 | 0.00 | 0.00 | 25.54 | 25.54 | 0.00 | 0.00 | 25.54 | 1.00 |
| G1-0.15-3 | 100 | 45 | 25 | 25.54 | 33.76 | 33.76 | 1.32 | ||||||||
| G1-0.30-3 | 90 | 70 | 41.97 | 41.97 | 1.64 | ||||||||||
| G1-0.40-3 | 120 | 100 | 47.44 | 47.44 | 1.86 | ||||||||||
| G1-0.50-3 | 150 | 130 | 52.91 | 52.91 | 2.07 | ||||||||||
| G1-0.65-3 | 195 | 175 | 61.13 | 61.13 | 2.39 | ||||||||||
| G1-0.80-3 | 240 | 220 | 69.34 | 69.34 | 2.71 | ||||||||||
| G1-0.90-3 | 270 | 250 | 74.81 | 74.81 | 2.93 | ||||||||||
| G1-1-3 | 300 | 280 | 76.63 | 76.63 | 76.63 | 1.00 | |||||||||
| G1-0.15-5 | 200 | 45 | 25 | 25.54 | 41.97 | 41.97 | 1.64 | ||||||||
| G1-0.30-5 | 90 | 70 | 58.39 | 58.39 | 2.29 | ||||||||||
| G1-0.40-5 | 120 | 100 | 69.34 | 69.34 | 2.71 | ||||||||||
| G1-0.50-5 | 150 | 130 | 80.28 | 80.28 | 3.14 | ||||||||||
| G1-0.65-5 | 195 | 175 | 96.71 | 96.71 | 3.79 | ||||||||||
| G1-0.80-5 | 240 | 220 | 113.13 | 113.13 | 4.43 | ||||||||||
| G1-0.90-5 | 270 | 250 | 124.07 | 124.07 | 4.86 | ||||||||||
| G1-1-5 | 300 | 280 | 127.72 | 127.72 | 127.72 | 1.00 | |||||||||
| C0-S | 280 | 0 | 0 | 0 | 56.6 | 0 | 76.26 | 25.54 | 50.71 | 0.00 | 76.26 | 1.00 | |||
| G3-0.15-3 | 235 | 100 | 45 | 25 | 56.6 | 201.2 | 76.26 | 33.76 | 42.56 | 16.10 | 92.41 | 1.21 | |||
| G3-0.30-3 | 190 | 90 | 70 | 41.97 | 34.41 | 45.07 | 121.45 | 1.59 | |||||||
| G3-0.40-3 | 160 | 120 | 100 | 47.44 | 28.98 | 64.38 | 140.80 | 1.85 | |||||||
| G3-0.50-3 | 130 | 150 | 130 | 52.91 | 23.55 | 83.70 | 160.16 | 2.10 | |||||||
| G3-0.65-3 | 85 | 195 | 175 | 61.13 | 15.40 | 112.67 | 189.19 | 2.48 | |||||||
| G3-0.80-3 | 40 | 240 | 220 | 69.34 | 7.24 | 141.64 | 218.23 | 2.86 | |||||||
| G3-0.90-3 | 10 | 270 | 250 | 74.81 | 1.81 | 160.96 | 237.58 | 3.12 | |||||||
| G3-1-3 | 0 | 300 | 280 | 256.91 | 76.63 | 0.00 | 180.28 | 256.91 | 1.00 | ||||||
| G3-0.15-5 | 235 | 200 | 45 | 25 | 301.8 | 76.26 | 41.97 | 42.56 | 24.14 | 108.67 | 1.43 | ||||
| G3-0.30-5 | 190 | 90 | 70 | 58.39 | 34.41 | 67.60 | 160.40 | 2.10 | |||||||
| G3-0.40-5 | 160 | 120 | 100 | 69.34 | 28.98 | 96.58 | 194.89 | 2.56 | |||||||
| G3-0.50-5 | 130 | 150 | 130 | 80.28 | 23.55 | 125.55 | 229.38 | 3.01 | |||||||
| G3-0.65-5 | 85 | 195 | 175 | 96.71 | 15.40 | 169.01 | 281.11 | 3.69 | |||||||
| G3-0.80-5 | 40 | 240 | 220 | 113.13 | 7.24 | 212.47 | 332.84 | 4.36 | |||||||
| G3-0.90-5 | 10 | 270 | 250 | 124.07 | 1.81 | 241.44 | 367.33 | 4.82 | |||||||
| G3-1-5 | 0 | 300 | 280 | 398.14 | 127.72 | 0.00 | 270.41 | 398.14 | 1.00 | ||||||
Publisher’s Note: MDPI stays neutral with regard to jurisdictional claims in published maps and institutional affiliations. |
© 2022 by the authors. Licensee MDPI, Basel, Switzerland. This article is an open access article distributed under the terms and conditions of the Creative Commons Attribution (CC BY) license (https://creativecommons.org/licenses/by/4.0/).
Share and Cite
Ramadan, O.M.; Abdel-Kareem, A.H.; El-Azab, I.A.; Abousafa, H.R. Flange Contribution to the Shear Strength of RC T-Beams with Flange in Compression. Buildings 2022, 12, 803. https://doi.org/10.3390/buildings12060803
Ramadan OM, Abdel-Kareem AH, El-Azab IA, Abousafa HR. Flange Contribution to the Shear Strength of RC T-Beams with Flange in Compression. Buildings. 2022; 12(6):803. https://doi.org/10.3390/buildings12060803
Chicago/Turabian StyleRamadan, Osman M., Ahmed H. Abdel-Kareem, Ibrahim A. El-Azab, and Hala R. Abousafa. 2022. "Flange Contribution to the Shear Strength of RC T-Beams with Flange in Compression" Buildings 12, no. 6: 803. https://doi.org/10.3390/buildings12060803