
Intelligent Novel IMF D-SWARA—Rough MARCOS Algorithm for Selection Construction Machinery for Sustainable Construction of Road Infrastructure


Abstract
:1. Introduction
- A novel integrated model for evaluating the performance of construction machinery for sustainable construction was constructed.
- The original multi-criteria model allows for a new extension of the IMF SWARA method that processes fuzzy information based on D numbers and application in the construction industry.
- A flexible multi-criteria model that allows for multiphase verification tests in order to check obtained results related to the evaluation of construction machinery is proposed.
2. Literature Review
2.1. Importance of Construction Equipment in Civil Engineering
2.2. Application of MCDM Methods in the Construction Industry
2.3. The Application of MCDM Methods Based on D Numbers
3. Methodology
- Category 1—asphalting width is up to 5 m;
- Category 2—asphalting width is from 5 to 10 m;
- Category 3—asphalting width is over 10 m.
3.1. Description of the Problem
3.1.1. Definition of Alternatives
3.1.2. Definition of Criteria
3.2. D Numbers
3.3. IMF D-SWARA Algorithm
- Step 1: Ranking of criteria according to their importance by expert assessment.
- Step 2: In group decision-making, r experts present their preferences by applying fuzzy linguistic variables from Table 4. Starting from the previously determined rank, the relatively smaller significance of the criterion (criterion Cj) was determined in relation to the previous one (Cj−1), and this was repeated for each subsequent criterion [67,68].
- Step 3: Transformation of fuzzy D linguistic variables in the matrix. The evaluation of the () criteria under the () criteria is represented by the D number , where represents the fuzzy linguistic variable from Table 2, and represents the probability of choosing the fuzzy linguistic variable. By applying the rules for the combination of D numbers (2) and (3), the final values of fuzzy D numbers are transformed into fuzzy values, . Thus, an aggregated fuzzy D matrix was obtained.
- Step 4: Calculation of the weights (5):
- Step 5: Calculation of the fuzzy weight coefficients (6):where wj is the fuzzy relative weight of the criteria j, and m denotes the total number of criteria.
3.4. Rough MARCOS Method
- Step 1: The Rough Decision Matrix () is organized as follows:where vij denotes values of the initial Rough Matrix, which consists of m alternatives and n criteria.
- Step 2: The Extended Rough Matrix is arranged by adding anti-ideal and ideal solutions to the matrix.where AID is anti-ideal, while ID is ideal solution. In Equations (8) and (9), and indicate beneficial and cost criteria, respectively.
- Step 3: The Rough Normalized Matrix is obtained by Equations (11) and (12):where and are low and upper values from the initial decision matrix, respectively. Elements and represents low and upper of ideal solution.
- Step 4: The Rough Weighted Normalized Matrix is computed by Equation (13):In this step, it is necessary to multiply the values of criteria weights by values from the normalized matrix.
- Step 5: is computed by using Equation (14).where represents the sum of the elements of matrix E.
- Step 6: Rough utility degrees of alternatives and are calculated as follows:where and are low and upper values from the previous summed matrix, respectively. Elements and represent low and upper in respect to the ideal solution.
- Step 7: Rough utility degrees ( and ) are converted into crisp and , using Equations (17) and (18):
- Step 8: The utility functions in relation to the anti-ideal and ideal solutions are computed by Equations (20) and (21), respectively.where we have the following:
- Step 9: The alternatives are sorted from the highest utility function to the lowest utility function.
4. Results
4.1. Application of IMF D-SWARA Algorithm
4.2. Evaluation of Alternatives—Application of Rough MARCOS Algorithm
5. Sensitivity, Comparative Analysis, and Discussion
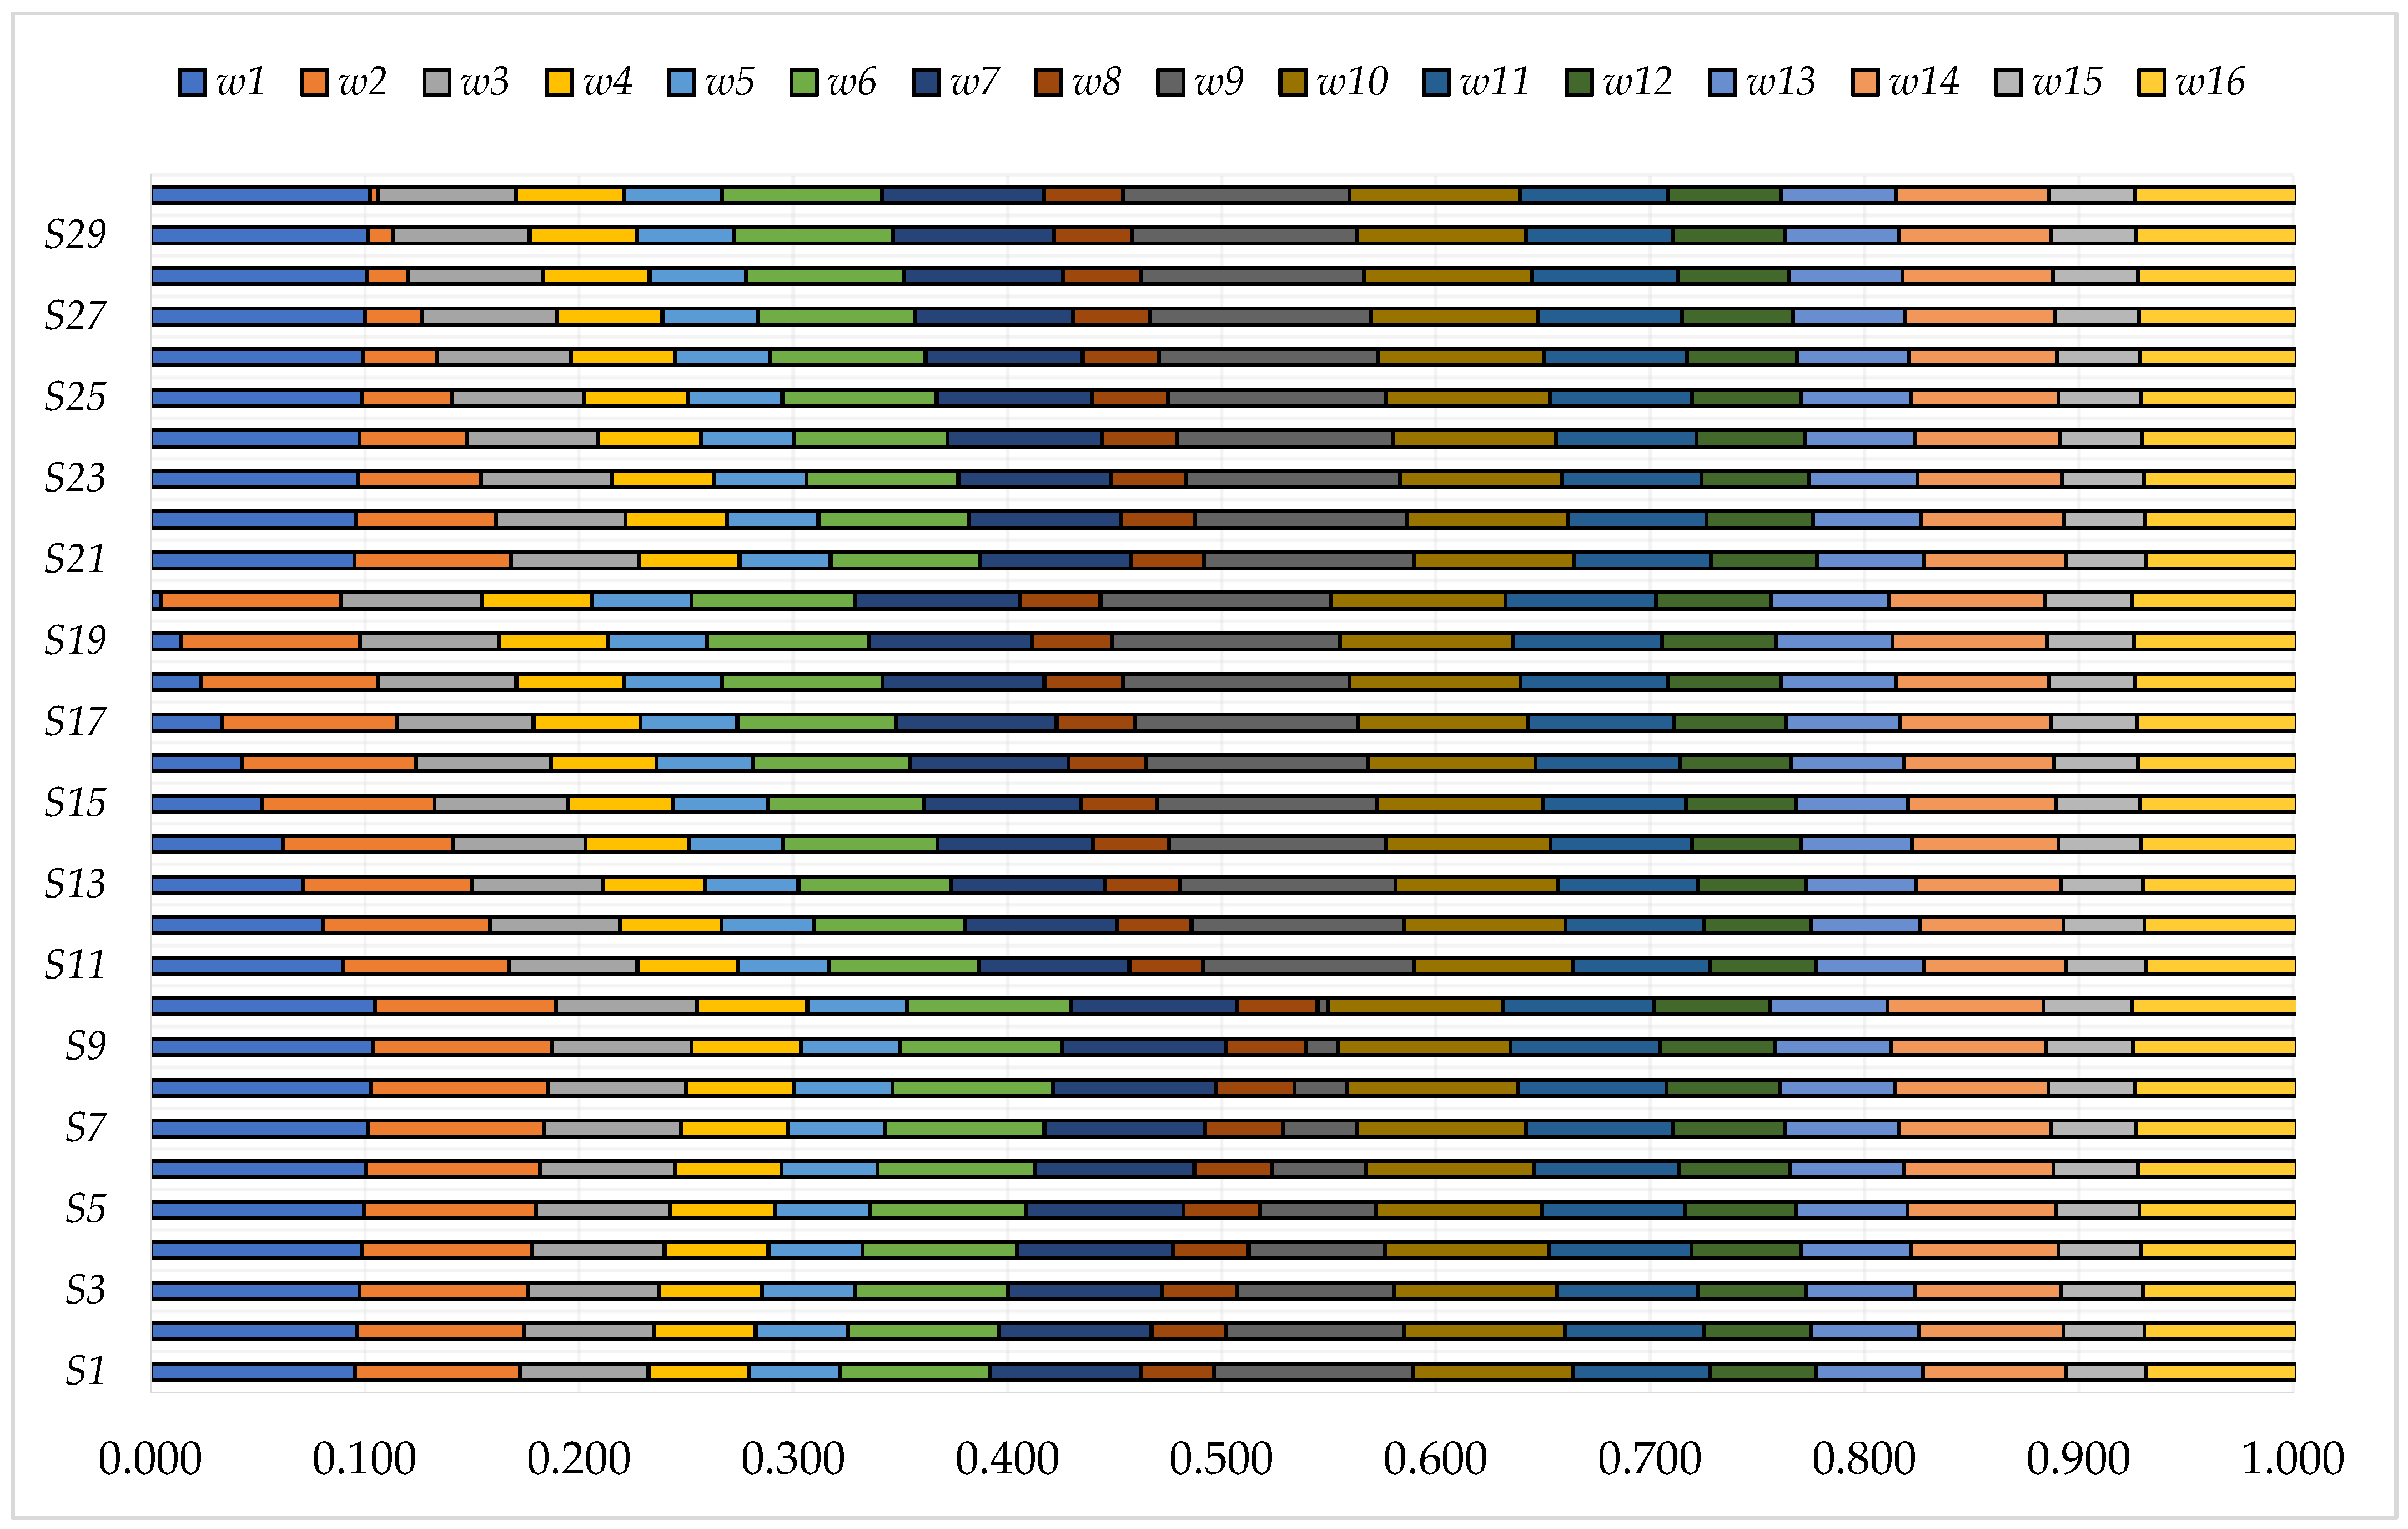
5.1. Simulation of New Criterion Weights
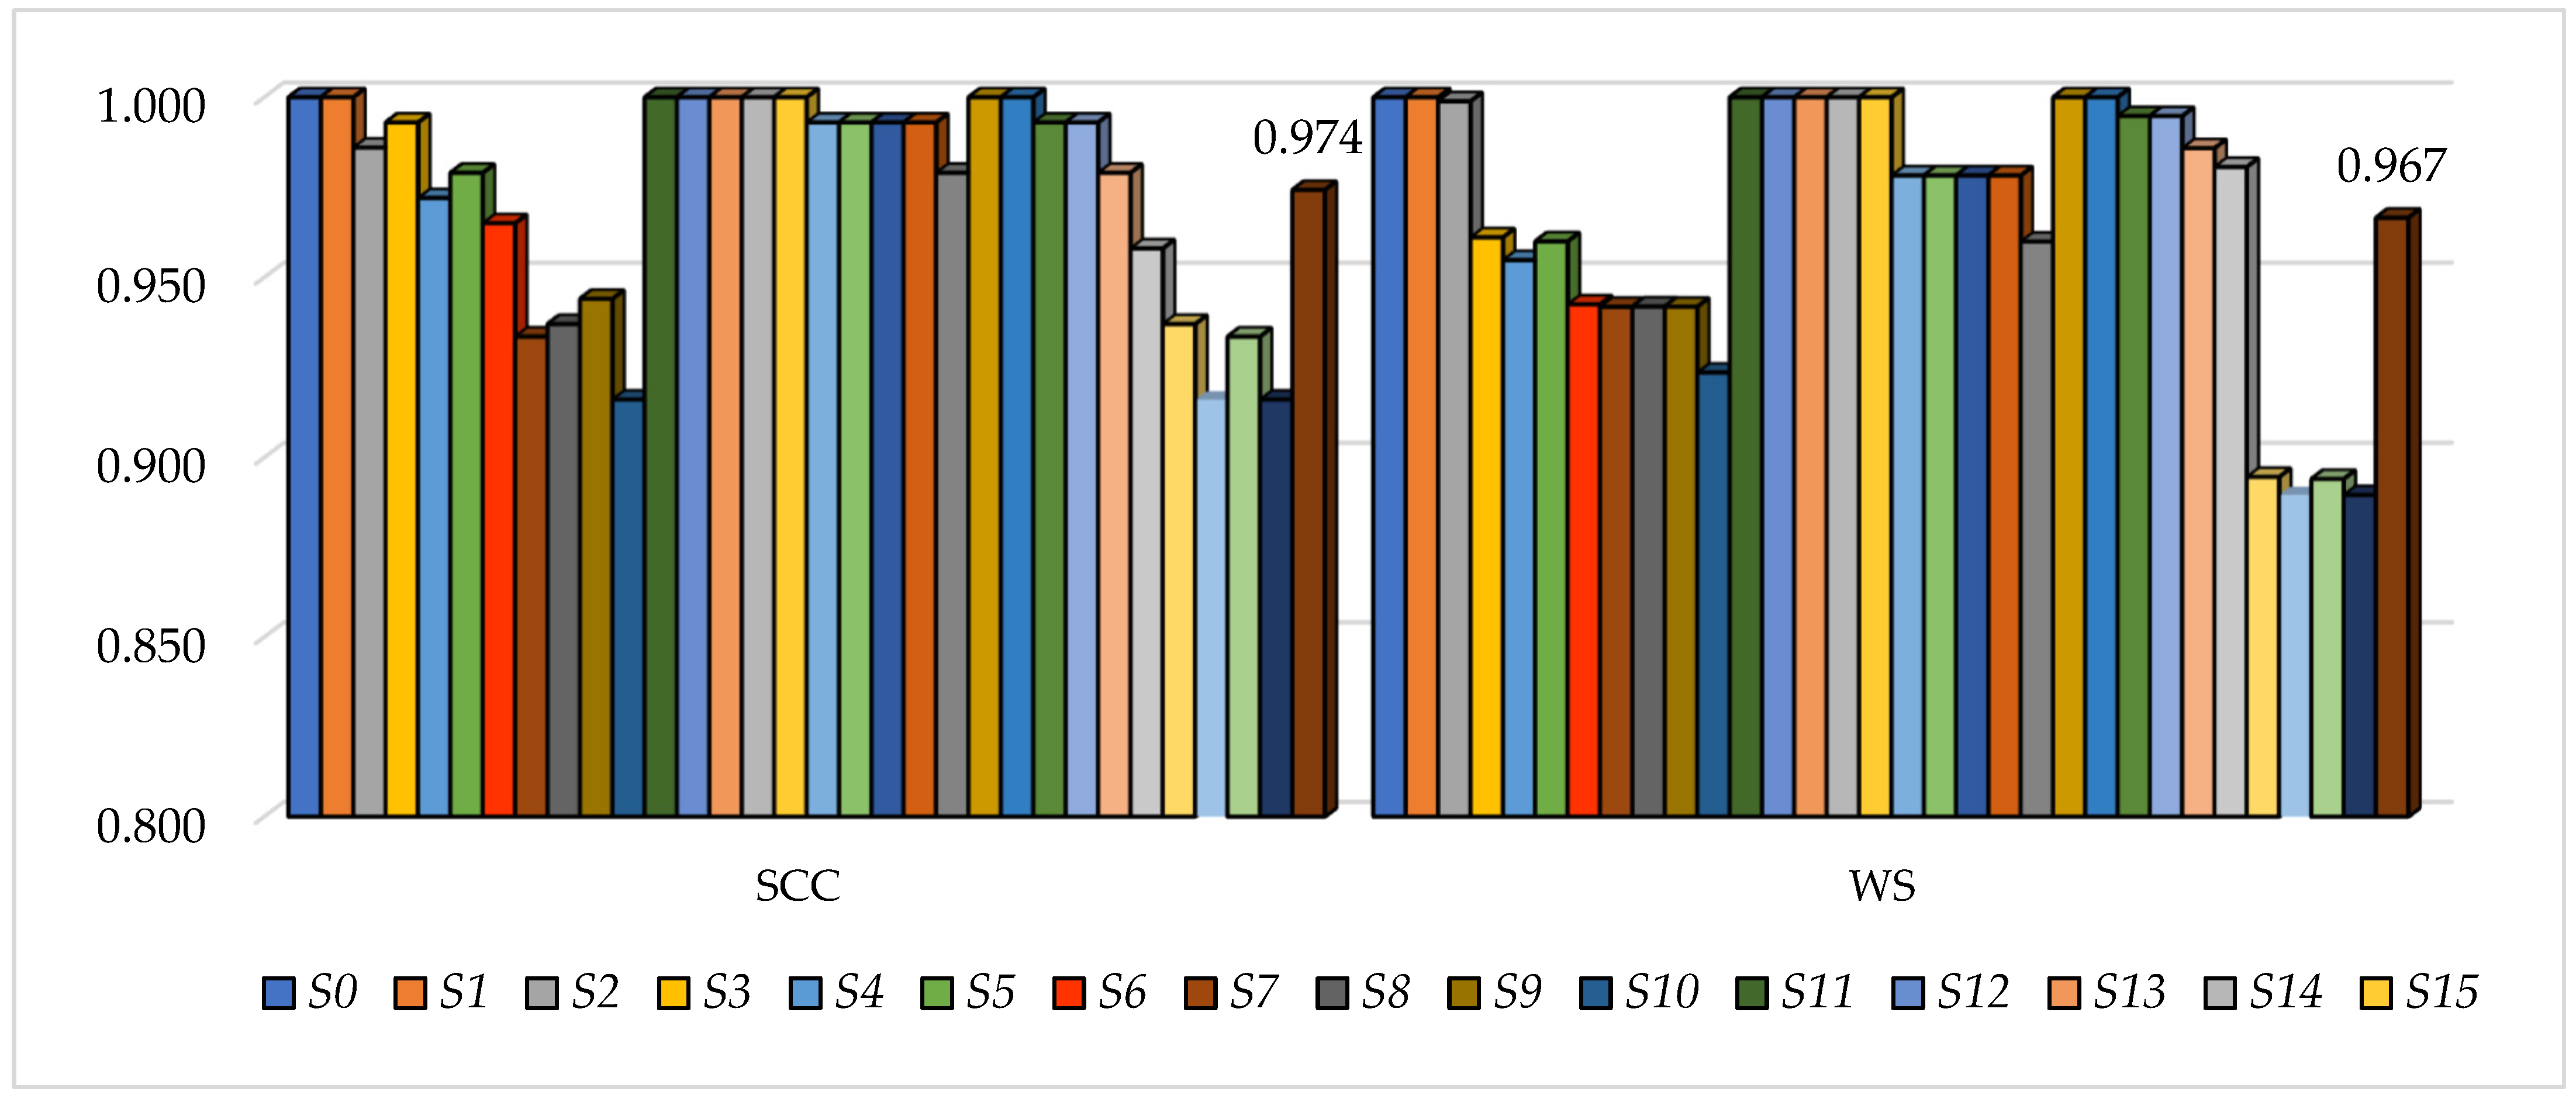
5.2. SCC and WS—Statistical Correlation Coefficients When Changing the Weights of Criteria
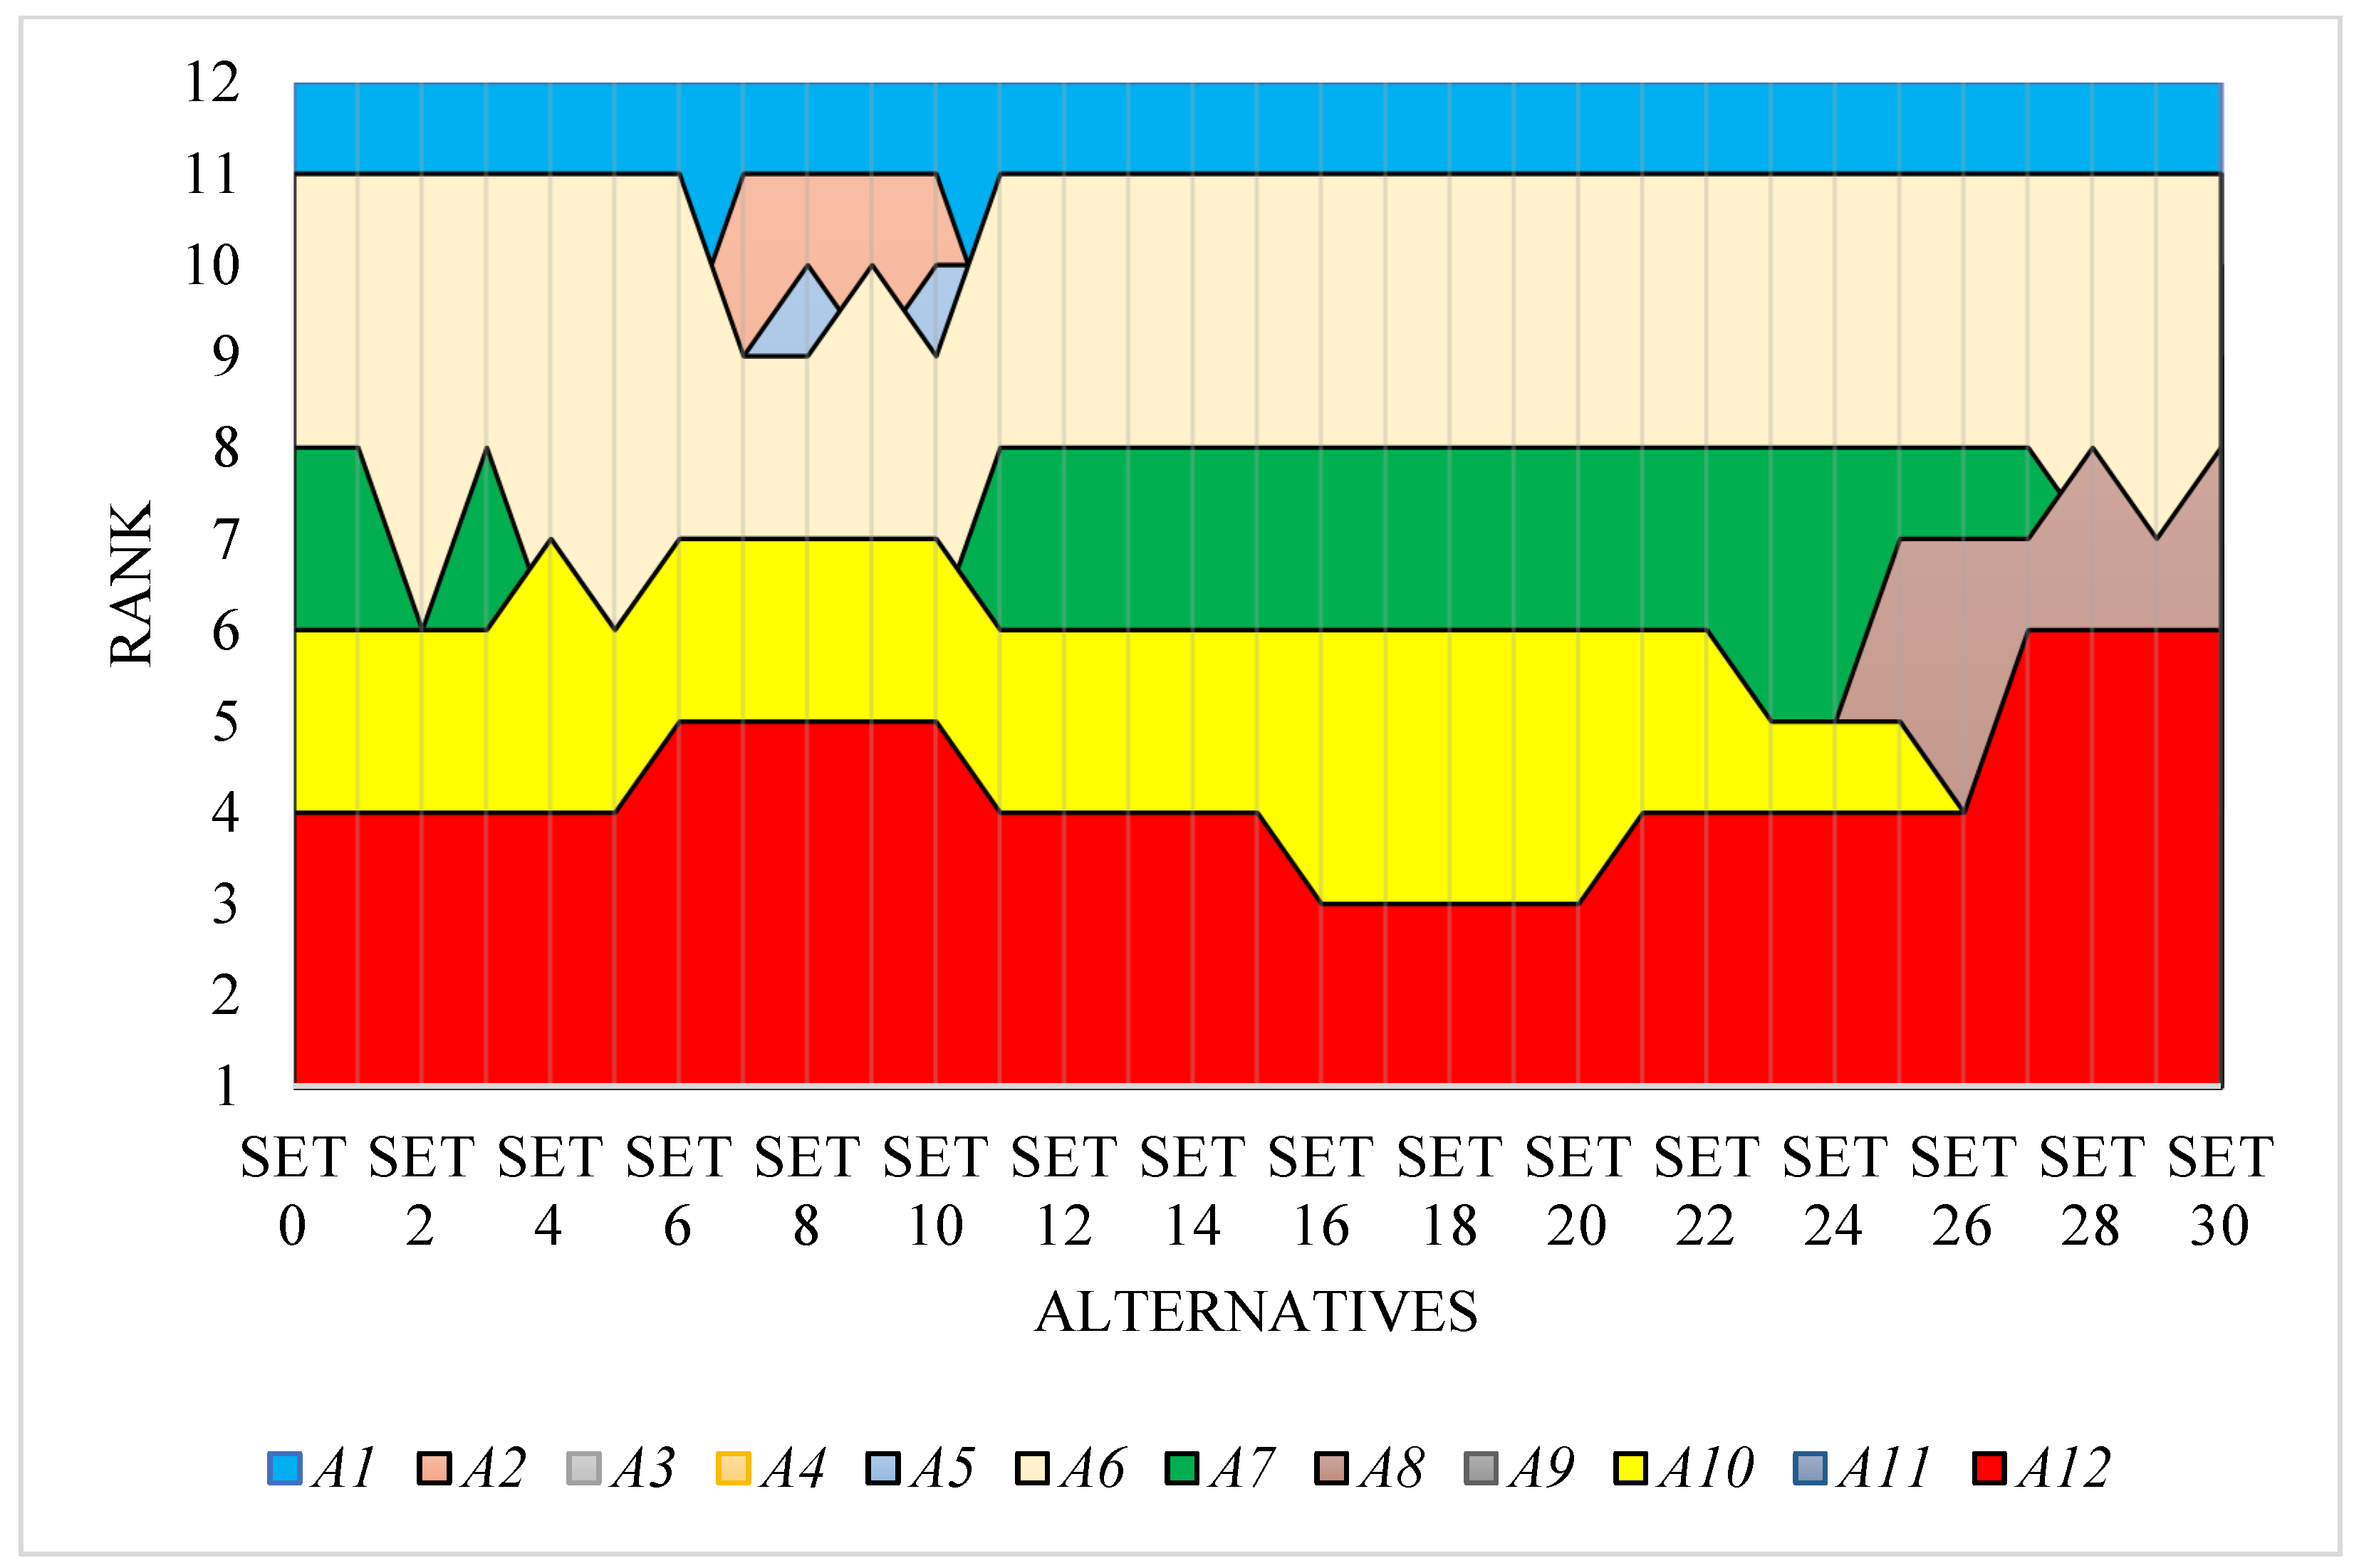
5.3. Changing the Size of the Initial Decision Matrix
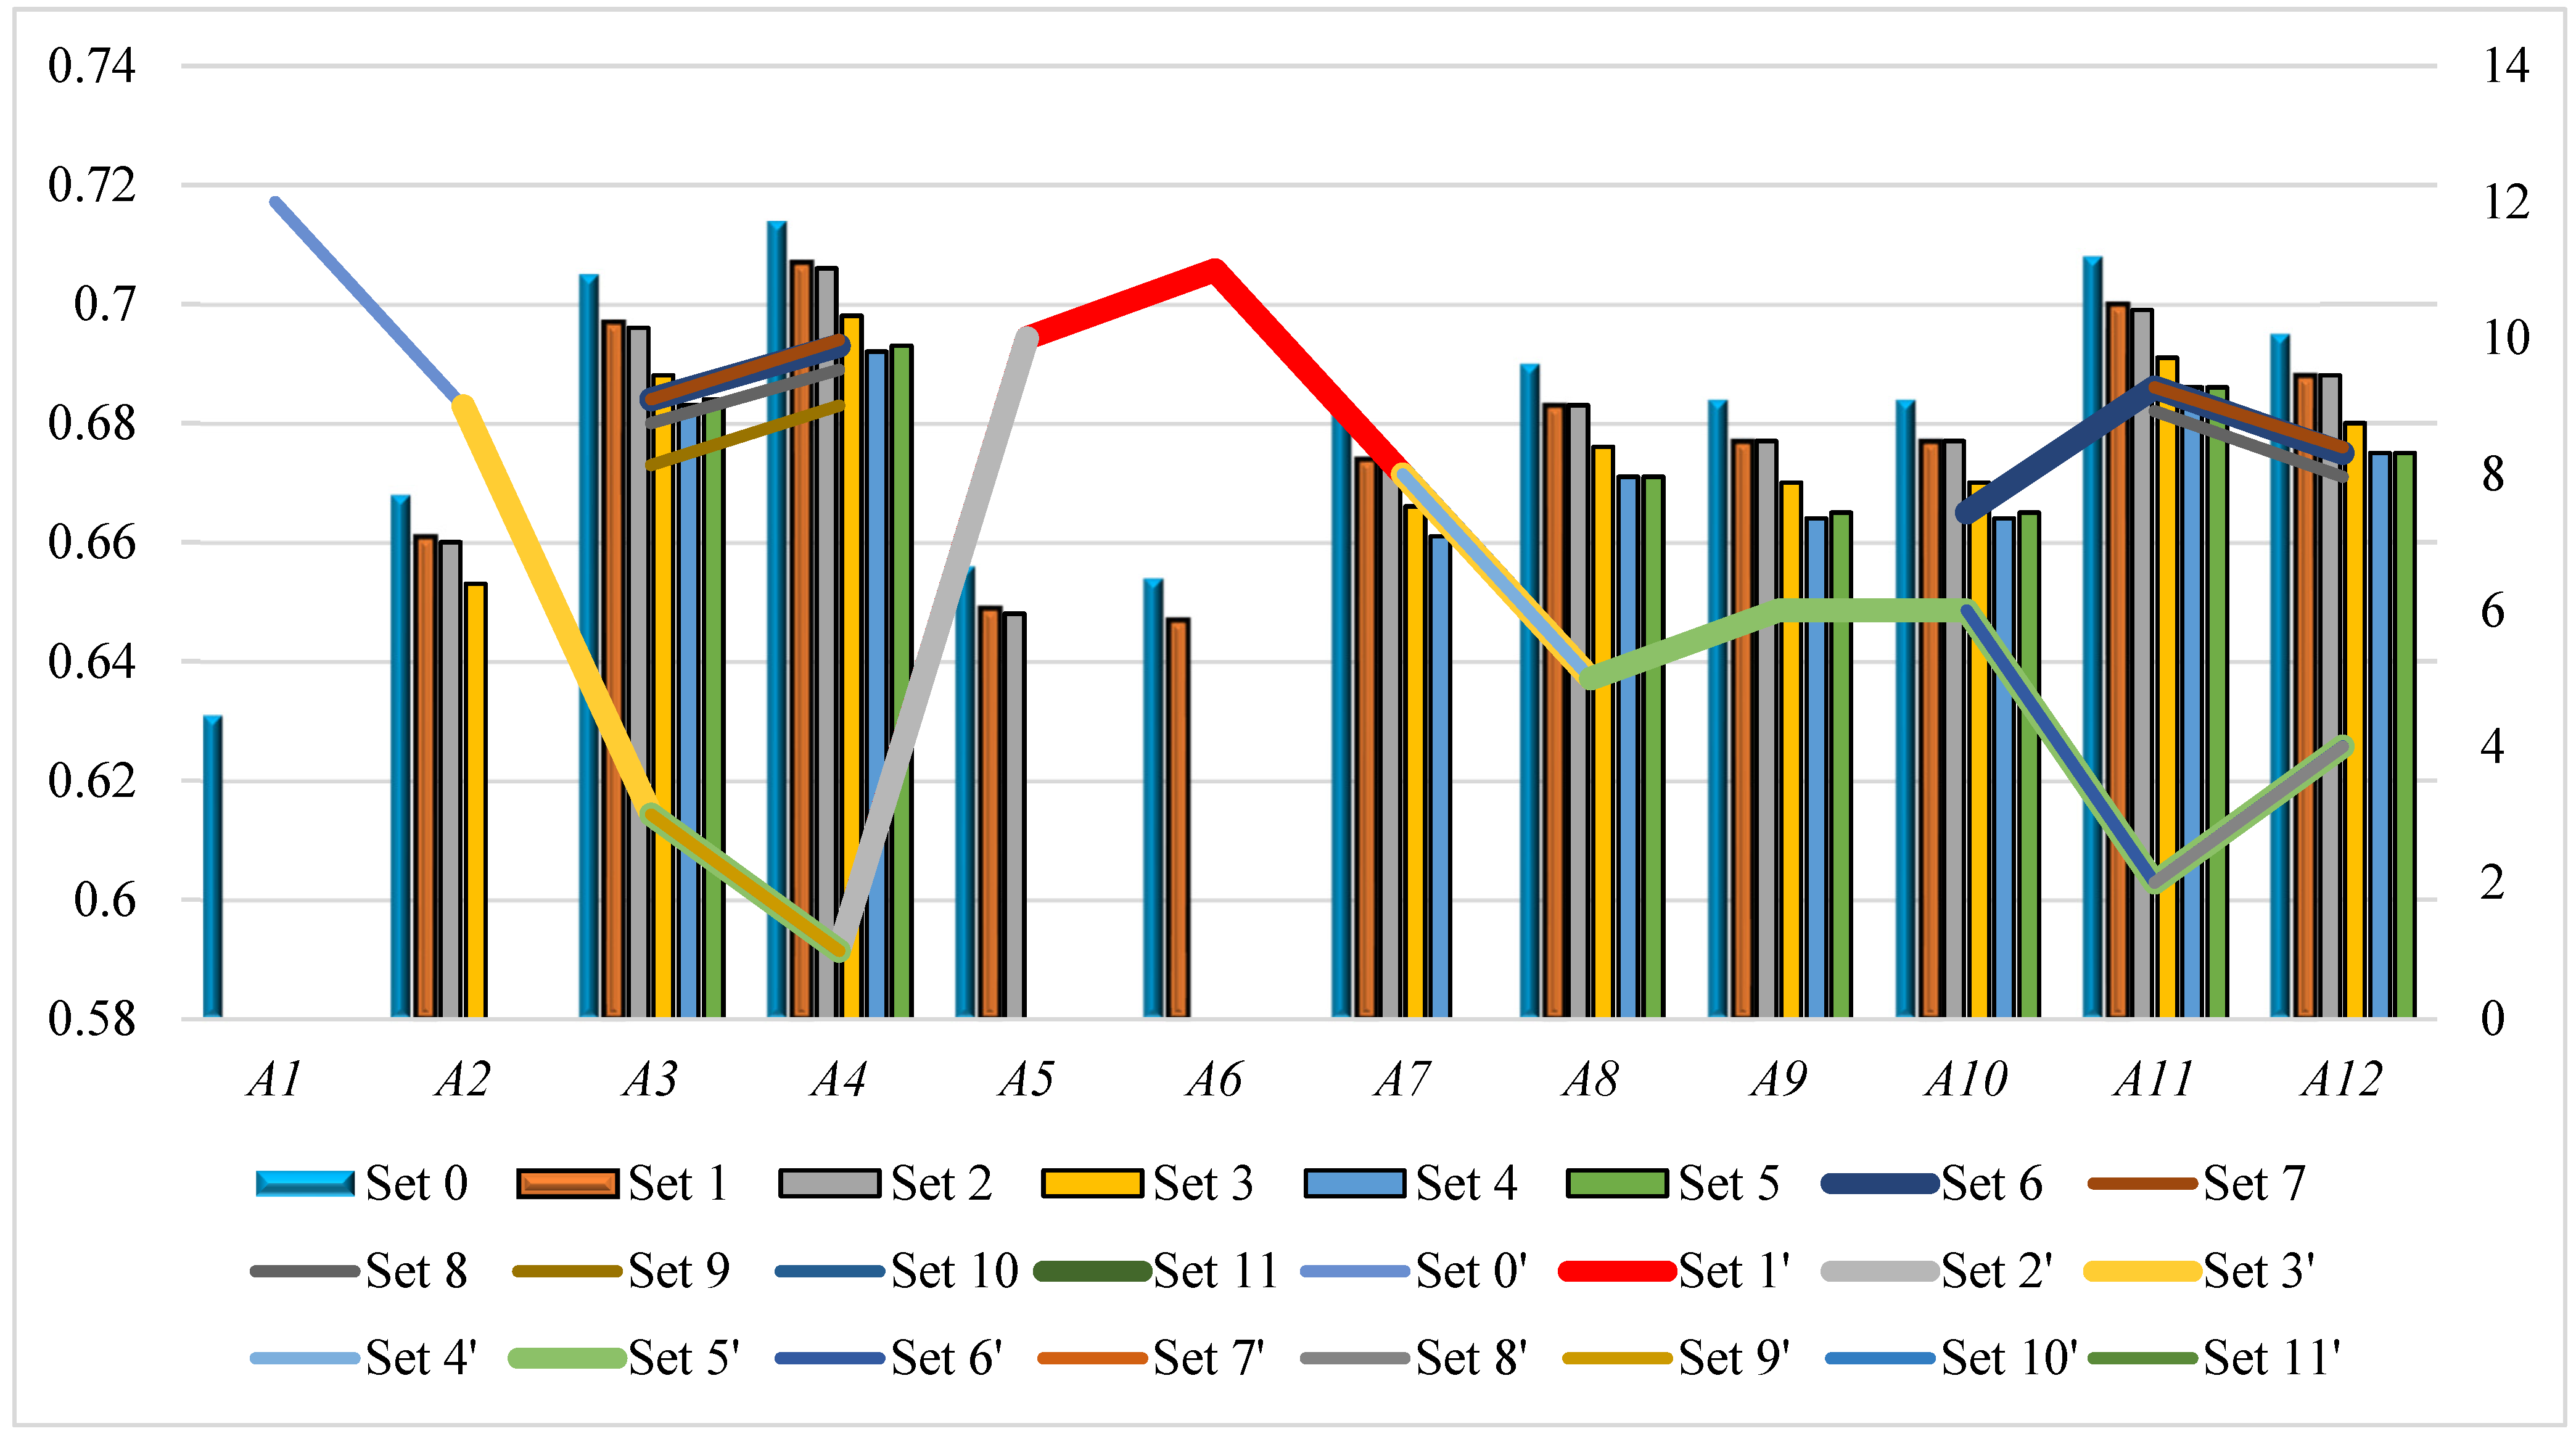
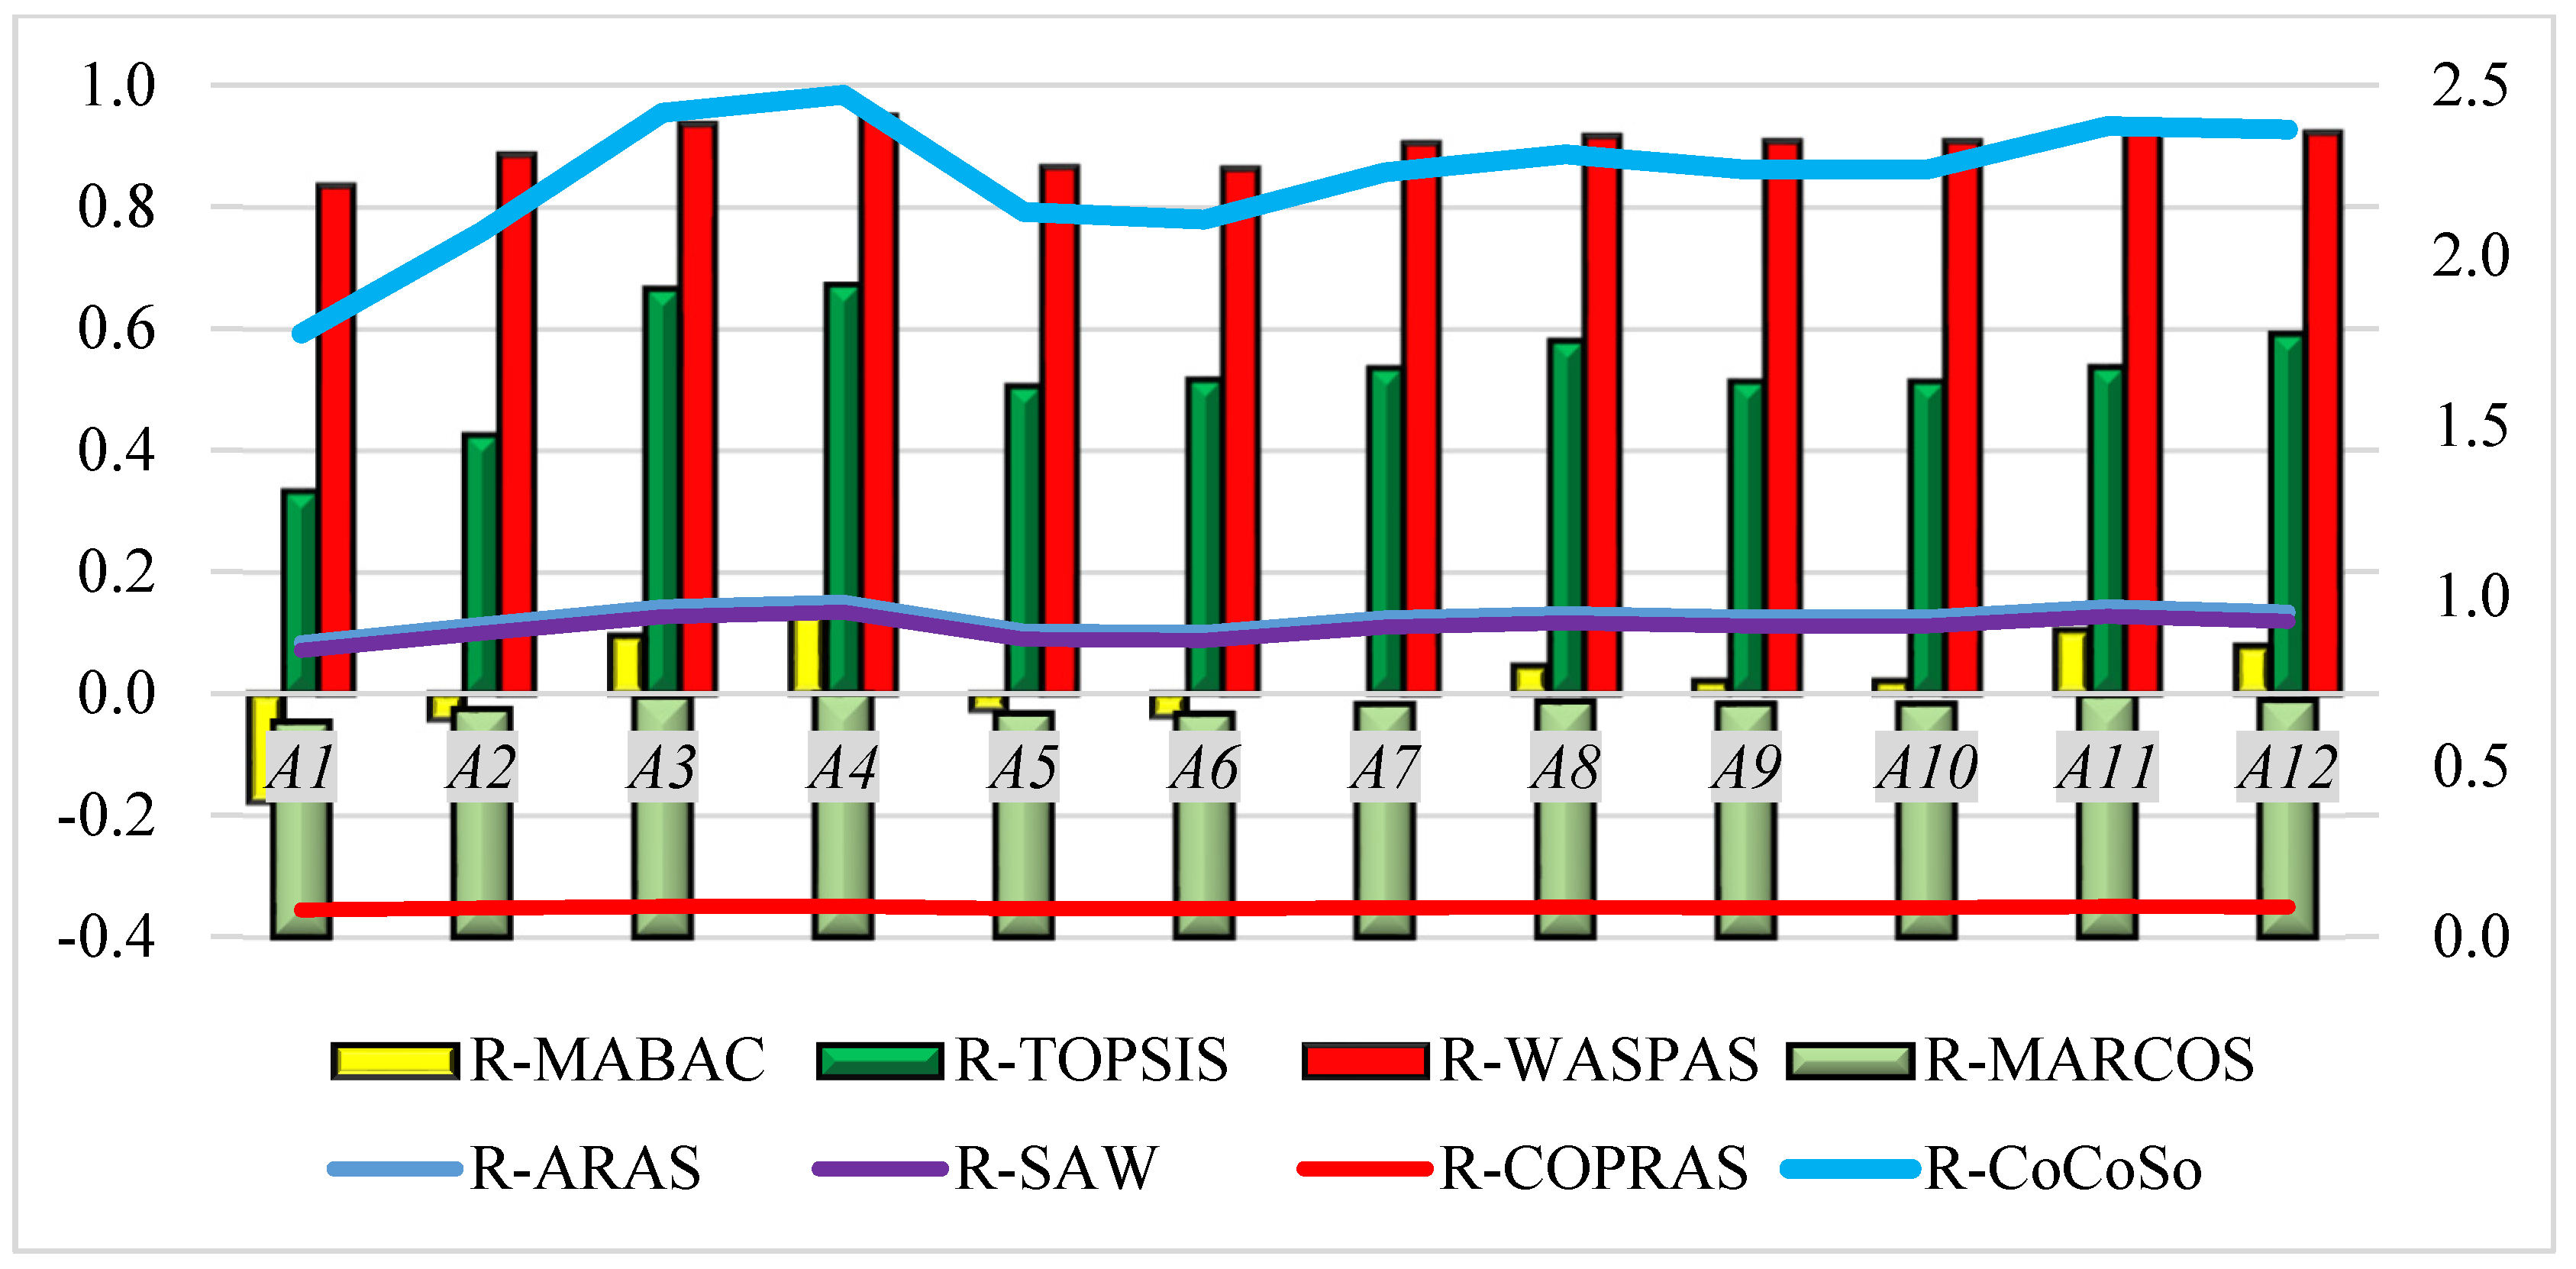
5.4. Additional Comparative Analysis with Rough MCDM Methods
5.5. SCC and WS—Statistical Correlation Coefficients in Comparative Analysis
6. Conclusions
Author Contributions
Funding
Institutional Review Board Statement
Informed Consent Statement
Data Availability Statement
Conflicts of Interest
Appendix A

| C1 | C2 | C3 | C4 | C5 | C6 | C7 | C8 | C9 | C10 | C11 | C12 | C13 | C14 | C15 | C16 | |
|---|---|---|---|---|---|---|---|---|---|---|---|---|---|---|---|---|
| A1 | VG | G | G | VG | VG | MG | EG | VG | M | EG | VG | VG | P | VG | G | M |
| A2 | VG | G | VG | EG | EG | EG | EG | VG | EG | VG | VG | G | MG | VG | G | M |
| A3 | EG | VG | VG | EG | VG | EG | G | VG | EG | EG | VG | G | MG | VG | MG | M |
| A4 | EG | VG | VG | EG | VG | EG | G | VG | EG | EG | VG | G | MG | VG | MG | M |
| A5 | VG | EG | EG | EG | EG | VG | EG | EG | M | EG | VG | G | VP | EG | MG | P |
| A6 | VG | G | EG | EG | EG | VG | G | EG | M | EG | VG | G | M | EG | M | P |
| A7 | VG | EG | EG | EG | EG | EG | EG | EG | M | EG | G | MG | M | VG | M | M |
| A8 | G | EG | EG | EG | EG | EG | G | EG | M | EG | VG | MG | M | VG | M | M |
| A9 | VG | G | EG | EG | EG | EG | EG | EG | G | EG | G | M | M | VG | M | M |
| A10 | G | EG | EG | EG | EG | EG | G | EG | G | EG | VG | MG | MG | VG | M | M |
| A11 | VG | G | EG | EG | EG | EG | EG | EG | EG | EG | VG | M | VG | VG | M | MP |
| A12 | G | EG | EG | EG | EG | EG | G | EG | VG | EG | VG | M | M | VG | M | MP |
| C1 | C2 | C3 | C4 | C5 | C6 | C7 | C8 | C9 | C10 | C11 | C12 | C13 | C14 | C15 | C16 | |
|---|---|---|---|---|---|---|---|---|---|---|---|---|---|---|---|---|
| A1 | M | P | M | MG | MG | G | G | VG | MG | VG | VG | G | G | VG | G | MP |
| A2 | M | P | M | G | G | VG | G | VG | VG | M | MG | VG | VG | VG | G | MP |
| A3 | G | MG | M | G | MG | VG | VG | VG | G | VG | MG | VG | VG | VG | G | MP |
| A4 | G | MG | M | G | MG | VG | VG | VG | VG | VG | MG | VG | VG | VG | G | MP |
| A5 | MG | MP | G | G | G | G | G | EG | MG | VG | MG | VG | G | EG | G | VP |
| A6 | MG | MP | G | G | G | G | VG | EG | MG | VG | MG | VG | G | EG | M | VP |
| A7 | MG | P | G | G | G | VG | G | EG | MG | VG | VG | EG | VG | VG | M | MP |
| A8 | M | MG | G | G | G | VG | VG | EG | MG | VG | G | EG | VG | VG | M | MP |
| A9 | MG | P | G | G | G | VG | G | EG | MG | VG | VG | EG | VG | VG | M | MP |
| A10 | M | MG | G | G | G | VG | VG | EG | MG | VG | G | EG | VG | VG | M | MP |
| A11 | MG | P | G | G | G | VG | G | EG | VG | VG | MG | EG | EG | VG | M | MP |
| A12 | M | MG | G | G | G | VG | VG | EG | G | VG | MG | EG | VG | VG | M | MP |
| C1 | C2 | C3 | C4 | C5 | C6 | C7 | C8 | C9 | C10 | C11 | C12 | C13 | C14 | C15 | C16 | |
|---|---|---|---|---|---|---|---|---|---|---|---|---|---|---|---|---|
| A1 | MG | M | M | M | G | MG | G | G | MG | VG | M | M | MG | MG | G | M |
| A2 | MG | M | MG | EG | VG | EG | G | G | VG | G | P | M | VG | G | VG | MP |
| A3 | EG | EG | MG | EG | G | EG | VG | G | G | VG | P | M | VG | MG | MG | MP |
| A4 | EG | EG | MG | VG | EG | EG | VG | G | VG | VG | P | M | VG | G | MG | MP |
| A5 | G | G | VG | VG | EG | MG | G | EG | MG | VG | P | M | MG | EG | G | VP |
| A6 | G | VG | VG | EG | VG | MG | VG | EG | MG | VG | P | M | MG | EG | MP | VP |
| A7 | G | M | EG | EG | VG | G | G | VG | MG | VG | M | G | G | MG | MP | M |
| A8 | MG | EG | EG | EG | VG | G | VG | VG | MG | VG | MP | G | G | MG | MP | MP |
| A9 | G | M | EG | EG | VG | G | G | VG | G | VG | M | G | G | MG | MP | MP |
| A10 | MG | EG | EG | EG | VG | G | VG | VG | G | VG | MP | G | G | MG | MP | MP |
| A11 | G | M | EG | EG | VG | EG | G | VG | VG | VG | MP | EG | EG | G | MP | MP |
| A12 | MG | EG | EG | EG | VG | EG | VG | VG | G | VG | MP | VG | VG | G | MP | P |
References
- Currie, A. Improving efficiencies through mechanisation. IMIESA 2020, 45, 24–25. [Google Scholar]
- Peurifoy, R.L.; Schexnayder, C.J.; Schmitt, R.L.; Shapira, A. Construction Planning, Equipment, and Methods; McGraw-Hill Education: New York, NY, USA, 2018. [Google Scholar]
- Božanić, D.; Milić, A.; Tešić, D.; Salabun, W.; Pamučar, D. D numbers–FUCOM–fuzzy RAFSI model for selecting the Group of construction machines for enabling mobility. Facta Univ. Ser. Mech. Eng. 2021, 19, 447–471. [Google Scholar] [CrossRef]
- Sinenko, S.; Zhadanovsky, B.; Obodnikov, V. Construction machines requirement for the building site. In E3S Web of Conferences; EDP Sciences: St. Petersburg, Russia, 2019; Volume 110, p. 01036. [Google Scholar]
- Wang, L.; Chen, Y. Slipform Paver Design Based on Product Identity. Adv. Ergon. Des. 2021, 261, 959–964. [Google Scholar] [CrossRef]
- Čović, P. Usklađivanje Rada Strojeva Prilikom Izgradnje Ceste I Probijanja Tunela. Ph.D. Thesis, University of Split, Split, Croatia, 2018. [Google Scholar]
- Lunkad, P.R. Simultaneous Enhancement of Fluidity and Thixotropy of Vibration-Free Concrete; Missouri University of Science and Technology: Rolla, MO, USA, 2018. [Google Scholar]
- Liu, Y.; Wang, X. Progress and Key Technical Control Points of Side Slip-form Construction Technology. In Journal of Physics: Conference Series; IOP Publishing: Guiyang, China, 2020; Volume 1637, p. 012133. [Google Scholar]
- Wang, X.; Taylor, P.; Yurdakul, E.; Wang, X. An innovative approach to concrete mixture proportioning. ACI Mater. J. 2018, 115, 749–759. [Google Scholar] [CrossRef]
- Kuntsman, M.V.; Sultygova, A.A.; Shelikhanova, N.A. Methodology for Analysing the Technical and Economic Factors of Mechanisation in Aerodrome Construction. In 2021 Intelligent Technologies and Electronic Devices in Vehicle and Road Transport Complex (TIRVED); IEEE: Moscow, Russia, 2021; pp. 1–5. [Google Scholar]
- Himawati, H.N. Evaluasi Produktivitas Dan Biaya Operasional Alat Berat Slipform Paver Dan Dump Truck Serat Perbandingan Perhitunag Rencana Dengan Perhitunang di Lapangan Pada Pekerjjan Perkerasan Kaku (Rigid Pavement) Jalan Tol Semargangsol. Ph.D. Thesis, Universitas Gadjah Mada, Yogyakarta, Indonesia, 2018. [Google Scholar]
- Chang, G.K.; Xu, G.; Correia, A.G.; Nazarian, S. Intelligent Construction for Infrastructure—The Framework. In Advances in Transportation Geotechnics IV; Springer: Cham, Switzerland, 2022; pp. 193–204. [Google Scholar]
- Prokopev, A.P.; Nabizhanov, Z.I.; Emelyanov, R.T.; Ivanchura, V.I. Concept of a new method for continuous non-destructive control of asphalt road pavements compaction. In Journal of Physics: Conference Series; IOP Publishing: Guiyang, China, 2020; Volume 1515, p. 052054. [Google Scholar]
- Snyder, M.B. Stringless Paving [Techbrief] (No. FHWA-HIF-18–011); Federal Highway Administration: Washington, DC, USA, 2019. [Google Scholar]
- Guyer, J.P. An Introduction to Stringless Paving of Streets and Highways; Guyer Partners: El Macero, CA, USA, 2021. [Google Scholar]
- Bock, R. Quantification of Paving Equipment Emmissions on Asphalt Construction Sites. Bachelor’s Thesis, University of Twente, Enschede, The Netherlands, 2020. [Google Scholar]
- Ebrahimi, B.; Wallbaum, H.; Jakobsen, P.D.; Booto, G.K. Regionalized environmental impacts of construction machinery. Int. J. Life Cycle Assess. 2020, 25, 1472–1485. [Google Scholar] [CrossRef]
- Voronov, R.V.; Markov, O.B.; Grigorev, I.V.; Davtyan, A.B. Mathematical model of the modular approach for selection of a system of machines for creation and operation of forest plantations. Lesn. Zhurnal For. J. 2019, 5, 125–134. [Google Scholar] [CrossRef]
- Scherbakov, A.; Babanina, A.; Solovyeva, E.; Aleksandrovskiy, M. Materials and Methods of Experimental Studies of Welded Metal Structures of Construction Machines. In Proceedings of the XIII International Scientific Conference on Architecture and Construction 2020; Springer: Singapore; pp. 572–586.
- Abdelmassih, A.; Faddoul, R.; Geara, F. A Machine Learning Approach on Earthmoving Fleet Selection. In Proceedings of the Sixth International Congress on Information and Communication Technology, London, UK, 25–26 February 2021; Springer: Singapore, 2022; pp. 813–826. [Google Scholar]
- Prochorov, S. Use of modern construction machinery in the construction. MATEC Web Conf. 2018, 193, 04022. [Google Scholar] [CrossRef]
- Wang, C.C.; Wang, M.; Sun, J.; Mojtahedi, M. A safety warning algorithm based on axis aligned bounding box method to prevent onsite accidents of mobile construction machineries. Sensors 2021, 21, 7075. [Google Scholar] [CrossRef]
- Antoniou, F.; Aretoulis, G.N. Comparative analysis of multi-criteria decision making methods in choosing contract type for highway construction in Greece. Int. J. Manag. Decis. Mak. 2018, 17, 1–28. [Google Scholar]
- Ighravwe, D.E.; Oke, S.A. A multi-criteria decision-making framework for selecting a suitable maintenance strategy for public buildings using sustainability criteria. J. Build. Eng. 2019, 24, 100753. [Google Scholar] [CrossRef]
- Torres-Machi, C.; Nasir, F.; Achebe, J.; Saari, R.; Tighe, S.L. Sustainability evaluation of pavement technologies through multicriteria decision techniques. J. Infrastruct. Syst. 2019, 253, 04019023. [Google Scholar] [CrossRef]
- Slebi-Acevedo, C.J.; Pascual-Muñoz, P.; Lastra-González, P.; Castro-Fresno, D. A multi-criteria decision-making analysis for the selection of fibres aimed at reinforcing asphalt concrete mixtures. Int. J. Pavement Eng. 2021, 22, 763–779. [Google Scholar] [CrossRef]
- Akhanova, G.; Nadeem, A.; Kim, J.R.; Azhar, S. A multi-criteria decision-making framework for building sustainability assessment in Kazakhstan. Sustain. Cities Soc. 2020, 52, 101842. [Google Scholar] [CrossRef]
- Anysz, H.; Nicał, A.; Stević, Ž.; Grzegorzewski, M.; Sikora, K. Pareto Optimal Decisions in Multi-Criteria Decision Making Explained with Construction Cost Cases. Symmetry 2020, 13, 46. [Google Scholar] [CrossRef]
- Kishore, R.; Dehmourdi, S.A.; Naik, M.G.; Hassanpour, M. Designing a framework for Subcontractor’s selection in construction projects using AN MCDM model. Oper. Res. Eng. Sci. Theory Appl. 2020, 3, 48–64. [Google Scholar] [CrossRef]
- Yang, S.H.; Liu, J.Y.H.; Tran, N.H. Multi-criteria life cycle approach to develop weighting of sustainability indicators for pavement. Sustainability 2018, 10, 2325. [Google Scholar] [CrossRef] [Green Version]
- Mathiyazhagan, K.; Gnanavelbabu, A.; Prabhuraj, B.L. A sustainable assessment model for material selection in construction industries perspective using hybrid MCDM approaches. J. Adv. Manag. Res. 2018, 16, 234–259. [Google Scholar] [CrossRef]
- Sánchez-Garrido, A.J.; Navarro, I.J.; Yepes, V. Multi-criteria decision-making applied to the sustainability of building structures based on Modern Methods of Construction. J. Clean. Prod. 2022, 330, 129724. [Google Scholar] [CrossRef]
- Erdogan, S.A.; Šaparauskas, J.; Turskis, Z. A multi-criteria decision-making model to choose the best option for sustainable construction management. Sustainability 2019, 11, 2239. [Google Scholar] [CrossRef] [Green Version]
- Shahpari, M.; Saradj, F.M.; Pishvaee, M.S.; Piri, S. Assessing the productivity of prefabricated and in-situ construction systems using hybrid multi-criteria decision making method. J. Build. Eng. 2020, 27, 100979. [Google Scholar] [CrossRef]
- Khoshnava, S.M.; Rostami, R.; Valipour, A.; Ismail, M.; Rahmat, A.R. Rank of green building material criteria based on the three pillars of sustainability using the hybrid multi criteria decision making method. J. Clean. Prod. 2018, 173, 82–99. [Google Scholar] [CrossRef]
- Chen, C.H. A novel multi-criteria decision-making model for building material supplier selection based on entropy-AHP weighted TOPSIS. Entropy 2020, 22, 259. [Google Scholar] [CrossRef] [PubMed] [Green Version]
- Bozanic, D.; Tešić, D.; Kočić, J. Multi-criteria FUCOM–Fuzzy MABAC model for the selection of location for construction of single-span bailey bridge. Decis. Mak. Appl. Manag. Eng. 2019, 2, 132–146. [Google Scholar] [CrossRef]
- Jovanović, M. Selection of the optimal group of the groundwork machines. In Proceeding of the Faculty of Technical Sciences, Facultz of Technical Sciences, Novi Sad, Serbia, 23–25 September 2020; Volume 35, pp. 637–640. [Google Scholar]
- Naik, G.; Kishore, R.; Dehmourdi, S. Modeling a Multi-Criteria Decision Support System for Prequalification Assessment of Construction Contractors using CRITIC and EDAS Models. Oper. Res. Eng. Sci. Theory Appl. 2021, 4, 79–101. [Google Scholar] [CrossRef]
- Ruiz, A.; Guevara, J. Sustainable Decision-Making in Road Development: Analysis of Road Preservation Policies. Sustainability 2020, 12, 872. [Google Scholar] [CrossRef] [Green Version]
- Pamučar, D.; Puška, A.; Stević, Ž.; Ćirović, G. A new intelligent MCDM model for HCW management: The integrated BWM–MABAC model based on D numbers. Expert Syst. Appl. 2021, 175, 114862. [Google Scholar] [CrossRef]
- Chakraborty, S.; Chattopadhyay, R.; Chakraborty, S. An integrated D-MARCOS method for supplier selection in an iron and steel industry. Decis. Mak. Appl. Manag. Eng. 2020, 3, 49–69. [Google Scholar]
- Pribićević, I.; Doljanica, S.; Momčilović, O.; Das, D.K.; Pamučar, D.; Stević, Ž. Novel Extension of DEMATEL Method by Trapezoidal Fuzzy Numbers and D Numbers for Management of Decision-Making Processes. Mathematics 2020, 8, 812. [Google Scholar] [CrossRef]
- Salimi, P.; Edalatpanah, S.A. Supplier selection using fuzzy AHP method and D-Numbers. J. Fuzzy Ext. Appl. 2020, 1, 1–14. [Google Scholar]
- Lin, S.; Li, C.; Xu, F.; Liu, D.; Liu, J. Risk identification and analysis for new energy power system in China based on D numbers and decision-making trial and evaluation laboratory (DEMATEL). J. Clean. Prod. 2018, 180, 81–96. [Google Scholar] [CrossRef]
- Mousavi-Nasab, S.H.; Sotoudeh-Anvari, A. An extension of best-worst method with D numbers: Application in evaluation of renewable energy resources. Sustain. Energy Technol. Assess. 2020, 40, 100771. [Google Scholar] [CrossRef]
- Liu, B.-Y.; Hu, Y.; Deng, Y. New failure mode and effects analysis based on D numbers downscaling method. Int. J. Comput. Commun. Control 2018, 13, 205–220. [Google Scholar] [CrossRef] [Green Version]
- Zhao, J.; Deng, Y. Performer selection in human reliability analysis: D numbers approach. Int. J. Comput. Commun. Control 2019, 14, 437–452. [Google Scholar] [CrossRef] [Green Version]
- Lai, H.; Liao, H. A multi-criteria decision making method based on DNMA and CRITIC with linguistic D numbers for blockchain platform evaluation. Eng. Appl. Artif. Intell. 2021, 101, 104200. [Google Scholar] [CrossRef]
- Liu, B.; Cui, Y.; Deng, X. A satisfaction degree of D numbers and its application in multi-criteria decision making. In Proceedings of the 2020 Chinese Control and Decision Conference (CCDC), Hefei, China, 22–24 August 2020; pp. 5297–5302. [Google Scholar]
- Xiao, F. A Multiple-Criteria Decision-Making Method Based on D Numbers and Belief Entropy. Int. J. Fuzzy Syst. 2019, 21, 1144–1153. [Google Scholar] [CrossRef]
- Mohammadi, A.; Darestani, S. Green supplier selection problem using TOPSIS extended by D numbers in tractor manufacturing industry. Int. J. Serv. Oper. Manag. 2019, 32, 327–338. [Google Scholar] [CrossRef]
- Deng, X.; Jiang, W. Evaluating green supply chain management practices under fuzzy environment: A novel method based on D number theory. Int. J. Fuzzy Syst. 2019, 21, 1389–1402. [Google Scholar] [CrossRef]
- Hristov, N.; Pamucar, D.; Amine, M.E. Application of a D Number based LBWA Model and an Interval MABAC Model in Selection of an Automatic Cannon for Integration into Combat Vehicles. Def. Sci. J. 2021, 71, 34–45. [Google Scholar] [CrossRef]
- Xiao, F. A novel multi-criteria decision making method for assessing health-care waste treatment technologies based on D numbers. Eng. Appl. Artif. Intell. 2018, 71, 216–225. [Google Scholar] [CrossRef]
- Sénquiz-Díaz, C. Transport infrastructure quality and logistics performance in exports. Econ. Innov. Econ. Res. 2021, 9, 107–124. [Google Scholar] [CrossRef]
- Foster, C.R. The effect of paver speed on roller requirements. Construction and construction equipment. Highw. Res. Board 1970, 316, 76–81. [Google Scholar]
- Fischer, A.; Schug, R. Vögele Booklet on Paving; Joseph Vögele AG: Ludwigshaf, Germany, 2017. [Google Scholar]
- Quality Paving Guide Book; Cedarapids, A Terex Company: Cedar Rapids, IA, USA, 2015.
- US Army Corps of Engineers. Hot-Mix Asphalt Paving Handbook; US Army Corps of Engineers: Washington, DC, USA, 2000.
- Simons, B. Op Weg Naar Een Beheerst Asfaltverwerkongsproces. Master’s Thesis, University of Twente, Enschede, The Netherlands, 2007. [Google Scholar]
- Arbeider, C.G. Planning the Asphalt Paving and Compaction Process. The Alignment between Paver Output, Roller Capacity and Available Time for Compaction; Universiteit Twente: Enschede, The Netherlands, 2016. [Google Scholar]
- Arbeider, C.G.; Miller, S.R.; Doree, A.G.; Oosterveld, M. Planning the asphalt construction process–Towards more consistent paving and compaction operations. In Proceedings of the 17th AAPA International Flexible Pavements Conference, Melbourne, Australia, 13–16 August 2017. [Google Scholar]
- Ma, F.; Sha, A.; Lin, R.; Huang, Y.; Wang, C. Greenhouse Gas Emissions from Asphalt Pavement Construction: A Case Study in China. Int. J. Environ. Res. Public Health 2016, 13, 351. [Google Scholar] [CrossRef] [PubMed]
- Huang, S.; Su, X.; Hu, Y.; Mahadevan, S.; Deng, Y. A new decision-making method by incomplete preferences based on evidence distance. Knowl. Based Syst. 2014, 56, 264–272. [Google Scholar] [CrossRef]
- Deng, X.; Hu, Y.; Deng, Y.; Mahadevan, S. Environmental impact assessment based on D numbers. Expert Syst. Appl. 2013, 41, 635–643. [Google Scholar] [CrossRef]
- Vrtagić, S.; Softić, E.; Subotić, M.; Stević, Z.; Dordevic, M.; Ponjavic, M. Ranking Road Sections Based on MCDM Model: New Improved Fuzzy SWARA (IMF SWARA). Axioms 2021, 10, 92. [Google Scholar] [CrossRef]
- Vojinović, N.; Stević, Z.; Tanackov, I. A Novel IMF SWARA-FDWGA-PESTEL Analysis for Assessment Of Healthcare System. Oper. Res. Eng. Sci. Theory Appl. 2022, 5, 139–151. [Google Scholar] [CrossRef]
- Subotić, M.; Radičević, V.; Pavlović, Z.; Ćirović, G. Development of a New Risk Assessment Methodology for Light Goods Vehicles on Two-Lane Road Sections. Symmetry 2021, 13, 1271. [Google Scholar] [CrossRef]
- Vojinović, N.; Sremac, S.; Zlatanović, D. A Novel Integrated Fuzzy-Rough MCDM Model for Evaluation of Companies for Transport of Dangerous Goods. Complexity 2021, 2021, 5141611. [Google Scholar] [CrossRef]
- Mahmutagić, E.; Stević, Ž.; Nunić, Z.; Chatterjee, P.; Tanackov, I. An integrated decision-making model for effi-ciency analysis of the forklifts in warehousing systems. Facta Univ. Ser. Mech. Eng. 2021, 19, 537–553. [Google Scholar]
- Mešić, A.; Miškić, S.; Stević, Z.; Mastilo, Z. Hybrid MCDM Solutions for Evaluation of the Logistics Performance Index of the Western Balkan Countries. Econ. Innov. Econ. Res. 2022, 10, 13–34. [Google Scholar] [CrossRef]
- Deveci, M.; Pamucar, D.; Gokasar, I.; Delen, D.; Wu, Q.; Simic, V. An analytics approach to decision alternative prioritization for zero-emission zone logistics. J. Bus. Res. 2022, 146, 554–570. [Google Scholar] [CrossRef]
- Pamucar, D.; Deveci, M.; Gokasar, I.; Martínez, L.; Köppen, M. Prioritizing Transport Planning Strategies for Freight Companies towards Zero Carbon Emission using Ordinal Priority Approach. Comput. Ind. Eng. 2022, 169, 108259. [Google Scholar] [CrossRef]
- Sałabun, W.; Urbaniak, K. A new coefficient of rankings similarity in decision-making problems. In International Conference on Computational; Springer: Cham, Amsterdam, The Netherlands, 2020; pp. 632–645. [Google Scholar]
- Sharma, H.K.; Roy, J.; Kar, S.; Prentkovskis, O. Multi criteria evaluation framework for prioritizing Indian railway stations using modified rough ahp-mabac method. Transp. Telecommun. 2018, 19, 113–127. [Google Scholar] [CrossRef] [Green Version]
- Song, W.; Ming, X.; Wu, Z.; Zhu, B. A rough TOPSIS approach for failure mode and effects analysis in uncertain environments. Qual. Reliab. Eng. Int. 2014, 30, 473–486. [Google Scholar] [CrossRef]
- Stević, Ž.; Pamučar, D.; Subotić, M.; Antuchevičiene, J.; Zavadskas, E.K. The location selection for roundabout construction using rough BWM-Rough WASPAS approach based on a new Rough Hamy aggregator. Sustainability 2018, 10, 2817. [Google Scholar] [CrossRef] [Green Version]
- Radović, D.; Stević, Ž.; Pamučar, D.; Zavadskas, E.K.; Badi, I.; Antuchevičiene, J.; Turskis, Z. Measuring perfor-mance in transportation companies in developing countries: A novel rough ARAS model. Symmetry 2018, 10, 434. [Google Scholar] [CrossRef] [Green Version]
- Durmić, E.; Stević, Z.; Chatterjee, P.; Vasiljević, M.; Tomašević, M. Sustainable supplier selection using combined FUCOM–Rough SAW model. Rep. Mech. Eng. 2020, 1, 34–43. [Google Scholar] [CrossRef]
- Matić, B.; Jovanović, S.; Das, D.K.; Zavadskas, E.K.; Stević, Ž.; Sremac, S.; Marinković, M. A new hybrid MCDM model: Sustainable supplier selection in a construction company. Symmetry 2019, 11, 353. [Google Scholar] [CrossRef] [Green Version]
- Yazdani, M.; Chatterjee, P.; Pamucar, D.; Chakraborty, S. Development of an integrated decision making model for location selection of logistics centers in the Spanish autonomous communities. Expert Syst. Appl. 2020, 148, 113208. [Google Scholar] [CrossRef]


| Location of Case Study | Method | Findings | Evaluation Criteria | Authors |
|---|---|---|---|---|
| Taiwan | AHP | Assessment of the level of environmental sustainability of engineering projects for the construction of transport infrastructure. | Performance criteria, environmental criteria, and cost criteria. | Yang et al. [30] |
| India | Fuzzy TOPSIS and BWM | Assessment and selection of sustainable construction materials. | Twenty-three sub-criteria of environmental, economic, and social sustainability. | Mathiyazhagan et al. [31] |
| Spain | SAW, COPRAS, TOPSIS, VIKOR, and MIVES | Sustainability assessment of various modern construction techniques. | A set of 38 indicators related to the economic and environmental characteristics of design and social impact. | Sánchez-Garrido et al. [32] |
| Turkey | AHP | Selection of construction project management models. | Performance, technical experience, financial stability, management performance/qualifications of employees, capacity, safety records, and equipment operation. | Erdogan et al. [33] |
| Iran | Delphi, DEMATEL, ANP, and TOPSIS | Productivity estimation of prefabricated building systems. | Management criteria, planning criteria, and cost criteria. | Shahpari et al. [34] |
| Malaysia | Fuzzy ANP and DEMATEL | Assessment and selection of environmentally friendly building materials. | Criteria for environmental, economic, and social sustainability. | Khoshnava et al. [35] |
| Taiwan | Entropy, AHP, and TOPSIS | Selection of construction material suppliers. | Qualified product rate, product price, product market share rate, supply capacity, new product development rate, delivery time, and delivery time ratio. | Chen [36] |
| Serbia | FUCOM and Fuzzy MABAC | Selection of a location to build a Bailey bridge. | Access roads, scope of work on site arrangement, properties of banks, width of water barrier, masking conditions, scope of works on joining access roads with the crossing point, and protection of units. | Bozanic et al. [37] |
| Spain | WASPAS, TOPSIS, and Fuzzy AHP | Selection of fibers for strengthening reinforced asphalt mixtures. | Volume properties, resistance, strength, service life, stability, sensitivity to moisture, and strength at low temperatures. | Slebi-Acevedo et al. [26] |
| Montenegro | VIKOR and CP | Selection of the optimal combination of groundwork machines. | Practical performance indicators, price of machine combination operating hours, and reliability of machine combinations in relation to age. | Jovanović [38] |
| Iran | CRITIC and EDAS | Prequalification assessment of construction contractors. | Fifty-six criteria related to general information, financial and technical information, information on equipment, management, and professional experience. | Naik et al. [39] |
| Colombia | SD and AHP | Comparison of some strategies employed in the development of sustainable road maintenance policies. | Four criteria: growth of the road network, technical performance, costs, and environmental impact. | Ruiz and Guevara [40] |
| Alternatives | Capacity of Tank (t) | Asphalting Speed (m/min) | Theoretical Performance (t/h) | Width of Asphalting (m) | Asphalt Installation Thickness (cm) |
|---|---|---|---|---|---|
| A1—Volvo P4820D ABG | 12.5 | 20 | 500 | 6.5 | 30 |
| A2—Volvo P6820D ABG | 13.5 | 20 | 700 | 10 | 20 |
| A3—Volvo P5870c ABG | 12 | 40 | 600 | 8 | 30 |
| A4—Volvo P6870c ABG | 12 | 40 | 700 | 9 | 30 |
| A5—CAT AP555F | 14.5 | 25 | 1168 | 6.5–7.5 | 30 |
| A6—CAT AP500F | 14.5 | 25 | 1168 | 6.5 | 30 |
| A7—Vögele SUPER 1600 | 13 | 25 | 600 | 6.3 | 30 |
| A8—Vögele SUPER 1603 | 13 | 18 | 600 | 6.3 | 30 |
| A9—Vögele SUPER 1600-3 | 13 | 24 | 600 | 7.5 | 30 |
| A10—Vögele SUPER 1603-3 | 13 | 18 | 600 | 7 | 30 |
| A11—Vögele SUPER 1800-3 | 13 | 24 | 700 | 10 | 30 |
| A12—Vögele SUPER 1803-3 | 13 | 18 | 700 | 8 | 30 |
| Main Criteria | Sub-Criteria | Definition |
|---|---|---|
| Speed criteria | C1—Asphalting speed | Asphalting speed is a criterion that defines the efficiency of the paver in terms of what road length can be asphalted in a given period of time. The asphalting speed is most often expressed in meters of paved road per minute (mpm—meters per minute) or feet per minute (fpm). |
| C2—Transport speed | Transport speed is the speed at which pavers are transported from one place to another. Paver transport speed is expressed in km/h. The maximum transport speed was used in the analyses. | |
| C3—Conveyor speed | Conveyors are mechanisms that transport asphalt mixtures from tanks in which the asphalt mixtures are located. That is why this criterion is significant. Conveyor speed is expressed in meters per minute (mpm). | |
| C4—Drill speed | The augers take the material being delivered by the conveyors and move it outward across the width of the screed. Drill speed is expressed in revolutions per minute (rpm). | |
| Technical and technological group | C5—Tank capacity | Tank capacity is the amount of asphalt mixture that can be found in the paver. Tank capacity is expressed in tons. |
| C6—Engine power | Engine power is a factor which is a driving force of the paver and affects the movement of the paver. Engine power is expressed in Kw. | |
| C7—Type (wheels/caterpillars) | Based on the way of movement, all pavers can be divided into wheel pavers and caterpillar pavers. | |
| C8—Drill diameter | Drills evenly distribute the material in front of the iron. The function of drills enables homogeneous compaction and asphalting. They can be adjusted to required width by adding drill bits. The larger the diameter of the drill, the more asphalt mixture can be distributed in front of the iron. The diameter of the drill is expressed in millimeters (mm). | |
| A group of criteria related to dimensioning | C9—Asphalting width | Asphalting width is the width that the paver asphalts in one pass. This width may be different for the same paver depending on the accessories. Asphalting width is given in meters (m). |
| C10—Asphalt installation thickness | Asphalt is a material consisting of binders and stone material. There are several types of asphalt that differ in the grain size of the stone aggregate used for production. Depending on the types of asphalt, there are minimum and maximum technological thicknesses of asphalt. When evaluating pavers, this criterion is reflected in what the maximum thickness is that can be installed by asphalt pavers. The thickness of the asphalt installation is expressed in centimeters (cm). | |
| C11—The dimensions of pavers | The dimensions of pavers are important due to the movement of pavers and possible restrictions on movement in relation to the dimensions. The dimensions of pavers are presented in the form of length, width, and height, and all three dimensions are expressed in meters. | |
| C12—The weight of pavers | The weight of pavers is important because it affects the execution of works. Weight can be extremely important if working on poorly bearing soil, where heavier pavers can affect higher soil subsidence, while their weight can help compact the asphalt mixture. | |
| EEE group of criteria | C13—Fuel tank—capacity | Fuel tank capacity is expressed in liters (L). Tank capacity affects the continuity of paving. The higher the capacity of the tank, the less interruptions, and vice versa. |
| C14—Theoretical performance | Theoretical performance is the theoretical amount of asphalt mixture that can be installed. The theoretical performance of pavers is expressed in tons of asphalt mixture per time unit (t/h). | |
| C15—Gas emissions | During the construction of roads, certain amounts of gases are emitted in all processes, including asphalting with a paver. According to classification, there are six categories: Euro 1, Euro 2, Euro 3, Euro 4, Euro 5, and Euro 6. Vehicles are categorized based on the emission of certain gases. | |
| C16—The purchase price | The purchase price is the material value of a paver, which represents its value depending on its properties. The greater the possibility of applying a paver, the more expensive the paver, and vice versa. |
| Linguistic Variable | Abbreviation | TFN Scale |
|---|---|---|
| Absolutely less significant | ALS | (1,1,1) |
| Dominantly less significant | DLS | (0.5,0.667,1) |
| Much less significant | MLS | (0.4,0.5,0.667) |
| Really less significant | RLS | (0.333,0.4,0.5) |
| Less significant | LS | (0.286,0.333,0.4) |
| Moderately less significant | MDLS | (0.25,0.286,0.333) |
| Weakly less significant | WLS | (0.222,0.25,0.286) |
| Equally significant | ES | (0,0,0) |
| Cj/Cj−1 for main criteria | |||
| C1/ C3 | D1 = {(ES,0.65),(WLS,0.35)}; D2 = {(ES,0.75),(WLS,0.15),(MDLS,0.1)} | ||
| C4/C1 | D1 = {(ES,0.1),(WLS,0.9)}; D2 = {(ES,0.15),(WLS,0.7),(MDLS,0.15)} | ||
| C2/ C4 | D1 = {(ES,0.7),(WLS,0.25)}; D2 = {(ES,0.6),(WLS,0.3),(MDLS,0.1)} | ||
| Cj/Cj−1 for speed criteria | Cj/Cj−1 for TT criteria | ||
| C2/ C1 | D1 = {(MDLS,0.1),(WLS,0.85)}; D2 = {(ES,0.1),(MDLS,0.15),(WLS,0.75)} | C2/ C3 | D1 = {(ES,0.85),(WLS,0.15)}; D2 = {(ES,0.75),(WLS,0.15);(LS,0.1)} |
| C3/ C2 | D1 = {(MLS,0.25),(MDLS,0.75)}; D2 = {(ES,0.05),(MDLS,0.8),(WLS,0.15)} | C1/ C2 | D1 = {(DLS,0.8),(ALS,0.15)}; D2 = {(RLS,0.1),(DLS,0.8),(ALS,0.1)} |
| C4/ C3 | D1 = {(RLS,0.15),(MDLS,0.80)}; D2 = {(ES,0.1),(RLS,0.2),(MDLS;0.7)} | C4/ C1 | D1 = {(WLS,0.65),(MDLS,0.3)}; D2 = {(ES,0.1),(WLS,0.25),(MDLS,0.6)} |
| Cj/Cj−1 for dimensioning criteria | Cj/Cj−1 for the EEE group of criteria | ||
| C2/ C1 | D1 = {(RLS,0.4),(MDLS,0.6)}; D2 = {(LS,0.15),(RLS,0.35),(MDLS,0.5)} | C2/ C4 | D1 = {(ES,0.65),(WLS,0.35)}; D2 = {(ES,0.5),(WLS,0.3),(RLS,0.2)} |
| C3/ C2 | D1 = {(ES,0.35),(WLS,0.6)}; D2 = {(ES,0.3),(WLS,0.55),(MDLS,0.1)} | C1/ C2 | D1 = {(WLS,0.45),(RLS,0.55)}; D2 = {(WLS,0.45),(MDLS,0.15),(RLS,0.4)} |
| C4/ C3 | D1 = {(MDLS,0.55),(LS,0.45)}; D2 = {(ES;0.05),(MDLS,0.6),(LS,0.35)} | C3/ C1 | D1 = {(WLS,0.1),(LS,0.9)}; D2 = {(ES,0.1),(LS;0.8),(RLS,0.1)} |
| Cj/Cj−1 for main criteria | |||
| C1/ C3 | D = {(ES,0.903),(WLS,0.097)} | ||
| C4/ C1 | D = {(ES,0.023),(WLS,0.977)} | ||
| C2/ C4 | D = {(ES,0.806),(WLS,0.144)} | ||
| Cj/Cj−1 for speed criteria | Cj/Cj−1 for TT criteria | ||
| C2/ C1 | D = {(MDLS,0.022),(WLS,0.928)} | C2/ C3 | D = {(ES,0.966),(WLS,0.034)} |
| C3/ C2 | D = {(MDLS,1)} | C1/ C2 | D = {(DLS,0.916),(ALS,0.021)} |
| C4/ C3 | D = {(RLS,0.048),(MDLS,0.902} | C4/ C1 | D = {(WLS,0.428),(MDLS,0.474)} |
| Cj/Cj−1 for dimensioning criteria | Cj/Cj−1 for the EEE group of criteria | ||
| C2/ C1 | D = {(RLS,0.318),(MDLS,0.682)} | C2/ C4 | D = {(ES,0.756),(WLS,0.244)} |
| C3/ C2 | D = {(ES,0.2),(WLS,0.627)} | C1/ C2 | D = {(WLS,0.479),(RLS,0.521)} |
| C4/ C3 | D = {(MDLS,0.677),(LS,0.323)} | C3/ C1 | D = {LS,1)} |
| Main | Speed | TT | Dimensioning | EEE | |||||
|---|---|---|---|---|---|---|---|---|---|
| C1–C3 | (0.022,0.024,0.028) | C2–C1 | (0.212,0.238,0.272) | C2–C3 | (0.008,0.009,0.01) | C2–C1 | (0.277,0.322,0.386) | C2–C4 | (0.054,0.061,0.07) |
| C4–C1 | (0.217,0.244,0.279) | C3–C2 | (0.25,0.286,0.333) | C1–C2 | (0.479,0.632,0.937) | C3–C2 | (0.139,0.157,0.179) | C1–C2 | (0.28,0.328,0.397) |
| C2–C4 | (0.032,0.036,0.041) | C4–C3 | (0.242,0.277,0.325) | C4–C1 | (0.214,0.243,0.28) | C4–C3 | (0.262,0.301,0.355) | C3–C1 | (0.286,0.333,0.4) |
| Crisp Value | |||||||||||||
|---|---|---|---|---|---|---|---|---|---|---|---|---|---|
| C3 | 1.000 | 1.000 | 1.000 | 1.000 | 1.000 | 1.000 | 0.281 | 0.284 | 0.289 | 0.284 | |||
| C1 | 0.022 | 0.024 | 0.028 | 1.022 | 1.024 | 1.028 | 0.973 | 0.976 | 0.979 | 0.273 | 0.277 | 0.283 | 0.278 |
| C4 | 0.217 | 0.244 | 0.279 | 1.217 | 1.244 | 1.279 | 0.761 | 0.785 | 0.804 | 0.214 | 0.223 | 0.232 | 0.223 |
| C2 | 0.032 | 0.036 | 0.041 | 1.032 | 1.036 | 1.041 | 0.731 | 0.757 | 0.779 | 0.205 | 0.215 | 0.225 | 0.215 |
| SUM | 3.464 | 3.518 | 3.562 | ||||||||||
| I | II | III | IV | ||||||||||||
| C11 | 0.331 | 0.342 | 0.355 | C21 | 0.159 | 0.197 | 0.231 | C31 | 0.332 | 0.343 | 0.359 | C41 | 0.205 | 0.223 | 0.240 |
| C12 | 0.260 | 0.276 | 0.293 | C22 | 0.308 | 0.321 | 0.342 | C32 | 0.239 | 0.260 | 0.281 | C42 | 0.286 | 0.296 | 0.308 |
| C13 | 0.195 | 0.215 | 0.234 | C23 | 0.311 | 0.324 | 0.345 | C33 | 0.203 | 0.224 | 0.247 | C43 | 0.146 | 0.167 | 0.187 |
| C14 | 0.147 | 0.168 | 0.189 | C24 | 0.124 | 0.158 | 0.191 | C34 | 0.150 | 0.173 | 0.196 | C44 | 0.306 | 0.314 | 0.325 |
| I | II | III | IV | ||||||||||||
| C11 | 0.091 | 0.095 | 0.100 | C21 | 0.033 | 0.042 | 0.052 | C31 | 0.093 | 0.098 | 0.104 | C41 | 0.044 | 0.050 | 0.056 |
| C12 | 0.071 | 0.077 | 0.083 | C22 | 0.063 | 0.069 | 0.077 | C32 | 0.067 | 0.074 | 0.081 | C42 | 0.061 | 0.066 | 0.071 |
| C13 | 0.053 | 0.060 | 0.066 | C23 | 0.064 | 0.070 | 0.078 | C33 | 0.057 | 0.064 | 0.071 | C43 | 0.031 | 0.037 | 0.043 |
| C14 | 0.040 | 0.047 | 0.053 | C24 | 0.025 | 0.034 | 0.043 | C34 | 0.042 | 0.049 | 0.056 | C44 | 0.065 | 0.070 | 0.075 |
| C1 | C2 | C3 | C4 | C5 | C6 | C7 | C8 | C9 | C10 | C11 | C12 | C13 | C14 | C15 | C16 | |
|---|---|---|---|---|---|---|---|---|---|---|---|---|---|---|---|---|
| A1 | VG | G | MG | MG | MG | G | G | VG | VG | EG | G | G | MG | G | G | G |
| A2 | VG | G | G | VG | G | VG | G | VG | EG | VG | G | G | G | VG | G | G |
| A3 | EG | VG | VG | EG | G | VG | EG | EG | VG | EG | G | VG | G | VG | VG | VG |
| A4 | EG | VG | VG | EG | G | VG | EG | EG | EG | EG | G | VG | G | VG | VG | VG |
| A5 | EG | G | VG | VG | G | G | G | VG | VG | EG | G | VG | G | EG | VG | MG |
| A6 | EG | G | VG | VG | G | G | G | EG | G | EG | G | VG | G | EG | VG | MG |
| A7 | EG | VG | VG | VG | G | G | G | VG | VG | EG | VG | G | G | VG | VG | VG |
| A8 | VG | VG | EG | VG | G | G | EG | EG | EG | EG | VG | G | G | EG | VG | VG |
| A9 | EG | G | EG | VG | G | G | G | VG | EG | EG | VG | G | G | EG | VG | VG |
| A10 | VG | EG | EG | VG | G | G | EG | EG | EG | EG | VG | G | G | EG | VG | VG |
| A11 | EG | VG | EG | VG | VG | G | G | VG | EG | EG | VG | G | VG | EG | VG | VG |
| A12 | VG | VG | EG | VG | G | G | EG | EG | EG | EG | VG | G | G | VG | VG | MG |
| C1 | C2 | C3 | C4 | C5 | C6 | C7 | C8 | |||||||||
| A1 | 6.00 | 7.52 | 4.50 | 6.46 | 5.27 | 6.25 | 5.65 | 6.90 | 6.27 | 7.25 | 6.25 | 6.75 | 7.13 | 7.88 | 7.56 | 7.94 |
| A2 | 6.00 | 7.52 | 4.50 | 6.46 | 5.75 | 7.25 | 7.75 | 8.73 | 7.27 | 8.25 | 8.25 | 8.75 | 7.13 | 7.88 | 7.56 | 7.94 |
| A3 | 8.13 | 8.88 | 7.10 | 8.35 | 6.00 | 7.52 | 8.13 | 8.88 | 6.59 | 7.42 | 8.25 | 8.75 | 7.59 | 8.42 | 7.59 | 8.42 |
| A4 | 8.13 | 8.88 | 7.10 | 8.35 | 6.00 | 7.52 | 7.75 | 8.73 | 6.75 | 8.25 | 8.25 | 8.75 | 7.59 | 8.42 | 7.59 | 8.42 |
| A5 | 6.75 | 8.25 | 5.69 | 6.81 | 7.59 | 8.42 | 7.59 | 8.42 | 7.50 | 8.50 | 6.59 | 7.42 | 7.13 | 7.88 | 8.56 | 8.94 |
| A6 | 6.75 | 8.25 | 5.63 | 7.29 | 7.59 | 8.42 | 7.75 | 8.73 | 7.27 | 8.25 | 6.59 | 7.42 | 7.25 | 7.75 | 9.00 | 9.00 |
| A7 | 6.75 | 8.25 | 4.65 | 7.77 | 7.75 | 8.73 | 7.75 | 8.73 | 7.27 | 8.25 | 7.27 | 8.25 | 7.13 | 7.88 | 8.25 | 8.75 |
| A8 | 5.75 | 7.25 | 7.25 | 8.67 | 8.13 | 8.88 | 7.75 | 8.73 | 7.27 | 8.25 | 7.27 | 8.25 | 7.59 | 8.42 | 8.56 | 8.94 |
| A9 | 6.75 | 8.25 | 4.50 | 6.46 | 8.13 | 8.88 | 7.75 | 8.73 | 7.27 | 8.25 | 7.27 | 8.25 | 7.13 | 7.88 | 8.25 | 8.75 |
| A10 | 6.75 | 8.25 | 4.50 | 6.46 | 8.13 | 8.88 | 7.75 | 8.73 | 7.27 | 8.25 | 7.27 | 8.25 | 7.13 | 7.88 | 8.25 | 8.75 |
| A11 | 6.75 | 8.25 | 4.44 | 6.98 | 8.13 | 8.88 | 7.75 | 8.73 | 7.59 | 8.42 | 7.75 | 8.73 | 7.13 | 7.88 | 8.25 | 8.75 |
| A12 | 5.75 | 7.25 | 7.25 | 8.67 | 8.13 | 8.88 | 7.75 | 8.73 | 7.27 | 8.25 | 7.75 | 8.73 | 7.59 | 8.42 | 8.56 | 8.94 |
| C9 | C10 | C11 | C12 | C13 | C14 | C15 | C16 | |||||||||
| A1 | 5.65 | 6.90 | 8.25 | 8.75 | 6.25 | 7.67 | 6.10 | 7.35 | 4.63 | 6.29 | 7.56 | 7.94 | 7.00 | 7.00 | 4.65 | 5.90 |
| A2 | 8.25 | 8.75 | 6.25 | 7.67 | 4.71 | 7.13 | 6.10 | 7.35 | 6.75 | 7.73 | 7.56 | 7.94 | 7.06 | 7.44 | 4.33 | 5.75 |
| A3 | 6.23 | 8.19 | 8.25 | 8.75 | 4.71 | 7.13 | 6.25 | 7.67 | 6.75 | 7.73 | 8.00 | 8.00 | 6.27 | 7.25 | 4.40 | 6.25 |
| A4 | 8.25 | 8.75 | 8.25 | 8.75 | 4.71 | 7.13 | 6.25 | 7.67 | 6.75 | 7.73 | 7.56 | 7.94 | 6.27 | 7.25 | 4.40 | 6.25 |
| A5 | 5.65 | 6.90 | 8.25 | 8.75 | 4.71 | 7.13 | 6.25 | 7.67 | 4.25 | 6.54 | 9.00 | 9.00 | 6.59 | 7.42 | 2.40 | 4.25 |
| A6 | 5.59 | 6.42 | 8.25 | 8.75 | 4.71 | 7.13 | 6.25 | 7.67 | 5.75 | 6.73 | 9.00 | 9.00 | 4.71 | 6.38 | 2.40 | 4.25 |
| A7 | 5.65 | 6.90 | 8.25 | 8.75 | 6.25 | 7.67 | 6.65 | 7.90 | 6.10 | 7.35 | 7.13 | 7.88 | 4.71 | 6.38 | 4.71 | 6.38 |
| A8 | 5.71 | 7.38 | 8.25 | 8.75 | 5.75 | 7.61 | 6.65 | 7.90 | 6.10 | 7.35 | 7.10 | 8.35 | 4.71 | 6.38 | 4.40 | 6.25 |
| A9 | 6.65 | 7.90 | 8.25 | 8.75 | 6.25 | 7.67 | 6.17 | 7.84 | 6.10 | 7.35 | 7.10 | 8.35 | 4.71 | 6.38 | 4.40 | 6.25 |
| A10 | 6.65 | 7.90 | 8.25 | 8.75 | 6.25 | 7.67 | 6.17 | 7.84 | 6.10 | 7.35 | 7.10 | 8.35 | 4.71 | 6.38 | 4.40 | 6.25 |
| A11 | 8.25 | 8.75 | 8.25 | 8.75 | 5.50 | 7.46 | 6.50 | 8.46 | 8.25 | 8.75 | 7.59 | 8.42 | 4.71 | 6.38 | 4.25 | 5.75 |
| A12 | 7.27 | 8.25 | 8.25 | 8.75 | 5.50 | 7.46 | 6.23 | 8.19 | 6.23 | 8.19 | 7.56 | 7.94 | 4.71 | 6.38 | 3.65 | 4.90 |
| Rank | ||||||||||||
|---|---|---|---|---|---|---|---|---|---|---|---|---|
| AID | 0.65 | 0.81 | ||||||||||
| A1 | 0.73 | 0.85 | 0.899 | 1.31 | 0.725 | 0.946 | 1.105 | 0.836 | 0.431 | 0.569 | 0.631 | 12 |
| A2 | 0.77 | 0.91 | 0.952 | 1.39 | 0.767 | 1.003 | 1.171 | 0.885 | 0.43 | 0.57 | 0.668 | 9 |
| A3 | 0.81 | 0.95 | 1.007 | 1.462 | 0.812 | 1.055 | 1.235 | 0.934 | 0.431 | 0.569 | 0.705 | 3 |
| A4 | 0.83 | 0.96 | 1.03 | 1.475 | 0.83 | 1.064 | 1.253 | 0.947 | 0.43 | 0.57 | 0.714 | 1 |
| A5 | 0.75 | 0.89 | 0.928 | 1.37 | 0.749 | 0.989 | 1.149 | 0.869 | 0.431 | 0.569 | 0.656 | 10 |
| A6 | 0.75 | 0.89 | 0.932 | 1.361 | 0.751 | 0.982 | 1.147 | 0.867 | 0.43 | 0.57 | 0.654 | 11 |
| A7 | 0.78 | 0.93 | 0.962 | 1.429 | 0.775 | 1.031 | 1.196 | 0.903 | 0.43 | 0.57 | 0.682 | 8 |
| A8 | 0.79 | 0.94 | 0.979 | 1.442 | 0.789 | 1.041 | 1.211 | 0.915 | 0.43 | 0.57 | 0.69 | 5 |
| A9 | 0.78 | 0.93 | 0.969 | 1.432 | 0.781 | 1.033 | 1.201 | 0.907 | 0.43 | 0.57 | 0.684 | 6 |
| A10 | 0.78 | 0.93 | 0.969 | 1.432 | 0.781 | 1.033 | 1.201 | 0.907 | 0.43 | 0.57 | 0.684 | 6 |
| A11 | 0.82 | 0.96 | 1.011 | 1.469 | 0.815 | 1.06 | 1.24 | 0.938 | 0.431 | 0.569 | 0.708 | 2 |
| A12 | 0.80 | 0.94 | 0.994 | 1.445 | 0.801 | 1.043 | 1.22 | 0.922 | 0.43 | 0.57 | 0.695 | 4 |
| İD | 0.90 | 1.00 | ||||||||||
| SCC | R- MARCOS | R-MABAC | R- TOPSIS | R-WASPAS | R- ARAS | R- SAW | R- COPRAS | R- CoCoSo | AV |
| R-MARCOS | 1.000 | 0.979 | 0.846 | 1.000 | 0.993 | 1.000 | 0.993 | 0.972 | 0.973 |
| R-MABAC | 0.979 | 1.000 | 0.881 | 0.979 | 0.972 | 0.979 | 0.972 | 0.993 | 0.969 |
| R-TOPSIS | 0.846 | 0.881 | 1.000 | 0.846 | 0.867 | 0.846 | 0.867 | 0.902 | 0.882 |
| R-WASPAS | 1.000 | 0.979 | 0.846 | 1.000 | 0.993 | 1.000 | 0.993 | 0.972 | 0.973 |
| R-ARAS | 0.993 | 0.972 | 0.867 | 0.993 | 1.000 | 0.993 | 1.000 | 0.979 | 0.975 |
| R-SAW | 1.000 | 0.979 | 0.846 | 1.000 | 0.993 | 1.000 | 0.993 | 0.972 | 0.973 |
| R-COPRAS | 0.993 | 0.972 | 0.867 | 0.993 | 1.000 | 0.993 | 1.000 | 0.979 | 0.975 |
| R-CoCoSo | 0.972 | 0.993 | 0.902 | 0.972 | 0.979 | 0.972 | 0.979 | 1.000 | 0.971 |
| 0.961 | |||||||||
| WS | R- MARCOS | R-MABAC | R- TOPSIS | R-WASPAS | R- ARAS | R- SAW | R- COPRAS | R- CoCoSo | AV |
| R-MARCOS | 1.000 | 0.999 | 0.887 | 1.000 | 0.961 | 1.000 | 0.961 | 0.960 | 0.971 |
| R-MABAC | 1.000 | 1.000 | 0.887 | 1.000 | 0.961 | 1.000 | 0.961 | 0.961 | 0.971 |
| R-TOPSIS | 0.927 | 0.928 | 1.000 | 0.927 | 0.957 | 0.927 | 0.957 | 0.958 | 0.948 |
| R-WASPAS | 1.000 | 0.999 | 0.887 | 1.000 | 0.961 | 1.000 | 0.961 | 0.960 | 0.971 |
| R-ARAS | 0.961 | 0.960 | 0.948 | 0.961 | 1.000 | 0.961 | 1.000 | 0.999 | 0.974 |
| R-SAW | 1.000 | 0.999 | 0.887 | 1.000 | 0.961 | 1.000 | 0.961 | 0.960 | 0.971 |
| R-COPRAS | 0.961 | 0.960 | 0.948 | 0.961 | 1.000 | 0.961 | 1.000 | 0.999 | 0.974 |
| R-CoCoSo | 0.961 | 0.961 | 0.948 | 0.961 | 1.000 | 0.961 | 1.000 | 1.000 | 0.974 |
| 0.969 |
Publisher’s Note: MDPI stays neutral with regard to jurisdictional claims in published maps and institutional affiliations. |
© 2022 by the authors. Licensee MDPI, Basel, Switzerland. This article is an open access article distributed under the terms and conditions of the Creative Commons Attribution (CC BY) license (https://creativecommons.org/licenses/by/4.0/).
Share and Cite
Matić, B.; Marinković, M.; Jovanović, S.; Sremac, S.; Stević, Ž. Intelligent Novel IMF D-SWARA—Rough MARCOS Algorithm for Selection Construction Machinery for Sustainable Construction of Road Infrastructure. Buildings 2022, 12, 1059. https://doi.org/10.3390/buildings12071059
Matić B, Marinković M, Jovanović S, Sremac S, Stević Ž. Intelligent Novel IMF D-SWARA—Rough MARCOS Algorithm for Selection Construction Machinery for Sustainable Construction of Road Infrastructure. Buildings. 2022; 12(7):1059. https://doi.org/10.3390/buildings12071059
Chicago/Turabian StyleMatić, Bojan, Milan Marinković, Stanislav Jovanović, Siniša Sremac, and Željko Stević. 2022. "Intelligent Novel IMF D-SWARA—Rough MARCOS Algorithm for Selection Construction Machinery for Sustainable Construction of Road Infrastructure" Buildings 12, no. 7: 1059. https://doi.org/10.3390/buildings12071059