
Effect of Hot Mixing Duration on Blending, Performance, and Environmental Impact of Central Plant Recycled Asphalt Mixture

 ,
,
Abstract
:1. Introduction
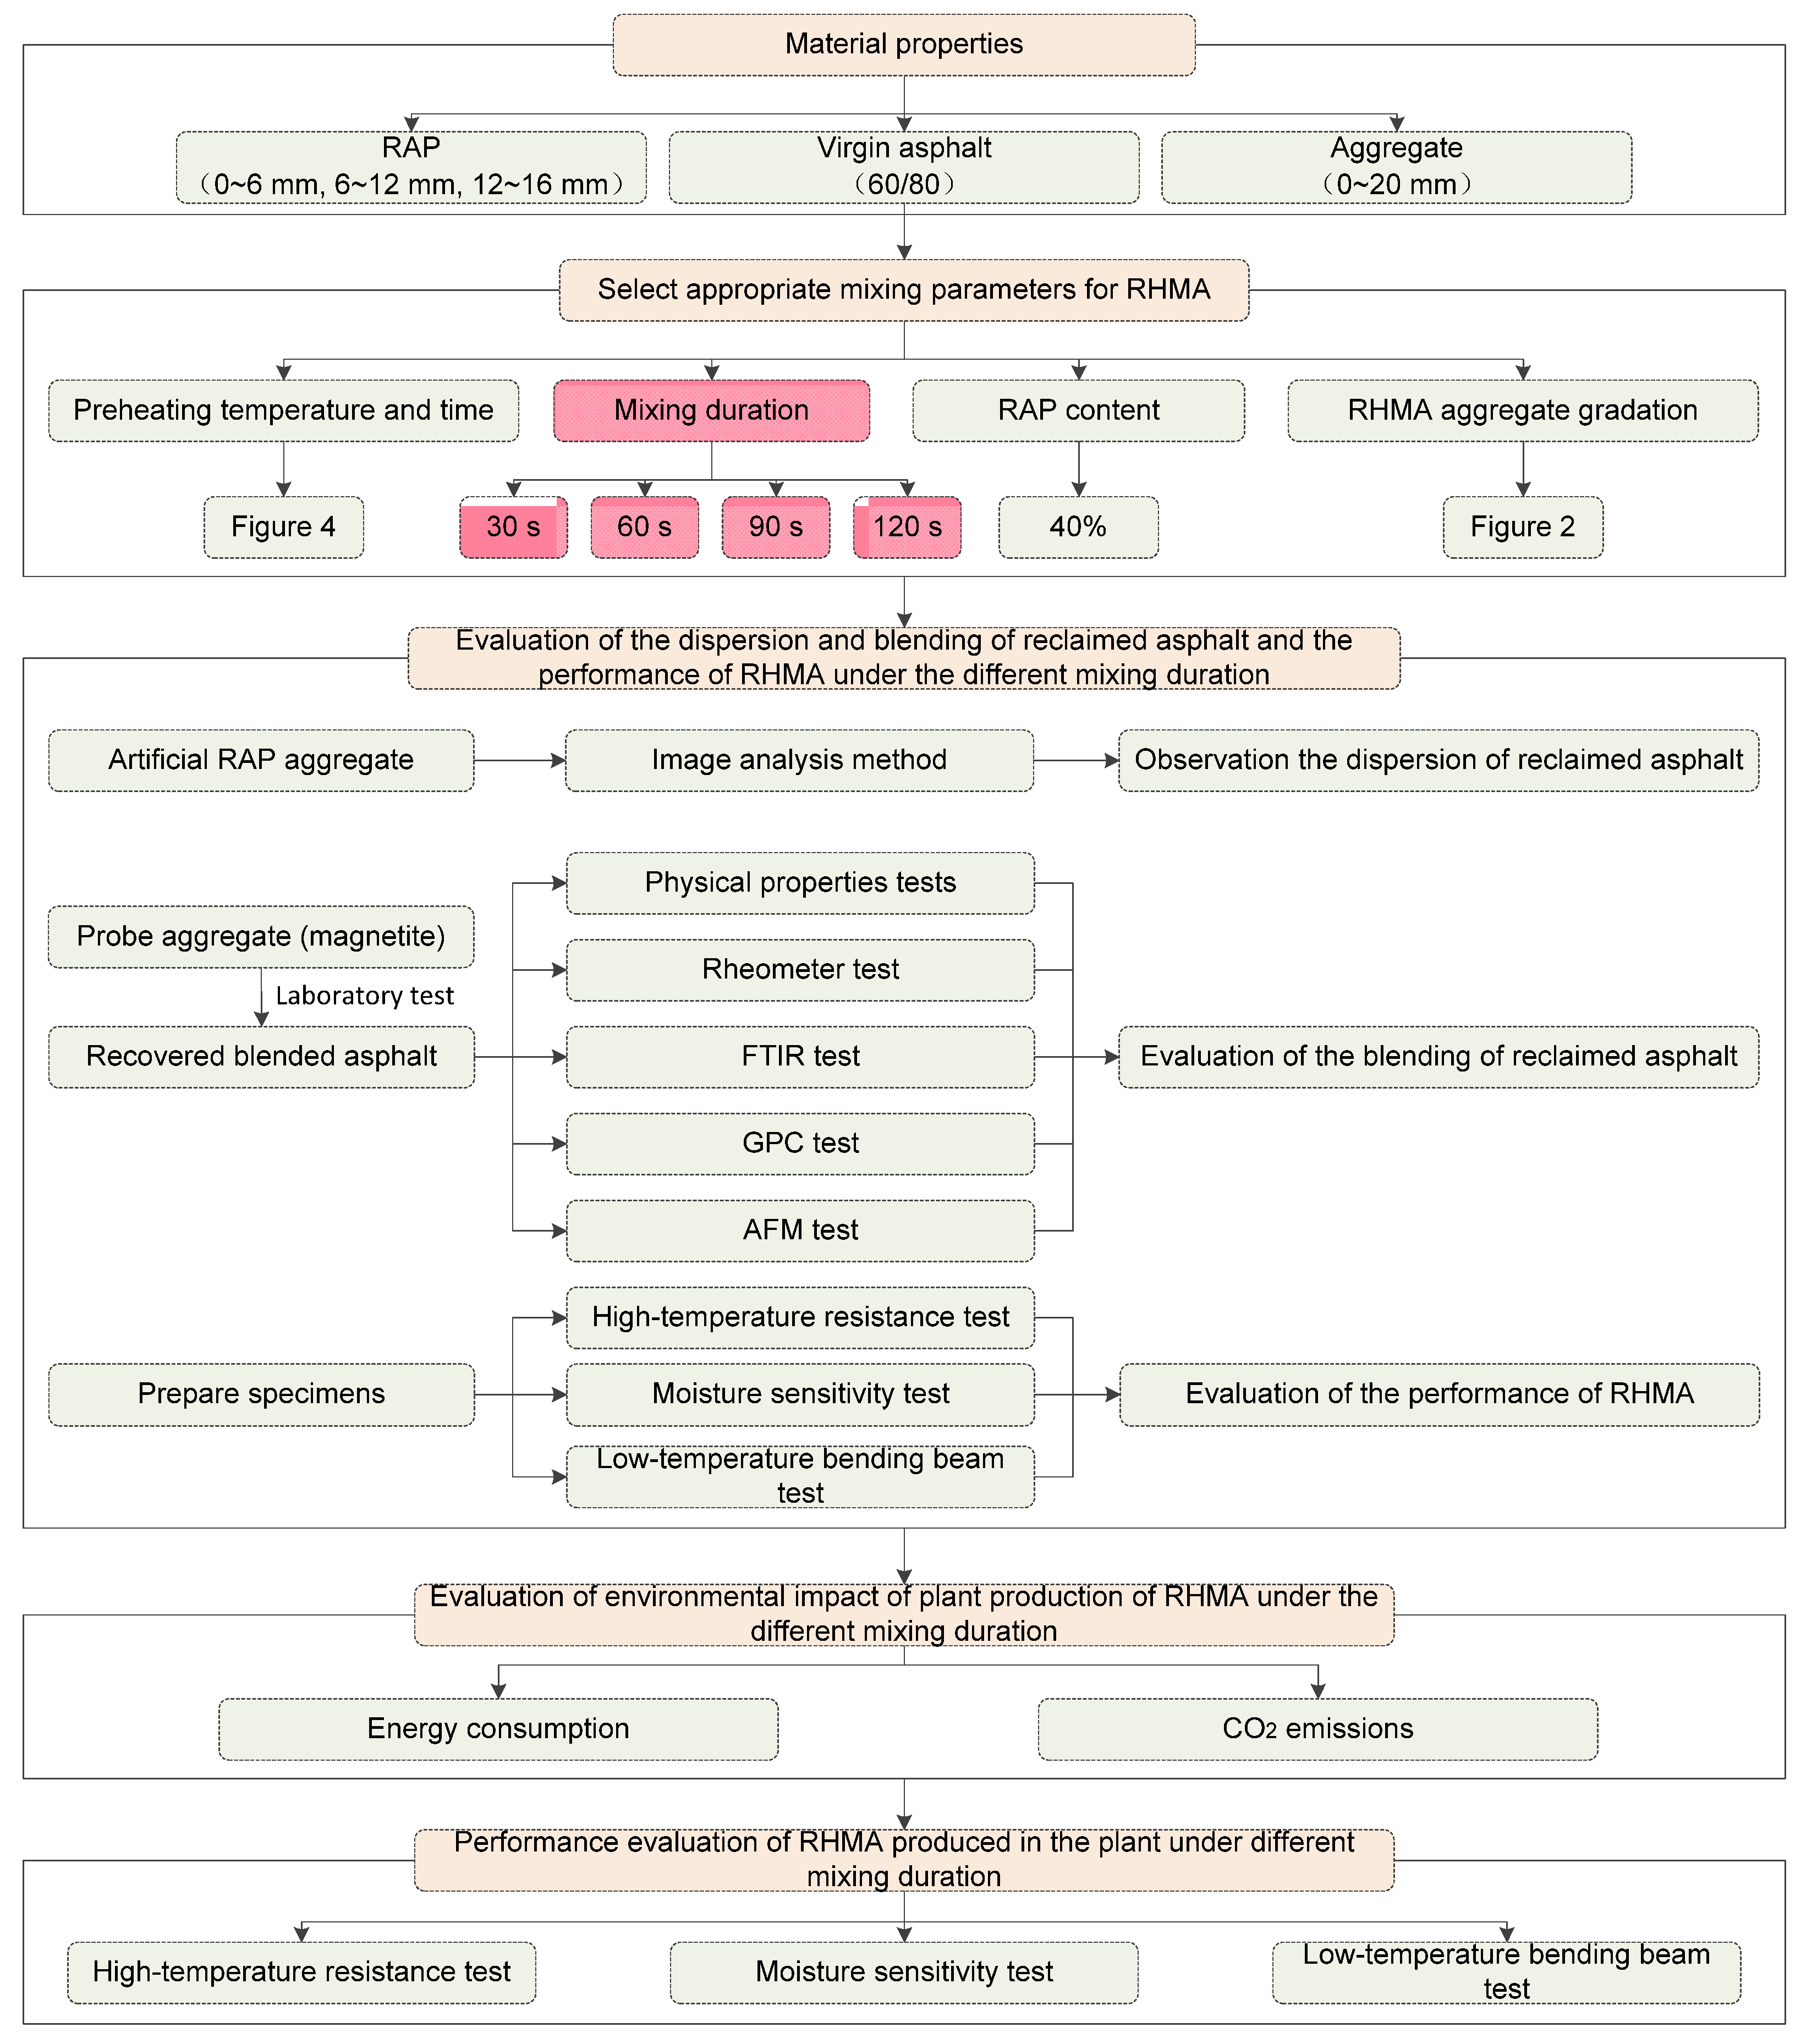
2. Materials and Methods
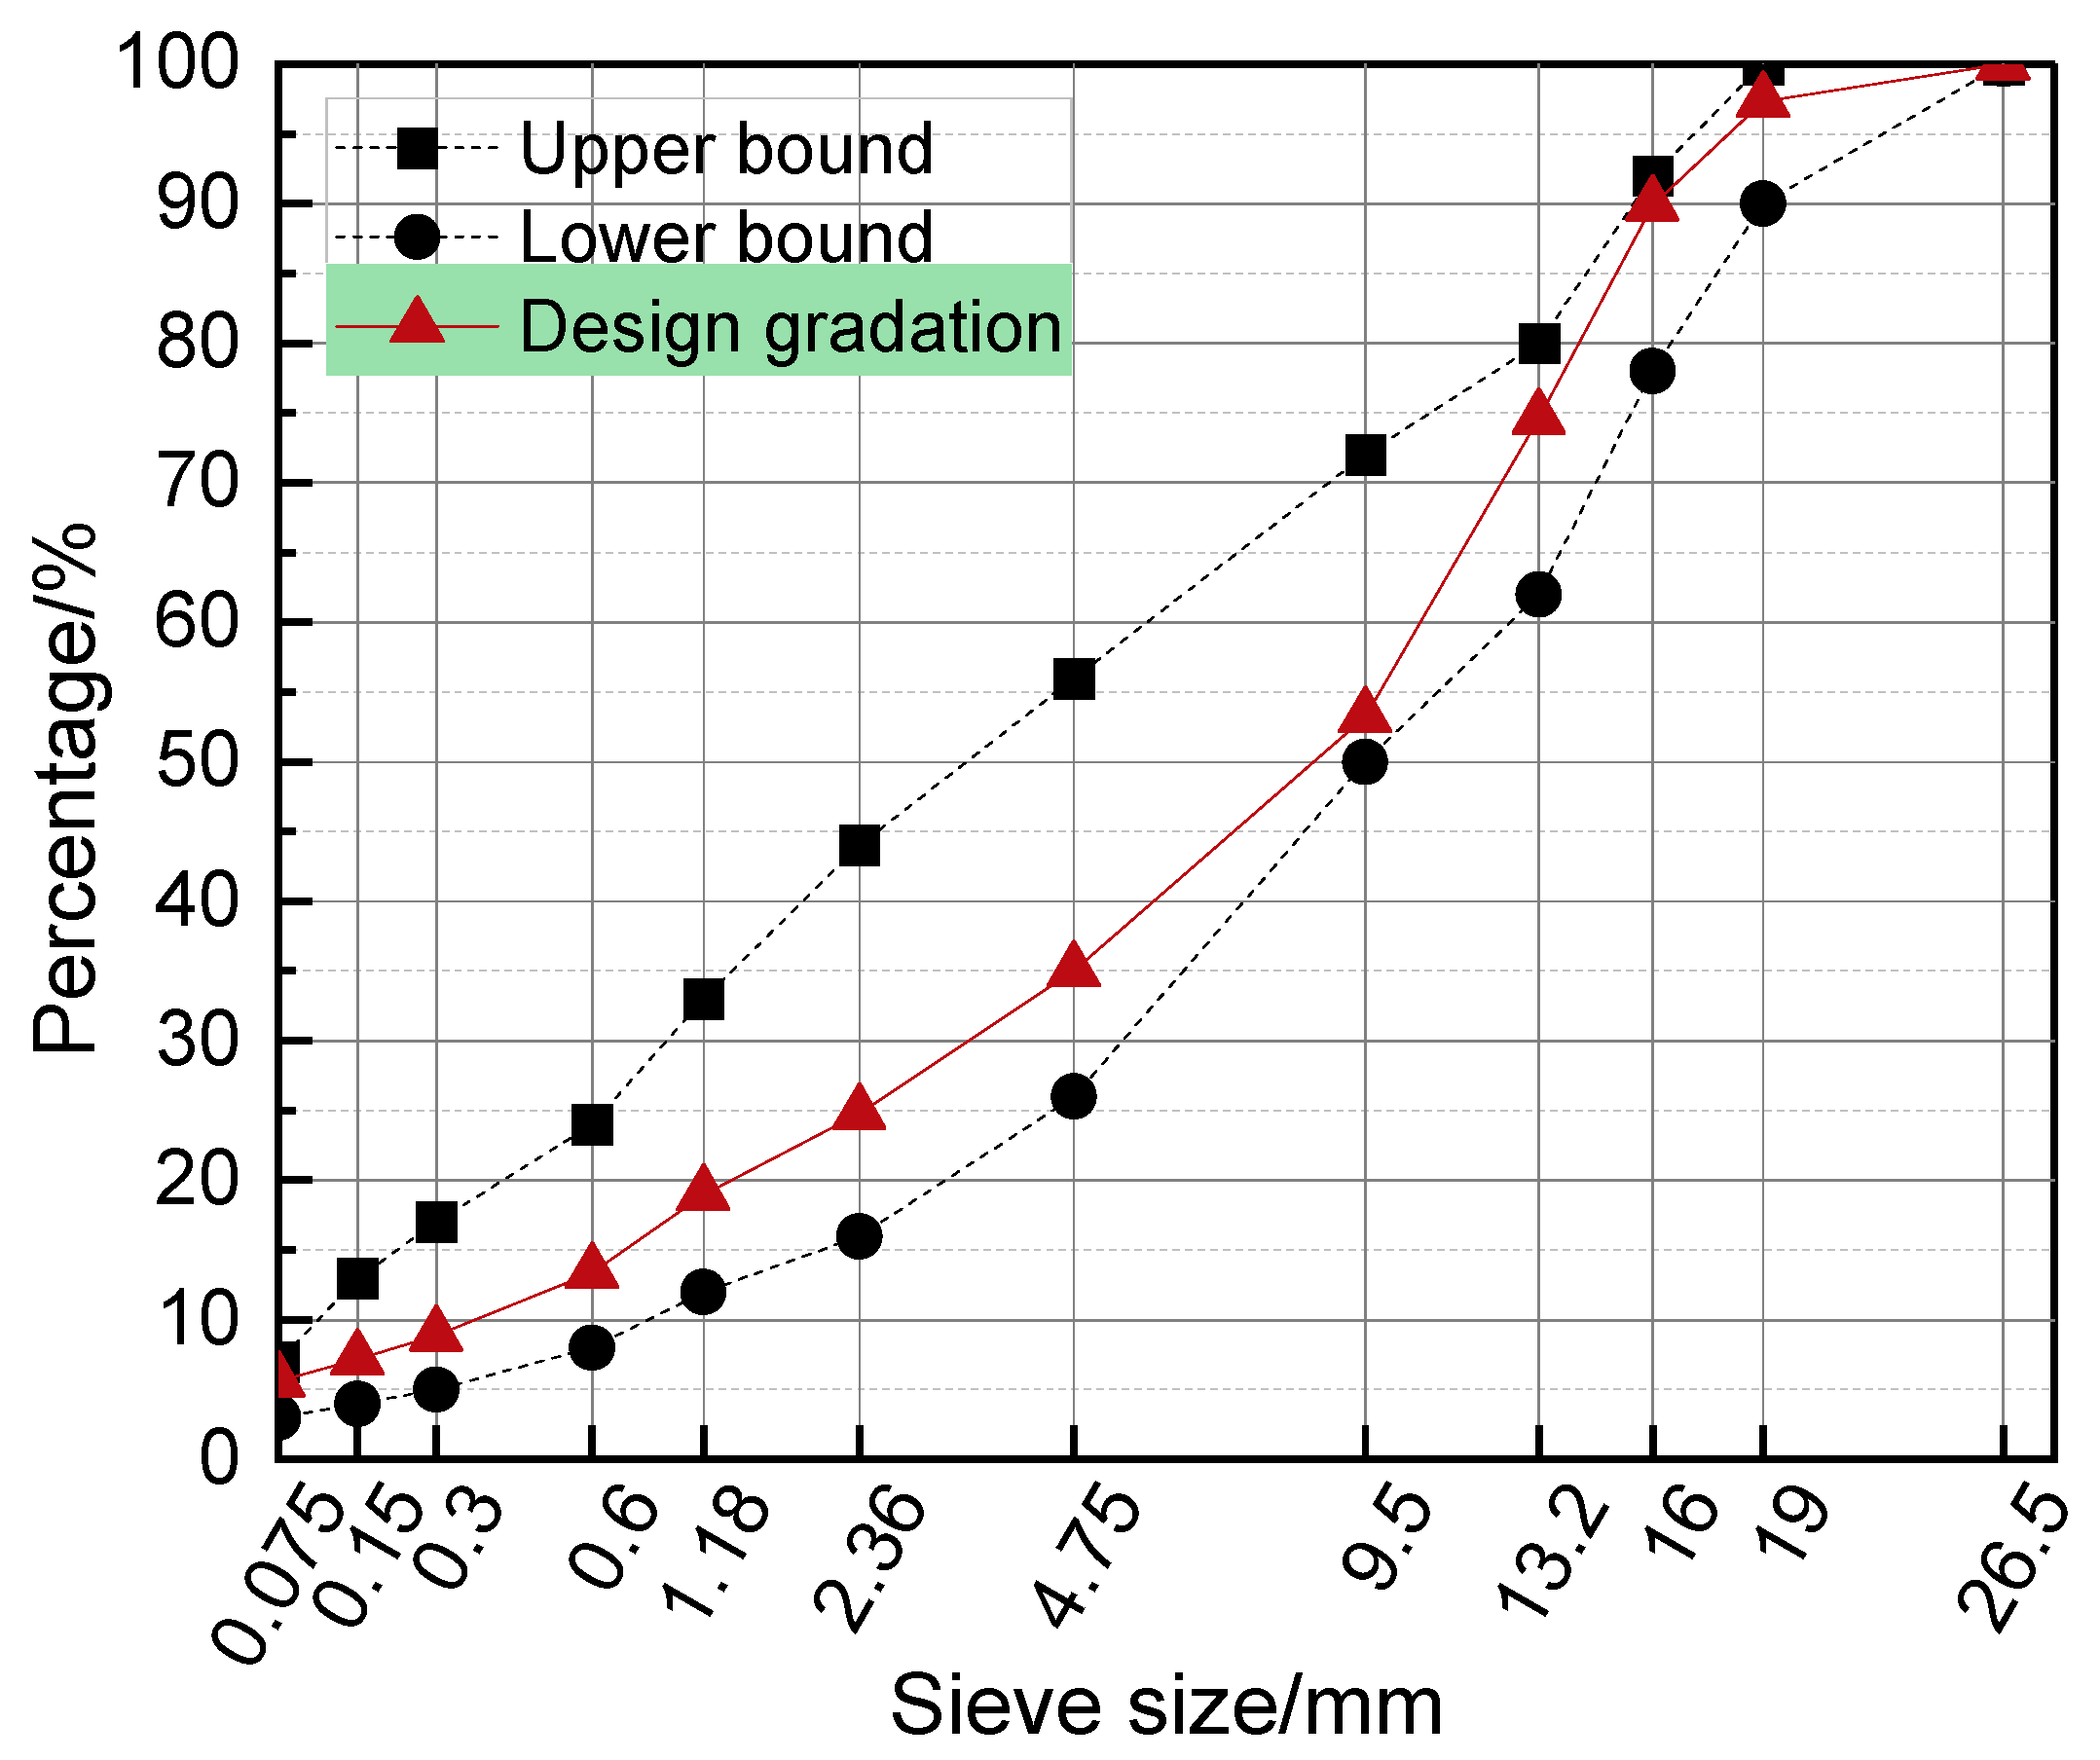
2.1. Materials
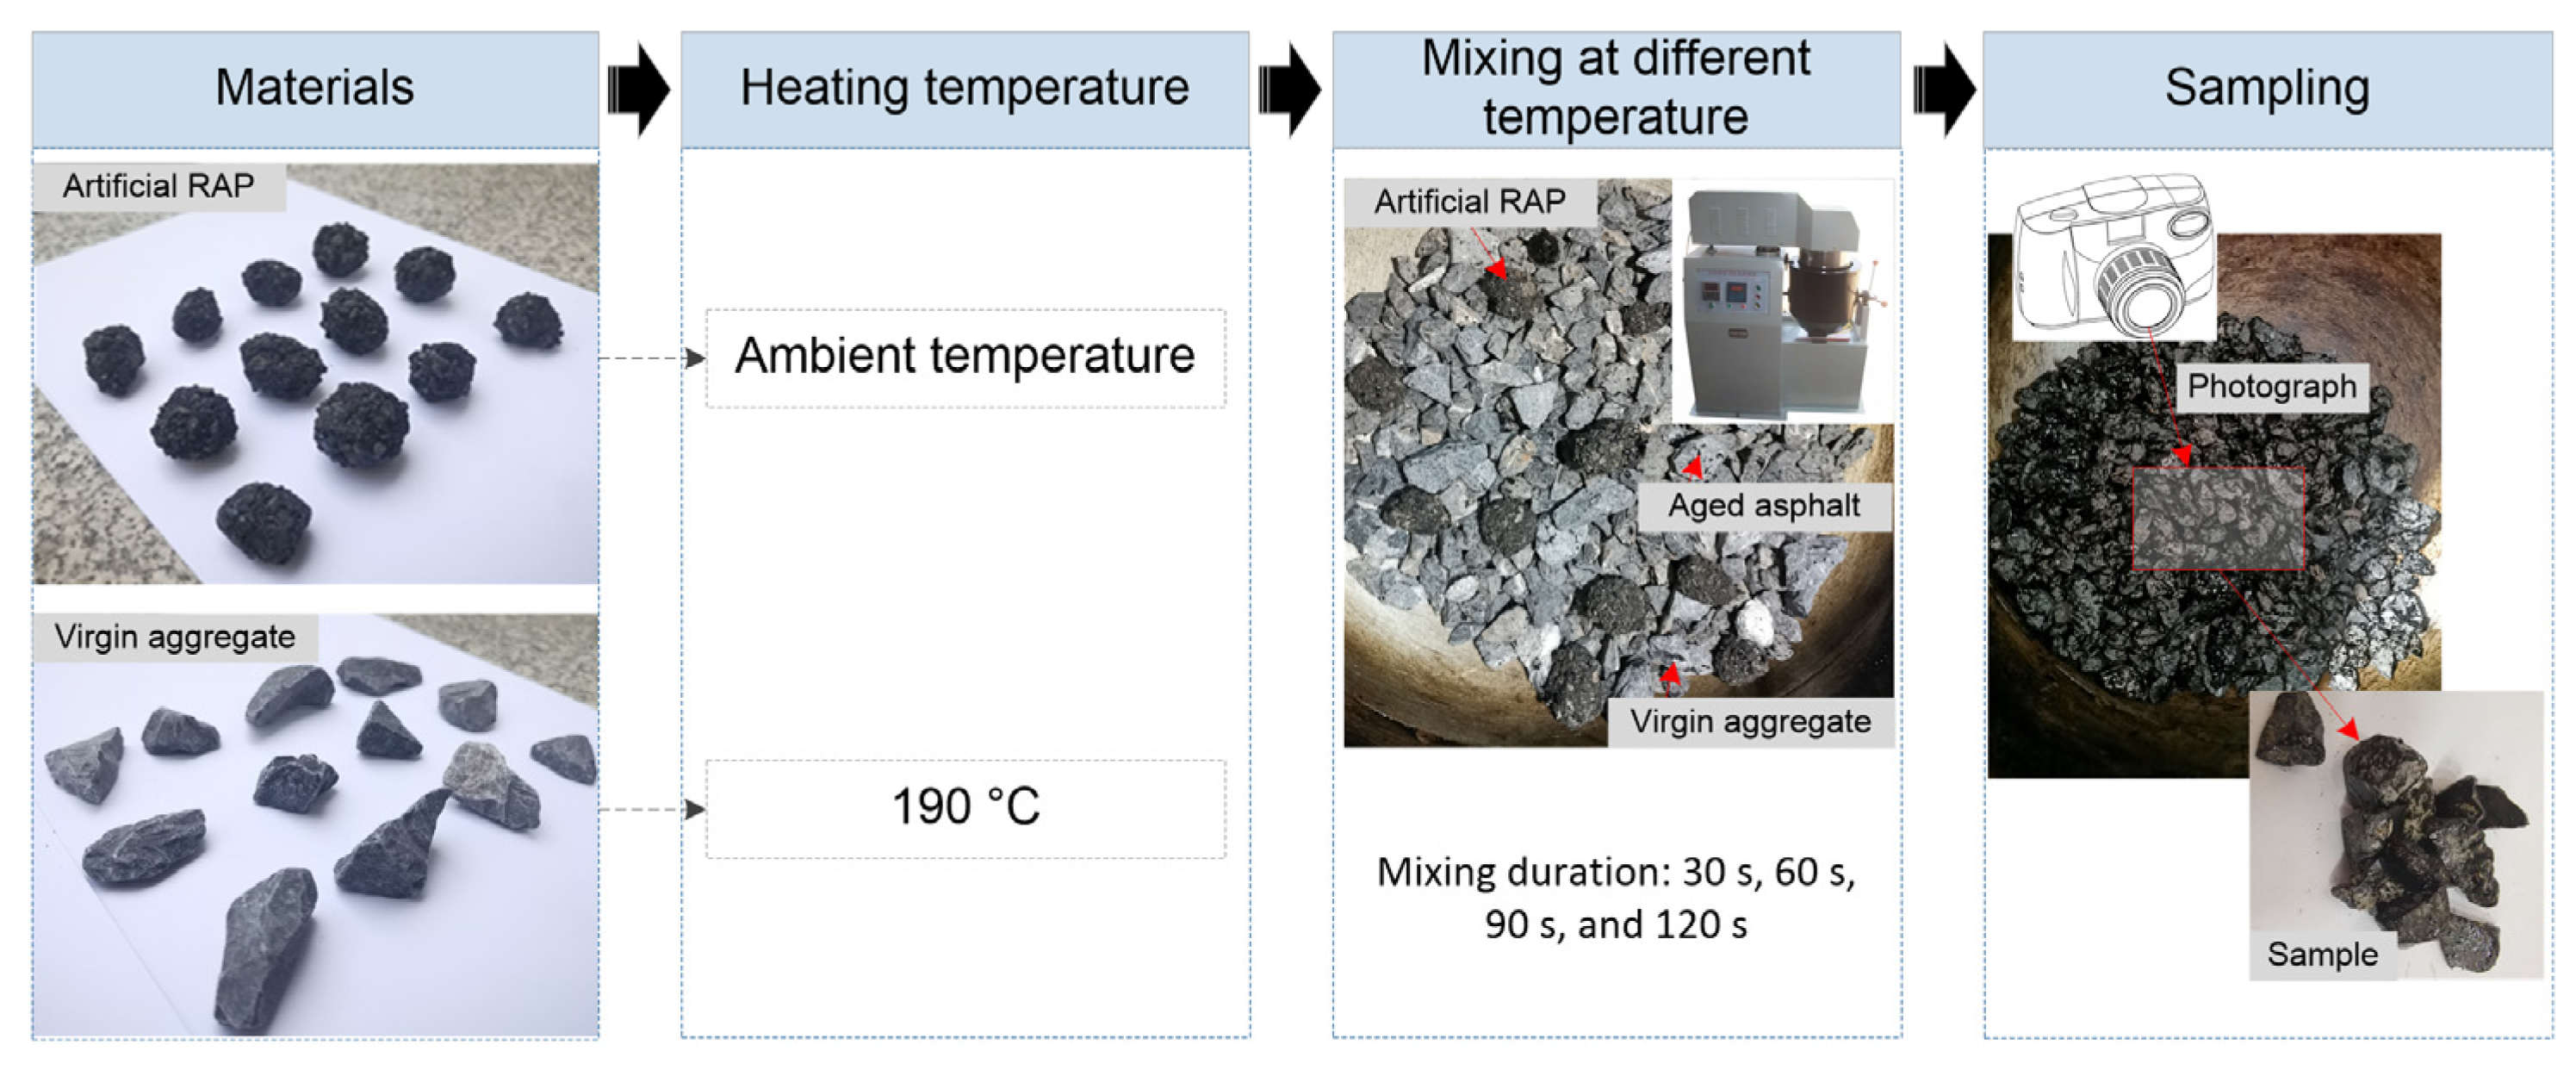
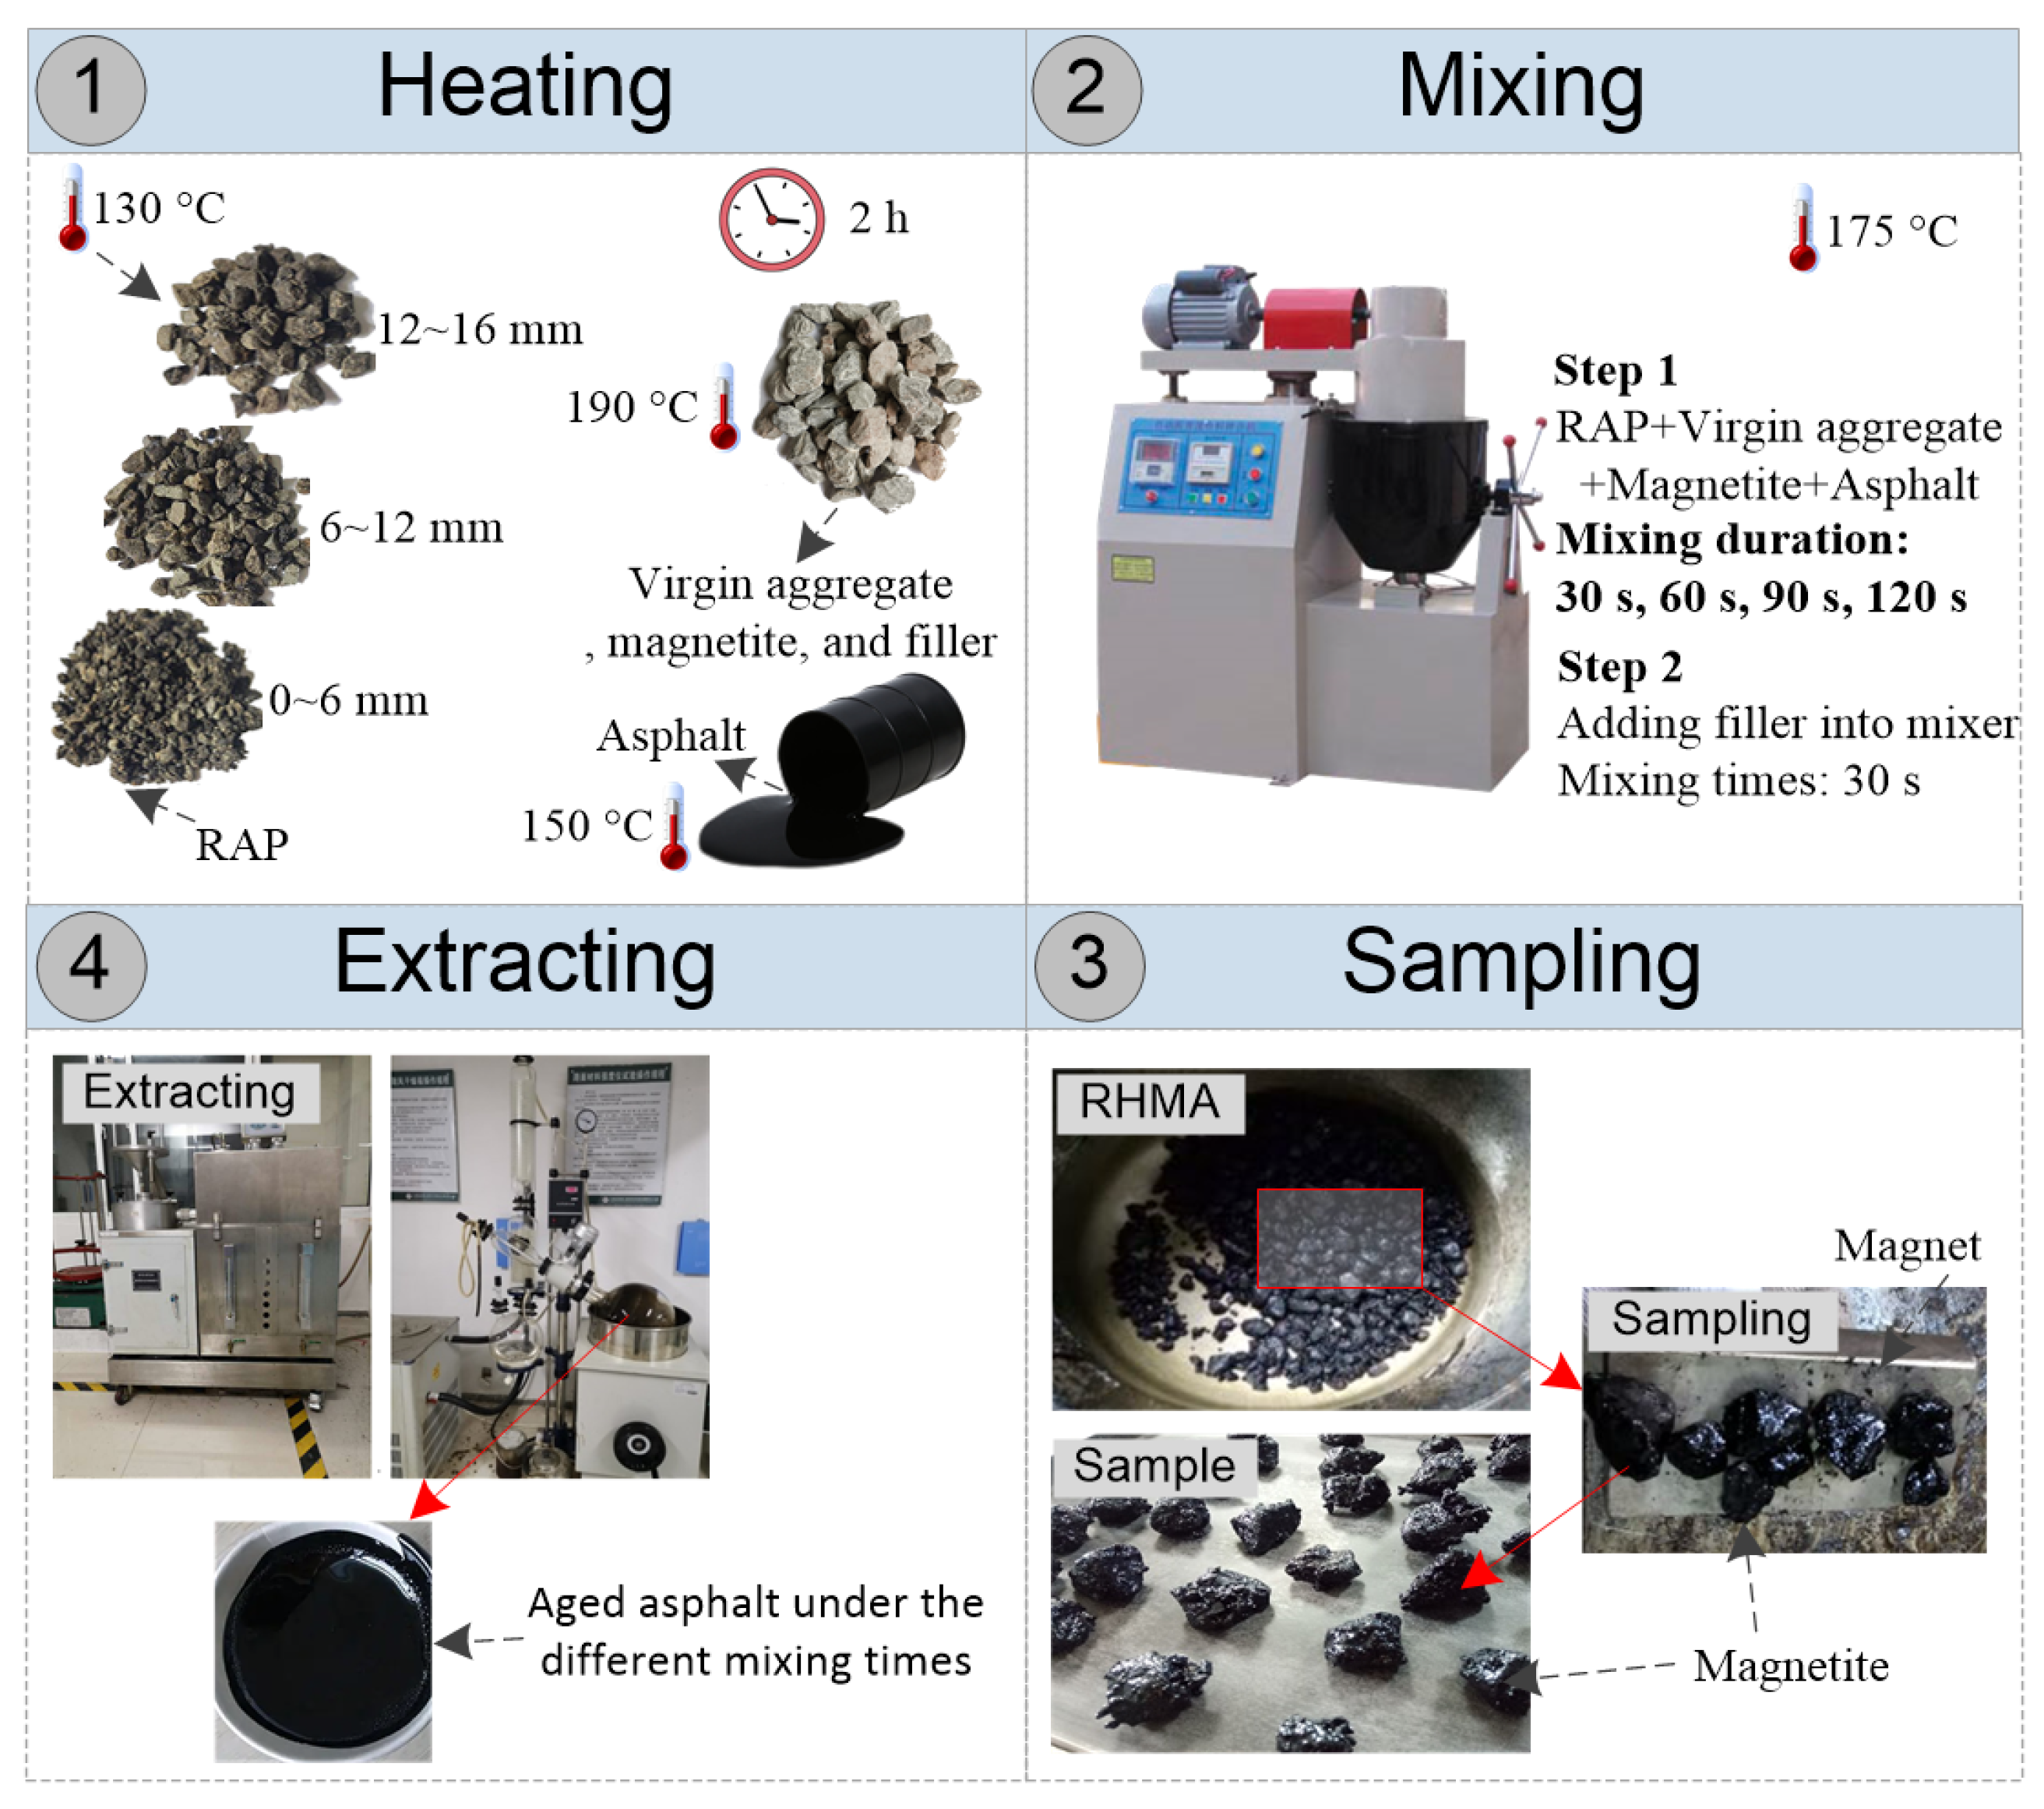
2.2. Sample Preparation
2.3. Methods
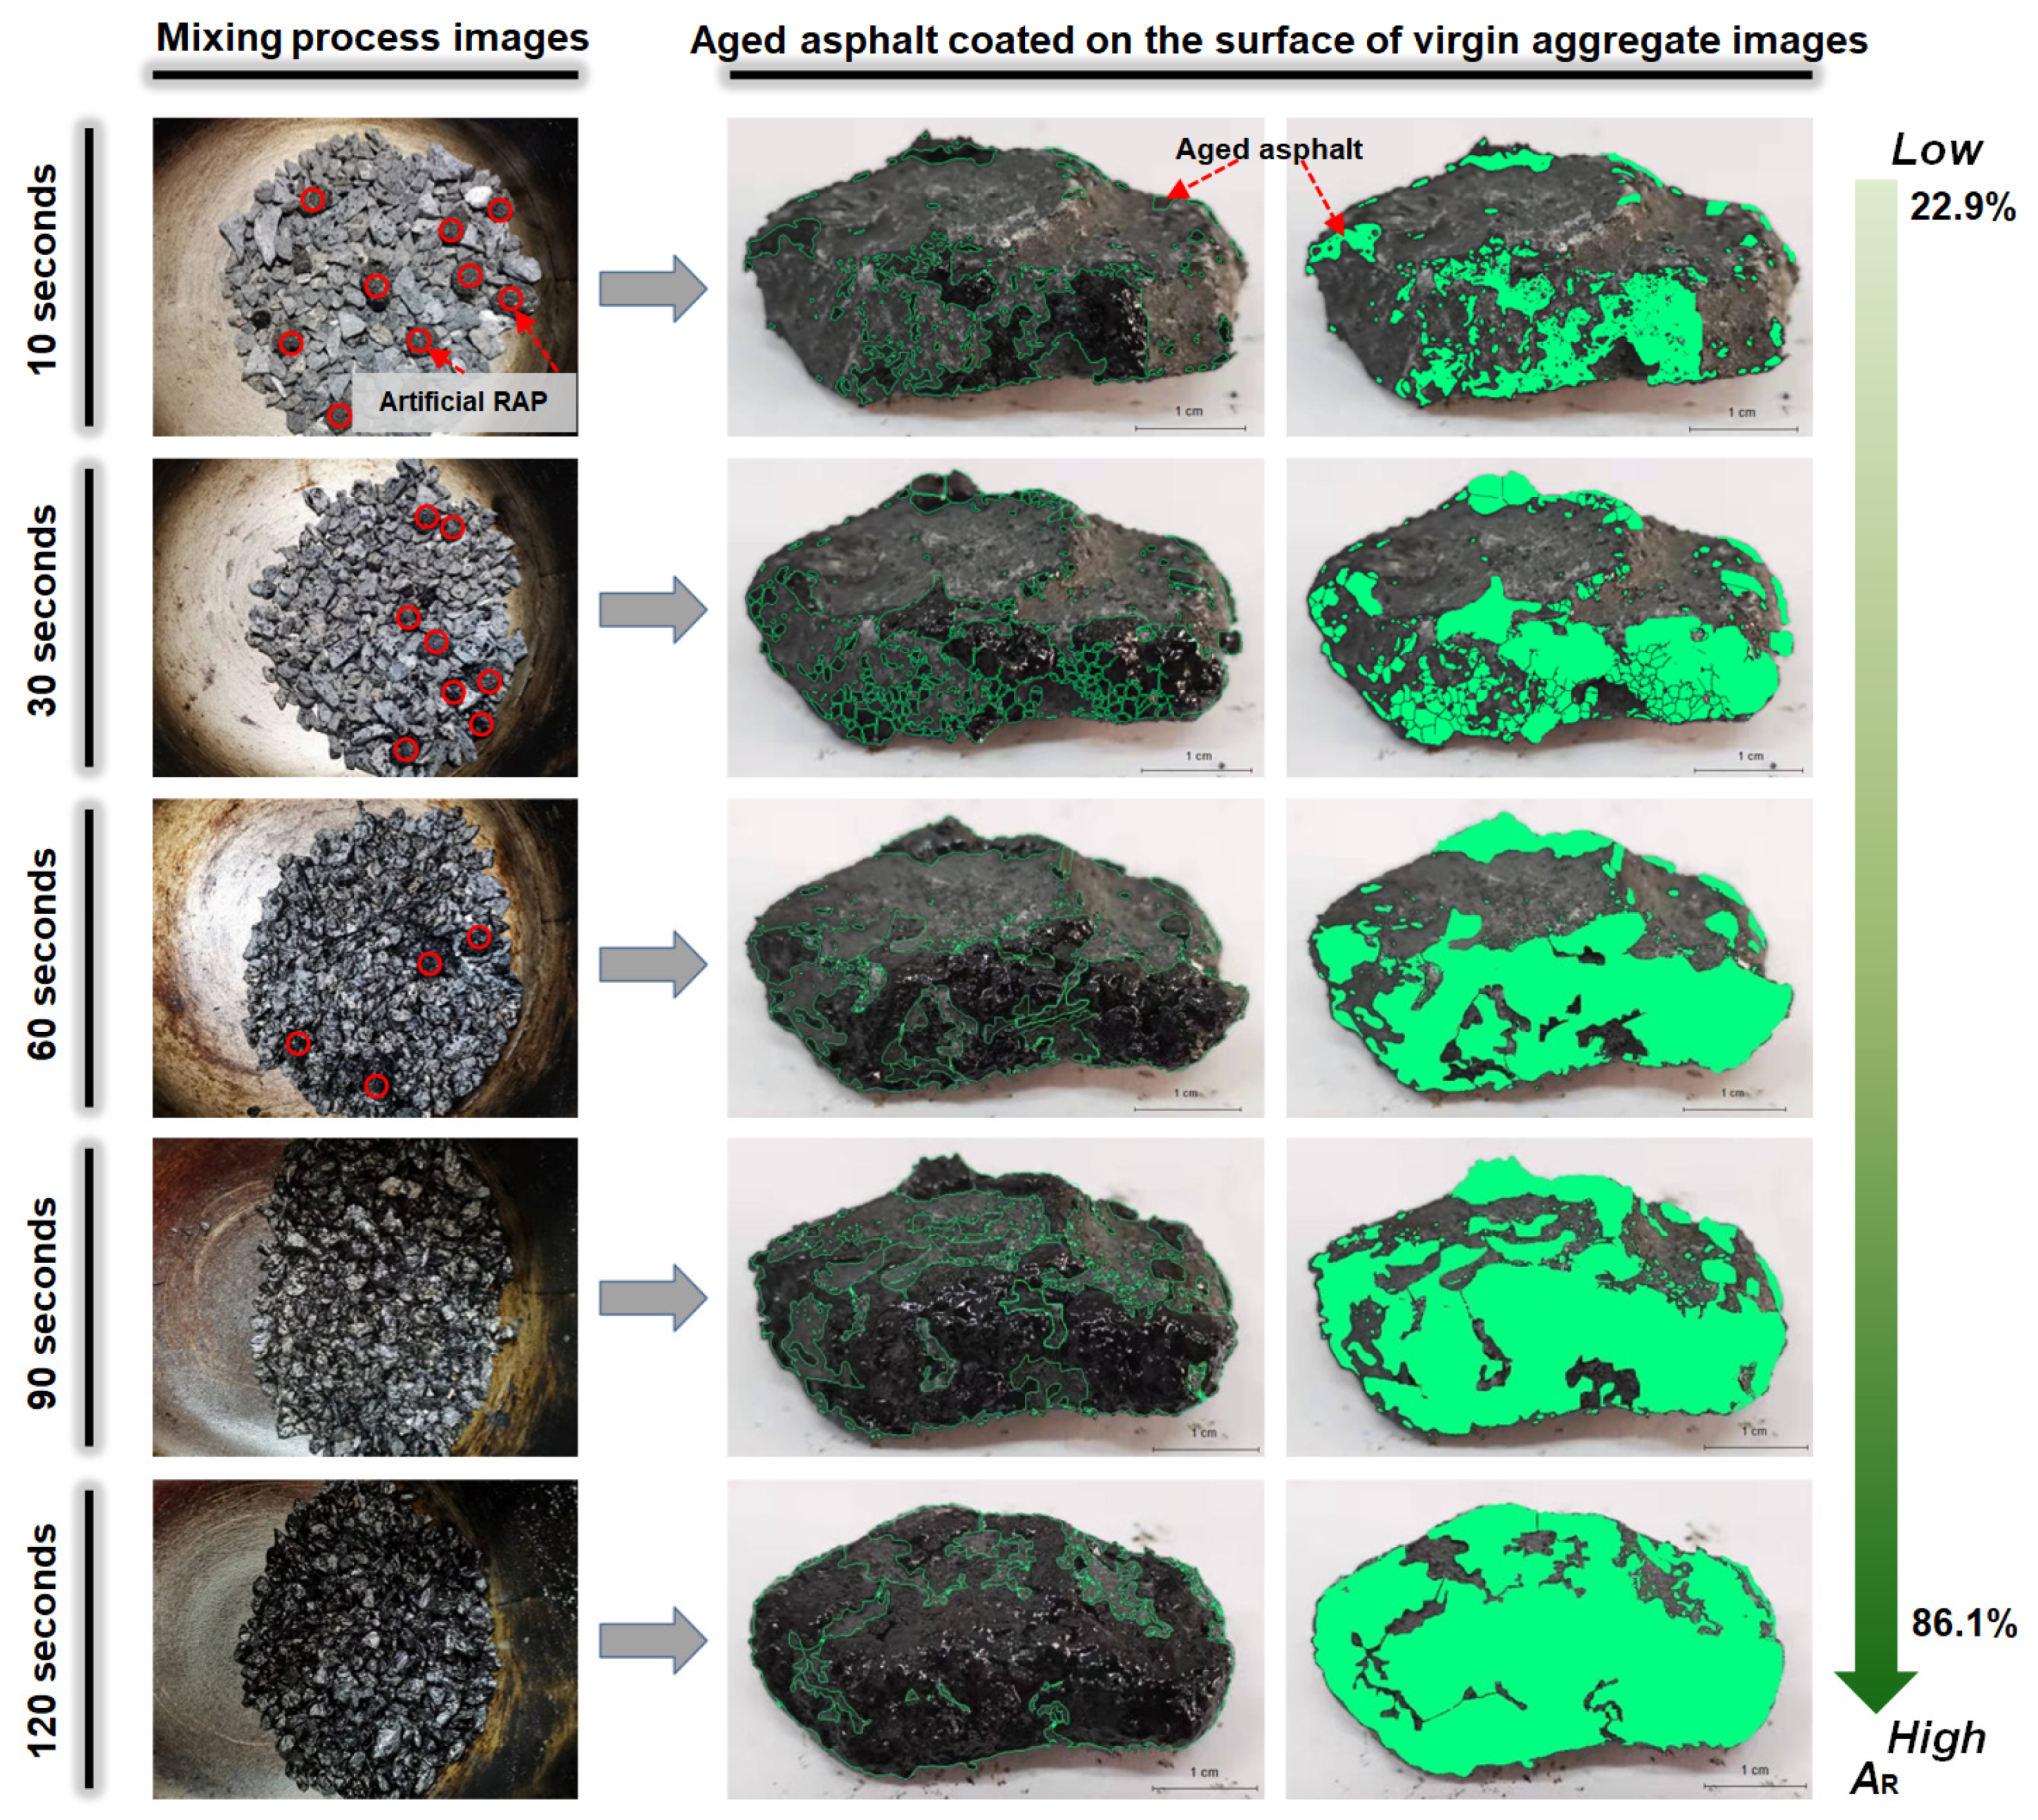
2.3.1. Image Analysis Method
2.3.2. Asphalt Binder
Physical Properties Tests
Rheometer Test
FTIR Test
GPC Test
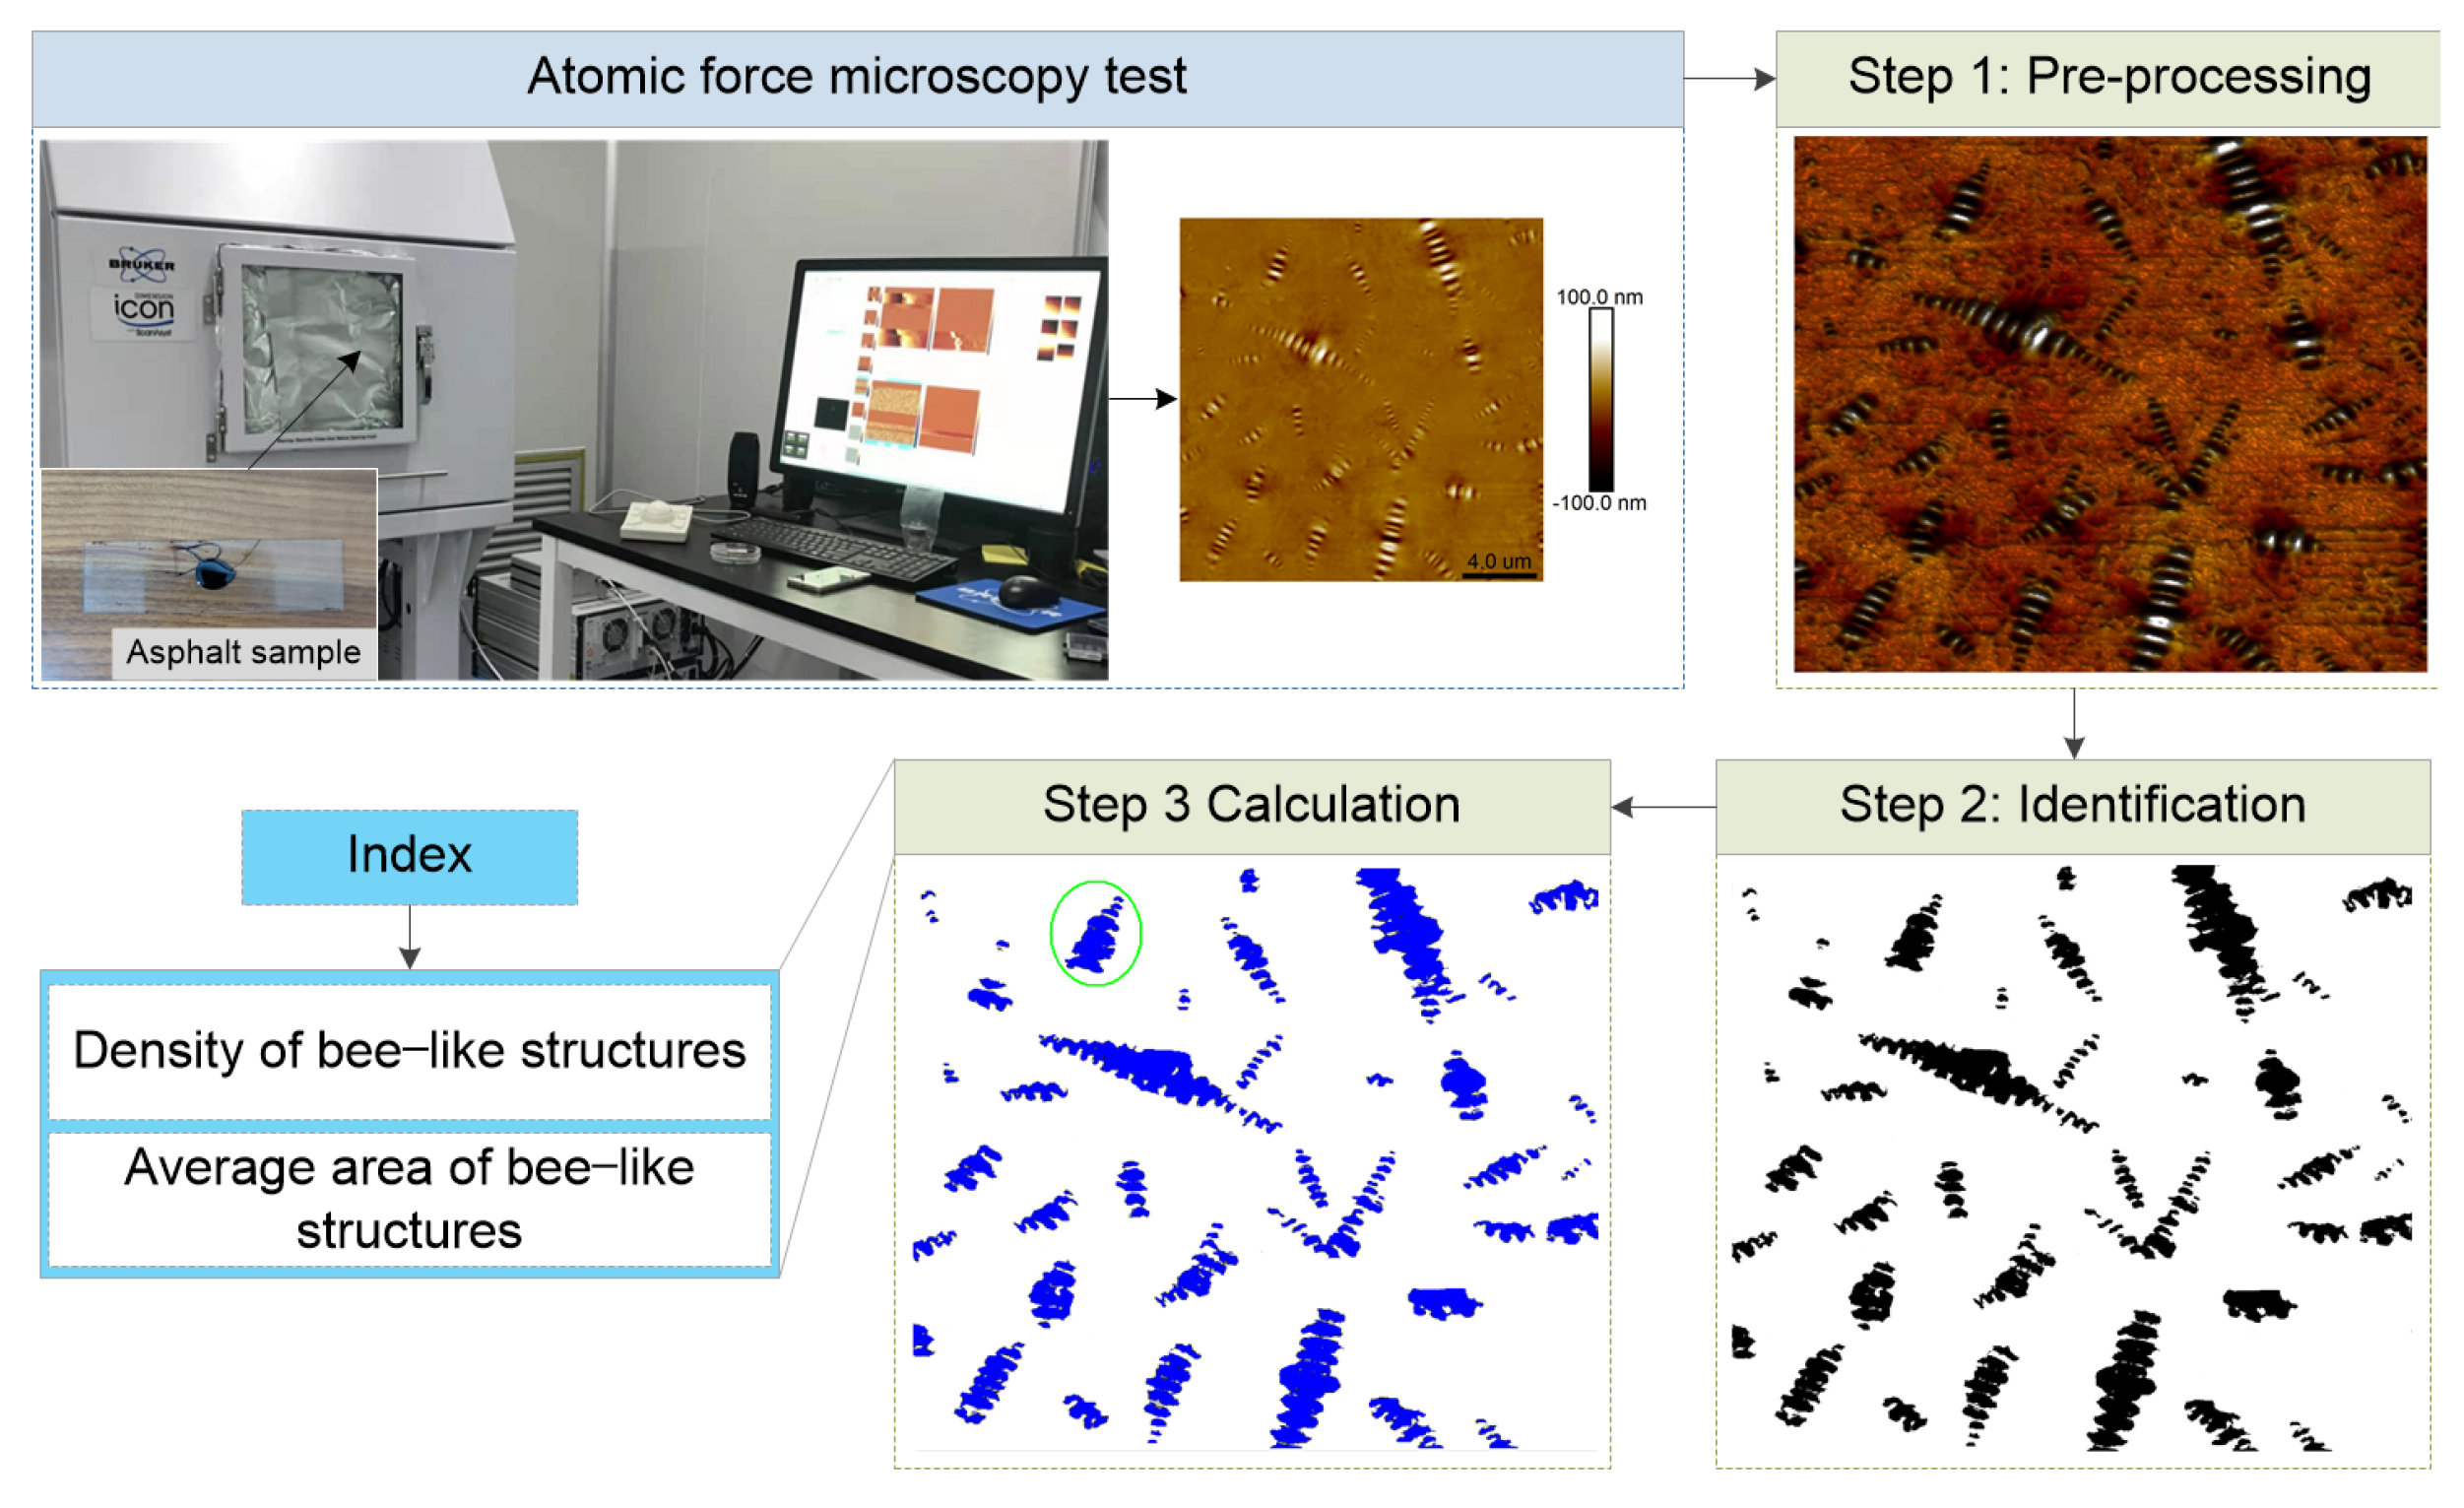
AFM Test
2.3.3. Asphalt Mixture
High-Temperature Resistance Test
Moisture Sensitivity Test
Low-Temperature Bending Beam Test
3. Results and Analysis
3.1. Reclaimed Asphalt Dispersion with Different Mixing Durations
3.2. Performance and Chemical Composition of Blended Asphalt with Different Mixing Durations
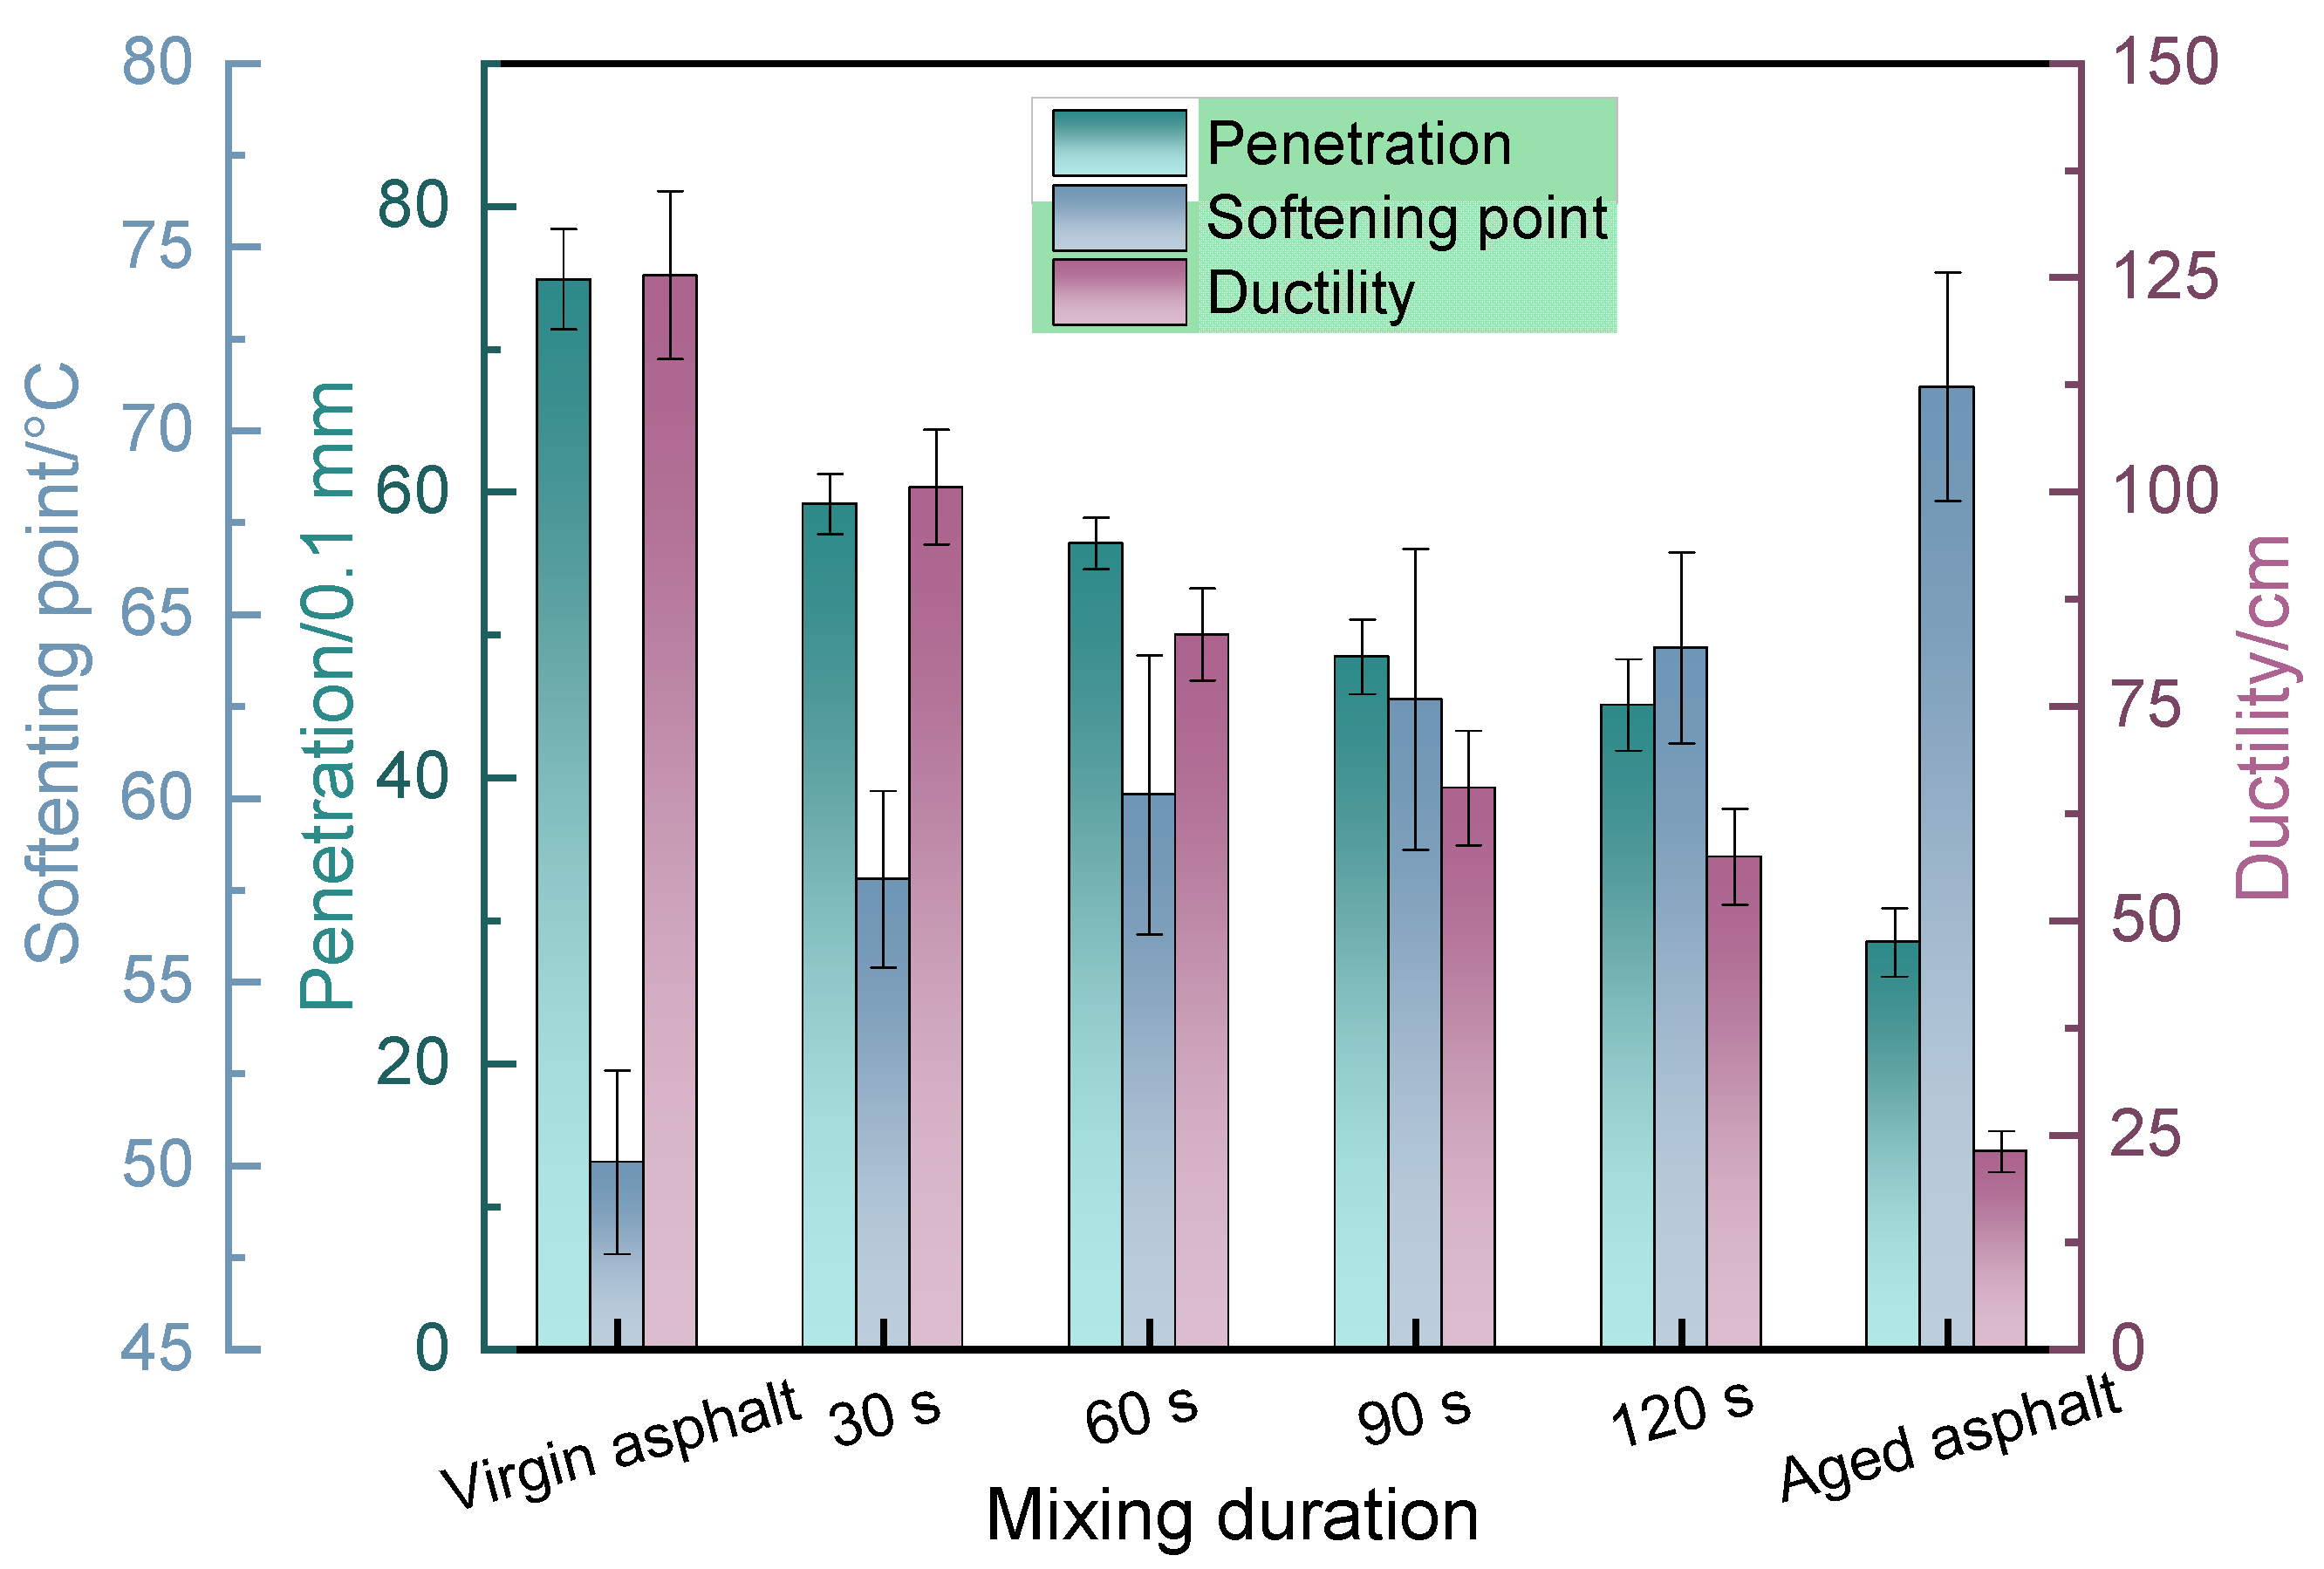
3.2.1. Physical Properties Tests
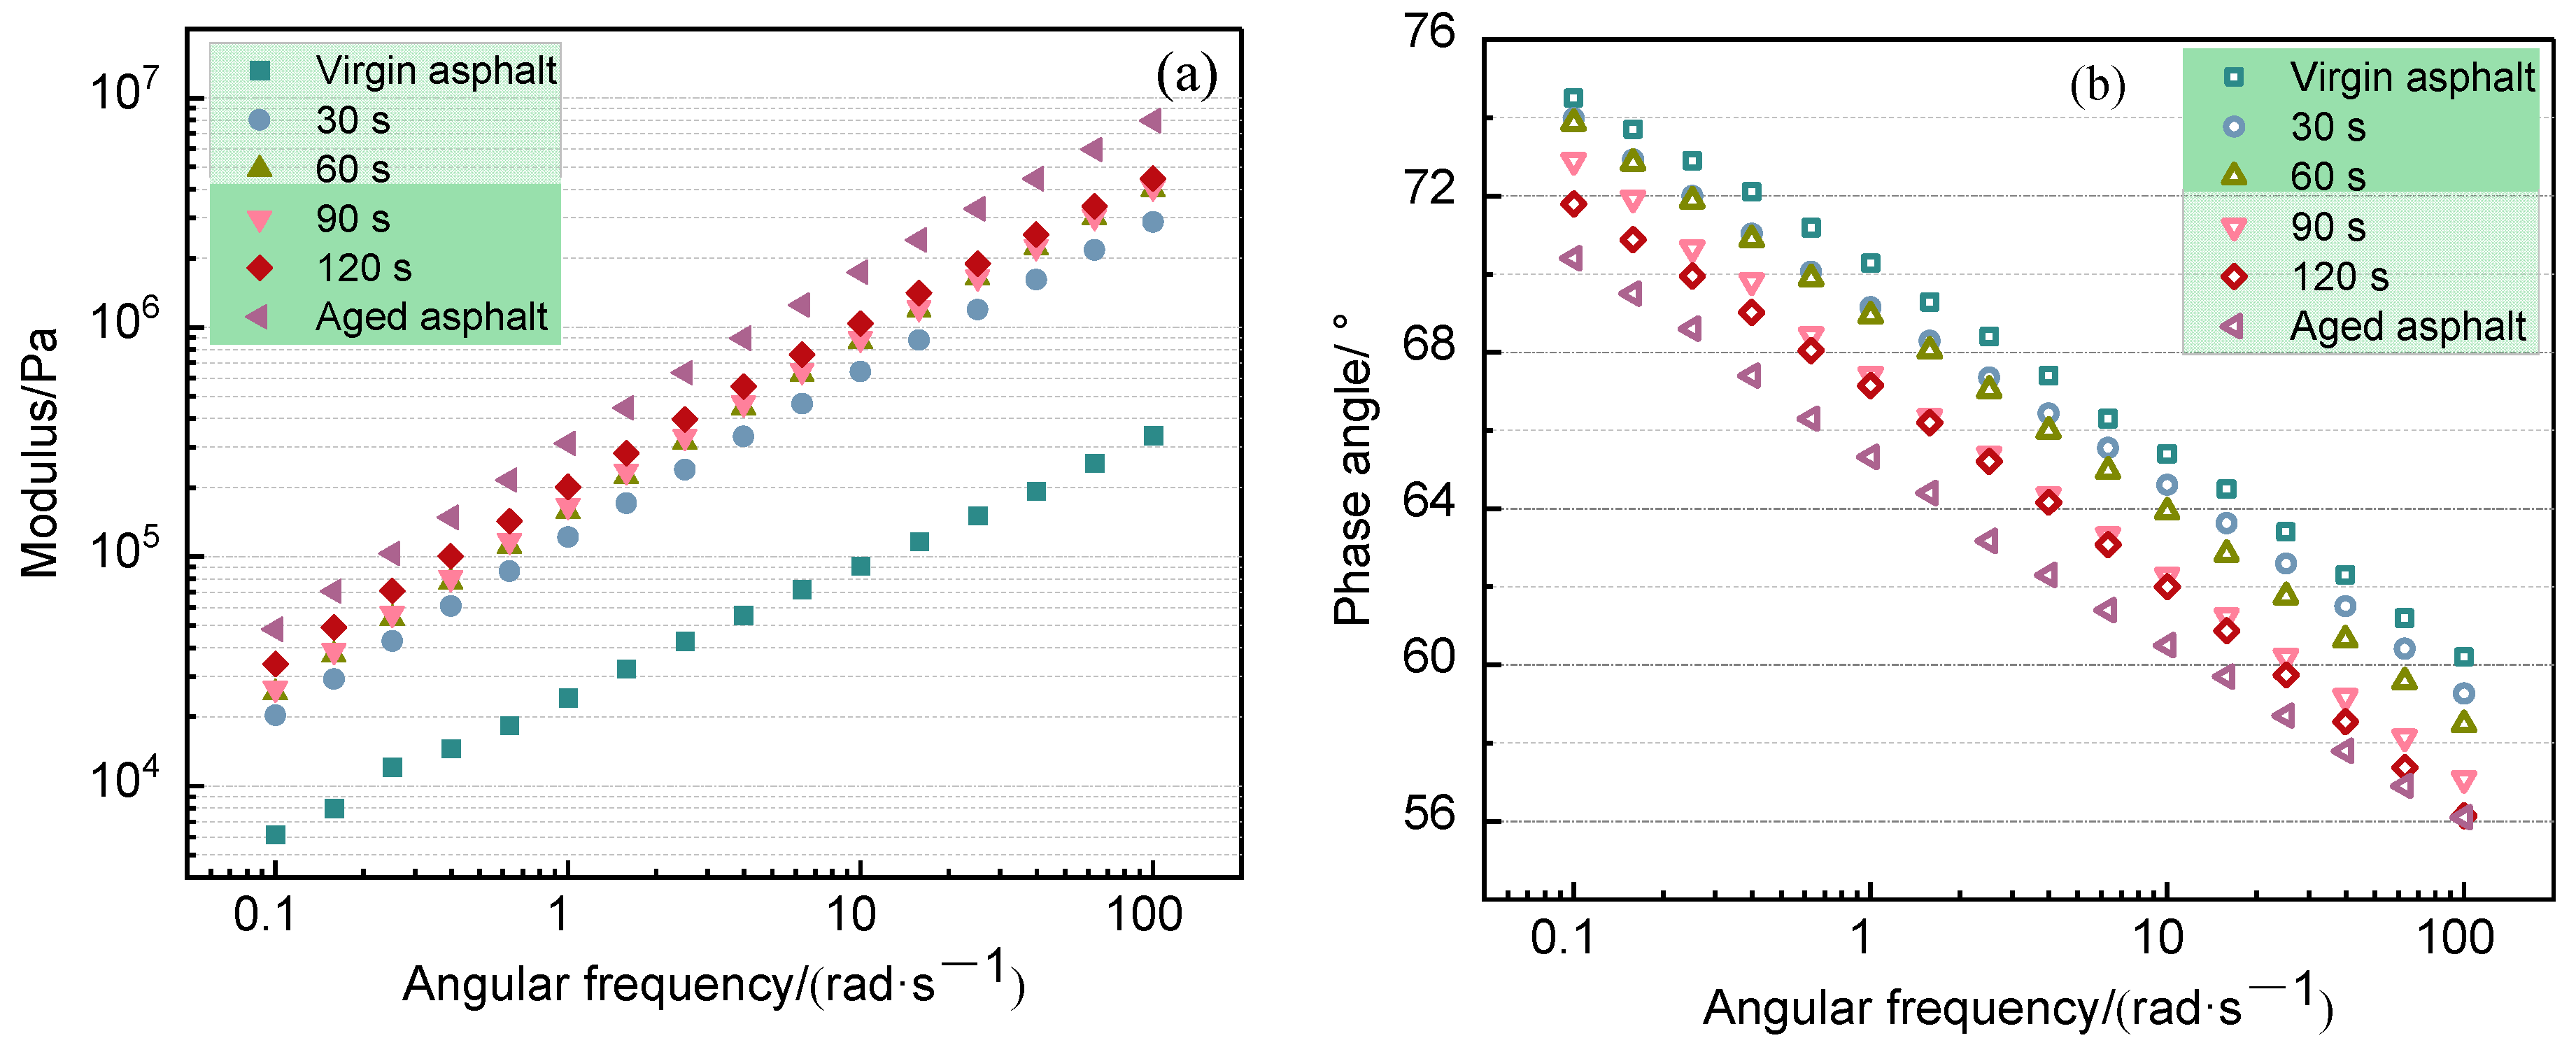
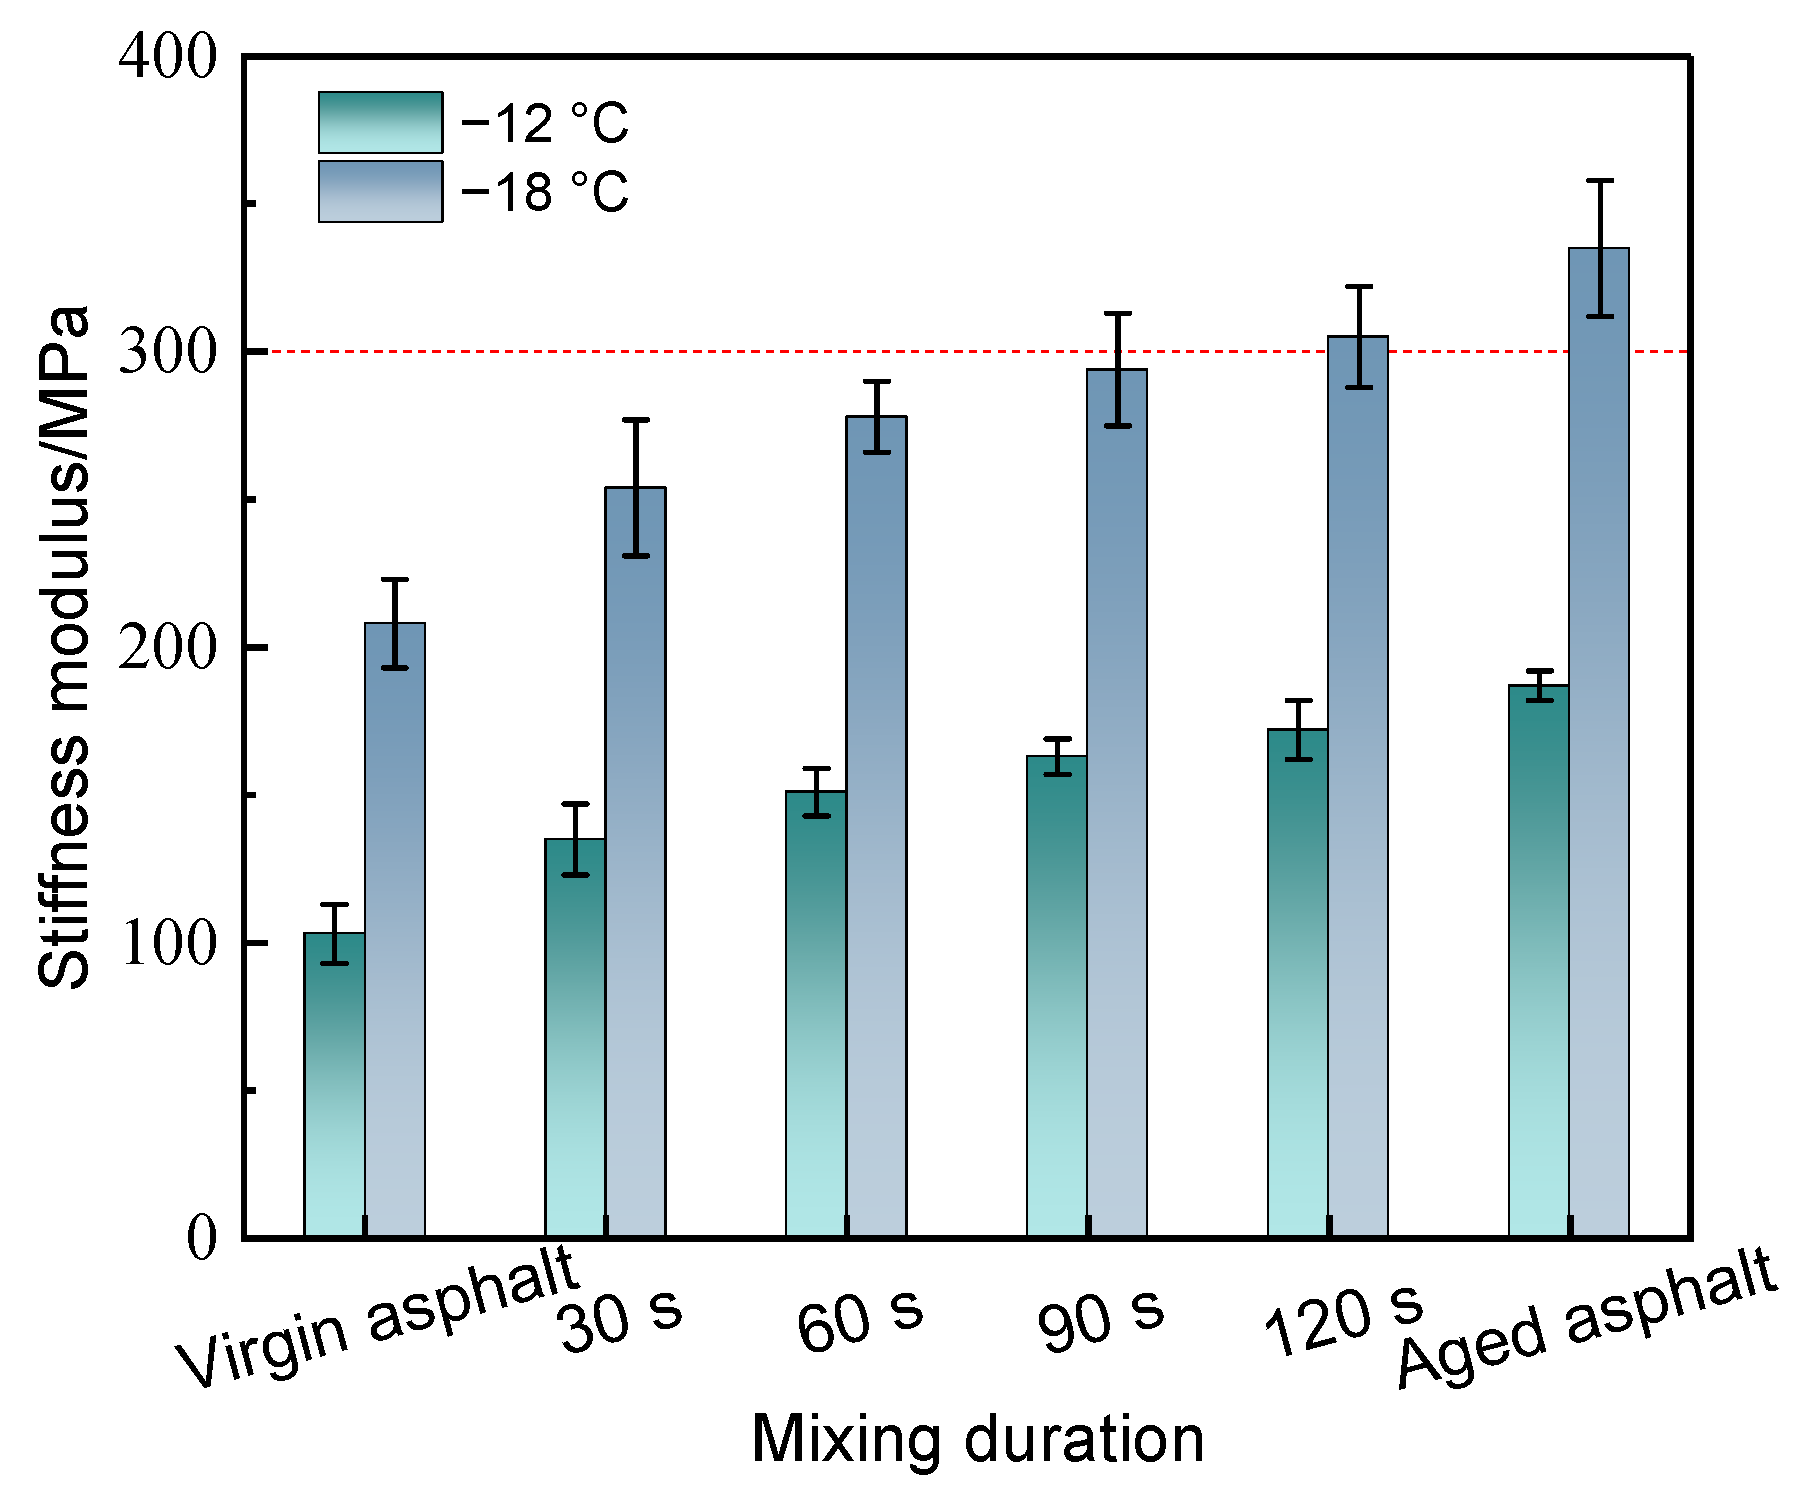
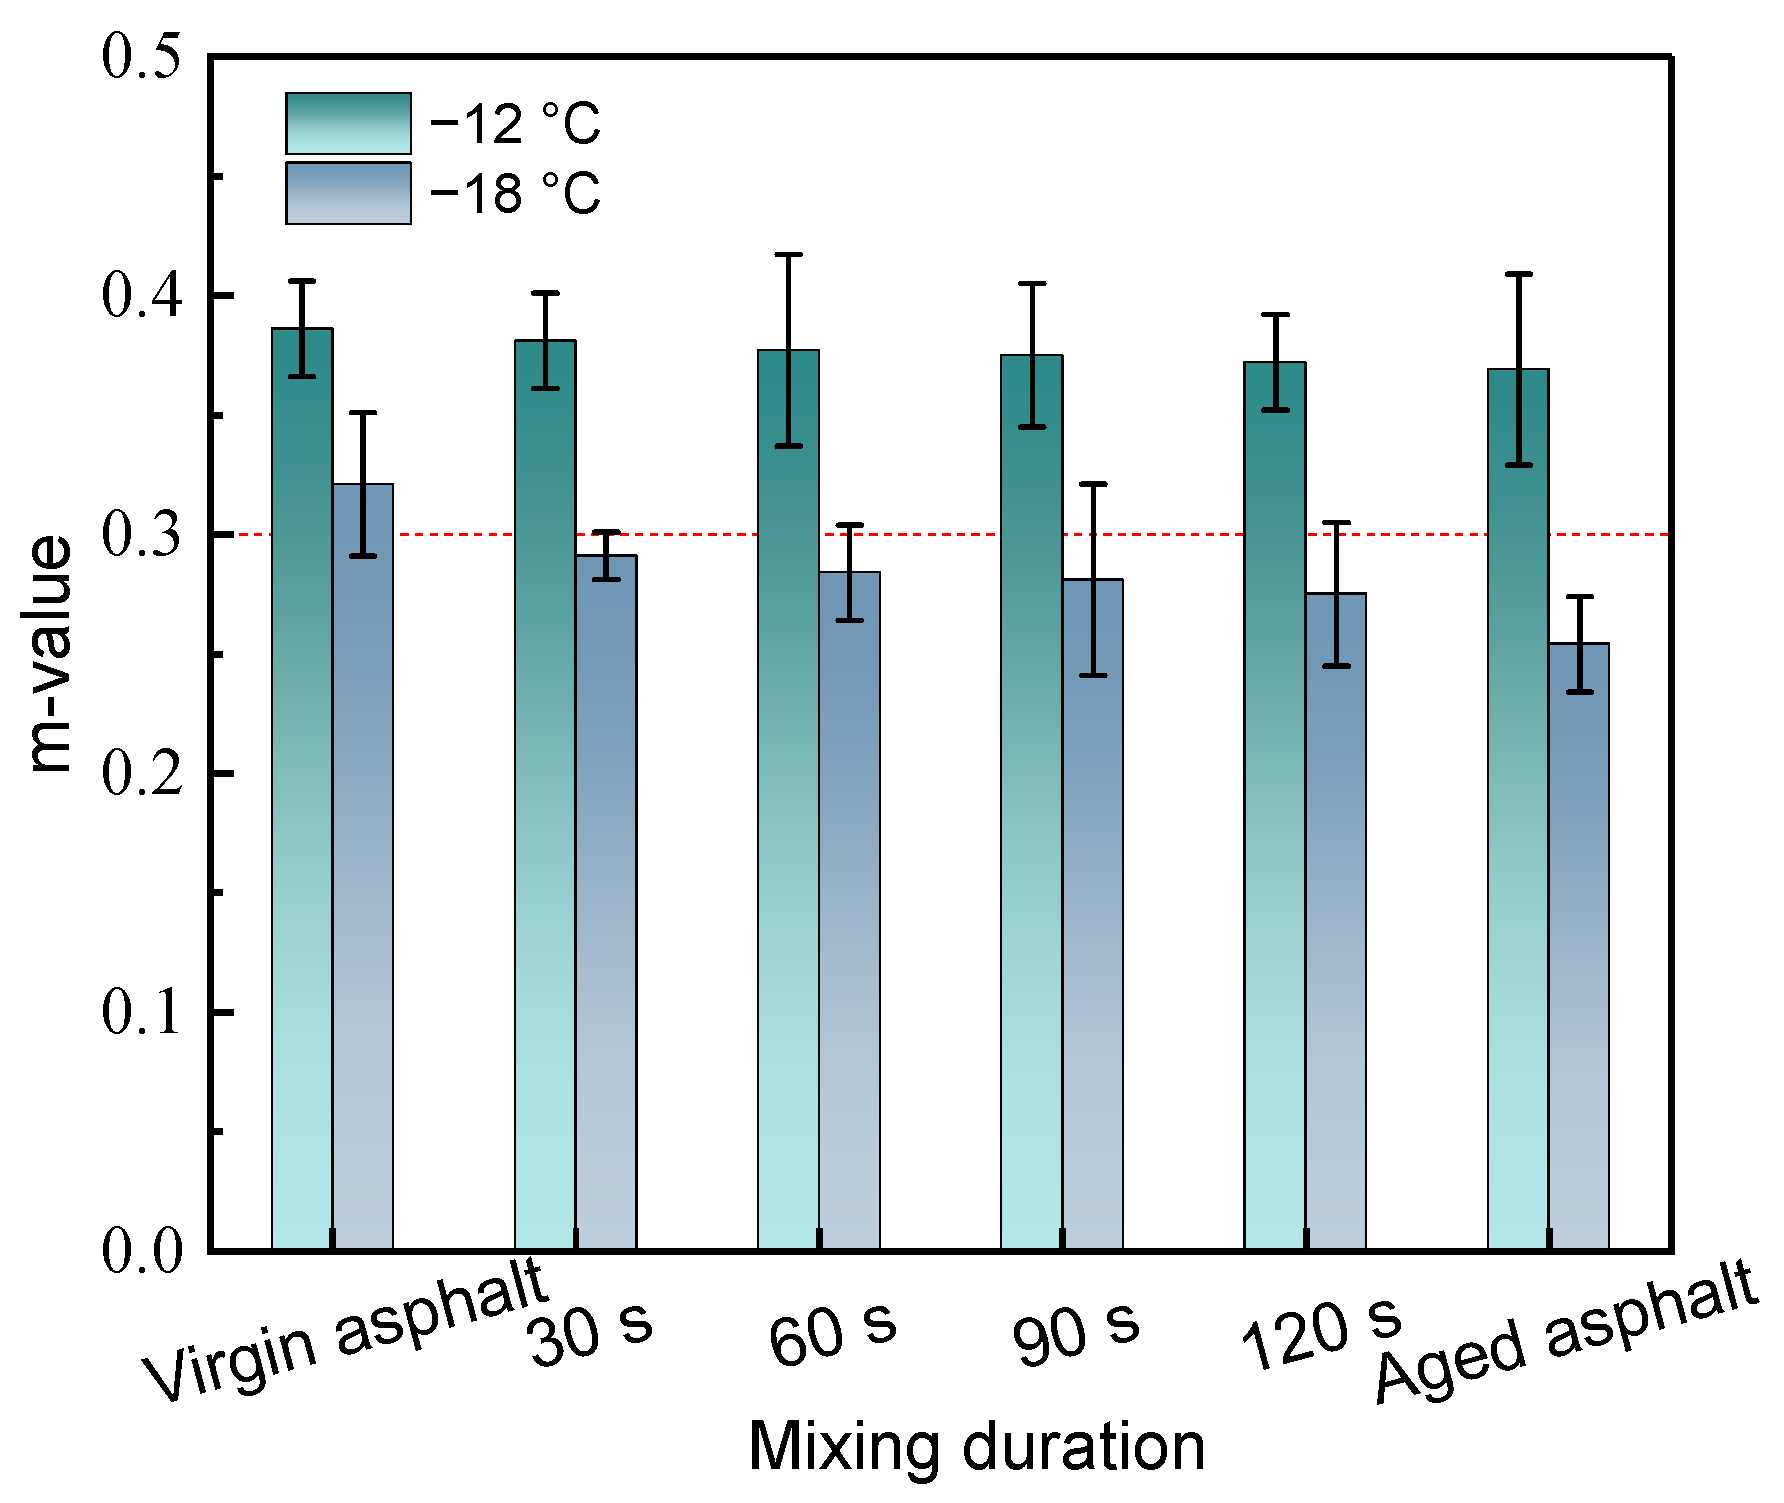
3.2.2. Rheometer Test
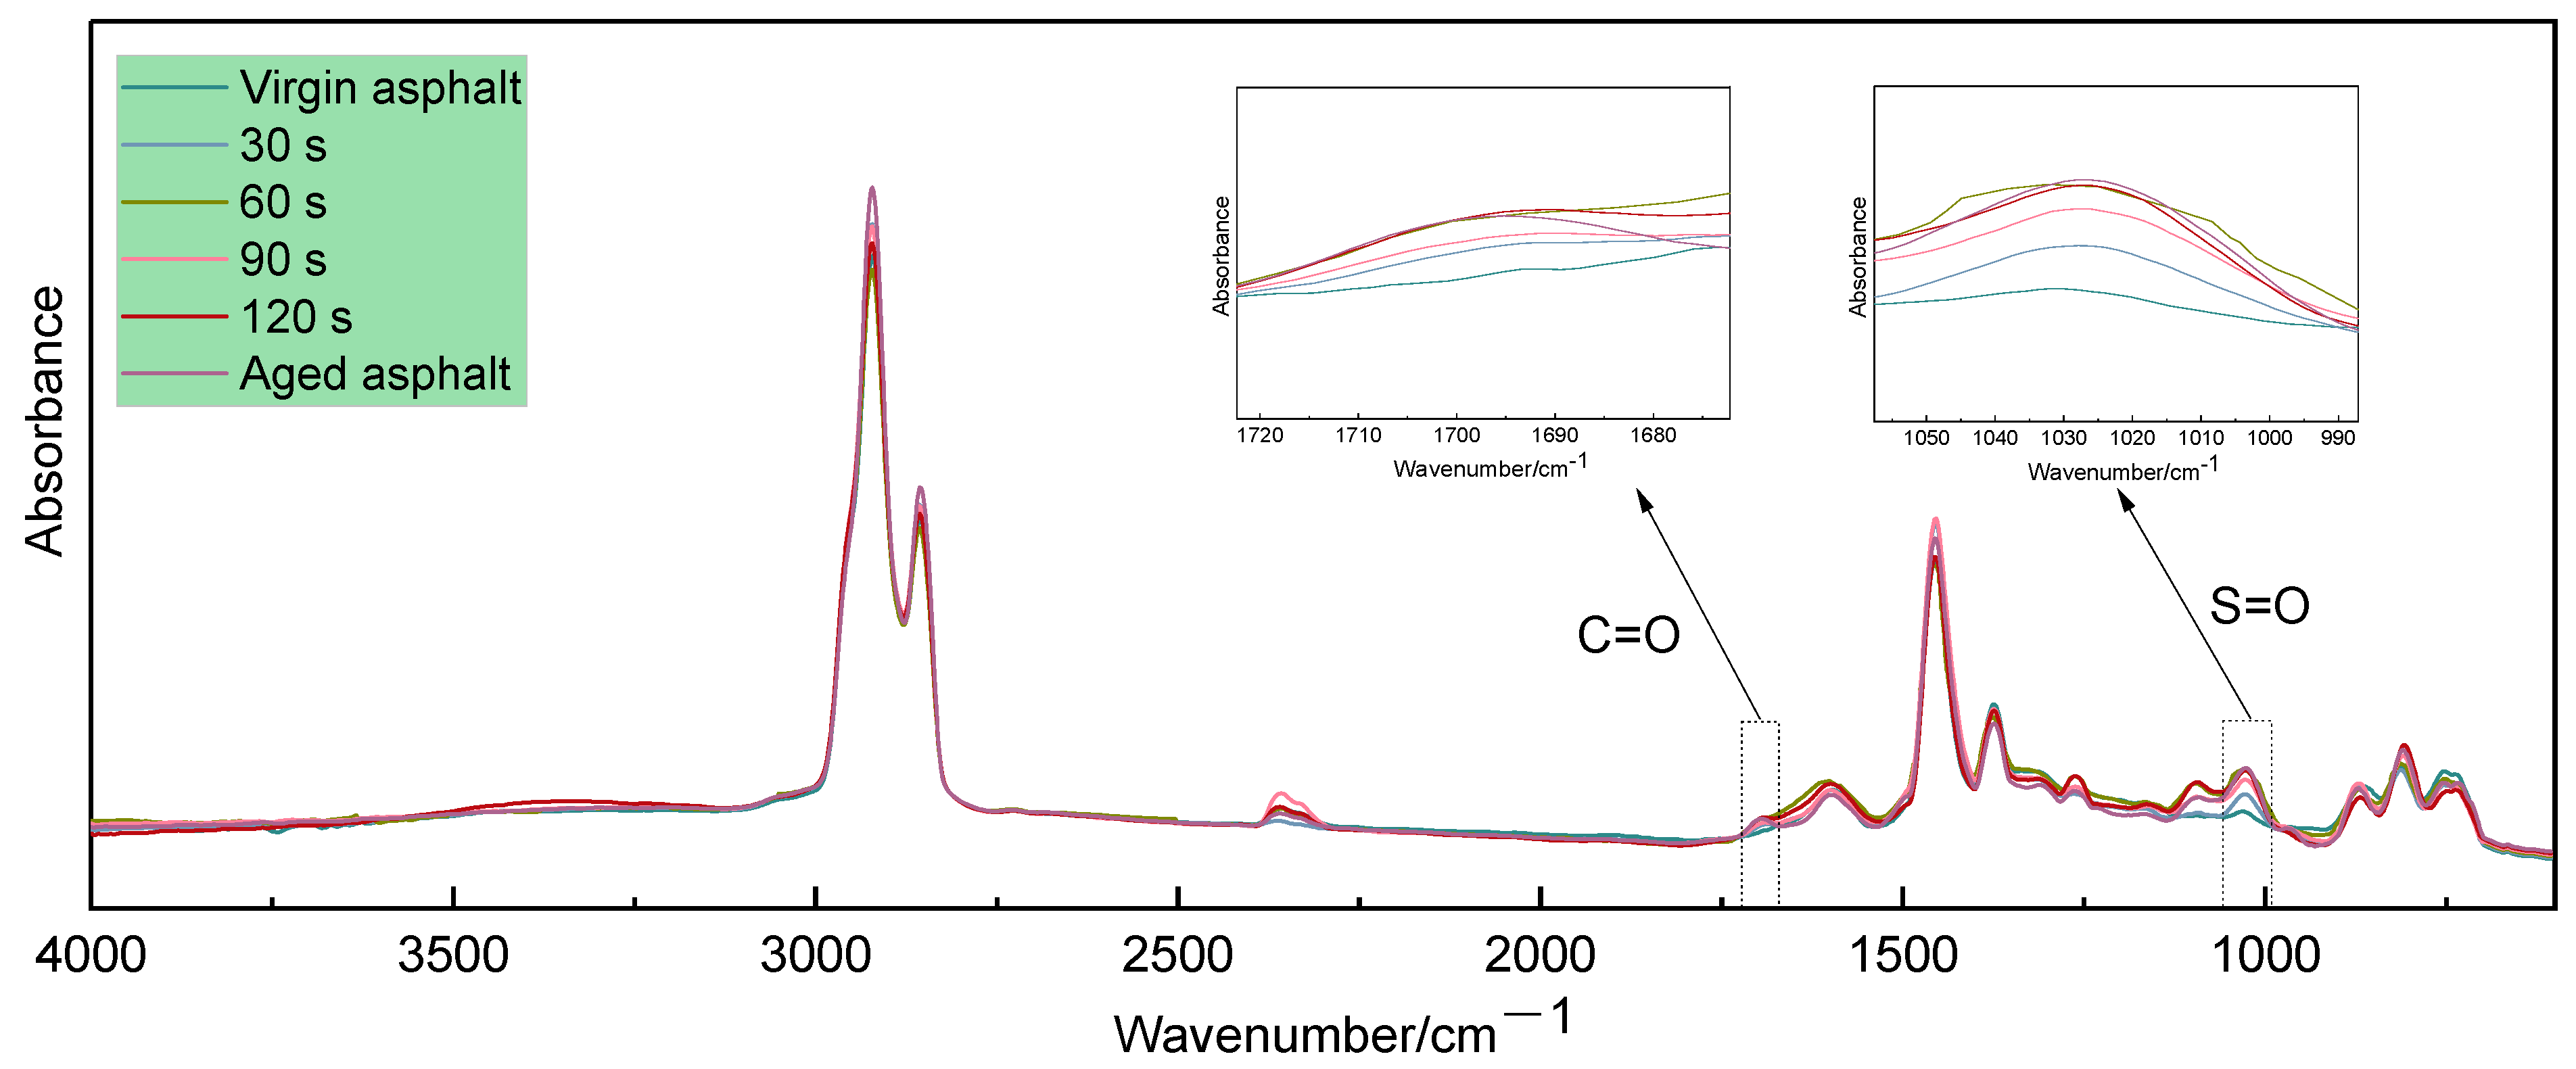
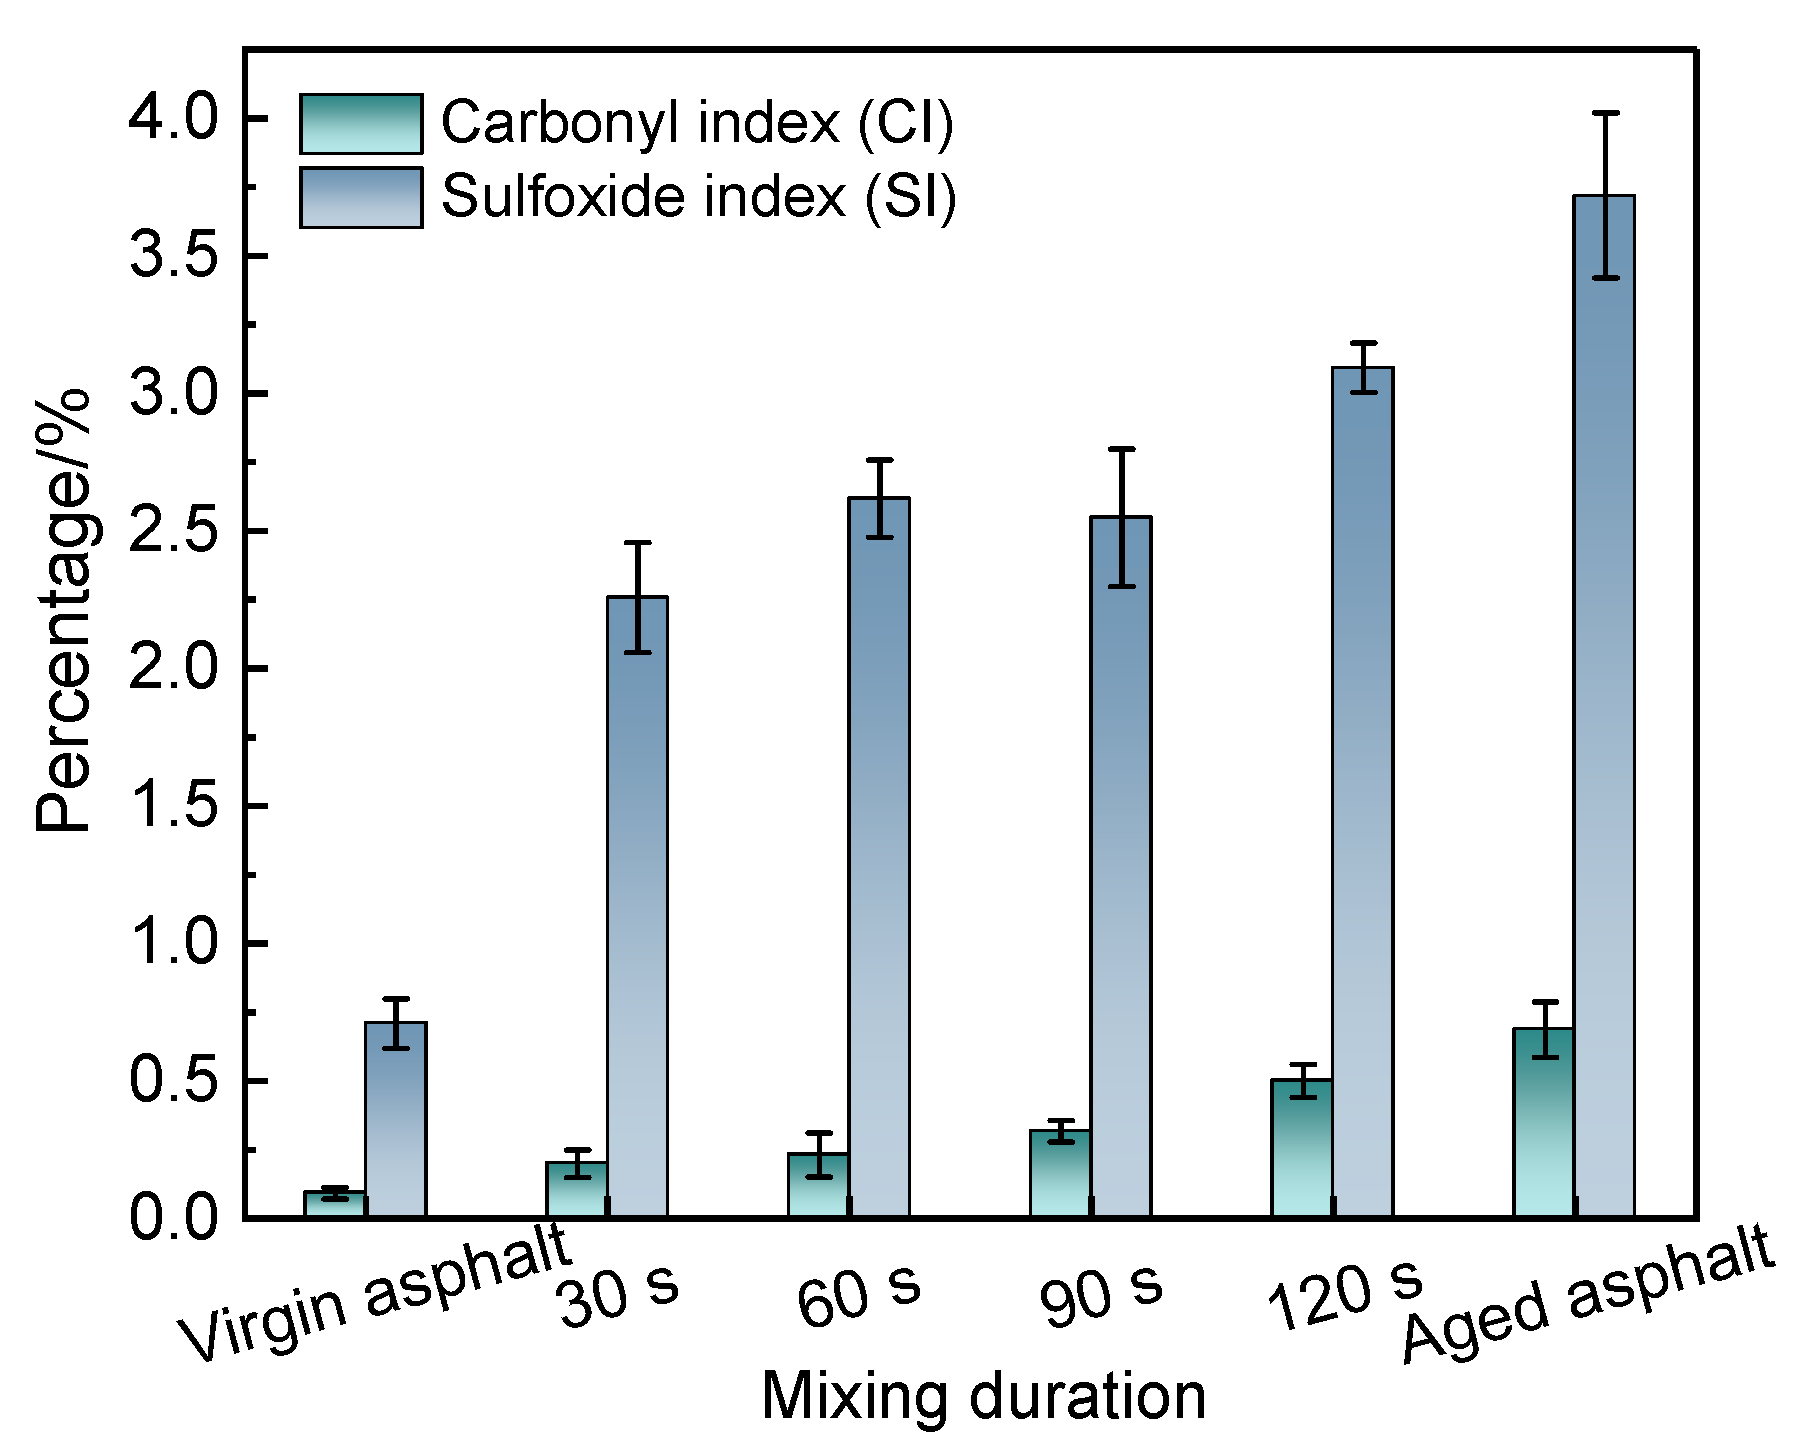
3.2.3. FTIR Test
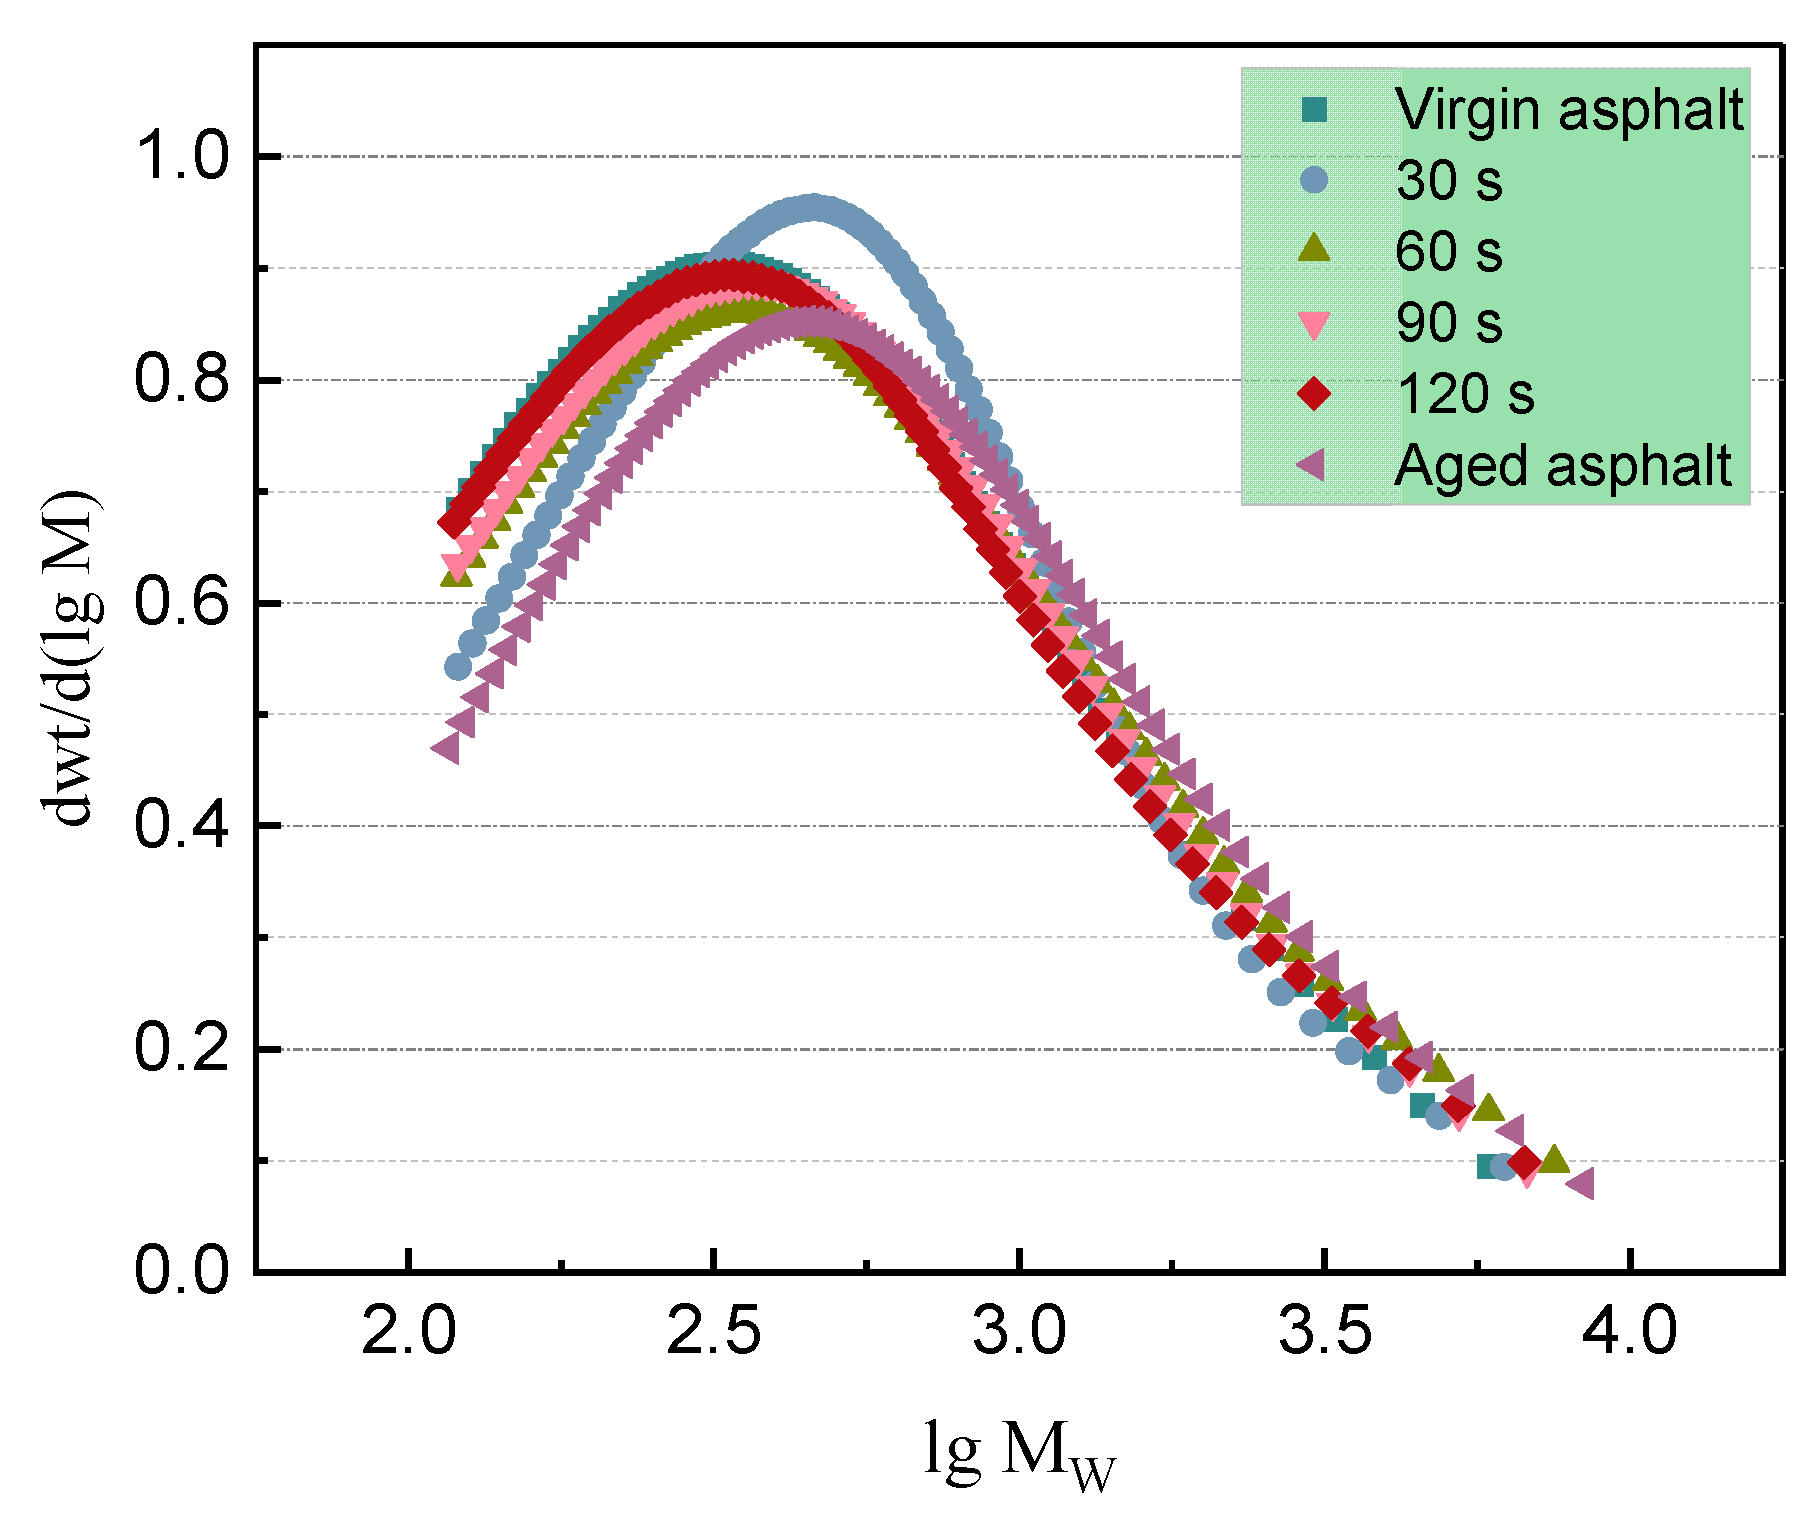
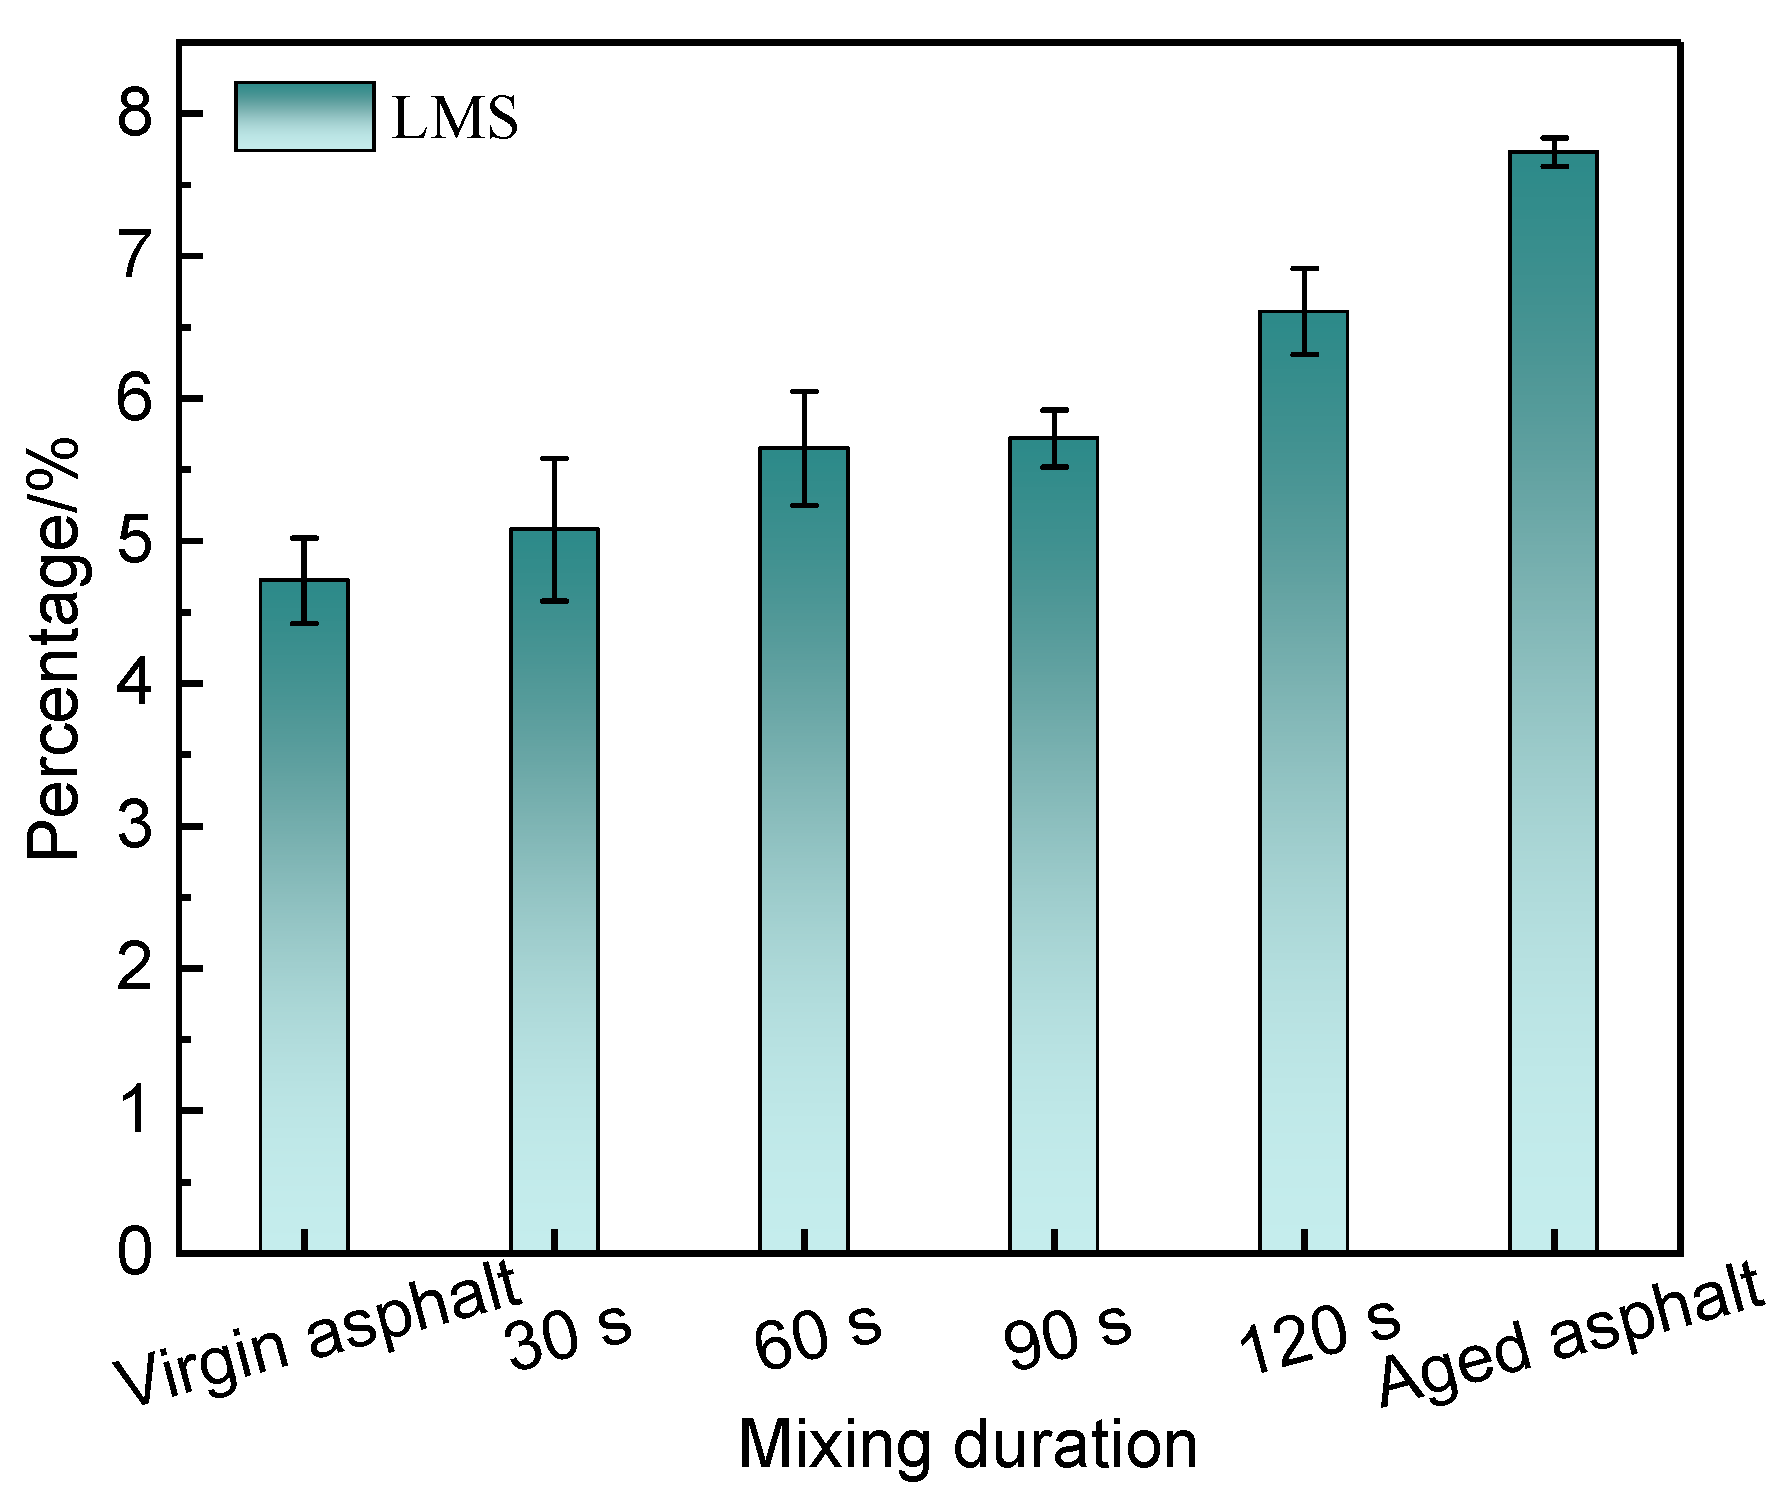
3.2.4. GPC Test
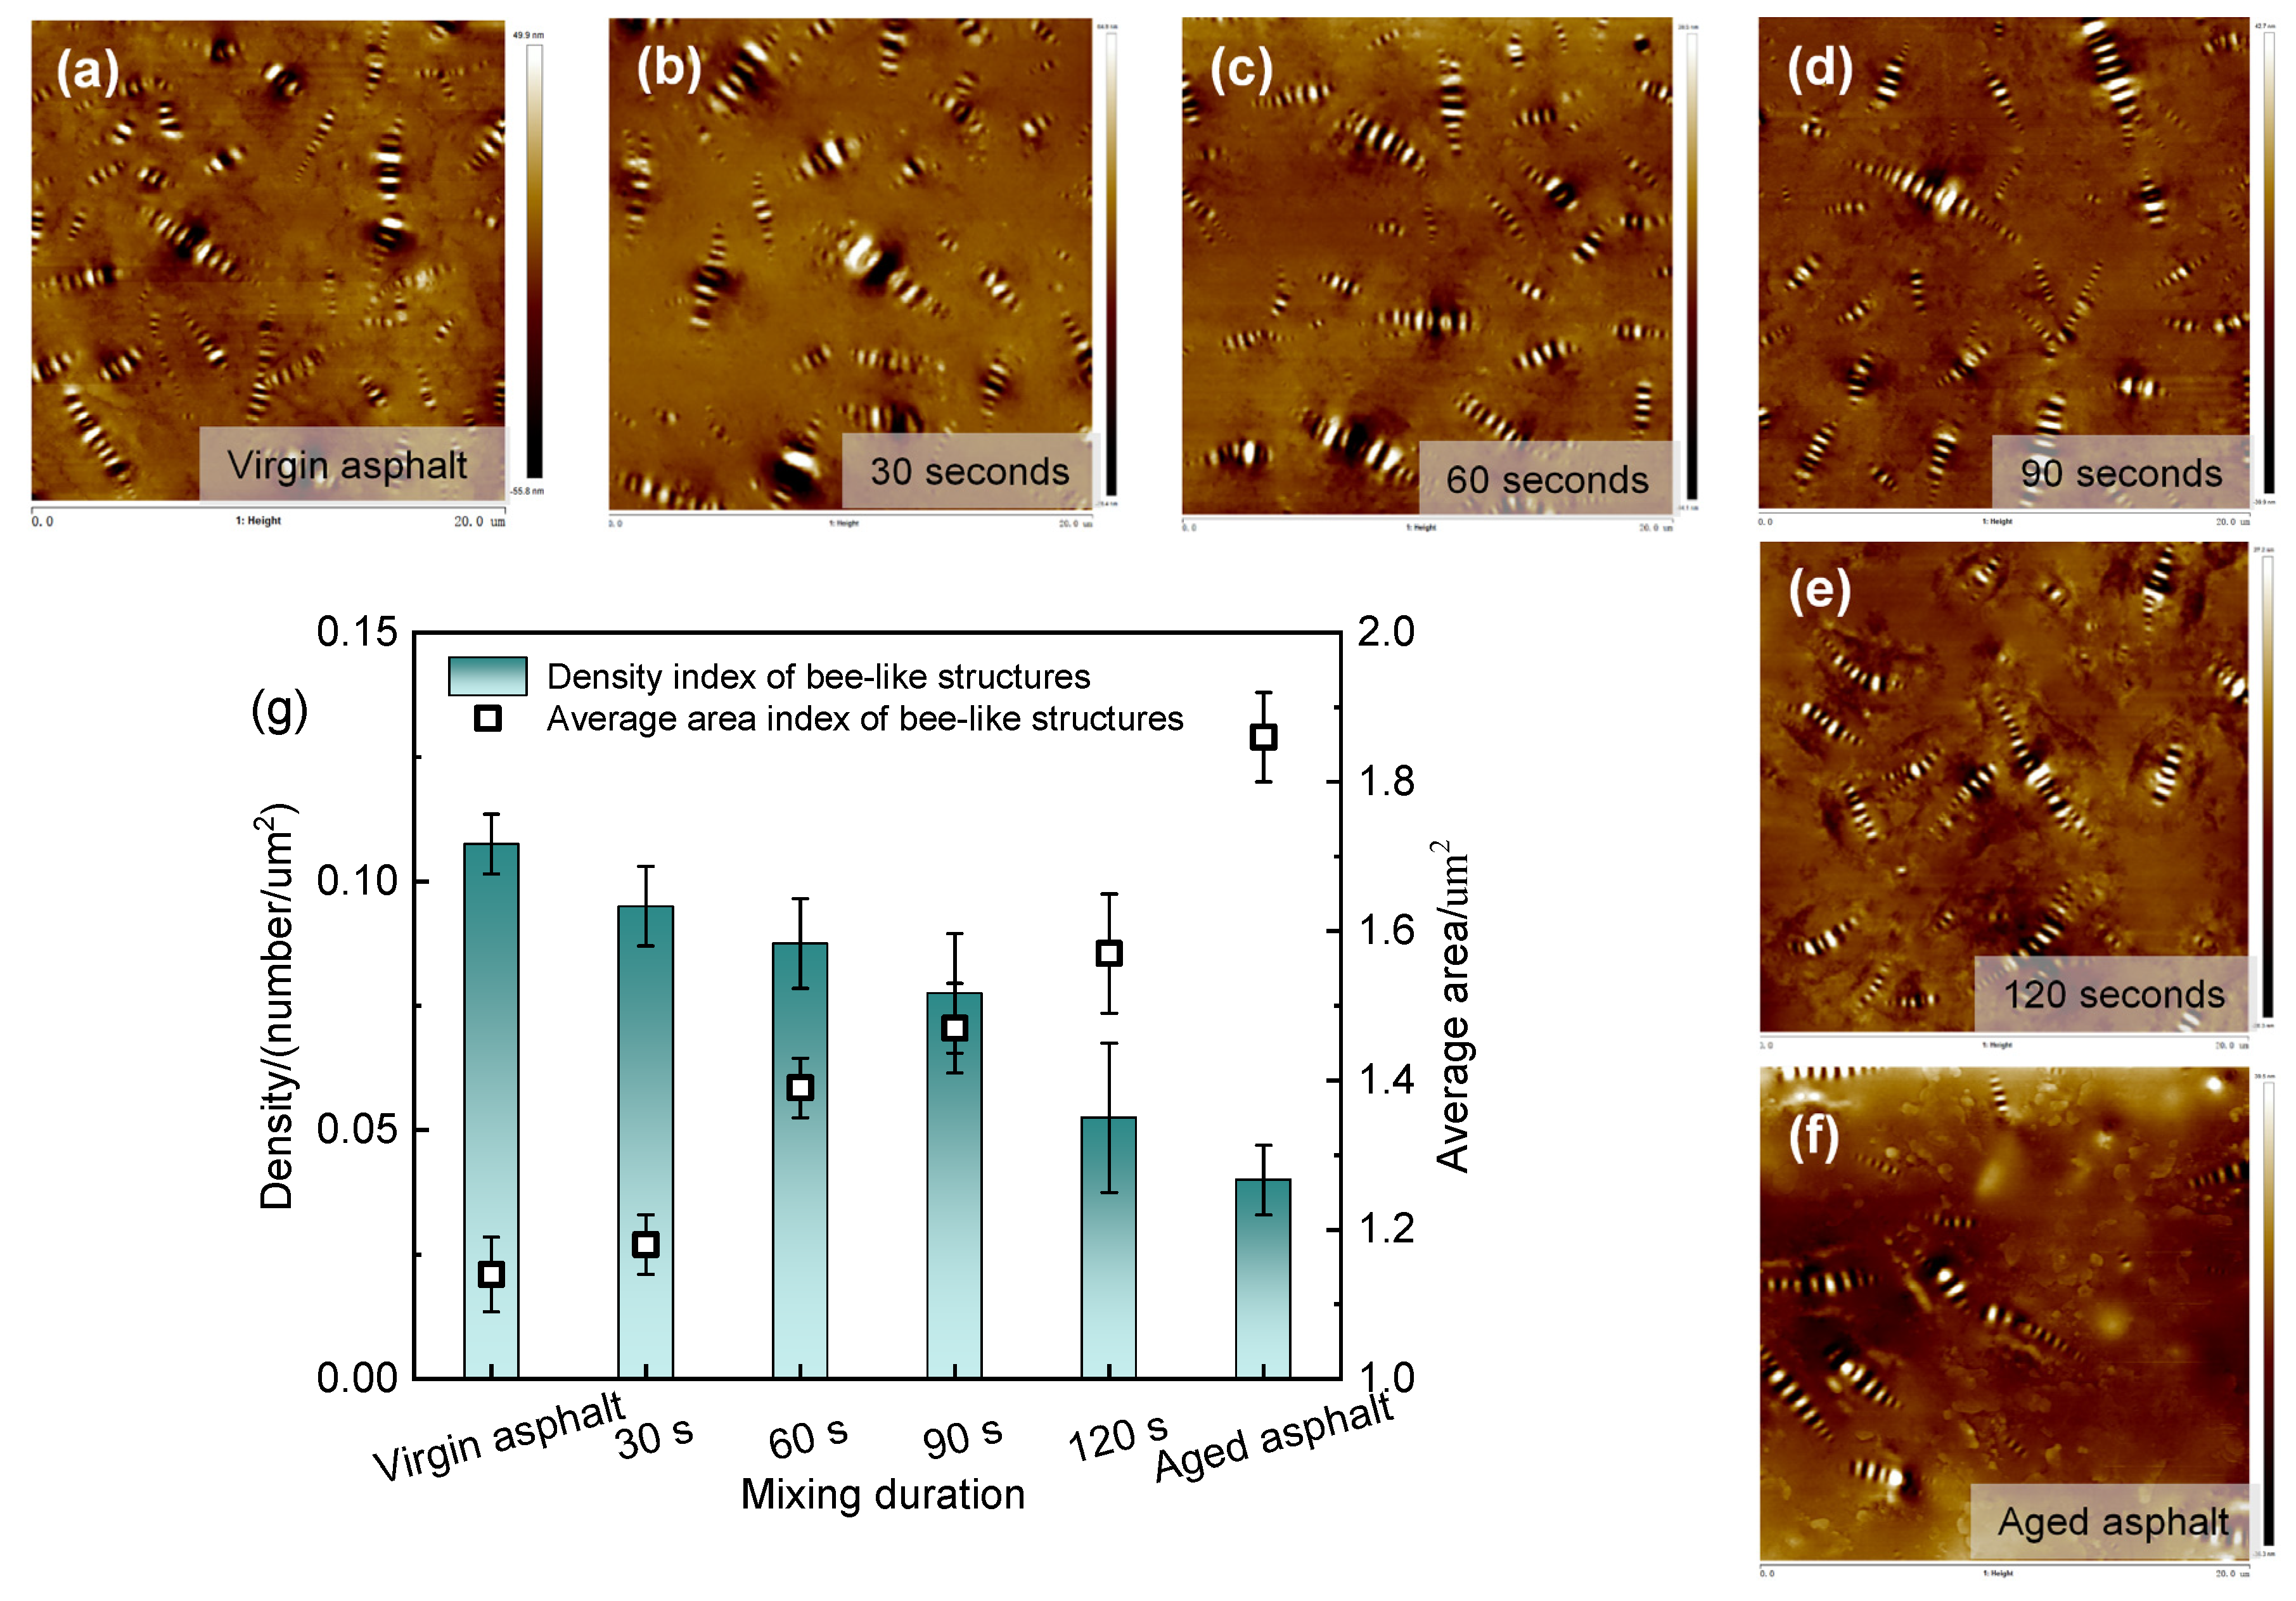
3.2.5. AFM Test
3.3. Performance of RHMA with Different Mixing Durations
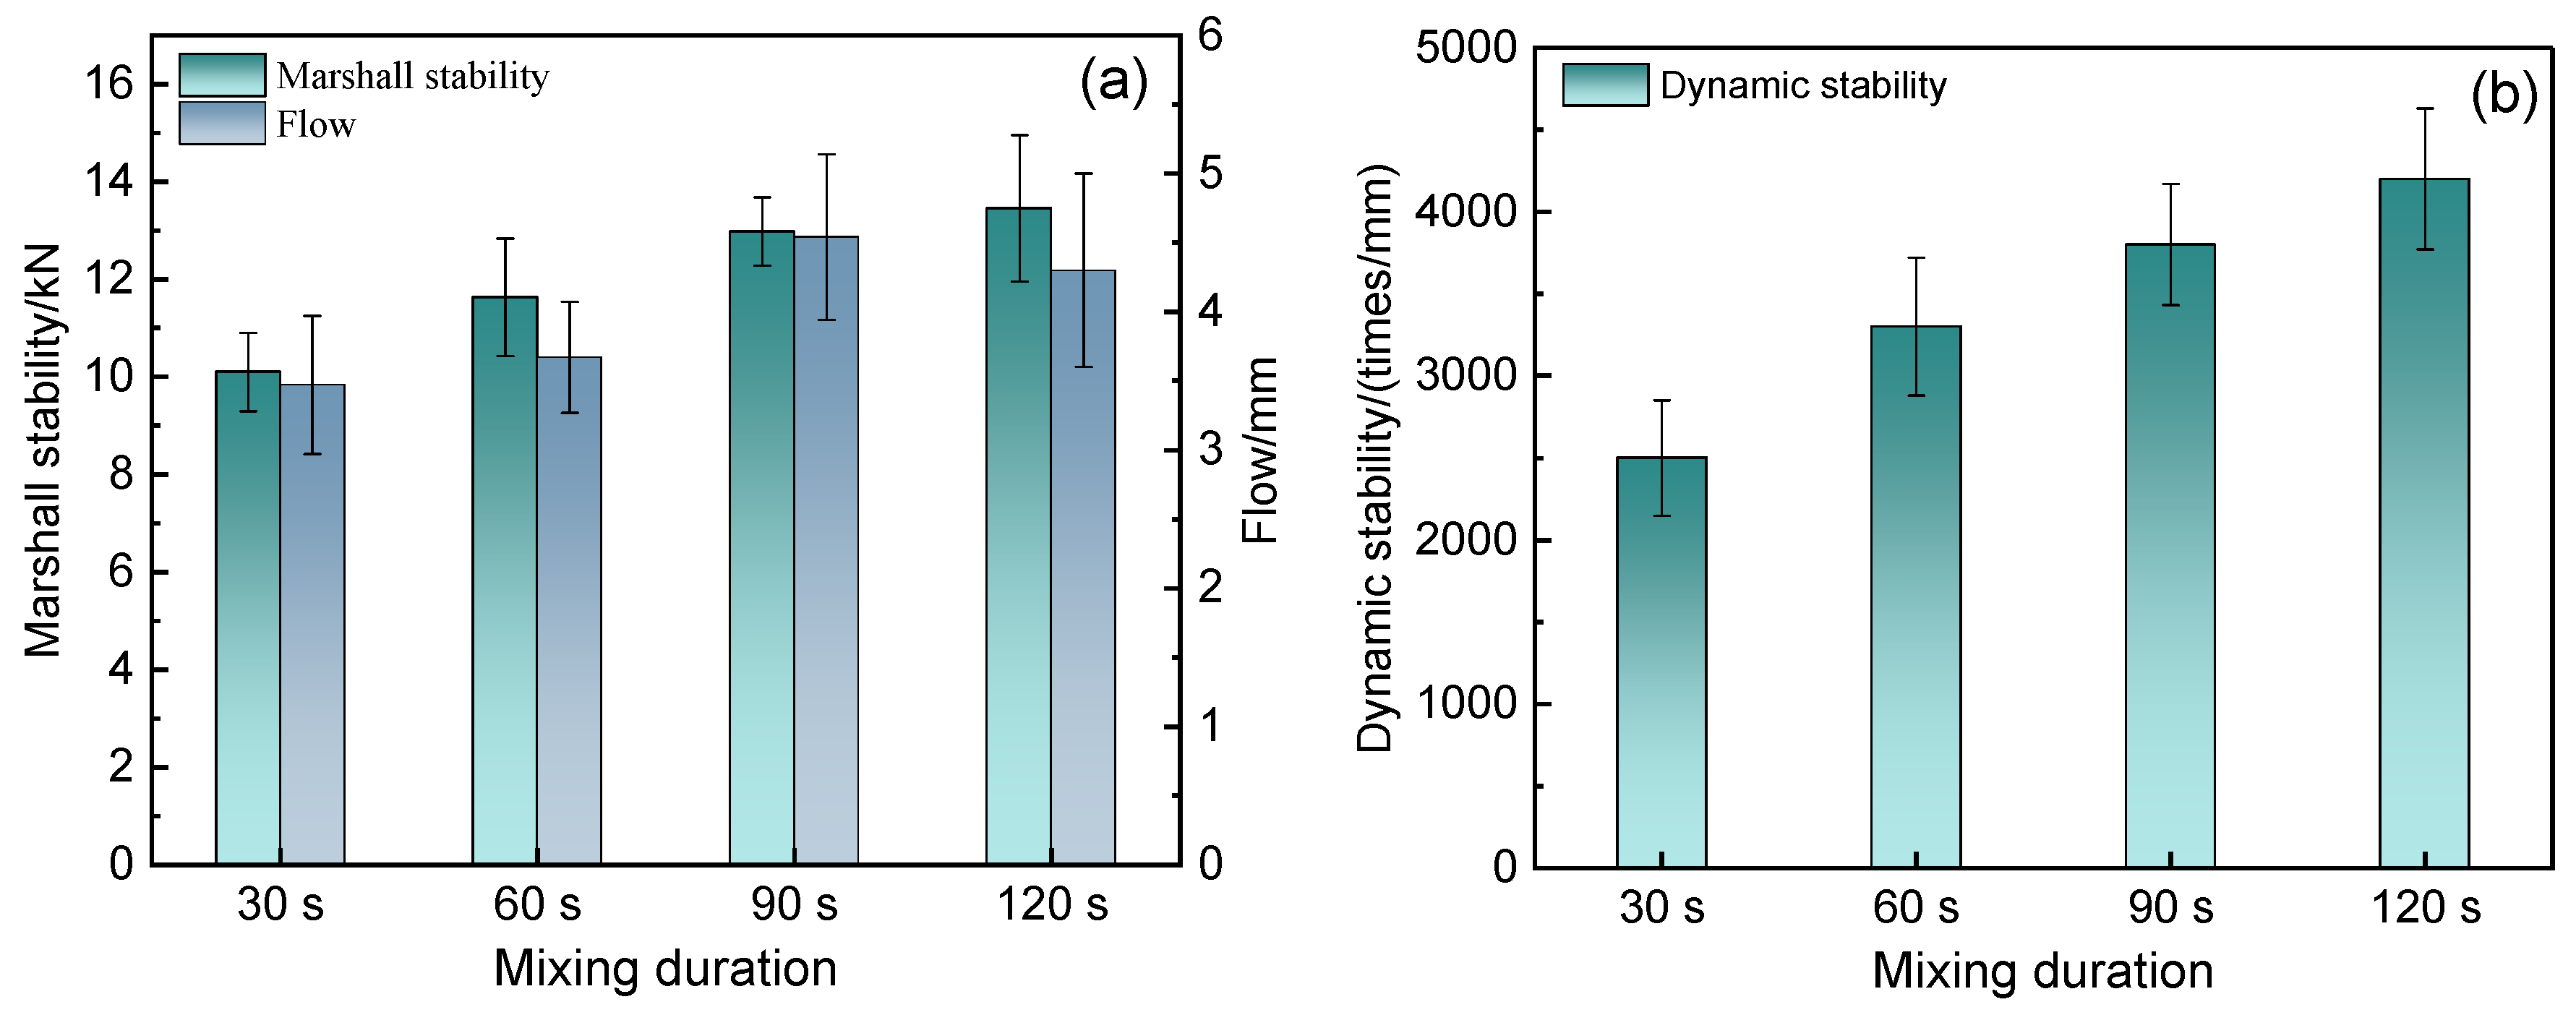
3.3.1. High-Temperature Resistance Test
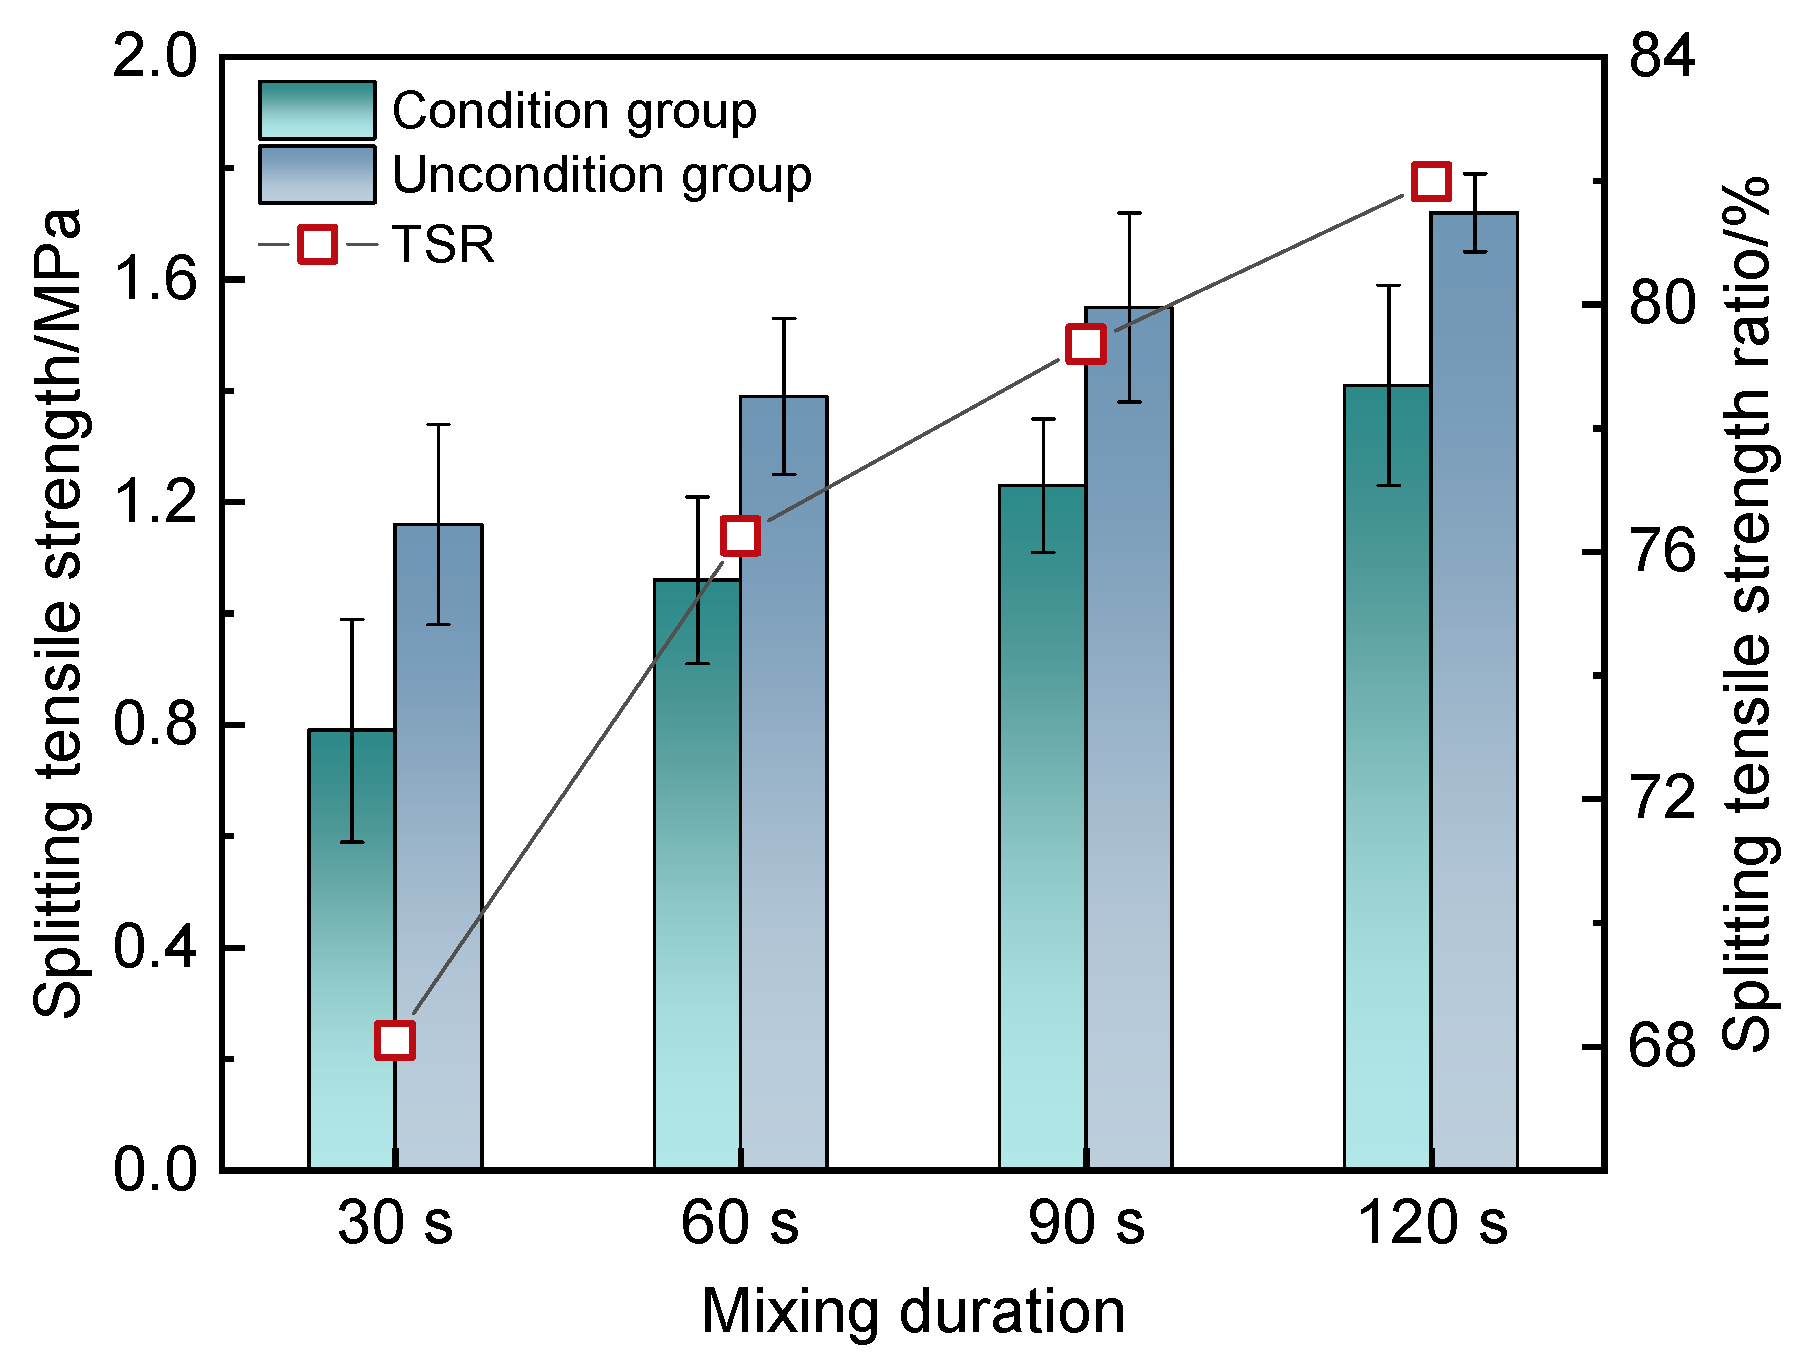
3.3.2. Moisture Sensitivity Test
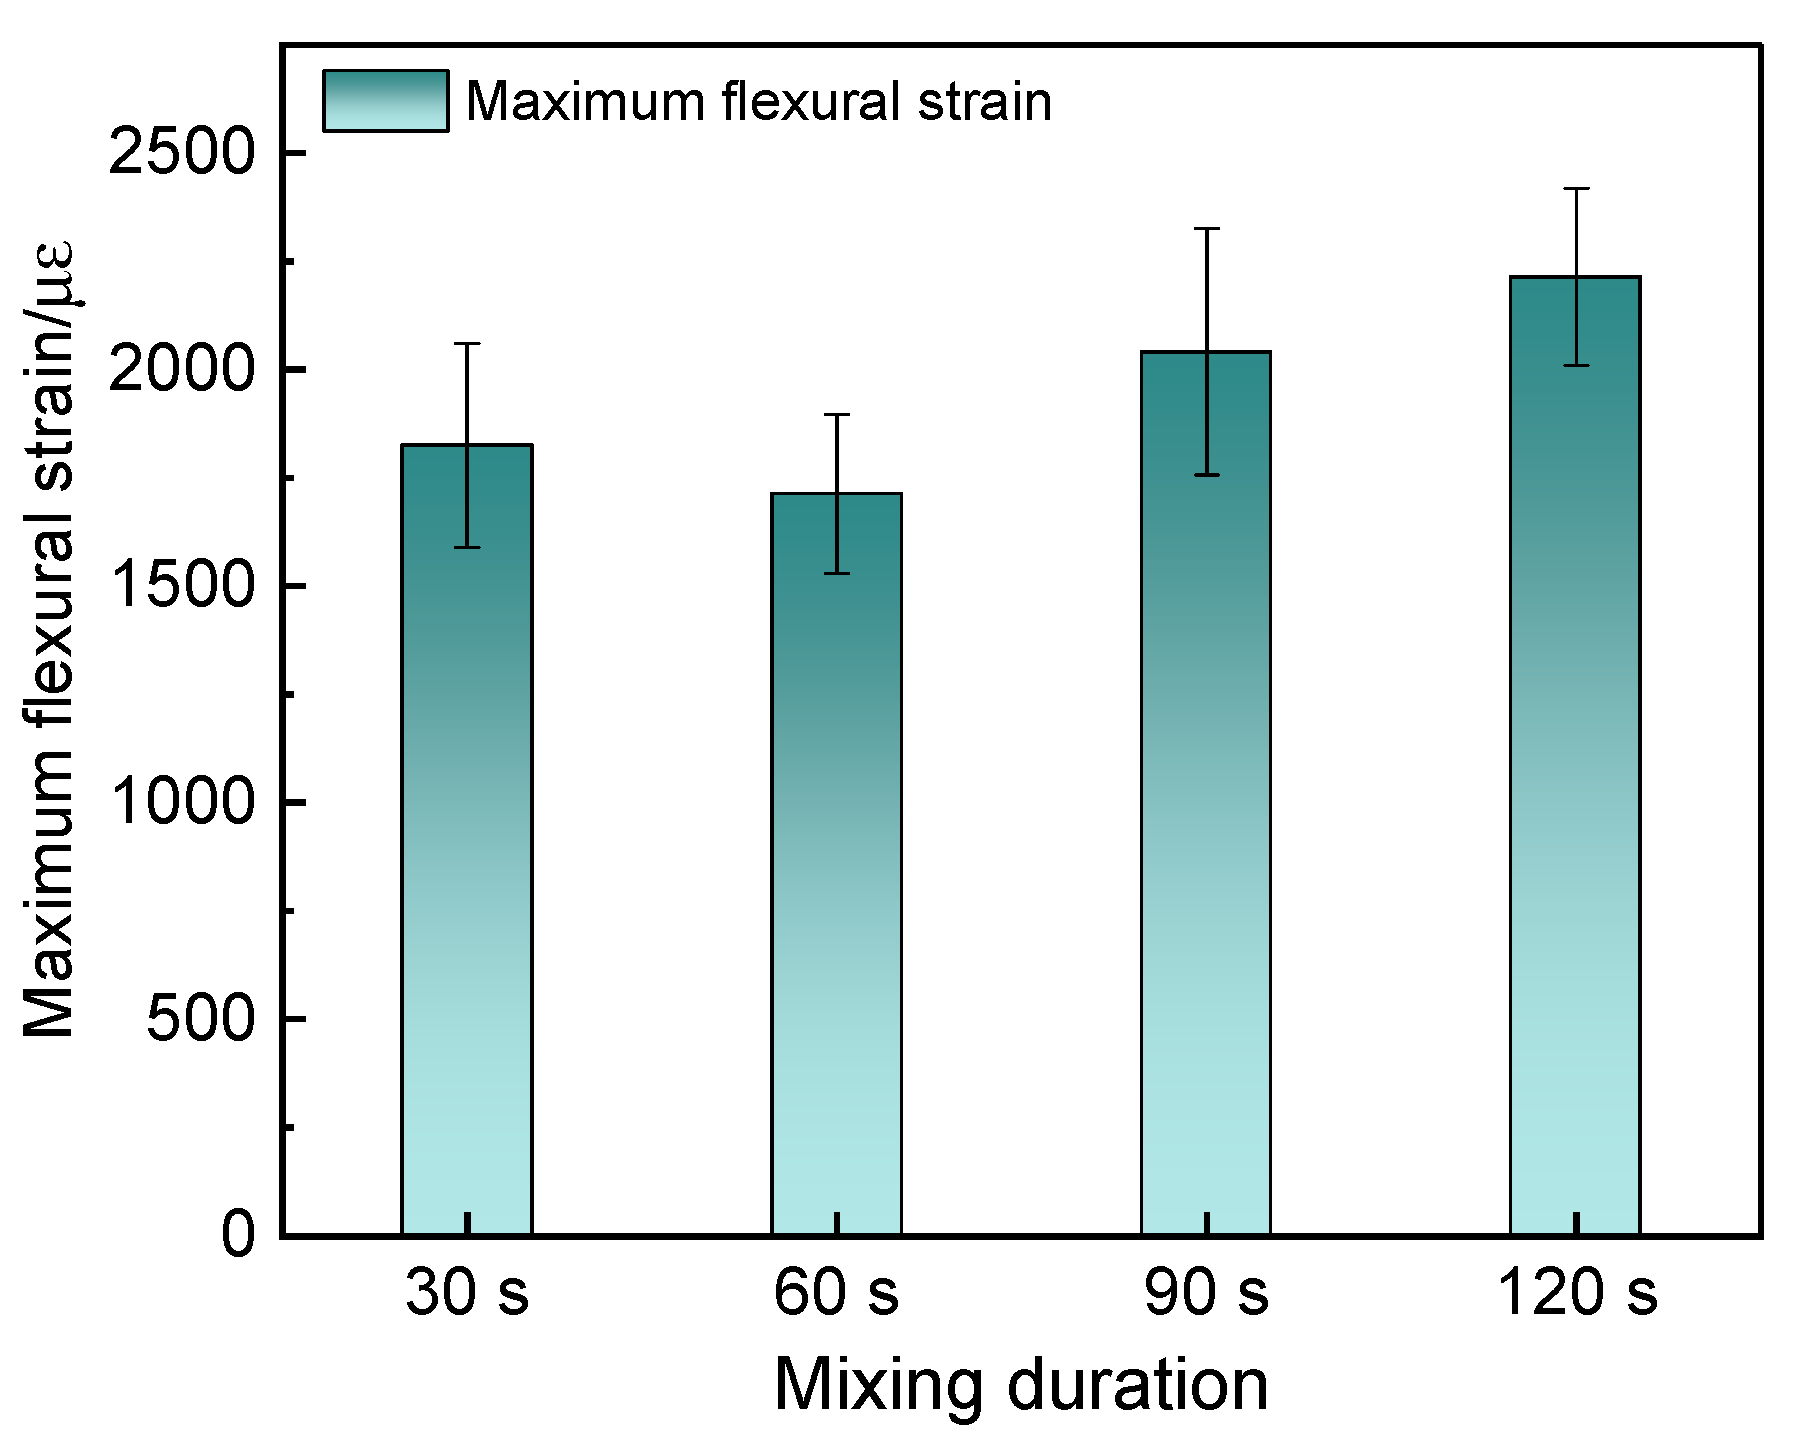
3.3.3. Low-Temperature Bending Beam Test
4. Environmental Impacts
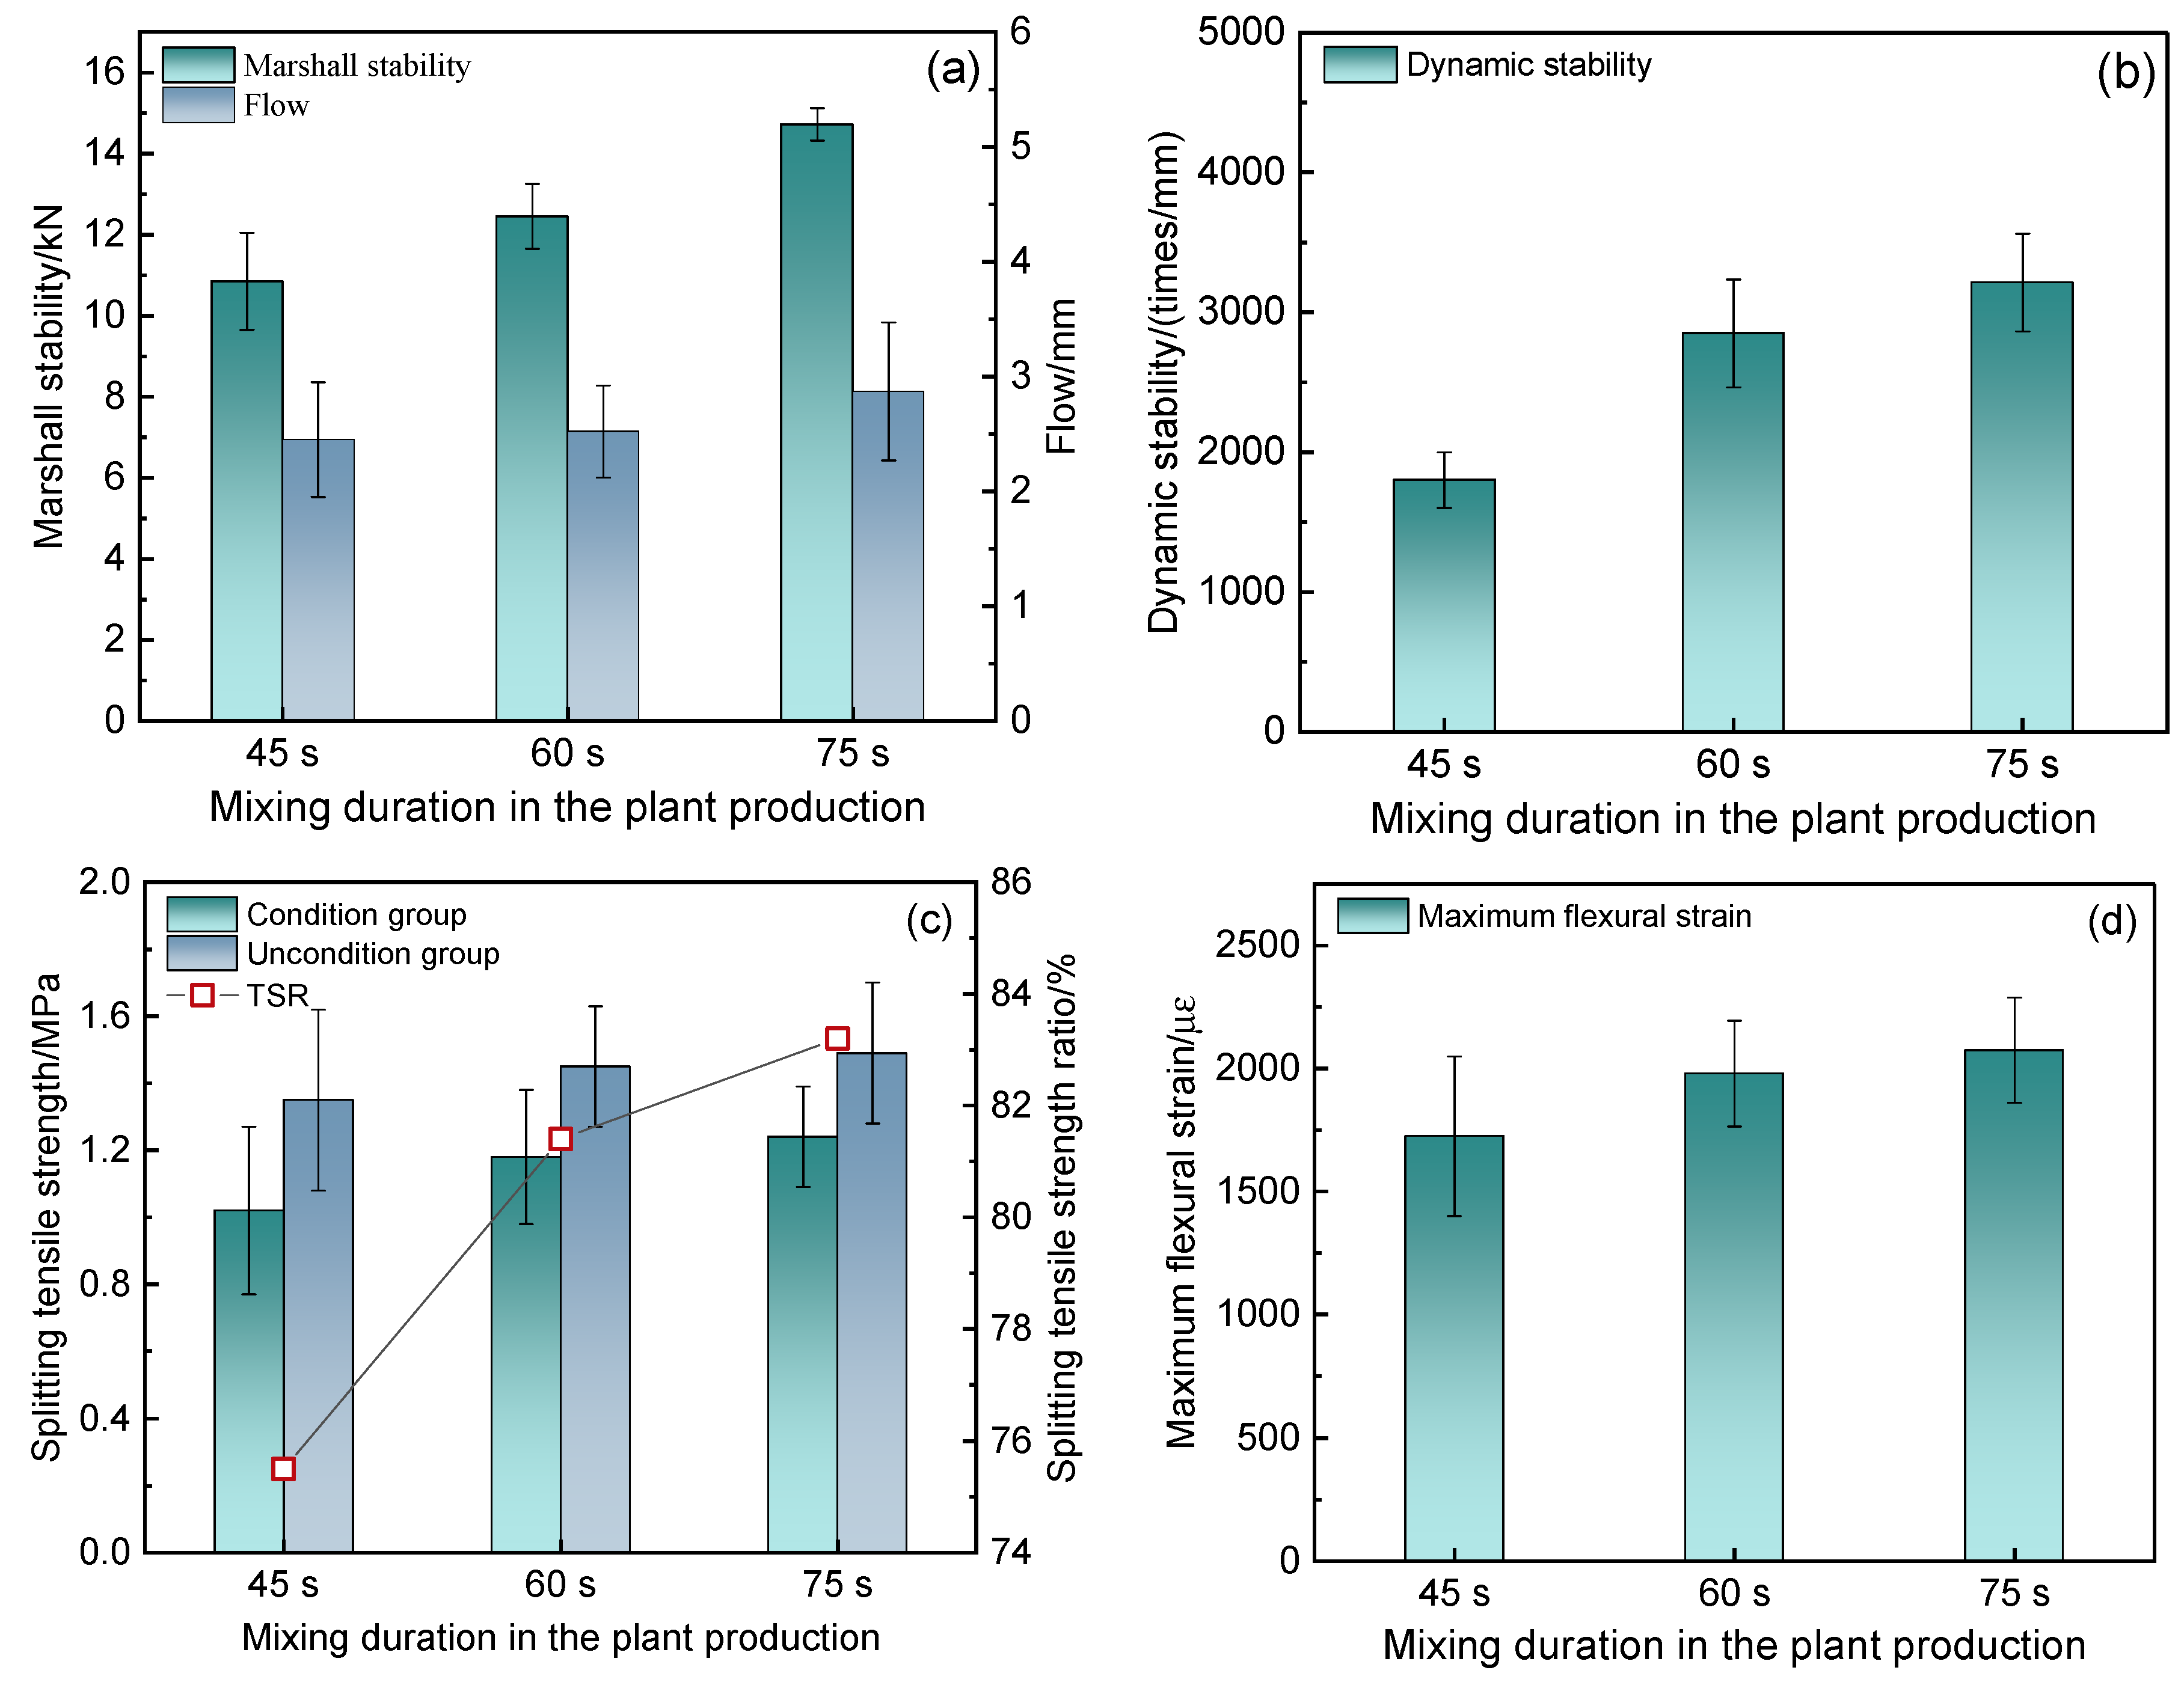
5. Evaluating the Performance of RHMA with Different Mixing Durations in the Plant
6. Discussion of the Results
7. Conclusions
Author Contributions
Funding
Institutional Review Board Statement
Informed Consent Statement
Data Availability Statement
Conflicts of Interest
References
- Sha, A.; Liu, Z.; Jiang, W.; Qi, L.; Hu, L.; Jiao, W.; Barbieri, D.M. Advances and development trends in eco-friendly pavements. J. Road Eng. 2021, 1, 1–42. [Google Scholar] [CrossRef]
- Wang, H.; Rath, P.; Buttlar, W.G. Recycled asphalt shingle modified asphalt mixture design and performance evaluation. J. Traffic Transp. Eng. 2020, 7, 205–214. [Google Scholar] [CrossRef]
- Pasetto, M.; Baliello, A.; Giacomello, G.; Pasquini, E. Towards very high RAP content asphalt mixes: A comprehensive performance-based study of rejuvenated binders. J. Traffic Transp. Eng. 2021, 8, 1022–1035. [Google Scholar] [CrossRef]
- Gao, J.; Yang, J.; Yu, D.; Jiang, Y.; Ruan, K.; Tao, W.; Sun, C.; Luo, L. Reducing the variability of multi-source reclaimed asphalt pavement materials: A practice in China. Constr. Build. Mater. 2021, 278, 122389. [Google Scholar] [CrossRef]
- Yang, J.; Tao, W.; Gao, J.; Yu, D.; Zhou, J.; He, L.; Yao, Y. Measurement of particle agglomeration and aggregate breakdown of reclaimed asphalt pavement. Constr. Build. Mater. 2021, 296, 123681. [Google Scholar] [CrossRef]
- Cai, J.; Song, C.; Gong, X.; Zhang, J.; Pei, J.; Chen, Z. Gradation of limestone-aggregate-based porous asphalt concrete under dynamic crushing test: Composition, fragmentation and stability. Constr. Build. Mater. 2022, 323, 126532. [Google Scholar] [CrossRef]
- Wang, D.; Riccardi, C.; Jafari, B.; Falchetto, A.C.; Wistuba, M.P. Investigation on the effect of high amount of Re-recycled RAP with Warm mix asphalt (WMA) technology. Constr. Build. Mater. 2021, 312, 125395. [Google Scholar] [CrossRef]
- Zaumanis, M.; Mallick, R.B.; Frank, R. 100% recycled hot mix asphalt: A review and analysis. Resour. Conserv. Recycl. 2014, 92, 230–245. [Google Scholar] [CrossRef]
- Antunes, V.; Freire, A.C.; Neves, J. A review on the effect of RAP recycling on bituminous mixtures properties and the viability of multi-recycling. Constr. Build. Mater. 2019, 211, 453–469. [Google Scholar] [CrossRef]
- Hou, X.; Hettiarachchi, C.; Xiao, F.; Zhao, Z.; Xiang, Q.; Yong, D. Blending efficiency improvement and energy investigation of recycled asphalt mixture involved warm mix technology. J. Clean. Prod. 2021, 279, 123732. [Google Scholar] [CrossRef]
- Falchetto, A.C.; Moon, K.H.; Kim, D.H. Evaluation of recycled asphalt mixture at low temperature using different analytical solutions. Can. J. Civ. Eng. 2020, 47, 801–811. [Google Scholar] [CrossRef]
- Oualit, M.; Irekti, A.; Hami, B. Performance of recycled asphalt mixtures formulated with modified bitumen. Environ. Eng. Manag. J. 2019, 18, 2613–2621. [Google Scholar] [CrossRef]
- McDaniel, R.; Anderson, R.M. Recommended Use of Reclaimed Asphalt Pavement in the Superpave Mix Design Method: Technician’s Manual; Transportation Research Board: Washington, DC, USA, 2001; pp. 1–60. [Google Scholar]
- Xu, Y.; Chou, Z.; Li, Y.; Ji, J.; Xu, S. Effect of Blending Degree between Virgin and Aged Binder on Pavement Performance of Recycled Asphalt Mixture with High RAP Content. Adv. Mater. Sci. Eng. 2019, 2019, 5741642. [Google Scholar] [CrossRef] [Green Version]
- Ashtiani, M.Z.; Mogawer, W.S.; Austerman, A.J. A Mechanical Approach to Quantify Blending of Aged Binder from Recycled Materials in New Hot Mix Asphalt Mixtures. Transp. Res. Rec. J. Transp. Res. Board 2018, 2672, 107–118. [Google Scholar] [CrossRef]
- Kaseer, F.; Arámbula-Mercado, E.; Martin, A.E. A Method to Quantify Reclaimed Asphalt Pavement Binder Availability (Effective RAP Binder) in Recycled Asphalt Mixes. Transp. Res. Rec. J. Transp. Res. Board 2019, 2673, 205–216. [Google Scholar] [CrossRef]
- Shirodkar, P.; Mehta, Y.; Nolan, A.; Sonpal, K.; Norton, A.; Tomlinson, C.; Dubois, E.; Sullivan, P.; Sauber, R. A study to determine the degree of partial blending of reclaimed asphalt pavement (RAP) binder for high RAP hot mix asphalt. Constr. Build. Mater. 2011, 25, 150–155. [Google Scholar] [CrossRef]
- Vassaux, S.; Gaudefroy, V.; Boulangé, L.; Pévère, A.; Michelet, A.; Barragan-Montero, V.; Mouillet, V. Assessment of the binder blending in bituminous mixtures based on the development of an innovative sustainable infrared imaging methodology. J. Clean. Prod. 2019, 215, 821–828. [Google Scholar] [CrossRef]
- Ding, Y.; Huang, B.; Shu, X. Blending efficiency evaluation of plant asphalt mixtures using fluorescence microscopy. Constr. Build. Mater. 2018, 161, 461–467. [Google Scholar] [CrossRef]
- Bowers, B.F.; Moore, J.; Huang, B.; Shu, X. Blending efficiency of Reclaimed Asphalt Pavement: An approach utilizing rheological properties and molecular weight distributions. Fuel 2014, 135, 63–68. [Google Scholar] [CrossRef]
- Solaimanian, M.; Chen, X. Investigating Degree of Blending Between Reclaimed Asphalt Pavement and Virgin Binder Using Atomic Force Microscopy and Focused Ion Beam. Transp. Res. Rec. J. Transp. Res. Board 2021, 2021, 036119812110184. [Google Scholar] [CrossRef]
- Rinaldini, E.; Schuetz, P.; Partl, M.N.; Tebaldi, G.; Poulikakos, L.D. Investigating the blending of reclaimed asphalt with virgin materials using rheology, electron microscopy and computer tomography. Compos. Part B Eng. 2014, 67, 579–587. [Google Scholar] [CrossRef]
- Xu, J.; Hao, P.; Zhang, D.; Yuan, G. Investigation of reclaimed asphalt pavement blending efficiency based on micro-mechanical properties of layered asphalt binders. Constr. Build. Mater. 2018, 163, 390–401. [Google Scholar] [CrossRef]
- Research Institute of Highway Ministry of Transport. Standard Test Methods of Bitumen and Bituminous Mixtures for Highway Engineering; China Communications Press: Beijing, China, 2011; pp. 1–358. [Google Scholar]
- Research Institute of Highway Ministry of Transport. Testing Methods of Aggregate for Highway Engineering; China Communications Press: Beijing, China, 2005; pp. 1–131. [Google Scholar]
- Research Institute of Highway Ministry of Transport. Technical Specifications for Highway Asphalt Pavement Recycling; China Communications Press: Beijing, China, 2019; pp. 1–92. [Google Scholar]
- Research Institute of Highway Ministry of Transport. Technical Specifications for Construction of Highway Asphalt Pavements; China Communications Press: Beijing, China, 2017; pp. 1–186. [Google Scholar]
- Yan, C.; Huang, W.; Lin, P.; Zhang, Y.; Lv, Q. Chemical and rheological evaluation of aging properties of high content SBS polymer modified asphalt. Fuel 2019, 252, 417–426. [Google Scholar] [CrossRef]
- Yan, C.; Huang, W.; Tang, N. Evaluation of the temperature effect on Rolling Thin Film Oven aging for polymer modified asphalt. Constr. Build. Mater. 2017, 137, 485–493. [Google Scholar] [CrossRef]
- Baqersad, M.; Ali, H. Rheological and chemical characteristics of asphalt binders recycled using different recycling agents. Constr. Build. Mater. 2019, 228, 116738. [Google Scholar] [CrossRef]
- Hettiarachchi, C.; Hou, X.; Xiang, Q.; Yong, D.; Xiao, F. A blending efficiency model for virgin and aged binders in recycled asphalt mixtures based on blending temperature and duration. Resour. Conserv. Recycl. 2020, 161, 104957. [Google Scholar] [CrossRef]
- Hou, X.; Xiao, F.; Wang, J.; Amirkhanian, S. Identification of asphalt aging characterization by spectrophotometry technique. Fuel 2018, 226, 230–239. [Google Scholar] [CrossRef]
- Hou, X.; Lv, S.; Chen, Z.; Xiao, F. Applications of Fourier transform infrared spectroscopy technologies on asphalt materials. Measurement 2018, 121, 304–316. [Google Scholar] [CrossRef]
- Mirwald, J.; Nura, D.; Hofko, B. Recommendations for handling bitumen prior to FTIR spectroscopy. Mater. Struct. 2022, 55, 22. [Google Scholar] [CrossRef]
- Rathore, M.; Haritonovs, V.; Meri, R.M.; Zaumanis, M. Rheological and chemical evaluation of aging in 100% reclaimed asphalt mixtures containing rejuvenators. Constr. Build. Mater. 2022, 318, 126026. [Google Scholar] [CrossRef]
- Ding, L.; Wang, X.; Zhang, M.; Chen, Z.; Meng, J.; Shao, X. Morphology and properties changes of virgin and aged asphalt after fusion. Constr. Build. Mater. 2021, 291, 123284. [Google Scholar] [CrossRef]
- Nahar, S.N.; Mohajeri, M.; Schmets AJ, M.; Scarpas, A.; Van de Ven, M.F.; Schitter, G. First Observation of Blending-Zone Morphology at Interface of Reclaimed Asphalt Binder and Virgin Bitumen. Transp. Res. Rec. J. Transp. Res. Board 2013, 2370, 1–9. [Google Scholar] [CrossRef] [Green Version]
- Yang, J.; Luo, L.; Gao, J.; Xu, J.; He, C. Study on the Effect of Regeneration Agent on the Viscosity Properties of Aged Asphalt. Materials 2022, 15, 380. [Google Scholar] [CrossRef] [PubMed]
- Rebelo, L.M.; De Sousa, J.S.; Baroni, M.P.M.A.; Alencar, A.E.V.; Soares, S.A.; Filho, J.M.; Soares, J.B. Aging of asphaltic binders investigated with atomic force microscopy. Fuel 2014, 117, 15–25. [Google Scholar] [CrossRef]
- Liu, B.; Shen, J.; Song, X. Changes in Nanoscaled Mechanical and Rheological Properties of Asphalt Binders Caused by Aging. J. Nanomater. 2015, 2015, 961924. [Google Scholar] [CrossRef] [Green Version]
- Meng, X. Study on Quantification of Energy Consumption and Carbon Emission During the Period of Asphalt Pavement Construction. Master’s Thesis, Beijing Jiaotong University, Beijing, China, 2020. [Google Scholar]
- GB/T 2589-2020; General Rules for Calculation of the Comprehensive Energy Consumption. China Communications Press: Beijing, China, 2021; pp. 1–12.
- China Emission Accounts and Datasets, CEADs. Available online: https://www.ceads.net.cn/data/ (accessed on 10 June 2022).
- Bowers, B.F.; Huang, B.; Shu, X.; Miller, B.C. Investigation of Reclaimed Asphalt Pavement blending efficiency through GPC and FTIR. Constr. Build. Mater. 2014, 50, 517–523. [Google Scholar] [CrossRef]
- Xing, C.; Liu, L.; Li, M. Chemical Composition and Aging Characteristics of Linear SBS Modified Asphalt Binders. Energy Fuels 2020, 34, 4194–4200. [Google Scholar] [CrossRef]
- Haghshenas, H.F.; Rea, R.; Reinke, G.; Zaumanis, M.; Fini, E. Relationship between colloidal index and chemo-rheological properties of asphalt binders modified by various recycling agents. Constr. Build. Mater. 2022, 318, 126161. [Google Scholar] [CrossRef]
- Wang, J.; Wang, T.; Hou, X.; Xiao, F. Modelling of rheological and chemical properties of asphalt binder considering SARA fraction. Fuel 2019, 238, 320–330. [Google Scholar] [CrossRef]
- Wu, J.; Liu, Q.; Wang, Y.; Chen, J.; Wang, D.; Xie, L.; Ago, C. Effect of Mixing duration and Temperature on the Homogeneity of Asphalt Mixtures Containing Reclaimed Asphalt Pavement Material. Transp. Res. Rec. J. Transp. Res. Board 2018, 2672, 167–177. [Google Scholar] [CrossRef]
- Karlsson, R.; Isacsson, U. Application of FTIR-ATR to Characterization of Bitumen Rejuvenator Diffusion. J. Mater. Civ. Eng. 2003, 15, 157–165. [Google Scholar] [CrossRef]


| Test Items | Test Results | Test Method | |
|---|---|---|---|
| Penetration, 25 °C, 0.1 mm | 74.9 | T0604 | |
| Softening point, °C | 50.1 | T0606 | |
| Ductility, 15 °C, cm | >100 | T0605 | |
| Viscosity, 60 °C, Pa·s | 225 | T0620 | |
| RTFOT | Penetration ratio, % | 71.2 | T0604 |
| Residual ductility, 10 °C, cm | 32.5 | T0605 | |
| Mass loss, % | −0.03 | T0610 | |
| Aggregate Type | Test Items | Test Results | Test Method |
|---|---|---|---|
| Coarse aggregate | Specific gravity | 2.751 | T0304 |
| Flakiness and elongation particles, % | 11.4 | T0312 | |
| Crushing value, % | 12.6 | T0316 | |
| Los Angeles abrasion, % | 13.7 | T0317 | |
| Water absorption, % | 0.5 | T0304 | |
| Fine aggregate | Specific gravity | 2.715 | T0328 |
| Sand equivalent, % | 70.1 | T0334 | |
| Filler | Specific gravity | 2.648 | T0352 |
| Sieve Size/mm | 12~16 mm | 6~12 mm | 0~6 mm | |||
|---|---|---|---|---|---|---|
| Before | After | Before | After | Before | After | |
| 16 | 100.0 | 100.0 | 100.0 | 100.0 | 97.9 | 100.0 |
| 13.2 | 100.0 | 100.0 | 100.0 | 100.0 | 60.1 | 78.5 |
| 9.5 | 100.0 | 99.9 | 85.2 | 92.2 | 4.9 | 32.6 |
| 4.75 | 74.5 | 96.8 | 6.6 | 26.0 | 0.4 | 18.4 |
| 2.36 | 35.6 | 62.9 | 1.9 | 17.4 | 0.1 | 13.3 |
| 1.18 | 19.6 | 45.8 | 1.0 | 14.9 | 0.1 | 10.9 |
| 0.6 | 9.3 | 36.4 | 0.5 | 12.3 | 0.1 | 9.5 |
| 0.3 | 2.8 | 26.1 | 0.2 | 9.6 | 0.1 | 7.4 |
| 0.15 | 1.2 | 19.2 | 0.2 | 7.5 | 0.1 | 5.7 |
| 0.075 | 0.3 | 14.9 | 0.0 | 6.0 | 0.0 | 4.5 |
| Asphalt content, % | - | 2.32 | - | 3.16 | - | 7.86 |
| Material Type | Indicators | Test Results | Test Method |
|---|---|---|---|
| RAP | Moisture content, % | 0.57 | T0307 and T0334 |
| Sand equivalent, % | 86.7 | ||
| Asphalt in RAP | Penetration, 25 °C, 0.1 mm | 28.5 | T0604 |
| Softening point, °C | 71.2 | T0606 | |
| Ductility, 15 °C, cm | 23.1 | T0605 | |
| Viscosity, 60 °C, Pa·s | 1980 | T0620 | |
| Coarse aggregate | Crushing value, % | 14.7 | T0316 |
| Flakiness and elongation particles, % | 13.8 | T0312 | |
| Fine Aggregate | Angularity | 32.1 | T0345 |
| Energy Type | Energy Consumption | CO2 Emissions |
|---|---|---|
| Natural gas | 38.931 MJ/m3 | 2.162 kg/m3 |
| Electricity | 3.597 MJ/(kW·h) | 0.997 kg/(kW·h) |
| Mixing Duration, s | Productivity, t/h | Natural Gas Consumption, m3/t | Electricity Consumption, (kW·h)/t | Energy Consumption, MJ/t | CO2 Emissions, kg/t |
|---|---|---|---|---|---|
| 30 | 480 | 3.14 | 2 | 129.44 | 8.78 |
| 45 | 320 | 3.96 | 3 | 164.96 | 11.55 |
| 60 | 240 | 4.78 | 4 | 200.48 | 14.32 |
| 75 | 192 | 5.61 | 5 | 236.39 | 17.11 |
| 90 | 160 | 6.44 | 6 | 272.30 | 19.91 |
Publisher’s Note: MDPI stays neutral with regard to jurisdictional claims in published maps and institutional affiliations. |
© 2022 by the authors. Licensee MDPI, Basel, Switzerland. This article is an open access article distributed under the terms and conditions of the Creative Commons Attribution (CC BY) license (https://creativecommons.org/licenses/by/4.0/).
Share and Cite
Gao, J.; Yao, Y.; Huang, J.; Yang, J.; Song, L.; Xu, J.; Lu, X. Effect of Hot Mixing Duration on Blending, Performance, and Environmental Impact of Central Plant Recycled Asphalt Mixture. Buildings 2022, 12, 1057. https://doi.org/10.3390/buildings12071057
Gao J, Yao Y, Huang J, Yang J, Song L, Xu J, Lu X. Effect of Hot Mixing Duration on Blending, Performance, and Environmental Impact of Central Plant Recycled Asphalt Mixture. Buildings. 2022; 12(7):1057. https://doi.org/10.3390/buildings12071057
Chicago/Turabian StyleGao, Jie, Yuquan Yao, Jinhua Huang, Jiangang Yang, Liang Song, Jing Xu, and Xinhu Lu. 2022. "Effect of Hot Mixing Duration on Blending, Performance, and Environmental Impact of Central Plant Recycled Asphalt Mixture" Buildings 12, no. 7: 1057. https://doi.org/10.3390/buildings12071057