Article

Comprehensive Evaluation of Very Thin Asphalt Overlays with Different Aggregate Gradations and Asphalt Materials Based on AHP and TOPSIS

1
School of Naval Architecture, Ocean and Civil Engineering, Shanghai Jiao Tong University, Shanghai 200240, China
2
Shanghai Municipal Maintenance Management Co., Ltd., Shanghai 201105, China
*
Author to whom correspondence should be addressed.
Buildings 2022, 12(8), 1149; https://doi.org/10.3390/buildings12081149
Submission received: 27 May 2022 / Revised: 20 July 2022 / Accepted: 27 July 2022 / Published: 1 August 2022

Abstract

:
Very thin asphalt overlays (VTAOs) have been widely used as a cost-effective preventive maintenance measure in various countries. However, because of the complex combinations of aggregate gradations and asphalt materials, the selection of VTAOs is an unsolved problem that is extremely important for pavement management authorities. Therefore, this study proposed a comprehensive evaluation method for VTAOs based on the analytic hierarchy process (AHP) and technique for order of preference by similarity to ideal solution (TOPSIS). Three VTAO mixtures comprising different aggregate gradations (stone mastic asphalt (SMA), open-graded friction course (OGFC), and asphalt concrete (AC)) and different asphalt materials (organic silicon (OS) and styrene-butadiene-styrene (SBS)) were investigated and preliminarily compared in the laboratory. Subsequently, four road performance indicators (pavement condition indicator, British pendulum number, texture depth, and international roughness index) were selected as the evaluation indices, and their weights were calculated using the AHP according to the questionnaires collected from specialists. Finally, the field test data of the road performance indicators with scale confusion were handled using TOPSIS, and the closeness was considered as the final evaluation criterion. The results indicated that the mixture of AC and SBS exhibited the best performance among the three investigated mixtures. Categorizing the evaluation indicators into two aspects—the strength aspect and the structural aspect—it is found that the strength aspect of a VTAO is mainly affected by the asphalt materials, whereas the structural aspect of a VTAO is mainly affected by the aggregate gradation. This study provides a practical method for evaluating the road performance of VTAO with diverse measurement indices, as well as a quantitative scope for the impacts of the aggregate gradation and asphalt materials on the road performance.

1. Introduction

Preventive maintenance technologies are widely used in the preservation of asphalt pavements because of their ability to improve road performance and ultimately extend the service life of pavements [1,2,3,4,5]. Among the various preventive maintenance measures (chip seal, slurry seal, micro-surface, and very thin asphalt overlay (VTAO)), VTAO is a cost-effective solution owing to its effectiveness for improving durability and skid resistance [6,7,8]. Additionally, it is sustainable because it exhibits a lower raw-material consumption (saves > 50% of the aggregate and asphalt) than traditional micro-surface measures, while providing a comparable road performance improvement [9]. Various VTAOs have been designed and applied, and have shown different superior performances, such as better cooling effects to prevent high-temperature-related disease [10]; high skid resistance and low traffic noise [11]; superior resistance to rutting, moisture, and studded tire wear [12]; and cost-effectiveness of maintenance [13]. However, because of the complex combinations of VTAO mixtures, it is difficult for pavement management authorities to evaluate VTAOs and to identify the VTAO with the optimum performance.
The performance of a VTAO is closely related to the aggregate gradation and type of cement [14,15]. For example, previous studies have shown that the international roughness index (IRI), water permeability coefficient, texture depth (TD), and British pendulum number (BPN) are affected to different degrees by aggregate gradation [16,17]. Imaninasab et al. [18] and Tayfur et al. [19] conducted a series of laboratory tests to compare the strengths of porous asphalt and dense-graded asphalt mixtures. They observed that the porous asphalt mixture exhibited a lower strength and rutting resistance than the dense-graded asphalt mixture. Additionally, researchers have observed that the road performance of VTAOs is affected by cement materials, e.g., modified asphalt materials [20,21]. Xu et al. [22,23] conducted an experimental study on four different asphalt materials and found that the adhesion of the asphalt material to stone is the most important factor for improving the raveling resistance of pavements. However, current studies on preventive maintenance measures mainly focus on comparative performance analyses based on laboratory tests [24,25], a single comparative analysis of the pavement performance indicators [26], and identifying the optimal material composition of a certain VTAO through experimental investigation [25,27,28]. Comprehensive evaluation research on preventive maintenance measures has rarely been conducted. Hence, it is difficult to solve the practical problem of identifying the optimum preventive maintenance measure.
The comprehensive evaluation of VTAOs is difficult because it requires handling objective field test data involving different units, dimensions, and directions. The analytic hierarchy process (AHP) is a frequently used comprehensive evaluation method involving multiple indicators. Although it has the advantages of having a simple calculation and a strong logical structure, it usually deals with subjective evaluation scores [29,30,31,32]. Meanwhile, the technique for order of preference by similarity to ideal solution (TOPSIS) is considered to be an objective evaluation method that reflects the differences in real data [33,34]. It can conveniently resolve inconsistencies in the dimensions of different indicators and can perform normalization processing of the indicators [35]. Therefore, the combination of AHP and TOPSIS is proposed for comprehensively evaluating the performance of VTAOs with different aggregate gradations and asphalt materials.
The remainder of this article is organized as follows. The structural compositions and material properties of three VTAO mixtures are presented in Section 2. The evaluation indicators for the road performance and the field-testing methods for VTAOs are presented in Section 3, and the evaluation steps and calculation methods of AHP and TOPSIS are presented in Section 4. Subsequently, the evaluation results for the aggregate gradations and asphalt materials are discussed in Section 5, and conclusions are drawn in Section 6.

2. Structural Composition and Material Properties of VTAO

2.1. Structural Composition of VTAO

VTAO is a thin-layer surface system comprising a surface abrasion layer and an adhesive waterproof layer, as shown in Figure 1. The surface abrasion layer mainly contains aggregates and asphalt cement. There are various types of asphalt cements, such as styrene–butadiene–styrene (SBS)-modified asphalt, organic silicon (OS)-modified asphalt, and styrene–butadiene–rubber (SBR)-modified asphalt. The adhesive waterproof layer is composed of bonding oil, which is generally identical to that used in the asphalt cement. From a functional aspect, the surface abrasion layer can increase the skid resistance of the pavement surface, reduce the pavement noise, and enhance the smoothness of the pavement surface, while the adhesive waterproof layer ensures a good waterproof performance. Notably, the three VTAOs in our study are thinner (0.8–1.2 cm) than the thickness of VTAOs proposed in previous studies (about 2–2.5 cm) [9,17].

2.2. Types of Aggregate Gradation

According to the Technical Specifications for Construction of Highway Asphalt Pavements (JTG F40—2004) [36], asphalt mixtures are classified according to the gradation of the mineral aggregates and the nominal maximum particle size of the aggregates. Three gradation types were investigated in this study: stone mastic asphalt (SMA), open-graded friction course (OGFC), and asphalt concrete (AC). SMA—an asphalt mastic crushed stone mixture—had intermittent gradation. The gradation of OGFC is a macroporous asphalt with 70% coarse aggregate and a small proportion of fine aggregate. The gradation of AC is a densely mixed AC mixture. The number suffix of the gradation type, such as AC-5, represents the nominal maximum particle size of the aggregate. The differences between the three gradation types used in this study are presented in Table 1. The gradation compositions of the three aggregates are shown in Figure 2.

2.3. Properties of Asphalt Materials

In this study, three asphalt materials provided by different companies were used as the asphalt cement, which are denoted as A, B, and C, respectively. Their properties were tested in the laboratory, and their specific performance parameters are presented in Table 2. As shown, the differences between the asphalt types were significant.
The bonding effect plays a key role in the occurrence of asphalt pavement cracks, ruts, looseness, and other defects, which significantly affect the road performance of VTAOs [9,26]. Thus, in this study, bonding-strength tests were conducted in the laboratory. The instrument used in the bonding-strength test was a fully automatic digital display pull-out adhesion tester. By applying a load on the pulling head, the asphalt adhering to the surface of the stone was peeled off, so as to evaluate the adhesion between the asphalt and the stone. By controlling the variables in the test process, the pull-out test can also be used to evaluate the asphalt-aggregate adhesion of different materials, at different temperatures, and under wet or dry conditions. The results indicated that the bonding strengths of the OS-modified and SBS-modified asphalt materials exceeded 1 MPa under dry and wet conditions, as shown in Figure 3. According to the specifications [36], the bonding strengths of the asphalt materials satisfied the strength requirement.

2.4. Performance of VTAO Mixtures

The performance of VTAO mixtures is complex and is affected by both the asphalt materials and the aggregate gradation. Thus, three VTAO mixtures were prepared for performance tests, as shown in Table 3.
Laboratory tests were conducted on the three VTAO mixtures, and the performance results are presented in Table 4.
As indicated in Table 4, the aggregate gradation and asphalt type significantly affected the performance of the VTAO mixtures, and the laboratory tests showed that the performances of the three VTAO mixtures all satisfied the requirements of the Chinese specifications [36]. From the laboratory test results, it was difficult to determine the best VTAO mixture for preventive maintenance. Therefore, comprehensive evaluations through relevant field tests were conducted to identify the VTAO with the optimum road performance.

3. Evaluation Indicators and Field Tests

3.1. Evaluation Indicators for Road Performance

In this study, the pavement condition index (PCI), BPN, TD, and IRI were selected as evaluation indicators for the road performance, with reference to road standards for performance assessment and quality control [37]. These indicators were selected because (1) they can accurately reflect the state of the road and (2) they are necessary and convenient measurable indicators. The indicators are described in Table 5. Moreover, the pavement repair effect is typically evaluated without consideration of the economic benefits, human factors, etc.

3.2. Field Tests

To ensure the consistency of the road conditions of the three VTAOs, field tests were conducted on three adjacent sections of pavement in Shanghai, as shown in Figure 4. Additionally, as evaluation indicators should reflect the deterioration process of preventive maintenance measures, each evaluation indicator was measured several times over a one-year period, and the average values of multiple measurements were considered as the final test results.
The testing methods and instruments, along with onsite photographs, for the different indicators are presented in Table 6.
The definitions and calculation formulas of the evaluation indicators are presented below.

3.2.1. PCI

PCI reflects the damage to the pavement surface and is calculated using Equation (1) [37,38]:
PCI   = 100 15 DR 0.412
DR = 100 × i = 1 n w i A i A
where DR represents the pavement damage rate (%), A i denotes the cumulative area of type- i pavement damage, A indicates the pavement inspection or survey area, and w i is the weight or conversion factor for type- i pavement damage.
The PCI value is mainly related to the defects, such as cracks, rutting, segregation, looseness, and oiling, which are important indicators of the pavement surface performance.

3.2.2. BPN

BPN is an important performance indicator for evaluating the skid resistance of asphalt pavements. It is determined using a pendulum meter to measure the surface friction coefficient of the pavement under wet conditions. The relationship between the BPN and pavement surface friction coefficient f is given as follows:
BPN   = 100 × f

3.2.3. TD

TD refers to the average depth of unevenly opened pores in a certain area of the pavement surface. It is primarily used to evaluate the macroscopic roughness, drainage performance, and skid resistance of the pavement surface. There are two commonly used measurement methods: the manual sand-paving method and the T0962 electric sand-paving method. In this study, the manual sand-paving method was used. Fine sand with a volume of V (diameter: 0.15–0.3 mm) was paved into a circle with diameter D on the road surface, so that the sand filled the gaps on the uneven road surface until there was no excess floating fine sand on the road surface. TD is calculated as follows:
TD   = 4 V π D 2

3.2.4. IRI

IRI refers to the cumulative vertical displacement of a quarter-vehicle model at a speed of 80 km/h. Different measurement methods are used in different countries. In China, according to the requirements of the pavement maintenance specifications [37,38], a 3-m ruler is generally used for measurement, and this method was adopted in the present study. In this measurement method, the maximum gap h between the ruler and the pavement was tested after placing the 3-m ruler horizontally on the pavement at several different locations. IRI is calculated as follows:
IRI   = i = 1 20 h i 20

4. Evaluation Method

4.1. Evaluation Procedure

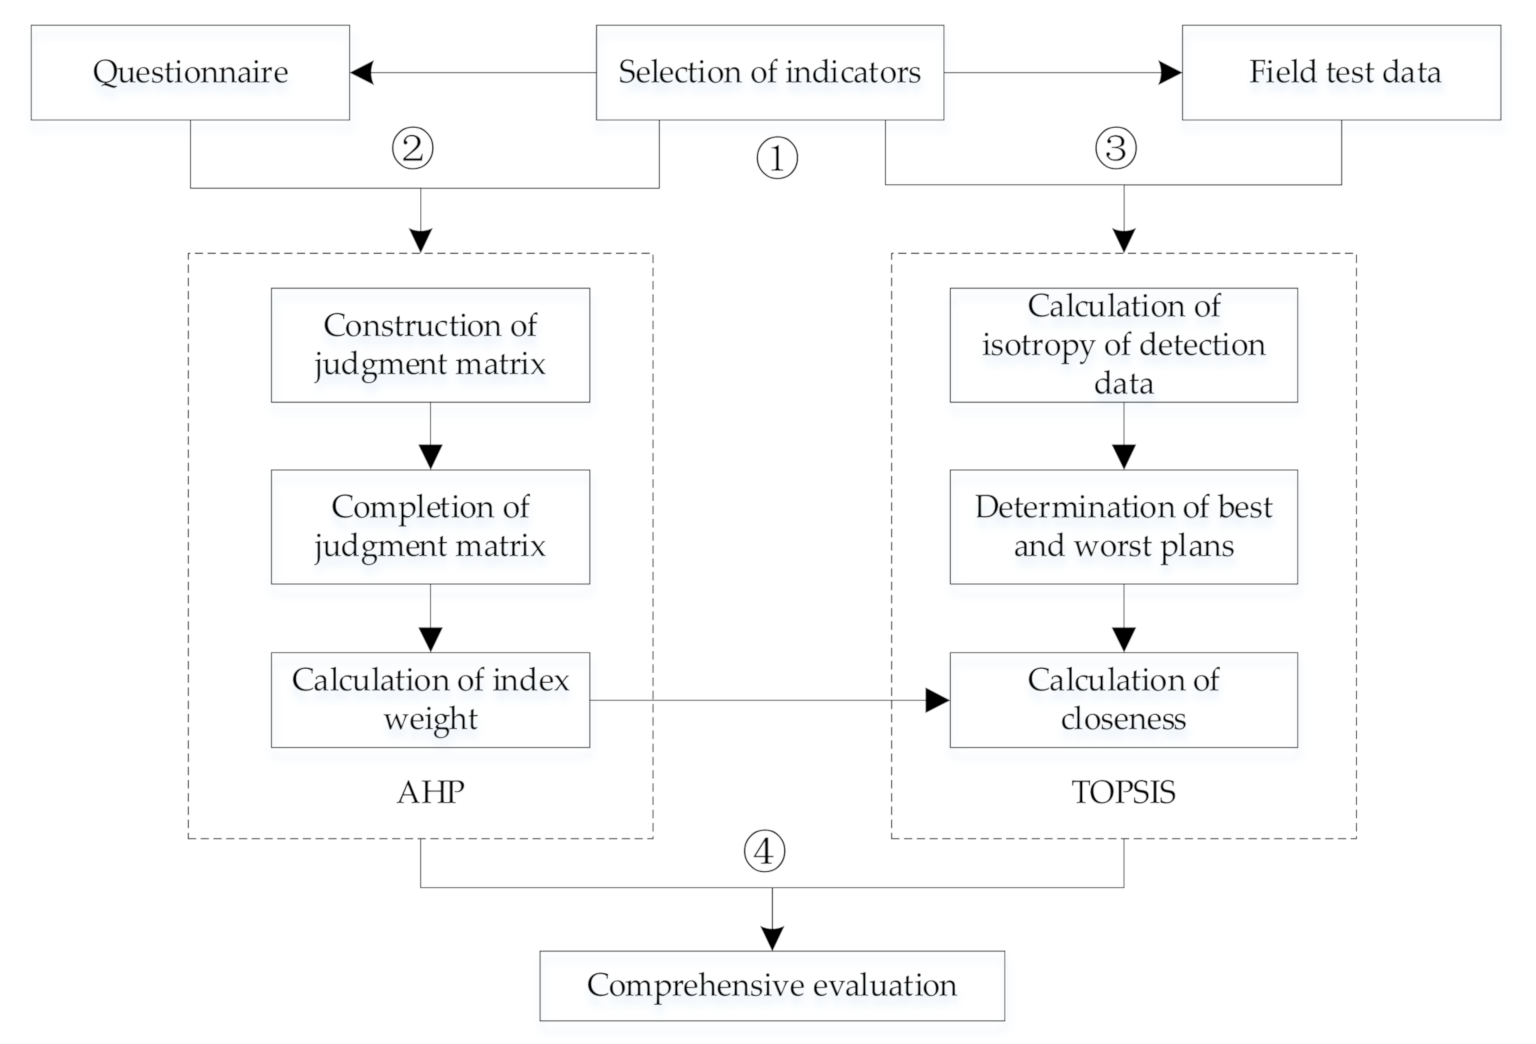
In this study, we developed a comprehensive evaluation method for identifying the VTAO with the best performance by combining AHP and TOPSIS. The evaluation procedure is illustrated in Figure 5 and is described below.
  • Select evaluation indicators according to national specifications and the literature.
  • Determine the weights of the evaluation indicators using AHP according to questionnaires from specialists in the area.
  • Obtain field test data on the evaluation indicators and process them using TOPSIS.
  • Combine the AHP weights of the evaluation indicators and the closeness calculated via TOPSIS to obtain the final evaluation result.
The final evaluation result is the degree of closeness of the three VTAOs. A higher degree of closeness corresponds to a better VTAO performance.

4.2. AHP

In this study, AHP was used to determine the weights of the evaluation indicators, because it is a facile and simple method for solving evaluation problems considering different aspects. The raw data for AHP were obtained from questionnaires completed by 17 specialists in pavement maintenance. The calculation process for the weights using AHP is described below [39].

4.2.1. Construct Judgment Matrix

The comparison results for the evaluation indicators were expressed using a pairwise comparison matrix A. A 1–9 fundamental scale was used to construct the matrix A (Equation (6)), on the basis of the questionnaires. The meanings of the 1–9 fundamental scale are presented in Table 7.
A = 1 a 12 a 1 n a 21 a i j a j i = 1 / a i j a n 1 1
Here, a i j represents the comparison result for activities i and j.

4.2.2. Calculate Weight

AHP was used to obtain the eigenvector of the maximum eigenvalue of matrix A. The weight of the ith indicator was obtained by normalizing the ith component of the eigenvector. The square-root approximation method was used to calculate the eigenvector in this study, and the steps are presented below.
Calculate w i ¯ :
w i ¯ = j = 1 n a i j n i = 1 , , n
where w i ¯ represents the ith component of the eigenvector.
Normalize w i ¯ :
w i = w i ¯ i = 1 n w i ¯ i = 1 , , n
where w i represents the weight of the ith indicator.

4.2.3. Consistency

Because matrix A is filled artificially, data inconsistency can easily occur when various indicators exist. For instance, the judgment favoring B over C is 1/2, and that favoring C over D is 1/2. If the judgment favoring B over D is also 1/2, it is obviously inconsistent with the previously filled data. To prevent this, the consistency of the filled matrix was checked via the following steps.
Determine the maximum eigenvalue λ m a x of matrix A:
λ m a x = i = 1 n j = 1 n a i j w i n w i
Calculate the consistency indicator (CI):
C I = λ m a x n n 1
Table 8 presents the corresponding average random indicators (RI).
Calculate and judge the consistency ratio (CR):
C R = C I R I
When CR 0.1 , the consistency of matrix A is considered acceptable. In this situation, the weight of the indicator calculated using this matrix has a high reliability. When CR > 0.1 , the judgment matrix does not satisfy the consistency requirements and must be revised to ensure the credibility of the weight.

4.3. TOPSIS

There are problems in directly using field test data to evaluate the road performance of the three VTAOs, as the indicator values have different magnitudes, units, and directions. Among the objective data-processing methods, such as the entropy method, principal component analysis, and grey relational analysis, TOPSIS was selected in this study because of its advantages in handling data with direction and magnitude differences. Another reason we considered combining AHP and TOPSIS is that they are relatively simple, and if other factors or indicators need to be considered in the evaluation, the proposed method can quickly expand without changing the framework. Therefore, it is easier to be used, accepted, and promoted by engineers.
The calculation process for TOPSIS is presented below.

4.3.1. Normalize Indicator Attributes

To overcome the direction and magnitude differences, the first step of the TOPSIS method is the normalization of the indicator attributes. The data of indicator attributes are categorized into four types: maximum, minimum, intermediate, and interval. The maximum indicator reflects that larger values of the data correspond to a better performance. Therefore, for ease of computation, the other three data types should be transformed into the maximum indicator, which is called normalization processing. The steps for this are presented below.
  • For the minimum indicator, a smaller value is more suitable. After processing, the value of indicator x is transformed into x as follows:
x = 1 x x 0   o r   x = M x
where M represents the maximum possible value of indicator x .
2.
For the intermediate indicator, the middle value of the indicator should be selected appropriately. After processing, the value of indicator x is transformed into x as follows:
x = 2 x m M m ,         m x 1 2 M + m 2 M x M m ,         1 2 M + m x M
where M and m represent the maximum and minimum possible values of indicator x , respectively.
3.
For the interval indicator, it is best to expect the indicator value to fall within a certain interval. After processing, the value of indicator x is transformed into x as follows:
x = 1 a x a a * ,             x < a 1 ,                 a x b 1 x b b * b ,             x > b
where a , b is the most stable interval of indicator x and a * , b * is the maximum tolerance interval of indicator x .

4.3.2. Construct Normalized Initialization Matrix

If there are n alternatives to be evaluated and each alternative has m indicators, the original data matrix is constructed as follows:
X = x 11 x 12 x 1 m x 21 x 22 x 2 m x n 1 x n 2 x n m
where x i j represents the jth indicator value of the ith alternative.
The indicator values in each column are normalized as follows:
z i j = x i j i = 1 n x i j 2 ,
where z i j represents the normalized value of the jth indicator of the ith alternative.
Thus, the normalized matrix Z is obtained:
Z = z 11 z 12 z 1 m z 21 z 22 z 2 m z n 1 z n 2 z n m

4.3.3. Determine Positive Ideal and Negative Ideal Solutions

The positive ideal solution Z + is composed of the maximum value of each column in Z:
Z + = ( max z 11 , z 21 , , z n 1 , max z 12 , z 22 , , z n 2 , , max z 1 m , z 2 m , , z n m ) = Z 1 + , Z 2 + , , Z m +
The negative ideal solution Z is composed of the minimum value of each column in Z:
Z = ( min z 11 , z 21 , , z n 1 , min z 12 , z 22 , , z n 2 , , min z 1 m , z 2 m , , z n m ) = Z 1 , Z 2 , , Z m
The degrees of closeness of each alternative to the positive ideal solution and the negative ideal solution are calculated as follows:
D i + = j = 1 m w j Z j + z i j 2 ,     D i = j = 1 m w j Z j z i j 2 ,     i = 1 , , n
where w j represents the weight of the jth indicator and j = 1 m w j = 1 .
The indicator weights can be determined according to the actual situation or using an expert evaluation method. In this study, the AHP method was used to determine the indicator weights.

4.3.4. Calculate Closeness Ci of Each Alternative to Ideal Solution

C i = D i D i + + D i ,         i = 1 , , n
Here, 0 C i 1 . A larger indicator value corresponds to better performance of the alternative. Thus, a set of alternatives can be preference-ranked in descending order of the C i values.

5. Discussion

5.1. Field Test Data

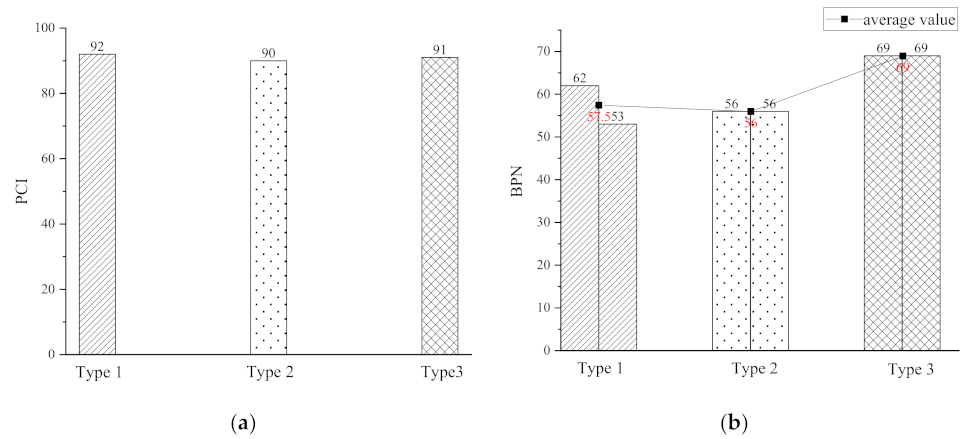
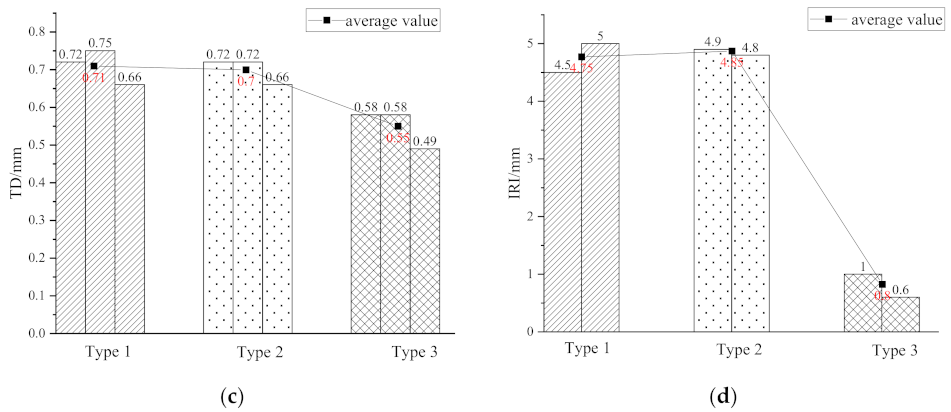
The field test data of the four evaluation indicators are presented in Figure 6a–d, and the red numbers are the average value of field test data. The PCI and BPN values of the three VTAOs were close, whereas the TD and IRI values differed significantly among the three VTAOs. It can be seen that there are not many field test data, but the discreteness of the indices of each VTAO was not large. Considering the feedback from the engineers in the field tests, the apparent road performance of each VTAO was relatively uniform. Therefore, these data were sufficient for the evaluation method proposed in this study.
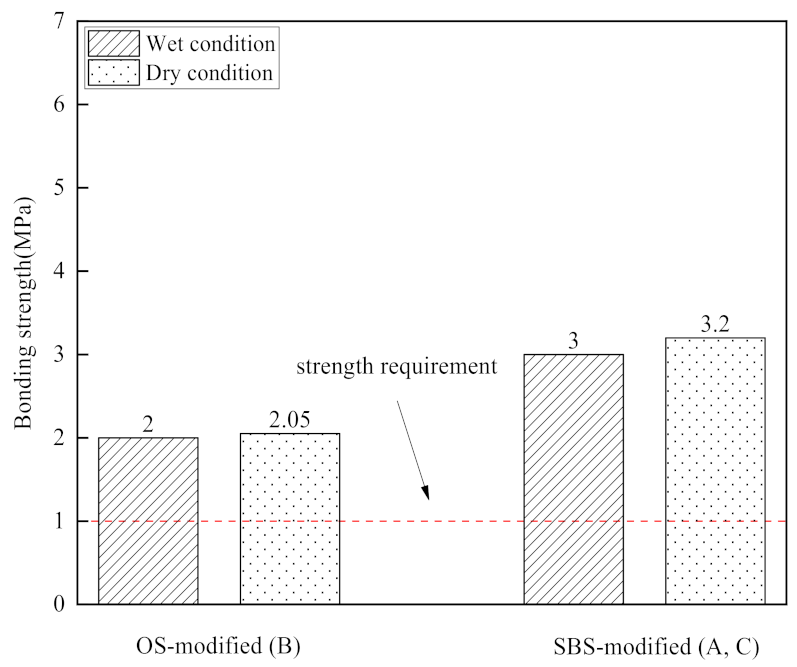
The PCI values of the three VTAOs were excellent after one year of operation, indicating that the three VTAO mixtures had a good resistance to damage. As shown in Figure 2, the bonding strengths of the three mixtures were far higher than the specification requirements (1 MPa). It can be inferred that the bonding strength of the asphalt mixture is an important factor for obtaining good PCI values.
The BPN values of types 1 and 2 were identical, and they were approximately 20% smaller than that of Type 3. However, the BPN values of all three VTAOs exceeded the requirement (> 40). The differences in BPN originated from the polishing values of the aggregate materials. All three types of aggregate materials were composed of basalt, which has a good polishing value. Thus, the three VTAOs had a good performance with regard to the BPN.
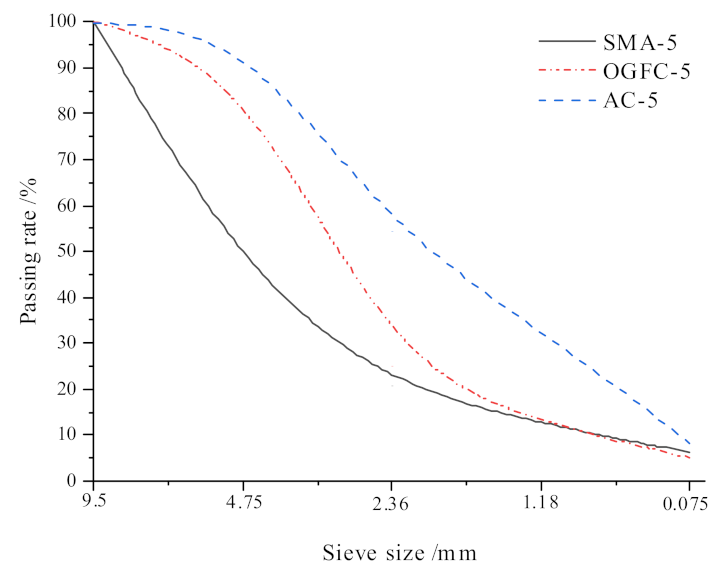
The TD values of Types 1 and 2 were identical, and they were significantly better than that of Type 3. TD is mainly related to the porosity of the aggregates. Considering the aggregate gradations of the three VTAOs, Type 3 (with continuous gradation and a dense suspension structure) had the lowest porosity. Type 1 (with discontinuous gradation) and Type 2 (with open gradation) had higher porosities; thus, their TD values were larger.
For the IRI, Type 3 outperformed Types 1 and 2. This was attributed to the gradation types, as Type 3 (with a dense suspension structure) was conducive to the compaction and smoothing of the pavement surface. However, all three VTAO mixtures satisfied the IRI requirement of the national specification (10 mm) [36].
The evaluation indicators were categorized into two aspects: the strength aspect (PCI) and the structural aspect (BPN, TD, and IRI). The strength aspect of a VTAO is mainly affected by the asphalt materials, whereas the structural aspect of a VTAO is mainly affected by the aggregate gradation. It should be noted that issues such as uncertainties of the road performances were not considered in this study.

5.2. AHP Weights

Using Equations (6)–(11), the weights of the evaluation indicators were calculated according to questionnaires collected from 17 specialists in pavement maintenance. Table 9 presents the results.
Among the four evaluation indicators, PCI had the largest weight, followed by IRI, BPN, and TD. It is inferred that PCI and IRI can be intuitively checked by specialists, whereas the other two parameters must be evaluated via measurements. This result is consistent with engineering experience, because, as a preventive maintenance measure, VTAOs are mainly used to improve the condition of the road surface, and the surface condition is of great concern to operating management authorities. Thus, the selection of an indicator is important for a comprehensive evaluation, as it may affect the evaluation results.

5.3. Evaluation Results of TOPSIS

Using the TOPSIS method presented in Section 4.3, the raw field test data of several indicators were normalized, as shown in Table 10.
The results of the TOPSIS calculations are presented in Table 11 and Table 12. Using Equations (15)–(19), the positive ideal solution Z + and negative ideal solution Z for each evaluation indicator were obtained.
To calculate the closeness of each alternative to the positive and negative ideal solutions, the weight w j of each evaluation index was used, according to Equation (20). The closeness results for each VTAO are presented in Table 12.
The closeness of the VTAO was considered as the final result of the comprehensive evaluation. Among the three VTAO mixtures, Type 3 exhibited the optimum performance, followed by Types 1 and 2. The evaluation results indicated that the use of the Type 3 VTAO is the optimum preventive maintenance measure with the consideration of PCI, BPN, TD, and IRI.

6. Conclusions

We developed a comprehensive evaluation method for identifying the best VTAO among the different combinations of aggregate gradations and asphalt materials. The properties of the materials and the evaluation methods based on AHP and TOPSIS were investigated according to the field test data, which provided a quantitative scope for the impacts of the aggregate gradation and asphalt materials on the road performance. The following conclusions are drawn.
  • According to the field test results, the aggregate gradation of the VTAO and the type of asphalt material significantly affect the road performance of the pavement.
  • The aggregate gradation affects the BPN, TD, and IRI values of pavements. Asphalt mixtures with discontinuous and open gradation (such as SMA and OGFC) provide the VTAO with a good TD. Asphalt mixtures with continuous gradation (such as AC) cause the VTAO to have good BPN and IRI values.
  • The bonding strength of the asphalt materials significantly affects the PCI value of the pavement. SBS-modified and OS-modified asphalt materials have high bonding strengths, allowing the VTAO to resist damage and maintain a good PCI.
  • The weights of the indicators depend on the evaluation objective. As VTAOs are mainly used to improve the condition and appearance of the road surface, specialists focus on the PCI and IRI; therefore, they have larger weights than the other indicators.
  • The comprehensive evaluation results indicated that the VTAO combining AC and SBS exhibited the optimal performance, followed by the SMA and SBS and OGFC and OS mixtures.
  • TOPSIS is effective for solving comprehensive evaluation problems involving multi-magnitude and multi-direction indicators. It is also useful for estimating the weights of evaluation indicators in conjunction with AHP.
  • Limitations: (1) Too few field test data. (2) The sensitivity of important indicators and the superiority of the proposed method need further validation. (3) The proposed method cannot account for the uncertainty of the field test data.
  • Outlook: (1) VTAOs with new materials and new functions are worthy of development and evaluation. (2) Durability and sustainability are also important factors, and related indicators should be considered in future studies. (3) Uncertainty of field test data should also be considered for improvement of the evaluation method.

Author Contributions

Conceptualization, Q.A. and J.H.; methodology, Q.A. and S.D.; validation, J.H. and K.Y.; writing—original draft preparation, J.H. and Q.A.; writing—review and editing, Q.A. and H.W.; visualization, J.H.; funding acquisition, K.Y. All authors have read and agreed to the published version of the manuscript.

Funding

This research was funded by the National Natural Science Foundation of China (grant no. 51808336) and the Shanghai Pujiang Program (grant no. 20PJ1406100).

Institutional Review Board Statement

Not applicable.

Informed Consent Statement

Not applicable.

Data Availability Statement

Data are available upon request to the authors.

Acknowledgments

The kind help from specialists working at Shanghai Municipal Maintenance Management Co., Ltd., is gratefully acknowledged. The first author acknowledges the help of Xu Cai, who works at Guangzhou University.

Conflicts of Interest

The authors declare no conflict of interest.

References

  1. Morian, D.A. Cost Benefit Analysis of Including Microsurfacing in Pavement Treatment Strategies & Cycle Maintenance; No. FHWA-PA-2011-001-080503; Department of Transportation: Harrisburg, PA, USA, 2011.
  2. Yu, H.; Chen, Y.; Wu, Q.; Zhang, L.; Zhang, Z.; Zhang, J.; Miljkoviće, M.; Oeser, M. Decision support for selecting optimal method of recycling waste tire rubber into wax-based warm mix asphalt based on fuzzy comprehensive evaluation. J. Clean. Prod. 2020, 265, 121781. [Google Scholar] [CrossRef]
  3. Jiang, X.; Zhang, M.; Xiao, R.; Polaczyk, P.; Bai, Y.; Huang, B. An investigation of structural responses of inverted pavements by numerical approaches considering nonlinear stress-dependent properties of unbound aggregate layer. Constr. Build. Mater. 2021, 303, 124505. [Google Scholar] [CrossRef]
  4. Ma, Y.; Polaczyk, P.; Park, H.; Jiang, X.; Hu, W.; Huang, B. Performance evaluation of temperature effect on hot in-place recycling asphalt mixtures. J. Clean. Prod. 2020, 277, 124093. [Google Scholar] [CrossRef]
  5. Yu, H.; Zhu, Z.; Zhang, Z.; Yu, J.; Oeser, M.; Wang, D. Recycling waste packaging tape into bituminous mixtures towards enhanced mechanical properties and environmental benefits. J. Clean. Prod. 2019, 229, 22–31. [Google Scholar] [CrossRef]
  6. Watson, D.E.; Heitzman, M. Thin Asphalt Concrete Overlays; No. Project 20-05, Topic 44-07; Transportation Research Board: Washington, DC, USA, 2014. [Google Scholar]
  7. Jiang, X.; Xiao, R.; Bai, Y.; Huang, B.; Ma, Y. Influence of waste glass powder as a supplementary cementitious material (SCM) on physical and mechanical properties of cement paste under high temperatures. J. Clean. Prod. 2022, 340, 130778. [Google Scholar] [CrossRef]
  8. Mattinzioli, T.; Sol-Sanchez, M.; Moreno-Navarro, F.; Rubio-Gamez, M.C.; Martinez, G. Benchmarking the embodied environmental impacts of the design parameters for asphalt mixtures. Sustain. Mater. Technol. 2022, 32, e00395. [Google Scholar] [CrossRef]
  9. Chen, D.H.; Scullion, T. Very thin overlays in Texas. Constr. Build. Mater. 2015, 95, 108–116. [Google Scholar] [CrossRef]
  10. Li, X.; Ye, J.; Badjona, Y.; Chen, Y.; Luo, S.; Song, X.; Zhang, H.; Yao, H.; Yang, L.; You, L.; et al. Preparation and performance of colored Ultra-Thin overlay for preventive maintenance. Constr. Build. Mater. 2020, 249, 118619. [Google Scholar] [CrossRef]
  11. Yu, J.; Chen, F.; Deng, W.; Ma, Y.; Yu, H. Design and performance of high-toughness ultra-thin friction course in south China. Constr. Build. Mater. 2020, 246, 118508. [Google Scholar] [CrossRef]
  12. Lim, J.; Bahadori, A.; Wen, H.; Littleton, K.; Corley, P.; Muhunthan, B. Feasibility of 9.5-mm Stone Matrix Asphalt for Thin Lift Overlays in Washington State. J. Mater. Civ. Eng. 2021, 33, 04021044. [Google Scholar] [CrossRef]
  13. Yu, J.; Yang, N.; Yu, H. Research and application status of high-performance asphalt ultra-thin wearing layer technology. J. Cent. South Univ. (Sci. Technol.) 2021, 52, 2287–2298. (In Chinese) [Google Scholar]
  14. Rahman, F.; Islam, M.S.; Musty, H.; Hossain, M. Aggregate retention in chip seal. Transp. Res. Record 2012, 2267, 56–64. [Google Scholar] [CrossRef] [Green Version]
  15. Luo, X.; Wang, F.; Bhandari, S.; Wang, N.; Qiu, X. Effectiveness evaluation and influencing factor analysis of pavement seal coat treatments using random forests. Constr. Build. Mater. 2021, 282, 122688. [Google Scholar] [CrossRef]
  16. Pan, Y.; Shang, Y.; Liu, G.; Xie, Y.; Zhang, C.; Zhao, Y. Cost-effectiveness evaluation of pavement maintenance treatments using multiple regression and life-cycle cost analysis. Constr. Build. Mater. 2021, 292, 123461. [Google Scholar] [CrossRef]
  17. Sol-Sánchez, M.; García-Travé, G.; Ayar, P.; Moreno-Navarro, F.; Rubio-Gámez, M.C. Evaluating the mechanical performance of Very Thin Asphalt Overlay (VTAO) as a sustainable rehabilitation strategy in urban pavements. Mater. Construcción 2017, 67, e132. [Google Scholar] [CrossRef] [Green Version]
  18. Imaninasab, R.; Bakhshi, B.; Shirini, B. Rutting performance of rubberized porous asphalt using Finite Element Method (FEM). Constr. Build. Mater. 2016, 106, 382–391. [Google Scholar] [CrossRef]
  19. Tayfur, S.; Ozen, H.; Aksoy, A. Investigation of rutting performance of asphalt mixtures containing polymer modifiers. Constr. Build. Mater. 2007, 21, 328–337. [Google Scholar] [CrossRef]
  20. Ye, W.; Jiang, W.; Li, P.; Yuan, D.; Shan, J.; Xiao, J. Analysis of mechanism and time-temperature equivalent effects of asphalt binder in short-term aging. Constr. Build. Mater. 2019, 215, 823–838. [Google Scholar] [CrossRef]
  21. Jiang, W.; Huang, Y.; Sha, A. A review of eco-friendly functional road materials. Constr. Build. Mater. 2018, 191, 1082–1092. [Google Scholar] [CrossRef]
  22. Xu, B.; Li, M.; Liu, S.; Fang, J.; Ding, R.; Cao, D. Performance analysis of different type preventive maintenance materials for porous asphalt based on high viscosity modified asphalt. Constr. Build. Mater. 2018, 191, 320–329. [Google Scholar] [CrossRef]
  23. Xu, B.; Chen, J.; Li, M.; Cao, D.; Ping, S.; Zhang, Y.; Wang, W. Experimental investigation of preventive maintenance materials of porous asphalt mixture based on high viscosity modified bitumen. Constr. Build. Mater. 2016, 124, 681–689. [Google Scholar] [CrossRef]
  24. Jiang, W.; Yuan, D.; Shan, J.; Ye, W.; Lu, H.; Sha, A. Experimental study of the performance of porous ultra-thin asphalt overlay. Int. J. Pavement Eng. 2022, 23, 2049–2061. [Google Scholar] [CrossRef]
  25. Garcia-Gil, L.; Miró, R.; Pérez-Jiménez, F.E. Evaluating the role of aggregate gradation on cracking performance of asphalt concrete for thin overlays. Appl. Sci. 2019, 9, 628. [Google Scholar] [CrossRef] [Green Version]
  26. Ongel, A.; Kohler, E.; Lu, Q.; Harvey, J. Comparison of surface characteristics and pavement/tire noise of various thin asphalt overlays. Road Mater. Pavement Des. 2008, 9, 333–344. [Google Scholar] [CrossRef]
  27. Wang, M.; Wei, J.; Xie, X.; Li, G.; Zhang, H.; Bao, M.; Zhu, X. Composition and Evaluation on Road Performance of SBS/PTW High-Viscosity-Modified Asphalt and Its Mixtures for Ultrathin Overlays. Adv. Mater. Sci. Eng. 2022, 2022, 8644521. [Google Scholar] [CrossRef]
  28. Zhao, Q.; Lu, X.; Jing, S.; Liu, Y.; Hu, W.; Su, M.; Wang, P.; Liu, J.; Sun, M.; Li, Z. Properties of SBS/MCF-Modified Asphalts Mixtures Used for Ultra-Thin Overlays. Coatings 2022, 12, 432. [Google Scholar] [CrossRef]
  29. Saaty, T.L. Decision making with the analytic hierarchy process. Int. J. Serv. Sci. 2008, 1, 83–98. [Google Scholar] [CrossRef] [Green Version]
  30. Lyu, H.M.; Sun, W.J.; Shen, S.L.; Zhou, A.N. Risk assessment using a new consulting process in fuzzy AHP. J. Constr. Eng. Manag. 2020, 146, 04019112. [Google Scholar] [CrossRef]
  31. Lyu, H.M.; Shen, J.S.; Arulrajah, A. Assessment of geohazards and preventative countermeasures using AHP incorporated with GIS in Lanzhou, China. Sustainability 2018, 10, 304. [Google Scholar] [CrossRef] [Green Version]
  32. Lyu, H.M.; Wu, Y.X.; Shen, J.S.; Zhou, A.N. Assessment of social-economic risk of Chinese dual land use system using fuzzy AHP. Sustainability 2018, 10, 2451. [Google Scholar] [CrossRef] [Green Version]
  33. Zavadskas, E.K.; Mardani, A.; Turskis, Z.; Jusoh, A.; Nor, K.M. Development of TOPSIS method to solve complicated decision-making problems—An overview on developments from 2000 to 2015. Int. J. Inf. Technol. Decis. Mak. 2016, 15, 645–682. [Google Scholar] [CrossRef]
  34. Shuai, Q.Y.; He, Y.B. Application of Improved TOPSIS Method to the Evaluation on Asphalt Pavement Performance. Appl. Mech. Mater. 2012, 253, 611–615. [Google Scholar]
  35. Kucukvar, M.; Gumus, S.; Egilmez, G.; Tatari, O. Ranking the sustainability performance of pavements: An intuitionistic fuzzy decision making method. Autom. Constr. 2014, 40, 33–43. [Google Scholar] [CrossRef]
  36. Ministry of Transport of the People’s Republic of China. Technical Specification for Construction of Highway Asphalt Pavements; JTG F40-2004; People’s Communications Press: Beijing, China, 2004.
  37. Ministry of Transport of the People’s Republic of China. Highway Performance Assessment Standards; JTG 5210-2018; People’s Communications Press: Beijing, China, 2008.
  38. Shanghai Pavement Administration Bureau. Technical Regulations for Urban Pavement Maintenance; DG/TJ08-92-2013; Shanghai Code for Engineering Construction: Shanghai, China, 2013. [Google Scholar]
  39. Bian, F.; Cai, H. Choice of crack repairing material for asphalt pavement based on AHP. J. Test. Eval. 2012, 40, 1144–1147. [Google Scholar] [CrossRef]
Figure 1. Structural composition and drainage of the VTAO.
Buildings 12 01149 g001
Figure 2. Gradation compositions of SMA-5, OGFC-5, and AC-5.
Buildings 12 01149 g002
Figure 3. Bonding strengths of the OS-modified and SBS-modified asphalts.
Buildings 12 01149 g003
Figure 4. Schematic of field test sections for the three VTAOs.
Buildings 12 01149 g004
Figure 5. Evaluation procedure of the proposed method.
Buildings 12 01149 g005
Figure 6. Field test data of the three VTAOs. (a) PCI; (b) BPN; (c) TD; (d) IRI.
Buildings 12 01149 g006aBuildings 12 01149 g006b
Table 1. Differences between the three types of aggregate gradations.
NameGradation TypeSkeleton Structure
SMA-5IntermittentDense skeleton
OGFC-5OpenSkeleton gap
AC-5ContinuousSuspension and compaction
Table 2. Properties of the asphalt materials.
Asphalt Material No.ABC
Type of modified asphaltSBSOSSBS
Penetration/0.1 mm (25 °C, 100 g, 5 s)488458
Ductility/cm (5 °C, 5 cm/min)3249111.5
Softening point/°C925690
60 °C dynamic viscosity/Pa·s≥100,000≥100,000150,000
Table 3. Three types of VTAO mixtures.
Type 1Type 2Type 3
SMA-5 + AOGFC-5 + BAC-5 + C
Table 4. Performance of the three VTAO mixtures.
PerformanceType 1Type 2Type 3Specification
Rutting stability at 60 °C [time/mm]16,00062005080≥3000
Kentucky Fort Dispersion Test Loss [%]282.5≤15
Residual stability in the Marshall immersion test [%]948295≥80
Freeze–thaw splitting test residual stability [%]918182≥80
Table 5. Evaluation indicators of road performance.
Evaluation IndicatorImplication
PCIThe PCI reflects the overall severity of the pavement surface defect.
BPNThe BPN is the representative value of the friction coefficient of the road surface under wet conditions.
TDThe TD is the average depth of uneven opening pores in a certain area of the road surface.
IRIThe IRI is the roughness index most commonly obtained from measured longitudinal road profiles.
Table 6. Field test methods for the evaluation indicators.
IndicatorTesting MethodInstrumentOnsite Photographs
PCIManual recording of road surface defectsRuler Buildings 12 01149 i001
BPNMeasurement of friction coefficientPendulum meter Buildings 12 01149 i002
TDSand-paving methodSand Buildings 12 01149 i003
IRIMeasurement of maximum ground clearance3-m ruler Buildings 12 01149 i004
Table 7. The 1–9 fundamental scale.
Intensity of Importance DefinitionExplanation
1Equal importanceTwo activities contribute equally to the objective.
3Weak importance of one over antherExperience and judgment slightly favor one activity over another.
5Essential or strong importanceExperience and judgment strongly favor one activity over another.
7Demonstrated importanceAn activity is strongly favored, and its dominance is demonstrated in practice.
9Absolute importanceThe evidence favoring one activity over another is of the highest possible order of affirmation.
2, 4, 6, 8Intermediate values between the two adjacent judgmentsCompromise is needed.
Reciprocals of above nonzero numbersIf activity i has one of the above non-zero numbers assigned to it when compared with activity j, the value for j is the reciprocal of that for i.
Table 8. Average random consistency indicators.
Matrix Order12345678910
RI000.520.891.121.261.361.411.461.49
Table 9. Weights of the evaluation indicators.
Evaluation IndicatorPCIBPNTDIRI
Weight0.5070.1460.1100.238
Table 10. Raw field test data before TOPSIS.
Evaluation IndicatorPCIBPNTDIRI
Indicator typeMaximumMaximumIntervalMinimum
Should be normalized?NoNoYesYes
Formula--Equation (14)Equation (12)
Filed test data after normalization
Type 19257.50.640 0.211
Type 290560.600 0.206
Type 391690.000 1.284
Note: According to the specification [36], [a, b] of TD is [0.8, 1.2] and [a*, b*] of TD is [0.55, 1.4].
Table 11. Intermediate TOPSIS calculation results.
Evaluation IndicatorPCIBPNTDIRI
Z + 0.5840.652 0.730 0.973
Z 0.5710.529 0.000 0.161
w j 0.5070.146 0.110 0.238
Table 12. Closeness results for the three VTAOs.
Evaluation IndicatorType 1Type 2Type 3
D + 0.3970.40.242
D 0.2420.2260.399
Closeness0.3780.3620.623
Publisher’s Note: MDPI stays neutral with regard to jurisdictional claims in published maps and institutional affiliations.

