Article

Assessment of Performance Indicators of a Large-Span Reinforced Concrete Arch Bridge in a Multi-Hazard Environment

by
Marija Kušter Marić
*,
Ana Mandić Ivanković
,
Mladen Srbić
and
Dominik Skokandić
Department for Structures, Faculty of Civil Engineering, University of Zagreb, 10 000 Zagreb, Croatia
*
Author to whom correspondence should be addressed.
Buildings 2022, 12(7), 1046; https://doi.org/10.3390/buildings12071046
Submission received: 15 June 2022 / Revised: 7 July 2022 / Accepted: 16 July 2022 / Published: 19 July 2022

Abstract

:
Assessment of a single bridge and management system for all bridges in the network is still a major challenge, although much research has been carried out and implemented in existing networks over the last four decades. This paper presents a case study of a long-span arch bridge, the Maslenica Motorway Bridge, located in a multi-hazard maritime environment. Although special attention was paid to durability during design, the bridge required repair after 20 years of operation. The analysis includes an overview of the design project, structural health monitoring during construction and operation, numerous laboratory and in-situ testing, numerical analysis of structural capacity and remaining service life, and meteorological monitoring of the bridge site. A new approach to bridge assessment is presented that includes not only a deterioration index, but five groups of key performance indicators: (1) safety, reliability, and security; (2) availability and maintainability; (3) costs; (4) the environment; and (5) health and politics. Incorporating all available data and evaluating various aspects of bridge performance provides greater insight into the condition of the bridge, not only at the structure level but also at the network level. The method is applied to the reinforced concrete arch bridge in a harsh maritime environment and evaluation is provided based on the comprehensive data analysis. The key performance assessment procedure and lessons learned from this case study can be applied to a wide range of structures.

1. Introduction

Assessment of a single bridge and a management system for all bridges in the network is still a challenge, although much research has been carried out and implemented in existing infrastructure networks over the last four decades [1]. Most standard bridges in the road or rail network are assessed based on visual inspection. However, a visual inspection can be subjective and depends heavily on the experience of the inspector [2]. Most damage and material deterioration, such as corrosion of reinforcement in concrete, can only be detected by visual inspection at an advanced stage, when it is too late for proactive bridge management [3]. Moreover, a visual inspection cannot provide all the necessary information, e.g., an assessment of bearing capacity. Indeed, most bridges in Western Europe and North America were built in the second half of the 20th century with a much lower standard load than that foreseen by current traffic and seismic standards [4].
On the other hand, bridges with large spans or structures of high strategic importance usually have a longer service life and an extended assessment that includes not only a visual inspection but also several in-situ and laboratory tests, structural health monitoring, and optionally, a numerical analysis of the structural assessment, remaining service life and life cycle cost [1]. However, most of the published research papers address only one or a few aspects: e.g., structural assessment of bearing capacity in the combination of numerical analysis and experimental testing [4,5], experimental testing of a specific structural element or detail [6,7,8,9], evaluation and effectiveness of non-destructive testing [3,9,10], analytic models on failure modes [11], and numerical and experimental analysis of the main degradation mechanisms [12,13,14]. A comprehensive assessment of road bridges is included in [1], but in this case, the assessment is based on visual inspection and standard bridges of small and medium spans are analyzed.
Therefore, a long-span arch bridge carrying a highway over a windy sea channel was chosen for this case study. The Maslenica Bridge [15] has a very important strategic location and for ten years it was the only road connection between the mainland and the southern coastal part of Croatia. On the other hand, the location of the bridge is characterized by a very harsh maritime environment. Therefore, it is important to monitor and evaluate the structure throughout its lifetime since its construction. The analysis includes an overview of the design project, structural health monitoring during construction and operation, numerous laboratory and in-situ testing, numerical analysis of structural capacity and remaining service life, and meteorological monitoring of the bridge site.
Although the bridge was been extensively monitored, tested, analyzed, and inspected during the first 20 years of service, only two types of assessment had been applied by the road authority: qualitative methods and the worst-conditioned element approach.
Three visual inspections of the bridge are provided prior repair and condition is assessed only qualitatively: “The bridge is in relatively good condition, but signs of deterioration have been noted in some elements that should be repaired because they may affect the load-bearing capacity and usability of the bridge in the long run”. Hence, such qualitative bridge assessment is therefore common for all bridges in the network and does not lend itself to prioritization of repairs in the network.
Therefore, a new weighted average approach for qualitative bridge assessment is developed and presented in this paper. Based on the comprehensive data analysis, the bridge is evaluated in groups of five key performance indicators: (1) safety, reliability, and security; (2) availability and maintainability; (3) costs; (4) the environment; and (5) health and politics.

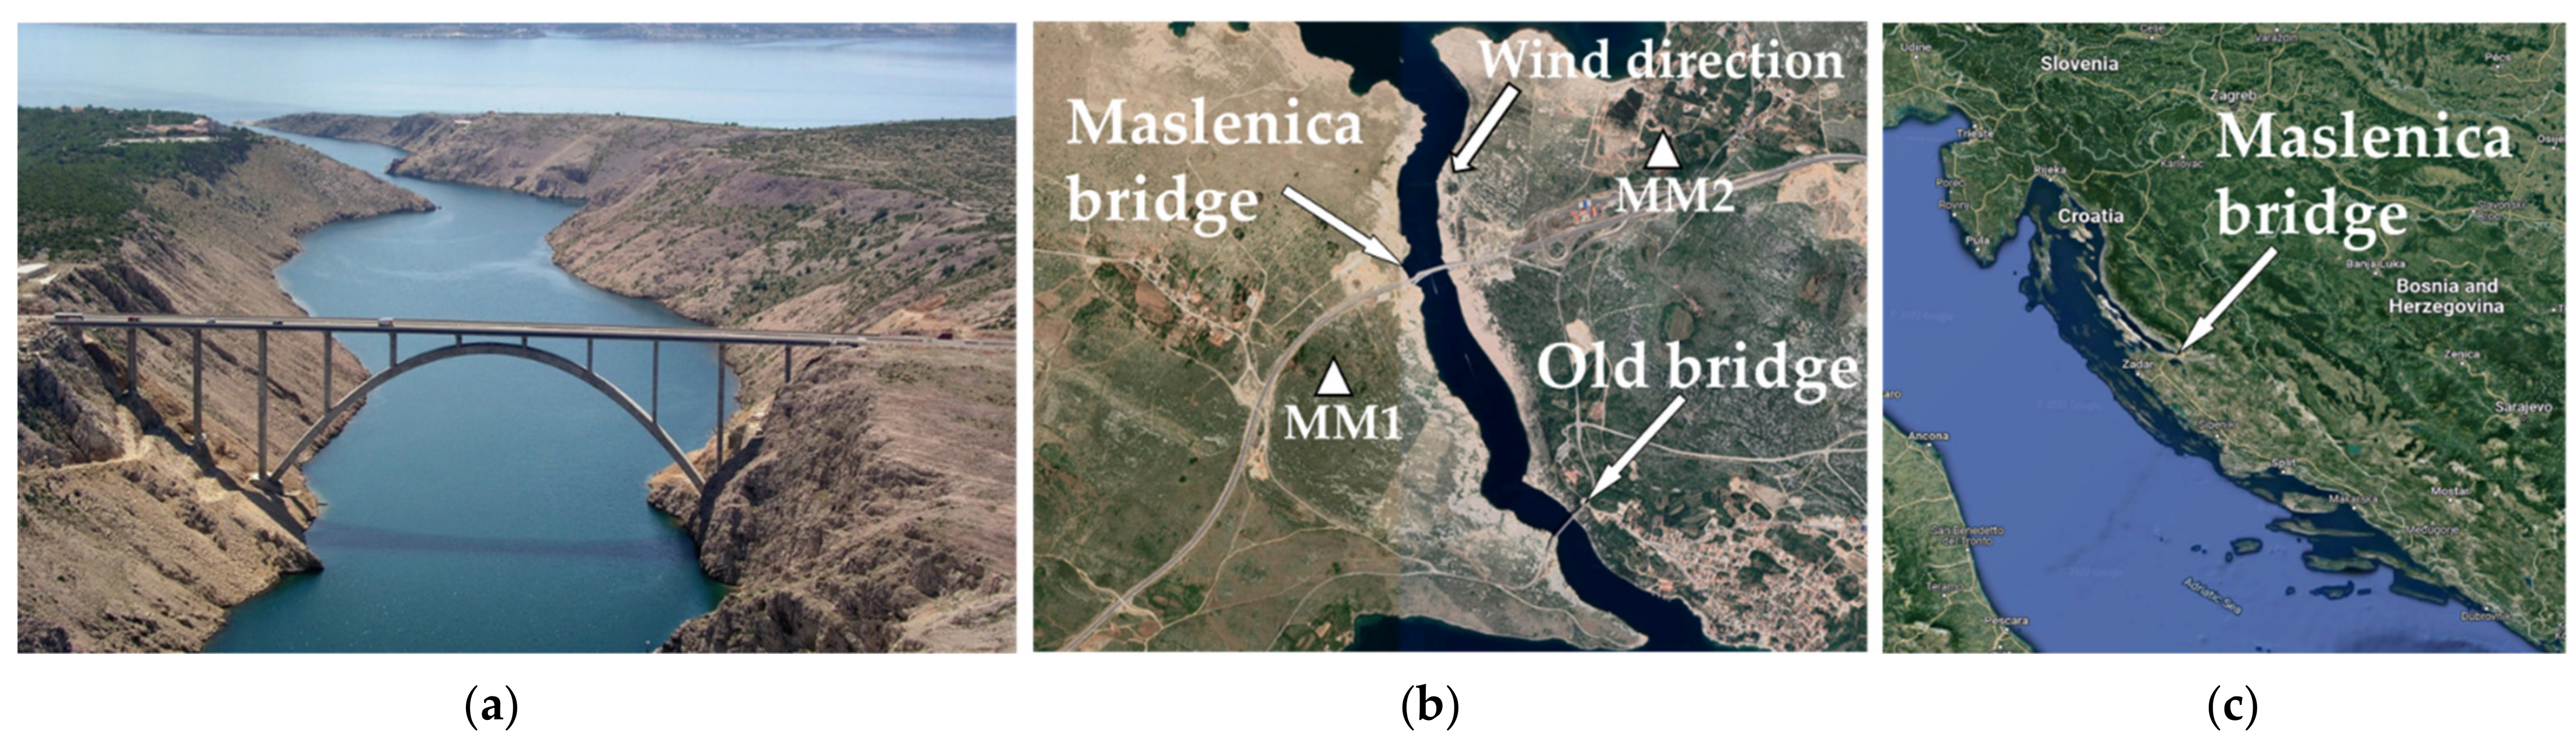
2. Description of the Case Study

The old Maslenica Bridge, built in 1961, was the only road link across the Maslenica Strait, connecting the mainland and the coastal region of Croatia. However, this steel arch bridge was destroyed in 1991 during the Homeland War. Since the only road connection between the north and south of Croatia was destroyed, a pontoon bridge built by the Croatian Army served as a temporary connection [15]. Meanwhile, the Croatian Road Authority made decision to build a new highway, the first part of which was the new Maslenica Bridge (Figure 1). The concrete arch bridge, proposed by the Chair of Bridges at the Faculty of Civil Engineering University of Zagreb, was selected among six alternative preliminary designs [15]. The Maslenica Bridge has a wide concrete superstructure and a narrow fixed reinforced concrete arch with a span of 200 m and a rise of 60 m (Figure 1).The superstructure consists of eight single-span, post-tensioned precast girders connected by a concrete deck slab cast on site over 12 spans: 6 + 10 × 30 + 24 = 350 m. The superstructure width is 21.42 m and provides four lanes, a median, and safety strips adjacent to the concrete safety barriers on both sides [15,16,17,18,19,20]. Two expansion joints are provided at the abutments, while longitudinally movable bearings are located at both abutments and the piers closest to the abutments. Fixed bearings are located on the two piers near the crown of the arch, while all other piers are fixed to the superstructure [15,16,17,18,19,20]. The bridge piers of a box-shaped cross-section consist of two individual piers connected at the top by a header beam. The bridge is founded on a solid rock foundation [15,16,17,18,19,20]. The bridge design is based on the German standard DIN 1072, while the seismic loading was modelled according to the European preliminary standard, since an adequate complete system of Croatian building codes did not exist at that time [15,16,17,18,19,20]. The Maslenica Bridge is located in a very aggressive maritime environment characterized by the following factors: high salinity of the sea with an average value of 38.5‰, strong winds with maximum gusts of up to 69 m/s, wind-driven spray, several freeze–thaw cycles per season, and high temperature gradients [15,16,17,18,19,20].
Since aggressive environmental conditions have significantly accelerated the deterioration of older arch bridges on the Croatian coast, special attention was paid to durability in the design of the new Maslenica Bridge [15,16,17,18]: (i) structural details and the cross-section were simplified to minimize execution problems and increase construction quality; (ii) all structural dimensions were increased compared to previously built concrete arch bridges on the Adriatic coast; (iii) concrete with better durability performance was used, with low permeability and a water–cement ratio w/c of less than 0.40; (iv) the minimum thickness of concrete cover was 10.0 cm for the arch abutments and 5.0 cm for other structural elements; (v) most of the piers are fixed to the superstructure, while expansion joints are only located at the abutments, so the number of structural joints was kept to a minimum; and (vi) the monitoring system was used during construction, load testing and bridge operation.
The quantities of construction materials for the Maslenica Bridge are shown in Table 1, while the concrete mix is shown in Table 2 (data from [20]).
The construction of the bridge started in 1993, two months after the military operation to liberate the occupied territories, and the construction site was within the range of the insurgents’ artillery throughout the year. Therefore, the bunkers had to be built first, and then access and resources had to be provided [19]. In addition, due to the inaccessible terrain, access roads to the bridge site and foundations had to be built, which were over 15 km long. The arch was constructed using the free cantilever method in only 11 months, including a 2-month interruption due to strong bora winds. All erection phases were numerically calculated. Immediately prior to the closure of the arch, a relatively strong earthquake occurred, with the epicenter very close to the bridge site, which did not affect the bridge structure. The piers on the bank were constructed using climbing formwork [15,19]. The bridge has been open to traffic since 1997.
The damage caused by chloride-induced corrosion has already spread significantly in the first two decades [3,21], and the bridge was repaired in 2018.
Depending on the results of the corrosion risk assessment, two types of repair solutions are applied. The most damaged elements in the propagation stage of corrosion, such as the portal piers P3 and P10 up to a height of 20 m and the arch foundation, are completely rehabilitated. Rehabilitation includes hydrodynamic removal of the existing concrete layer up to 2 cm deeper than the reinforcement. If the existing reinforcement is less affected by corrosion (reduction in the cross-section of less than 20%), the rebars are cleaned. If the existing reinforcing bars are severely corroded and the reduction in the cross-sectional area is 20% or more, they are removed and replaced with new reinforcing bars anchored in sound concrete. A new layer with steel microfibers is then applied and the concrete cover depth is increased to 7 cm [3,21].
Structural elements where corrosion is considered to still be in its initial phase (arch, outer main girders, all columns except those at the arch springing up to 35 m above sea level) are treated locally. The damaged concrete is removed using a hydrodynamic method and repaired with repair mortar under high pressure [3,21].
Finally, all exposed elements are provided with a surface protection that includes corrosion-inhibiting impregnation and a protective elastomeric coating [3,21].

3. Methods

During the twenty years of operation, the following methods and measurements were carried out on the Maslenica Bridge (Table 3):
  • Structural health monitoring (SHM);
  • Non-destructive testing (NDT);
  • Laboratory tests on samples taken from the structure;
  • Numerical analyses using the finite element method (FEM);
  • Meteorological monitoring.
Prior to the repair of the structure, three major visual inspections were conducted: in 2006, 2010, and 2012. In 2006, visual inspection, in-situ measurements, and laboratory testing were conducted only on the northern half of the bridge [22], while in 2010 the investigation work was extended to the entire structure [23], and in 2012 additional measurements were conducted prior to the reconstruction project [21]. Post-repair visual inspection was carried out in 2018 when non-destructive testing was performed on the elements that were neither included in the repair nor protected by a coating [3].

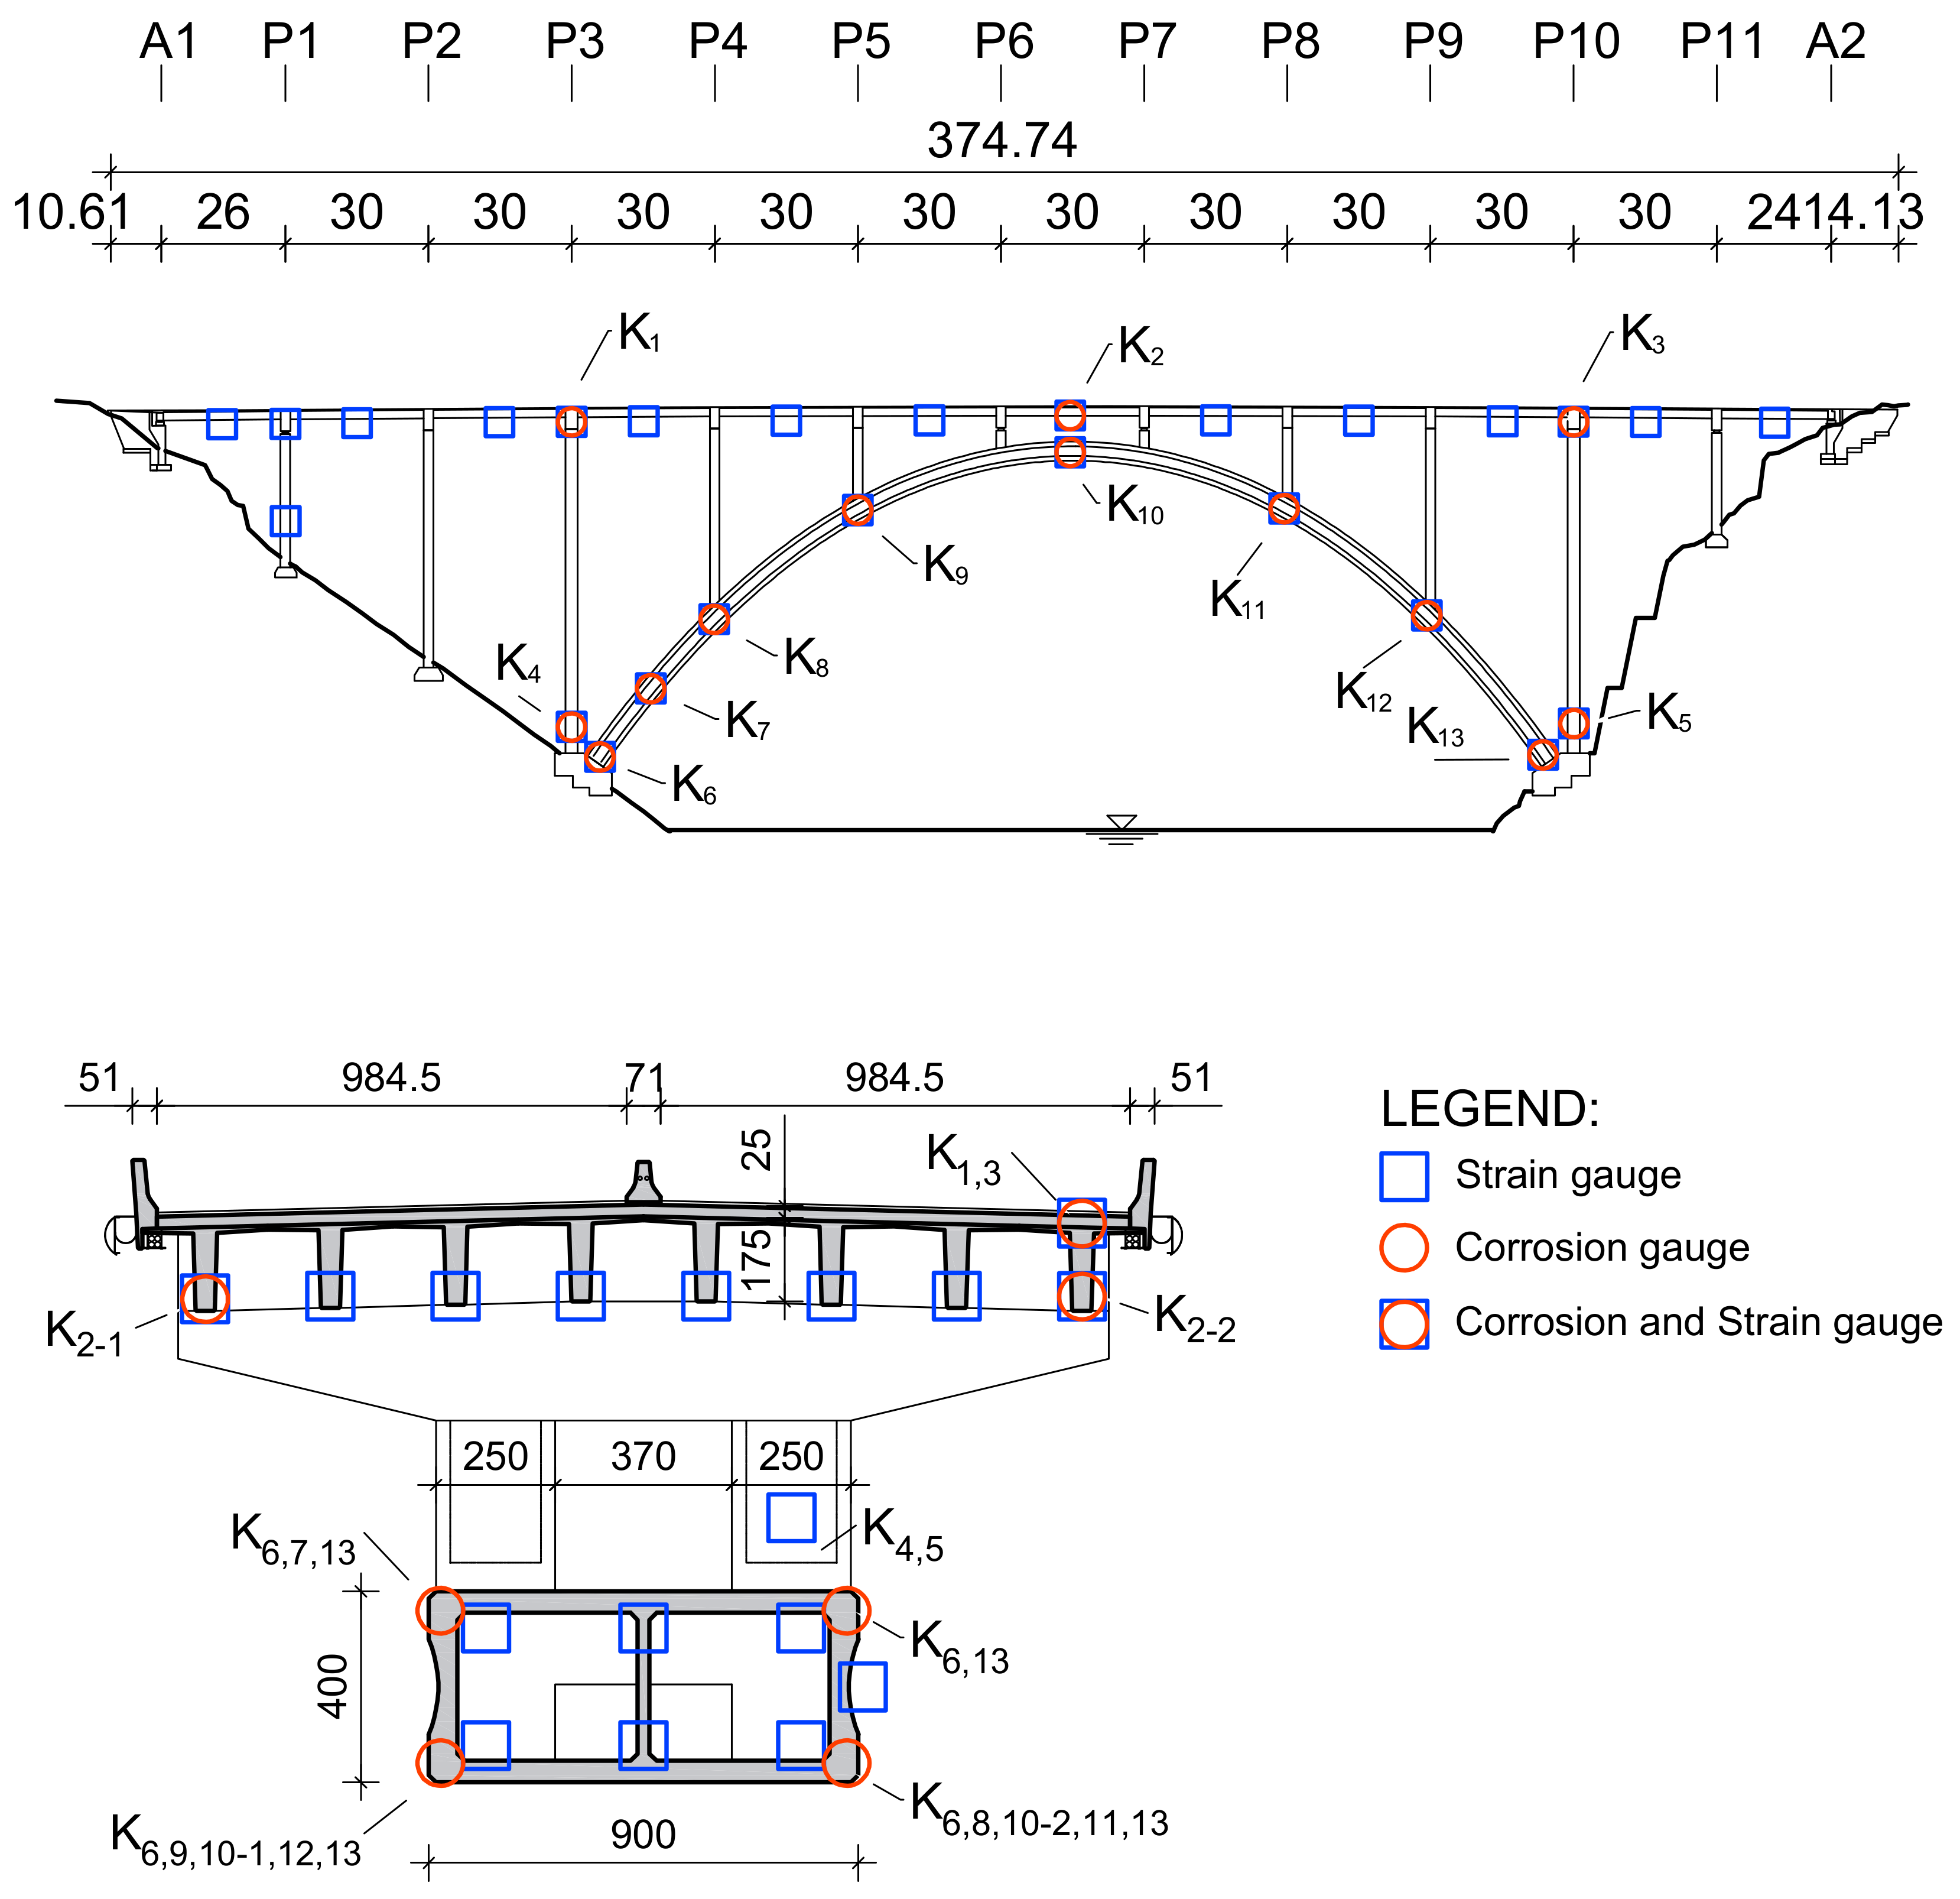
3.1. Structural Health Monitoring

The structural health monitoring (SHM) system was applied for the first time in Croatia on the Maslenica Bridge [24]. The application of the SHM aimed to prevent problems related to the construction and durability that occurred in older Adriatic RC arch bridges [13]. The SHM during construction aimed to prevent geometric instability of the bridge due to long-term deformation of the concrete (creep). Corrosion monitoring is installed to warn of the early stages of degradation before the corrosion of the reinforcement can be confirmed by visual inspection.
The installed monitoring system included (Figure 2):
  • Ninety-two strain gauges (18 on the concrete and 74 on the reinforcement);
  • Forty temperature sensors;
  • Twenty-one corrosion sensors (anode-ladder);
These were placed at carefully selected locations on the arch and girders of the superstructure (Figure 2).
The monitoring system was used to record the relative strains and accelerations in the different construction phases and during the load tests before the opening of the bridge to traffic, in order to calculate the stresses, velocities, and displacements [24].
Monitoring of environmental parameters such as air temperature, humidity, wind speed, and direction was also provided. The corrosion monitoring system was introduced, which measures the corrosion current density, the electrochemical potential of the anode, as well as the temperature and electrolytic resistance of the concrete. The corrosion sensor consists of an anode conductor with 6 black steel rebars (A1 to A6) serving as anodes and a titanium oxide rebar serving as a cathode. The conductors are installed at angle and cover the entire depth of the concrete cover: the anode A 1 is the closest to the surface, while the anode A6 is at the level of the reinforc11ement [24,25].
Unfortunately, the monitoring control was stopped shortly after the bridge was opened to traffic due to a lack of funds. The SHM is not adequately managed, namely, some of the measurement boxes of the sensors are completely degraded due to the action of wind and salt from seawater. However, during investigation work in 2014, nine out of thirteen corrosion sensors were found and repaired so the new measurements were subsequently recorded [25].

3.2. Non-Destructive Testing (NDT)

The condition survey in 2006 included the following NDT: detailed visual inspection of the northern half of the bridge and in-situ measurements of concrete cover depth [22]. The detailed visual inspection in 2010 and 2012 included the whole structure, while NDT in 2018 included elements that were not treated during repair [3,21,23].
A mobile inspection unit was used for inaccessible locations, e.g., side and bottom parts of the superstructure and the arch. Visual inspections were performed according to the protocol defined in the Maslenica Bridge Maintenance Manual and all defects and damages were recorded in detail [22,23].
As part of the rehabilitation design, additional NDT measurements were carried out in 2012 to determine the scope of the repair works [21].
In 2018, NDT was performed on the upper part of the pier P2 foundation and exposed to airborne chloride, which was not included in the repair nor protected by a coating [3].
A cover meter is used during onsite bridge testing to determine: (i) the location of the reinforcement, (ii) the depth of concrete cover, and (iii) the bar sizes [3]. Determination of the location of rebar also serves as a preliminary test for another form of testing, in which the reinforcement should be avoided or its presence should be considered, e.g., measurements of ultrasonic pulse velocity, half-cell potential, and concrete electrical resistivity [3].
The crack width is measured with a ruler (crack width rod) and optical microscope, while crack depth is estimated with an ultrasonic pulse velocity device according to the standard HRN EN 12504-4:2004 [26].
The Schmidt hammer is used to assess the uniformity of concrete and to determine the potential areas of poor quality. Since the compressive strength is also determined on concrete core samples taken from the same locations, a correlation function is used to calculate the characteristic strength of concrete based on the Schmidt hammer test [3].
The half-cell potential is measured according to the ASTM C876-09 standard [27] using a Cu/CuSO4 reference electrode two times: in 2012 and 2018. The measurements before the repair in 2012 included all groups of structural elements (piers, foundations, the arch, and main girders), while post-repair measurements were focused on a large surface of the pier’s P2 foundation [3].
The measurement of the surface electrical resistivity of concrete is based on the Wenner probe technique with alpha configuration, where four electrodes are in contact with the concrete surface. The small current I (A) is passed between the two outer probes, while the potential difference ∆V (V) is measured between two inner probes and the electrical resistivity ρ (Ωm) is determined [3].

3.3. Laboratory Testing

Compressive concrete strength was tested on 14 samples in 2006 and on 16 samples taken from piers, the arch, and foundations in 2012, according to the valid codes EN 12504-1:2009 [28] and EN 12390-3:2009 [29]. Additionally, in 2006, secant modulus of elasticity was tested on four samples according to EN 12390-13:2013 [30].
The test of gas permeability of concrete is carried out by measuring the gas flow under pressure at a given time, according to the standard EN 993-4 [31]. Gas permeability was tested on five samples taken from piers and foundation in 2006 and on 10 samples taken from all groups of structural elements (piers, foundation, the arch, and main girders) in 2012.
Capillary absorption of concrete was tested on 20 samples taken from piers, foundations, and the arch in 2012 according to the code EN ISO 15148:2004 [32].
Carbonatization depth was tested on 16 samples taken from piers, the arch, and foundations in 2012 according to the codes EN 14630:2007 [33].
The chloride content in concrete samples taken from the structure was determined three times before repair: in 2006, 2010, and 2012, using two comparable and compatible methods: the rapid chloride test (RCT) according to German instruments [34], used in 2006 and 2012, and the standard Volhard titration method according to the European standard EN 14629:2007 [35], used in 2010 and 2012. In 2006, the chloride content in the concrete was determined on 14 samples taken from different positions of piers and exposed parts of their foundations, while testing in 2010 and 2012 was extended to 24 and 16 samples, respectively, taken from all structural elements: piers, exposed parts of piers foundations, the arch, and main girders.
The chloride diffusion coefficient was determined twice: (i) the first time on concrete samples as a part of the initial testing in 1996, during bridge construction, achieving a non-steady-state diffusion process according to the standard NT BUILD 443 [36], and (ii) the second time in 2012, on samples taken from the bridge piers, arch and arch abutments using the non-steady-state migration test according to the standard NT BUILD 492 [37].

3.4. Numerical Analysis

The Maslenica Bridge was assessed under the framework of the long-term research project on the structural assessment of existing bridges. Linear and nonlinear analyses were performed using the finite element method. As the bridge was designed before the introduction of the current European standards, the superstructure is assessed on the traffic load, while the arch is assessed on the seismic action and wind load according to the current standards. During the bridge design, the service life is predicted using a mathematical model based on Fick’s second law to select an optimal concrete mixture and to achieve a service life of 100 years [38].
Measured chloride profiles after 13 years of exposure are compared with numerical results using two service life prediction models: the Life-365 and the 3D chemo-hygro-thermomechanical (CHTM) model [39,40]. The Life-365 model calculates chloride penetration into uncracked concrete according to Fick’s second law, assuming diffusion as the dominant transport process, where the chloride diffusion coefficient is time-dependent and is determined based on the concrete mixture [41]. The 3D CHTM model is more comprehensive and describes chloride transport in concrete as diffusion, convection, and physical and chemical binding by cement paste. The model is simulated in a 3D domain and uncracked and cracked concrete are considered, while the diffusion coefficient depends on the concrete mixture and is a function of the crack width [13,14,42].

3.5. Meteorological Monitoring

Two meteorological stations are located near the bridge, one on each bank, MM1, and MM2, located at abutments A1 and A2, respectively. Analysis of the flow regime (wind speed and frequency) is carried out based on measured data from 1998 to 2002 [43].

4. Results and Discussion

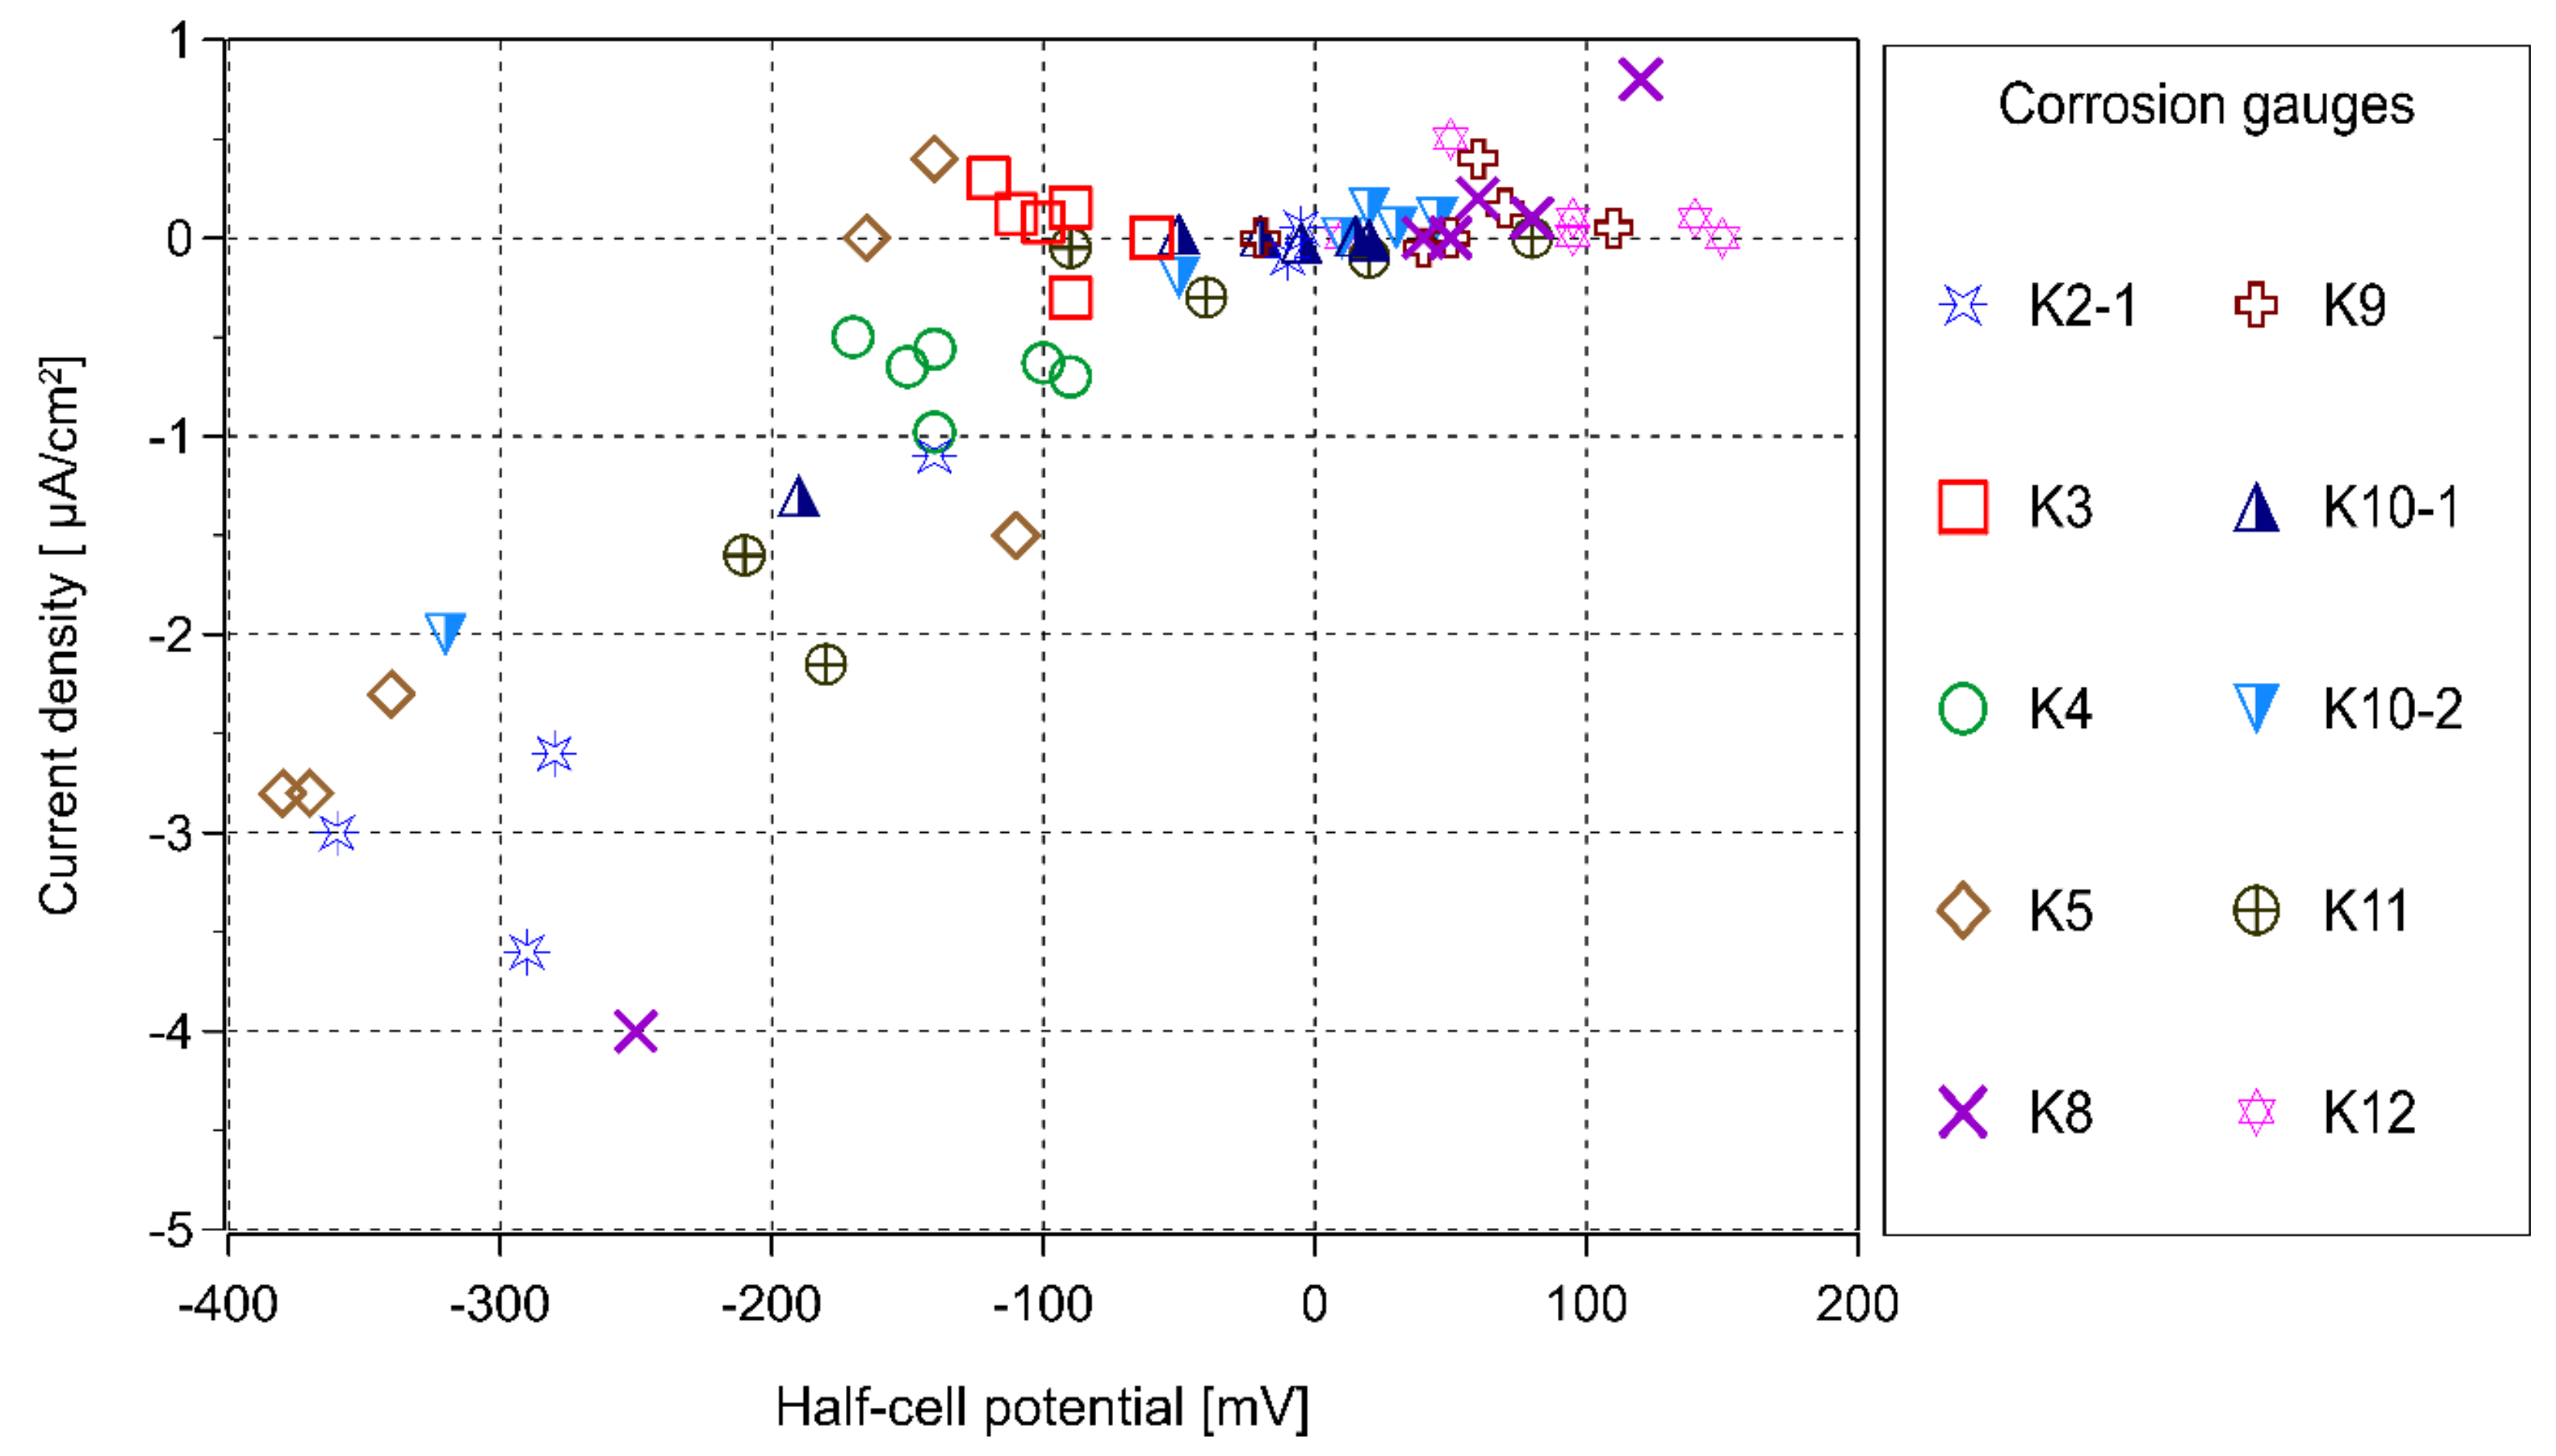
4.1. Strain Monitoring during Construction and In-Service Corrosion Monitoring

Monitoring during construction showed that the stresses and strains in each construction stage were consistent with the numerical analysis and that there were no excessive creep deformations, as was the case in the construction of older RC arches. The only deficiency identified during construction monitoring was the significant shrinkage of the concrete on some elements as a result of the intensive hardening process combined with the specific maritime environment, e.g., high temperature and low humidity (less than 50%) [24]. Cracks due to concrete shrinkage were later confirmed by visual inspection and NDT.
The corrosion monitoring results obtained in 2014 after the repair and recommissioning of the corrosion measurement devices are shown in Figure 3 [25]. Six values of electrical potential and current density were recorded for each sensor. The electrical potential ranges from +100 mV to −400 mV, while the current density varies from 0.7 µA/cm2 to −4.0 µA/cm2. The lowest corrosion risk with the lowest absolute values of corrosion rates and half-cell potential in all six measured depths was observed at the following three sensors: K3, on the top of the main girder; and K9, and K12, on the bottom part of the arch at 65 m and 40 m above sea level. The highest risk of corrosion is observed at the locations with the lowest values of half-cell potentials (≤−250 mV) and current densities (≤−2.0 µA/cm2): at the lower part of the main girder (K2-1) and arch (K10-2) at the position of the arch crown (more than 70 m above sea level), at the lower part of the portal pier P10 (K5), and at the lower part of the arch (K8) at pier P8. At the lower part of the arch crown (K10-2) and the arch segment 40 m above sea level (K8), a lower half-cell potential and current density were measured only at the anodes closest to the concrete surface, while the current densities at deeper layers of the concrete cover were negligible. However, 10 m above the arch crown, on the lower part of the main girder (K2-1), and the lower part of the portal pier P10 (K5), high current densities were detected, even in deeper concrete layers [25].
The repaired sensors installed on the arch (K8-K12) measured different values of current density and half-cell potential. A negligible corrosion risk on the arch was observed at sensors K9 (east coast, 50 m a.s.l.) and K12 (west coast, 20 m a.s.l.), while the most unfavorable values for reinforcement corrosion were measured at sensors K8 (east coast, 30 m a.s.l.) and K10 (at the arch crown, 70 m a.s.l.).
Sensors K3 and K2-1 are located on the superstructure; while sensor K-3 on the upper part at the pier P10 measured the minimum values of current densities, sensor K2-1 on the bottom part of the girder above the arch crown showed a significantly higher risk for corrosion. At almost the same height above sea level, different corrosion rates were measured at the main girders. Therefore, no correlation with the height above sea level can be established.
The reason for this phenomenon is specific microclimate conditions. The dominant bora wind blows from the mountains to the open sea (generally from a NE or NNE direction), but because of the deep and narrow strait, the wind changes its direction. This is especially significant for the west coast, where the MM2 meteorological station is located. The wind rose showed that the wind frequency and speed are almost uniformly distributed along the 16-wind compass rose, in contrast to the wind rose measured by the MM1 meteorological station on the east coast (more details are presented in the Section 4.5).

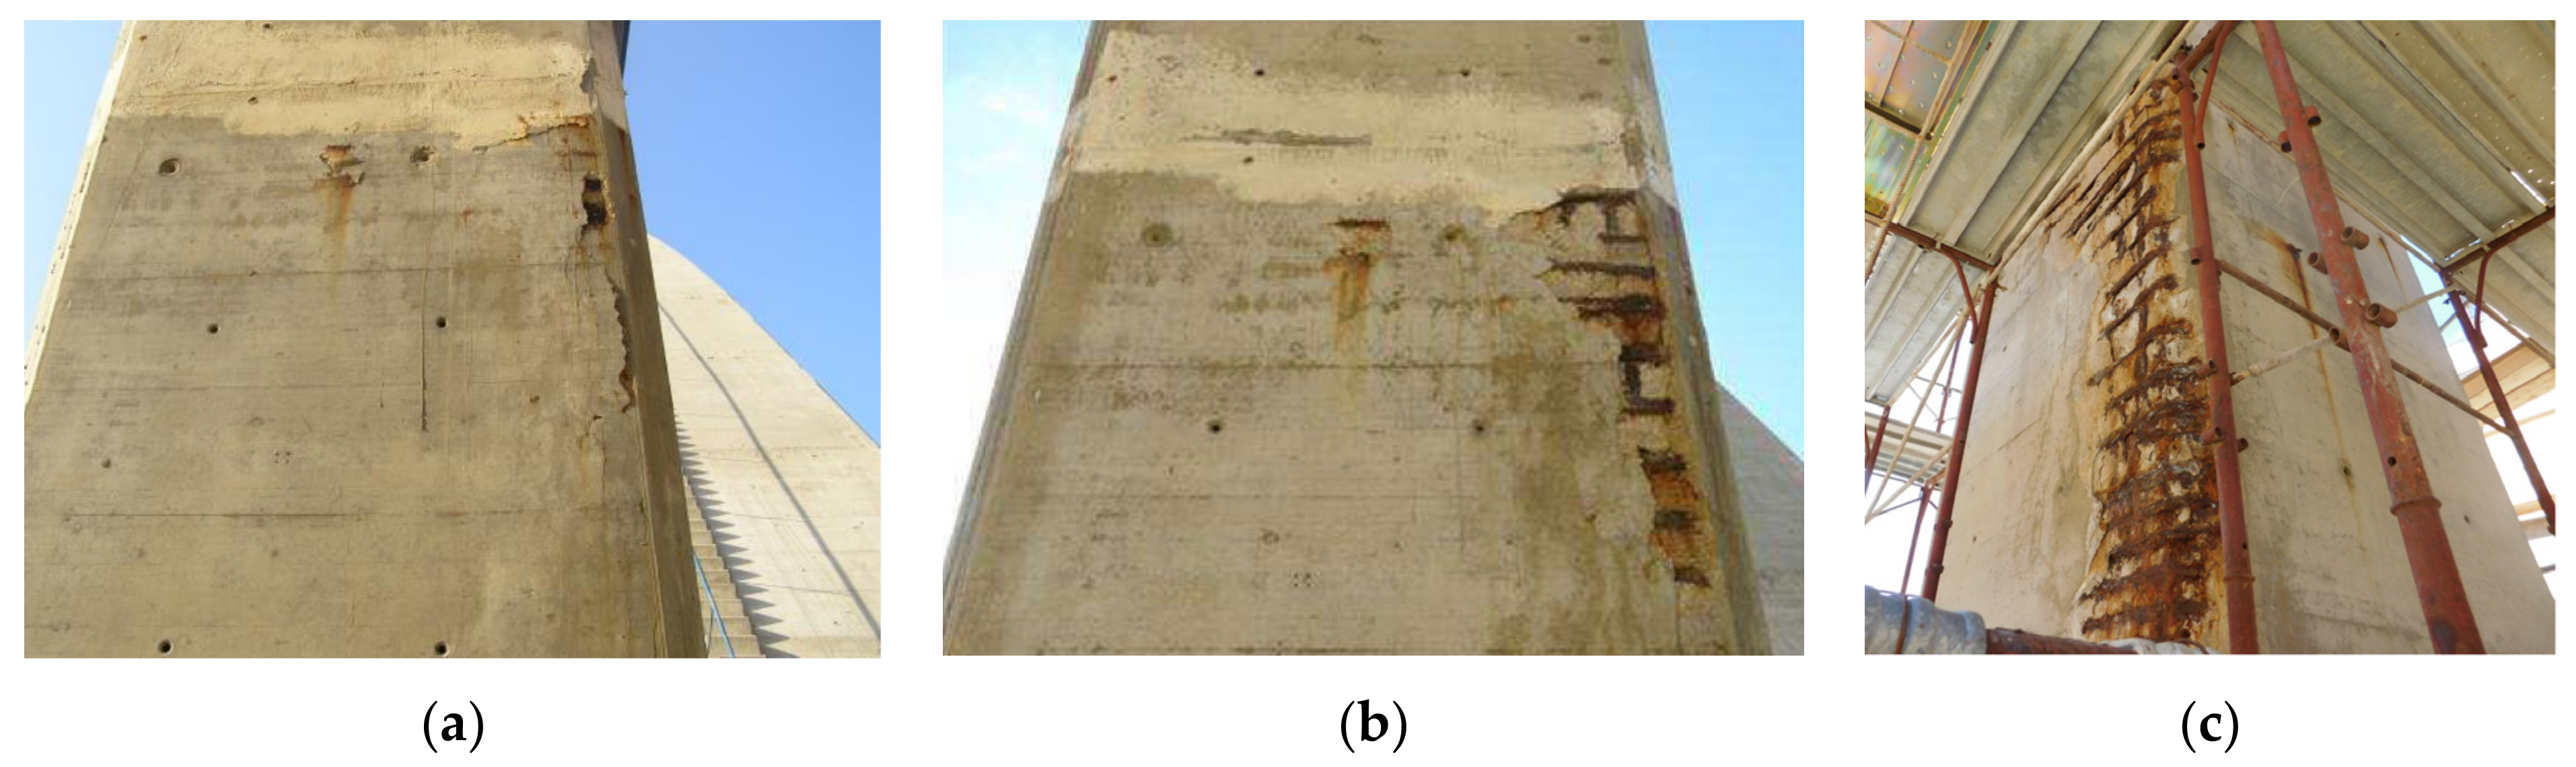
4.2. Results of Visual Inspection

A visual inspection in 2006 revealed corrosion-related damage to piers, piers foundations, the arch, and abutments (Figure 4a). In addition to the maritime environment, the causes include inadequate concrete cover, poor construction quality, and lack of maintenance [22]. Besides cracks generated during or immediately after construction, structural cracks and concrete layering were observed on the pier P2. The worst damage was found on pier P3, especially on the surface exposed to the NE bora wind. There was no significant visible damage to the abutments and the lower part of the superstructure, but there was water leakage through the expansion joint [22].
A detailed visual inspection in 2010 and additional testing in 2012 confirmed further deterioration of the bridge (Figure 4b). Defects during construction and water leakage through the expansion joint were noticed on the abutments. Piers, particularly those above the arch abutments (P3 and P10) were in the worst condition and need repair. There were defects during construction, cracks, and delamination of concrete cover. Similar damage, but at a lower level, was noted on the exterior surface of the arch. Rainwater was seeping through the built-in openings in the arch boxes, while the stairs for inspection were completely damaged. Insufficient concrete cover and corrosion-induced damage was also noticed on the arch abutments [23]. On the main girders, a protective coating was damaged, while other defects were localized. The asphalt pavement was damaged and deteriorated, as it was not renewed after the opening of the bridge. There was also minor damage to the concrete safety barrier. Bridge drainage and cornices were in relatively good condition, but the protective coating was deteriorated [23].
A post-repair visual inspection was conducted in 2019 [3]. The surface protection of the structural elements was well executed and no defects were found on the repaired parts. The upper parts of the foundations of the piers P1, P2, and P11, which are exposed to airborne chlorides, were not included in the repair in 2018, and few surface defects (e.g., cracks in the concrete and brown spots) were observed. The detected cracks were 0.1–0.2 mm wide and 602 −730 mm long, while the depth was equal to or higher than the concrete cover, whose average value for this measuring location was 44 ± 3 mm.
Unfortunately, it was a poor decision by the designer not to include these pier foundations in the repair. As can be seen in Figure 4, the structural element corrodes rapidly once active corrosion of the reinforcement begins. Only 11 years have passed since the first visible signs of corrosion (brown spots, Figure 4a) to the spalling of the concrete cover and the reduction in the reinforcement cross-section (Figure 4c).

4.3. Results of NDT and Laboratory Testing on Samples Taken from the Structure

The results of the most common tests, which have been carried out repeatedly, are given in Table 4. The compressive strength of the concrete, tested on specimens in 2006 and 2012, is above the designed values and belongs to concrete class C 50/60 [44,45] (Table 4). The values of compressive strength tested with the Schmidt hammer in situ are in good agreement with the laboratory results. The modulus of elasticity E = 33277.75 ± 476.01 MPa is also higher than the value reported in the design. Concrete cover depth, measured in 2006 and 2012, varies widely from 31 mm to 79 mm, with the average value for all structural elements of 48 ± 12 mm. The smallest concrete cover is executed on piers, while the greatest thickness of the concrete cover is measured on the arch.
The gas permeability coefficient of the concrete at the piers, measured in 2006, varies from 1.4 × 10⁻¹⁶ m2 to 4.2 × 10⁻¹⁶ m2 (Table 4). The same parameter measured in 2012 in different groups of elements gave more variable results with an average value of 9.47 × 10⁻¹⁶ m2 and a standard deviation of 8.41 × 10⁻¹⁶ m2. However, both measured values are above the value of 1.0 × 10⁻¹⁶ m2, which is considered a critical value representing vary high gas permeability unfavorable for the structure in the marine environment.
The capillary absorption of concrete tested on 20 samples in 2012 has an average value of 0.660 ± 0.231 kg/m2h1/2. Absorption of concrete suggests that the concrete is of poor quality in terms of penetration of aggressive environmental substances, e.g., seawater.
The carbonation depth measured on 16 samples in 2012 varied from 2 to 12 mm, with an average value of 3.6 ± 2.9 mm. Since the average concrete cover is 48 ± 12 mm, the measured depth of reduced concrete alkalinity indicates a very low risk of carbonation.
Determination of chloride content in concrete in 2012 is provided using both methods: the rapid chloride test (RCT) according to German instruments [34] and the standard Volhard titration method according to the European standard EN 14629:2007 [35] in order to evaluate differences. Chloride content determined according to the standard EN 14629:2007 [35] is 14.6–18.2% lower than the chloride content determined with the rapid chloride test at the chloride content of 0.4% of concrete mass, while for smaller chloride concentrations, the differences can be neglected. Since the threshold chloride concentration for the Maslenica Bridge is determined to be 0.05% mass of concrete, the results of both methods can be treated equally.
Testing in 2006 showed that the threshold chloride content of 0.4% of the mass of cement or 0.05% of the mass of concrete had been reached at the reinforcement level on 10 of the total of 14 measuring locations on piers and exposed parts of the pier foundations. More extensive results were obtained four years later, showing that the measured locations on girders, piers, the arch, and pier and arch foundations, exposed to the dominant bora wind from the north, reached the threshold chloride value at the reinforcement level; however, on the opposite sides of the same structural elements, sheltered from the wind, chloride content at the reinforcement level was low, on average 0.01% of the concrete mass. Measurements in 2012 were focused on the most vulnerable surfaces on piers, the arch, and pier and arch foundations. On all 16 samples, chloride content at the depth of 5 cm not only reached the threshold value but surpassed it by almost 10 times (Figure 5).
In Figure 5, measured chloride profiles are presented on three groups of elements: pier P3 (15 m above sea level, surface exposed to NNE), joint pier P3 and arch foundation F3 (10 m above sea level, surface exposed to ENE), and the arch segment close to the arch foundation at pier P10 (15 m above sea level, surface exposed to ENE) in different time periods: 2006, 2010 and 2012. According to the measured values, it can be concluded that reinforcement depassivation had already started in 2006, after 9 years of exposure to the maritime environment. Active corrosion of steel reinforcement caused cracks and damage 11 in the concrete, accelerating further chloride penetration in concrete cover. Results of visual inspection (Figure 5) confirm this conclusion.
Values of chloride in concrete taken from pier P3 and foundation F3 measured in 2006 are higher than the chloride content measured on the same elements in 2010. This may be due to the local influence of concrete damage and environmental exposure, since it is not possible to always take samples from the same position and due to variations in seasonal and multi-year cycles, as found in [46]. However, in each time period, the chloride content is higher than the threshold value, which should be the trigger point to decide on further maintenance and repair. As can be seen in the chloride profiles measured in 2012, damages caused by active reinforcement corrosion cause damage to the concrete, accelerating chloride penetration. Consequently, deeper layers of concrete are contaminated with chlorides and must be removed during repair.
Although the chloride diffusion coefficient was measured using different test methods, according to [46,47], both standards ND BUILD 443 and 492 provide good precision and fairly comparable results. Results of both methods show the high value of the chloride diffusion coefficient and its progression over time. To achieve a service life of 100 years in an aggressive maritime environment and prevent active corrosion in the early stage of the service life, the chloride diffusivity of concrete should be ten times smaller [13].
The measurement of the half-cell potential in 2012 at 17 locations, including all structural elements, also showed that the highly negative electrical potential of the reinforcement (less than −350 mV) was measured at the lower parts of piers P3 and P10 (up to a height of about 35 m above sea level), in the foundations of the arch and the arch springs (parts of the arch closest to the foundations), indicating, with 95% probability, the corrosion state of the reinforcement. On the opposite side, the most favorable values of half-cell potential (above −200 mV) were measured at the main girders and piers P1 and P11, indicating less than a 10% probability of active reinforcement corrosion. A comprehensive analysis of the results of all measurements showed that the half-cell potential increases and the probability of corrosion of the reinforcement decreases as the distance of the structural element from the sea increases.
Elements near sea level, e.g., piers P3 and 10, the arch foundation, and springs, are most vulnerable to reinforcement corrosion. This conclusion is confirmed by several methods: visual inspection, corrosion monitoring, and measurements of chloride content in concrete and half-cell potential. On the other hand, serious measurements have shown that the main girders are less exposed to reinforcement corrosion.
Since the foundations of piers P1 and P2 were not included in the repair, large areas of pier foundation P2 were investigated in 2018. All readings of the half-cell potentials ranged from −360 mV to −680 MV, indicating a high rate of corrosion of the reinforcement. The probability of a high corrosion rate is confirmed by the results of the surface electrical resistivity of the concrete, with values ranging from 2 kΩcm to 36 kΩcm. Testing with an ultrasonic device and a Schmidt hammer showed an uneven quality of the concrete and the presence of large internal concrete damage and deep cracks, most likely caused by reinforcement corrosion.

4.4. Results of Numerical Analysis

4.4.1. Structural Assessment

Assessment of the superstructure under traffic load is carried out in three steps [48,49]. The first and second steps are semi-probabilistic methods that consider the effects of the reduced European traffic load, the model 1, compared to the effective resistance and serviceability. The third step involves a probabilistic model of traffic load using the Gumbel distribution for traffic load effects [50]. The superstructure of the Maslenica Bridge satisfied all of the analyzed limit states in all three steps [48,49].
Assessment of the arch for wind load is also performed in three steps. The first step includes linear analysis with geometrical non-linearity, while a nonlinear analysis is performed in the second step. For the third assessment step, a probabilistic model of the wind load is used according to the probabilistic model code [49], utilizing the Gumbel distribution. Assessment of the arch under wind loads satisfied both ultimate and serviceability limit states in all three steps [48,49].
Assessment of the arch under an earthquake is carried out in two steps. In the first step, a linear multimodal spectral analysis is performed, while the second step involves a nonlinear static analysis (pushover). Assessment of the arch under seismic loads satisfied the ultimate limit state in both steps [48,49].

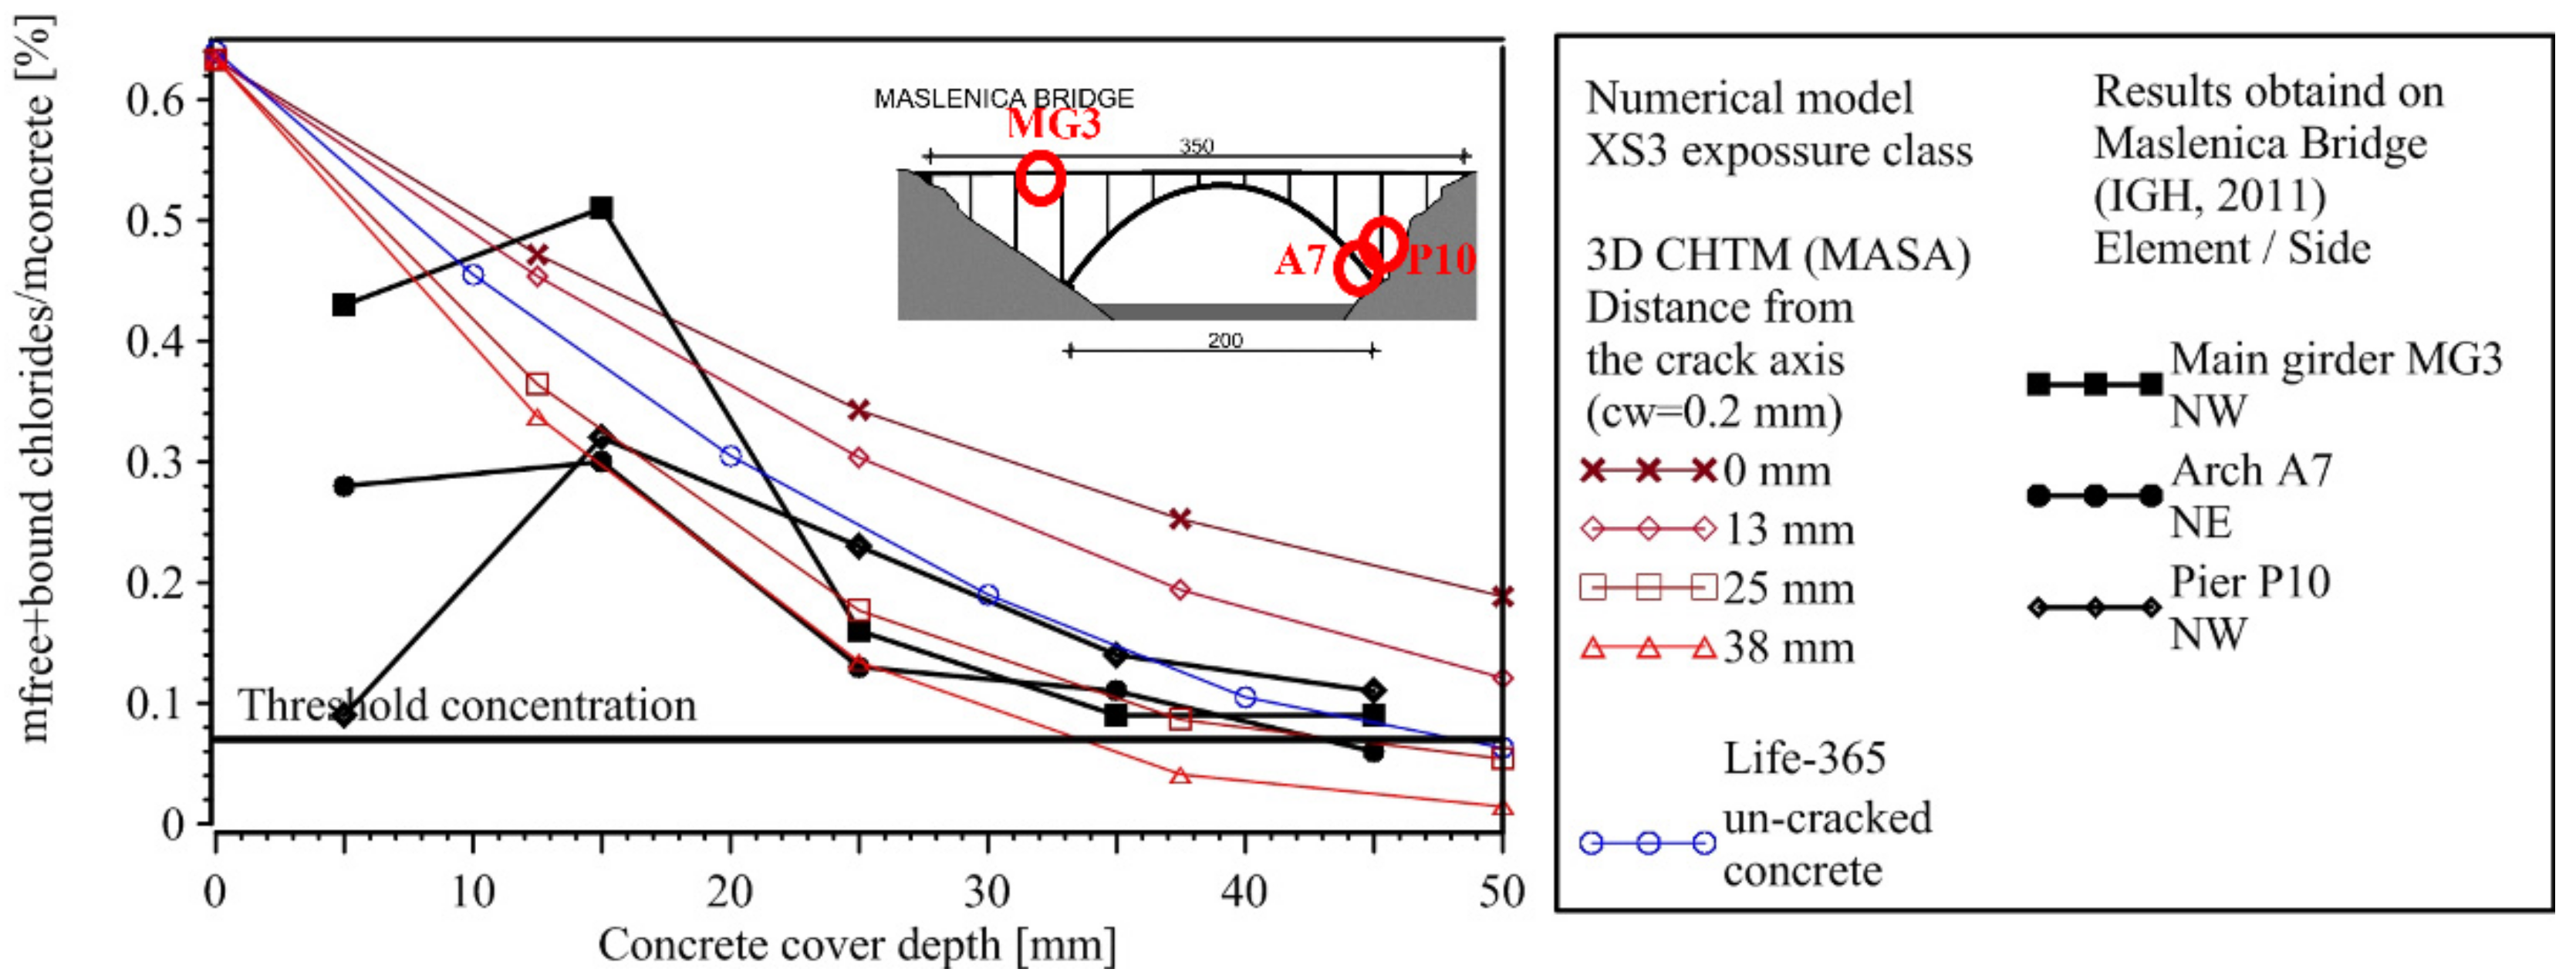
4.4.2. Service Life Prediction

The analysis prepared at the design stage to predict service life led to the choice of concrete mix, permeability, and diffusivity [38]. However, measurements of chloride in concrete showed that the depassivation time is much shorter than the predicted 100 years. The reason for this is that the preliminary analysis of service life prediction did not consider local cracks and damage in the executed concrete.
Chloride penetration in concrete is analyzed again after 13 years of exposure using two models for service life prediction, Life-365 and 3D chemo-hygro-thermo-mechanical (3D CHTM) model [41,42]. In addition, two environmental exposure conditions XS1 (airborne chloride) and XS3 (splash zone), were considered according to the European Standard EN 206:2013. The assumed surface chloride concentration for both models is 0.25% and 0.64% of the concrete mass for exposure classes XS1 and XS3, respectively. The initial chloride diffusivity is relatively low and the same for both models: 7.94 × 10⁻¹² m/s2 for the Life-365 and 5.50 × 10⁻¹² m/s2 for the 3D CHTM model. The comparison with measured data (Figure 6) led to the conclusion that both models are able to realistically predict the chloride concentration in concrete after a long period of time (more than 10 years). However, the 3D CHTM numerical model, which considers cracks in the concrete, predicts the depassivation time much more accurately [18,39,40]. Life prediction analysis combined with other testing methods leads to the conclusion that a service life of 100 years can be achieved with the designed concrete quality and concrete cover depth. However, cracks and damage in the concrete that occur during construction and exploration shorten the depassivation time to less than 10 years [18,39,40].
It should be noted that both models assume constant boundary conditions: surface chloride concentration, water saturation, relative humidity, and temperature, while chlorides penetrate into concrete by diffusion. Therefore, the effects of climate change, seasonal and long-term weather variations, as well as wetting–drying cycles, effects of precipitation, and other types of chloride transport are not considered, although their influence can be significant [46,51,52,53]. However, the focus of the analysis is on demonstrating the impact of cracks on chloride concentration in cracked and the local uncracked concrete.

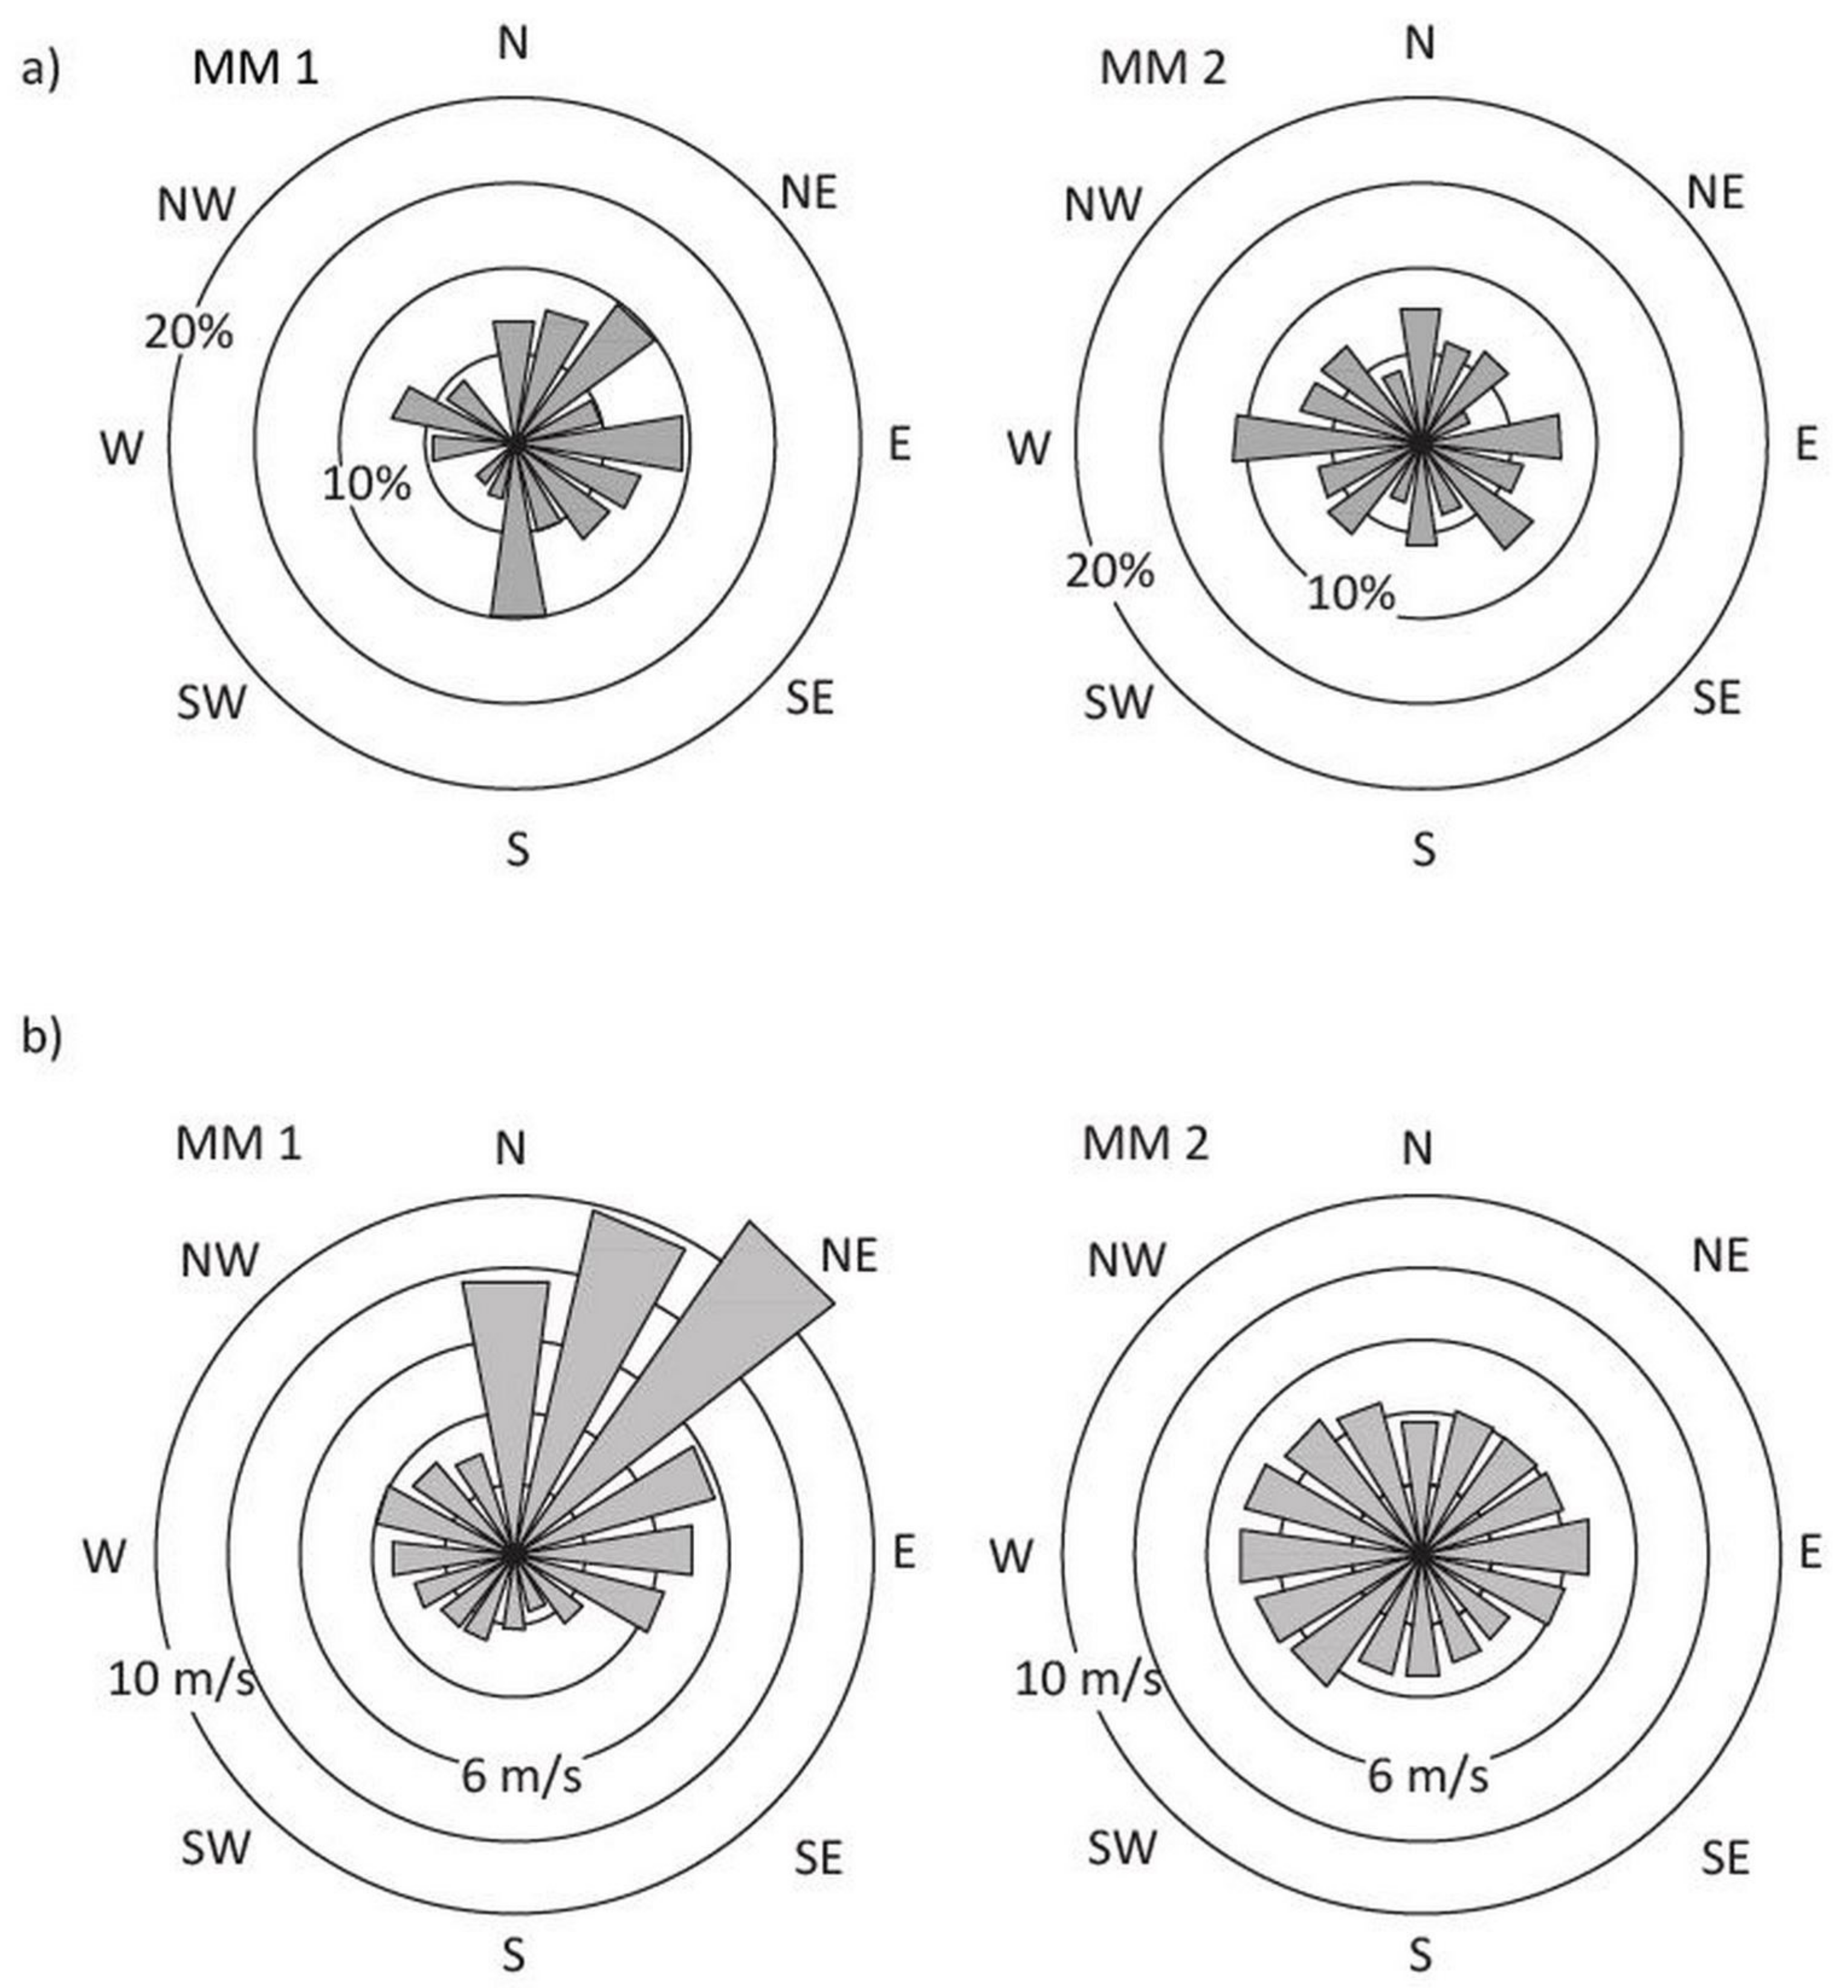
4.5. Data on Microclimate

The distribution of wind direction and speed is the first indicator of the airflow regime at a location. The wind roses (Figure 7) near the Maslenica Bridge show that the flow regime on both sides of the bridge differs significantly. On the Zadar side of the Maslenica Bridge (MM1), winds from the N–NE–E directions (bora), with an average speed of more than 10 m/s, predominate. Although the meteorological station MM2 is located a small distance from MM1, the differences in the airflow regime are significant. The winds from the W–NW and SE–S are much more frequent, and the wind direction is determined by the provision of the sea channel, which significantly affects the wind at the MM2 site [43].
A gale-force wind (bora wind) with an average hourly speed of more than 17.1 m/s is registered at MM1 in 4% of cases per year, which is the highest recorded frequency of strong winds in Croatia [43].
The average air temperature is 15.5 °C, with the highest average monthly value of 24.8 °C in July, while the coldest month is January, with an average temperature of 7.5 °C. The rainfall here is about 993 mm per year. The relative humidity is high throughout the year, without much variation, and with an annual average of 71% [43]. The strong bora winds in the sea channel raise sea droplets and spray them over all elements of the bridge. The high salinity of the Adriatic Sea (38–39‰) contributes to the penetration of large amounts of chloride into the concrete cover of the structure. In addition, the high relative humidity and warm weather contribute to the active corrosion of the reinforcement in the concrete.

5. Evaluation of Key Performance Indicators and Discussion

5.1. Introduction

In the bridge management system, condition assessments are provided at three levels: structural elements (girders, piers, the arch, etc.), structure (the entire bridge), and the network level (all bridges in the motorway network). The transition from the element to the structural level in Croatia is usually made using two approaches to bridge condition assessment: qualitative methods and the worst conditioned components approach. In qualitative assessment, the overall bridge condition is descriptively assessed, e.g., good, moderate, poor, and severe, based on the condition and importance of the assessed elements [54]. Since this rating does not provide numerical values, monitoring of the deterioration of a bridge over time is not possible. In addition, a comparison of all bridges at the network level is not possible due to the lack of quantitative rates.
The worst-conditioned component approach is common in bridge management systems, where a bridge is divided into several component groups and the worst rate of the component group becomes the overall rate of the bridge [54]. At the network level, this method clearly identifies the most vulnerable bridges. However, this approach does not capture the full condition of the bridge, e.g., the degree, extent, and significance of all recorded damage, which is important for rehabilitation planning.
Hence the new approach of bridge performance indicator evaluation is proposed and implemented in the case study. At first, performance indicators (PIs) are analyzed in order to assess not only the durability of the bridge but also other important aspects—key performance indicators (KPIs) such as reliability, availability, maintainability, safety, security, the environment, costs, health, and politics. Furthermore, performance indicators are evaluated based on the degree of degradation described as rate, but also considering the significance or contribution of each PI to the corresponding KPI. Performance indicators (PIs) for the Maslenica Bridge are analyzed based on the results of the COST TU 1406 [55,56,57,58] and presented in the service performance of the bridge, including the results of Croatian national projects related to the assessment and service life prediction for the Croatian Adriatic arch bridges [18,59]. The identification of performance indicators for bridge structures from European countries and their harmonization at the European level has been a complex, extensive, and time-consuming process [55]. In the end, about 100 filtered-out PIs were linked to one or more key performance indicators (KPIs) [1,59]. The categorization process aim is the final overall rating of each of the five most important groups of key performance indicators (KPIs) [59]:
  • Safety, reliability, and security (with rating factor rSRS),
  • Availability and maintainability (with rating factor rAM),
  • Costs (with rating factor rC),
  • Environment (with rating factor rE),
  • Health and politics (with rating factor rHP),
These are required to define quality specifications and control plans of road bridges at the European level.
Each PI is determined by rate (R = 1–5) and weight (W = 0–1). The rate represents the degree of performance indicators (Table 5).
The rates of PIs in this case study are based on the project design, SHM results during construction and operation, load-testing prior to the bridge opening, results of visual inspections, in-situ and laboratory testing prior to repair, bridge assessment on seismic, wind and traffic loads, numerical analysis on service life prediction, and meteorological monitoring.
The weights represent the impact of PI on the respective KPI, where 0 means that there is no effect on the respective KPI during the remaining service life of the bridge, while 1 means that a particular PI has a very high influence on the respective KPI. The description of the PI weights on the corresponding KPI is shown in Table 6.
The weights determined in this case study are based on the knowledge and experience with bridge management in general and, in particular, with the long-span arch bridges built on the Adriatic coast. The weighted approach to bridge condition assessment used in Australia, the United Kingdom, South Africa, and Austria is also based on the evaluator’s judgment, although only one key performance indicator—the bridge condition index—is assessed there [54].
Ren et al. 2021 [60] have effectively illustrated the shortcomings and advantages of different weight models for bridge system performance evaluation, using both a constant weight and an age- and condition-dependent variable weight, but, again, resulting in one final rate. The advantage of the method presented here is the evaluation of several groups of KPIs indicating important factors, based on which, the conclusions for bridge maintenance can be drawn. For example, higher importance of the bridge indicates that preventive maintenance should be performed, while low importance of the crossing and low traffic volume may indicate that it is sometimes possible to limit the load-bearing capacity instead of performing complex and expensive strengthening of the structure.
The rating factor of the main five groups of key performance indicators (rKPI) can be calculated according to:
r KPI = i = 1 n R i W i i = 1 n W i
where Ri is the rate of the PIi and Wi is the weight of the PIi for a certain group of the KPI. The description of the rating factor of the key performance indicators is shown in Table 7.

5.2. Assessment of PIs for the Maslenica Bridge Case Study

A comprehensive list of PIs correlated with the corresponding KPIs is the result of many years of research and large databases including the results of visual inspections, provided NDT and laboratory testing, project documentation, bridge assessment, numerical modeling, etc. Some PIs are easier to determine (e.g., the state of equipment based on the visual inspection and review of the maintenance program), while others require more study. However, in the framework of this study, all relevant PIs are included.
In order to assess PIs and KPIs, it is necessary to define the main degradation mechanism, the most vulnerable zones, critical elements, and the dominant bridge load. Results of the investigation work clearly indicate that the chloride-induced corrosion of reinforcement is the main degradation mechanism, while the most deteriorated elements are piers above arch abutments, and piers P3 and P10.
Weights or impacts 0–1 are assumed based on knowledge and experience with arch bridges in general, particularly those built on the Adriatic coast.
Rates from 1–5 are based on the project design, results of SHM during construction and in service, load-testing prior to the bridge opening, results of previous visual inspections, laboratory and non-destructive testing, structural assessment, and numerical analysis on service life prediction.
Considering a large number of PIs and five groups of KPIs, leads to a more complete condition assessment of the bridge. On the other hand, with a large number of PIs, a single PI has a smaller impact on the final rate of the corresponding KPI. Therefore, in the bridge management system and maintenance plan of a bridge, it is of great importance to pay special attention to PIs with a condition rate of 4–5, which require urgent actions, and a weight of 0.9–1.0, which means a high impact on the corresponding KPI. For example, damage to a concrete cover in a harsh maritime environment with a high risk of corrosion has a high weight, e.g., 0.9–1.0, while the weight of the same PI in an indoor environment with a low risk of corrosion is much lower.
This method can be applied at three levels: component (group of elements), structure (bridge), and network. However, due to the scope of the research and the limitation of the article, only the bridge level is presented here. Moreover, based on the extensive list of PIs and assessments of five groups of KPIs, the future condition of the bridge can be predicted by identifying the main degradation mechanisms and the most vulnerable zones considering the environment and the importance of the bridge.

5.2.1. Safety, Reliability, and Security

Safety, reliability, and security are the main demands on bridges. Reliability in this context means the probability that the bridge will be fit for its purpose during its service life and several possible conditions: in the case of structural failure (i.e., safety), operational failure (i.e., serviceability), or any other failure mode [57].
For the first group of the KPI, Safety, Reliability, and Security, the PIs are divided into several groups: defects in concrete cover, material parameters, structural performance, equipment, loads, and environmental influence, in order to better systematize the work (Table 8).
Construction monitoring results are considered in the evaluation of the following Pis: (i) arch displacement (ratification needed); (ii) sag, deformation, denivelation, and differential displacement; and (iii) cracks generated during or immediately after construction.
Defects in concrete cover include cracks, crumbling, delamination, detachment, segregation, layering of concrete, and insufficient thickness of the concrete cover. Cracks generated during or immediately after construction are most widespread on the structural elements, especially on the pier P3. According to their length, density, and deterioration degree, their rate is 3, as the average grade of damage. Cracks due to temperature changes occur less often and are localized, hence their rate is 2. Corrosion-induced cracks are localized and accompanied by brown spots; on the most deteriorated elements, piers P3 and P10, they indicate an advanced corrosion process which is not an allowable condition for the service life of 20 years, and their rate is 4. Cracks significantly influence the corrosion of reinforcement, especially those with a width larger than 0.2 mm and depth up to the reinforcement level. Hence, the weight for the corrosion-induced cracks is 1.0, while for more shallow cracks the weight is assumed to be 0.9.
The mean degree (rate 3) of crumbling of concrete cover at the concrete safety barrier is noticed during visual inspections, but its effect on the KPI is minor (weight 0.4) because it will not present a danger to traffic safety in the foreseeable future and has no influence on the structural capacity.
Delamination and detachment of concrete cover are discovered by the NDT on most of the structural elements, where the affected area is approximately 1 m2 and the density of defects is relatively high, resulting in the rate of 4. Since the quality and integrity of concrete cover are essential to provide protection against chloride penetration to the reinforcement level, but also to ensure the transfer of force, stress, and strain in structure, the PI weight is 1.0. Concrete layering and segregation are detected on some spots on the piers and foundations with a lower damage degree (rate 3); since the depth of the defects is not large, the weight is assumed to be 0.8. At piers P3 and P10, the measured concrete cover is 3.1 cm, while the designed concrete cover was 5 cm, and for the most exposed surfaces 10 cm of the concrete cover was specified in the bridge design; due to its importance for the structure durability in the aggressive maritime environment, the rate is 4, and weigh is 1.0.
Testing results showed that concrete strength and modulus of elasticity were above the value specified in the design, hence the rate of the PI concrete strength deficiency is 1 for all elements, except for the pier P2 foundation, where the rate is 2 due to slightly lower measured values. The weight for concrete strength and modulus of elasticity is set at 0.7, taking into account additional reserves covered by partial safety factors.
Gas permeability was higher than expected which is unfavorable because it accelerates chloride penetration and active corrosion. The designed service life of 100 years was planned to be achieved with much lower permeability, hence the rate is 4 and 5, for the arch and piers, respectively, while the weight is 1.0; due to the aggressive environment protective coating is needed immediately.
Analysis of the load-bearing capacity of the structure, described in Section 4.4.1, is used to evaluate the KPI related to safety, reliability, and security through the following PIs: load-carrying capacity, reliability index, safety index, frequency, stiffness, etc. The assessment of the bridge on the traffic, wind, and seismic loads, according to the Eurocode, showed that the ultimate and serviceability limit states were satisfying, hence the rate is 1, and the weight is 0.7, taking into account additional reserves covered by partial safety factors.
The rating factor for the key performance indicators related to safety, reliability, and security, is calculated as rSRS = 2.98, which indicates a marginal condition requiring minor rehabilitation. This rate is a result of the relatively good load-bearing capacity of the structure, satisfying mechanical parameters and conditions, and poor conditions related to structure and equipment degradation due to an aggressive maritime environment.
Results from visual inspection, in-service corrosion monitoring, laboratory testing, nondestructive testing, and service life prediction analysis allow evaluation of the following PIs: pitting corrosion (chlorides); chloride content; corrosion rate (electrical potential, current density); damage degree (extension); deterioration index, remaining service life; application of the protective coating, and aggressive maritime environment. These PIs affected all KPIs except the KPI for the environment. The detailed investigation has shown that not only the elements in the splash zone, but all elements are susceptible to corrosion of the reinforcement due to the specific maritime environment, especially due to the influence of wind.

5.2.2. Availability and Maintainability

The second group of KPIs—availability and maintainability—refers to the proportion of time a bridge is in a working condition, relative to the interruption of bridge users by planned or required maintenance activities. Therefore, PIs related to the condition assessment of the structure and equipment are most relevant to this KPI rate (Table 9). Chloride-induced corrosion of reinforcement is identified as the most important degradation mechanism, while other defects in the concrete (cracks, damage, delamination, insufficient concrete cover) or poor durability parameters of the material, e.g., permeability, can significantly accelerate the deterioration of the structure.
The availability of the bridge is also affected by the temporary closure of the bridge due to weather conditions, such as high winds in winter and traffic congestion during the tourist season in summer.
The calculated rating factor for the key performance indicators related to availability and maintainability; rAM = 3.87 indicates poor condition and a need for repair, which was carried out in 2018.

5.2.3. Costs

Costs, as one of the key performance indicators of the bridge, include long-term costs and maintenance activities during the service life of a bridge, but also user costs caused by detours and delays are included (Table 10). Costs, as one of the KPIs, are evaluated mainly based on the durability and traffic condition of the bridge. Durability issues have already been discussed in the previous chapters and necessary interventions during repair are included in the cost estimate. Traffic conditions include all available data on traffic on the bridge: (i) constant data such as road category, size and importance of the bridge in the network, detour distance; and (ii) time-dependent data such as information on road conditions, e.g., traffic congestion, traffic restrictions, daily, seasonal, and annual traffic volumes, etc.
The Maslenica Bridge is an important link due to its location in the motorway network, but also due to its length. Its strategic importance, therefore, leads to higher maintenance costs. However, during the first twenty years of the bridge’s operation, there was insufficient investment in regular maintenance of the bridge, i.e., pavement, bearings, or expansion joints were not replaced. Although additional funds were invested during construction in structural health monitoring, it was not properly maintained during execution and the results were not used for proactive maintenance to stop reinforcement corrosion at the initiation stage.
The high-cost rate of rC = 4.10 means that this is a bridge of great importance and preventive maintenance should be carried out using all available data on the bridge, equipment, maintenance, etc. As this was not the case during the first twenty years of operation, the maintenance costs have increased considerably.

5.2.4. Environment

The KPI of the environment is related to minimizing the harm to the environment during the service life of a bridge. Environmental impact on the bridge is included in other KPIs, especially availability and maintainability, while the focus here is in the opposite direction: how the structure and its users affect the environment. Emissions of gasses to the air and of liquids to the soil and sea are the most important PIs (Table 11).
Since the annual traffic volume is not so large, the natural environment, without other infrastructure nearby, is able to compensate for the negative impact of traffic on the air quality. A good drainage system installed on the bridge prevents the emission of harmful liquids into the soil or sea. Due to the disposition of the bridge and the large span of the arch, the risk of ship collision is minimal or non-existent. Finally, the rate of environment KPI rE = 1.58 confirms the minimal impact of the bridge on the environment.

5.2.5. Health and Politics

The last KPI, health and politics, is related to political–administrative and social requirements (Table 12). Three aspects are considered here: deterioration index, the importance of the bridge as a part of the network, and the bridge impact on the human health
The deterioration index as a PI is important for management policy; unfortunately, due to lack of regular maintenance and harsh environment deterioration, the index is high and has a negative impact on future management policy. As was noted earlier, the Maslenica Bridge is one of the most important links in its motorway network. Since the bridge is located in an unbuilt environment, its effect on human health, e.g., noise, is minimal.
Rate of health and politics KPI rHP = 3.78 implies more concern in the management of this bridge. The importance of the bridge in the network is something that cannot be changed, but the decrease in the deterioration index is an important task for the most significant links in the network, including the case study bridge.

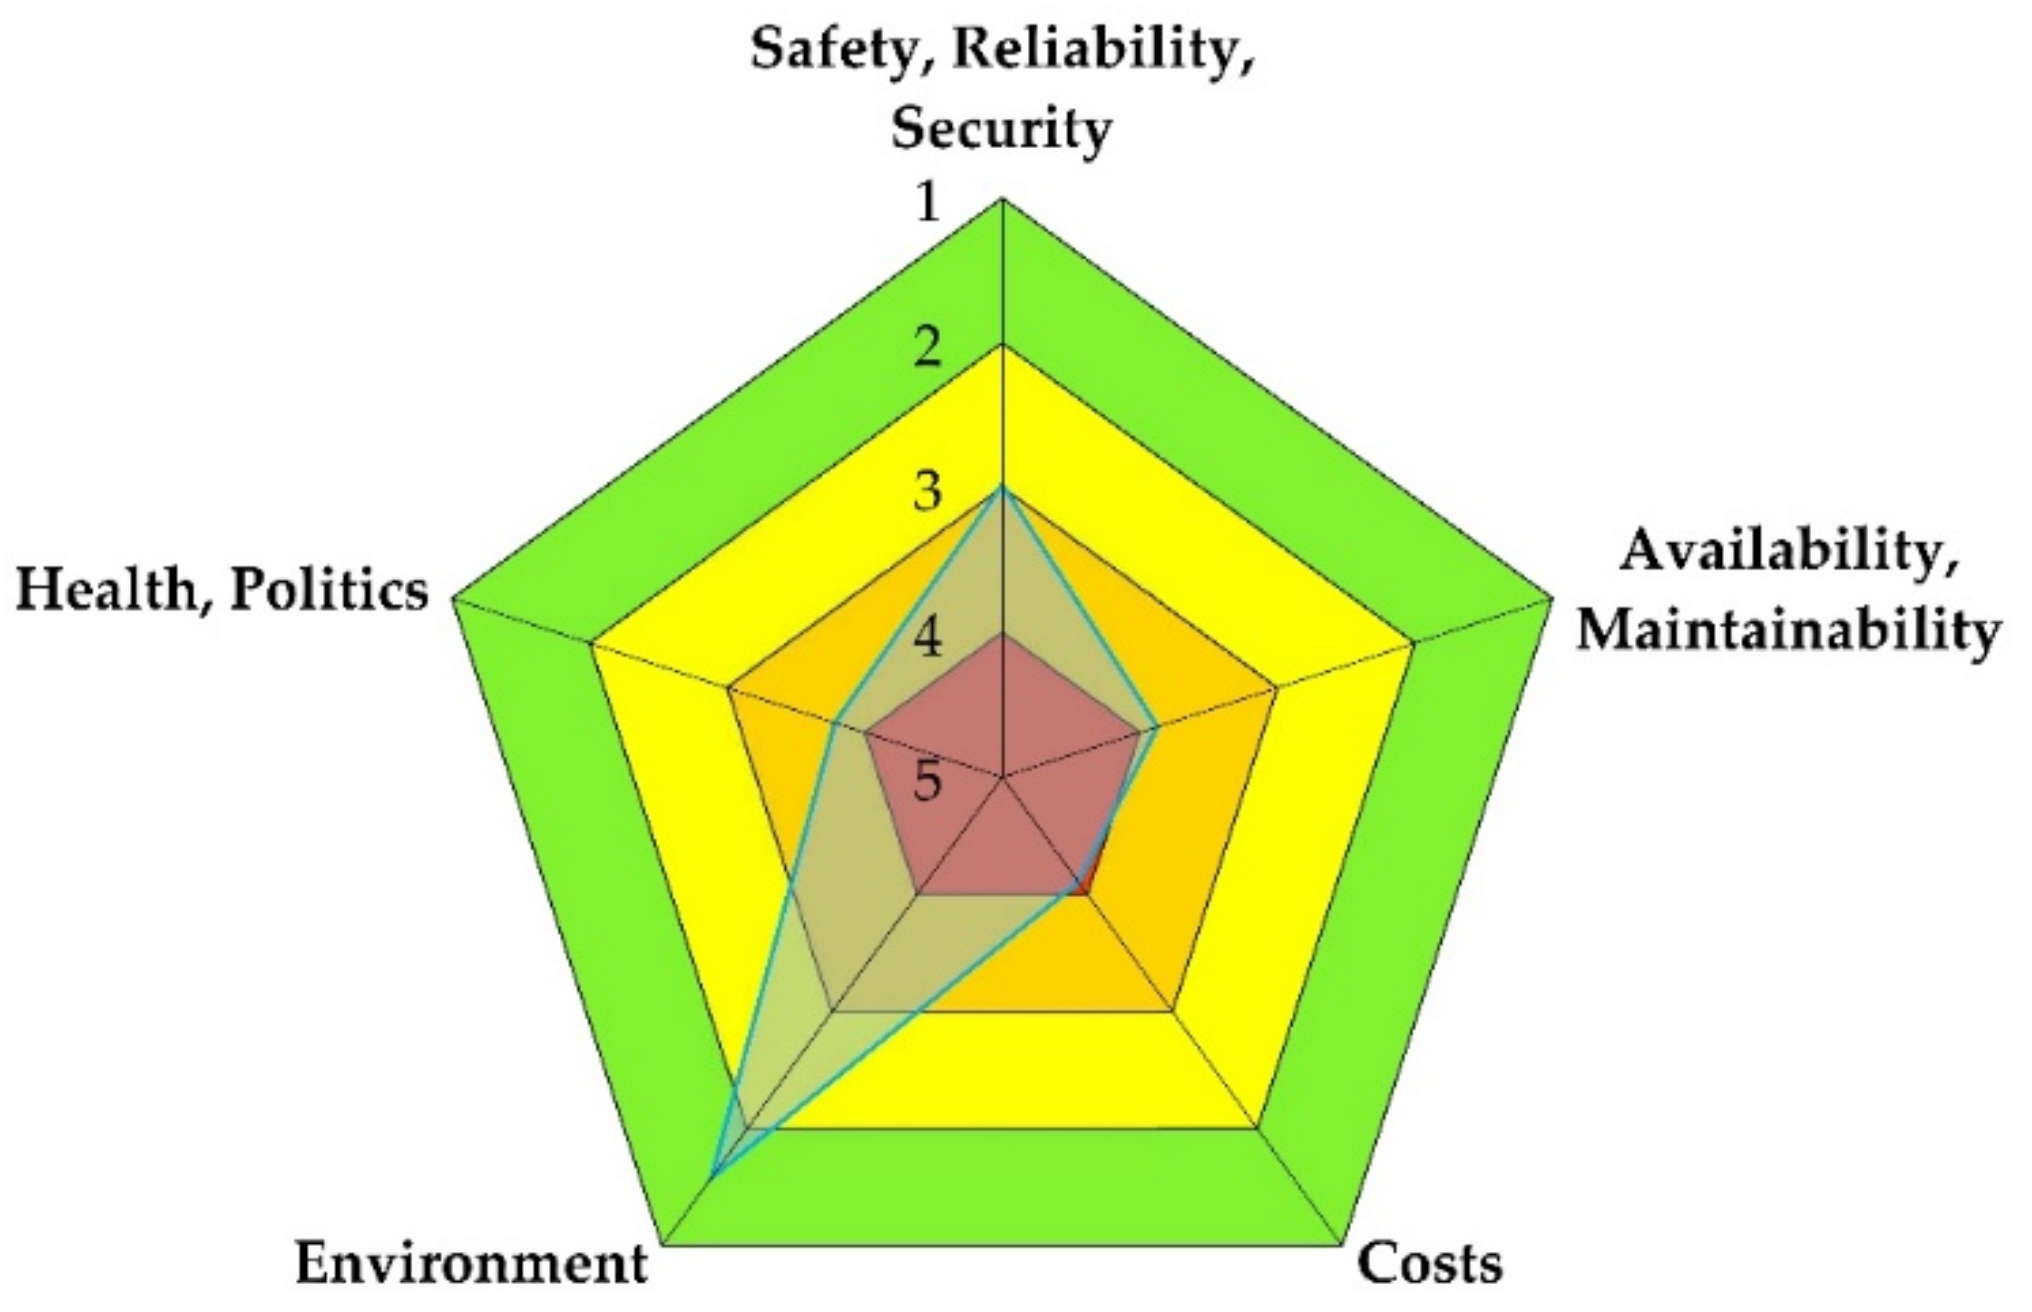
5.2.6. Final rating of KPIs

The final results of all assessed KPIs are in the form of a colored spider diagram (Figure 8) and Table 13. The spider diagram is represented by traffic light colors: green areas represent the most favorable rate, yellow and orange areas should warn the bridge operator, while red areas require immediate intervention [55,56,57].
The distinctive feature of this assessment method is a holistic approach that considers not only the structural load-bearing capacity and condition of the bridge and maintenance, but also the strategic importance of the bridge and the impact on users and the environment. The overall condition of the bridge is better when all KPIs rates are lower, i.e., when the area covered in the spider diagram is larger. However, some PIs such as the importance of the bridge in the network and environment aggressiveness to structure cannot be changed, so other PIs should be treated differently depending on the location, importance, and environment.
The overall assessment of all KPIs is influenced by numerous PIs, which can be grouped into varying and constant PIs. Constant parameters are invariant over time and are unaffected or less affected by the maintenance of the structure. Constant parameters depend on the location of the bridge and the concept of the structure. Some of the constant PIs, e.g., no scour risk and no impact from ships or settlement, have a favorable effect on several KPIs, especially safety, reliability, and security. On the other hand, the extremely aggressive marine environment and extreme winds, which blow sea droplets on all structural elements, have a very negative impact on the durability of the structure and, consequently, on other KPIs: safety, reliability, and security; cost; as well as health and politics. In addition, the strong bora wind, especially in winter and spring, affects the flow of traffic, and for the safety of passengers, the bridge may be temporarily closed to trucks and sometimes even to all vehicles.
Nine hazards are evaluated for the bridge safety, reliability, and security KPI. Hazards such as scour, impact of vehicles or ships, erosion, settlement, and rockfall do not pose a potential risk to the bridge and are therefore rated 1.
The hazards with the highest rate factor for the same KPI are the aggressive maritime environment (in terms of chloride content) and the seismic activity of the area with an rKPI of 4.5 and 3.2, respectively. The impact of these two hazards on the KPI related to the costs, where the aggressive maritime environment has the highest rate factor, 5.0, while the seismic activity is rated with a lower impact and a rate factor of 2.0 due to the favorable seismic design and assessment.
Extreme winds in the winter and extreme traffic volumes in the tourist season have lower impacts on safety, reliability, and security, but their impacts on availability and traffic flow are much less favorable. A solution for better availability for passengers is the detour route in the vicinity.
Although seismicity is relatively high in the region, the impact on the KPIs is not very negative because the structure has good seismic resistance. Constant PIs related to the importance of the bridge in the network, the road category, and the size of the bridge have a high value, indicating the importance of the structure and increasing the value of all KPIs, except the environment.
Most of the variable PIs relate to one of two groups: (i) with the mechanical behavior of the structure and (ii) with the degradation of elements due to physical, chemical, temperature, and electrochemical phenomena. The mechanical parameters of the materials, e.g., concrete strength and modulus of elasticity, as well as the mechanical parameters of the elements or the whole structure, e.g., deformation, stiffness, load-bearing capacity: superstructure assessment on traffic load, and arch assessment on seismic and wind load, are still at a very good level, resulting in a satisfactory evaluation of the rating factor of safety, reliability, and security. However, the variable PIs related to degradation are not at a satisfactory level, especially the PIs related to (i) durability of the concrete cover of structural elements, e.g., gas permeability, cracking, and delamination, and (ii) durability of equipment, e.g., cracking of asphalt, deterioration of expansion joints, and deterioration of protective coatings. Durability-related PIs affect not only KPIs related to availability and maintainability, but also KPIs related to safety, reliability and security; costs; as well as health and politics.
Two main factors were identified that increase the overall KPI rating factors: constant PIs related to the location and importance of the bridge, and variable PIs related to the durability of the equipment and the concrete cover of the structural elements. The large scale of the structure, its importance in the network, and the aggressive environment suggest that bridge management should be proactive and preventive. Bridge repair should be performed before durability problems threaten the structure’s load-bearing capacity, focusing mainly on renewing the equipment and increasing the durability of the concrete elements in the most vulnerable part—the concrete cover layer.
After repair, it is necessary to continue to perform proactive management and preventive maintenance to correct durability problems caused by aggressive environmental conditions as soon as possible so that the cost of maintenance does not multiply and the load-bearing capacity of the structure is not compromised.
Specifically, this means surveillance of the results of SHM, conducting regular inspections, and non-destructive testing and measurements to detect and correct defects as quickly as possible. The equipment of the bridge with a shorter service life must be replaced regularly so as not to compromise the durability and safety of the bridge.

6. Conclusions

This paper presents a case study of a bridge that includes design, numerical analysis, structural health monitoring, and laboratory and in-situ testing during construction and operation until repair. Based on all the data collected, a comprehensive assessment is made considering the five key performance indicators, which consider not only reliability and maintainability, but also economic, environmental, political, and social aspects. Based on the analyzed case study, the following conclusions are drawn:
  • The main novelty of this research is a new approach to the evaluation of bridges that takes into account not only durability and load-bearing capacity, but also other important aspects such as safety, availability, the importance of the bridge in the network, the impact of the bridge on the environment, society and decision-making policies, maintenance and user costs, and so on. All these aspects are evaluated by numerous performance indicators in five key performance indicators: (1) safety, reliability, and security; (2) availability and maintainability; (3) costs; (4) the environment and (5) health and politics.
  • The presented method can be applied on the element, structural, and network levels, considering different types of bridges and structures. The main advantage of this method is considering several groups of KPIs, not only the deterioration index. Considering a large number of PIs and five groups of KPIs, leads to a more comprehensive condition assessment of a bridge. Based on the extensive list of PIs and assessments of five groups of KPIs, the future condition of the bridge can be predicted by identifying the main degradation mechanisms and the most vulnerable zones, considering the environment and the importance of the bridge. The disadvantage of this method, similar to most of the known methods, is that it still depends on the experience of the evaluator and the final assessment depends on the considered PIs and the corresponding weights, which must be determined based on a good knowledge of the case study.
  • Although much research and improvement has been carried out in the field of bridge management systems in the past decades, the evaluation of existing bridges still depends on the experience of the evaluators and subjective decisions. However, in the presented approach, several methods were used for objective evaluation: (i) each performance indicator was assigned a weight factor to determine its influence on each of the respective key performance indicators; (ii) numerous indicators were estimated based on a large number of bridge tests and numerical analyzes; (iii) invariant parameters related to bridge importance, and environmental and climate characteristics also significantly influenced the bridge evaluation.
  • In the presented case study, the lack of regular maintenance and the omission of preventive measures, such as protective coatings on structural elements exposed to seawater, led to high maintenance rates, but also high rates of reliability, costs, and political and social decisions. Such practice for large and significant bridges in multi-hazard environments has more negative impacts compared to standard, small or medium bridges that are of medium importance to the network.
  • The methodology for evaluating key performance indicators and the lessons learned from this case study can be applied to a variety of structures, especially for megastructures in multi-hazard environments.

Author Contributions

Conceptualization, M.K.M. and A.M.I.; methodology, M.K.M.; analysis, M.K.M., A.M.I., M.S. and D.S.; investigation, M.K.M., A.M.I., M.S. and D.S.; resources, M.K.M., A.M.I., M.S. and D.S.; writing—original draft preparation, M.K.M.; writing—review and editing, M.K.M., A.M.I., M.S. and D.S.; visualization, D.S., M.S. and M.K.M. All authors have read and agreed to the published version of the manuscript.

Funding

This research was funded by two projects: (i) the UKF project 04/17 “Influence of concrete damage on reinforcement corrosion—computer simulation and in-service performance of bridges (CODEbridges)” co-funded by the Unity through Knowledge Fund (UKF), University of Stuttgart and University of Zagreb, and (ii) short-term financial support “Key Performance Indicators for existing bridges” funded by the University of Zagreb. The APC was funded by the University of Zagreb—short-term financial support “Key Performance Indicators for existing bridges”.

Institutional Review Board Statement

Not applicable.

Informed Consent Statement

Not applicable.

Data Availability Statement

The datasets generated for this study can be obtained from the corresponding author upon request.

Acknowledgments

The authors wish to express their gratitude to Croatian Motorway (HAC) for the transfer of the bridge maintenance data and their support with the project.

Conflicts of Interest

The authors declare no conflict of interest.

References

  1. Mandić Ivanković, A.; Skokandić, D.; Kušter Marić, M.; Srbić, M. Performance-Based Ranking of Existing Road Bridges. Appl. Sci. 2021, 11, 4398. [Google Scholar] [CrossRef]
  2. Puž, G.; Radić, J.; Tenžera, D. Visual inspection in evaluation of bridge condition. Građevinar 2012, 64, 9. [Google Scholar] [CrossRef]
  3. Kušter Marić, M.; Mandić Ivanković, A.; Vlašić, A.; Bleiziffer, J.; Srbić, M.; Skokandić, D. Assessment of reinforcement corrosion and concrete damage on bridges using non-destructive testing. Građevinar 2019, 71, 843–862. [Google Scholar] [CrossRef]
  4. Mandić Ivanković, A.; Skokandić, D.; Žnidarič, A.; Kreslin, M. Bridge performance indicators based on traffic load monitoring. Struct. Infrastruct. Eng. 2019, 15, 899–911. [Google Scholar] [CrossRef]
  5. De Domenico, D.; Messina, D.; Recupero, A. A Combined Experimental-Numerical Framework for Assessing the Load-Bearing Capacity of Existing PC Bridge Decks Accounting for Corrosion of Prestressing Strands. Materials 2021, 14, 4914. [Google Scholar] [CrossRef]
  6. Abokifa, M.; Moustafa, M.A. Experimental Behavior of Precast Bridge Deck Systems with Non-Proprietary UHPC Transverse Field Joints. Materials 2021, 14, 6964. [Google Scholar] [CrossRef]
  7. Srbić, M.; Mandić Ivanković, A.; Vlašić, A.; Hrelja Kovačević, G. Plastic Joints in Bridge Columns of Atypical Cross-Sections with Smooth Reinforcement without Seismic Details. Appl. Sci. 2021, 11, 2658. [Google Scholar] [CrossRef]
  8. Srbić, M.; Mandić Ivanković, A.; Brozović, T. Bending moment curvature relationship as an indicator of seismic resistance of older bridge piers. Građevinar 2019, 71, 481–488. [Google Scholar] [CrossRef]
  9. Kwiatkowski, J.; Anigacz, W.; Beben, D. Comparison of Non-Destructive Techniques for Technological Bridge Deflection Testing. Materials 2020, 13, 1908. [Google Scholar] [CrossRef]
  10. Asamoto, S.; Sato, J.; Okazaki, S.; Chun, P.-J.; Sahamitmongkol, R.; Nguyen, G.H. The Cover Depth Effect on Corrosion-Induced Deterioration of Reinforced Concrete Focusing on Water Penetration: Field Survey and Laboratory Study. Materials 2021, 14, 3478. [Google Scholar] [CrossRef]
  11. Ding, Y.; Dong, J.; Yang, T.; Zhou, S.; Wei, Y. Failure Evaluation of Bridge Deck Based on Parallel Connection Bayesian Network: Analytical Model. Materials 2021, 14, 1411. [Google Scholar] [CrossRef]
  12. Królikowska, A.; Komorowski, L.; Kunce, I.; Wojda, D.; Zacharuk, K.; Paszek, U.; Wierzbicki, T.; Bilewska, K. Corrosion Assessment of a Weathering Steel Bridge Structure after 30 Years of Service. Materials 2021, 14, 3788. [Google Scholar] [CrossRef]
  13. Kušter Marić, M.; Ožbolt, J.; Balabanić, G. Reinforced concrete bridge exposed to extreme maritime environmental conditions and mechanical damage: Measurements and numerical simulation. Eng. Struct. 2020, 205, 110078. [Google Scholar] [CrossRef]
  14. Kušter Marić, M.; Ožbolt, J.; Balabanić, G.; Zhychkovska, O.; Gambarelli, S. Chloride Transport in Cracked Concrete Subjected to Wetting—Drying Cycles: Numerical Simulations and Measurements on Bridges Exposed to De-Icing Salts. Front. Built Environ. 2020, 6, 561897. [Google Scholar] [CrossRef]
  15. Radić, J.; Šavor, Z.; Mandić, A. Two Notable Arch Bridges on The Croatian Adriatic Highway. Struct. Eng. Int. 2010, 20, 36–40. [Google Scholar] [CrossRef]
  16. Radić, J.; Šavor, Z.; Puž, G. Extreme Wind and Salt Influence on Adriatic Bridges. Struct. Eng. Int. 2001, 13, 242–245. [Google Scholar] [CrossRef]
  17. Kušter Marić, M.; Mandić Ivanković, A.; Ožbolt, J. Structural and climate performance indicators in service life prediction of concrete bridges in multi-hazard environment. In Life Cycle Analysis and Assessment in Civil Engineering: Towards an Integrated Vision, Proceedings of the Sixth International Symposium on Life-Cycle Civil Engineering (IALCCE 2018), Ghent, Belgium, 28–31 October 2018; Caspeele, R., Taerwe, L., Frangopol, D.M., Eds.; CRC Press: Ghent, Belgium, 2018; pp. 1701–1707. [Google Scholar]
  18. Kušter Marić, M.; Ožbolt, J.; Balabanić, G.; Mandić Ivanković, A.; Zarić, D. Service life prediction of concrete structures in maritime environment—Case study: Maslenica Motorway Bridge. In Proceedings of the 1st International Conference on Construction Materials for Sustainable Future (CoMS_2017), Zadar, Croatia, 19–21 April 2017; Banjad Pečur, I., Baričević, A., Štirmer, N., Bjegović, D., Eds.; Faculty of Civil Engineering, University of Zagreb: Zagreb, Croatia, 2017; pp. 629–636. [Google Scholar]
  19. Radić, J.; Šavor, Z.; Hrelja, G.; Oršanić, F.; Friedl, M.; Žderić, Ž. Construction of Maslenica arch bridge. In Construction of Arch Bridges; Chen, B., Radić, J., Eds.; Secon: Zagreb, Croatia, 2009; pp. 187–197. [Google Scholar]
  20. Bridge Chair at the Faculty of Civil Engineering University of Zagreb. Main Design of the Maslenica Motorway Bridge, Design Project; Bridge Chair at the Faculty of Civil Engineering University of Zagreb: Zagreb, Croatia, 1995. (In Croatian) [Google Scholar]
  21. IGH. Rehabilitation and Protection of the Concrete Structure of the Maslenica Bridge, Repair Project; IGH Institute: Zagreb, Croatia, 2014. (In Croatian) [Google Scholar]
  22. GF. Maslenica Bridge, Report from the Main Inspection of the Bridge; University of Zagreb Faculty of Civil Engineering: Zagreb, Croatia, 2007. [Google Scholar]
  23. IGH. Maslenica Bridge, Report from the Main Inspection of the Bridge; IGH Institute: Zagreb, Croatia, 2011. [Google Scholar]
  24. Šimunić, Ž.; Gašparac, I.; Pavlović, B. Monitoring of the Maslenica Bridge during Construction. In Structures for the Future—The Search for Quality; IABSE: Rio de Janeiro, Brazil, 1999; pp. 152–153. [Google Scholar]
  25. Sekulić, D.; Serdar, M. Experience with corrosion monitoring using embedded sensors in three bridges on the Adriatic coast. In Proceedings of the 1st International Conference COMS_2017, Zadar, Croatia, 19–21 April 2017; Banjad Pečur, I., Baričević, A., Štirmer, N., Bjegović, D., Eds.; Sveučilište u Zagrebu, Građevinski fakultet: Zagreb, Croatia, 2017; pp. 614–620. [Google Scholar]
  26. HRN EN 12504-4:2004; Testing Concrete—Part 4: Determination of Ultrasonic Pulse Velocity (EN 12504-4:2004). Croatian Standards Institute: Zagreb, Croatia, 2004.
  27. ASTM C876–91; Standard Test Method for Half-Cell Potentials of Uncoated Reinforcing Steel in Concrete. American Society for Testing and Materials: West Conshohocken, PA, USA, 2008.
  28. HRN EN 12504-1:2009; Testing Concrete in Structures—Part 1: Cored Specimens—Taking, Examining and Testing in Compression (EN 12504-1:2009). Croatian Standards Institute: Zagreb, Croatia, 2009.
  29. HRN EN 12390-3:2009; Testing Hardened Concrete—Part 3: Compressive Strength of Test Specimens (EN 12390-3:2009). Croatian Standards Institute: Zagreb, Croatia, 2009.
  30. HRN EN 12390-13:2013; Testing Hardened Concrete—Part 13: Determination of Secant Modulus of Elasticity in Compression (EN 12390-13:2013). Croatian Standards Institute:: Zagreb, Croatia, 2013.
  31. HRN EN 993-4:2008; Methods of Test for Dense Shaped Refractory Products—Part 4: Determination of Permeability to Gases (EN 993-4:1995). Croatian Standards Institute: Zagreb, Croatia, 2008.
  32. HRN EN ISO 15148:2004/A1:2016; Hygrothermal Performance of Building Materials and Products—Determination of Water Absorption Coefficient by Partial Immersion (ISO 15148:2002/Amd 1:2016; EN ISO 15148:2002/A1:2016). Croatian Standards Institute: Zagreb, Croatia, 2016.
  33. HRN EN 14630:2007; Products and Systems for the Protection and Repair of Concrete Structures—Test Methods—Determination of Carbonation Depth in Hardened Concrete by the Phenolphthalein Method (EN 14630:2006). Croatian Standards Institute: Zagreb, Croatia, 2007.
  34. Tang, L. Measurement of Chloride Content in Concrete with Blended Cement—An Evaluation of Repeatability and Reproducibility of the Commonly Used Test Methods; Report 1998:27; SP Swedish National Testing and Research Institute Building Technology: Boras, Sweden, 1998. [Google Scholar]
  35. HRN EN 14629:2007; Products and Systems for the Protection and Repair of Concrete Structures—Test methods—Determination of Chloride Content in Hardened Concrete (EN 14629:2007). Croatian Standards Institute: Zagreb, Croatia, 2007.
  36. NT BUILD 443; Concrete, Hardened: Accelerated Chloride Penetration. Nordtest: Esbo, Finland, 1995.
  37. NT BUILD 492; Concrete, Mortar and Cement-Based Repair Materials: Chloride Migration Coefficient from Non-Steady State Migration Experiments. Nordtest: Espoo, Finland, 1999.
  38. Bjegović, D.; Krstić, V.; Mikulić, D.; Radić, J.; Čandrlić, V. Mathematical model for durability design of reinforced concrete structures. Eng. Model. 1998, 11, 1–2. [Google Scholar]
  39. Kušter Marić, M.; Ožbolt, J.; Balabanić, G. Benchmarking chloride ingress models on real-life case studies: Krk bridge and Maslenica bridge. In Proceedings of the International Conference on Sustainable Materials, Systems and Structures (SMSS2019) Challenges in Design and Management of Structures; Mandić Ivanković, A., Kušter Marić, M., Strauss, A., Kišiček, T., Eds.; RILEM Publications S.A.R.L.: Zagreb, Croatia, 2019; pp. 108–115. [Google Scholar]
  40. Kušter Marić, M.; Ožbolt, J.; Balabanić, G. Application of the 3D chemo-hygro-thermo mechanical model on existing bridges exposed to chlorides and mechanical damages. In IOP Conference Series: Materials Science and Engineering, Proceedings of the 7th International Conference on Euro Asia Civil Engineering Forum, Stuttgart, Germany, 30 September–2 October 2019; Lie, H.A., Garrecht, H., Sharma, A., Hardjasaputra, H., Eds.; IOP Publishing: Stuttgart, Germany, 2019; Volume 8, p. 012097. [Google Scholar] [CrossRef] [Green Version]
  41. Thomas, M.D.A.; Bentz, E.C. Life-365TM Service Life Prediction ModelTM and Computer Program for Predicting the Service Life and Life-Cycle Cost of Reinforced Concrete Exposed to Chlorides, version 2.2.3; University of Toronto: Toronto, ON, Canada, 2018.
  42. Ožbolt, J.; Balabanić, G.; Periškić, G.; Kušter, M. Modelling the effect of damage on transport processes in concrete. Constr. Build. Mater. 2010, 24, 1638–1648. [Google Scholar] [CrossRef]
  43. Bajić, A. Expected airflow regimen on the Sv. Rok (South)—Maslenica motorway route. Građevinar 2003, 55, 149–158. [Google Scholar]
  44. HRN EN 13791:2019; Assessment of In-Situ Compressive Strength in Structures and Precast Concrete Components (EN 13791:2019). Croatian Standards Institute: Zagreb, Croatia, 2019.
  45. HRN EN 206-1:2006; Concrete—Part 1: Specification, Performance, Production and Conformity (includes Amendments A1:2004 and A2:2005) (EN 206-1:2000+A1:2004+A2:2005). Croatian Standards Institute: Zagreb, Croatia, 2006.
  46. Castro-Borges, P.; Mendoza-Rangel, J.M. Influence of climate change on concrete durability in Yucatan peninsula. Corros. Eng. Sci. Technol. 2010, 45, 61–69. [Google Scholar] [CrossRef]
  47. Tang, L.; Sørensen, H.E. Precision of the Nordic test methods for measuring the chloride diffusion/migration coefficients of concrete. Mater. Struct. 2001, 34, 479–485. [Google Scholar] [CrossRef]
  48. Mandić Ivanković, A.; Radić, J.; Šavor, Z. Limit state analysis for existing bridges. Građevinar 2009, 61, 533–545. [Google Scholar]
  49. Mandić, A.; Radić, J.; Šavor, Z. Limit states of existing bridges. In Codes in Structural Engineering—Developments and Needs for International Practice, Proceedings of the Joint IABSE-Fib Conference Dubrovnik 2010, Dubrovnik-Neretva, Croatia, 3–5 May 2010; Hirt, M., Radić, J., Mandić, A., Eds.; SECON-CSSE: Zagreb, Croatia, 2010; pp. 1169–1176. [Google Scholar]
  50. Skokandić, D.; Mandić Ivanković, A.; Žnidarič, A.; Srbić, M. Modelling of traffic load effects in the assessment of existing road bridges. Građevinar 2019, 71, 1153–1165. [Google Scholar] [CrossRef]
  51. Liu, J.; Liao, C.; Jin, H.; Jiang, Z.; Xie, R.; Tang, L. Electrically driven ionic transport in the RCM and RIM: Investigations based on experiments and numerical simulations. Constr. Build. Mater. 2022, 331, 127331. [Google Scholar] [CrossRef]
  52. Liu, J.; Liao, C.; Jin, H.; Jiang, Z.; Zhong, D.; Tang, L. Numerical model of the effect of water vapor environment on the chloride transport in concrete. Constr. Build. Mater. 2021, 311, 125330. [Google Scholar] [CrossRef]
  53. Liu, J.; Liao, C.; Jin, H.; Jiang, Z.; Zhou, H. Numerical and experimental research on the effect of rainfall on the transporting behavior of chloride ions in concrete. Constr. Build. Mater. 2021, 302, 124160. [Google Scholar] [CrossRef]
  54. Chase, S.B.; Adu-Gyamfi, Y.; Aktan, A.E.; Minaie, E. Synthesis of National and International Methodologies Used for Bridge Health Indices; FHWA-HRT-15-081; ROSAP: Washington, DC, USA, 2016. [Google Scholar] [CrossRef]
  55. Strauss, A.; Mandić Ivanković, A. WG1 Technical Report Performance Indicators for Roadway Bridges of Cost Action TU1406; University of Minho: Braga, Portugal, 2016. [Google Scholar]
  56. Stipanović, I.; Chatzi, E.; Limongelli, M.P.; Gavin, K.; Bukshs, Z.A.; Palic, S.S.; Xenidis, Y.; Imam, B.; Anžlin, A.; Zanini, M.; et al. WG2 Technical Report Performance Goals for Roadway Bridges of Cost Action TU1406; University of Minho: Braga, Portugal, 2017. [Google Scholar]
  57. Hajdin, R.; Kušar, M.; Mašović, S.; Linneberg, P.; Amado, J.; Tanasić, N. WG3 Technical Report Establishment of a Quality Control Plan of Cost Action TU1406; University of Minho: Braga, Portugal, 2018. [Google Scholar]
  58. Kedar, A.; Sein, S.; Panetsos, P.; Ademović, N.; Duke, A.; Ryjacek, P.; Bielecka, P.; Docevska, M.; Jurisic, M.; Karwowski, W.A.; et al. WG4 Technical Report Preparation of a Case Study of Cost Action TU1406; University of Minho: Braga, Portugal, 2019. [Google Scholar]
  59. Mandić Ivanković, A.; Strauss, A.; Kušter Marić, M. Extracting performance indicators for arch bridge assessment. In Proceedings of the 1st International Conference on Construction Materials for Sustainable Future (CoMS_2017), Zadar, Croatia, 19–21 April 2017; Banjad Pečur, I., Baričević, A., Štirmer, N., Bjegović, D., Eds.; Faculty of Civil Engineering, University of Zagreb: Zagreb, Croatia, 2017; pp. 621–628. [Google Scholar]
  60. Ren, Y.; Xu, X.; Liu, B.; Huang, Q. An Age- and Condition-Dependent Variable Weight Model for Performance Evaluation of Bridge Systems. KSCE J. Civ. Eng. 2021, 25, 1816–1825. [Google Scholar] [CrossRef]
Figure 1. The Case Study—Maslenica Motorway Bridge: (a) view, (b) micro-location with meteorological stations (MM1 and MM2), and (c) macro-location.
Buildings 12 01046 g001
Figure 2. Location of strain and corrosion gauges installed on the Maslenica Bridge.
Buildings 12 01046 g002
Figure 3. Results of corrosion monitoring after 17 years of exposure to the maritime conditions.
Buildings 12 01046 g003
Figure 4. Propagation of corrosion of the reinforcement on the pier P3 in different periods: (a) 2006, (b) 2010; (c) 2017—shortly before repair.
Buildings 12 01046 g004
Figure 5. Measured chloride profile on pier P3 (15 m above sea level, surface exposed to NNE), joint pier P3 and arch foundation F3 (10 m above sea level, surface exposed to ENE), and arch segment close to the arch foundation at pier P10 (10 m above sea level, surface exposed to ENE) in different time periods: 2006, 2010 and 2012.
Buildings 12 01046 g005
Figure 6. The total chloride content in concrete after 13 years of sea exposure: comparison of the numerical results and measured values on the Maslenica Bridge (reproduced with permission from [40], IOP Proceedings, 2019).
Buildings 12 01046 g006
Figure 7. Distribution of (a) frequencies and (b) medium speed of wind direction at the observed meteorological stations for the periods 1998–2002 (for MM1) and 2000–2002 (for MM2) (adapted with permission from [43], Croatian Association of Civil Engineers, 2003).
Buildings 12 01046 g007
Figure 8. Spider diagram of all KPI rates.
Buildings 12 01046 g008
Table 1. Structural material quantities.
Structural PartConcrete GradeConcrete
(m3)
Reinforcement
B500B
(t)
Tendons
1570/1770
(t)
SuperstructureC35/45 (precast girders)
C30/37 (deck slab)
4680765143
ArchC30/373570700
ColumnsC30/373550635
AbutmentsC30/3778078
FoundationsC20/252840185
Total 15,4202363143
Table 2. Concrete mix for the Maslenica Bridge.
ComponentType/OriginMass (kg/m3)
Cement CEM II/A-S 42,5 R, 35% slag400
Aggregate quarry Vrsi, Dmax = 16 mm1854
w/c = 0.40--
Admixture ISuperplasticizer7.40
Admixture IIAir-entraining agent0.08
Admixture IIIRetarder 0.80
Table 3. List of testing carried out on the Maslenica Bridge from 2006 to 2018.
Testing20062010201220142018
Cover meter (reinforcement location and diameter, concrete cover depth)+ + +
Concrete strength by Schmidt hammer+ + +
Crack geometry measurement+++ +
Ultrasonic pulse velocity +
Concrete strength on the drilled samples+ +
Modulus of elasticity on the drilled samples+
Chloride concentration in concrete+++
Gas permeability of concrete+ +
Half-cell potential +++
Current density +
Electrical resistivity of concrete +
Carbonatization +
Capillary absorption of concrete +
Chloride diffusivity +
Table 4. Results of some measured parameters carried out on the Maslenica Bridge from construction to 2012.
Concrete
Property
Unit1995–199620062012
x ¯ σ x ¯ σ x ¯ σ
Compressive strengthMPaDesign Value
(C 30/37)
51.8110.0766.6
(C 50/60)
4.3
Chloride
diffusion
×10−12 m2/s17.150.61//23.983.31
Gas
permeability
×10−16 m2//2.761.249.478.41
Table 5. Description of the rate of the performance indicators (R).
RDescription
1No damage, good condition, or observation that is favorable for the bridge
2Smaller defects, condition, or observation that is slightly disrupted
3Defects, conditions, or observations that, in long term (approximately 20–30 years), decrease KPIs
4Defects, conditions, or observations that, in the foreseeable future (approximately 10 years), can decrease KPIs
5Defects, conditions, or observation that, in the worst stage, present serious danger to KPIs, and intervention on the bridge is needed immediately or within 5 years, at least
Table 6. Description of weight (Wi) of a performance indicator (PIi) related to the corresponding key performance indicator (KPI).
WiDescription
0.0 ≤ Wi ≤ 0.2PI has a very small impact on the corresponding KPI.
0.2 ≤ Wi ≤ 0.4PI has a minor impact on the corresponding KPI.
0.4 ≤ Wi ≤ 0.6PI has a medium impact on the corresponding KPI.
0.6 ≤ Wi ≤ 0.8PI has a high impact on the corresponding KPI.
0.8 ≤ Wi ≤ 1.0PI has a very high impact on the corresponding KPI.
Table 7. Description of rating factor of the key performance indicators (rKPI).
rKPIDescription
0 ≤ rKPI ≤ 1Good condition—no intervention needed.
1 < rKPI ≤ 2In generally good condition—maintenance is required.
2 < rKPI ≤ 3Marginal condition—minor rehabilitation is required.
3 < rKPI ≤ 4Poor condition—repair or rehabilitation is required.
4 < rKPI ≤ 5Critical condition—repair or rehabilitation is urgent.
Table 8. Assessment of key performance indicators related to safety, reliability, and security.
Performance IndicatorsRating
(1–5)
Weighting
(0–1)
Basis for Assessment
Cracks generated during or immediately after construction30.9Visual inspection, NDT, SHM
Cracks due to temperature changes20.9Visual inspection, NDT
Corrosion-induced cracks41Visual inspection, NDT
Crumbling of concrete cover (at the safety barrier)30.4Visual inspection
Delamination/detachment of concrete cover41Visual inspection, NDT
Insufficient concrete cover41Visual inspection, measurements, NDT
Layering (concrete)30.8NDT
Concrete segregation30.8Visual inspection, NDT
Concrete strength deficiency: arch10.7Laboratory testing, NDT
Concrete strength deficiency: superstructure10.7Laboratory testing, NDT
Concrete strength deficiency: piers10.7Laboratory testing, NDT
Concrete strength deficiency: abutments10.7Laboratory testing, NDT
Concrete strength deficiency: foundations20.7Laboratory testing, NDT
Modulus of elasticity: arch10.7Laboratory testing
Modulus of elasticity: superstructure10.7Laboratory testing
Modulus of elasticity: piers10.7Laboratory testing
Modulus of elasticity: abutments10.7Laboratory testing
Modulus of elasticity: foundations20.7Laboratory testing
Gas permeability: arch41Laboratory testing
Gas permeability: piers51Laboratory testing
Arch displacement (ratification needed)10.7Visual inspection, SHM
Sag/deformation/denivelation/differential displacement11Visual inspection, SHM
Absent (missing) structural component10.8Visual inspection
Prestressing cable failure: superstructure10.8Visual inspection, NDT
Carrying capacity factor10.8Design project, structural assessment
Stiffness10.5Design project, structural assessment
Damping11Load-testing prior to the bridge opening, numerical analysis
Frequency11Load-testing prior to the bridge opening, structural assessment
Vibrations/oscillations10.8Load-testing prior to the bridge opening, structural assessment
Reliability index10.5Design project, assessment, numerical analysis
Safety index10.3Design project, structural assessment
Element functionality level11Visual inspection, design project, structural assessment
Importance of bridge element40.8Design project, structural assessment, visual inspection
Asphalt pavement cracking40.5Visual inspection
Deterioration of equipment component-stairs in arch50.2Visual inspection
Approach slab settlement10.2Visual inspection
Asphalt pavement wearing and tearing (rutting, raveling)40.3Visual inspection
Asphalt pavement wheel tracking and wrinkling and undulation40.4Visual inspection
Blistering of protective coating30.8Visual inspection
Cornicles and curbs defects30.3Visual inspection
Corrosion related to equipment made of steel40.9Visual inspection
Deterioration of protective coatings (e.g., corrosion protection, impregnation)40.8Visual inspection
Waterproofing deterioration/loss20.5Visual inspection
Drainage 20.3Visual inspection
Bearings: displacement/deformations/defects30.5Visual inspection
Insufficient height of railing (safety barrier)10.3Visual inspection
Expansion joint (waterproof, damage)40.7Visual inspection
Assessment of traffic load10.7Structural assessment
Assessment of wind load10.7Structural assessment
Assessment of seismic load10.7Structural assessment
Seismic activity of the area40.8Structural assessment
Extreme traffic load20.5Structural assessment
Extreme wind40.5Structural assessment
Inadequate clearance10.3Environmental conditions, design project
Erosion10.1Environmental conditions, Design project
Settlement10.5Environmental conditions, Design project
Wetting–drying 40.9Environmental conditions, Meteorological monitoring
Carbonation depth20.8Laboratory testing
Pitting corrosion (chlorides)31Laboratory testing, NDT, SHM, service life prediction
Aggressive environment (chloride content)50.9Laboratory testing, NDT, SHM, service life prediction
Corrosion rate (electrical potential, current density)40.9Laboratory testing, NDT, SHM, service life prediction
Impact (e.g., of vehicles or ships)10.3Environmental conditions, Design project
Rockfall10.5Environmental conditions, Design project
Scour 10.5Environmental conditions, Design project
Total Rating2.98
Table 9. Assessment of key performance indicators related to availability and maintainability.
Performance IndicatorsRating
(1–5)
Weighting
(0–1)
Basis for Assessment
Cracks generated during or immediately after construction30.9Visual inspection, NDT, SHM
Insufficient concrete cover41Visual inspection, NDT
Concrete segregation30.8Visual inspection, NDT
Gas permeability: arch41Laboratory testing
Gas permeability: piers51Laboratory testing
Capillary absorption51Laboratory testing
Honeycomb (bed concrete compaction)30.8Visual inspection, NDT
Arch displacement (ratification needed)10.7Visual inspection, SHM
Asphalt pavement cracking40.5Visual inspection
Deterioration of equipment component-stairs in arch51Visual inspection
Asphalt pavement wearing and tearing (rutting, raveling)40.6Visual inspection
Asphalt pavement wheel tracking and wrinkling and undulation40.4Visual inspection
Blistering of protective coating30.8Visual inspection
Cornicles and curbs defects30.3Visual inspection
Corrosion related to equipment made of steel40.4Visual inspection
Deterioration of protective coatings (e.g., corrosion protection, impregnate…)40.8Visual inspection
Waterproofing deterioration/loss20.5Visual inspection
Drainage 20.3Visual inspection
Bearings displacement/deformations/defects30.8Visual inspection
Expansion joint (waterproof, damage)40.8Visual inspection
Damage degree/extension50.8Visual inspection, NDT, laboratory testing, service life prediction
Deterioration index40.8Visual inspection, NDT, laboratory testing, service life prediction
Importance of the bridge in the network51Location, traffic conditions, meteorological monitoring
Extreme traffic load—summer (tourist) season51Location, traffic conditions
Extreme wind—winter season51Location, traffic conditions, meteorological monitoring
Total Rating3.87
Table 10. Assessment of key performance indicators related to costs.
Performance IndicatorsRating
(1–5)
Weighting
(0–1)
Basis for Assessment
Crack and concrete cover repair50.5Visual inspection, NDT
Replacement of asphalt40.2Visual inspection, data on maintenance
Application of protective coating50.5Visual inspection, NDT, laboratory testing, service life prediction
Replacement of bearings 30.3Visual inspection, data on maintenance
Replacement of expansion joints40.4Visual inspection, data on maintenance
Deterioration of equipment component-stairs in arch50.3Visual inspection, data on maintenance
Reliability index10.5Visual inspection, NDT, laboratory testing, structural assessment
Remaining service life40.7Visual inspection, NDT, laboratory testing, service life prediction
Traffic restrictions30.5Location, traffic conditions, meteorological monitoring
Traffic volume (annual average daily traffic)30.3Location, traffic conditions, meteorological monitoring
Importance of the bridge in the network51Location, traffic conditions, meteorological monitoring
Road category (roadway width)50.8Traffic conditions
Detour distance20.3Location, traffic conditions, meteorological monitoring
Bridge span40.5Design project
Bridge length40.5Design project
Seismic activity of the area40.5Design project
Aggressive maritime environment51Location, meteorological monitoring, service life prediction
Total Rating4.10
Table 11. Assessment of key performance indicators related to the environment.
Performance IndicatorsRating
(1–5)
Weighting
(0–1)
Basis for Assessment
Emissions to the air20.5Location, traffic conditions, design project
Emissions to the sea/water20.3Location, traffic conditions, design project
Emissions to the soil20.3Location, traffic conditions, design project
Impact (e.g., of vehicles or ships)10.8Location, traffic conditions, design project
Total Rating1.58
Table 12. Assessment of key performance indicators related to health and politics.
Performance IndicatorsRating (1–5)WeightingBasis for Assessment
Deterioration index40.8Visual inspection, NDT, laboratory testing, service life prediction
Importance of the bridge in the network51Location, traffic conditions, meteorological monitoring
Noise10.5Location, traffic conditions, environment
Total Rating3.78
Table 13. Assessment of the key performance indicators (KPIs) for the case study bridge.
KPITotal Rating
Safety, reliability, and security2.98
Availability and maintainability3.87
Costs4.10
Environment1.58
Health and politics3.78
Publisher’s Note: MDPI stays neutral with regard to jurisdictional claims in published maps and institutional affiliations.

