Article

Fracture and Damage Characteristics of Granite under Uniaxial Disturbance Loads

1
School of Civil Engineering and Architecture, Wuhan University of Technology, Wuhan 430070, China
2
School of Civil Engineering, Shaoxing University, Shaoxing 312000, China
3
Hubei Key Laboratory of Roadway Bridge and Structure Engineering, Wuhan University of Technology, Wuhan 430070, China
4
Key Laboratory of Geotechnical and Structural Engineering Safety of Hubei Province, School of Civil Engineering, Wuhan University, Wuhan 430070, China
*
Author to whom correspondence should be addressed.
Buildings 2022, 12(7), 1008; https://doi.org/10.3390/buildings12071008
Submission received: 18 June 2022 / Revised: 6 July 2022 / Accepted: 8 July 2022 / Published: 13 July 2022
(This article belongs to the Special Issue Advanced Seismic Technologies in Underground Structures)

Abstract

:
To investigate the mechanical properties and damage characteristics of granite under frequent disturbance loads in the process of underground engineering construction, laboratory uniaxial compression tests were conducted on granite under combined dynamic and static loading conditions. The following conclusions were reached: (1) under a dynamic disturbance, the failure stress of granite grows gradually as the initial stress and disturbance load rise due to the coupling of damage and strain-rate effect; (2) the characteristic stresses of granite specimens grow with the increasing amplitude of disturbance Δσ under the disturbing loads; with the same Δσ, the characteristic stresses show an increase trend with the increasing initial stress σm; (3) the particle size distribution of rock fragments broken under the disturbance load follows the fractal law, and the fractal dimension F gradually enlarges with the growth of Δσ, indicative of an increased degree of fragmentation; and (4) the damage variable grows rapidly at first, then steadily, and, finally, shows a rapid growth trend again under the disturbance loads. The Δσ significantly influences the number of cycles and rate of change of the damage variable during the steady increase. This research has certain theoretical significance and engineering guidance value for dynamic disaster recognition and control.

1. Introduction

In geotechnical engineering and mine and rock mechanics, the stability of rocks is generally impaired by frequent disturbances. Especially in the underground excavation, the rock mass is subjected to the combination of high static load and frequent or cyclic external disturbances, among which the external disturbances include blasting, earthquake, mechanical vibration, etc. [1,2,3,4]. Under these conditions, the stress redistribution within a certain range caused by rock excavation and the external disturbance is the main cause of the frequent occurrence of disasters, such as rockbursts [5,6,7]. The strain rates for remote seismic and mechanical vibration loads range from 10−4/s to 10−2/s, which are quite different from the static loads’ strain rates of less than 10−4/s. The mechanical properties of rock vary greatly under high static stress and external disturbance [8,9]. Therefore, research on the mechanical properties and damage effect of rocks under disturbance loads is important for prevention of disasters and accidents in underground engineering operations.
In recent years, numerous scholars have conducted many experimental studies on the fracture characteristics of different types of rocks under cyclic loads. Zhu et al. [10] developed a disturbance electro-hydraulic servo triaxial test system. A series of disturbance relaxation tests on marble with different frequencies and amplitudes were carried out. The influence of cyclic disturbance parameters on the relaxation amplitude, relaxation rate, and peak stress was analyzed. Ghasemi et al. [11] conducted monotonic and cyclic loading tests on gabbro specimens to study the evolution of micro-cracking therein under static and dynamic loading. The results indicated that compared with monotonic loading, cyclic loading facilitates the extension of micro-cracks earlier in the rock specimens, and the micro-cracks are longer. In order to study the deformation characteristics of brittle hard rock under cyclic disturbance loading, Cheng et al. [12] carried out cyclic loading and unloading tests at different loading and unloading rates, and analyzed the stress–strain curve‘s modulus elasticity. Wang et al. [13] conducted multi-level compressive cyclic loading experiments to investigate the fracture evolution of naturally fractured granite using acoustic emission monitoring and post-test CT (Computer Tomography) scanning. Xu et al. [14] conducted a series of conventional uniaxial compression tests and cyclic loading tests on sandstone specimens and revealed that the maximum stress and the amplitude of the disturbance stress were the main factors influencing the fatigue life of sandstone. Meanwhile, the larger the maximum stress and the amplitude of the disturbance stress, the shorter the fatigue life of sandstone specimens. Manouchehrian et al. [15] established a tunnel numerical model and simulated the rock mass failure with static and dynamic loads. The results showed that the disturbance can accelerate the tunnel failure. Yang et al. [16] developed a loading method applicable to granite specimens under combined dynamic and static loading conditions. By using the method, they revealed changes in the mechanical properties of granite before and after loading and verified that the method is feasible through tests. Chen et al. [17] studied the influences of disturbance loads of different frequencies and amplitudes on the stress–strain characteristics, damage evolution, and failure modes of sandstone. The results show that the degree of fragmentation and ductility of the rock specimens both increase with the increasing frequency and amplitude of disturbance. Su et al. [18] conducted a true triaxial experimental study and found that under the action of low-frequency periodic disturbance, the threshold values of the axial static stress and amplitude of the disturbance load existed in a rockburst. Moreover, many scholars also have explored the mechanical properties of rocks under cyclic loading from the perspectives of acoustic emission (AE) characteristics, infrared thermography, and energy dissipation [19,20,21,22,23,24,25,26,27,28,29].
The aforementioned research has proved fruitful and is of important theoretical significance and guiding significance in engineering for those seeking to understand the failure mechanism of rocks under disturbance loads. However, most researchers focus on the deformation and mechanical characteristics of rocks under different initial stresses and disturbance loads, while seldom studying the fracture mechanism and damage characteristics of rocks under cyclic disturbance loads. Considering this, granite collected from the deep underground powerhouse in Shuangjiangkou Hydropower Station in Sichuan Province, China, was taken as the research object to conduct mechanical tests under low-frequency cyclic disturbances. On this basis, the characteristic stresses, fractal dimensions of fragments, and damage evolution of deeply buried rocks under dynamic disturbances were investigated, which has important theoretical significance and engineering guidance value for dynamic disaster recognition and control.

2. Materials and Methods

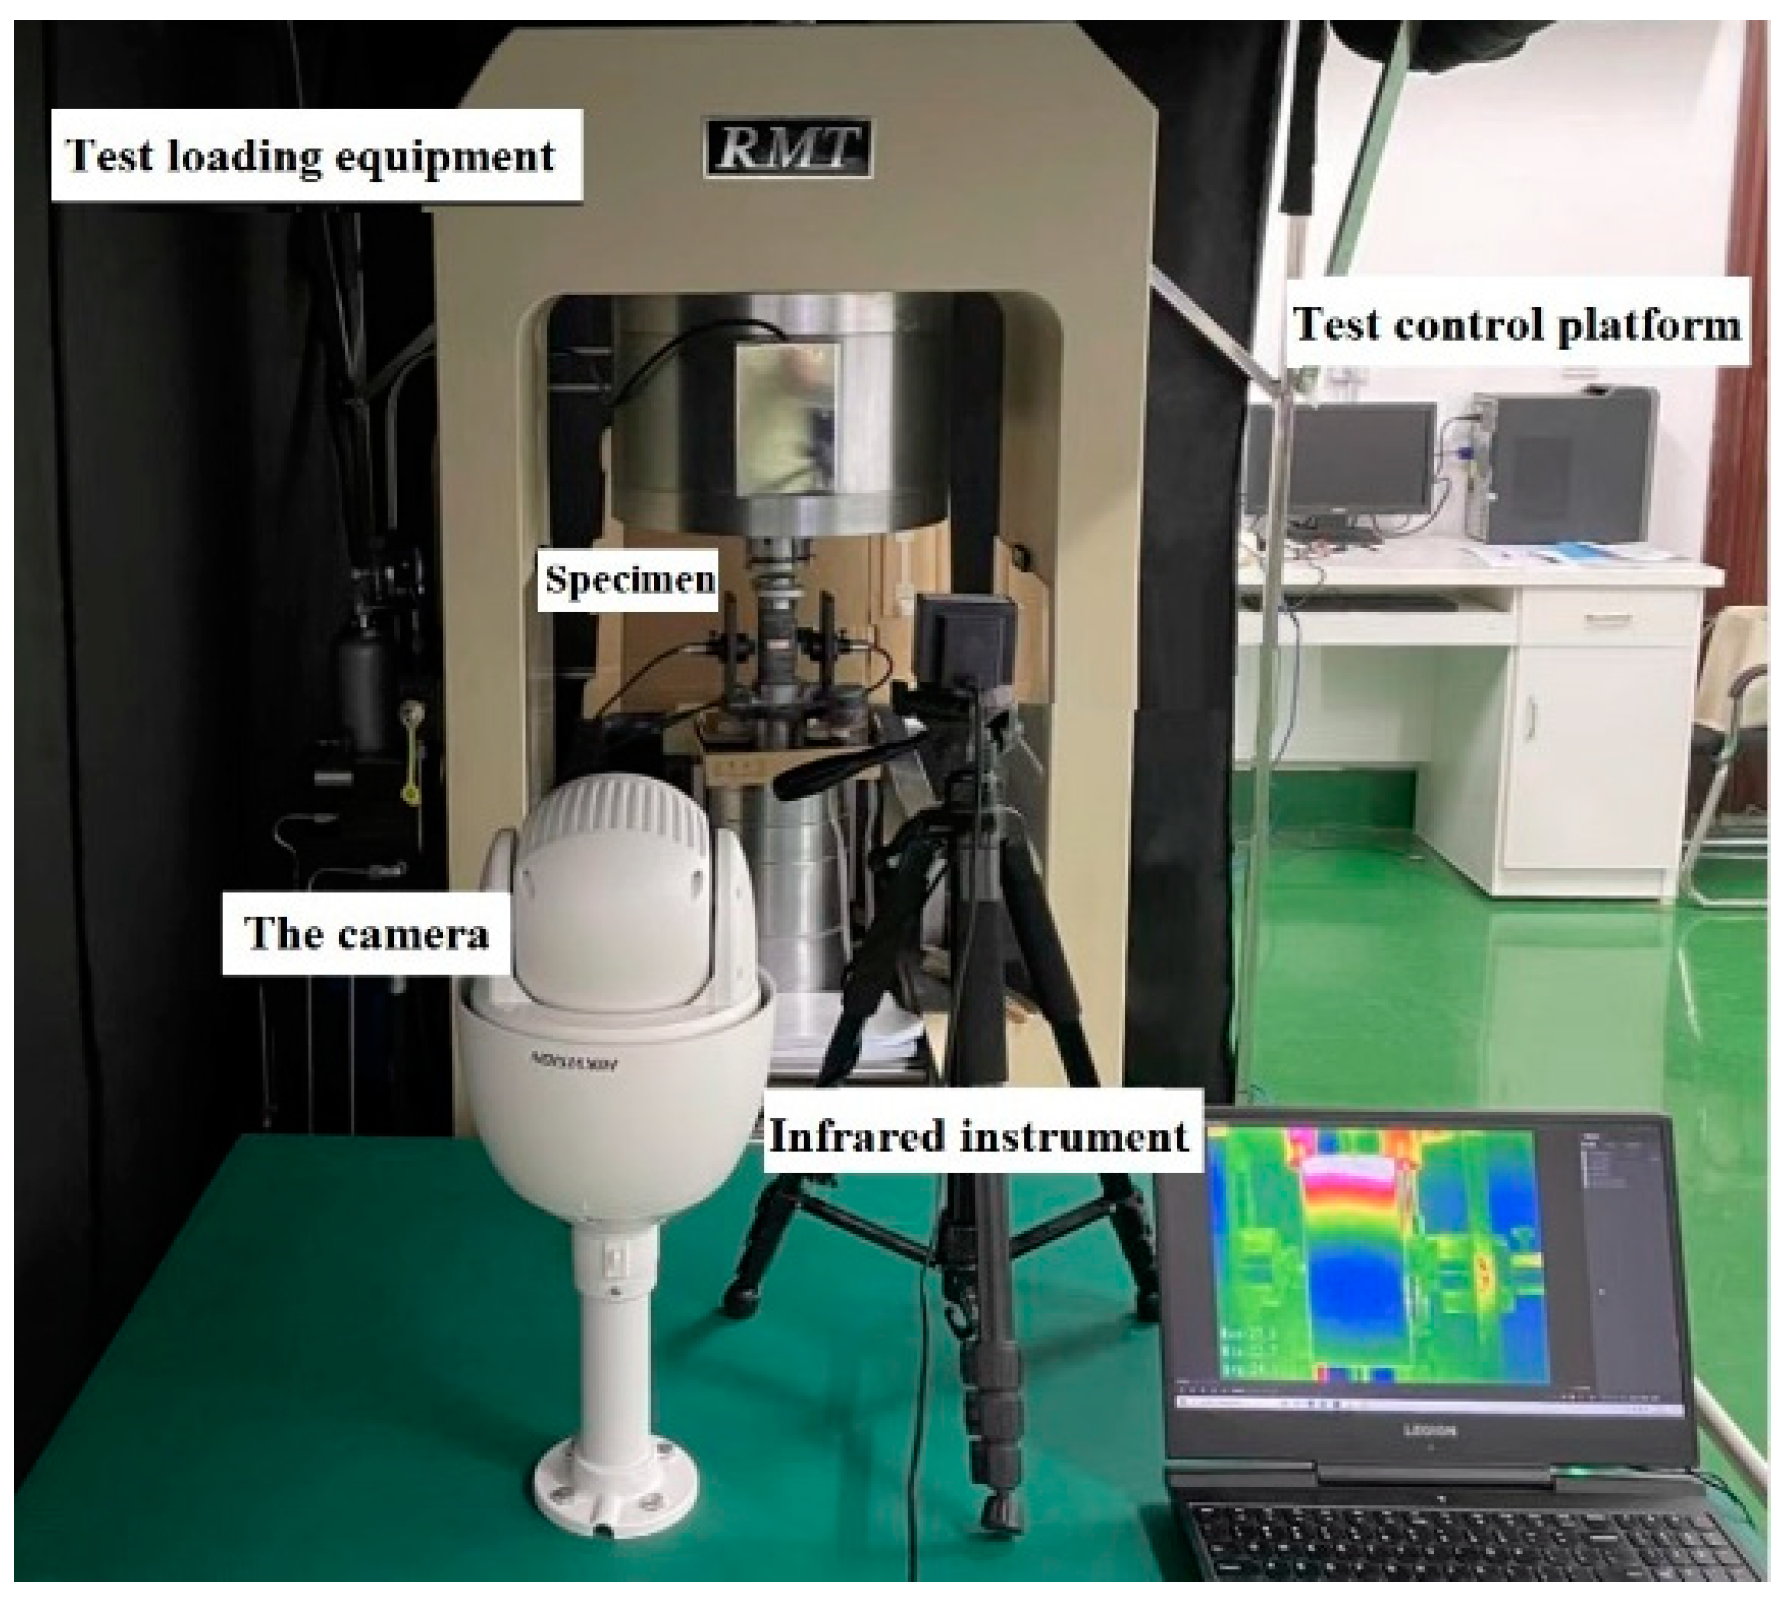
2.1. Test System and Specimen Preparation
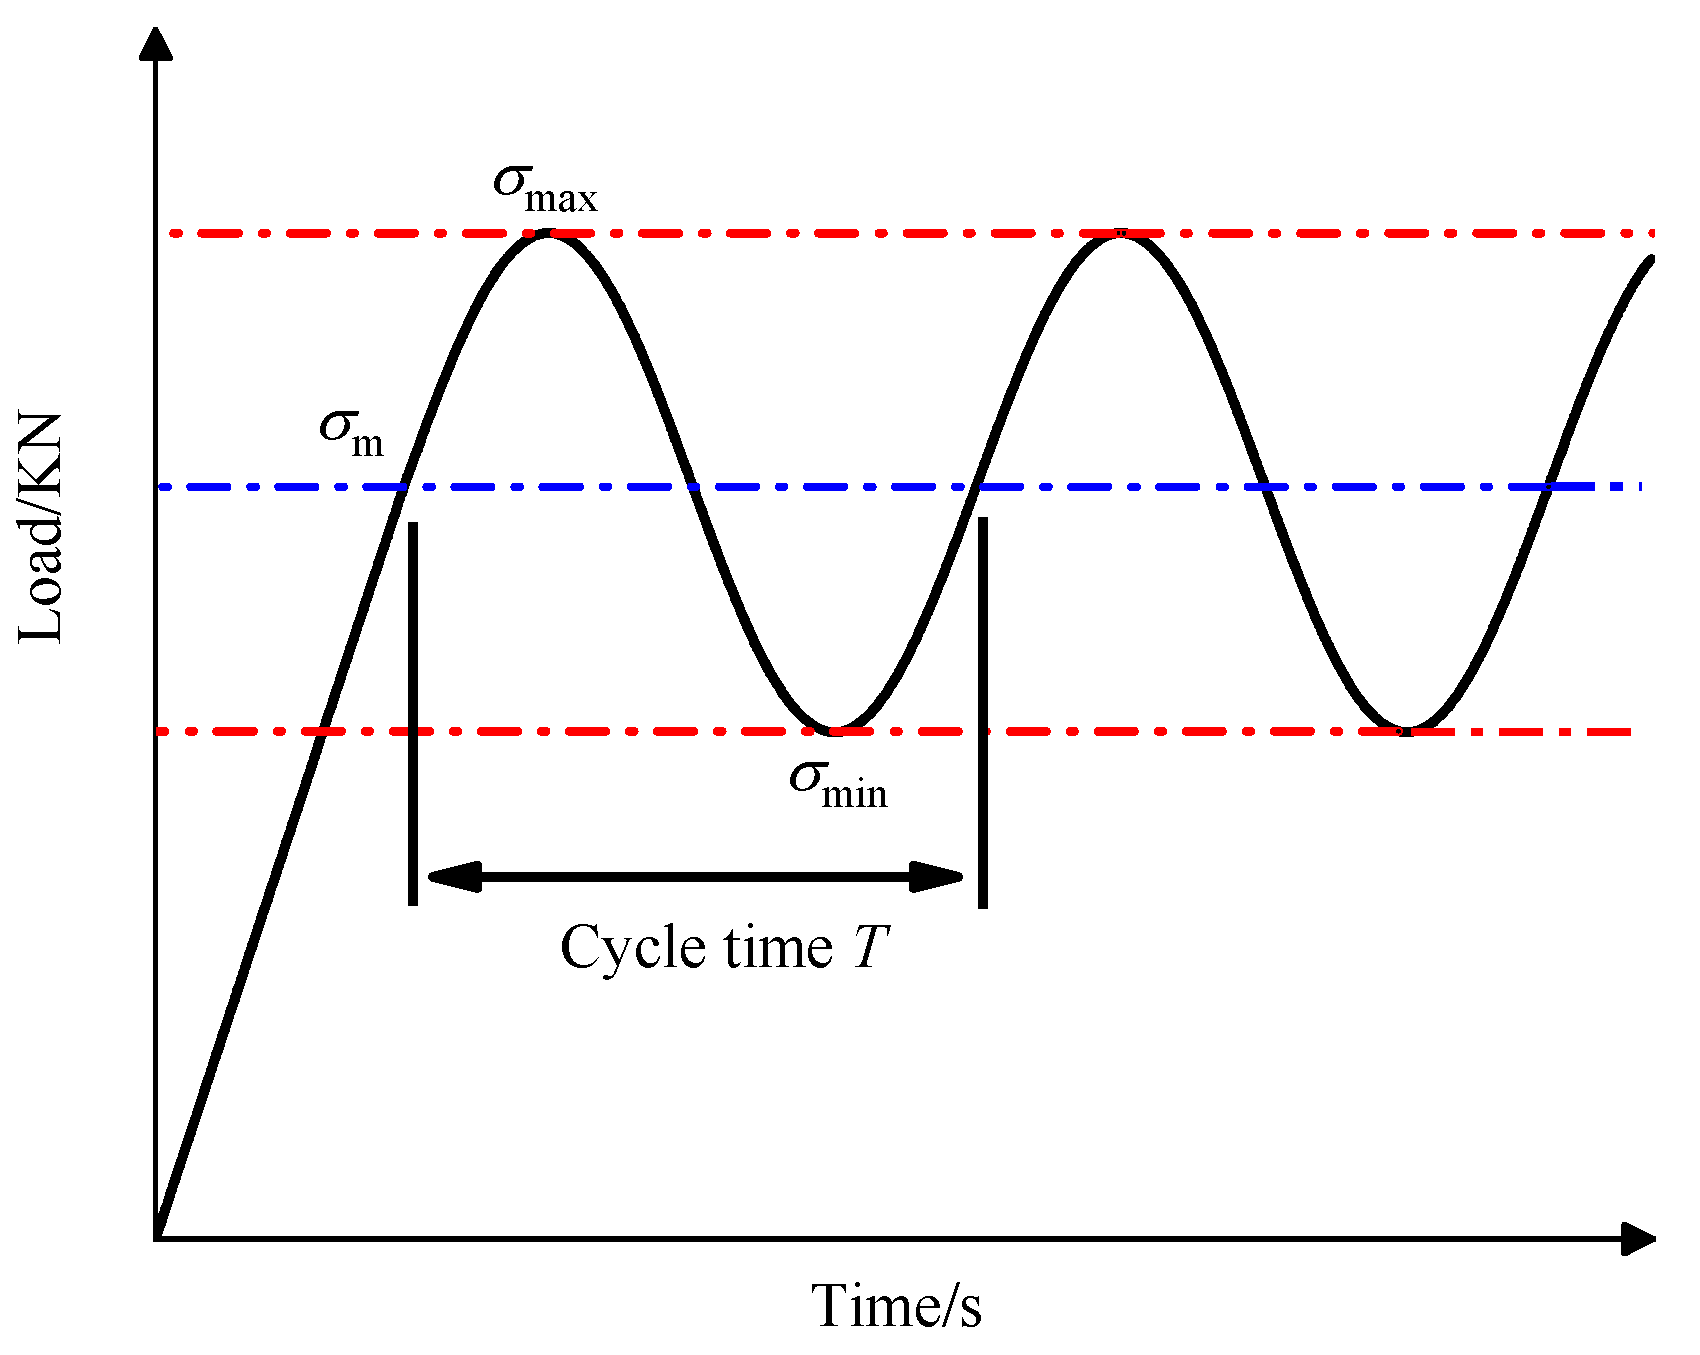
The apparatus used in the test was an RTM electro-hydraulic servo test system developed by the Institute of Rock and Soil Mechanics, Chinese Academy of Sciences (Figure 1). Consisting mainly of a loading system, a measurement system, and a control system, the system can realize axial cyclic disturbance loading from 0 to 500 kN at frequencies from 0 to 20 Hz and can accurately, and in real-time, measure the mechanical properties of the specimens.
The granite used in the test was collected from the underground powerhouse of Shuangjiangkou Hydropower Station in Sichuan Province, containing fine and uniform grains, tight textures, and few pre-existing cracks. With an intact structure, the rock specimens mainly comprise minerals including quartz (33%), potassium feldspar (26%), and plagioclase (36%), as well as accessory minerals (3%), such as black mica (Figure 2). After indoor coring, the granite was processed into standard cylinder specimens with a length of 100 mm and a diameter of 50 mm. The unevenness is less than 0.5 mm on both ends, and the tolerances on the diameter and height are within 0.3 mm. The two ends are perpendicular to the axis of the specimen, with the largest angle of deviation being no greater than 0.25°, which meets the requirements of the standard. The RMT electro-hydraulic servo test system was used to conduct uniaxial compression tests. The stress–strain curves are shown in Figure 3, and the basic parameters of the natural water content specimen (i.e., in the natural state) are shown in Table 1.

2.2. Test Schemes

Uniaxial dynamic and static combined loading was used in the tests (Figure 4). The stress control was used to apply axial static loads slowly on the specimens initially. After loading to the initial stress σm, cyclic disturbance loads with a sinusoidal waveform were applied. In the figure, T represents a loading cycle, and the upper and lower limits of disturbance loads are σmax and σmin, respectively, so the amplitude of disturbance is Δσ = σmaxσmin.
The test schemes are listed in Table 2. At first, axial static loads are applied to the rock specimens at a rate of 1 kN/s to 60%, 70%, and 80% of the uniaxial compressive strength (UCS). The loading rate of 1 kN/s is based on the recommended range of test specification (Rock Test Code for SL/T 264-2020 for Water Conservancy and Hydropower Engineering) and the existing research results [30,31]. Afterwards, disturbance loads with amplitudes of 20, 30, and 40 MPa are applied, and the tests continue until failure of the specimens. In deep rock engineering, the dynamic disturbance loads are the main sources of low-frequency cyclic disturbance loads [18]. These loads include stress waves propagating from a distant blasting source, seismic waves emitted from failure of a large volume of rocks near a cavern under excavation, vibration waves induced by mechanical drilling or low-frequency vibration of heavy equipment, and seismic waves triggered by natural earthquakes. Therefore, the cyclic disturbances frequency is set to 1 Hz for simulation of the conditions of deeply buried rock under different intensities of disturbance loads in an environment of certain static loads.

3. Results

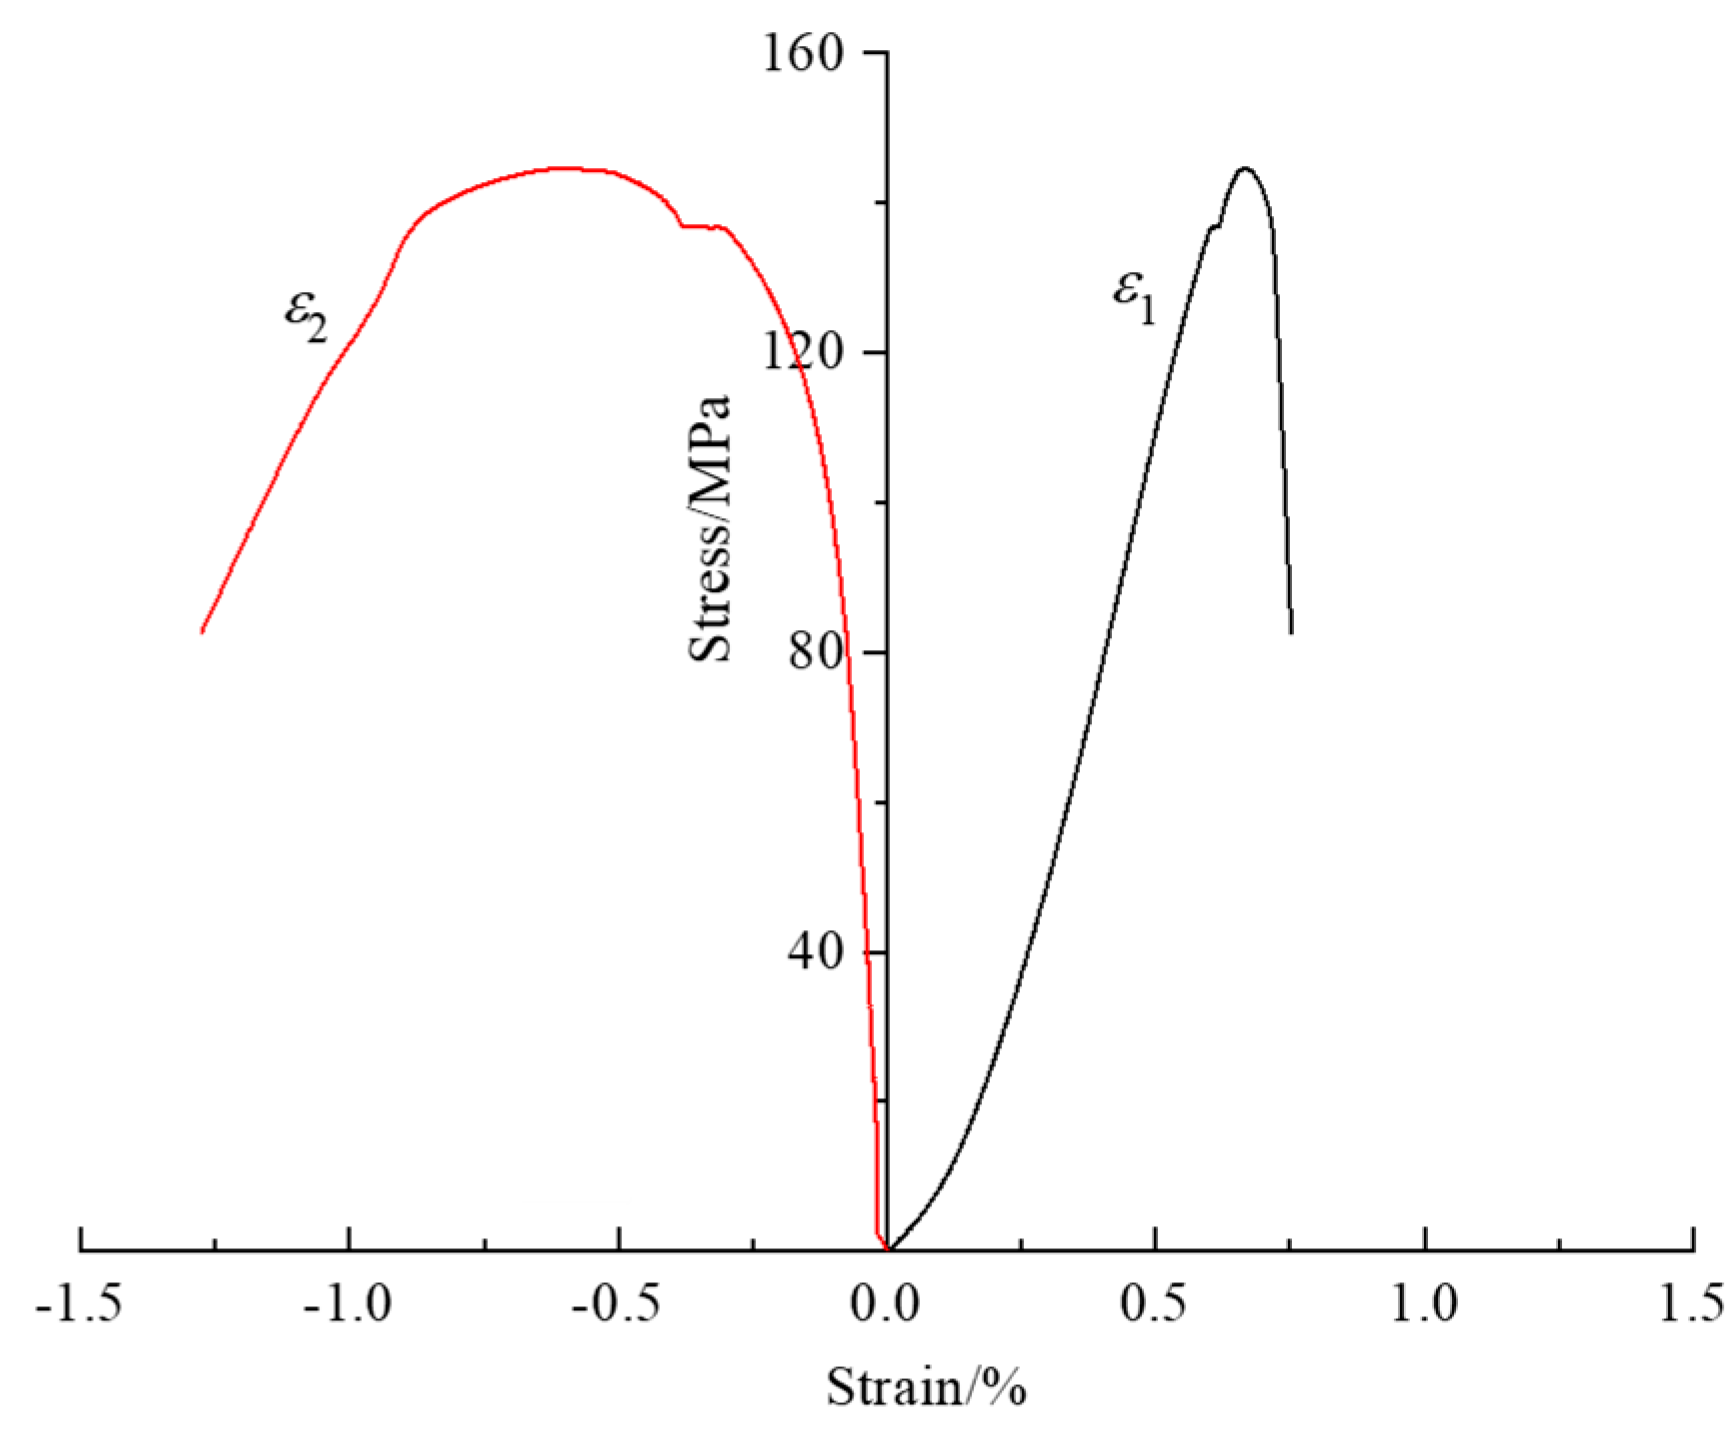
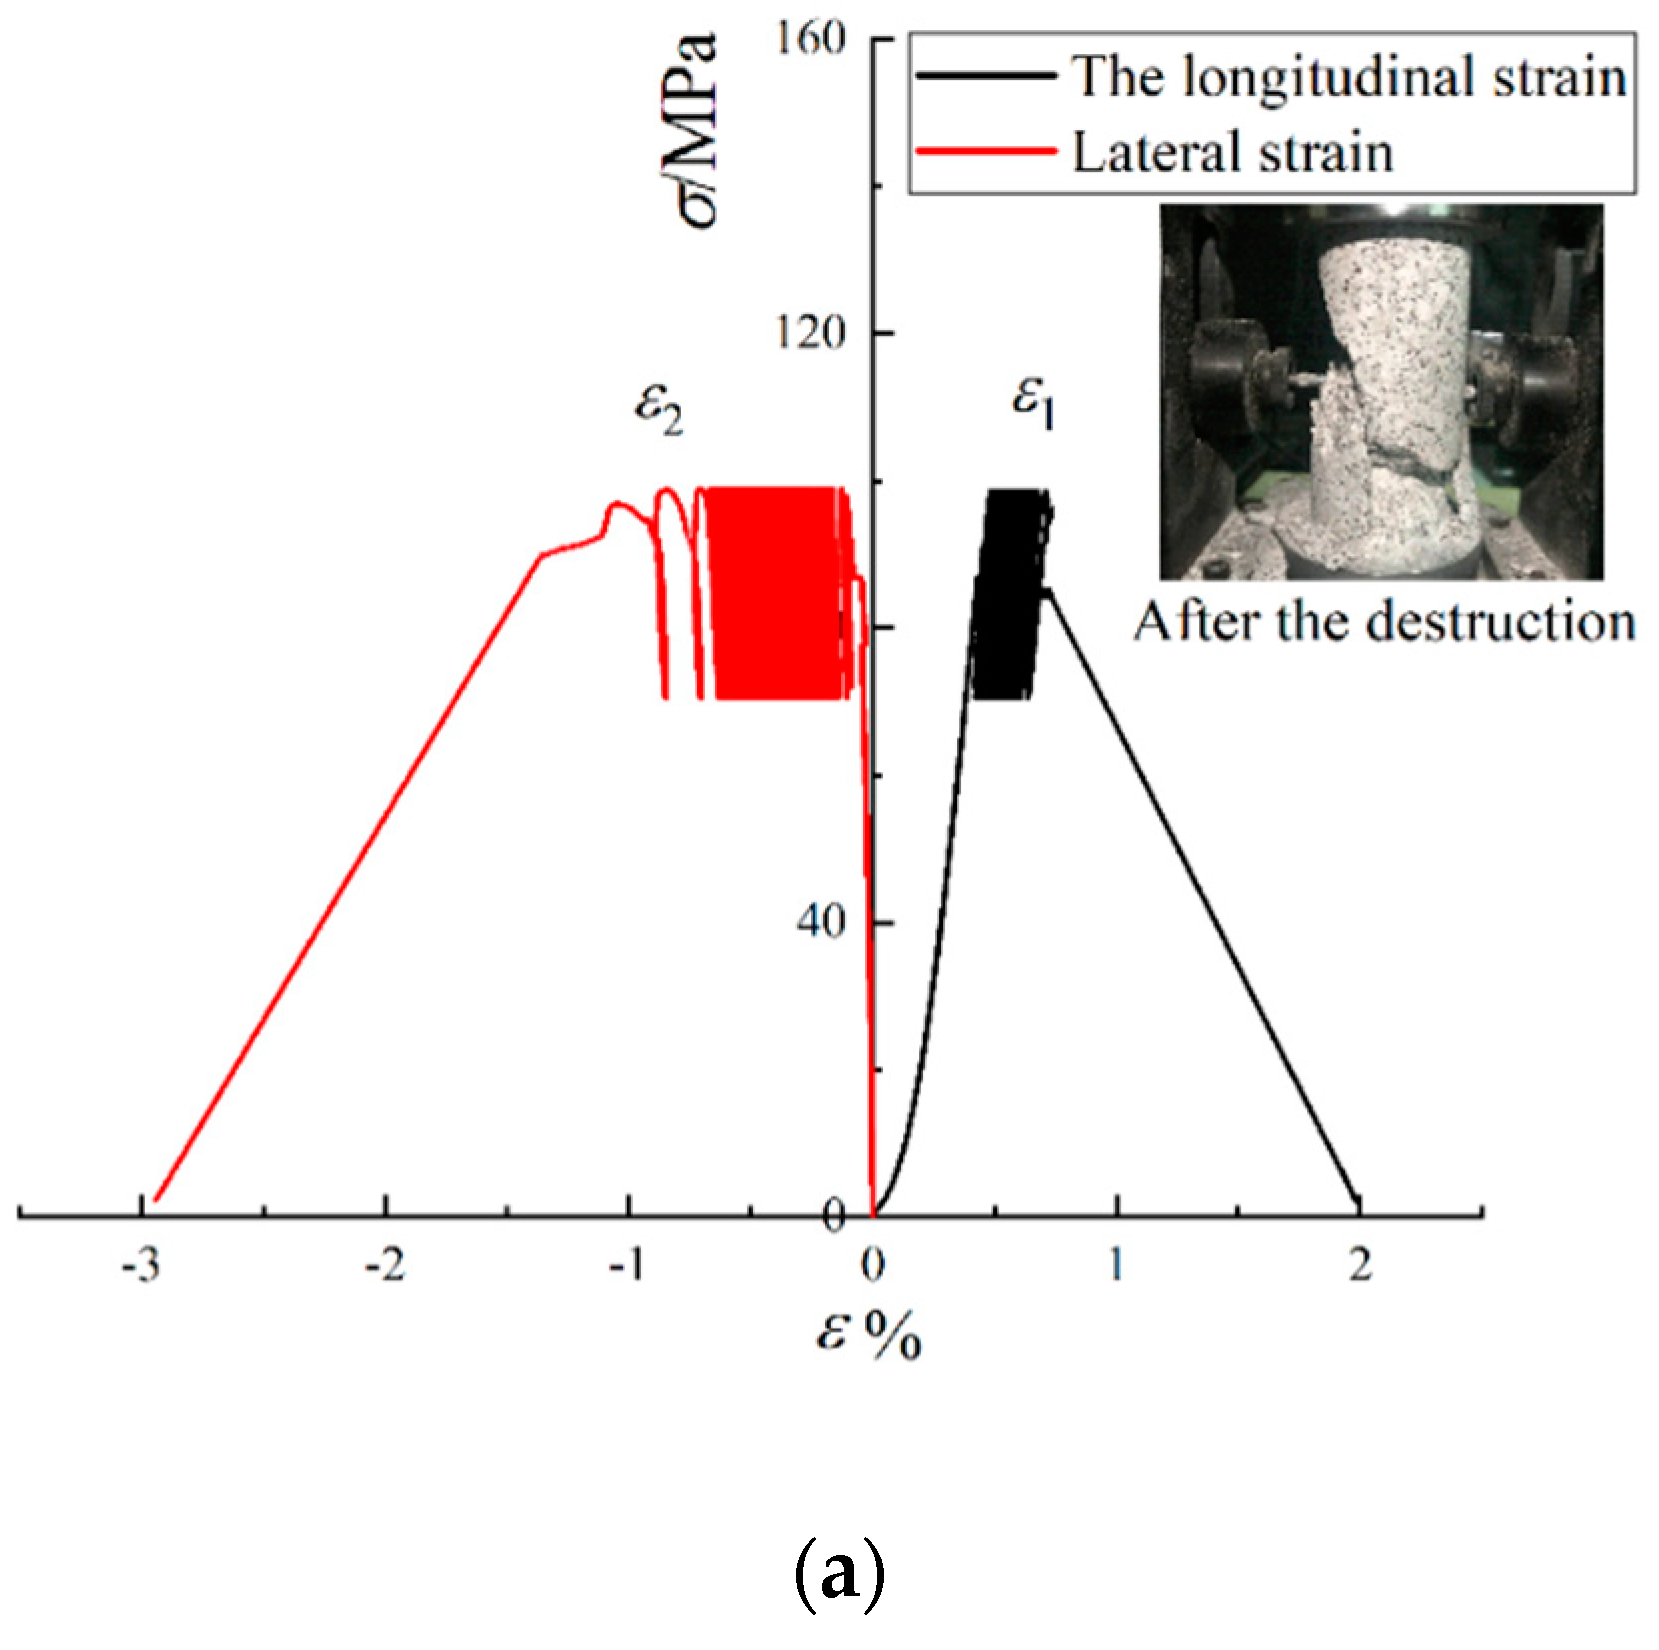
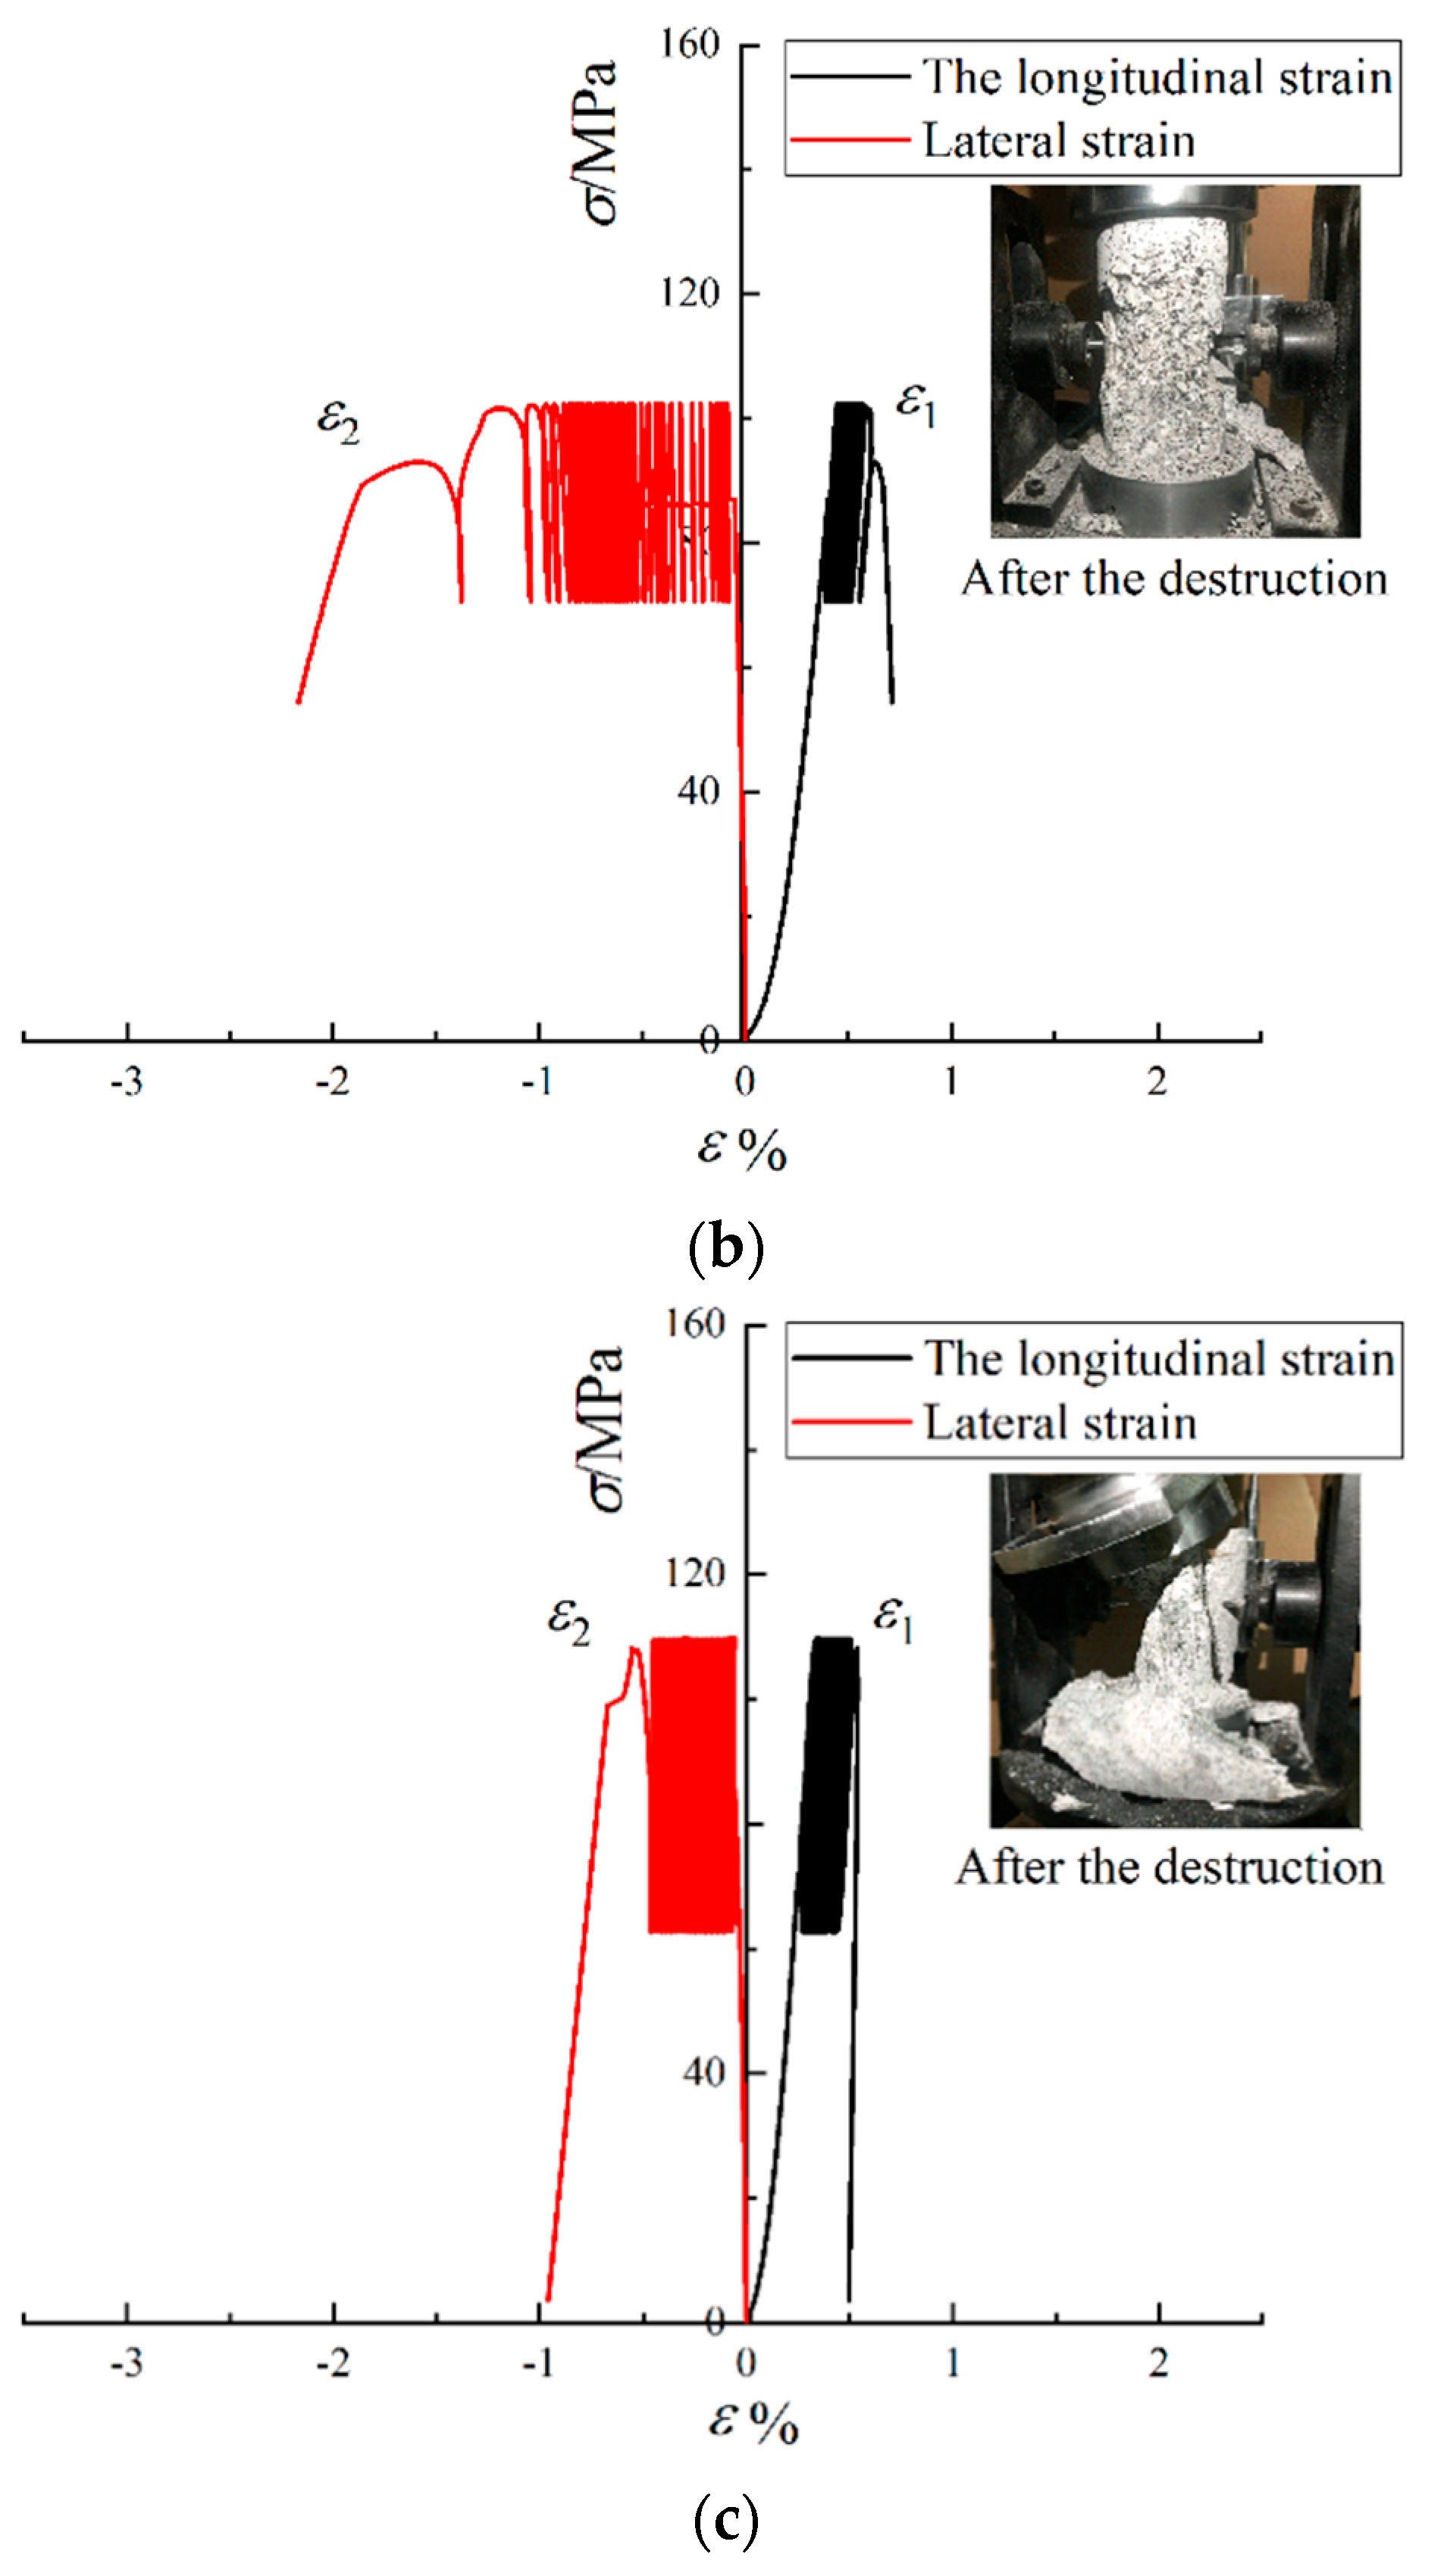
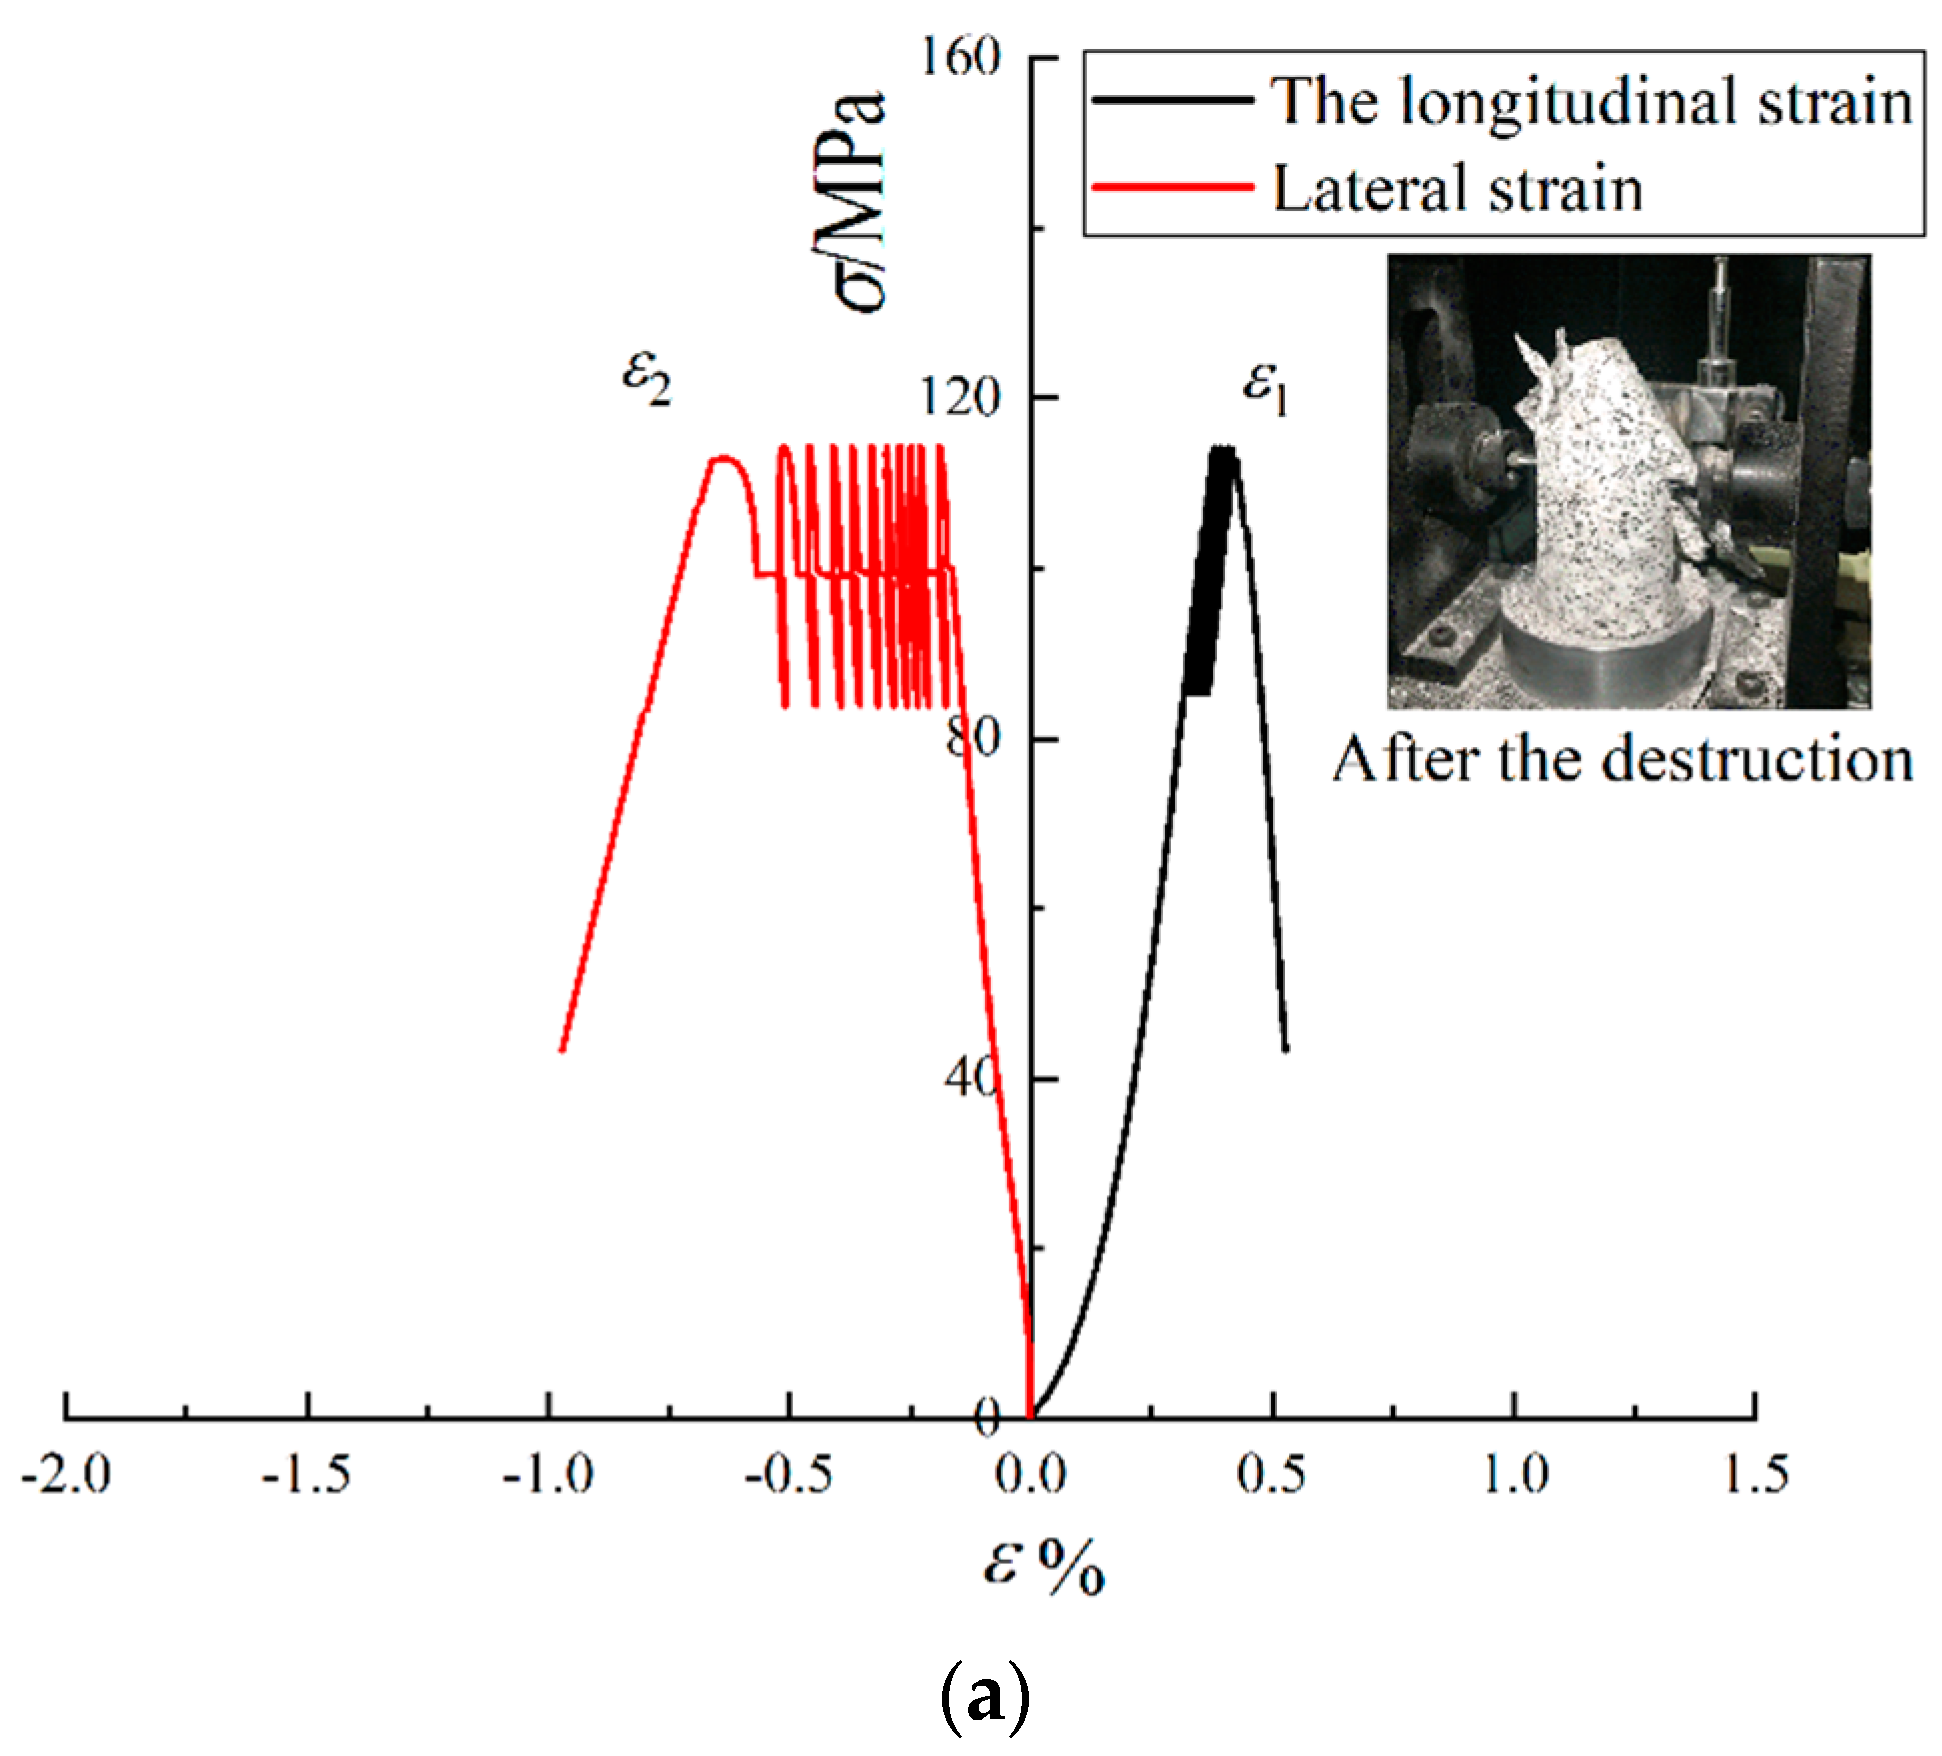
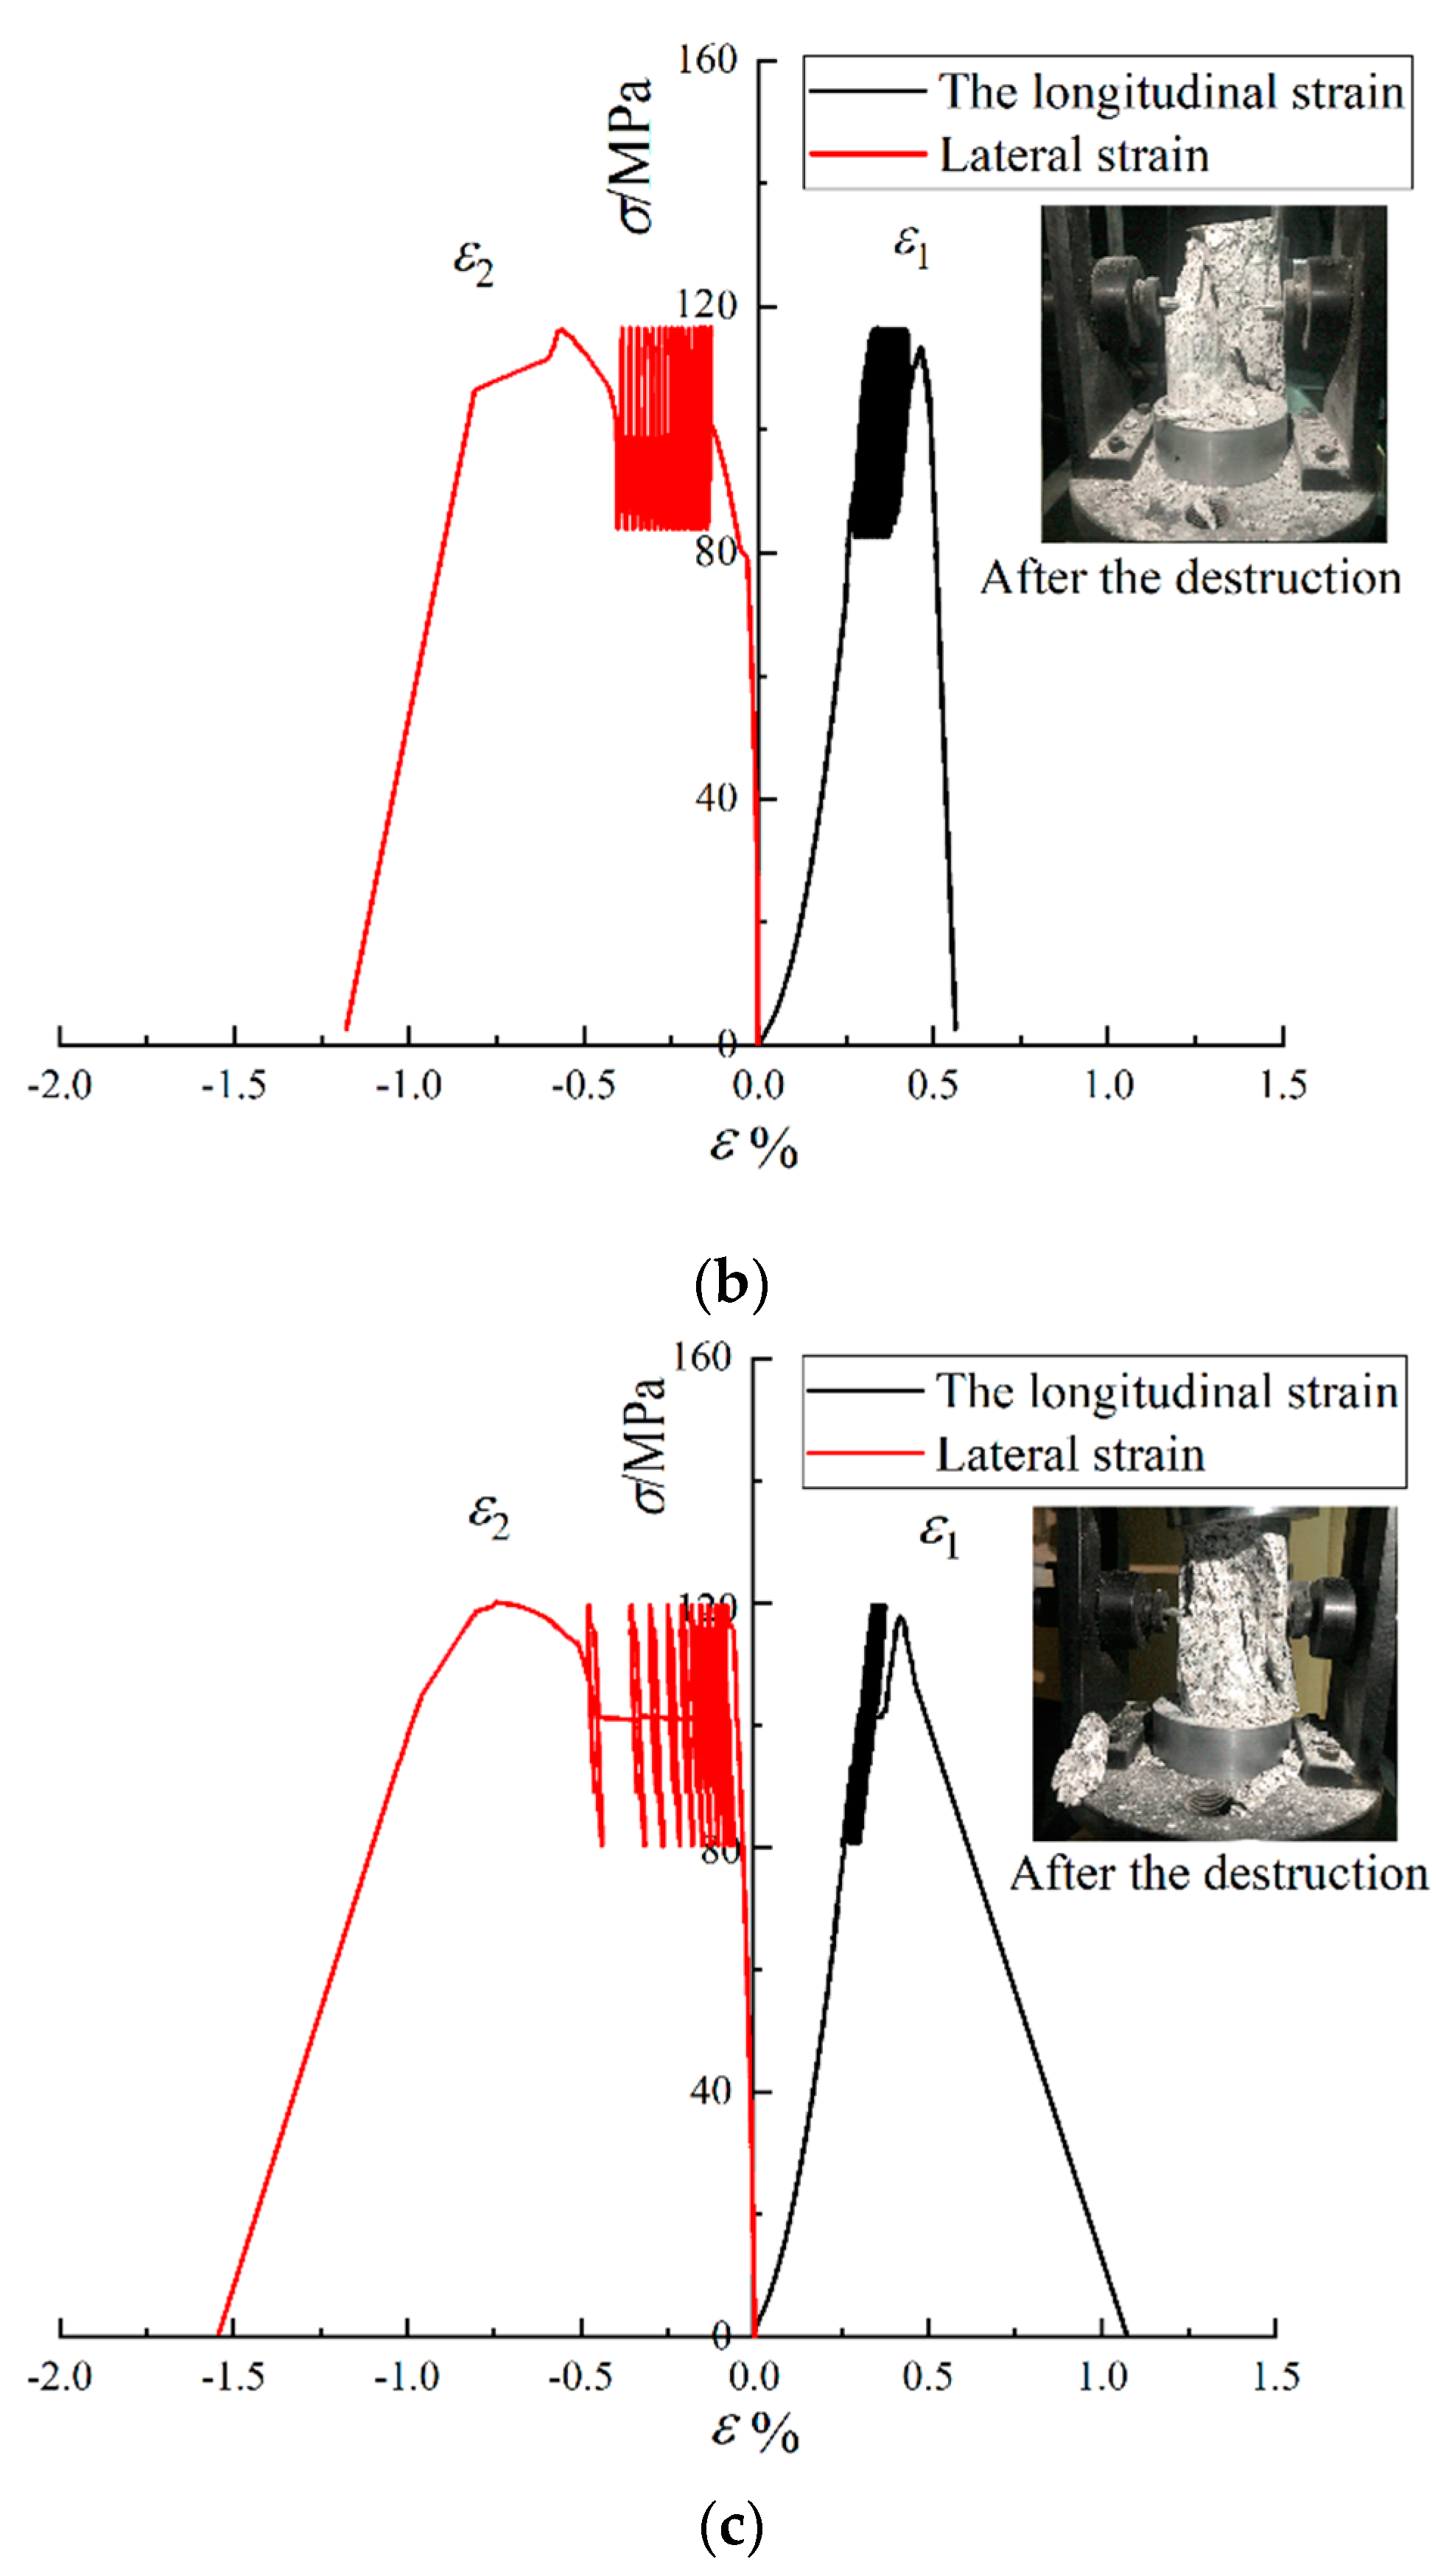
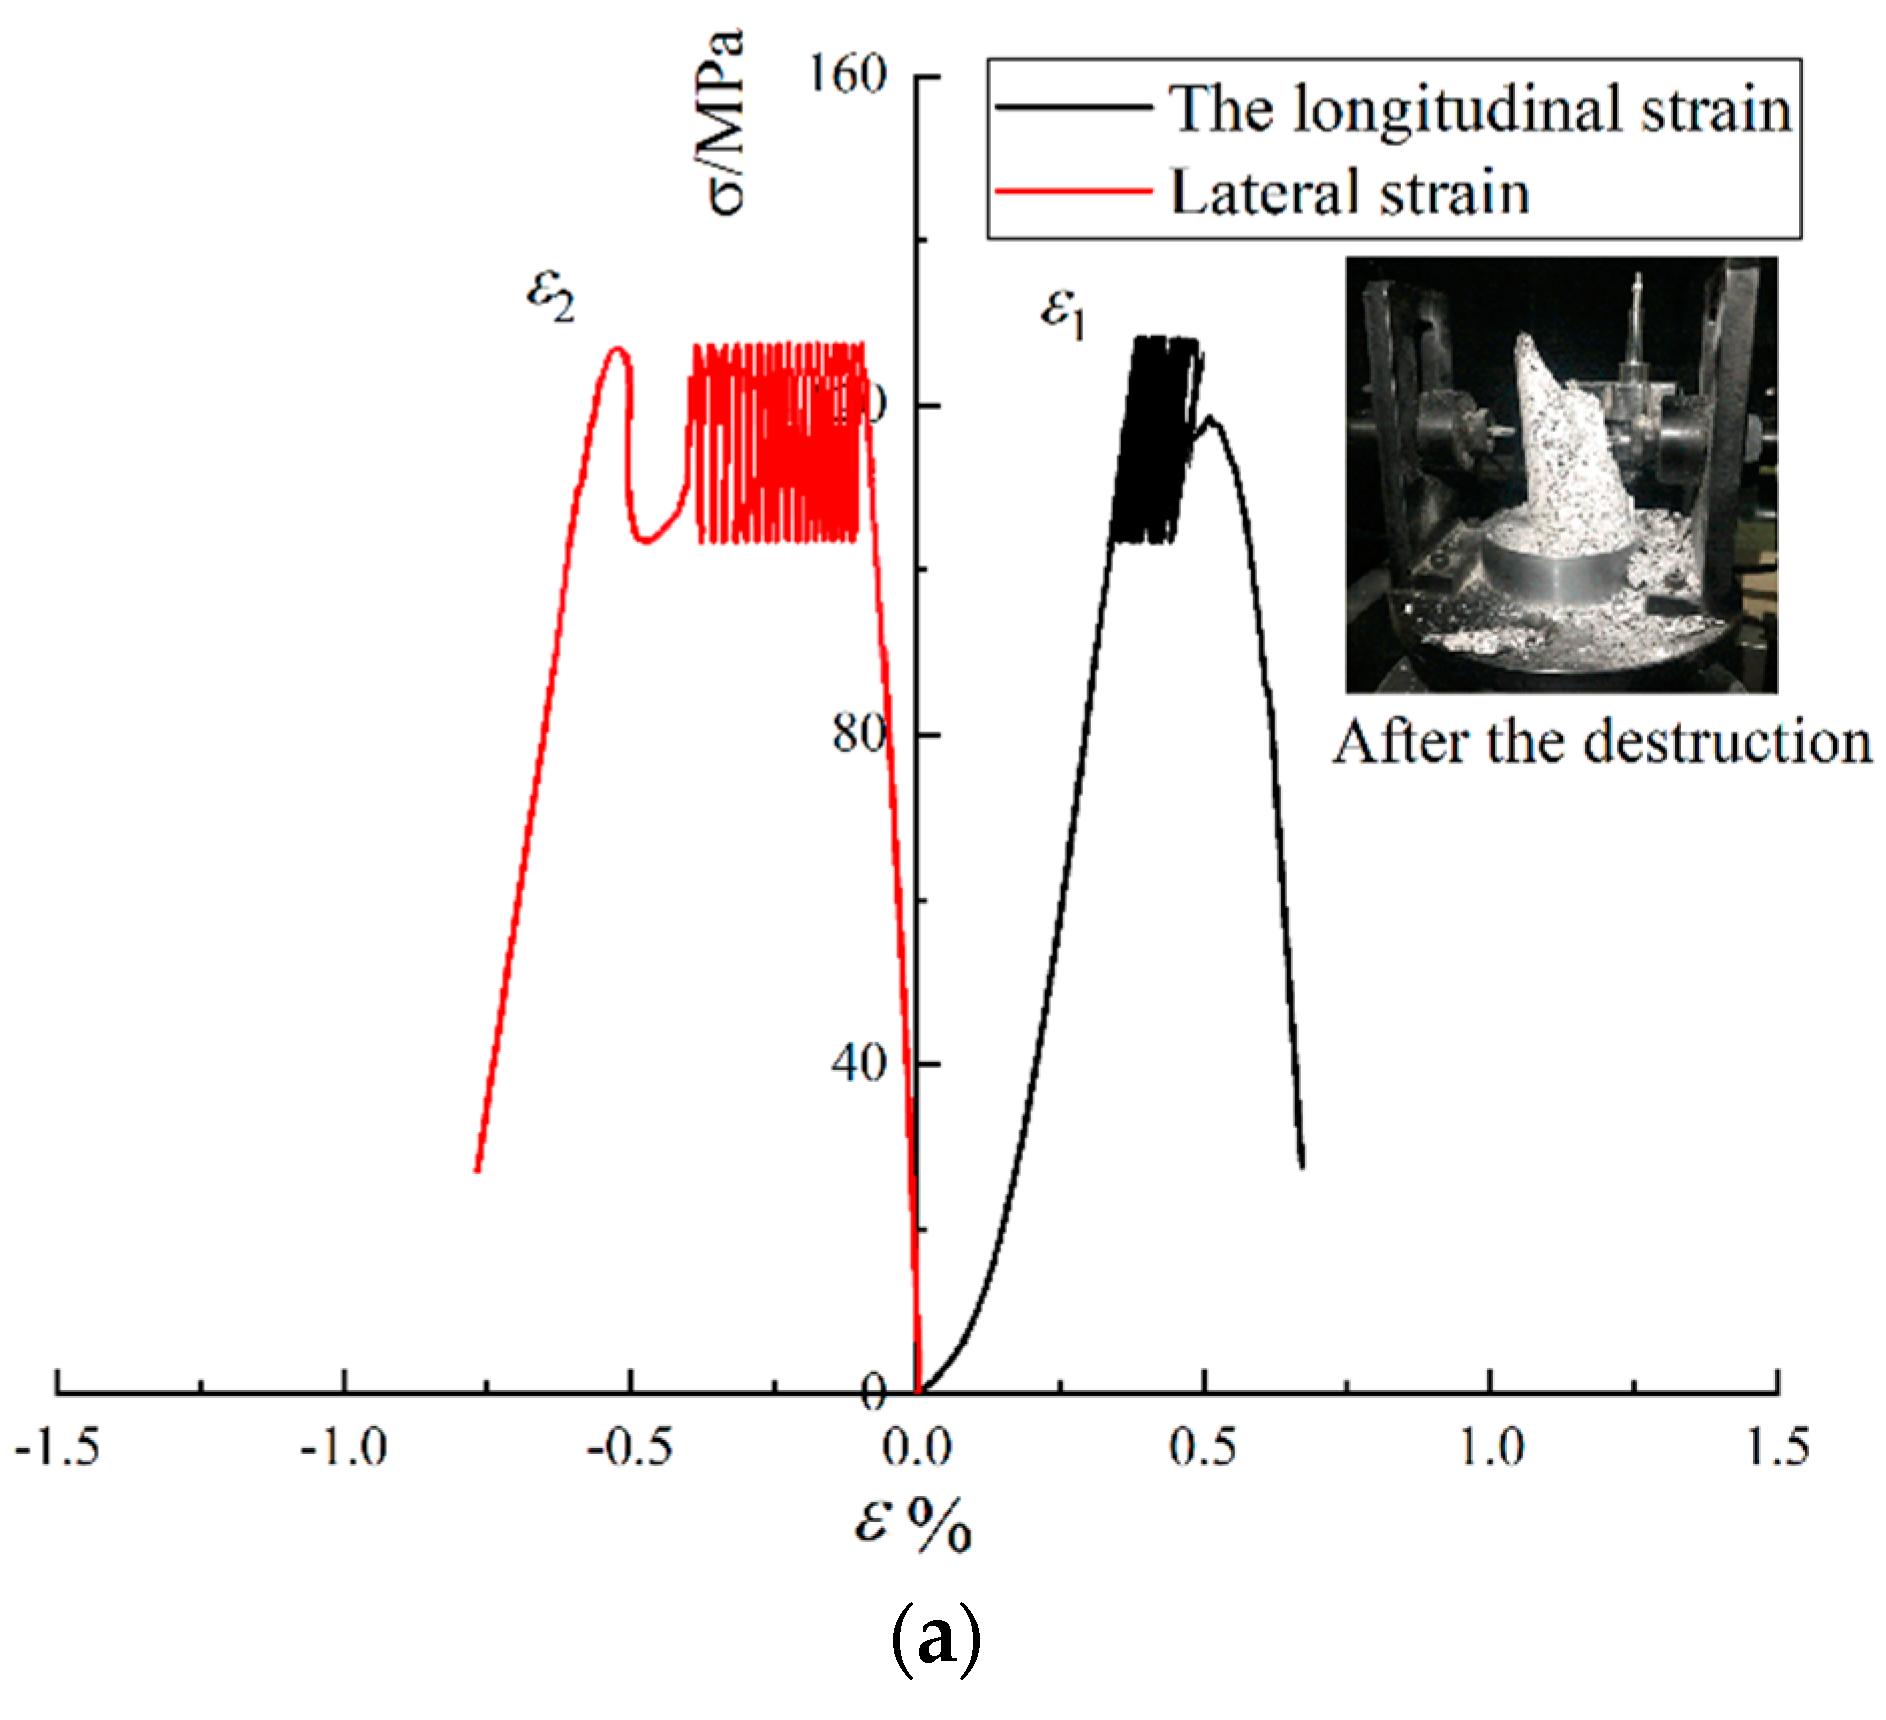
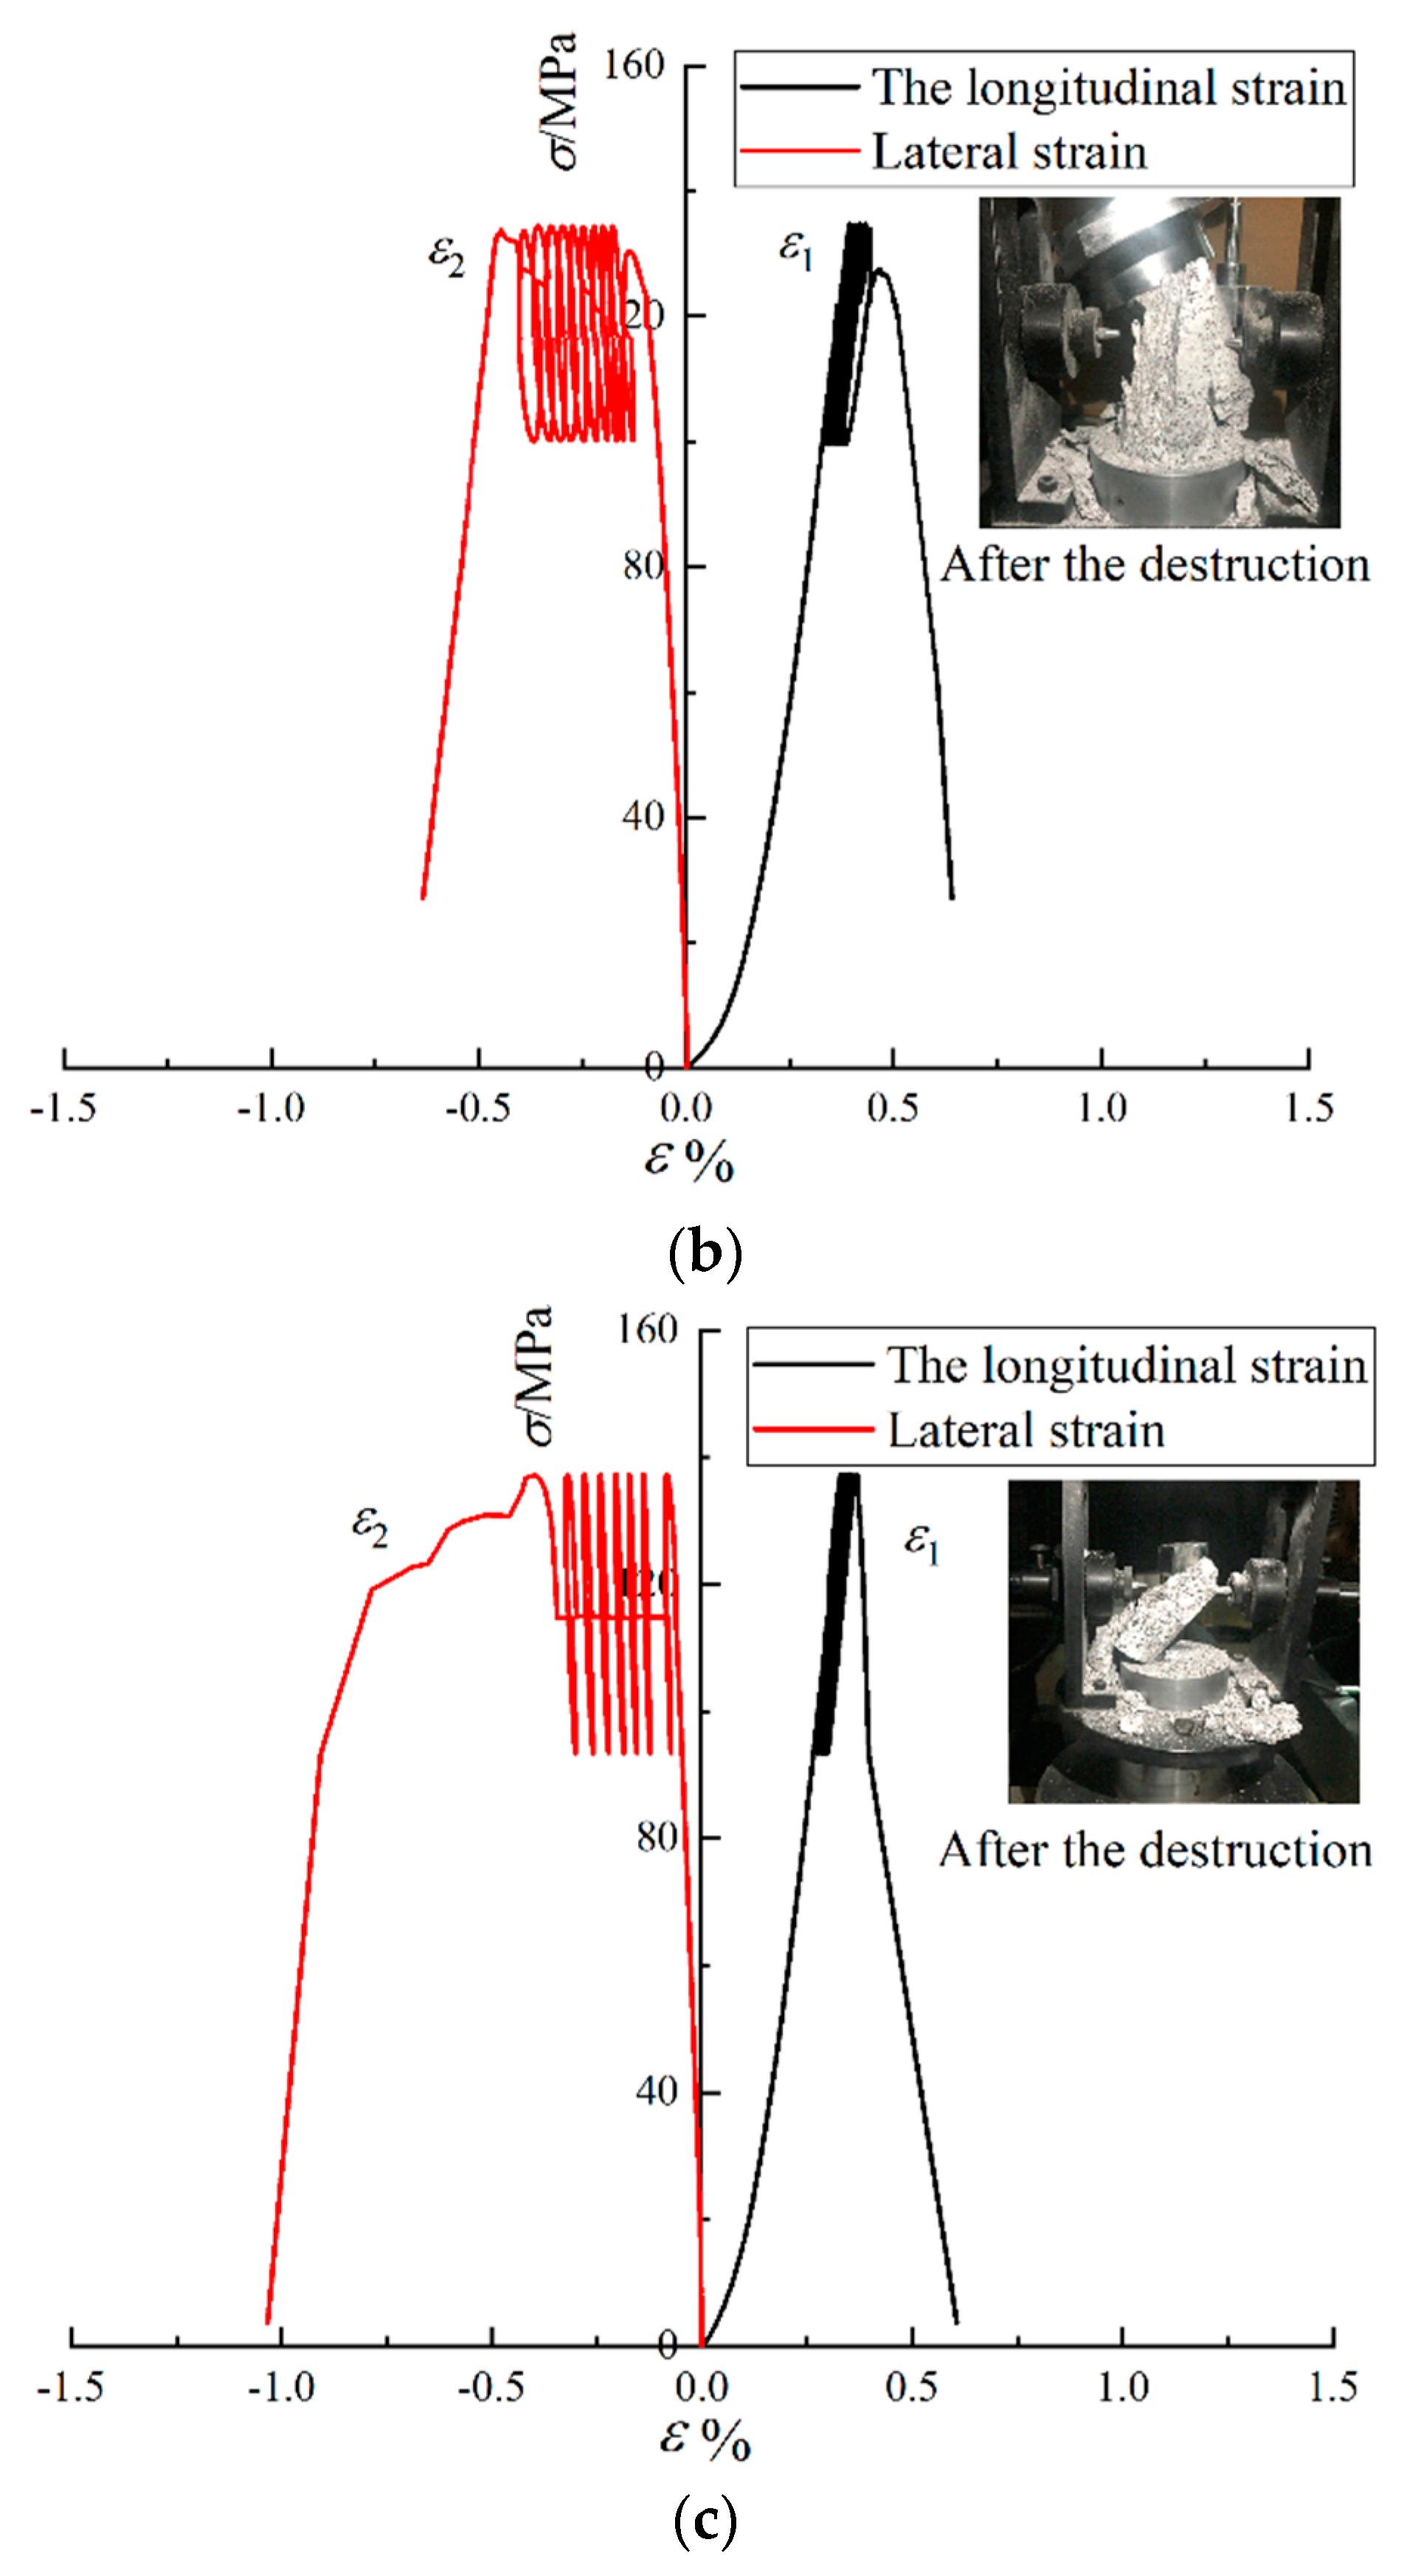
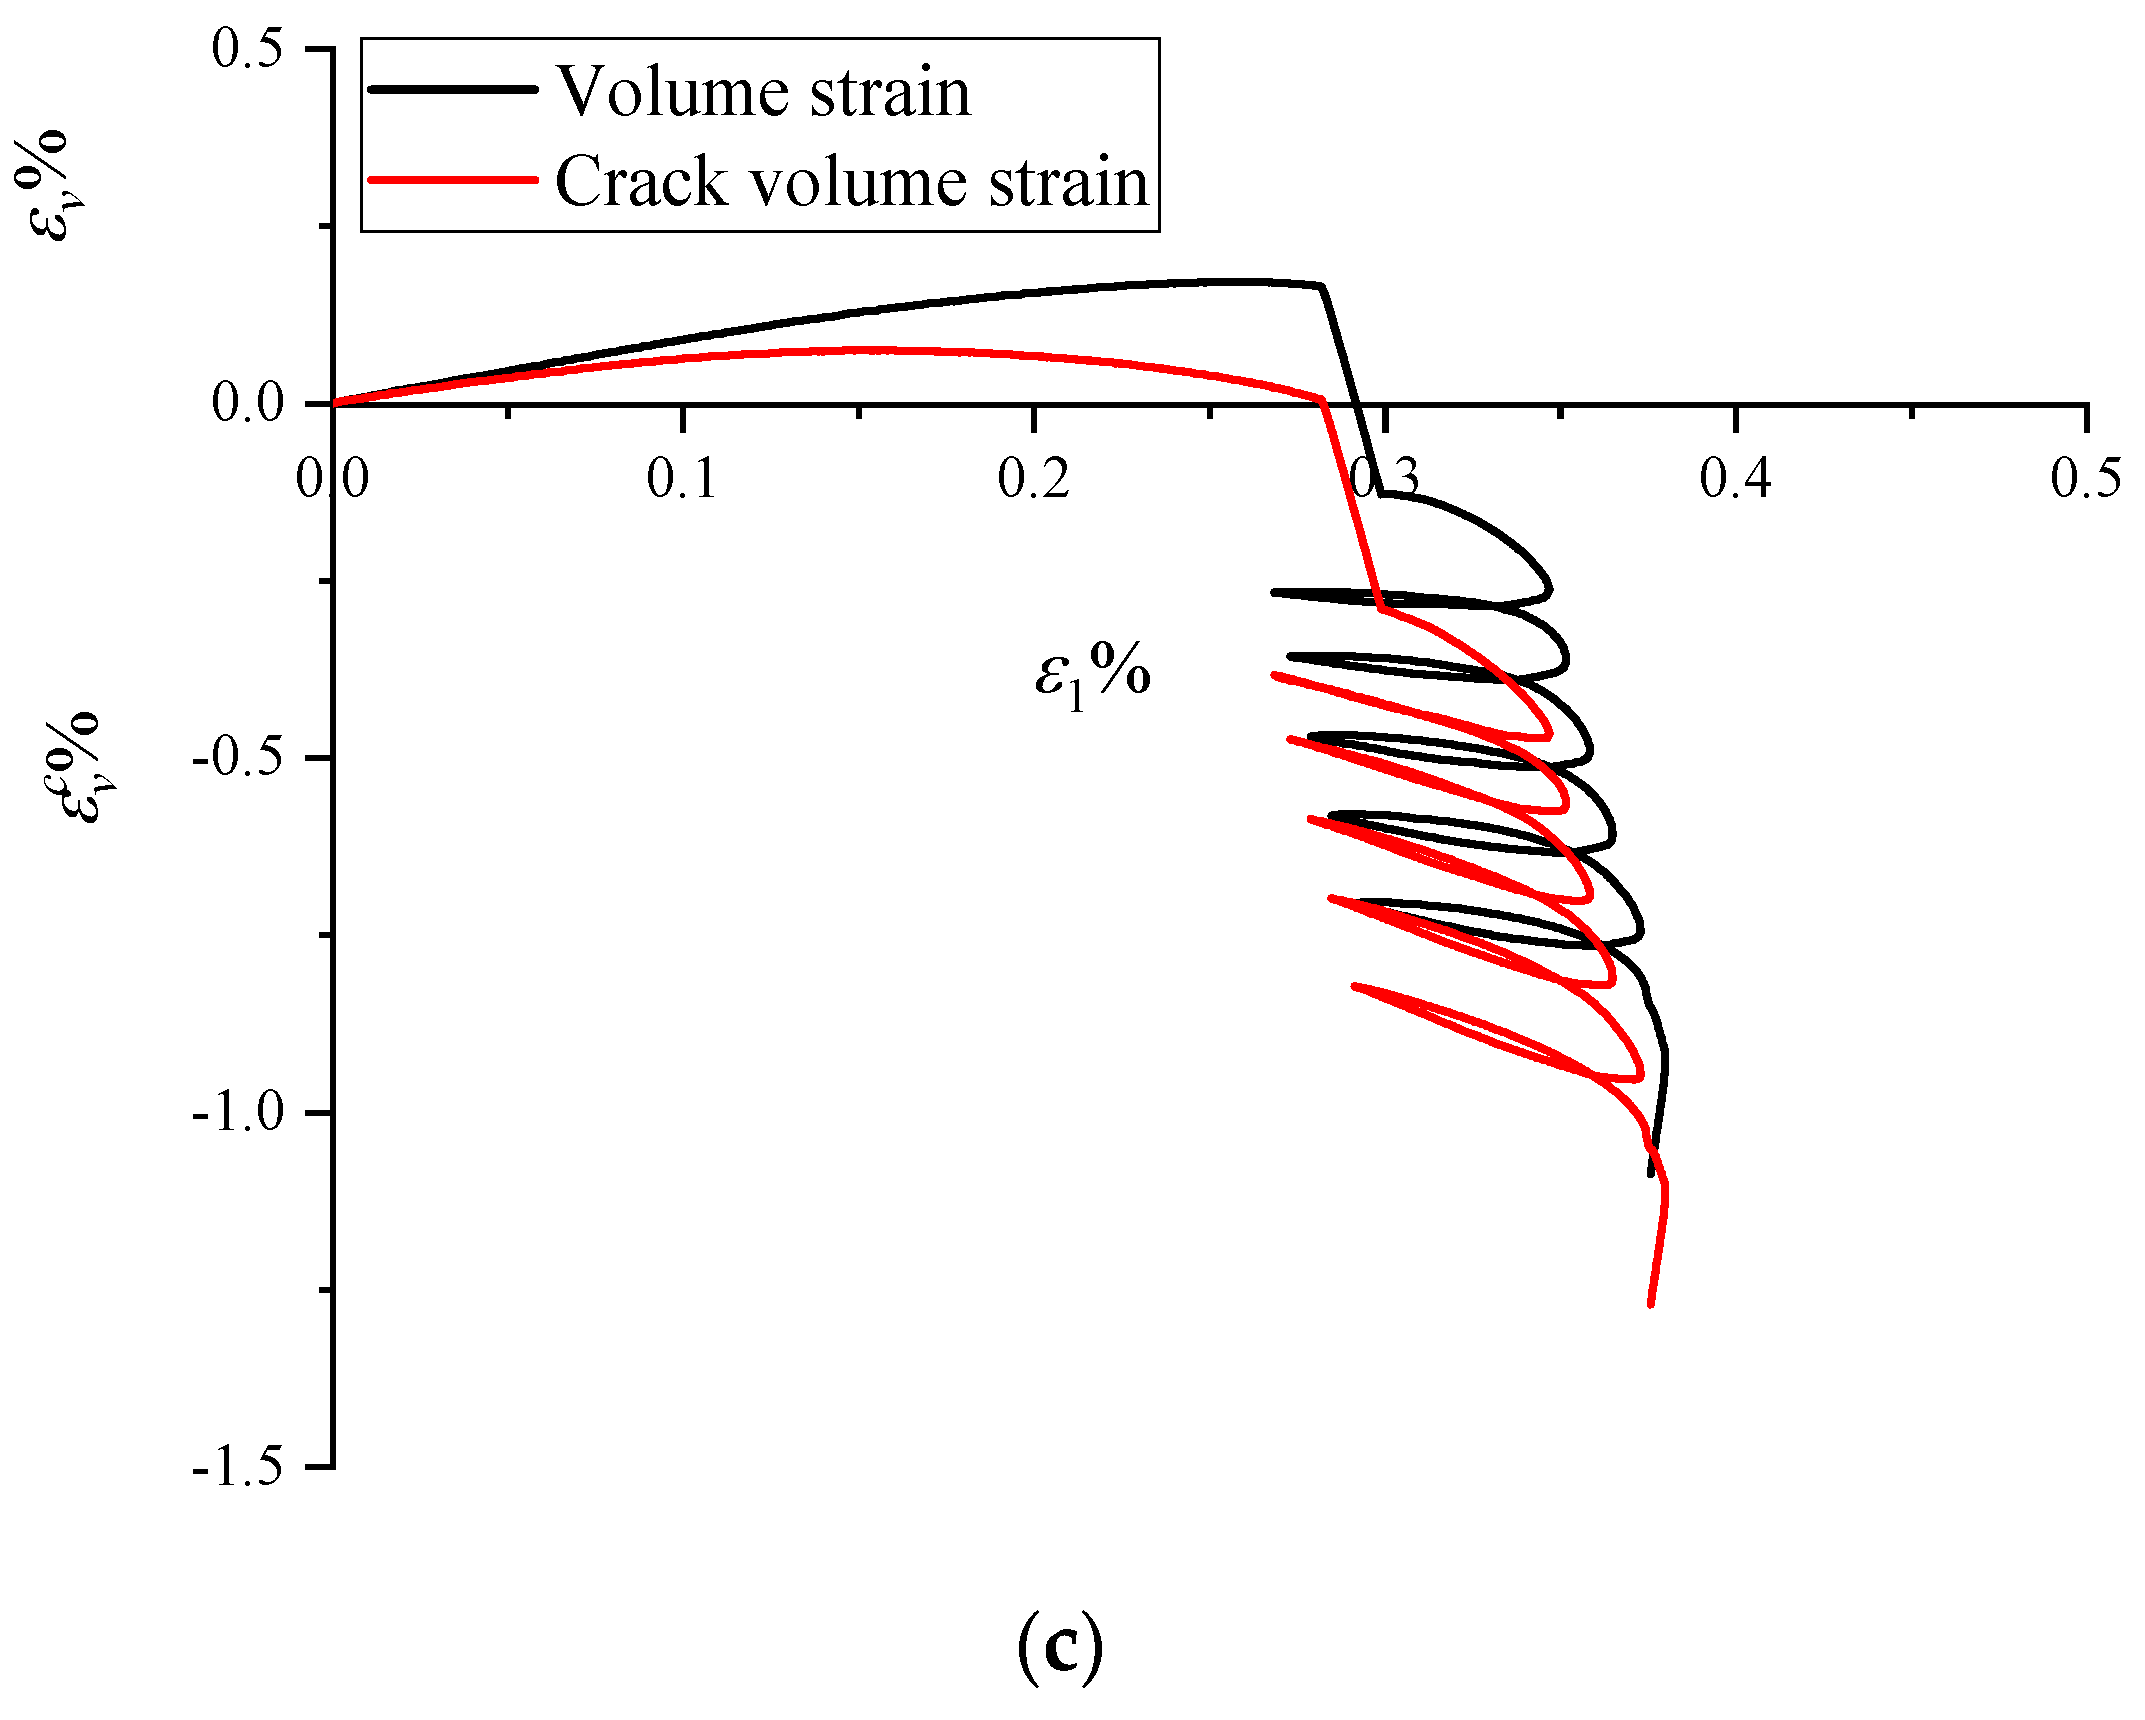
3.1. Stress Analysis

Figure 5, Figure 6 and Figure 7 show the stress–strain curves of various specimens under dynamic and static combined loading, in which ε1 and ε2 separately represent the longitudinal strain and transverse strain. It can be seen from the figures that the curve under the dynamic and static combined loading gradually shifts to the direction of increasing stress. Before failure of the rock, the stress–strain curves deviate significantly from the trajectory in historical cycles, and, finally, the rock is damaged at a certain point below the peak stress. Under the disturbance load, numerous shear fractures develop in the rock: these propagate and coalesce to form multiple shear failure planes that run through the specimen. In the context, macroscopic shear failure occurs to the rock. Because the stress on the rock specimen is relatively uniform in the loading process, the granite, as an elasto-brittle material, remains in the elastic deformation stage for a long time.
Table 3 lists the strengths of the rock specimens under different conditions. When the same initial axial static load σm is applied, the peak stress rises with the increasing amplitude of disturbance Δσ; if the amplitude Δσ is the same, the peak stress shows an increasing trend with the increasing σm. Under uniaxial compression conditions, the specimen has a strength of 144.84 MPa. When the initial stress is 60% of the UCS, the peak stress separately decreased by 37.57%, 31.66%, and 27.33% with the growing amplitude of disturbance, compared with the UCS; when the initial stress is 70% of the UCS, the peak stress drops by 24.58%, 23.37%, and 18.39% as the amplitude of disturbance has an increment; and, with the increase in the initial stress to 80% of the UCS, the peak stress of the granite decreases by 20.47%, 12.17%, and 6.80% as the amplitude of disturbance grows.
Under a low initial stress, the rock experiences many disturbances and then the route to failure, so it is more likely to be damaged, and, therefore, the failure load is low. If the initial stress is high, only a low number of disturbances are performed, so the degree of damage is low, and the specimen is damaged under higher stress. Under disturbances of a large amplitude, the failure load also enlarges because of strain-rate effects on the specimen.
The pre-peak section of the stress–strain curves of rocks during loading can be divided into four stages, i.e., an initial crack compaction stage, an elastic deformation stage, a stable crack propagation stage, and an unstable crack propagation stage [32,33], as illustrated in Figure 8. The four stages are characterized by the crack-closure stress σcc, crack-initiation stress σci, crack-damage stress σcd, and peak stress σc. The volumetric strain of cracks is 0 in the initial state. Under axial stress, the pre-existing cracks inside the rock are gradually closed, so their volumetric strain increases. When the stress corresponding to the volumetric strain reaches σcc, pre-existing cracks are completely closed. Thereafter, the curve of the volumetric strain of cracks basically remains unchanged, indicating that no damage occurs inside the rock. If the stress is unloaded in this context, the rock can recover to its initial state, so the stage belongs to the elastic deformation stage. When the load is increased further, the volumetric strain associated with the cracks changes; new cracks are initiated within the specimen, and the stress corresponding to the point is the crack-initiation stress σci. In the initial stage of the initiation of new cracks, there are a small number of new cracks, which develop slowly. As the volumetric strain ascends and reaches its maximum, the cracks enter a stage of rapid development, corresponding to the crack-damage stress σcd. When the load exceeds the peak stress σc, the specimen enters the unstable crack propagation stage.
Existing methods used for calculating characteristic stresses mainly include strain measurement, AC measurement, and an approach based on the volumetric strain of cracks. Among these, the one based on the volumetric strain of cracks has been widely used due to its definite concept and convenience of determination [34,35]. The method mainly divides the volumetric strain of rocks into the elastic volumetric strain and volumetric strain of cracks. Under uniaxial compression, the volumetric strain of cracks, ε v c , in the rock can be calculated thus [36,37]:
ε v c = ε v ε v e = ε v 1 2 × μ E × σ ,
ε v = ε 1 + 2 × ε 2 ,
where ε v and ε v e separately represent the volumetric strain of rocks and the elastic volumetric strain; ε1 and ε2 denote the longitudinal strain and transverse strain; μ represents the Poisson’s ratio; and E represents the modulus of elasticity.
The volumetric strain of cracks calculated using Formulas (1) and (2) is displayed in Figure 9, Figure 10 and Figure 11. Table 4 shows the normalization results of characteristic stresses (characteristic stresses/UCS) corresponding to each stage.
As shown in Table 4, the characteristic stresses increase with the increasing amplitude of disturbance Δσ when the same initial axial static load σm is applied; when Δσ is same, the characteristic stresses show an increasing trend with the growth of σm.
The crack-initiation stress gradually increases under the same amplitude of disturbance but different static loading intensities. The crack-closure stress, crack-initiation stress, and crack-damage stress are separately 0.2, 0.4, and 0.7 times the peak stress. Combining with previous research [38,39], different types of rocks feature significantly different characteristic stresses. The difference is mainly related to factors including mineral compositions, internal structure, and petrogenic environment of rocks.

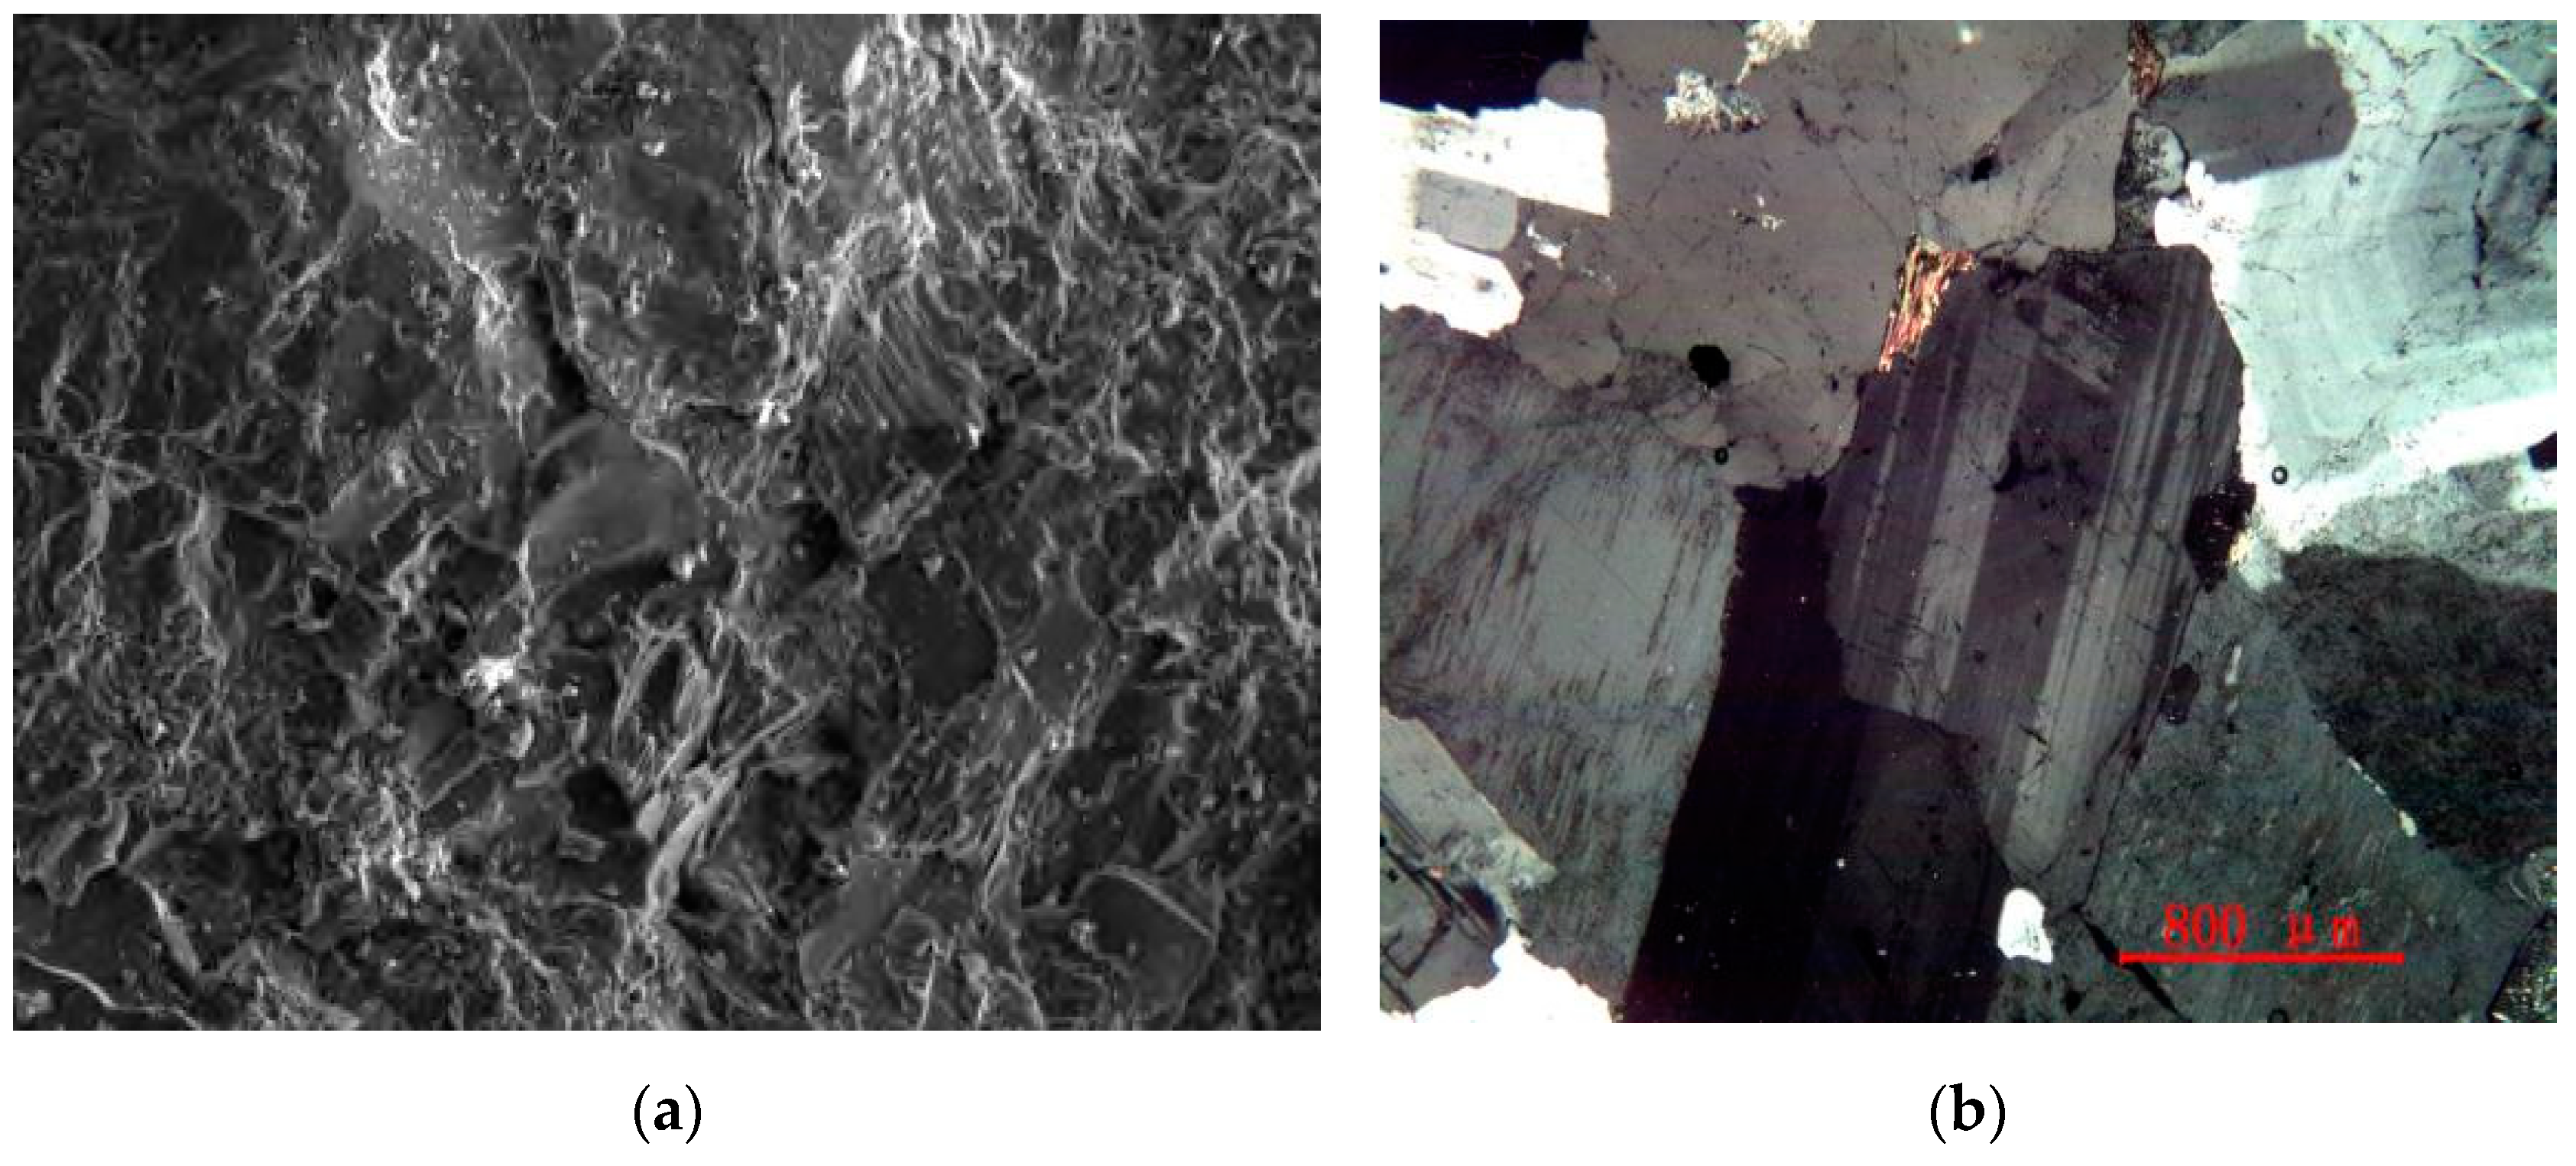
3.2. Failure Analysis

Many methods are available for quantitatively evaluating the degree of fragmentation of rocks, such as characteristic lumpiness, average lumpiness, and fractal dimension. Therein, fractal dimension has been extensively used in research into the degree of fragmentation of rocks due to its advantages, including its intuitive results and precise quantification.

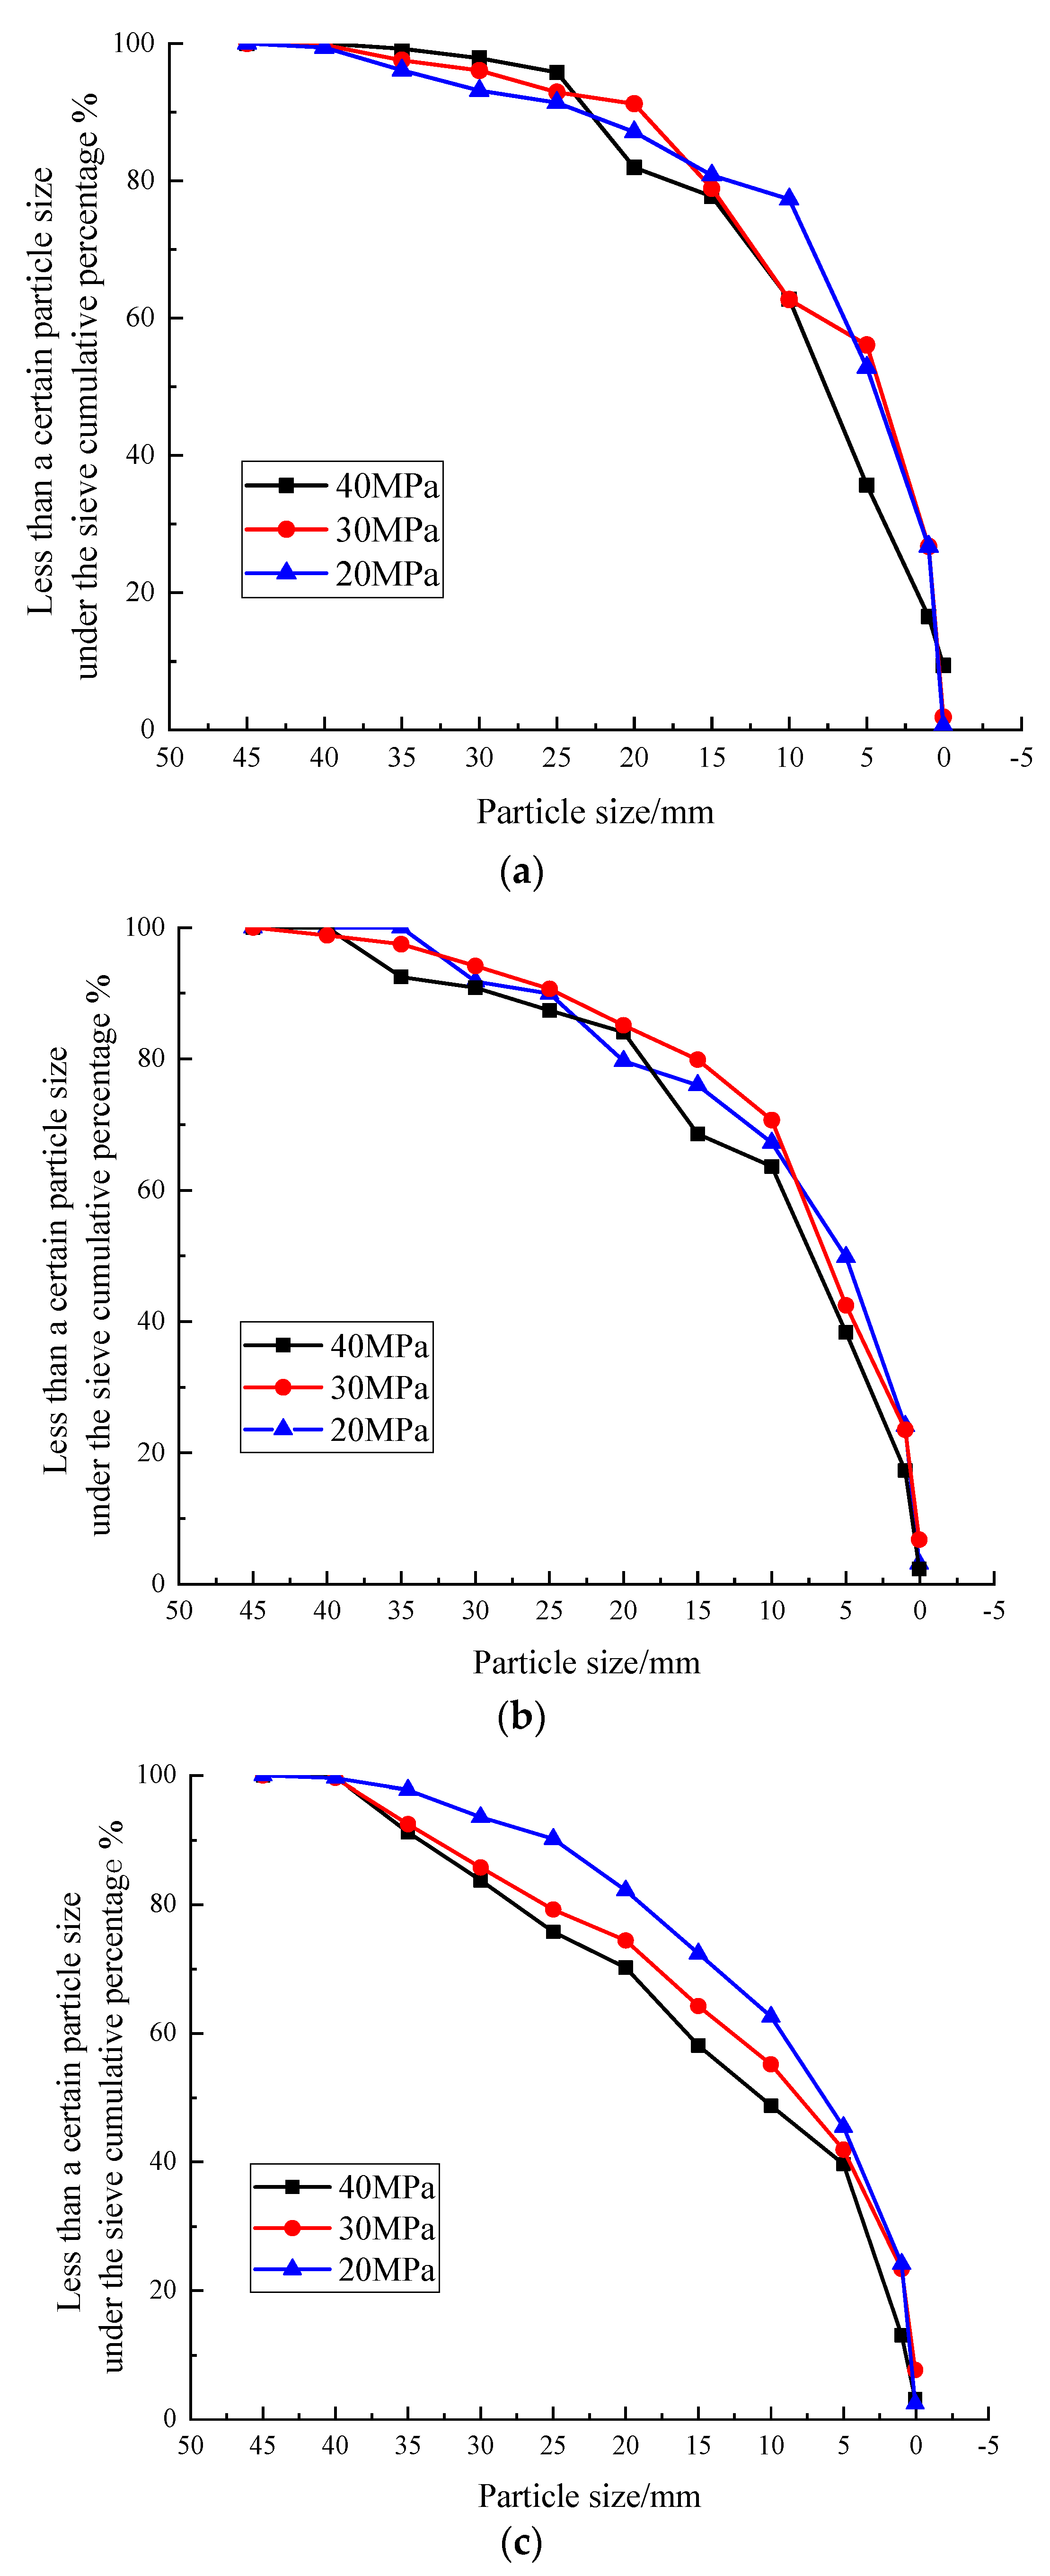
3.2.1. Screening of Broken Rock Fragments

A GZS-300 standard vibrating sieve with aperture sizes from 0.05 to 45 mm is used to perform the screening tests for the broken rocks. Particle sizes of the fragments were graded into 10 levels from: 0.05 to 1, 1 to 5, 5 to 10, 10 to 15, 15 to 20, 20 to 25, 25 to 30, 30 to 35, 35 to 40, and 40 to 45 mm. In addition, the mass of the fragments remaining on the holes of the sieves was weighed and converted to the cumulative percentage of particles below a given size. In this way, the particle size distribution of fragments of the granite under different amplitudes of disturbance is found (Figure 12).
According to Figure 12, the effective size d10, continuous size d30, and control size d60 of fragments under different conditions are determined. The uniformity coefficient of particle size distribution and the curvature coefficient of curves are calculated using the following formulas [40]:
C u = d 60 d 10 ,
C c = d 30 2 d 10 d 60 ,
The uniformity coefficients of the particle size distribution of the fragments and the curvature coefficients are listed in Table 5: the uniformity coefficients Cu of rock specimens are all greater than five under different conditions, indicating that the particle sizes of fragments broken under the disturbance loads are distributed in a non-uniform manner. From rock specimen Gra70%-2, the curvature coefficient Cc is between one and three. Based on the evaluation criterion for particle size distribution, rock specimens Gra70%-2, Gra70%-3, Gra80%-1, Gra80%-2, and Gra80%-3 exhibit favorable particle size distributions after breaking.

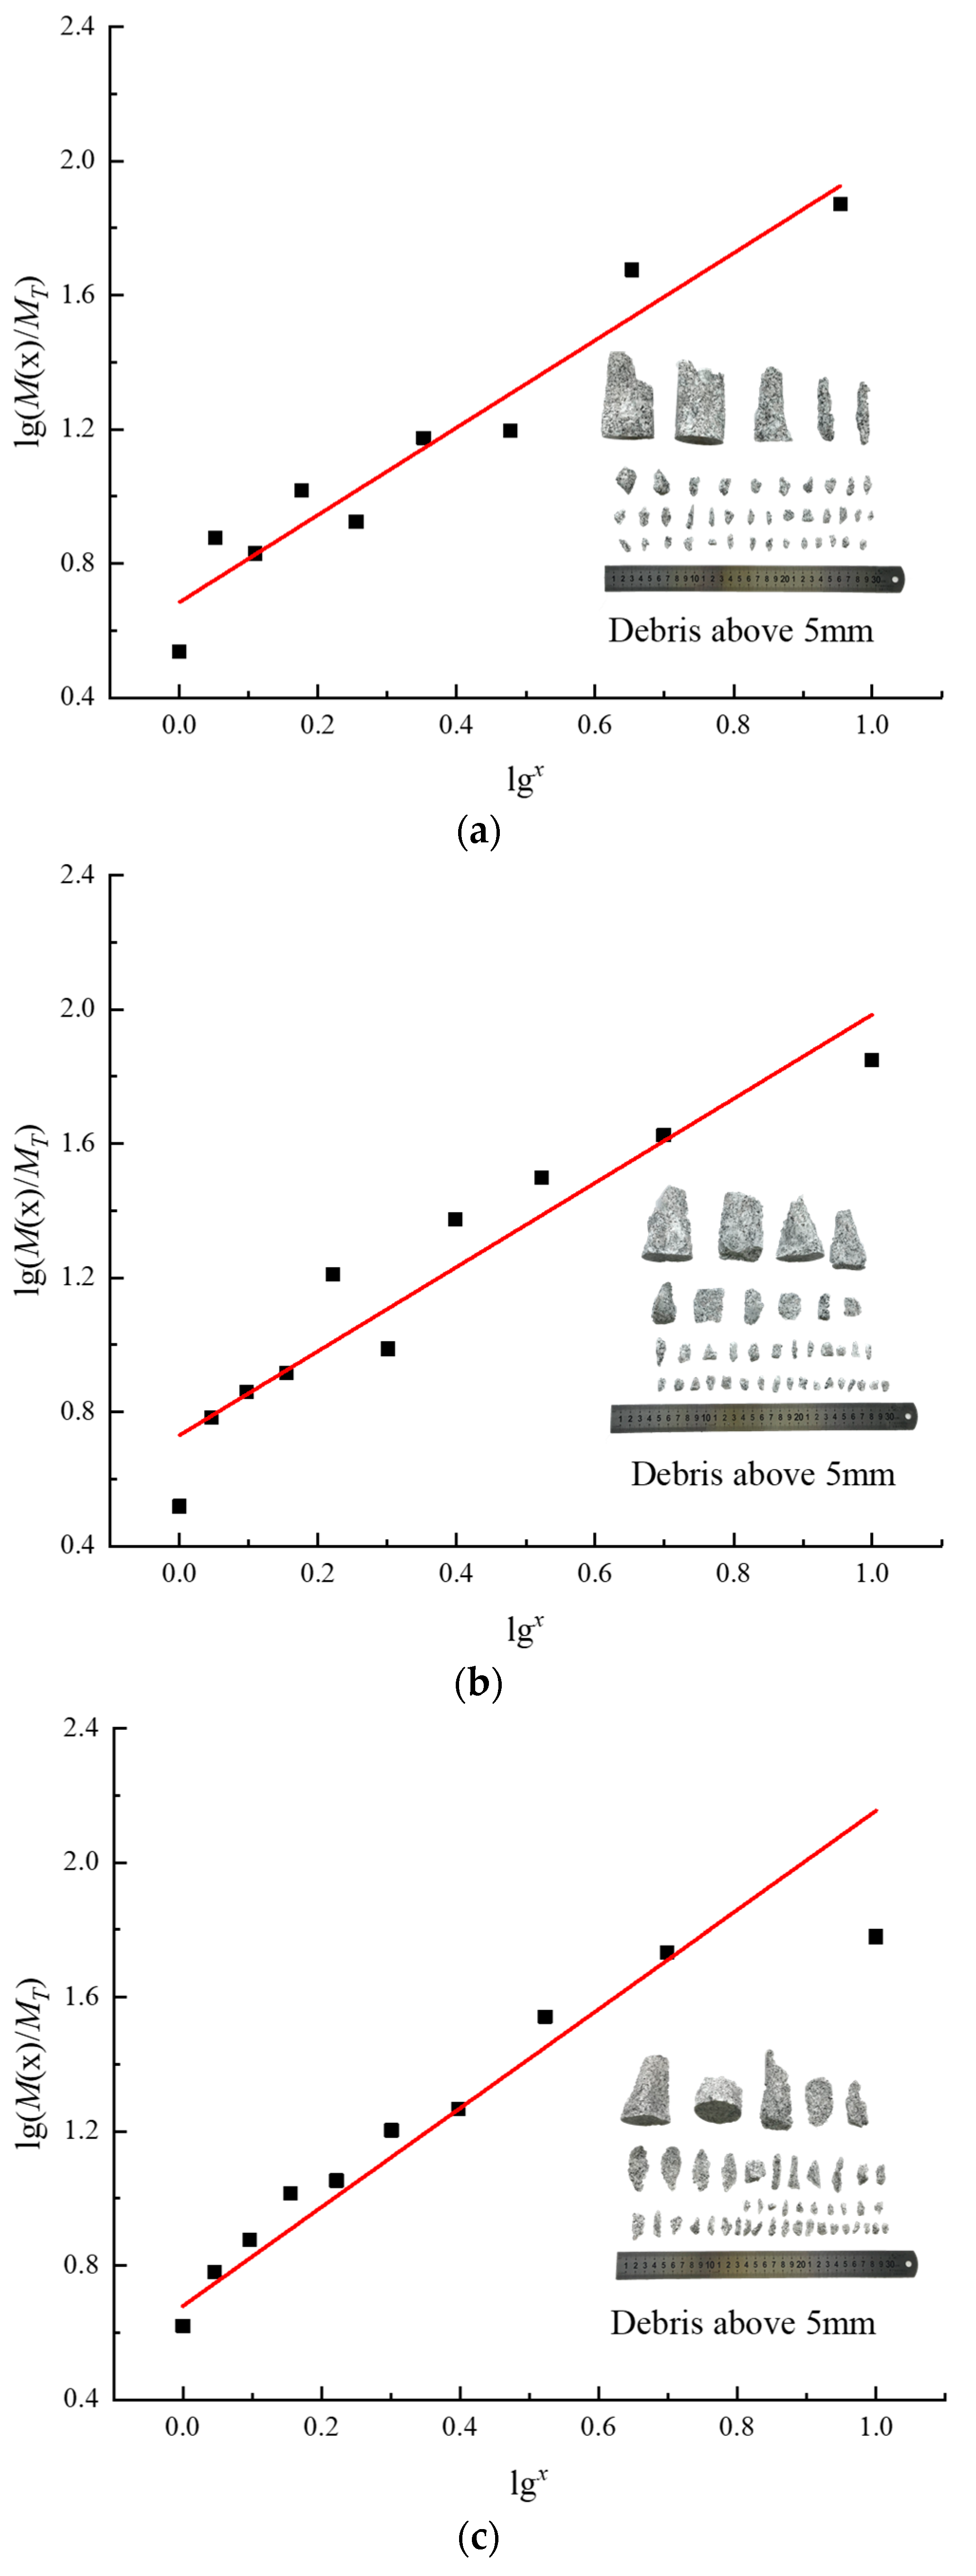
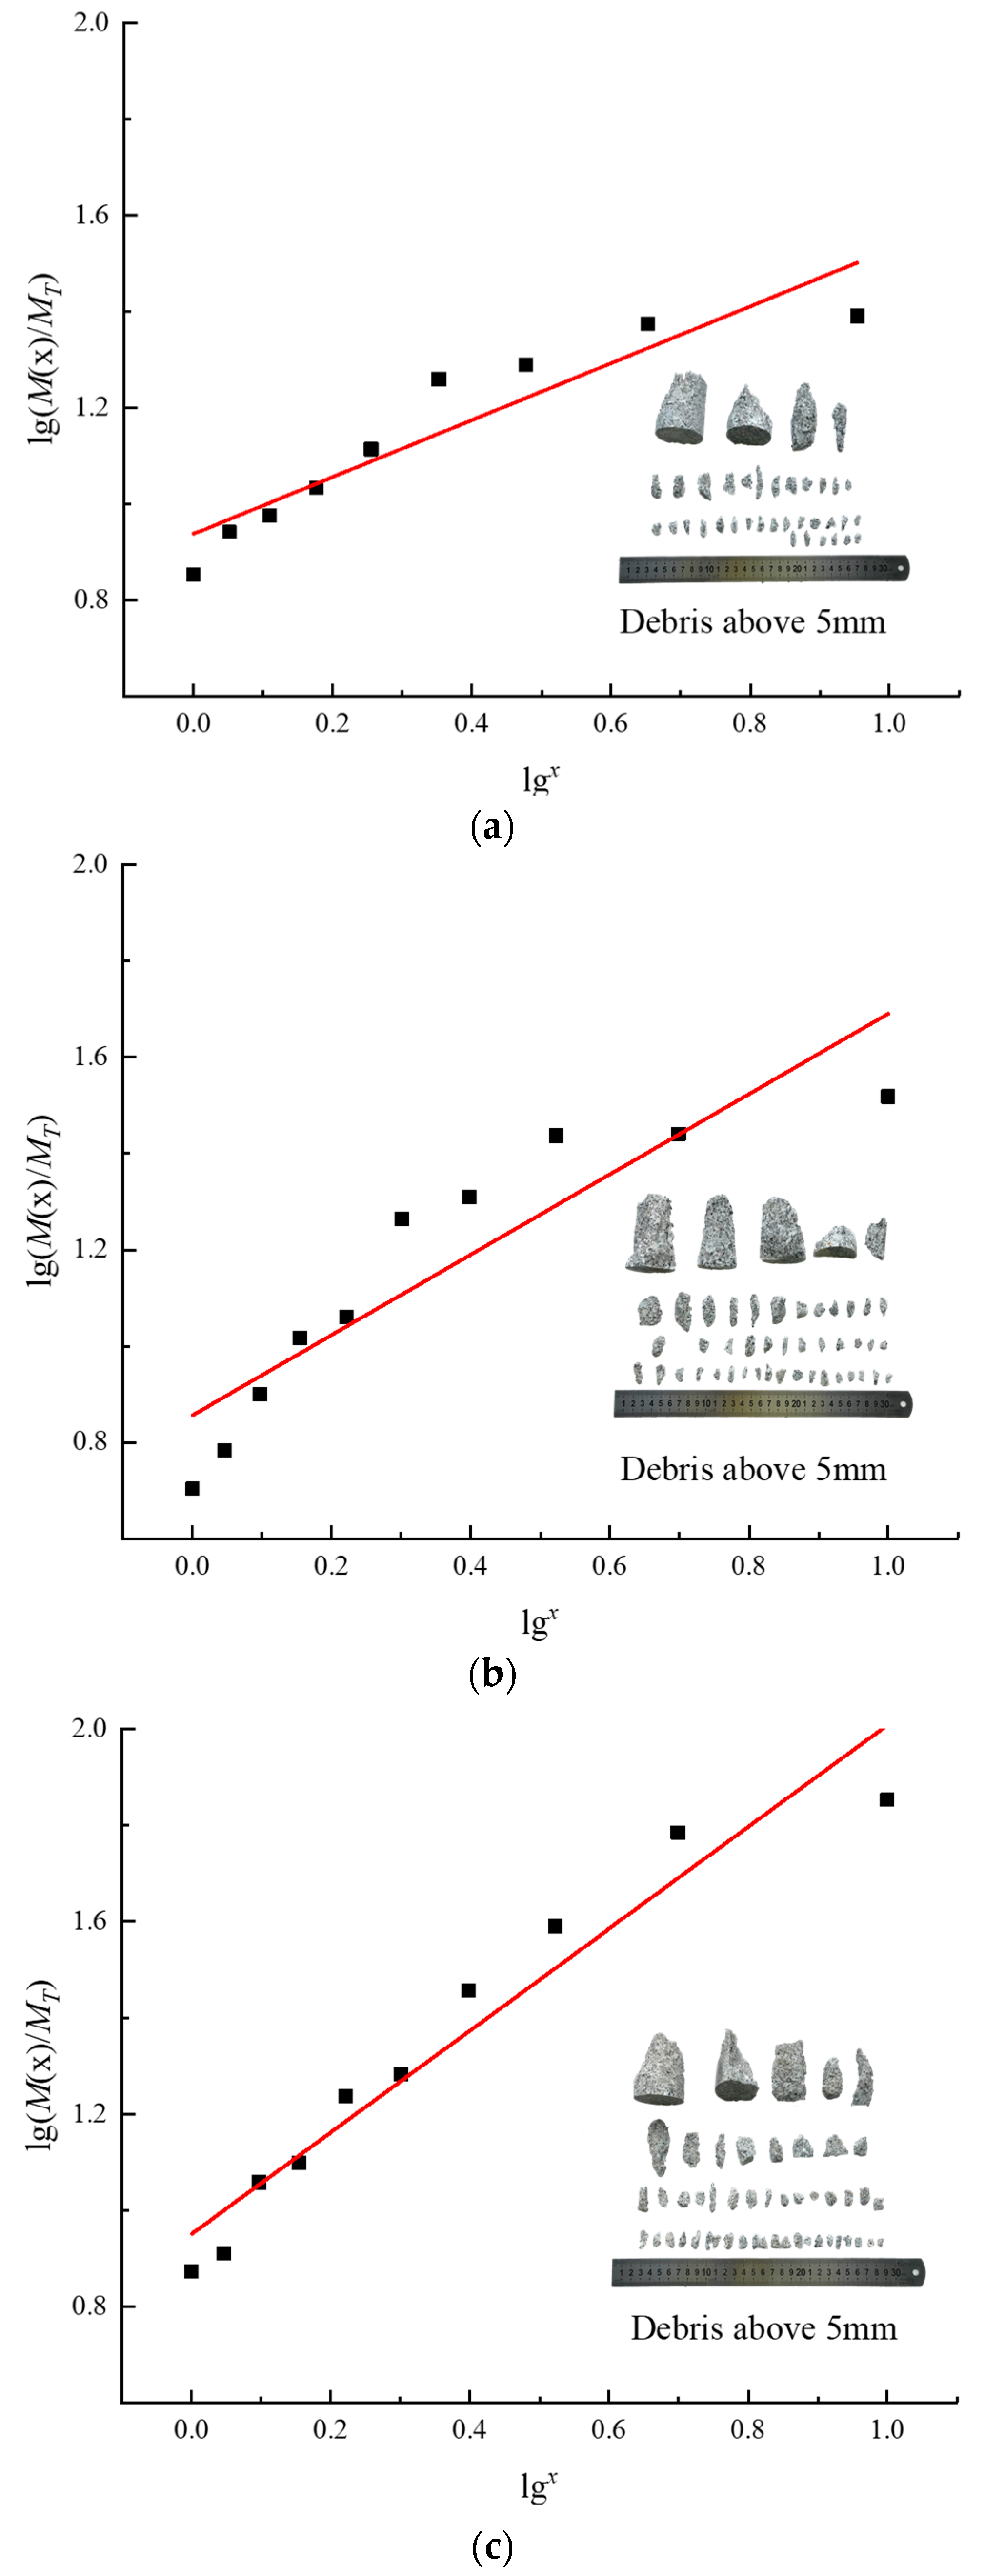
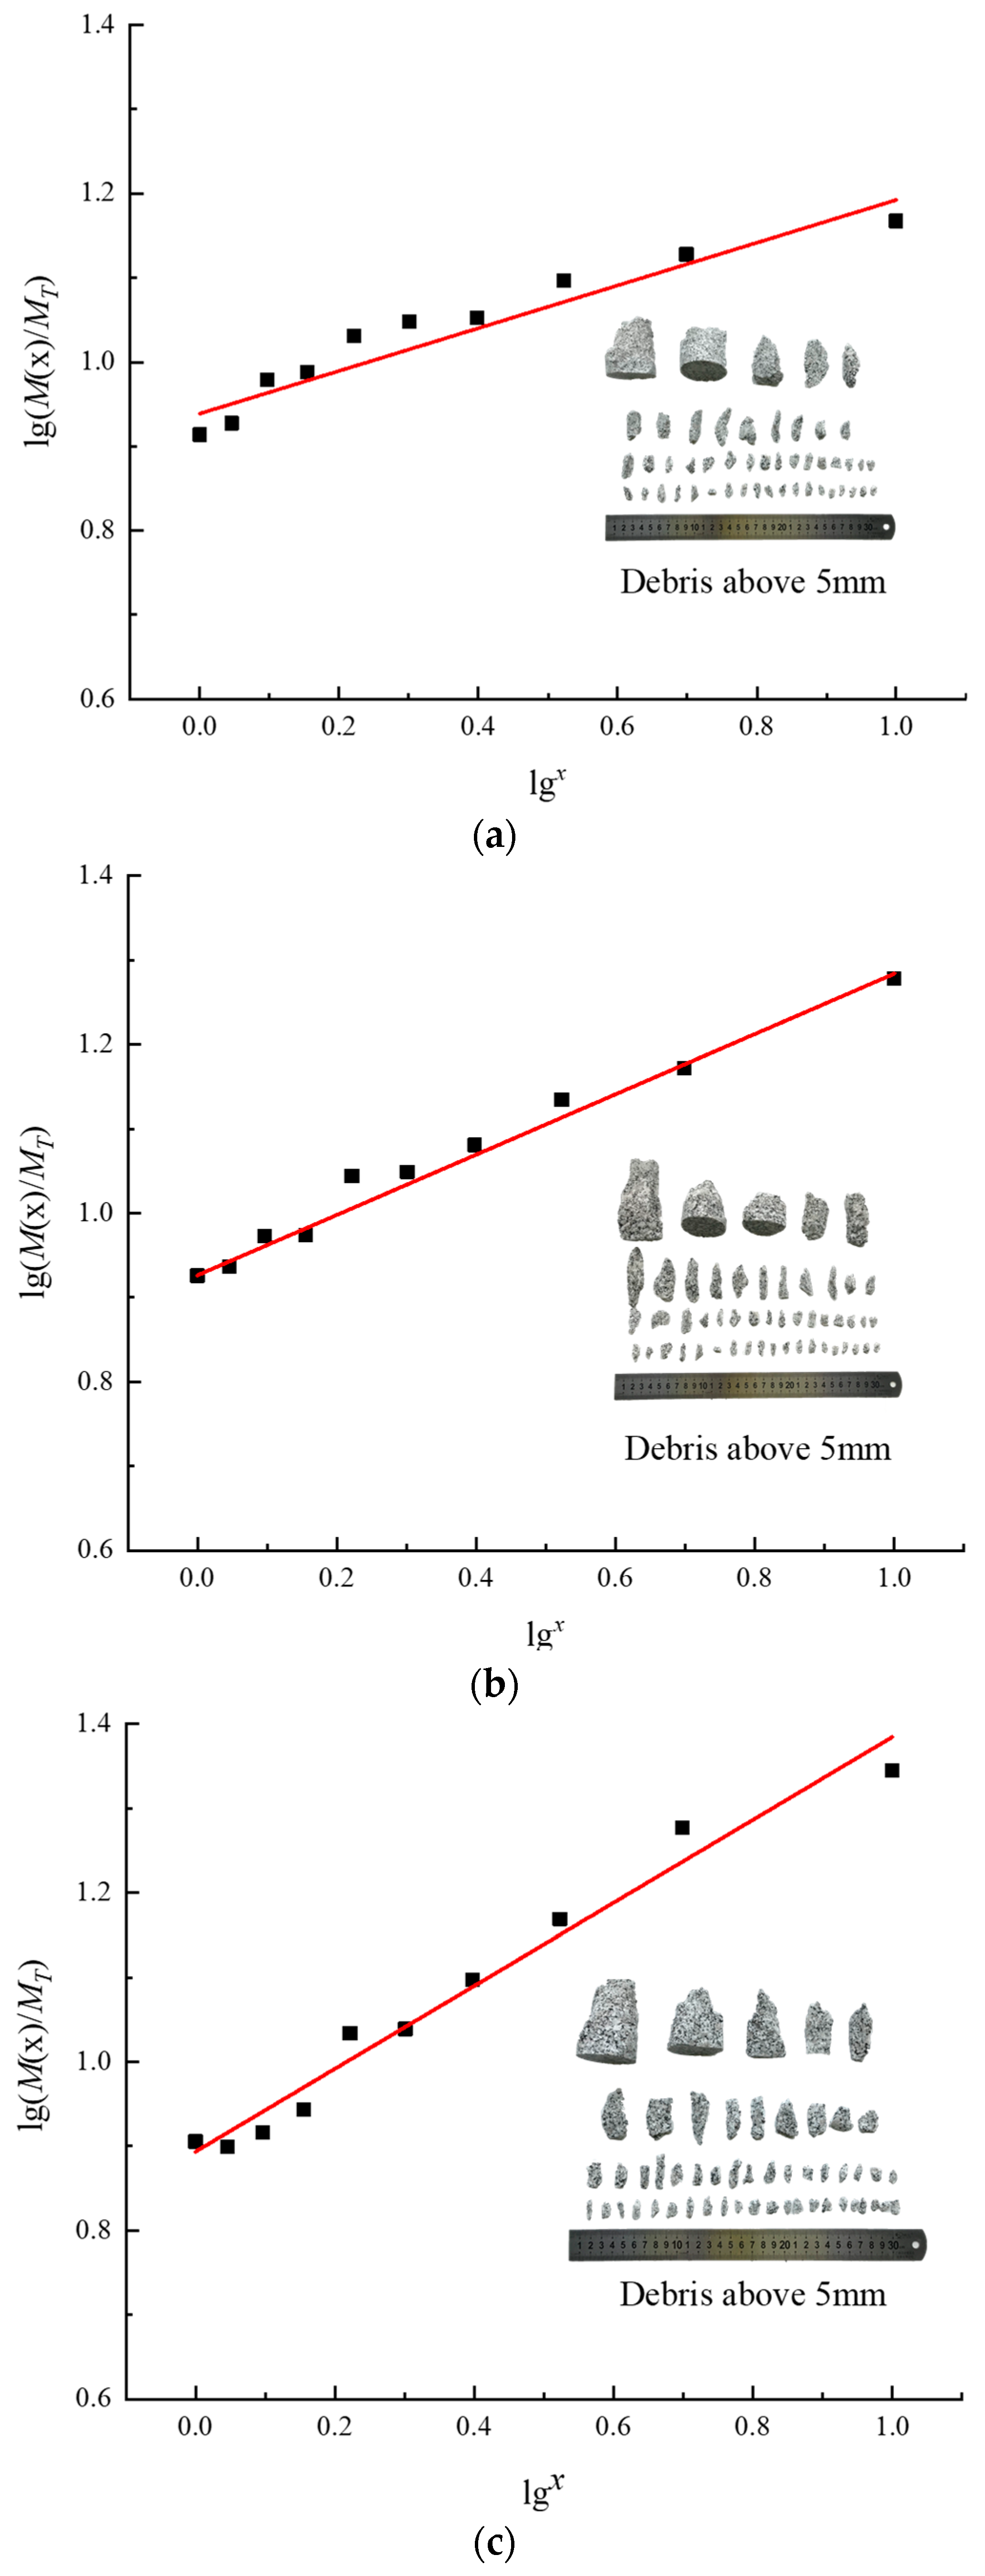
3.2.2. Calculation of Fractal Dimensions

The lumpiness distribution and particle size of broken rocks show favorable fractal characteristics. According to the fractal model for particle size distribution of rock fragments established by Mandelbrot et al. [41], the fractal dimension F is calculated based on the mass–frequency relation revealed in the screening tests. The equation for distribution of rock fragments generated under cyclic disturbance loads is expressed as follows [41]:
M ( x ) M T = ( x x m ) 3 F ,
Taking logarithms of both sides of the above equation, gives
lg ( M ( x ) M T ) = ( 3 F ) × lg ( x x m ) ,
where MT and M(x) represent the total mass of fragments and cumulative mass of fragments under sieves; xm and x denote the maximum particle size and the particle size of fragments; and F is the fractal dimension.
Figure 13, Figure 14 and Figure 15 display the linearly fitted lines of log(M(x)/MT)–logx scatter plots corresponding to different initial static loads σm. The fitted lines have a slope of (3−F), so the fractal dimension F can be calculated. The fitting results indicate that the cumulative percentage of particles under sieves (by mass) has a favorable linear correlation with the sieve hole size in double logarithm coordinates. This suggests that the fractal dimension can be used to quantitatively characterize the degree of fragmentation of rock specimens.

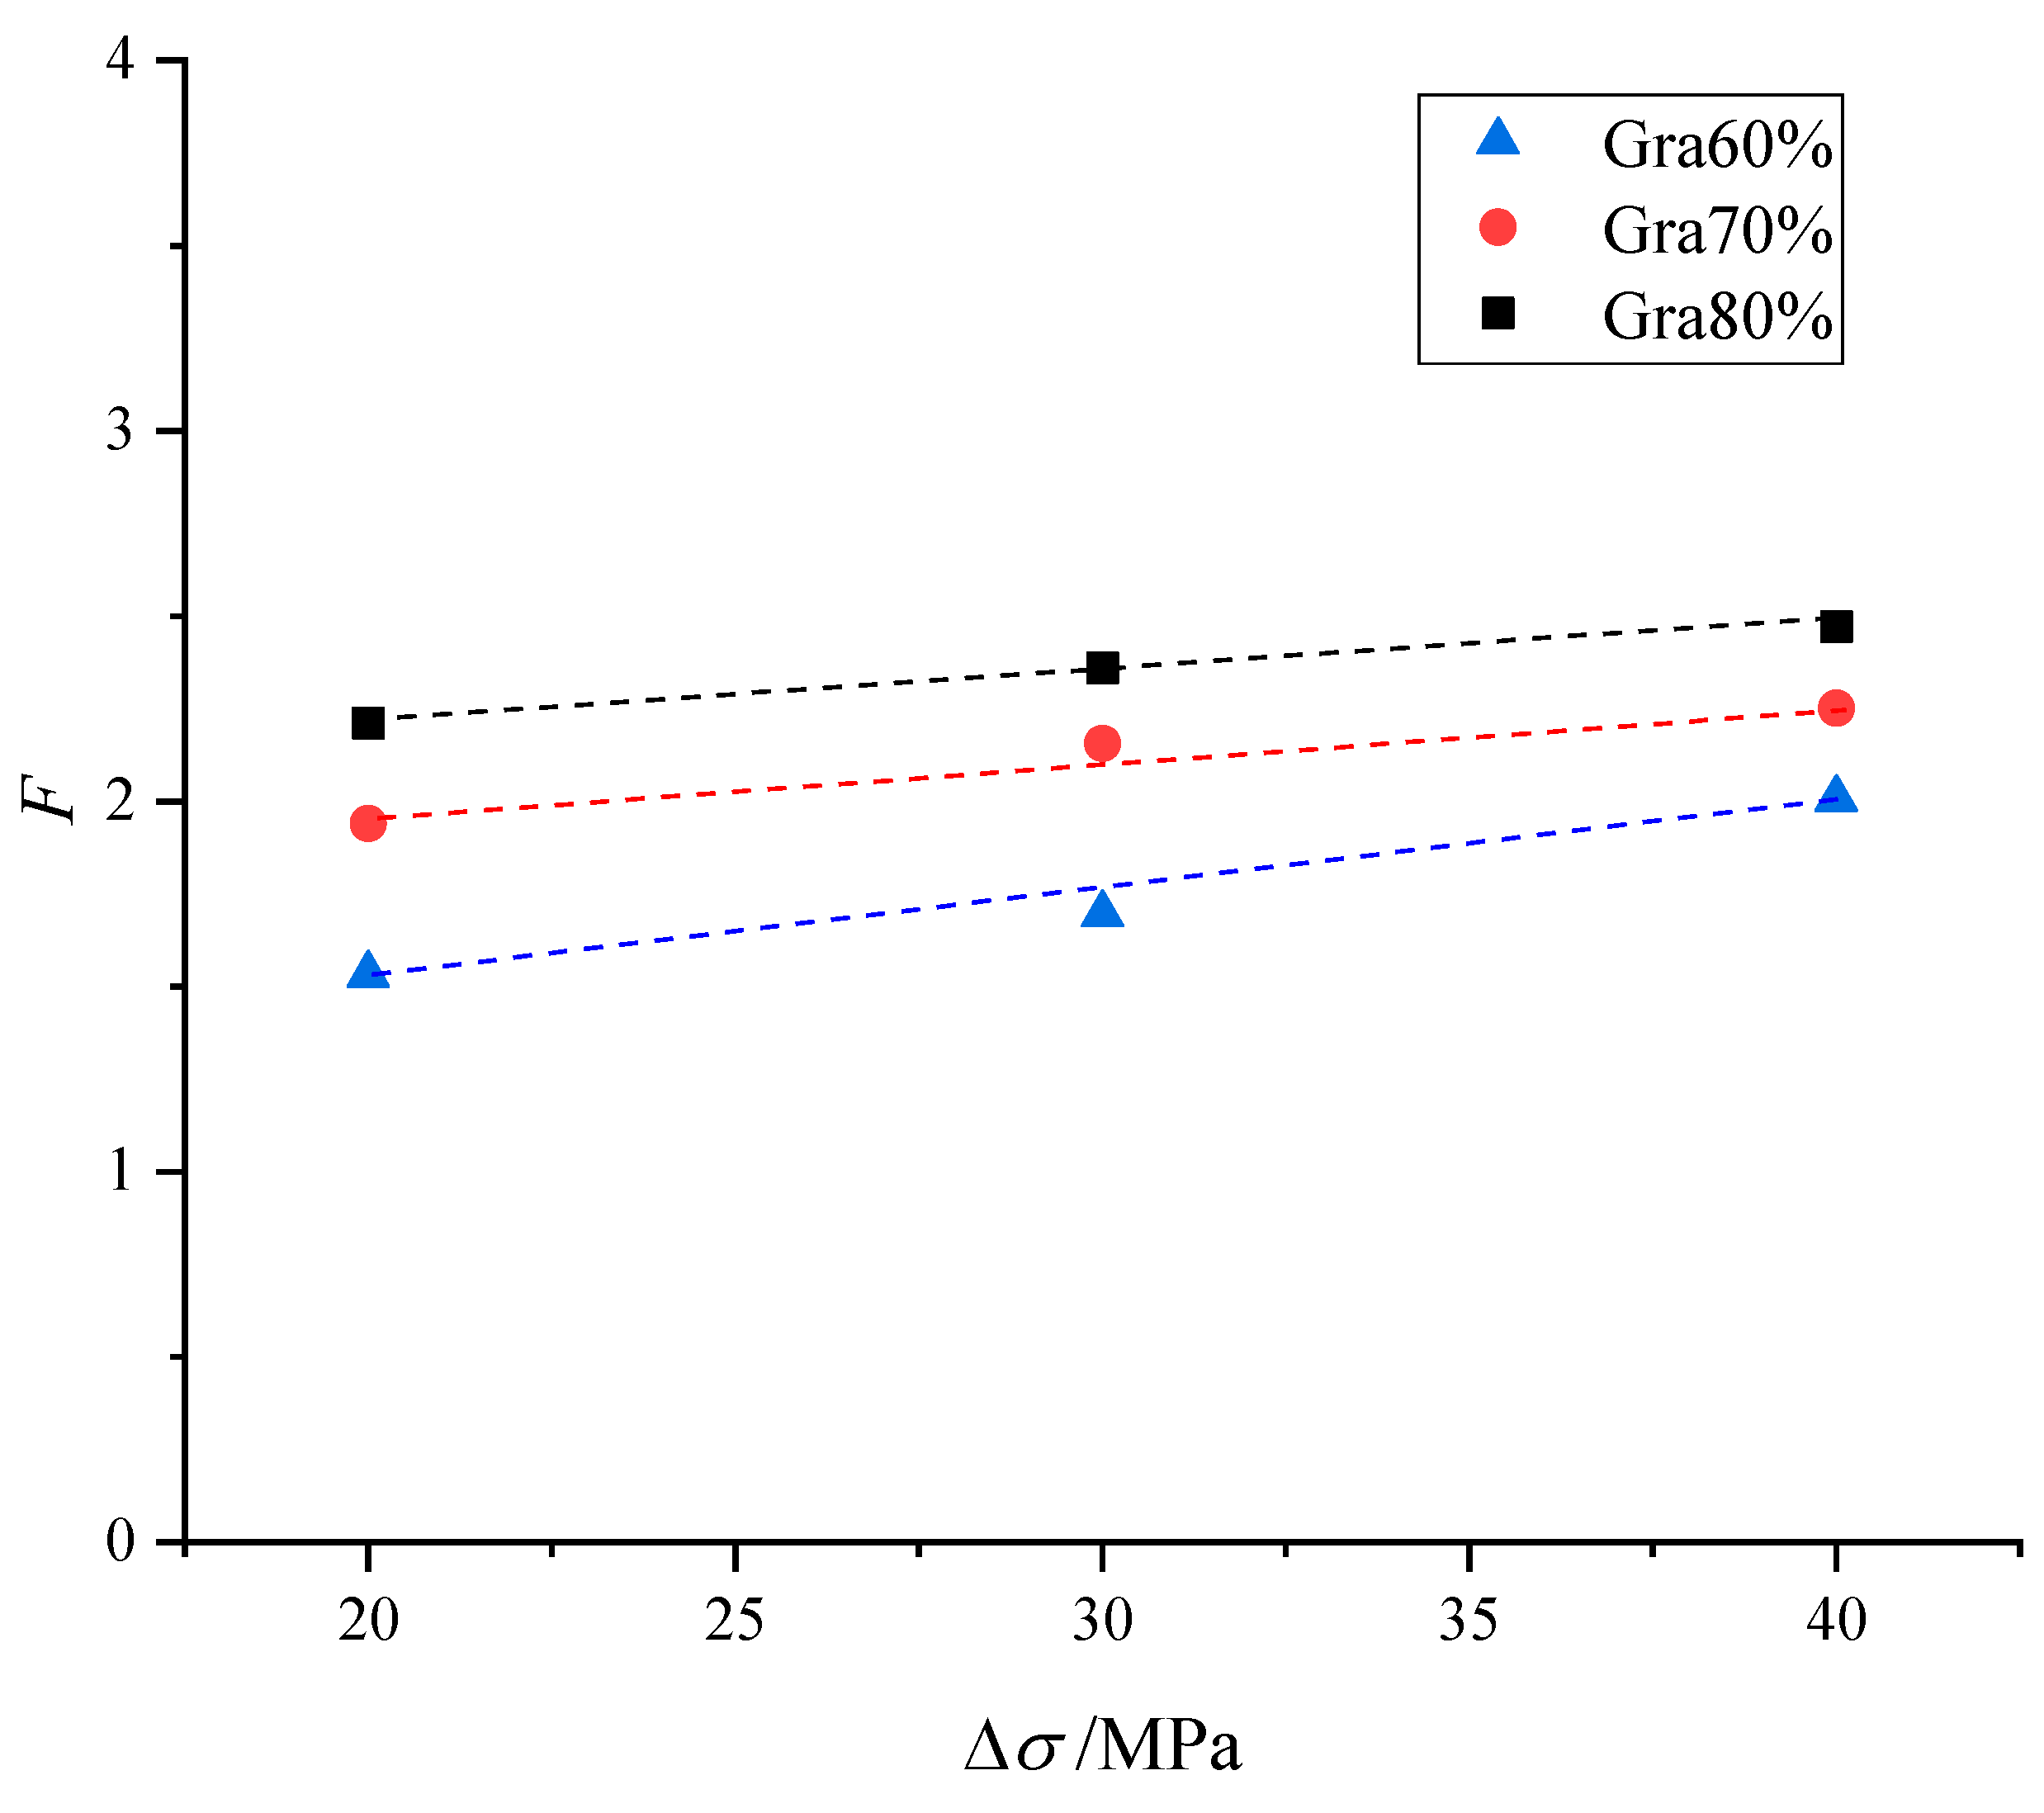
3.2.3. Relationship between the Fractal Dimension and Amplitude of Disturbance

According to the slopes of the above log(M(x)/MT)–logx fitted lines, the fractal dimensions F of each rock specimen are shown in Figure 16 (more detailed results are provided in Table 6): the correlation coefficients R2 are all high, suggesting that the particle size distribution of rock fragments broken under the cyclic disturbance loads conforms to a fractal relationship. Under the same axial prestress σm, the rock specimens are found to have a fractal dimension F that increases with increasing amplitude of disturbance, reaching 2.4 at most; because the fractal dimension can be used to characterize the degree of fragmentation of rocks, the larger F is, the greater the degree of fragmentation of the rocks.

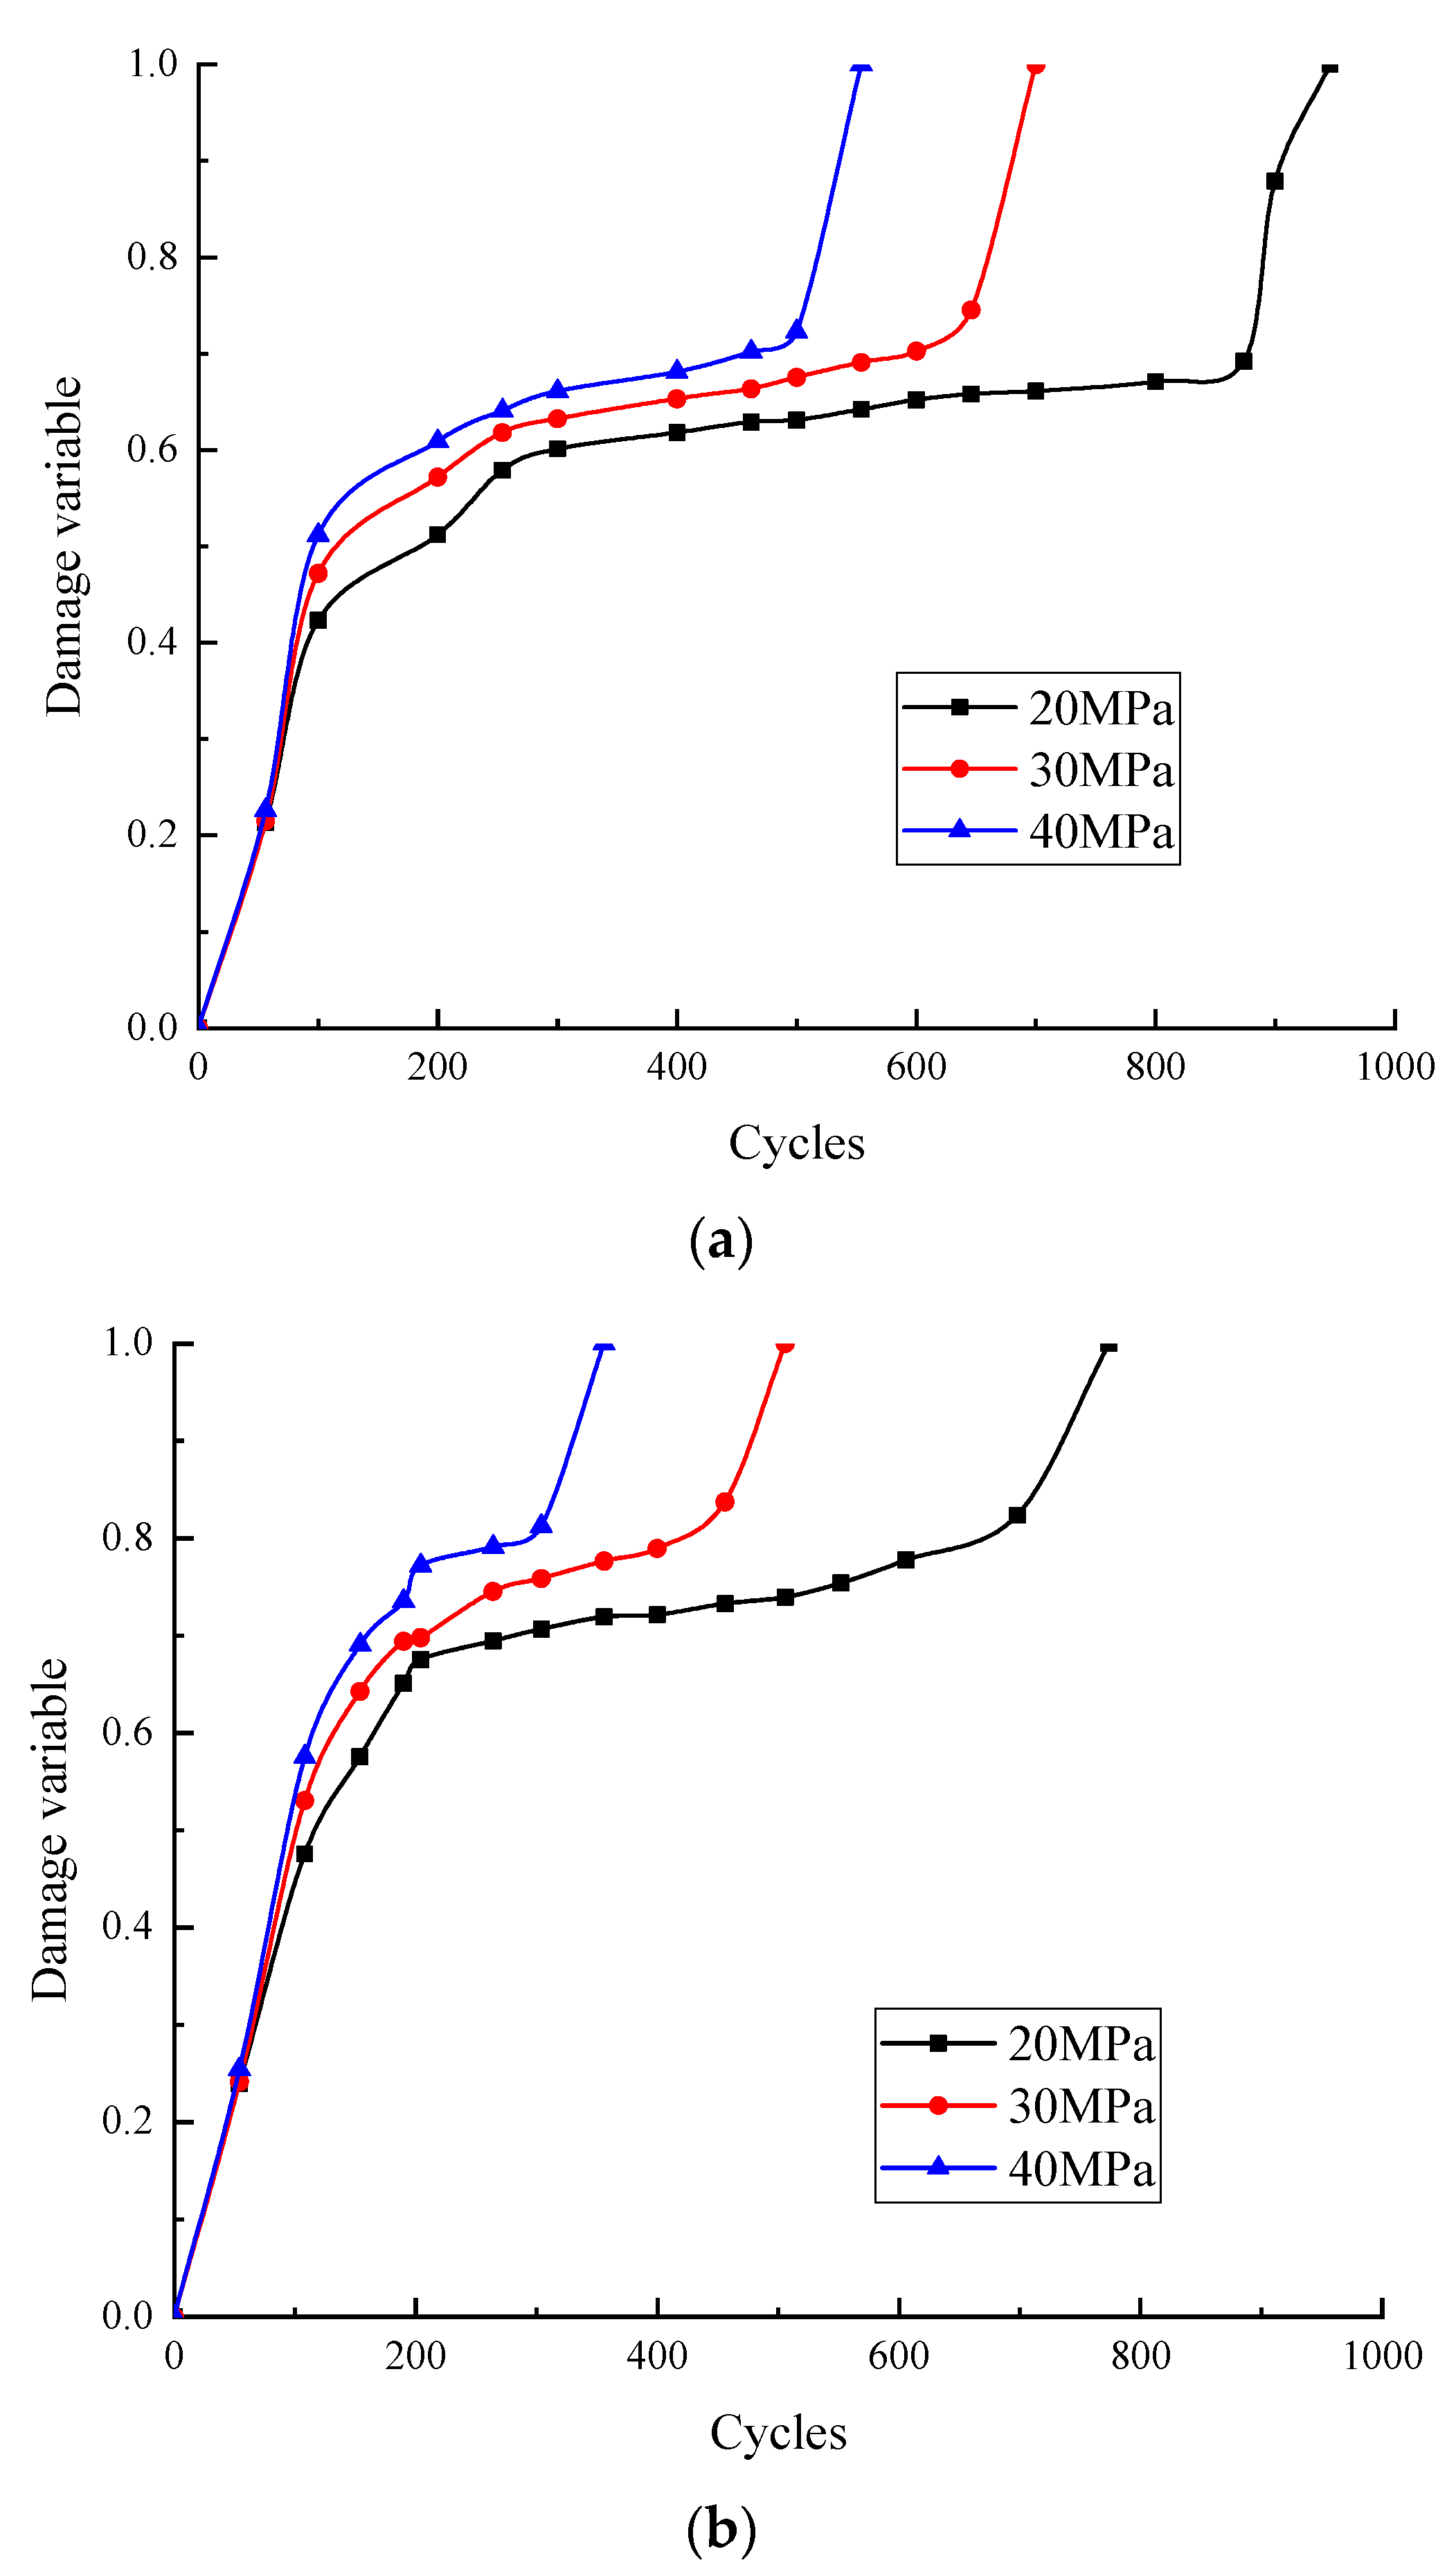
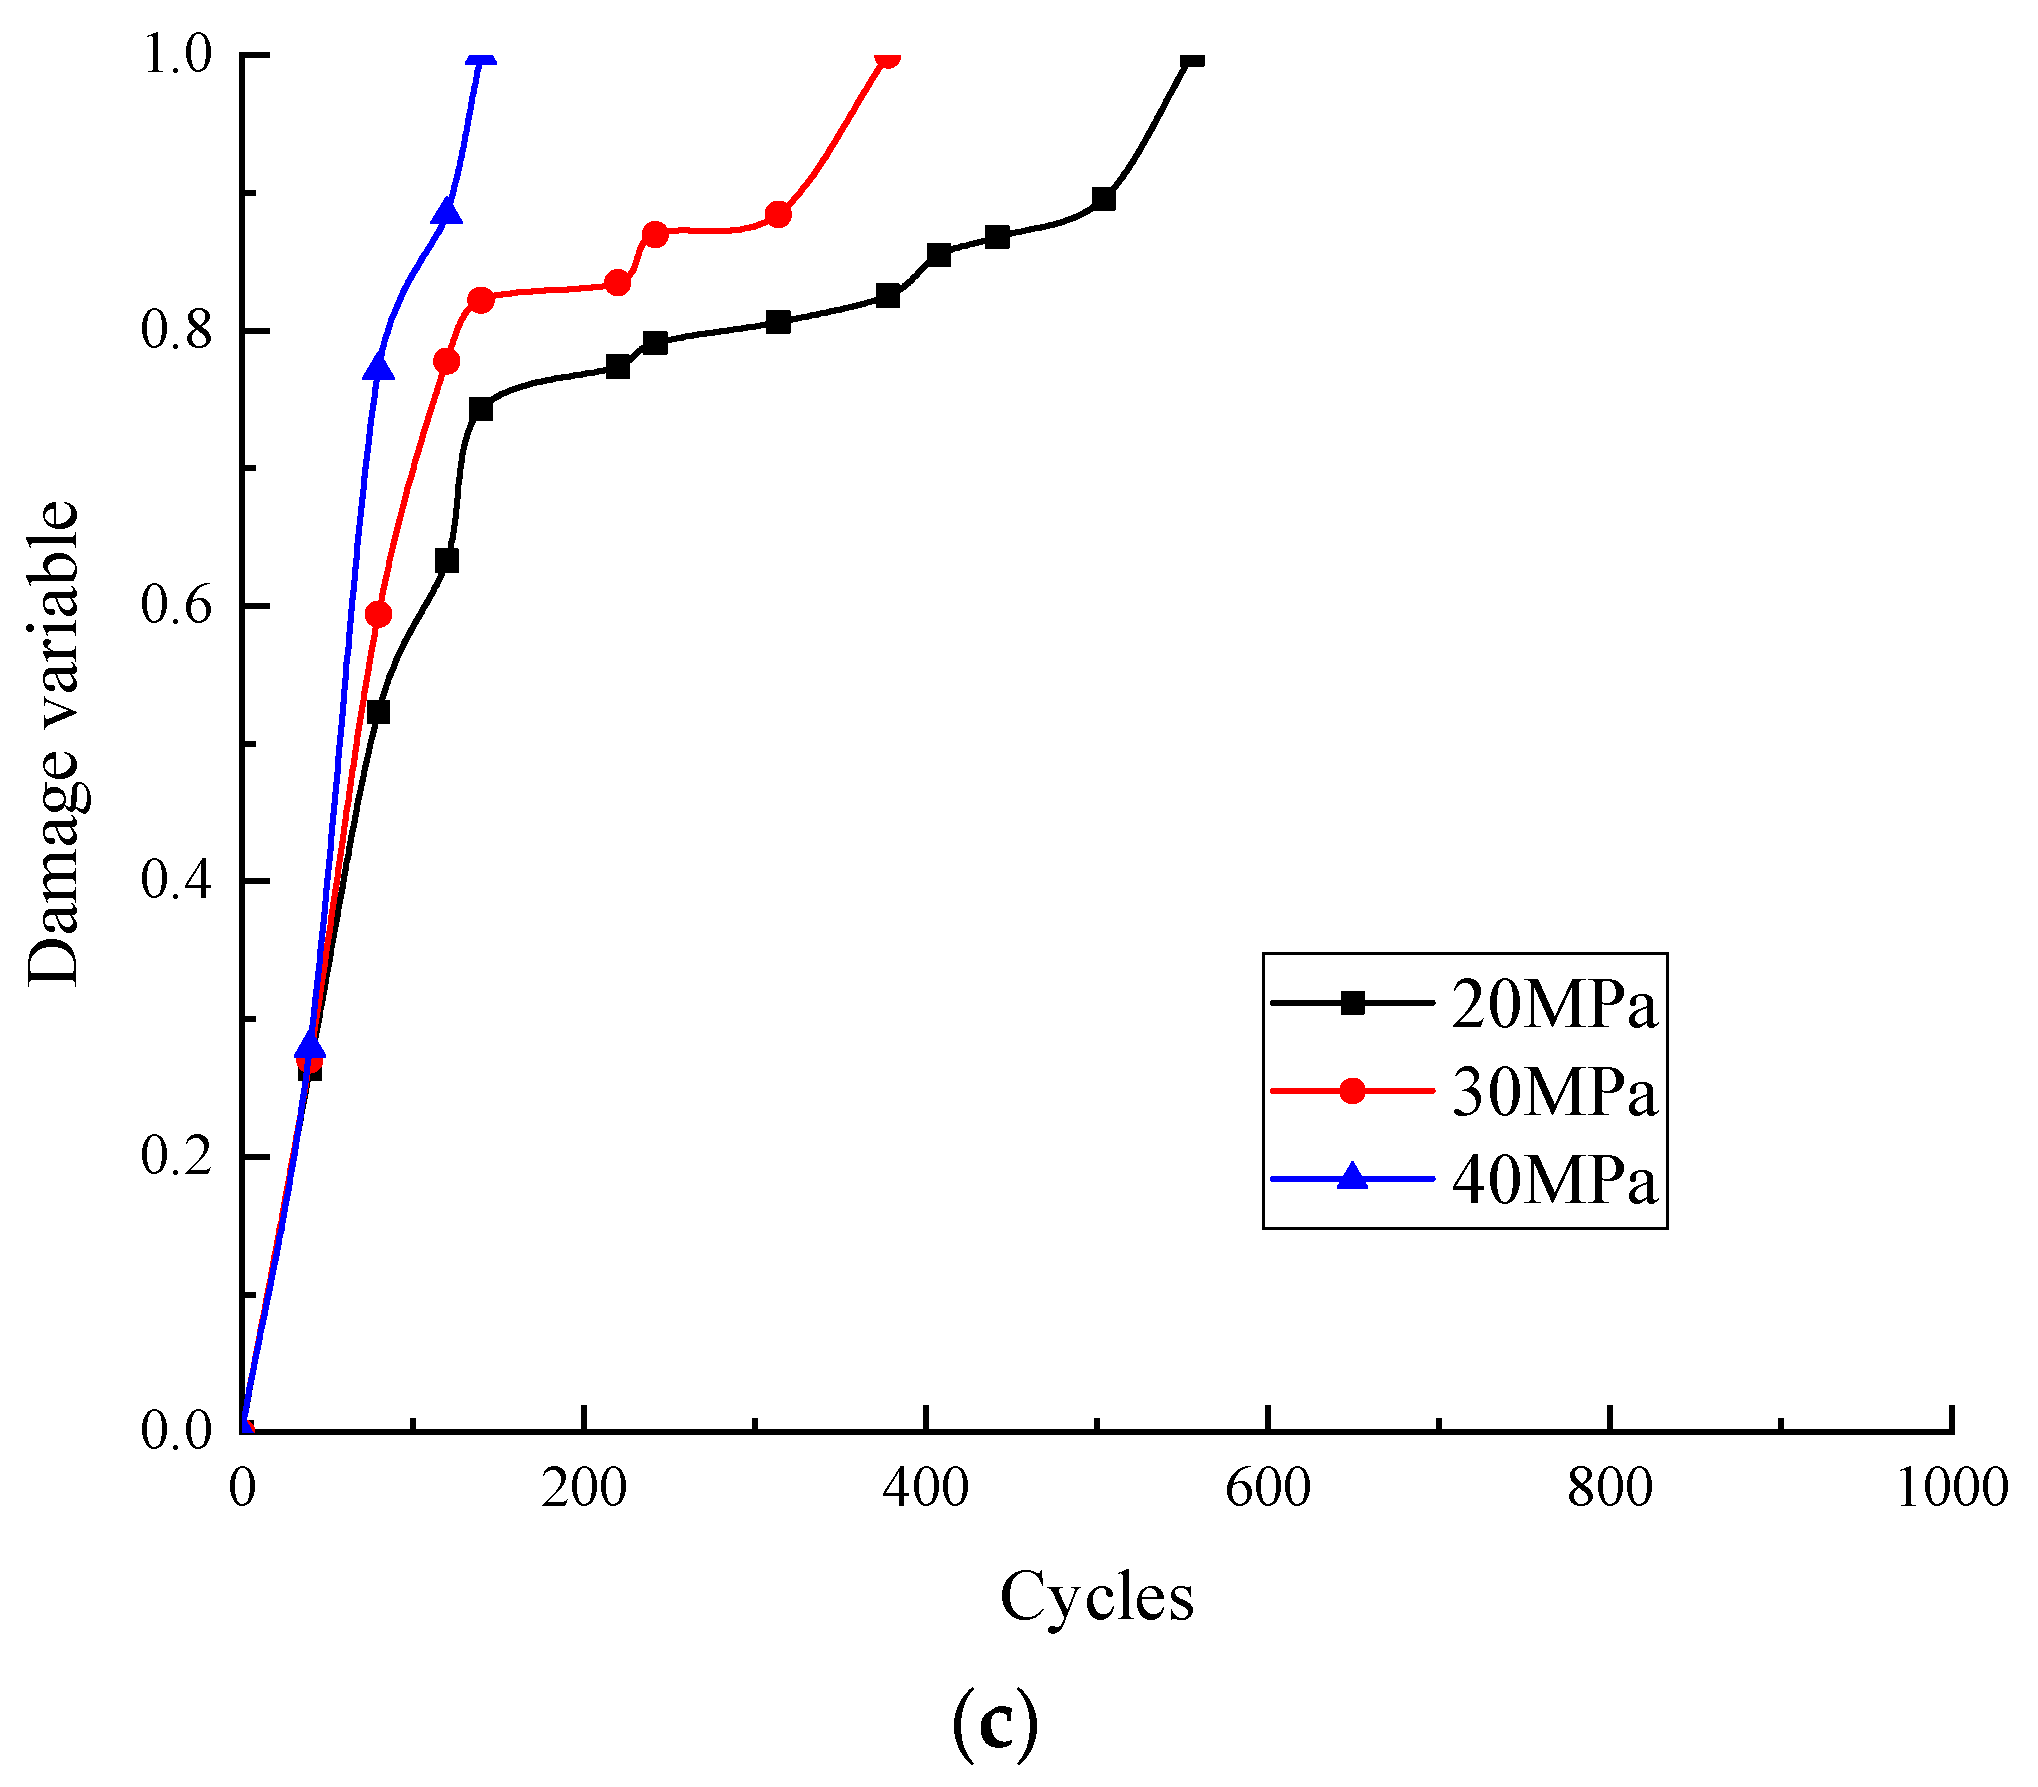
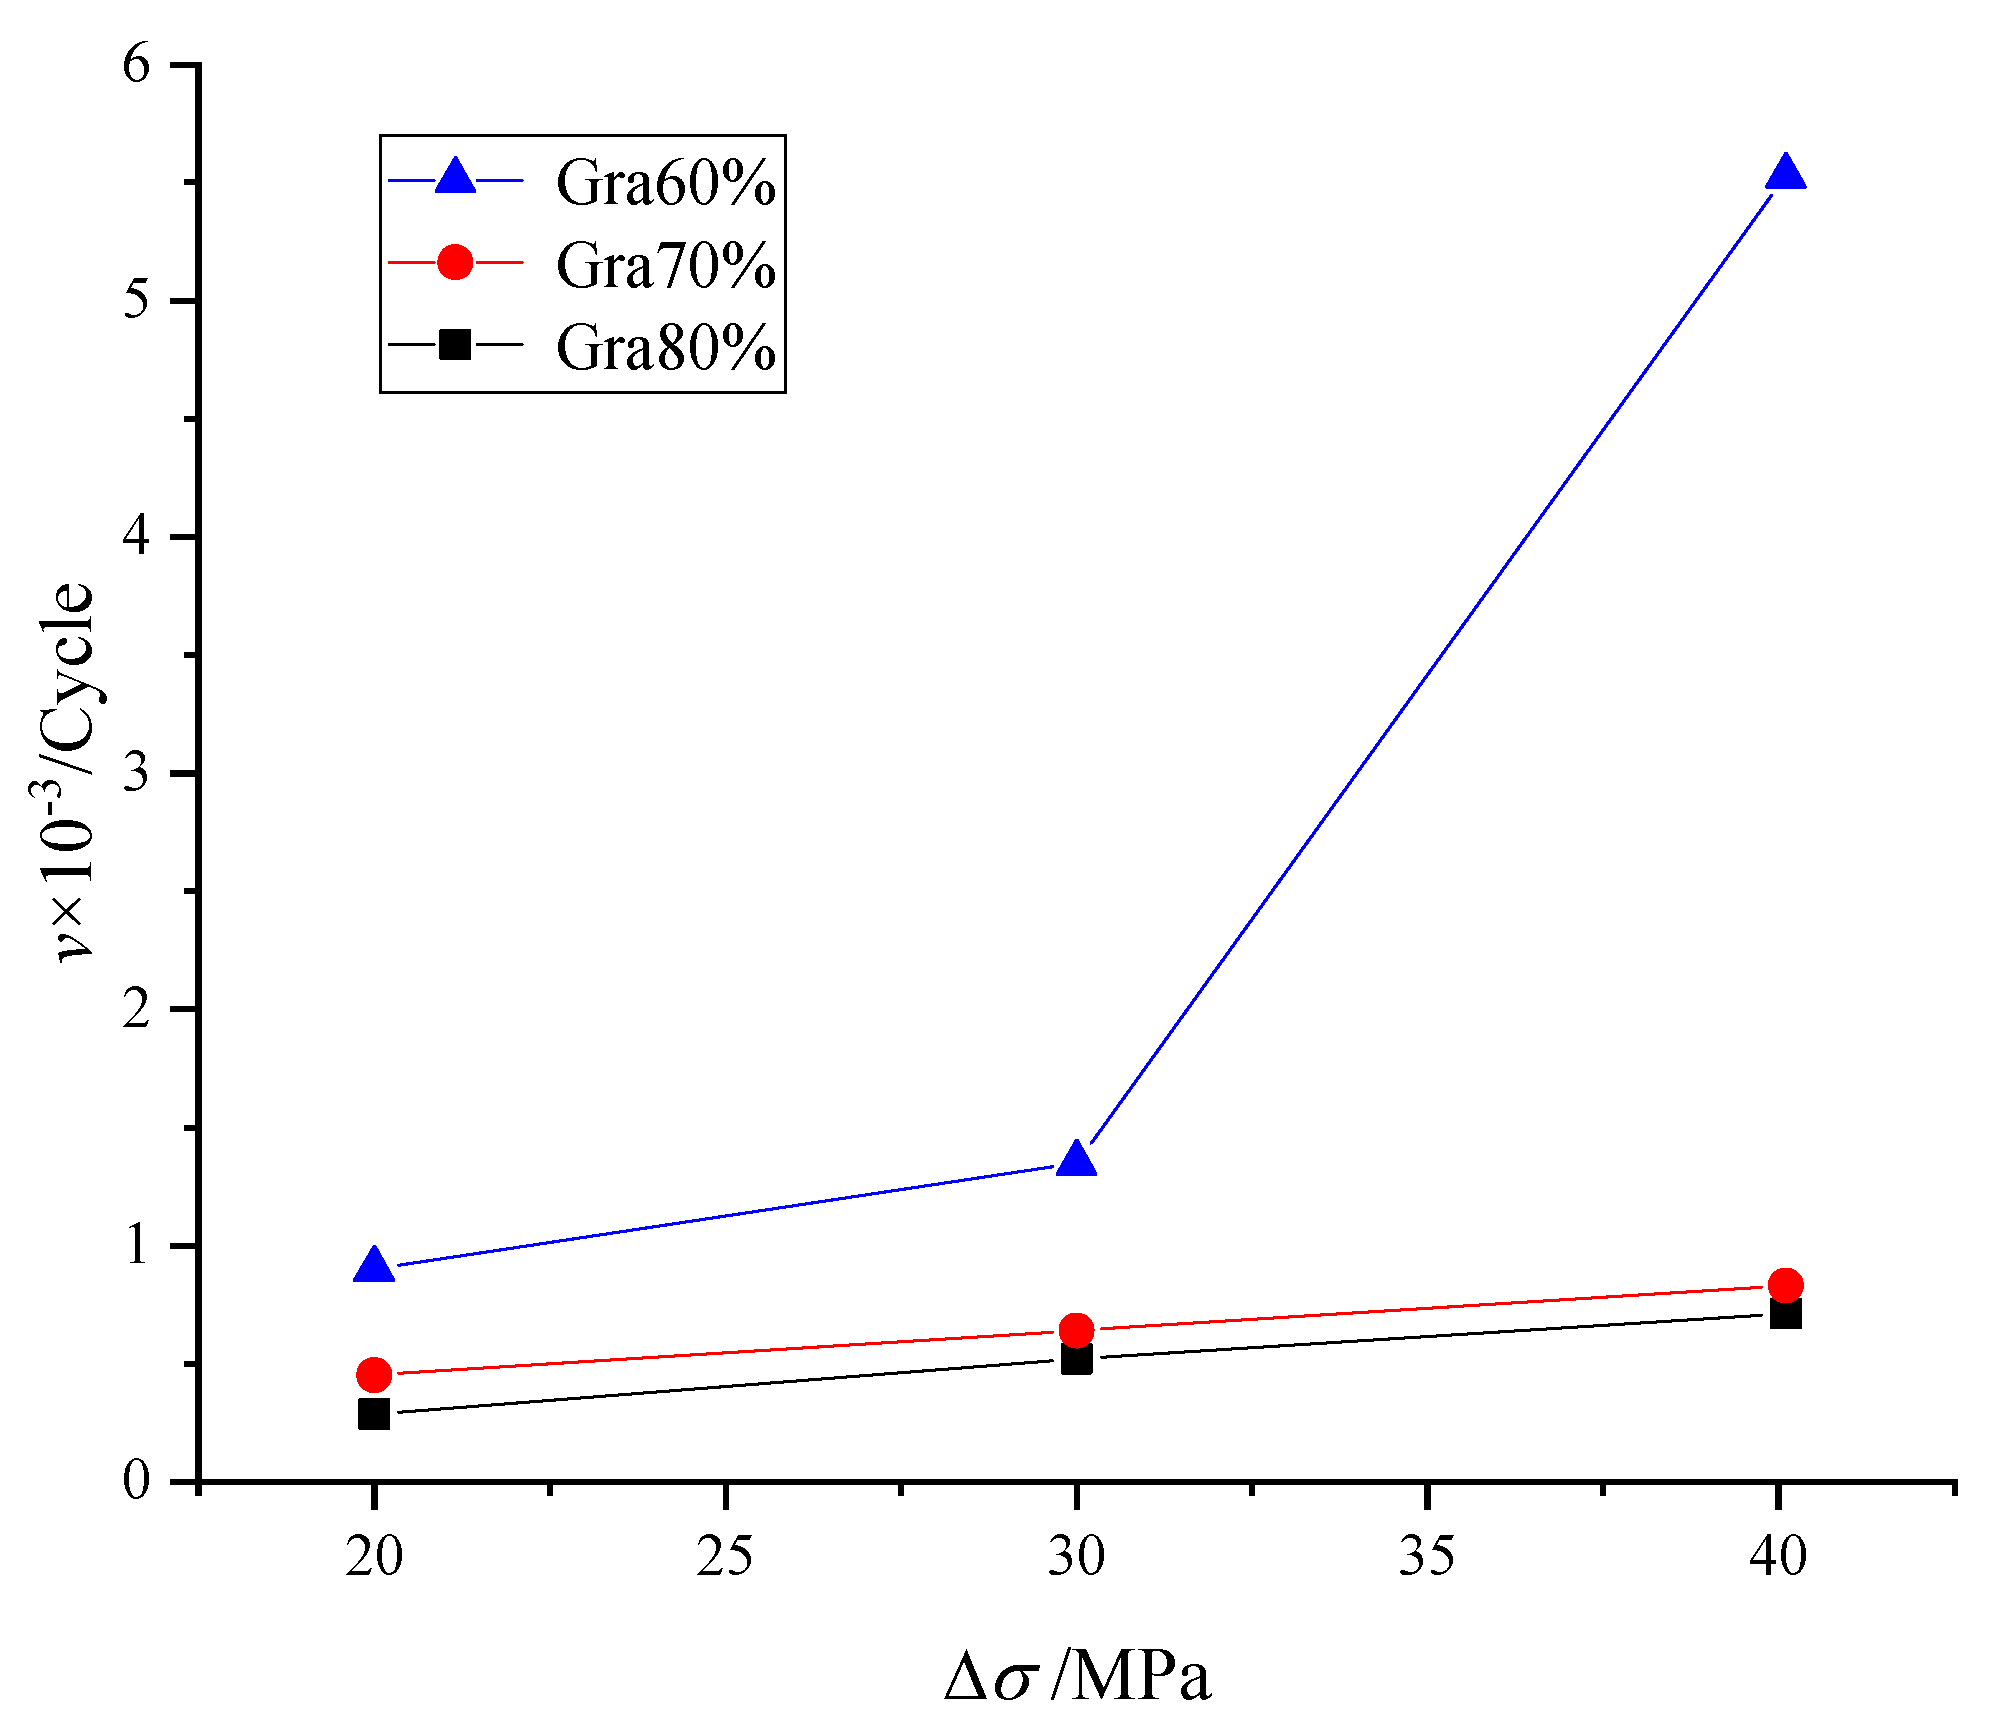
3.3. Damage Analysis of Specimens under Disturbance Loads

The failure of rocks under different cyclic dynamic disturbances is a gradual damage process of the internal part of rocks. The damage constitutive equation of rocks under the uniaxial compression is calculated as follows [14]:
σ = ε × E × ( 1 D ) ,
D = ε d ε × ε ε 0 ε 0 × ε d ,
where σ, ε, E, and D separately represent the stress, strain, modulus of elasticity, and damage variable of rocks. The values of ε0 and εd are derived according to the stress–strain curves in the test process.
Figure 17 shows the relationship between the number of disturbance cycles and the damage variable under different amplitudes of disturbance. The curves start from the axial static loading applied to the rock: the pre-set disturbance load is then applied until the rock specimen is damaged. It can be seen from the figure that the damage variable first shows a rapid, then steady, and, finally, rapidly increasing trend under the cyclic disturbance, and, as the amplitude of disturbance increases, the number of cycles in the steady increase stage is significantly reduced.
The rate of change of the damage variable in the steady increase stage is defined as V, which is calculated using the following formula [42]:
V = D b D a C b C a ,
where Db and Da are the initial damage variables in the steady increase stage; Cb and Ca represent the number of cycles of the initial disturbance loads that have been applied.
The rates of change of the damage variable in the steady increase stage, calculated using Formula (9), are shown in Figure 18 (more detailed results are provided in Table 7. It can be seen from Figure 18 that both the amplitude of disturbance loads, and the initial axial static loads exert significant influences on the rate of change of the damage variable in the steady increase stage. With the increasing amplitude of disturbance and the initial static load, the rate of change of the damage variable grows rapidly. Particularly when the initial static load is close to the peak strength, the rock shows a higher sensitivity to the disturbance, so that the rate of change of the damage variable rises significantly with the increasing amplitude of disturbance.

4. Conclusions

Taking granite collected from the deep underground powerhouse of Shuangjiangkou Hydropower Station in Sichuan Province as the research object, mechanical tests were carried out on the rock under low-frequency cyclic disturbances. The characteristic stresses, fractal dimensions of fragments, and damage evolution of the deeply buried rock under disturbance environment were studied. The following conclusions were reached:
  • Under the dynamic disturbance loads, the failure stress of the granite under loading gradually increases with the increases in the initial prestress and the disturbance load due to the coupling between the damage and strain-rate effect. In the case that the initial axial prestress σm is the same, the failure stress shows an increasing trend with the increment in the amplitude of disturbance Δσ; under the same Δσ, the failure stress elevates with increasing σm.
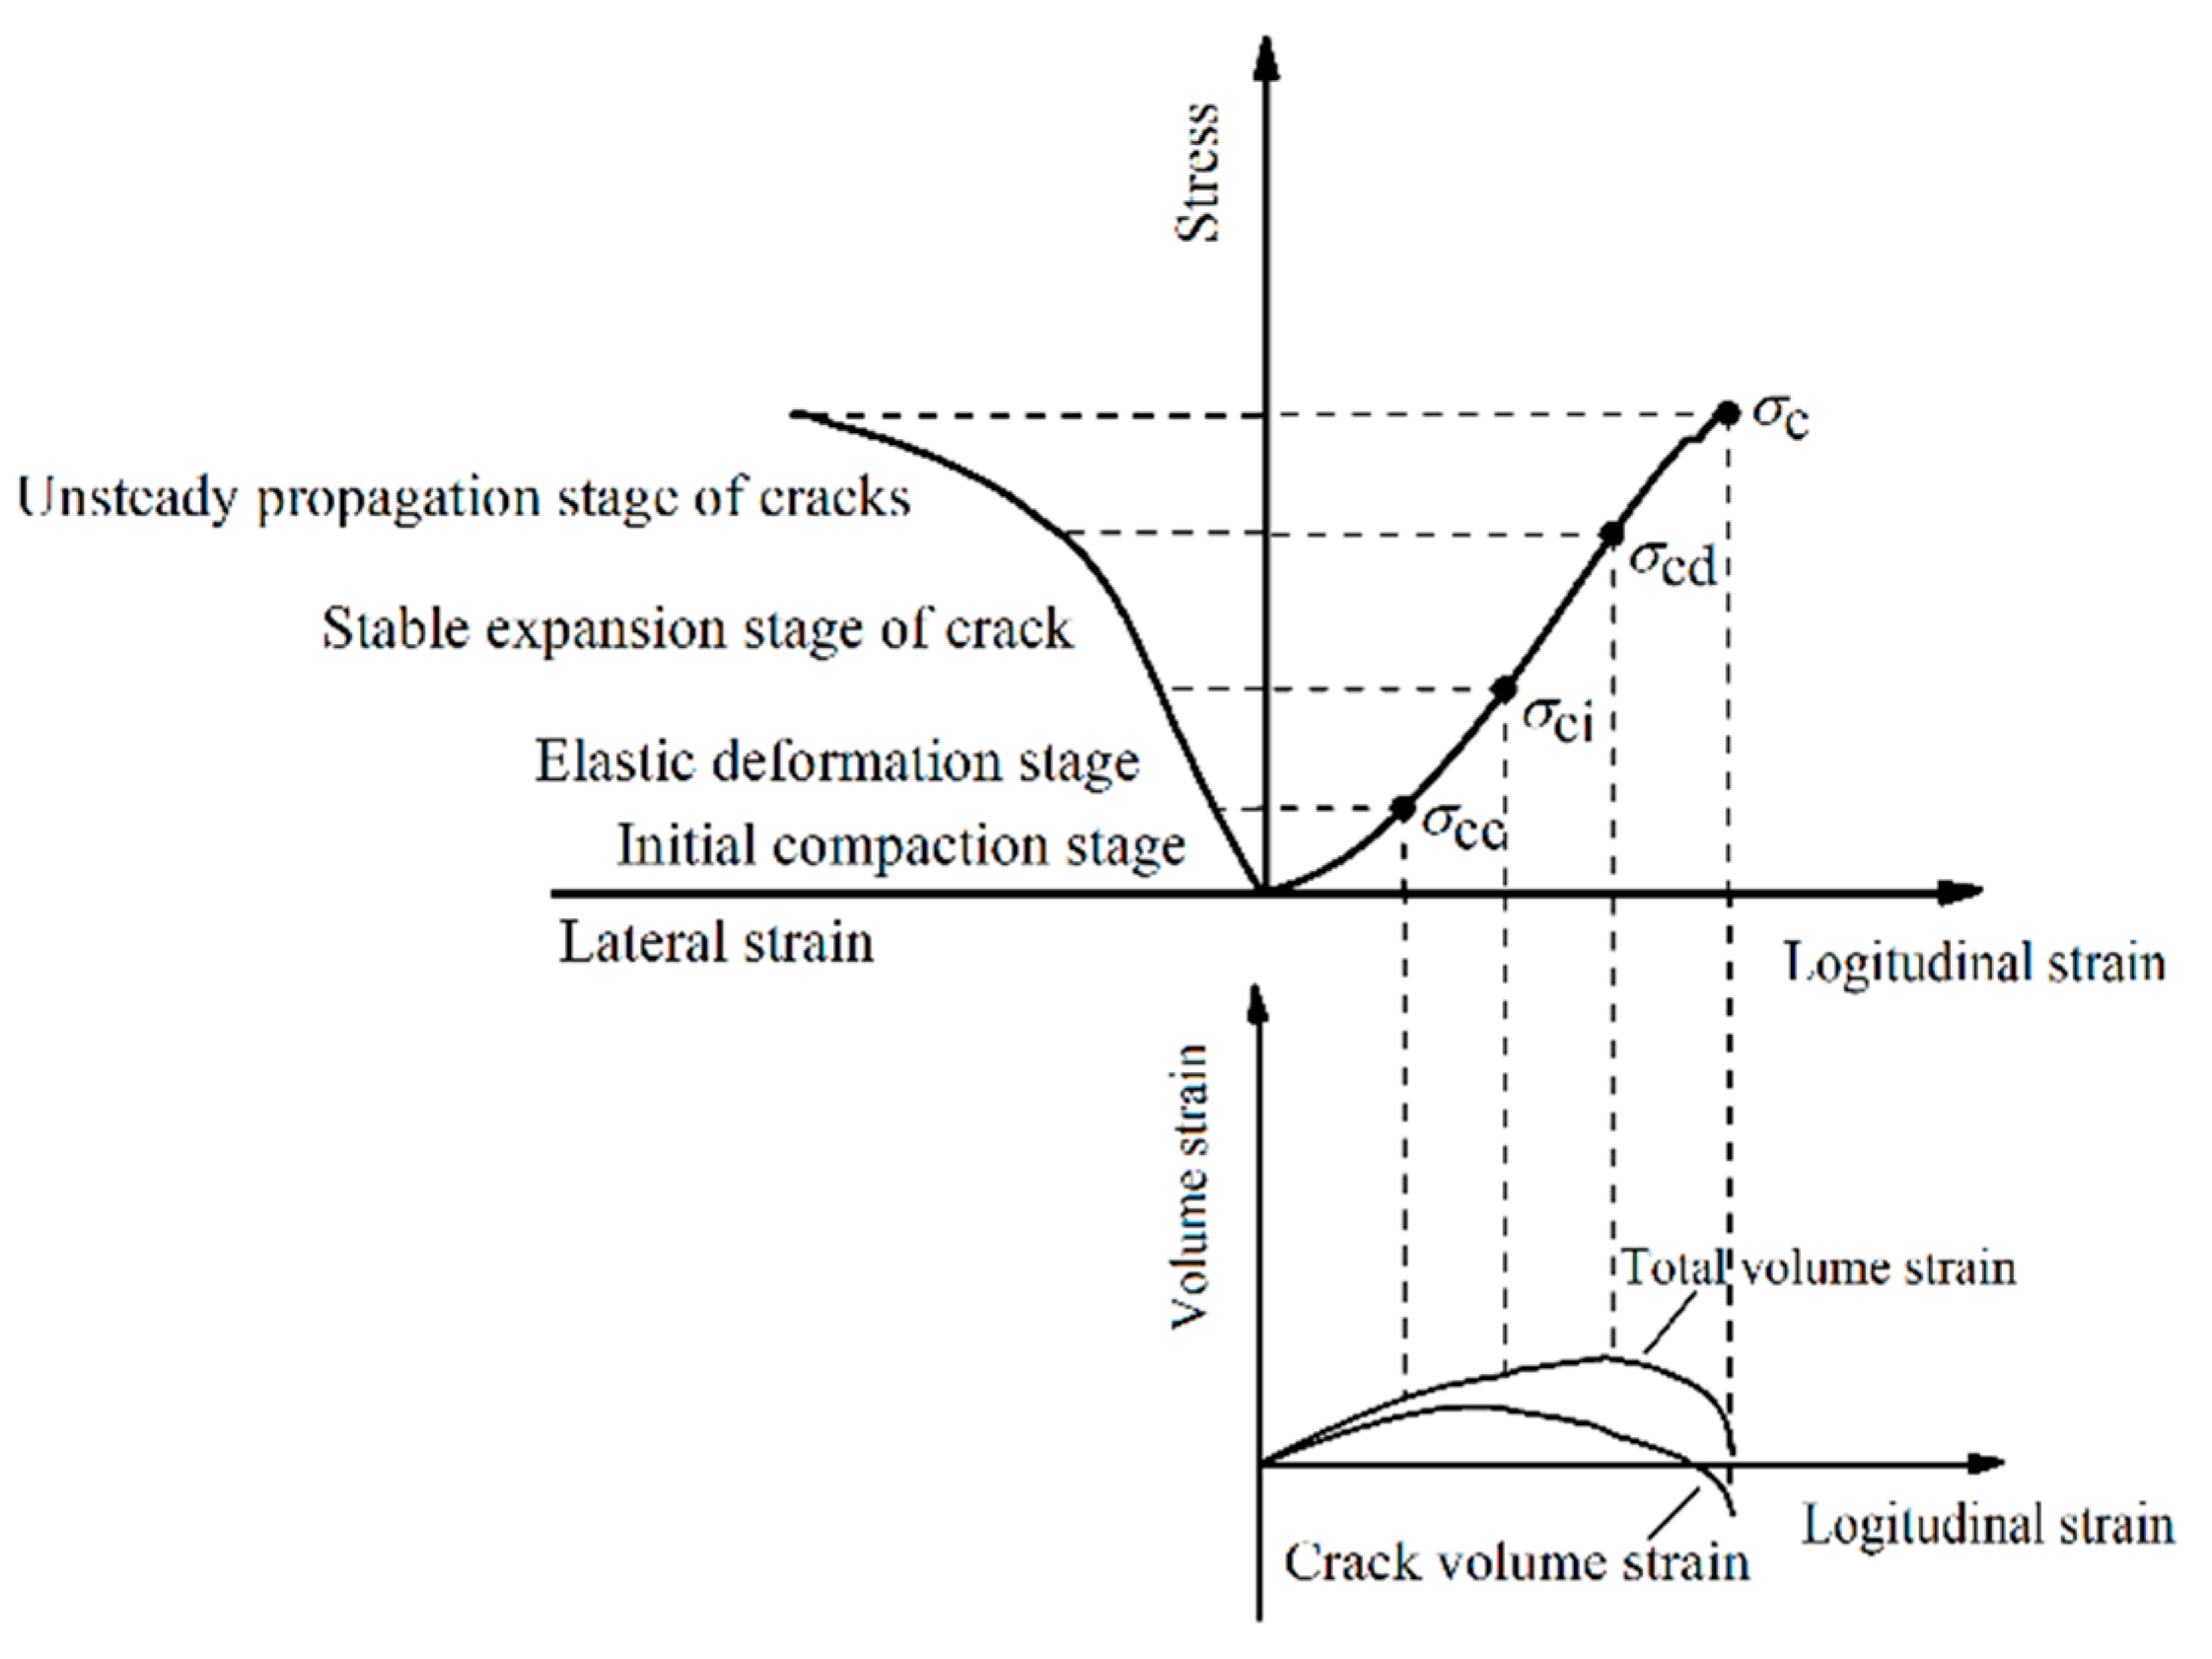
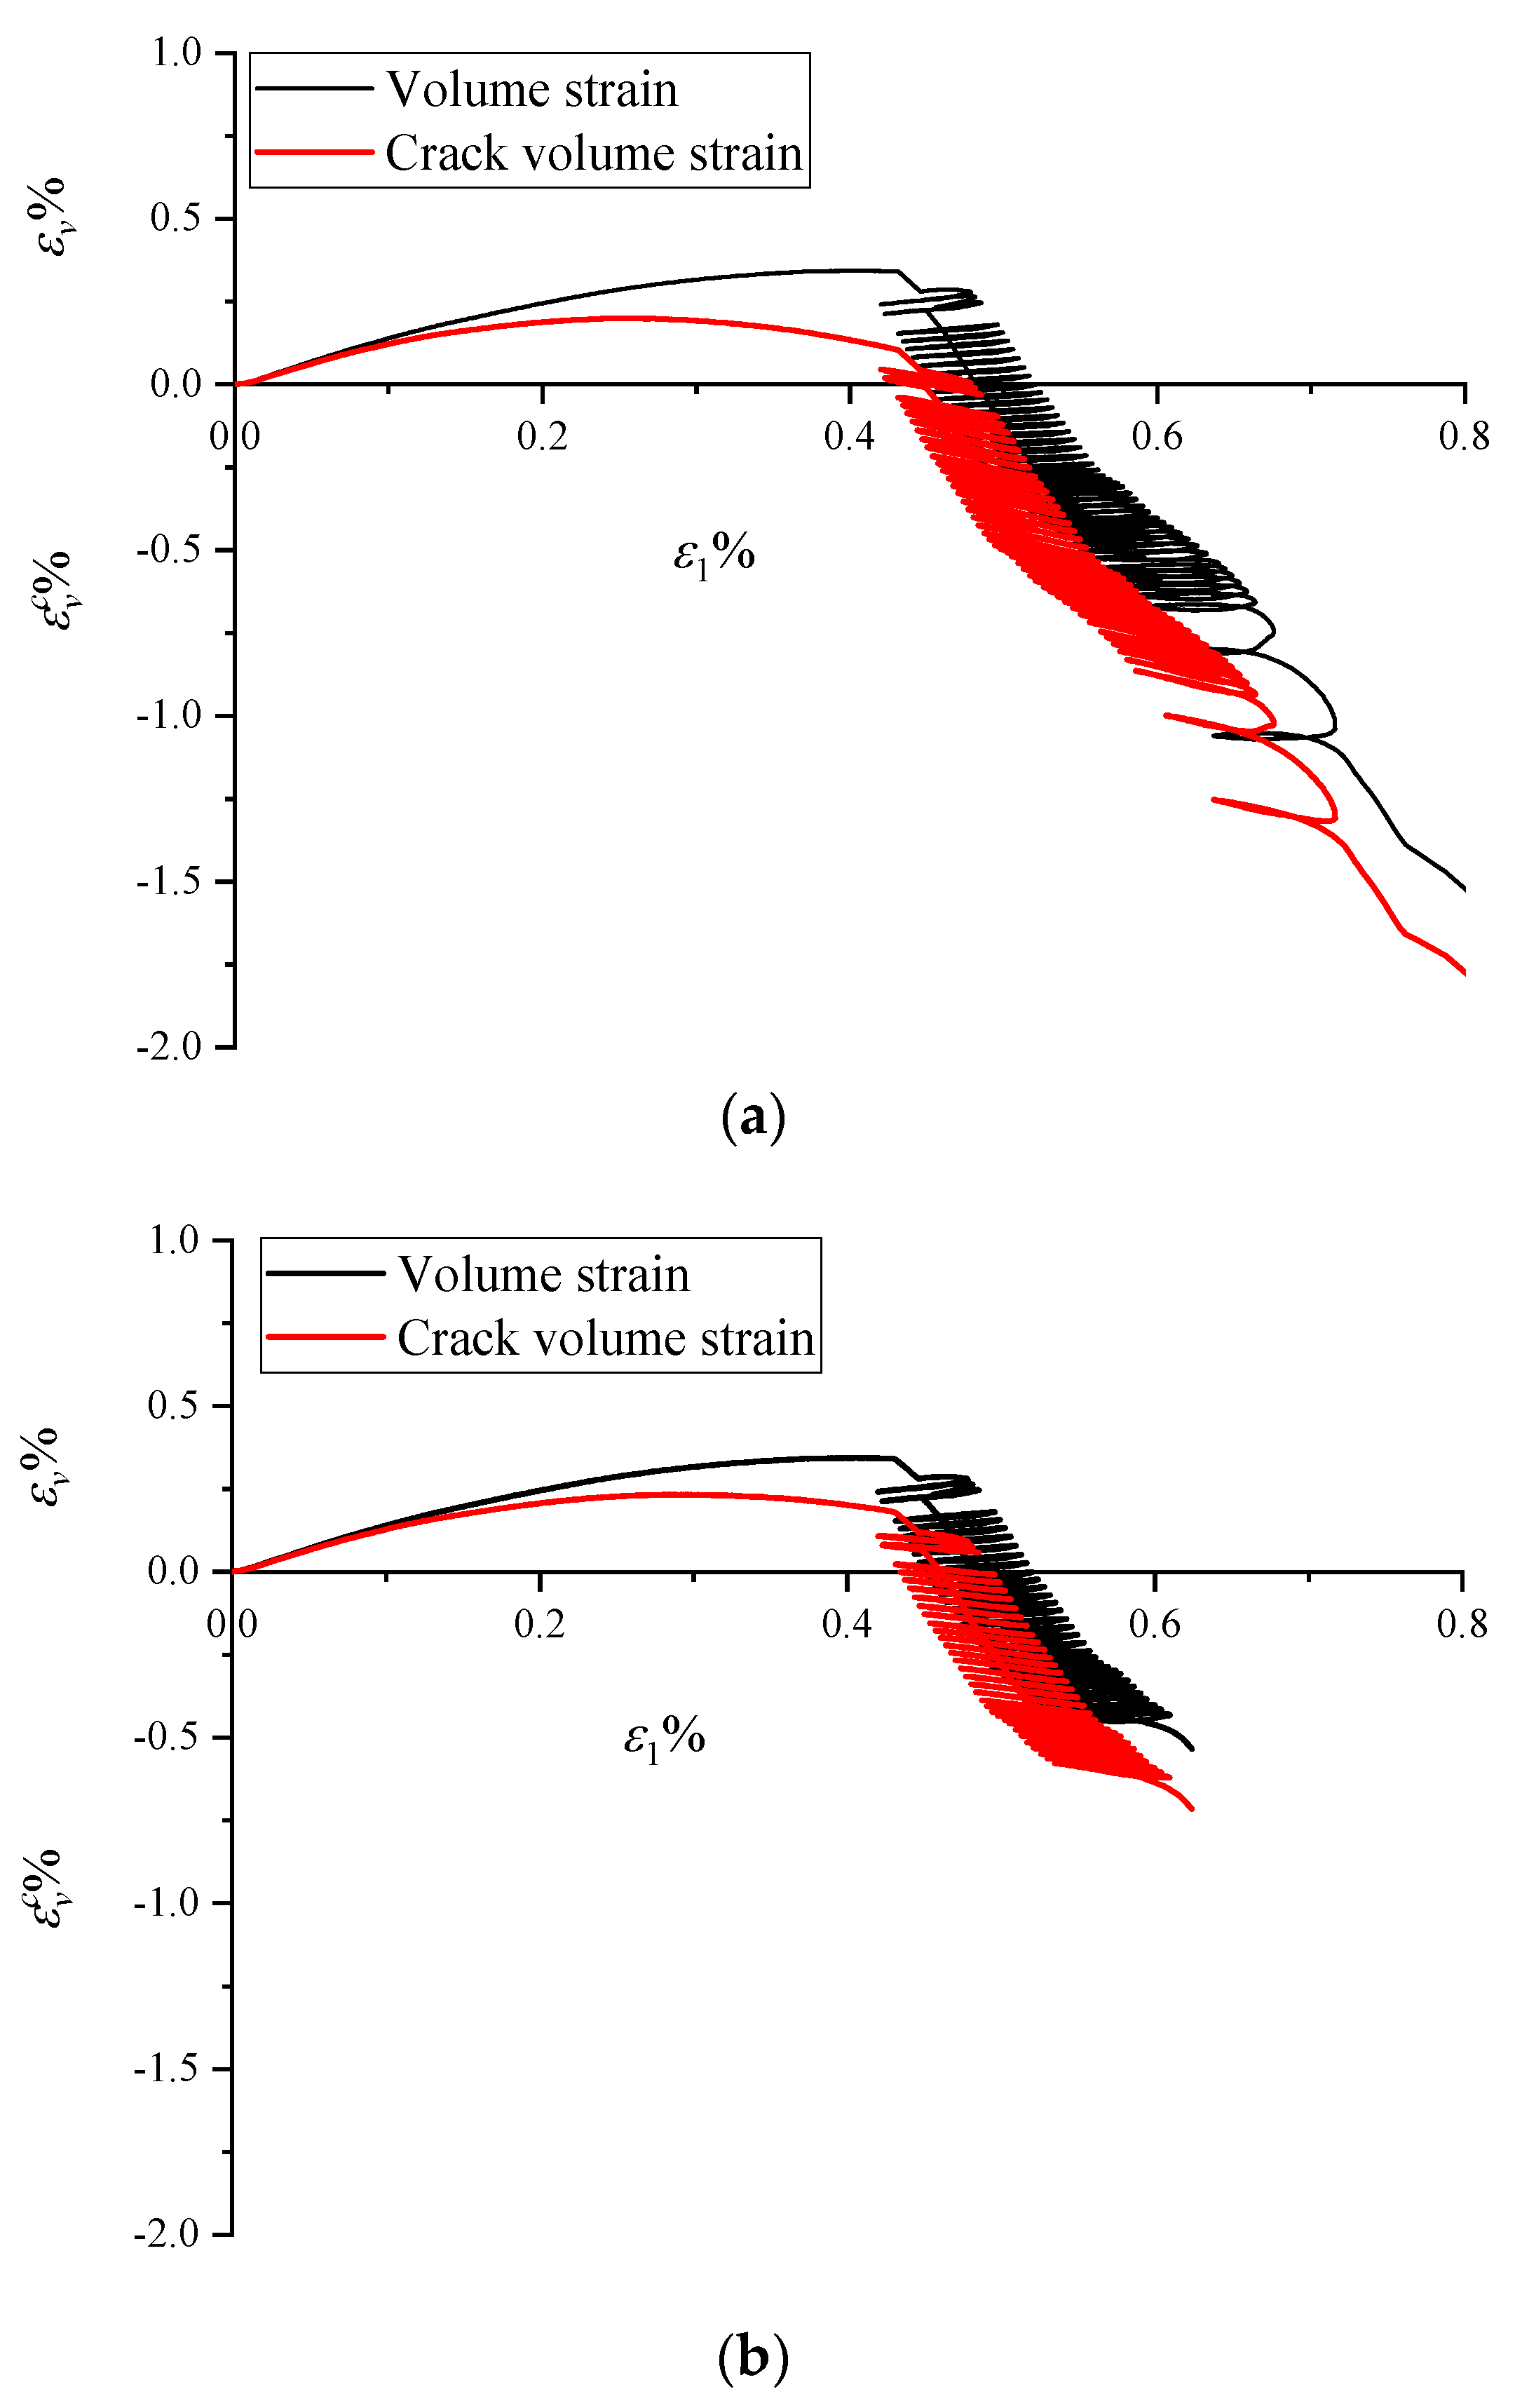
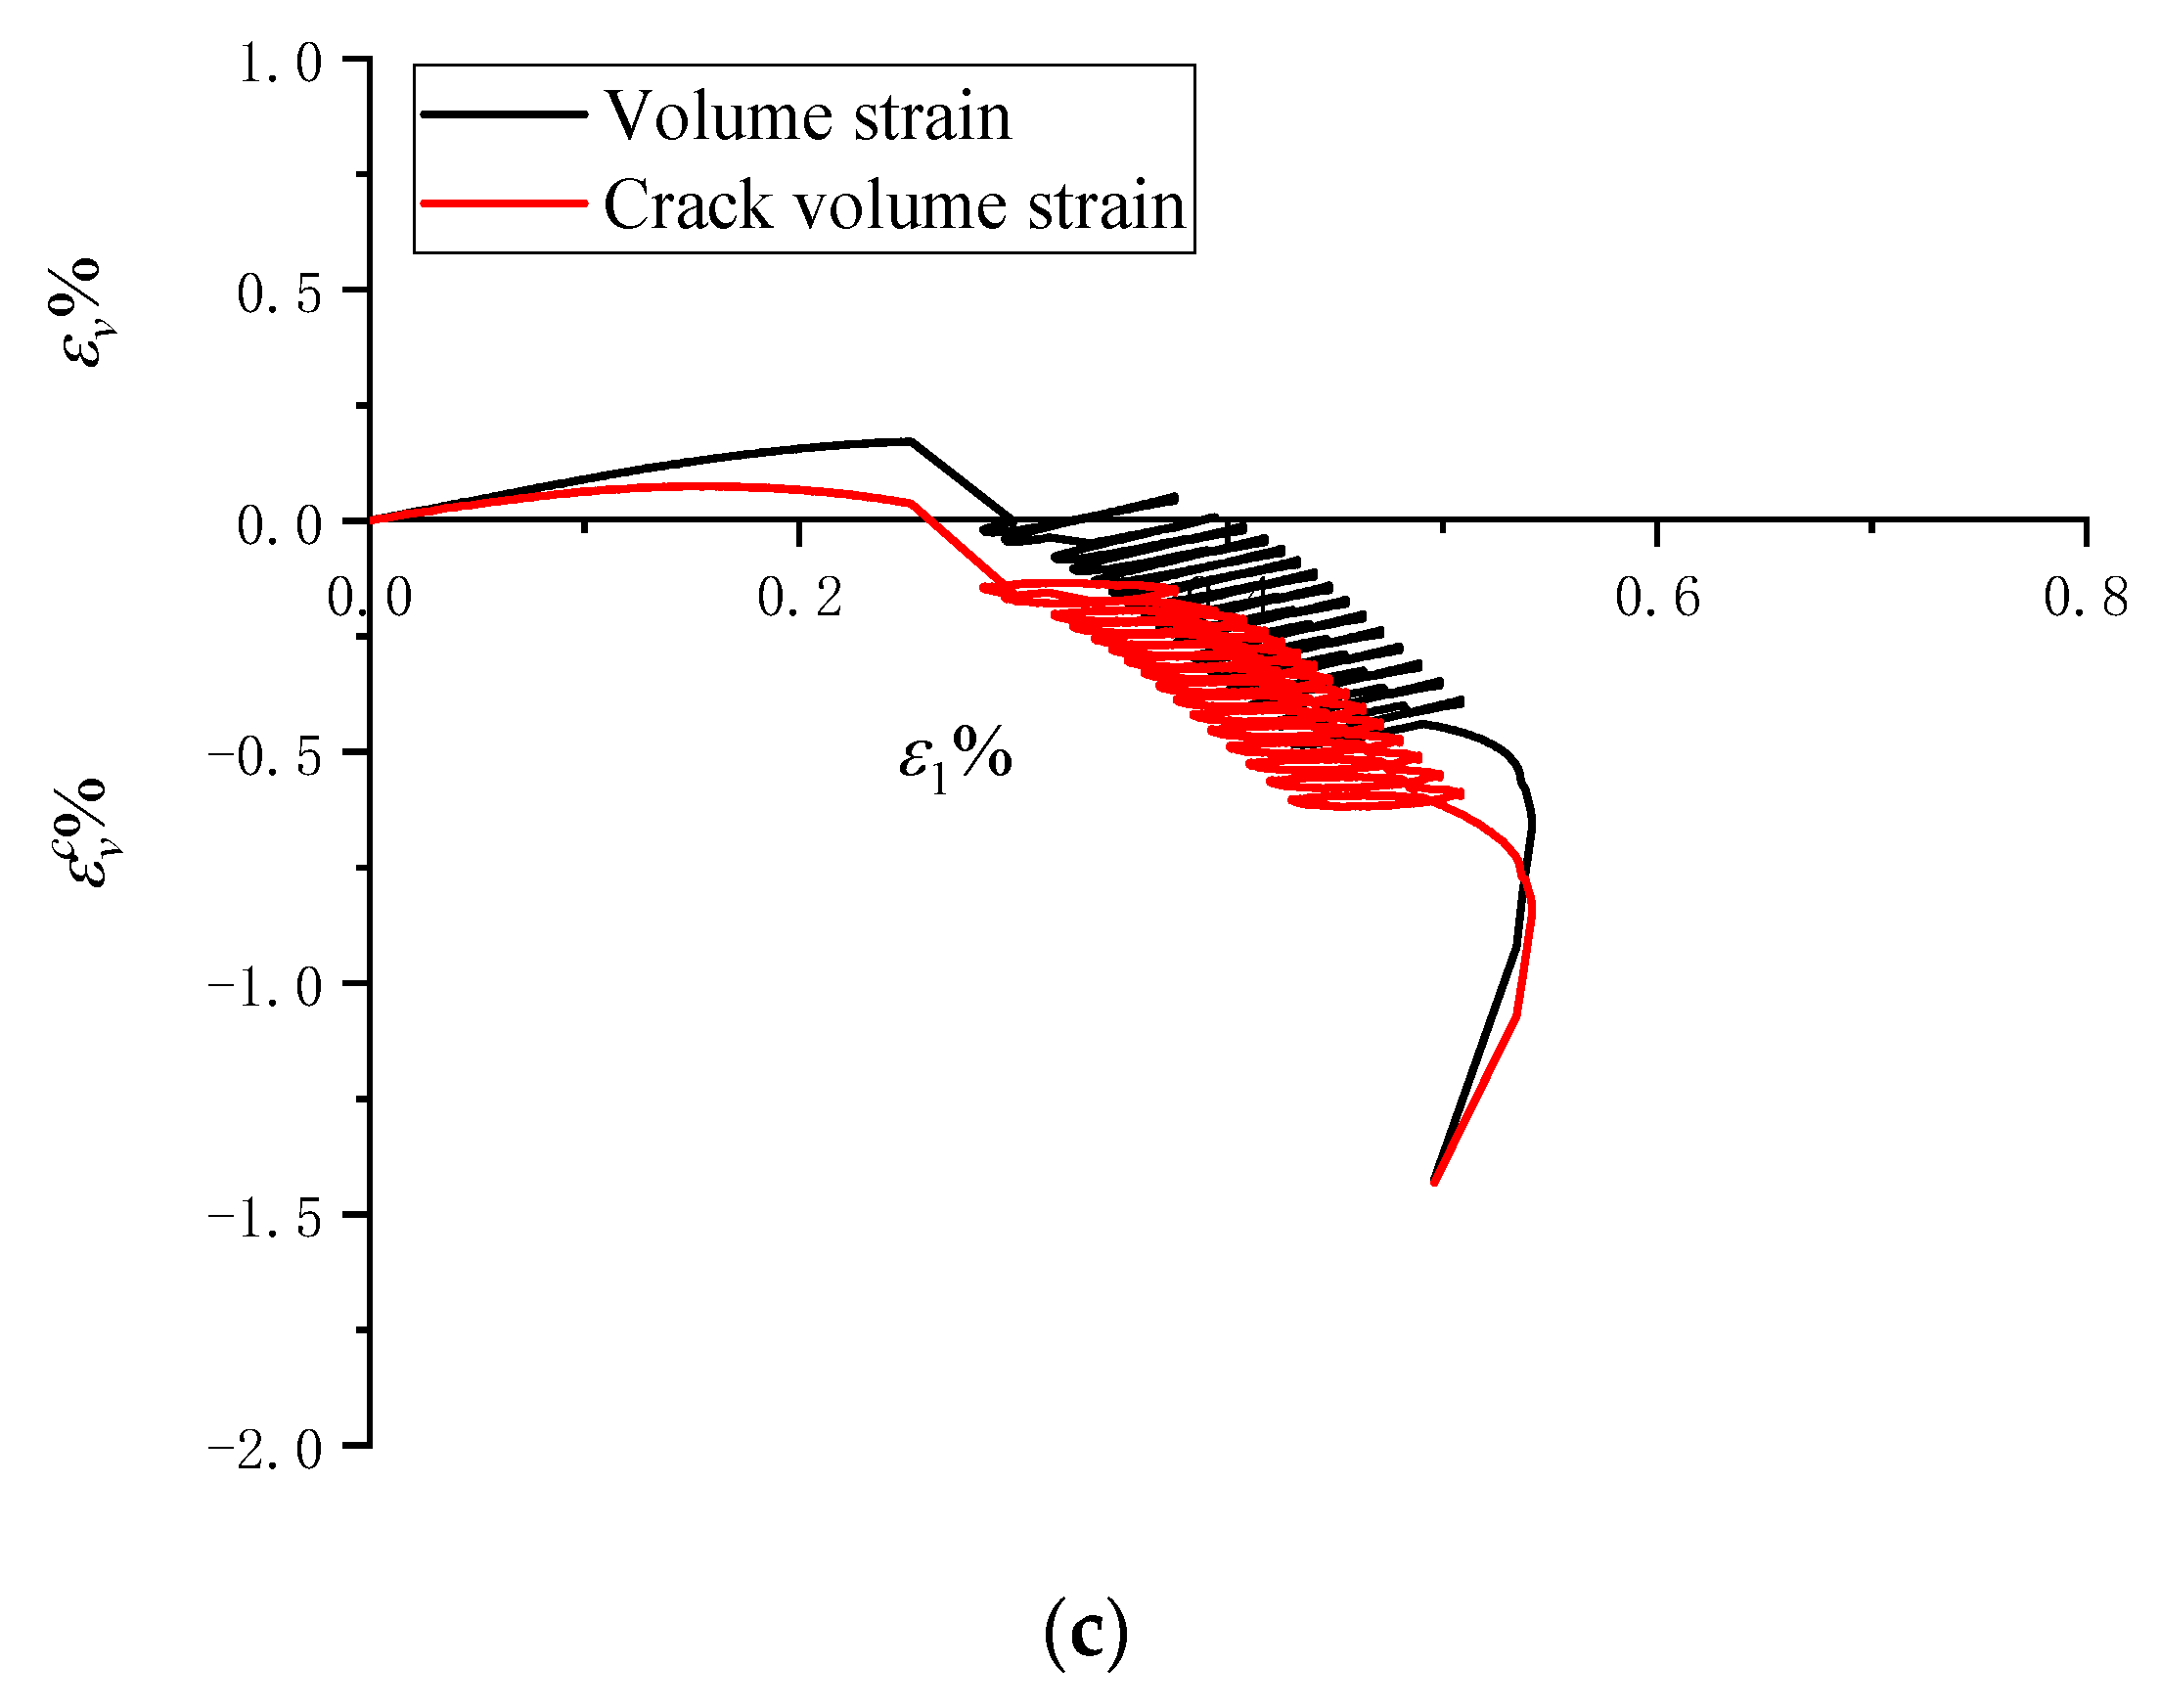
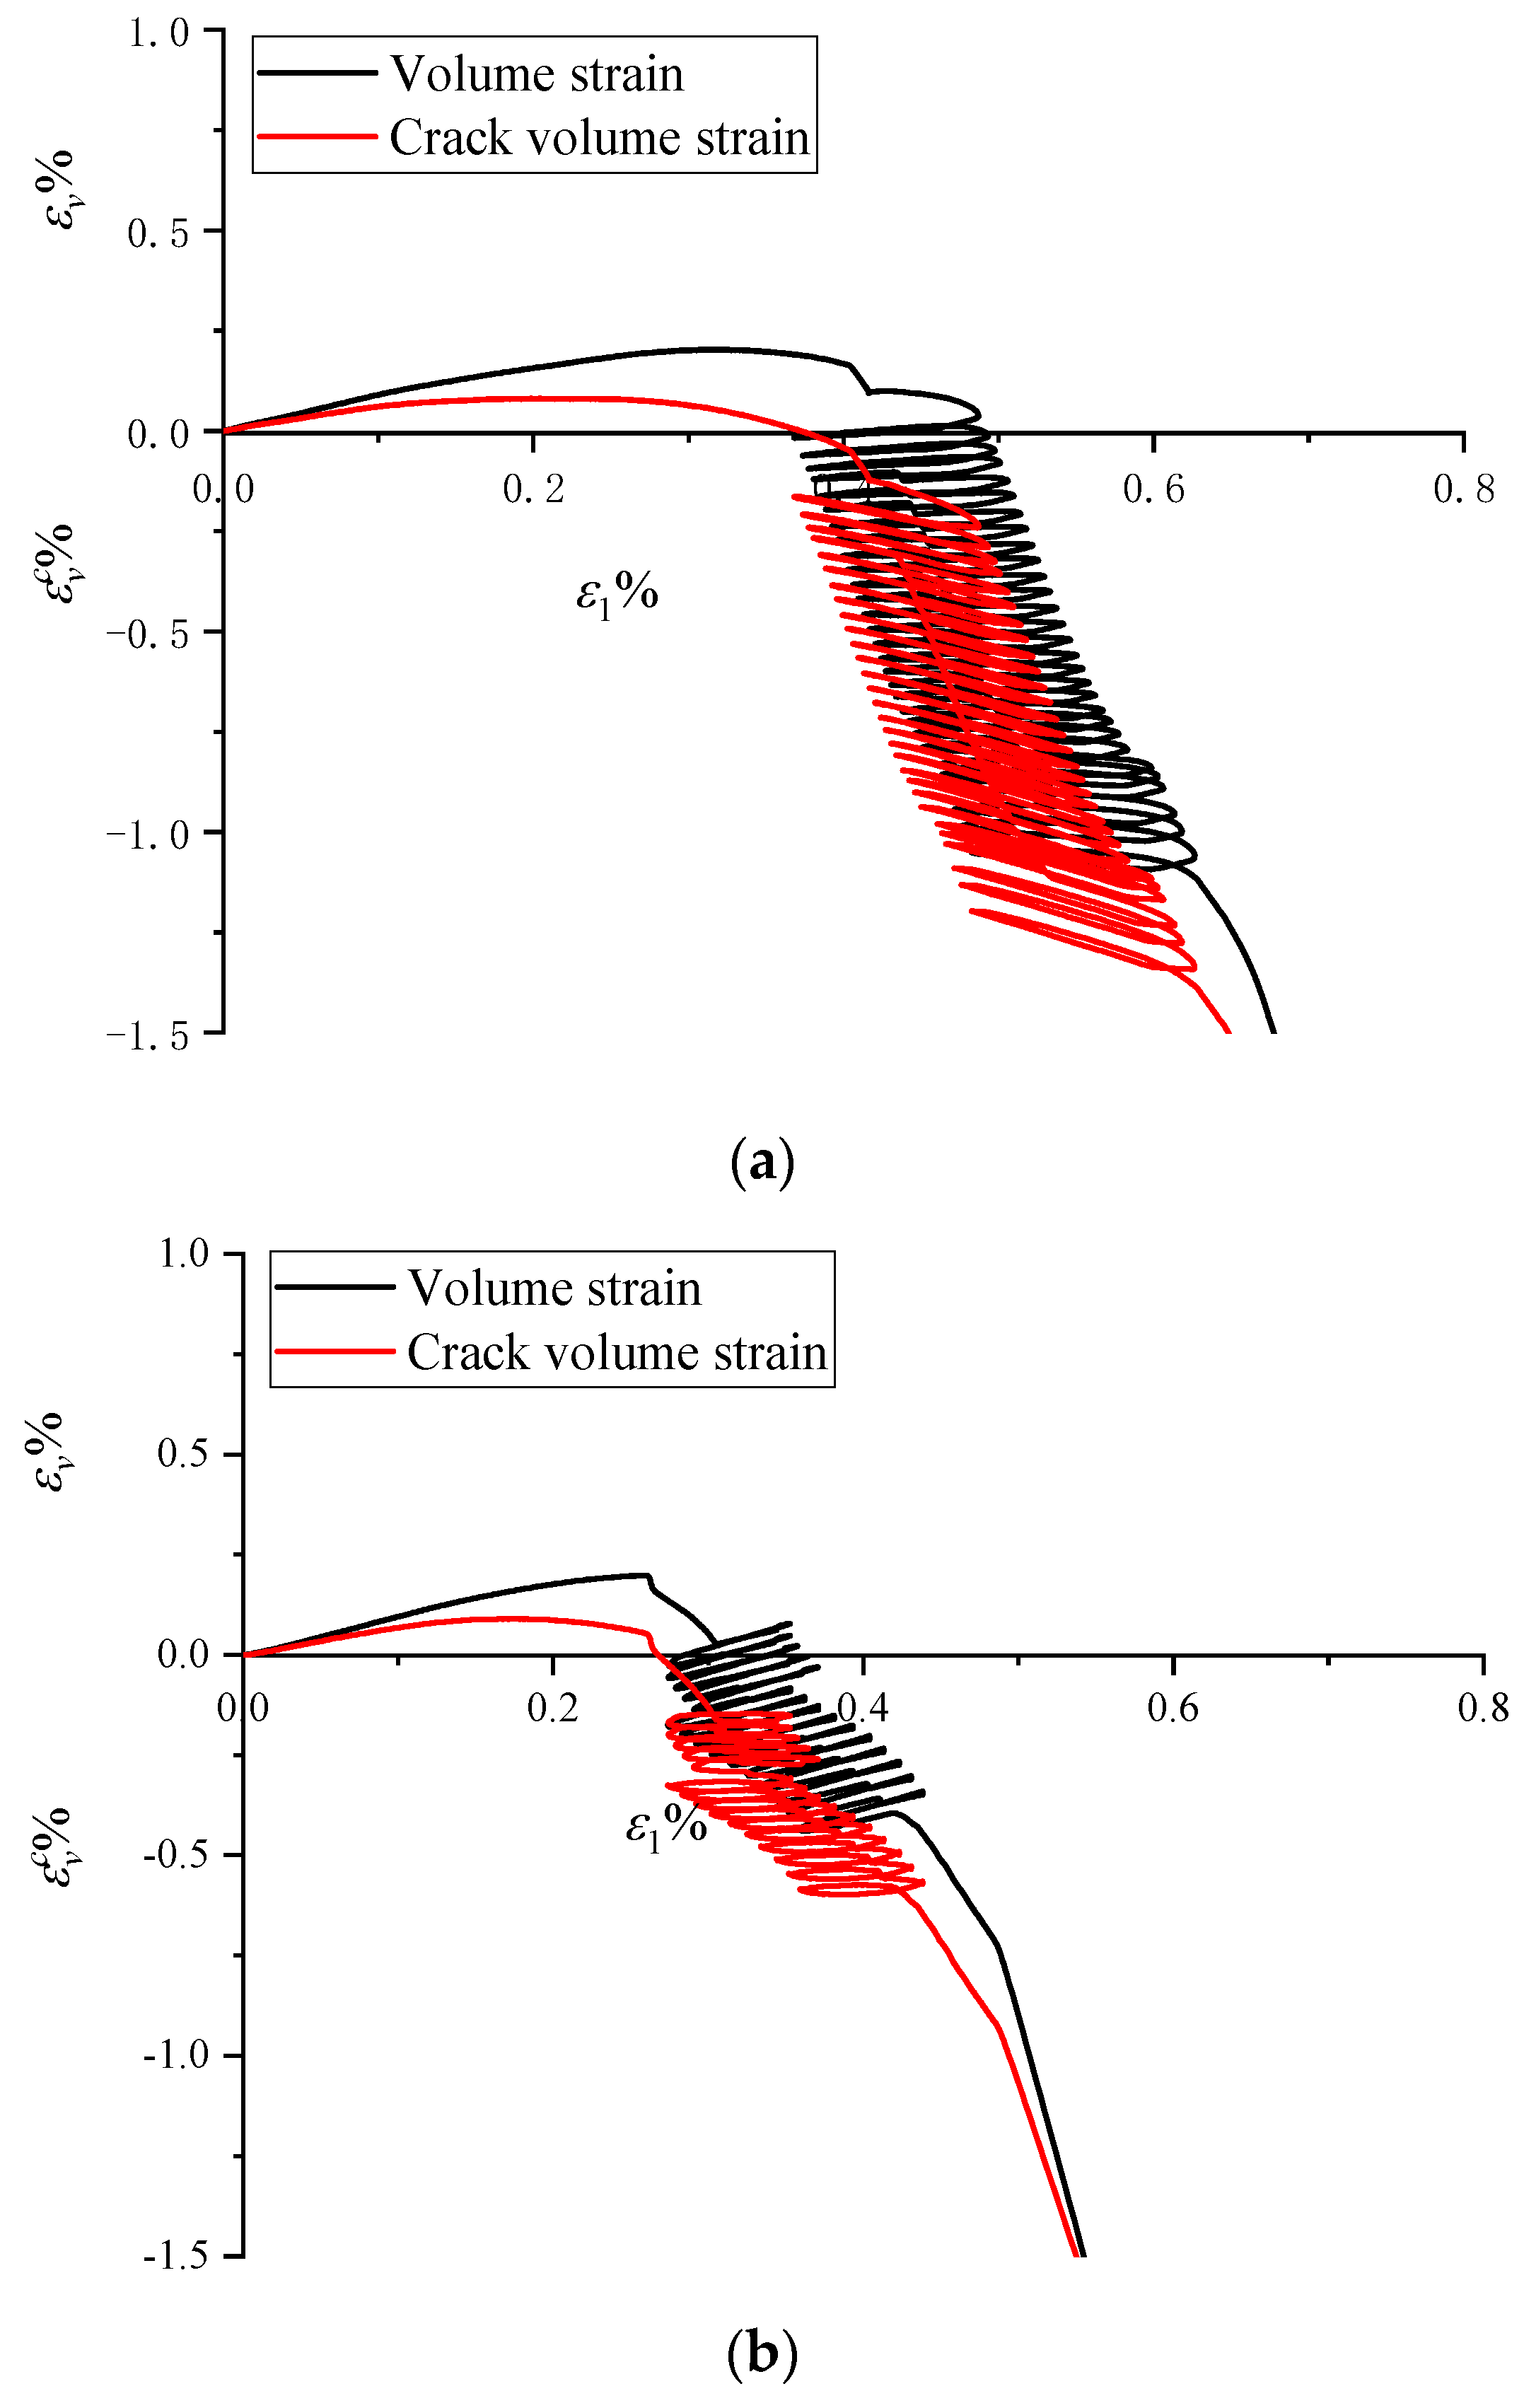
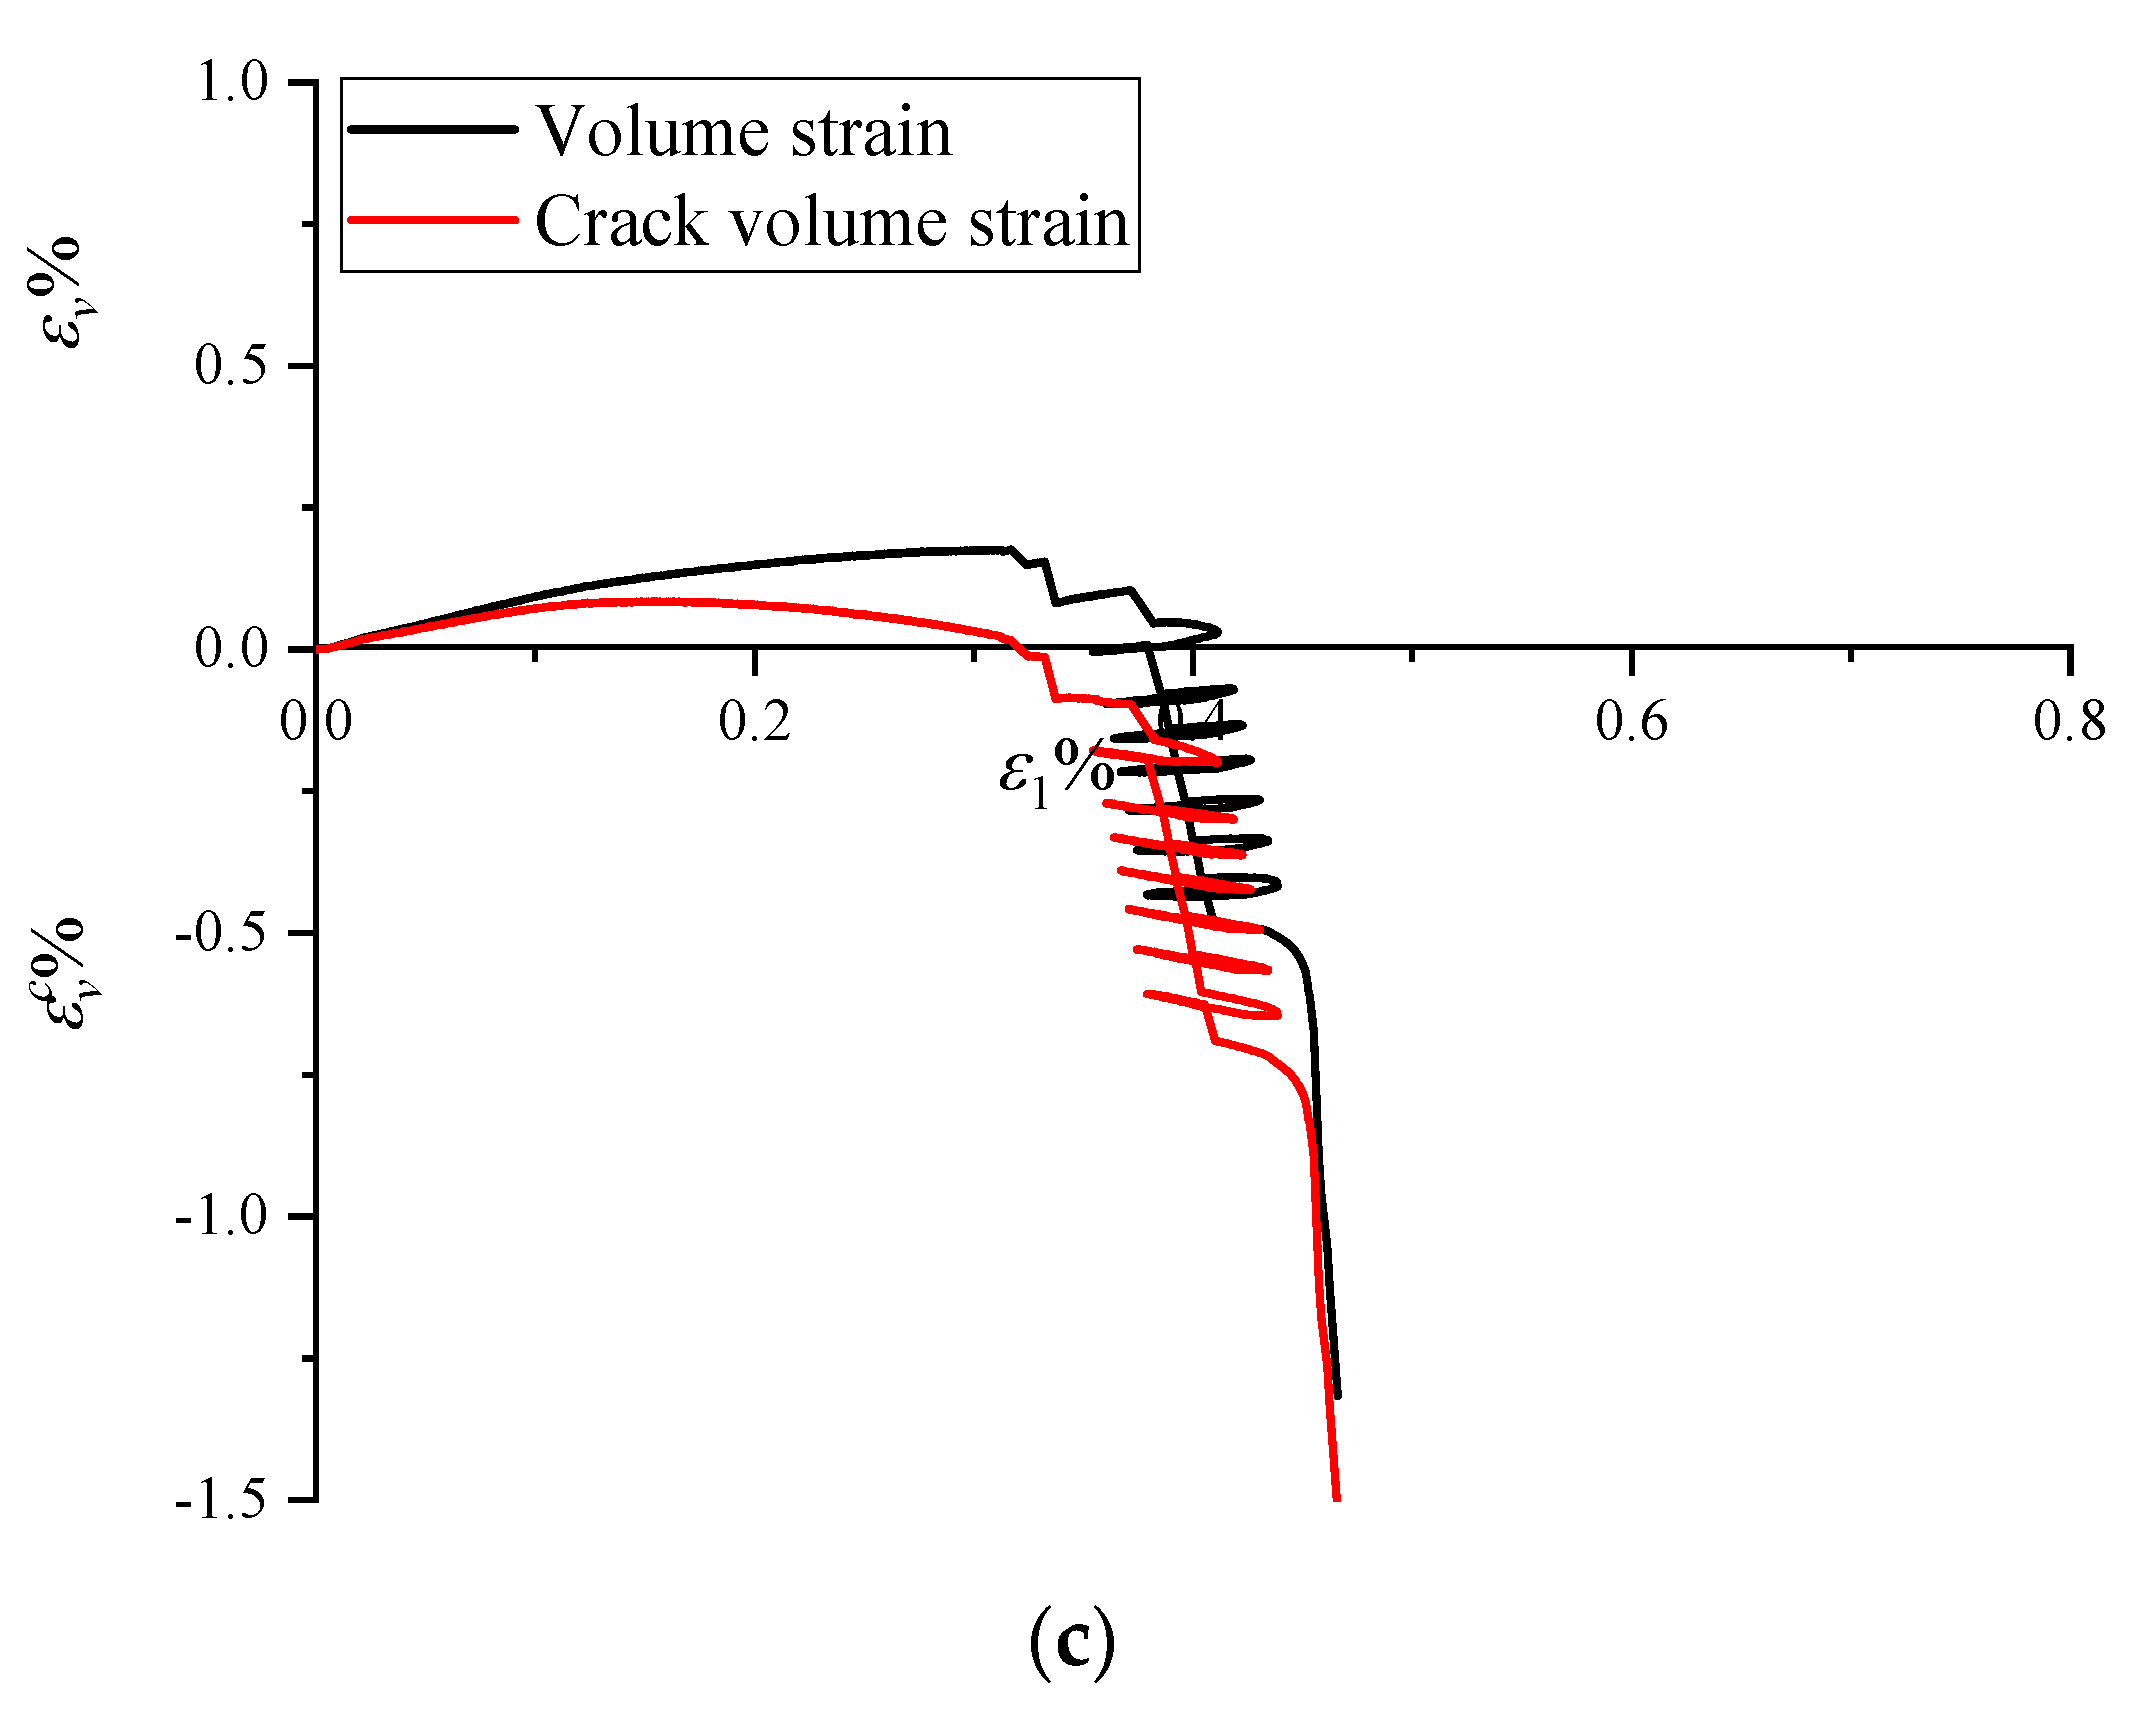
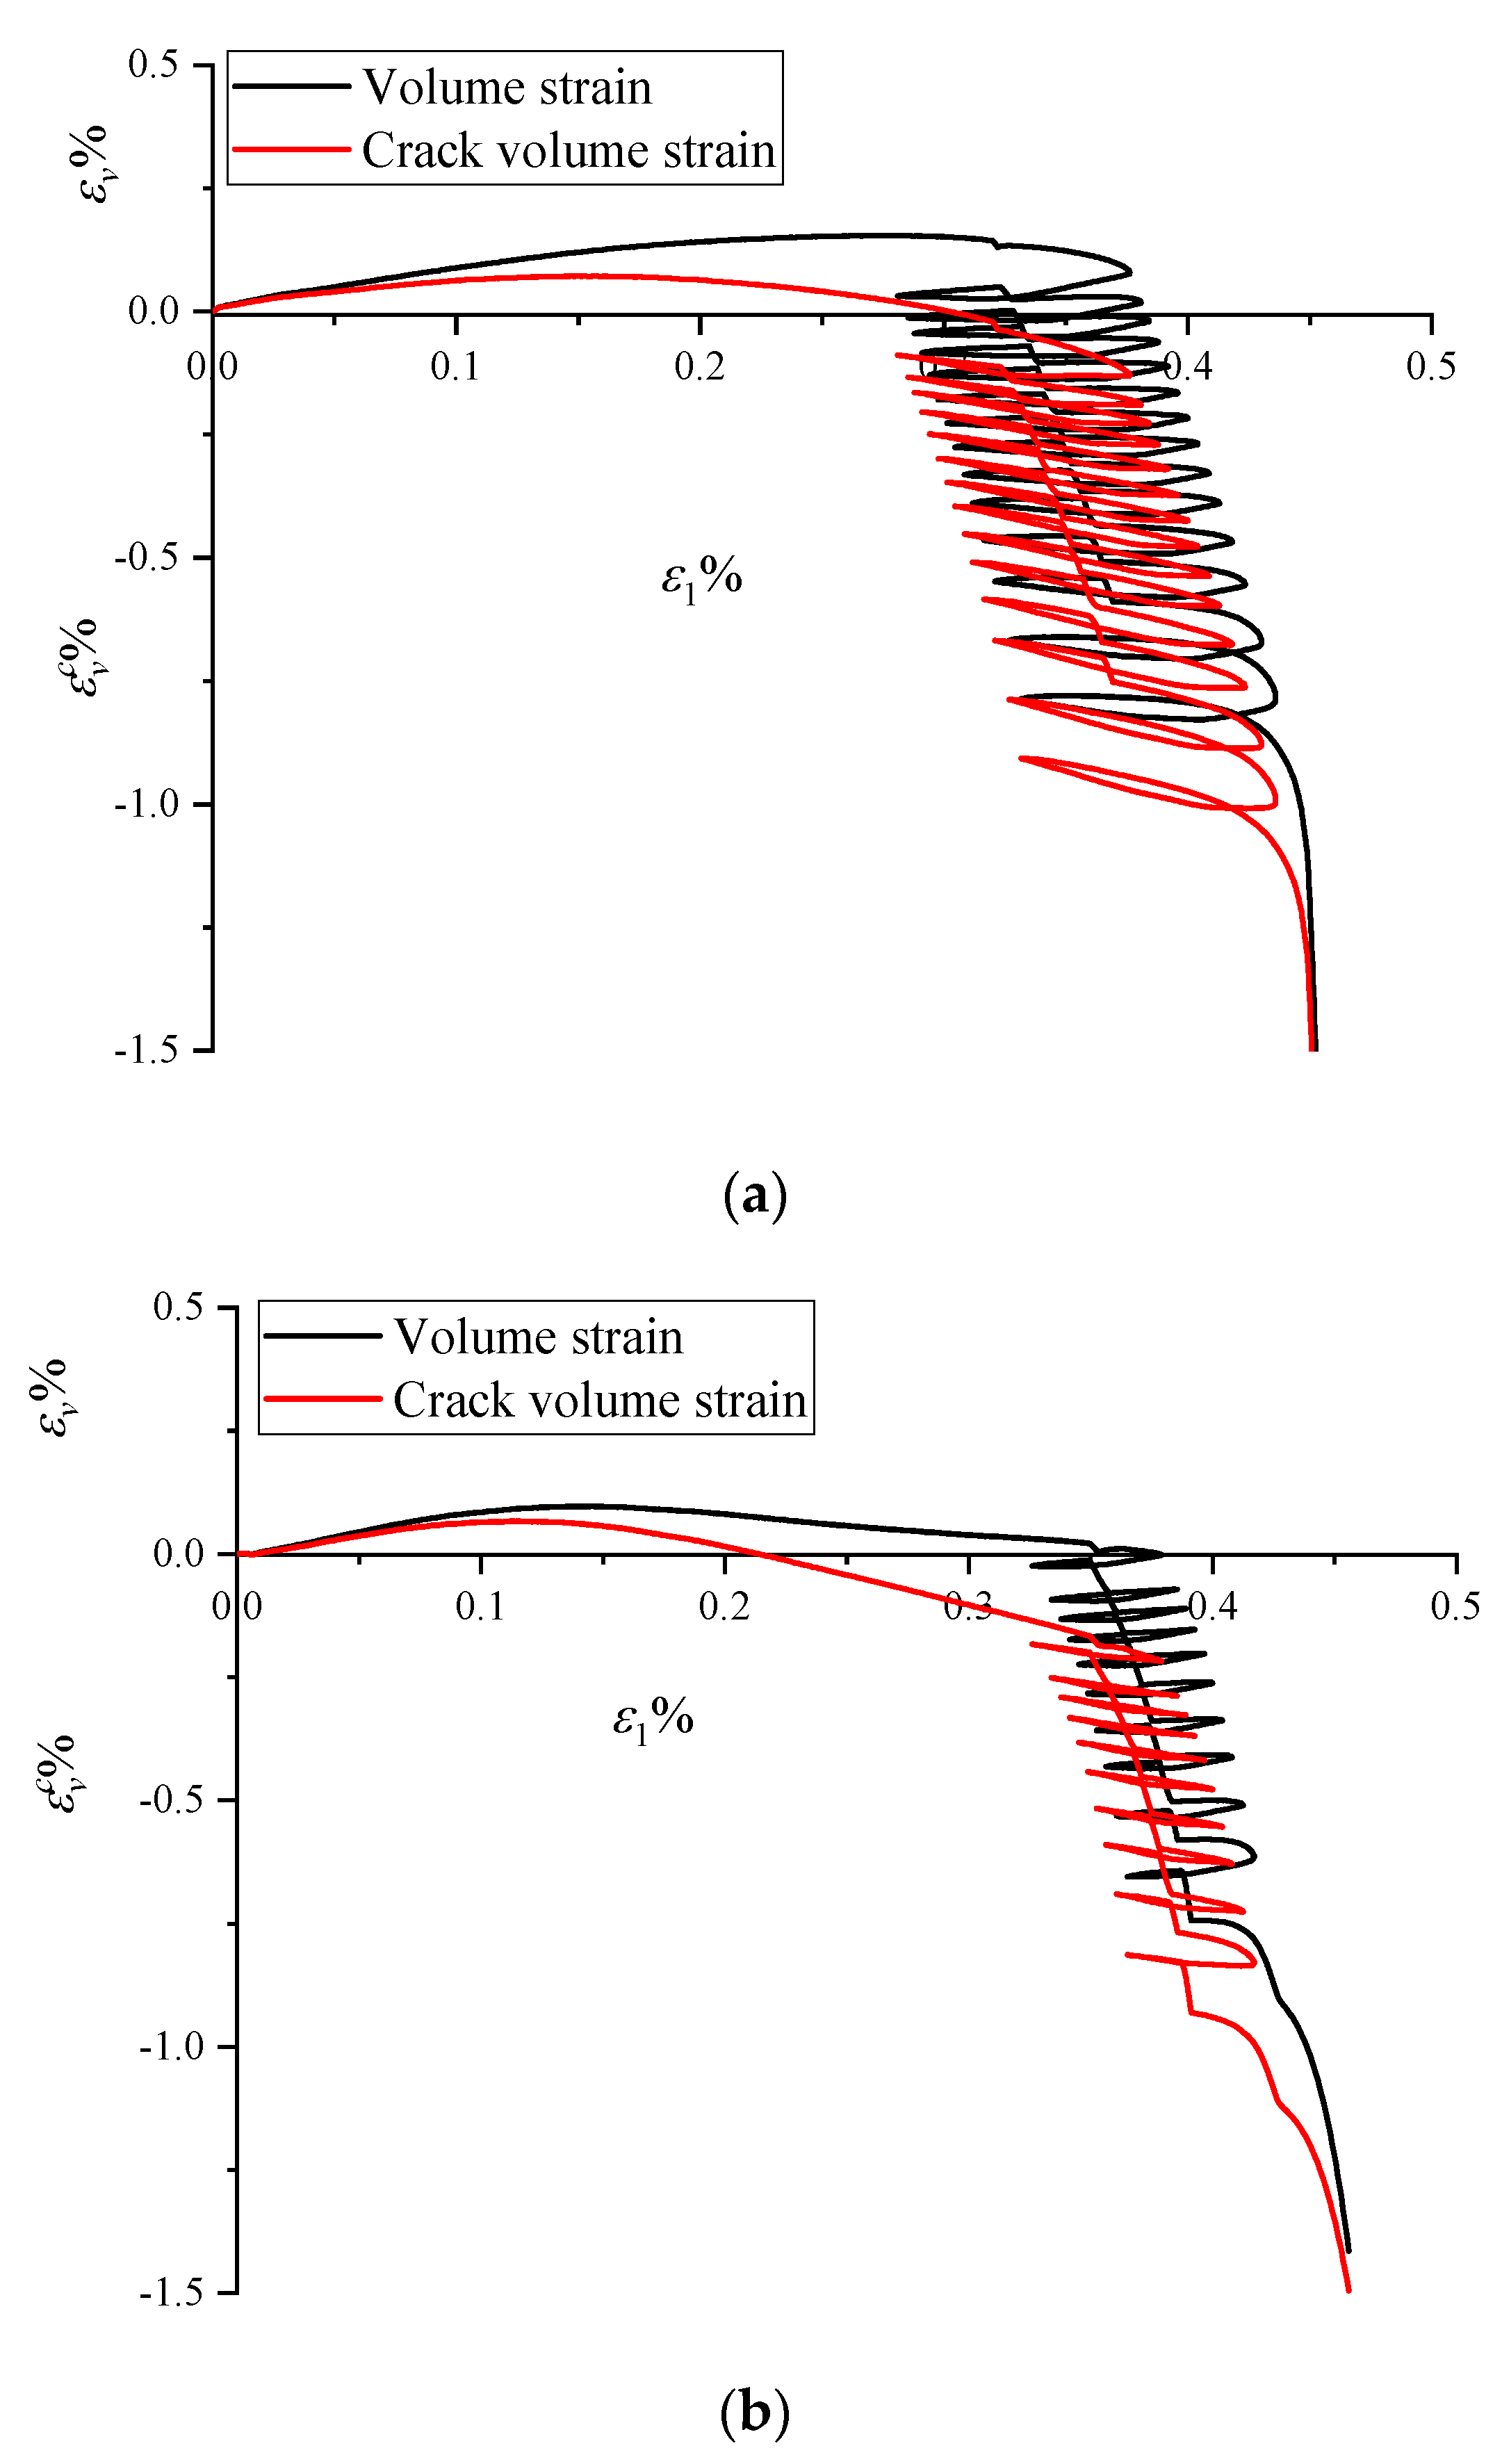
  • The pre-peak section of the stress–strain curves during loading can be divided into four stages: initial crack compaction, elastic deformation, tensile crack development, and macro-crack development. The crack-closure stress, crack-initiation stress, and crack-damage stress are about 0.2, 0.4, and 0.7 times the peak stress, respectively. Under the disturbance loads, the characteristic stresses of the granite specimens increase with the growth of the amplitude of disturbance Δσ. Under the same Δσ, the characteristic stresses show an increasing trend with the increasing initial stress σm.
  • The particle size distribution of rock fragments broken under the disturbance loads follows a fractal relationship. Moreover, as the initial axial static load σm and the amplitude of disturbance Δσ increase, the fractal dimension F rises, indicating a higher degree of fragmentation of the rock.
  • Damage to the rock specimens can be divided into rapid, steady, and rapid increase stages. As the amplitude of disturbance stress is increased, the number of cycles reduces remarkably in the steady increase stage, and the damage variable changes at a significantly increased rate. The rocks rapidly enter its final failure stage.

Author Contributions

B.F.: formal analysis, investigation, visualization; G.W.: conceptualization, methodology, writing—original draft, funding acquisition; X.L. (Xinping Li): writing—review and editing, supervision; X.L. (Xiqi Liu): writing—review and editing, funding acquisition; L.S.: writing—review and editing, funding acquisition. All authors have read and agreed to the published version of the manuscript.

Funding

The study was supported financially by the National Natural Science Foundation of China (No. 42002275), the National Natural Science Foundation of Zhejiang Province (No. LQ21D020001), the Collaborative Innovation Center for Prevention and Control of Mountain Geological Hazards of Zhejiang Province (No. PCMGH-2021-03), and the Hubei Key Laboratory of Roadway Bridge and Structure Engineering (Wuhan University of Technology) (No. DQJJ202104).

Institutional Review Board Statement

Not applicable.

Informed Consent Statement

Not applicable.

Data Availability Statement

Some or all data, models, or code that support the findings of this study are available from the corresponding author upon reasonable request.

Conflicts of Interest

The authors declare no conflict of interest.

References

  1. Sidorov, D.V.; Potapchuk, M.I.; Sidlyar, A.V. Forecasting rock burst hazard of tectonically disturbed ore massif at the deep horizons of nikolaevskoe polymetallic deposit. J. Min. Inst. 2018, 234, 604–611. [Google Scholar] [CrossRef]
  2. Khaledi, K.; Mahmoudi, E.; Datcheva, M.; Schanz, T. Stability and serviceability of underground energy storage caverns in rock salt subjected to mechanical cyclic loading. Int. J. Rock Mech. Min. 2016, 86, 115–131. [Google Scholar] [CrossRef]
  3. Siwek, S. Earth tides and seismic activity in deep coal mining. Int. J. Rock Mech. Min. 2021, 148, 104972. [Google Scholar] [CrossRef]
  4. Doğangün, A.; Ural, A.; Sezen, H.; Güney, Y.; Fırat, F.K. The 2011 earthquake in Simav, Turkey and seismic damage to reinforced concrete buildings. Buildings 2013, 3, 173–190. [Google Scholar] [CrossRef] [Green Version]
  5. Gómez, S.; Sanchidrián, J.A.; Segarra, P. Near-field vibration from blasting and rock damage prediction with a full-field solution. Int. J. Rock Mech. Min. 2020, 134, 104357. [Google Scholar] [CrossRef]
  6. Ma, C.S.; Chen, W.Z.; Tan, X.J.; Tian, H.M.; Yang, J.P.; Yu, J.X. Novel rockburst criterion based on the TBM tunnel construction of the Neelum–Jhelum (NJ) hydroelectric project in Pakistan. Tunn. Undergr. Space Technol. 2018, 81, 391–402. [Google Scholar] [CrossRef]
  7. Sainoki, A.; Mitri, H.S. Dynamic behaviour of mining-induced fault slip. Int. J. Rock Mech. Min. 2014, 66, 19–29. [Google Scholar] [CrossRef]
  8. Luo, Y.; Wang, G.; Li, X.; Liu, T.; Qu, D.; Huang, J. Research on triaxial compression failure characteristics and meso-simulation of brittle gypsum material. Eur. J. Environ. Civ. Eng. 2021, 5, 1–18. [Google Scholar] [CrossRef]
  9. Mishra, S.; Chakraborty, T. Determination of high-strain-rate stress–strain response of granite for blast analysis of tunnels. J. Eng. Mech. 2019, 145, 04019057. [Google Scholar] [CrossRef]
  10. Zhu, Y.; Yu, J.; Zhou, X.; Yang, Z.; Tang, X.; Liu, X. Uniaxial stress relaxation behavior of marble after cyclic disturbance loads. Mech. Time-Depend. Mater. 2021, 25, 513–537. [Google Scholar] [CrossRef]
  11. Ghasemi, S.; Khamehchiyan, M.; Taheri, A.; Nikudel, M.R.; Zalooli, A. Microcracking behavior of gabbro during monotonic and cyclic loading. Rock Mech. Rock Eng. 2021, 54, 2441–2463. [Google Scholar] [CrossRef]
  12. Cheng, Y.; Song, Z.; Song, W.; Li, S.; Yang, T.; Zhang, Z.; Wang, K. Strain performance and fracture response characteristics of hard rock under cyclic disturbance loading. Geomech. Eng. 2021, 26, 551–563. [Google Scholar] [CrossRef]
  13. Wang, Y.; Li, C.H.; Liu, H.; Han, J.Q. Fracture failure analysis of freeze–thawed granite containing natural fracture under uniaxial multi-level cyclic loads. Theor. Appl. Fract. Mech. 2020, 110, 102782. [Google Scholar] [CrossRef]
  14. Xu, T.; Fu, M.; Yang, S.Q.; Heap, M.J.; Zhou, G.L. A numerical meso-scale elasto-plastic damage model for modeling the deformation and fracturing of sandstone under cyclic loading. Rock Mech. Rock Eng. 2021, 54, 4569–4591. [Google Scholar] [CrossRef]
  15. Manouchehrian, A.; Cai, M. Analysis of rockburst in tunnels subjected to static and dynamic loads. J. Rock Mech. Geotech. 2017, 9, 1031–1040. [Google Scholar] [CrossRef]
  16. Yang, F.; Hu, D.; Zhou, H.; Lu, J. Physico-mechanical behaviors of granite under coupled static and dynamic cyclic loadings. Rock Mech. Rock Eng. 2020, 53, 2157–2173. [Google Scholar] [CrossRef]
  17. Chen, X.; Tang, C.; Kong, X. Study on progressive damage and failure of sandstone samples subjected to cyclic disturbance loads using a modified triaxial test system. KSCE J. Civ. Eng. 2019, 23, 2371–2383. [Google Scholar] [CrossRef]
  18. Su, G.; Hu, L.; Feng, X.; Wang, J.; Zhang, X. True triaxial experimental study of rockburst process under low frequency cyclic disturbance load combined with static load. Chin. J. Rock Mech. Eng. 2016, 35, 1309–1322. [Google Scholar] [CrossRef]
  19. Delpueyo, D.; Balandraud, X.; Grédiac, M. Applying infrared thermography to analyse martensitic microstructures in a cu–al–be shape-memory alloy subjected to a cyclic loading. Mater. Sci. Eng. 2011, 528, 8249–8258. [Google Scholar] [CrossRef]
  20. Kim, J.S.; Kim, G.Y.; Baik, M.H.; Finsterle, S.; Cho, G.C. A new approach for quantitative damage assessment of in situ rock mass by acoustic emission. Geomech. Eng. 2019, 18, 11–20. [Google Scholar] [CrossRef]
  21. Li, X.; Chen, J.; Ma, C.; Huang, L.; Li, C.; Zhang, J.; Zhao, Y. A novel in-situ stress measurement method incorporating non-oriented core ground re-orientation and acoustic emission: A case study of a deep borehole. Int. J. Rock Mech. Min. 2022, 152, 105079. [Google Scholar] [CrossRef]
  22. Shiotani, T.; Ohtsu, M.; Ikeda, K. Detection and evaluation of ae waves due to rock deformation. Constr. Build. Mater. 2001, 15, 235–246. [Google Scholar] [CrossRef]
  23. Diaz, M.B.; Kim, K.Y.; Jung, S.G. Effect of frequency during cyclic hydraulic fracturing and the process of fracture development in laboratory experiments. Int. J. Rock Mech. Min. 2020, 134, 104474. [Google Scholar] [CrossRef]
  24. Cai, M.; Morioka, H.; Kaiser, P.K.; Tasaka, Y.; Kurose, H.; Minami, M. Back-analysis of rock mass strength parameters using ae monitoring data. Int. J. Rock Mech. Min. 2007, 44, 538–549. [Google Scholar] [CrossRef]
  25. Maji, V.; Murton, J.B. Experimental Observations and Statistical Modeling of Crack Propagation Dynamics in Limestone by Acoustic Emission Analysis During Freezing and Thawing. J. Geophys. Res.-Earth. 2021, 126, e2021JF006127. [Google Scholar] [CrossRef]
  26. Young, R.P.; Nasseri, M.; Sehizadeh, M. Mechanical and seismic anisotropy of rocks from the onkalo underground rock characterization facility. Int. J. Rock Mech. Min. 2020, 126, 104190. [Google Scholar] [CrossRef]
  27. Mishra, S.; Khetwal, A.; Chakraborty, T. Dynamic characterisation of gneiss. Rock Mech. Rock Eng. 2019, 52, 61–81. [Google Scholar] [CrossRef]
  28. Schmidt, F.; Menendez, J.; Konietzky, H.; Pascual-Muoz, P.; AB Sánchez. Converting closed mines into giant batteries: Effects of cyclic loading on the geomechanical performance of underground compressed air energy storage systems. J. Energy Storage. 2020, 32, 101882. [Google Scholar] [CrossRef]
  29. Mansouri, H.; Ajalloeian, R. Mechanical behavior of salt rock under uniaxial compression and creep tests. Int. J. Rock Mech. Min. 2018, 110, 19–27. [Google Scholar] [CrossRef]
  30. Liu, E.L.; He, S.; Xue, X.; Xu, J. Dynamic properties of intact rock samples subjected to cyclic loading under confining pressure conditions. Rock Mech. Rock Eng. 2011, 44, 629–634. [Google Scholar] [CrossRef]
  31. Lu, G.M.; Zhou, J.; Zhang, B.; Pan, D.; Tong, T. Damage, deformation and energy characteristics of basalt after microwave irradiation subjected to cyclic loading. Tunn. Constr. 2020, 40, 1578–1585. [Google Scholar] [CrossRef]
  32. Shi, H.; Song, L.; Zhang, H.; Xue, K.; Yuan, G.; Wang, Z.; Wang, G. Numerical study on mechanical and failure properties of sandstone based on the power-law distribution of pre-crack length. Geomech. Eng. 2019, 19, 421–434. [Google Scholar] [CrossRef]
  33. Tho, V.D.; Korol, E.A.; Vatin, N.I.; Duc, H.M. The stress–strain state of three-layer precast elexural concrete enclosure structures with the contact interlayers. Buildings. 2021, 11, 88. [Google Scholar] [CrossRef]
  34. Aashranth, B.; Davinci, M.A.; Samantaray, D.; Borah, U.; Albert, S.K. A new critical point on the stress-strain curve: Delineation of dynamic recrystallization from grain growth. Mater. Des. 2016, 116, 495–503. [Google Scholar] [CrossRef]
  35. Cieślik, J. Onset of crack initiation in uniaxial and triaxial compression tests of dolomite samples. Stud. Geotech. Mech. 2014, 36, 23–27. [Google Scholar] [CrossRef] [Green Version]
  36. Cong, Y.; Cong, Y.; Zhang, L.; Jia, L.; Wang, Z. 3D particle flow simulation of loading-unloading failure process of marble. Rock Soil Mech. 2019, 40, 1179–1186. [Google Scholar] [CrossRef]
  37. Song, L.; Wang, G.; Wang, X.; Huang, M.; Xu, K.; Han, G.; Liu, G. The influence of joint inclination and opening width on fracture characteristics of granite under triaxial compression. Int. J. Geomech. 2022, 22, 04022031. [Google Scholar] [CrossRef]
  38. Baan, M.; Chorney, D. Insights from micromechanical modeling of intact rock failure: Event characteristics, stress drops, and force networks. J. Geophys. Re-Earth 2019, 124, 12955–12980. [Google Scholar] [CrossRef]
  39. Liu, L.; Li, H.; Li, X.; Wu, R. Full-field strain evolution and characteristic stress levels of rocks containing a single pre-existing flaw under uniaxial compression. B Eng. Geol. Environ. 2020, 79, 3145–3161. [Google Scholar] [CrossRef]
  40. Su, G.; Chen, Z.; Jiang, J.; Mo, J.; Shi, Y. Experimental study on energy dissipating characteristics of rockburst fragments under different loading rates. Chin. J. Geotech. Eng. 2016, 38, 1481–1489. [Google Scholar] [CrossRef]
  41. Odling, N.E. Natural fracture profiles, fractal dimension and joint roughness coefficients. Rock Mech. Rock Eng. 1994, 27, 135–153. [Google Scholar] [CrossRef]
  42. Sirdesai, N.N.; Singh, A.; Sharma, L.K.; Singh, R.; Singh, T.N. Determination of thermal damage in rock specimen using intelligent techniques. Eng. Geol. 2018, 239, 179–194. [Google Scholar] [CrossRef]
Figure 1. Test equipment.
Buildings 12 01008 g001
Figure 2. Mesoscopic characteristics of granite: (a) scanning electron microscopy micro-structures (×500); (b) polarized light microstructures.
Buildings 12 01008 g002
Figure 3. Stress−strain curves in the uniaxial compression test.
Buildings 12 01008 g003
Figure 4. Cyclic disturbance loading.
Buildings 12 01008 g004
Figure 5. Stress–strain curves under 60% of the UCS: (a) Gra60%-1; (b) Gra60%-2; (c) Gra60%-3.
Buildings 12 01008 g005aBuildings 12 01008 g005b
Figure 6. Stress–strain curves under 70% of the UCS: (a) Gra70%-1; (b) Gra70%-2; (c) Gra70%-3.
Buildings 12 01008 g006aBuildings 12 01008 g006b
Figure 7. Stress–strain curves under 80% of the UCS: (a) Gra80%-1; (b) Gra80%-2; (c) Gra80%-3.
Buildings 12 01008 g007aBuildings 12 01008 g007b
Figure 8. Division of damage evolution stages of the rock.
Buildings 12 01008 g008
Figure 9. Volumetric strain of cracks under 60% of the UCS: (a) Gra60%-1; (b) Gra60%-2; (c) Gra60%-3.
Buildings 12 01008 g009aBuildings 12 01008 g009b
Figure 10. Volumetric strain of cracks under 70% of the UCS: (a) Gra70%-1; (b) Gra70%-2; (c) Gra70%-3.
Buildings 12 01008 g010aBuildings 12 01008 g010b
Figure 11. Volumetric strain of cracks under 80% of the UCS: (a) Gra80%-1; (b) Gra80%-2; (c) Gra80%-3.
Buildings 12 01008 g011aBuildings 12 01008 g011b
Figure 12. Particle size distributions of fragments under different amplitudes of disturbance: (a) Gra60%; (b) Gra70%; (c) Gra80%.
Buildings 12 01008 g012
Figure 13. The log(M(x)/MT)–logx lines of rocks under 60% of the UCS: (a) 20 MPa; (b) 30 MPa; (c) 40 MPa.
Buildings 12 01008 g013
Figure 14. The log(M(x)/MT)–logx lines of rocks under 70% of the UCS: (a) 20 MPa; (b) 30 MPa; (c) 40 MPa.
Buildings 12 01008 g014
Figure 15. The log(M(x)/MT)–logx lines of rocks under 80% of the UCS: (a) 20 MPa; (b) 30 MPa; (c) 40 MPa.
Buildings 12 01008 g015
Figure 16. Evolution of the fractal dimension F.
Buildings 12 01008 g016
Figure 17. Relationship between the number of disturbance cycles and the damage variable: (a) 60%; (b) 70%; (c) 80%.
Buildings 12 01008 g017aBuildings 12 01008 g017b
Figure 18. Rates of change of the damage variable of the rock in the steady increase stage.
Buildings 12 01008 g018
Table 1. Basic parameters of granite.
Serial
Number
Uniaxial Compressive Strength/MPaElastic Modulus/GPaPoisson RatioDensity
/kg × m−3
Wave Velocity
/km × s−1
A1142.3232.150.2126673.33
A2144.8431.290.2126503.35
A3147.3630.430.2126333.37
Table 2. Mechanical test schemes under cyclic dynamic disturbances.
Serial Numberσmax
/MPa
Upper-Limit Stress
Ratio/%
σmin
/MPa
Lower-Limit Stress
Ratio/%
σm
/MPa
Average Stress
Ratio/%
Amplitude
/MPa
Gra60%-196.90466.9076.90453.1086.9046020
Gra60%-2101.90470.3671.90449.6486.9046030
Gra60%-3106.90473.8166.90446.1986.9046040
Gra70%-1111.38876.9091.38863.10101.3887020
Gra70%-2116.38880.3686.38859.64101.3887030
Gra70%-3121.38883.8181.38856.19101.3887040
Gra80%-1125.87286.90105.87273.10115.8728020
Gra80%-2130.87290.36100.87269.64115.8728030
Gra80%-3135.87293.8195.87266.19115.8728040
Table 3. Strengths of granite specimens under different conditions.
σm
Amplitude
/MPa
60%70%80%
203040203040203040
Strength
/MPa
90.4298.98105.25109.23111.00118.19115.19127.19134.99
Table 4. Values of characteristic stresses of rock specimens.
Serial Numberσcc/MPaσci/MPaσcd/MPaσc/MPa
Gra60%-10.0650.1480.2790.409
Gra60%-20.0690.1720.2920.450
Gra60%-30.0710.1790.3010.470
Gra70%-10.0660.1680.2810.414
Gra70%-20.0720.1760.3000.458
Gra70%-30.0840.1860.3020.471
Gra80%-10.0670.1730.2960.438
Gra80%-20.0800.1880.3030.465
Gra80%-30.0950.2020.3380.477
Table 5. Uniformity coefficients and curvature coefficients.
CategoryGra60%Gra70%Gra80%
123123123
Cu22.5718.8917.1723.1418.5723.1218.8029.3823.36
Cc3.451.424.420.741.942.691.531.921.84
Table 6. Statistical results: parameters of fragments of the granite.
Serial NumberFR2
Gra60%-11.52540.8746
Gra60%-21.70180.9043
Gra60%-32.02630.9459
Gra70%-11.94310.9401
Gra70%-22.16590.8549
Gra70%-32.24480.9045
Gra80%-12.20770.9682
Gra80%-22.38250.9615
Gra80%-32.46150.9099
Table 7. Rates of change of the damage variable.
Serial NumberGra60%Gra70%Gra80%
123123123
V × 10−3/Cycle0.280.560.760.460.620.810.891.345.5
Publisher’s Note: MDPI stays neutral with regard to jurisdictional claims in published maps and institutional affiliations.

