Article

Predicting Construction Workers’ Intentions to Engage in Unsafe Behaviours Using Machine Learning Algorithms and Taxonomy of Personality

1
College of Civil Engineering and Architecture, Zhejiang University, Hangzhou 310058, China
2
Civil and Environmental Engineering Department, Faculty of Engineering, University of Alberta, Edmonton, AB T6G 2R3, Canada
3
School of Built Environment, Massey University, Auckland 4472, New Zealand
4
Escuela de Ingeniería Informática, Pontificia Universidad Católica de Valparaíso, Valparaíso 2950, Chile
5
Department of Educational Technology, Jing Hengyi School of Education, Hangzhou Normal University, Hangzhou 311121, China
*
Author to whom correspondence should be addressed.
Buildings 2022, 12(6), 841; https://doi.org/10.3390/buildings12060841
Submission received: 4 June 2022 / Revised: 14 June 2022 / Accepted: 14 June 2022 / Published: 16 June 2022
(This article belongs to the Section Construction Management, and Computers & Digitization)

Abstract

:
Dynamic environmental circumstances can sometimes be incompatible with proactive human intentions of being safe, leading individuals to take unintended risks. Behaviour predictions, as performed in previous studies, are found to involve environmental circumstances as predictors, which might thereby result in biased safety conclusions about individuals’ inner intentions to engage in unsafe behaviours. This research calls attention to relatively less-understood worker intentions and provides a machine learning (ML) approach to help understand workers’ intentions to engage in unsafe behaviours based on the workers’ inner drives, i.e., personality. Personality is consistent across circumstances and allows insight into one’s intentions. To mathematically develop the approach, data on personality and behavioural intentions was collected from 268 workers. Five ML architectures—backpropagation neural network (BP-NN), decision tree, support vector machine, k-nearest neighbours, and multivariate linear regression—were used to capture the predictive relationship. The results showed that BP-NN outperformed other algorithms, yielding minimal prediction loss, and was determined to be the best approach. The approach can generate quantifiable predictions to understand the extent of workers’ inner intentions to engage in unsafe behaviours. Such knowledge is useful for understanding undesirable aspects in different workers in order to recommend suitable preventive strategies for workers with different needs.

1. Introduction

The construction sector plays a significant role in the economy, contributing 13% to the growth in global GDP in 2018 [1]. However, safety issues follow upon such achievements. In recent years, the construction sector has reached record-high accident rates. In the United States, the construction sector caused 1171 non-fatal and fatal injury claims in 2018, which accounted for 18% of all industrial accidents [2]. In the UK, construction was responsible for the largest portion of all occupational injuries in 2018, with an incidence rate of 21% [3]. Although the application of safety management practices seems to have made an impact on the reduction of injury and fatality rates, occupational accidents remain a pervasive issue [4].
Research has found that many occupational accidents are foreseeable, being the result of people’s unsafe behaviour from a retrospective point of view [5]. It has been suggested that behaviour prediction could be useful in the identification of vulnerable workers who are risk-takers and in the design of preventive strategies prior to the occurrence of accidents to contribute to the reduction of injury rates [6]. Behaviour predictions, as performed in previous studies, have been found to involve environmental circumstances as predictors [7,8,9,10,11,12]. However, environmental circumstances have dynamic changes which can sometimes be incompatible with proactive human intentions of being safe and lead individuals to take unintended risks [13]. For example, an individual intends, but fails, to use protective equipment such as a dust mask due to temporary unavailability in the workplace. Thus, existing literature suggests that behaviour predictions involving environmental circumstances might result in biased safety conclusions about individuals’ inner intentions to engage in safe or unsafe actions [5], which is known as the intention–behaviour gap [1].
While decreased accuracy in predicting behaviour is expected in a dynamic construction environment [13], prediction based on individuals’ intentions may be a more suitable approach to carrying out safety-related assessments in order to reveal people’s inner susceptibility to unsafe behaviours [14]. Intention refers to an individual’s cognitive stance of exerting physical effort to perform a specific behaviour [15]. Referring to the prevailing behaviour theories, such as the Theory of Planned Behaviour (TPB) [16] and Self-determination Theory (SDT) [17], an individual’s intention to engage in a safe or unsafe behaviour is indicative of the individual’s “favourable/unfavourable” or “should/should not” evaluation for that behaviour, which reflects an individual’s inner susceptibility to engaging in unsafe behaviours and allows more accurate predictions. As stated [18], “in literature related to understanding human behaviour, the concept of intention holds a central place” (p. 153). Since the beginning of the 21st century, researchers have increasingly focused on applying approaches from behavioural ecology in studying intentions [14]. Existing studies, e.g., [14,19,20,21] have accumulated substantial evidence from humans and other diverse animal species and found that “across a variety of animal taxa (including human race), individuals within populations often display remarkable differences in behavioural intentions that are consistent across time and contexts” [21] (p. 339).
Although the advantages of conducting safety assessments on individuals’ inner intentions to engage in unsafe behaviours can be identified, there have been only a few empirical tests in this field, i.e., [1,22]. In addition, the studies [1,22] have been descriptive in nature and provided insufficient insights into the constitution of predictors for workers’ behavioural intentions, which prevents these studies from reaching an operative prediction framework. To contribute to the growing research literature in this field, this research aims to:
  • Conduct literature review to investigate the predictors for workers’ unsafe behavioural intentions at the individual level;
  • Develop a predictive model of construction workers’ intentions to engage in unsafe behaviours based on the predictors identified using machine learning (ML) methods, and test its prediction performance;
  • Gain an enhanced understanding of the weights of each predictor in the prediction practice, as the weights constitute the predictive basis for workers’ safety behavioural intentions; and
  • Discuss the predictive model’s theoretical and practical implications.
This paper is organised as follows. A review of relevant academic literature to identify the predictors is presented first. The conceptual model section theoretically formulates the modelling framework of workers’ intentions to engage in safety-related behaviours and the predictors. The research method specifies the stages involved to mathematically develop the predictive model. Then the data collection is presented. The results involve the training and evaluation of the predictive model, and the insights into the weight of each predictor for predicting workers’ intentions. The discussion section interprets the model’s theoretical and practical implications. Finally, the conclusions summarise the results, discuss the limitations of this study, and recommend future research directions.

2. Literature Review

Research has found that many occupational accidents are foreseeable, being the result of people’s unsafe behaviour from a retrospective point of view [4,23,24]. It is suggested that behaviour prediction can be useful in the identification of vulnerable workers who are risk-takers and in the design of preventive strategies prior to the occurrence of accidents to contribute to the reduction of injury rates [8,9,10,11]. A review of the existing literature reveals that current studies have developed forecasting models as a function of environmental circumstances to predict construction workers’ potential future behaviours [7,8,9,10,11,12]. However, researchers have suggested that these predictions might not forecast behaviours well in a practical setting [23,24,25]. According to the prevailing behaviour theories such as the TPB [16] and SDT [17], a behaviour prediction approach is regarded useful only if individuals’ subsequent behaviour is performed as predicted. As meta-analyses have shown [26,27], human safety behaviour is not only driven by individuals’ own decision-making processes but is also determined by environmental circumstances. The construction environment has dynamic changes, sometimes unforeseeable, where task- and context-related dynamics exist and can sometimes cause individuals to subsequently fail to act on the behavioural consequences as predicted [7,25].
In particular, task-related dynamics refer to the dynamic changes of environmental circumstances that are immediately related to the accomplishment of work tasks such as workplace real-time supply of safety equipment and personal protective equipment (PPE) (e.g., availability of dust masks and sunscreen) [23]. Context-related dynamics refer to the dynamic changes of environmental circumstances that surround the accomplishment of work tasks such as workplace real-time housekeeping (e.g., tidy housekeeping or electrical power cords laying across walkways) and real-time supervision for safety commitment (e.g., the work shifts of site managers could result in different styles of supervision) [23]. For example, the lack of health and safety management efforts could result in PPE supply–demand imbalances and thereby the emergence of PPE availability–unavailability dynamics [28,29]. Prediction based on PPE availability–unavailability dynamics could be irrelevant to future occurrences (e.g., an individual fails to act as predicted to wear PPE due to workplace unavailability). Thus, these circumstances can be incompatible with proactive human intentions of being safe, leading individuals to take risks that are not factually intended [30,31]. In this regard, research shows that site management practices tend to follow a linear process to investigate why unsafe behaviours happen, lacking a holistic understanding of behavioural causation with workers at the “sharp end” of the system (usually) being incorrectly blamed [32,33]. On this account, research has suggested that the unforeseeable nature of environment circumstances could diminish the accuracy in predicting human behaviour and sometimes result in incorrect safety conclusions about an individual’s unsafe-behaviour intentions [13].
The above discussion draws on the relevant academic literature to interpret why previous researchers have suggested that existing behaviour prediction tools might not forecast behaviours well in a practical setting. Behavioural prediction based on individuals’ intentions, which is consistent across time and contexts and independent of environment dynamics, seems to be a more suitable approach to carry out safety-related assessments in order to reveal actual unsafe-behaviour potentials.
Investigating the mechanism responsible for consistent individual differences in intentions has been of long-standing interest to the scientific community [34]. Over the past few years, the understanding of human intentions has progressed significantly, and a considerable body of evidence has accumulated documenting that the formation of human intentions has personality origins, e.g., [27,35]. Decades of research involving hundreds of thousands of individuals have revealed two meta dimensions of personality traits—stability (including sub-traits neuroticism, agreeableness, and conscientiousness) and plasticity (including sub-trait extraversion)—which provide a basic model for portraying human personality [35]. Genetic polymorphisms in dopamine and serotonin transmembrane proteins determine individual differences in the density and responsive efficiency of dopamine and serotonin [36]. Dopamine and serotonin levels and signalling efficiencies are found to exert regulatory effects on the magnitude of physiological processes in the brain system such as cognition and pleasure seeking, which set individuals out on different personality trajectories for stability and plasticity and are expressed in behavioural intentions [34,35,37,38,39,40,41]. In previous studies [26,42,43,44,45,46], it has also been documented that subjects with less-efficient dopamine and serotonin systems were observed to consistently be more agreeable and conscientious but less extraverted and neurotic, and exhibited stronger intentions to undertake solicitous behaviours (e.g., caring for colleagues’ safety at work) but diminished intentions to take risks (e.g., sensation seeking); conversely, the opposite.
Research corroborates that it is not a single trait but a configuration of traits that constitutes the individually expressed intentions to engage in unsafe behaviours [47]. Each dimension of the meta-traits stability and plasticity is one component of the configuration, and an individual’s trait levels in the configuration (i.e., how high or low the individual scores on each trait compared to others) drive quantitatively the scale of the individual’s inner desire to take risks and help colleagues [47,48]. For example, extensive empirical evidence has shown that individual variation in trait scores is reflected upon different scales measuring individuals’ intentions about behaving safely (e.g., “strongly proactive”, “proactive”, “neither proactive nor negative”, “reactive”, or “strongly reactive”) [25,49,50,51,52]. These studies further pointed out that extraversion and neuroticism are positive regulators, and agreeableness and conscientiousness are negative regulators, in the configuration of individuals’ unsafe-behaviour intentions, and that the opposite is true for solicitous behaviours (e.g., caring for colleagues’ safety at work). Based on these findings, it has been suggested that the intention to engage in safety-related behaviours at the individual level can be predicted on the basis of quantifying such individual variations in personality configurations [47].
Thus, in this research, the authors develop an approach to predict construction workers’ intentions to engage in unsafe behaviours by quantifying workers’ individual variations in personality.

3. Research Method

As researchers have pointed out [51], in order to mathematically build a predictive function (to address the research objectives of this study), a conceptual model should be firstly proposed to reflect explicitly its operational architecture to allow numerical simulations of the model to be built (i.e., the input and output matrices). In this research, the conceptual model shapes the modelling framework of construction workers’ personality configurations and safety behavioural intentions. The personality configurations and dimensions of safety behavioural intentions of construction workers as the input and output matrices are thereby interpreted. As shown in the literature review, human personality is multidimensional, which can be represented by extraversion, neuroticism, agreeableness, and conscientiousness. Behavioural intentions are found to be involved in the decision-making processes for safety compliance and safety participation, which represent the basic dimensions that constitute people’s safety performance in the workplace [53]. Safety compliance refers to compliance-related behaviour that individuals carry out to keep themselves safe, such as not taking shortcuts, using safety equipment, and following safety procedures and rules. Safety participation refers to solicitous safety activities such as reporting co-workers’ safety problems, keeping the workplace clean, and caring for colleagues’ safety, which may not directly contribute to one’s own safety but helps to develop an environment that supports safety.
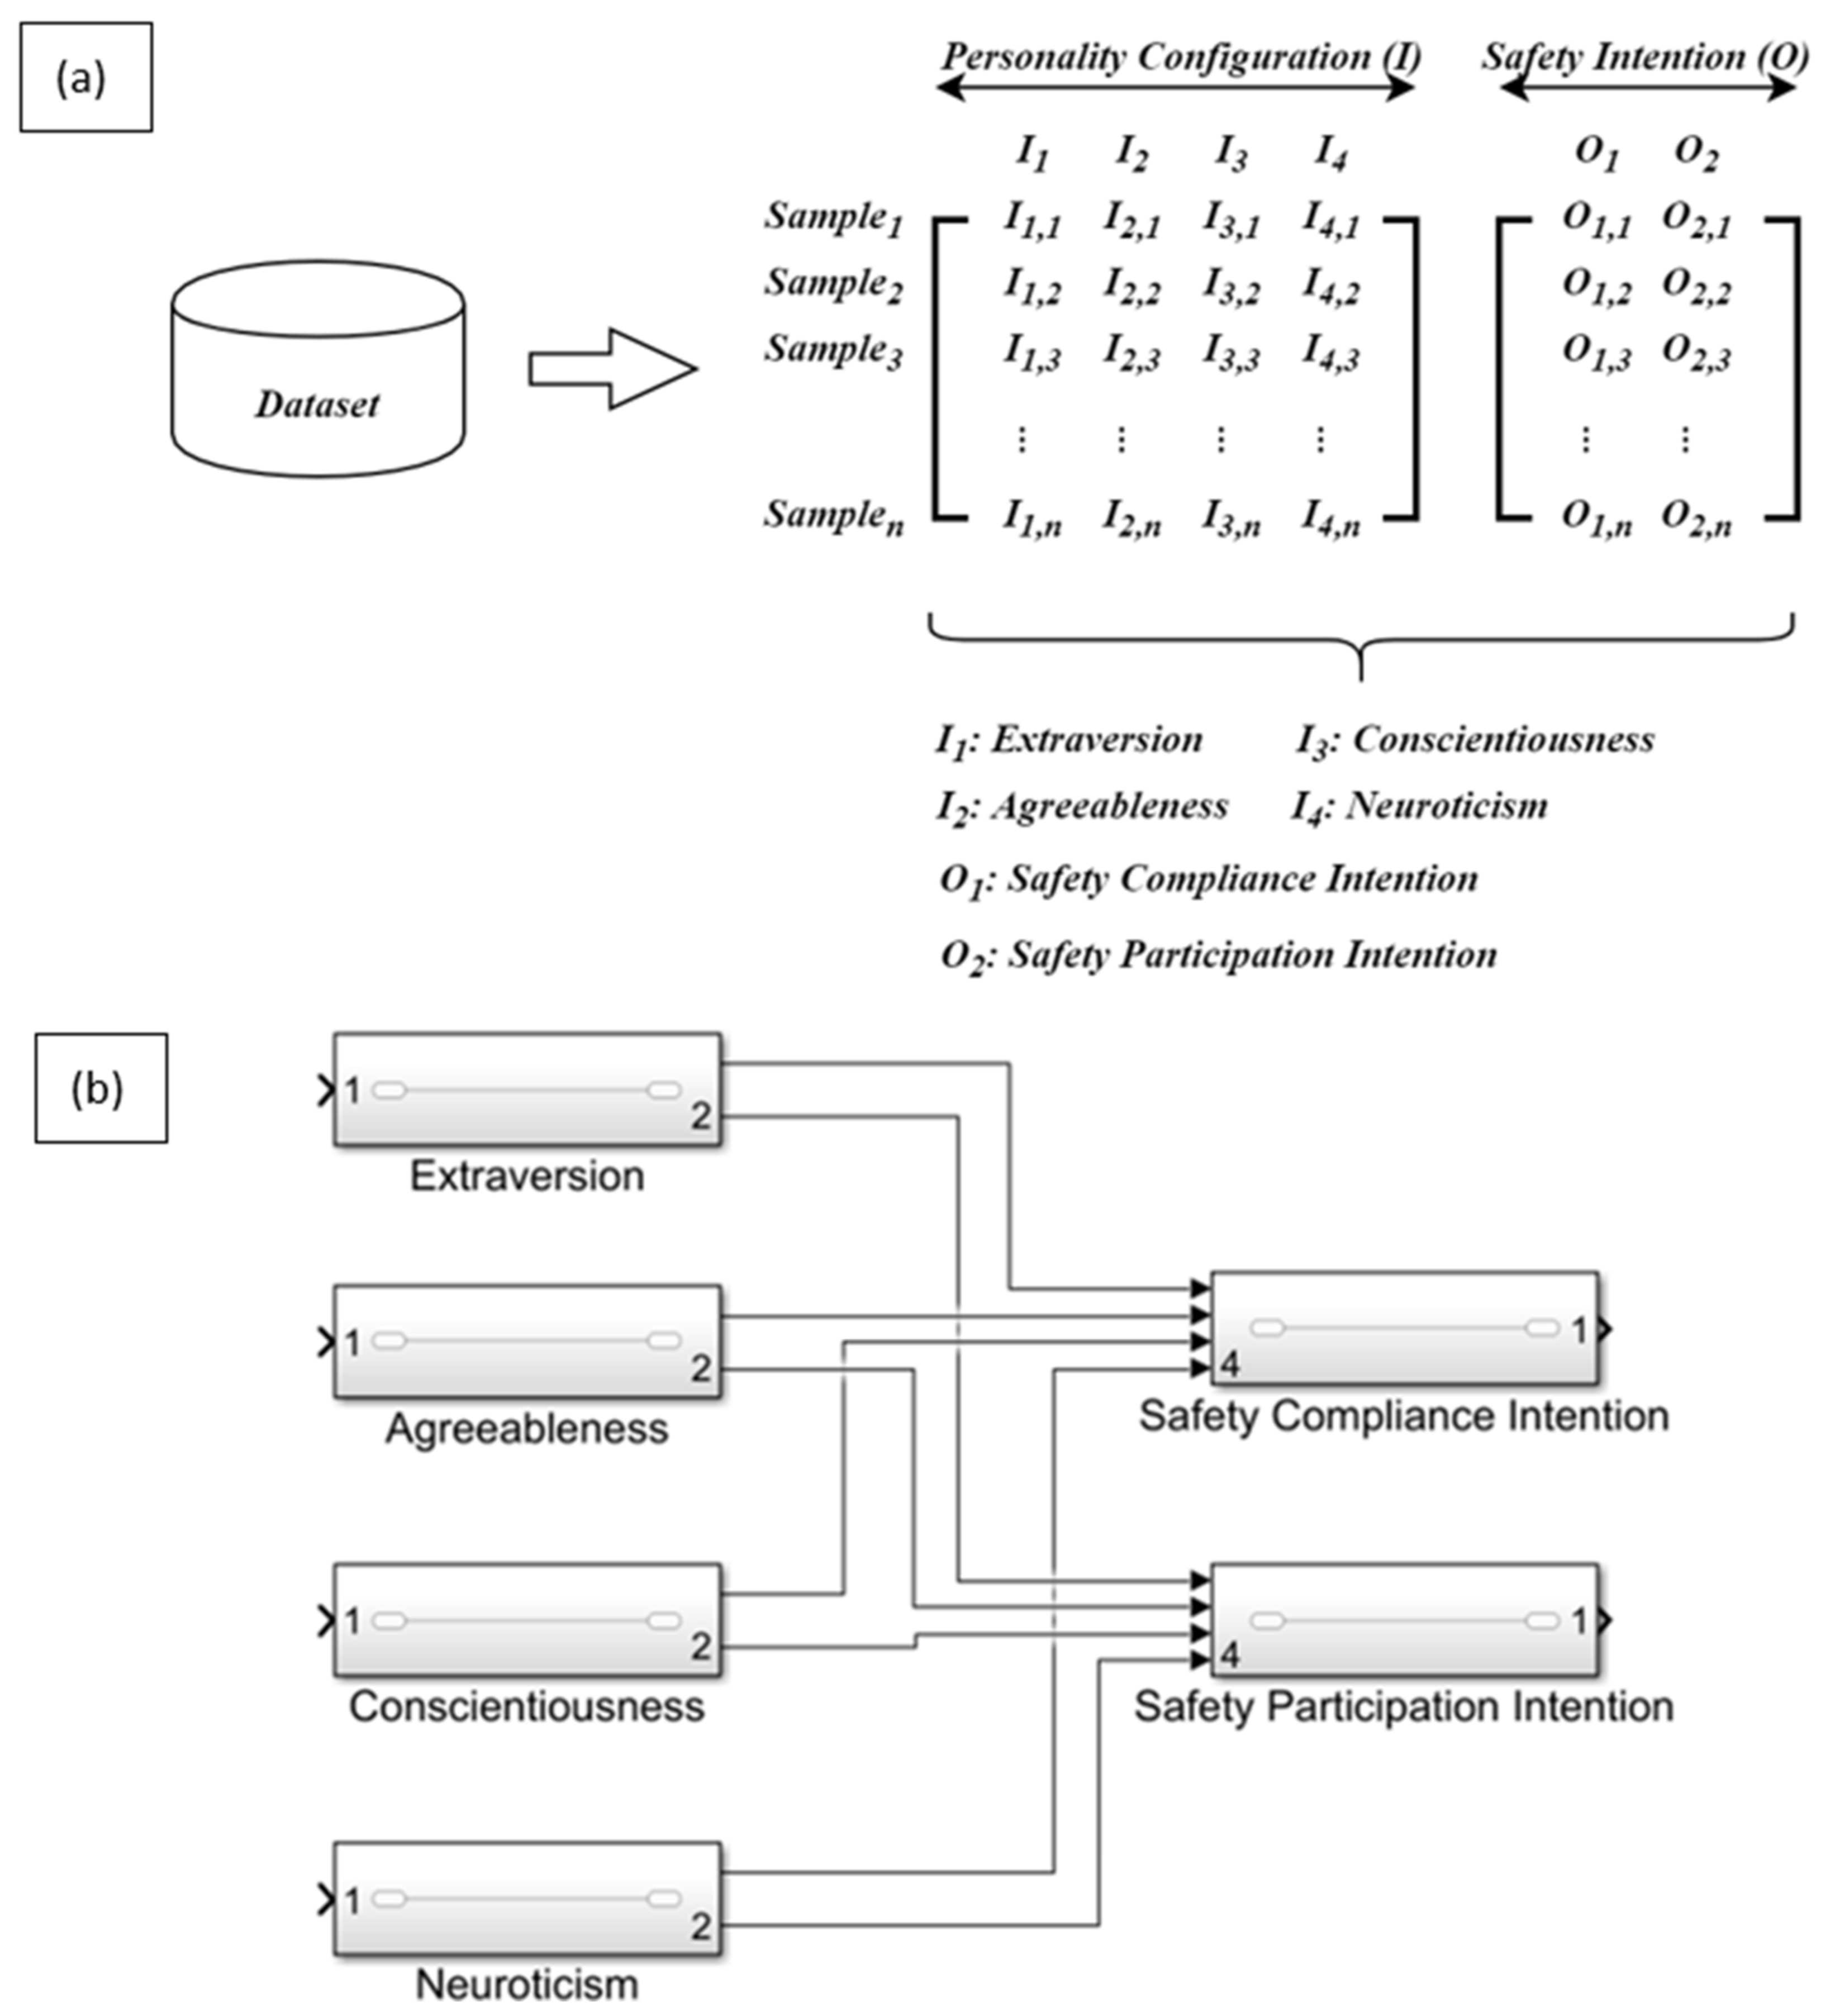
A conceptual model is proposed to represent the modelling framework of the personality configuration and behavioural intention dimensions, as ascertained. As shown in Figure 1a, the conceptual model holds a multiple-input-multiple-output architecture. The input consists of an nx4 matrix, which represents n samples of four personality traits (i.e., extraversion, agreeableness, conscientiousness, and neuroticism). The output is a nx2 matrix, which characterises n samples of two behavioural intention dimensions, namely, safety compliance and participation intentions. The conceptual model was then sketched in MATLAB using the Simulink Model function (see Figure 1b), which provides an abstract description of the mathematical simulation to be performed. After gathering the digital data on construction workers’ personality and safety behavioural intentions, the abstract description in the Simulink Model function will be able to absorb digital data as its input and output signals to mathematically build the predictive framework.
To achieve the objectives of this research, numerical simulations of the modelling framework were firstly carried out to establish the model’s mathematical framework. To perform the numerical simulations, the gathering of relevant data concerning construction workers’ personality configurations and behavioural intentions is one critical step in this research and is discussed in the data collection section. To further ‘crack the code’ of the conceptual model into its mathematical equivalent, ML algorithms were applied. In recent years, ML has seen an exponential rise in its usage due to its outstanding ability to iteratively learn from data to look into hidden insights and evolve its architecture to accommodate new findings [
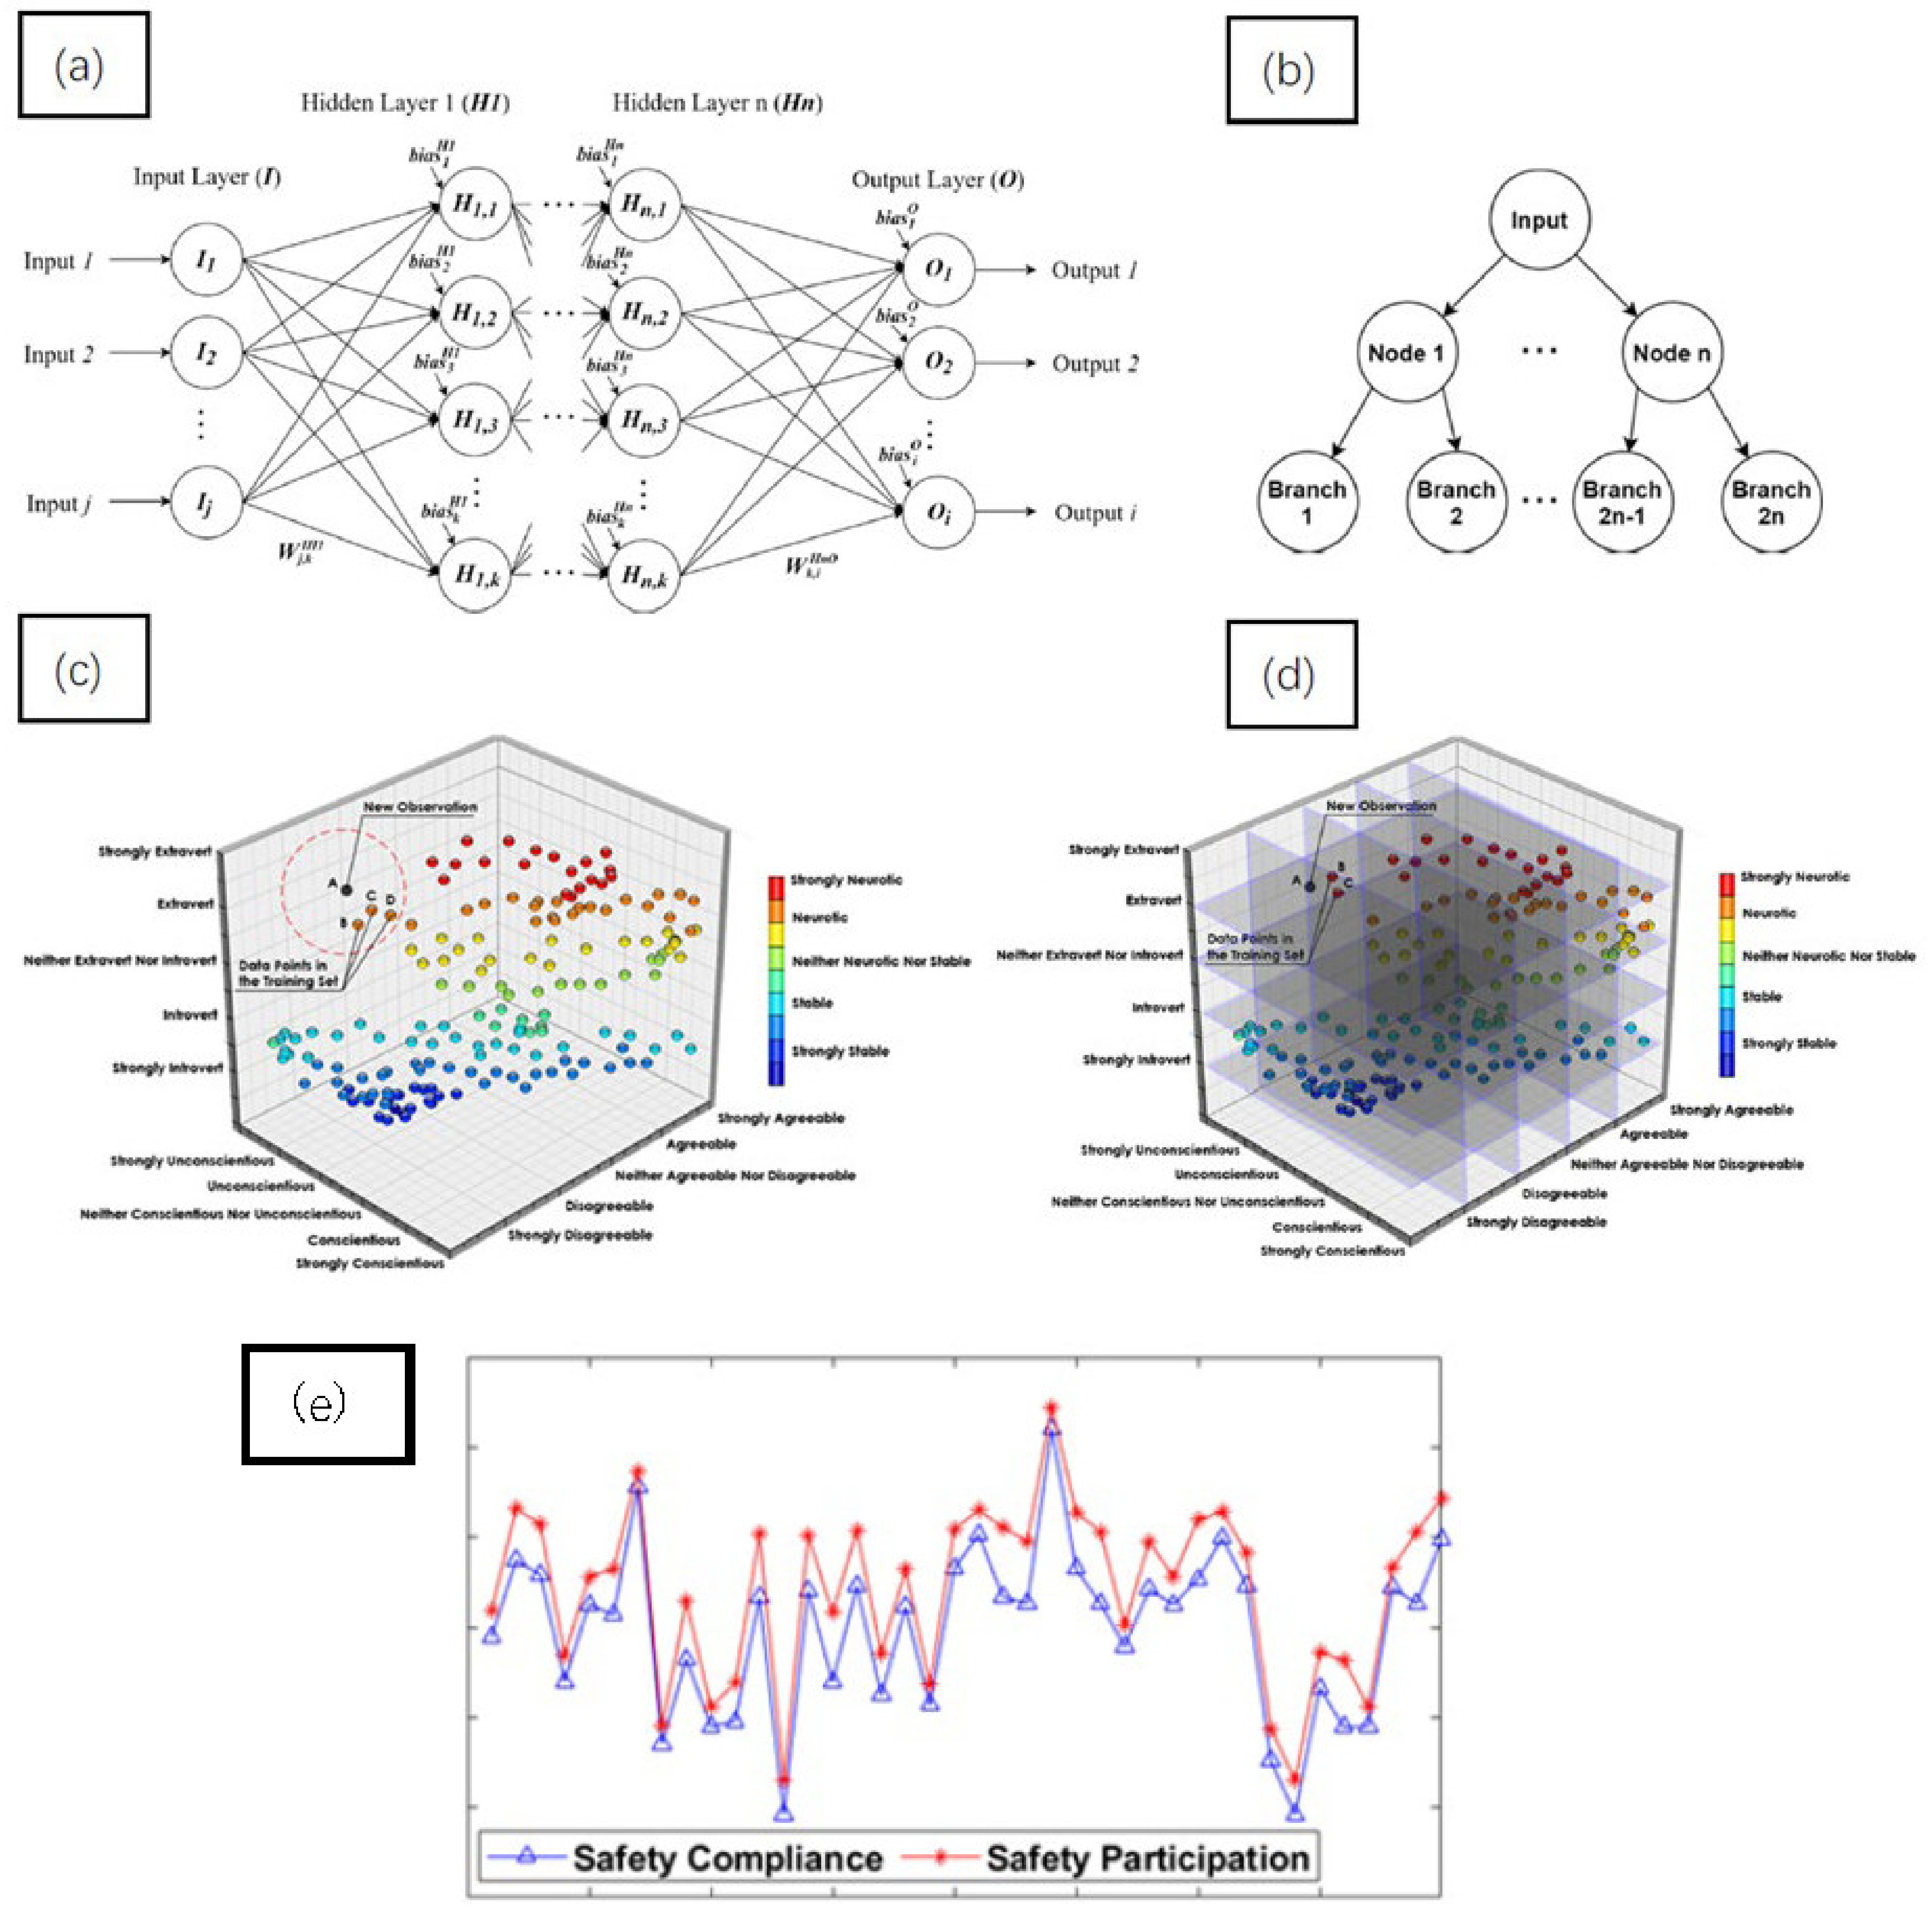
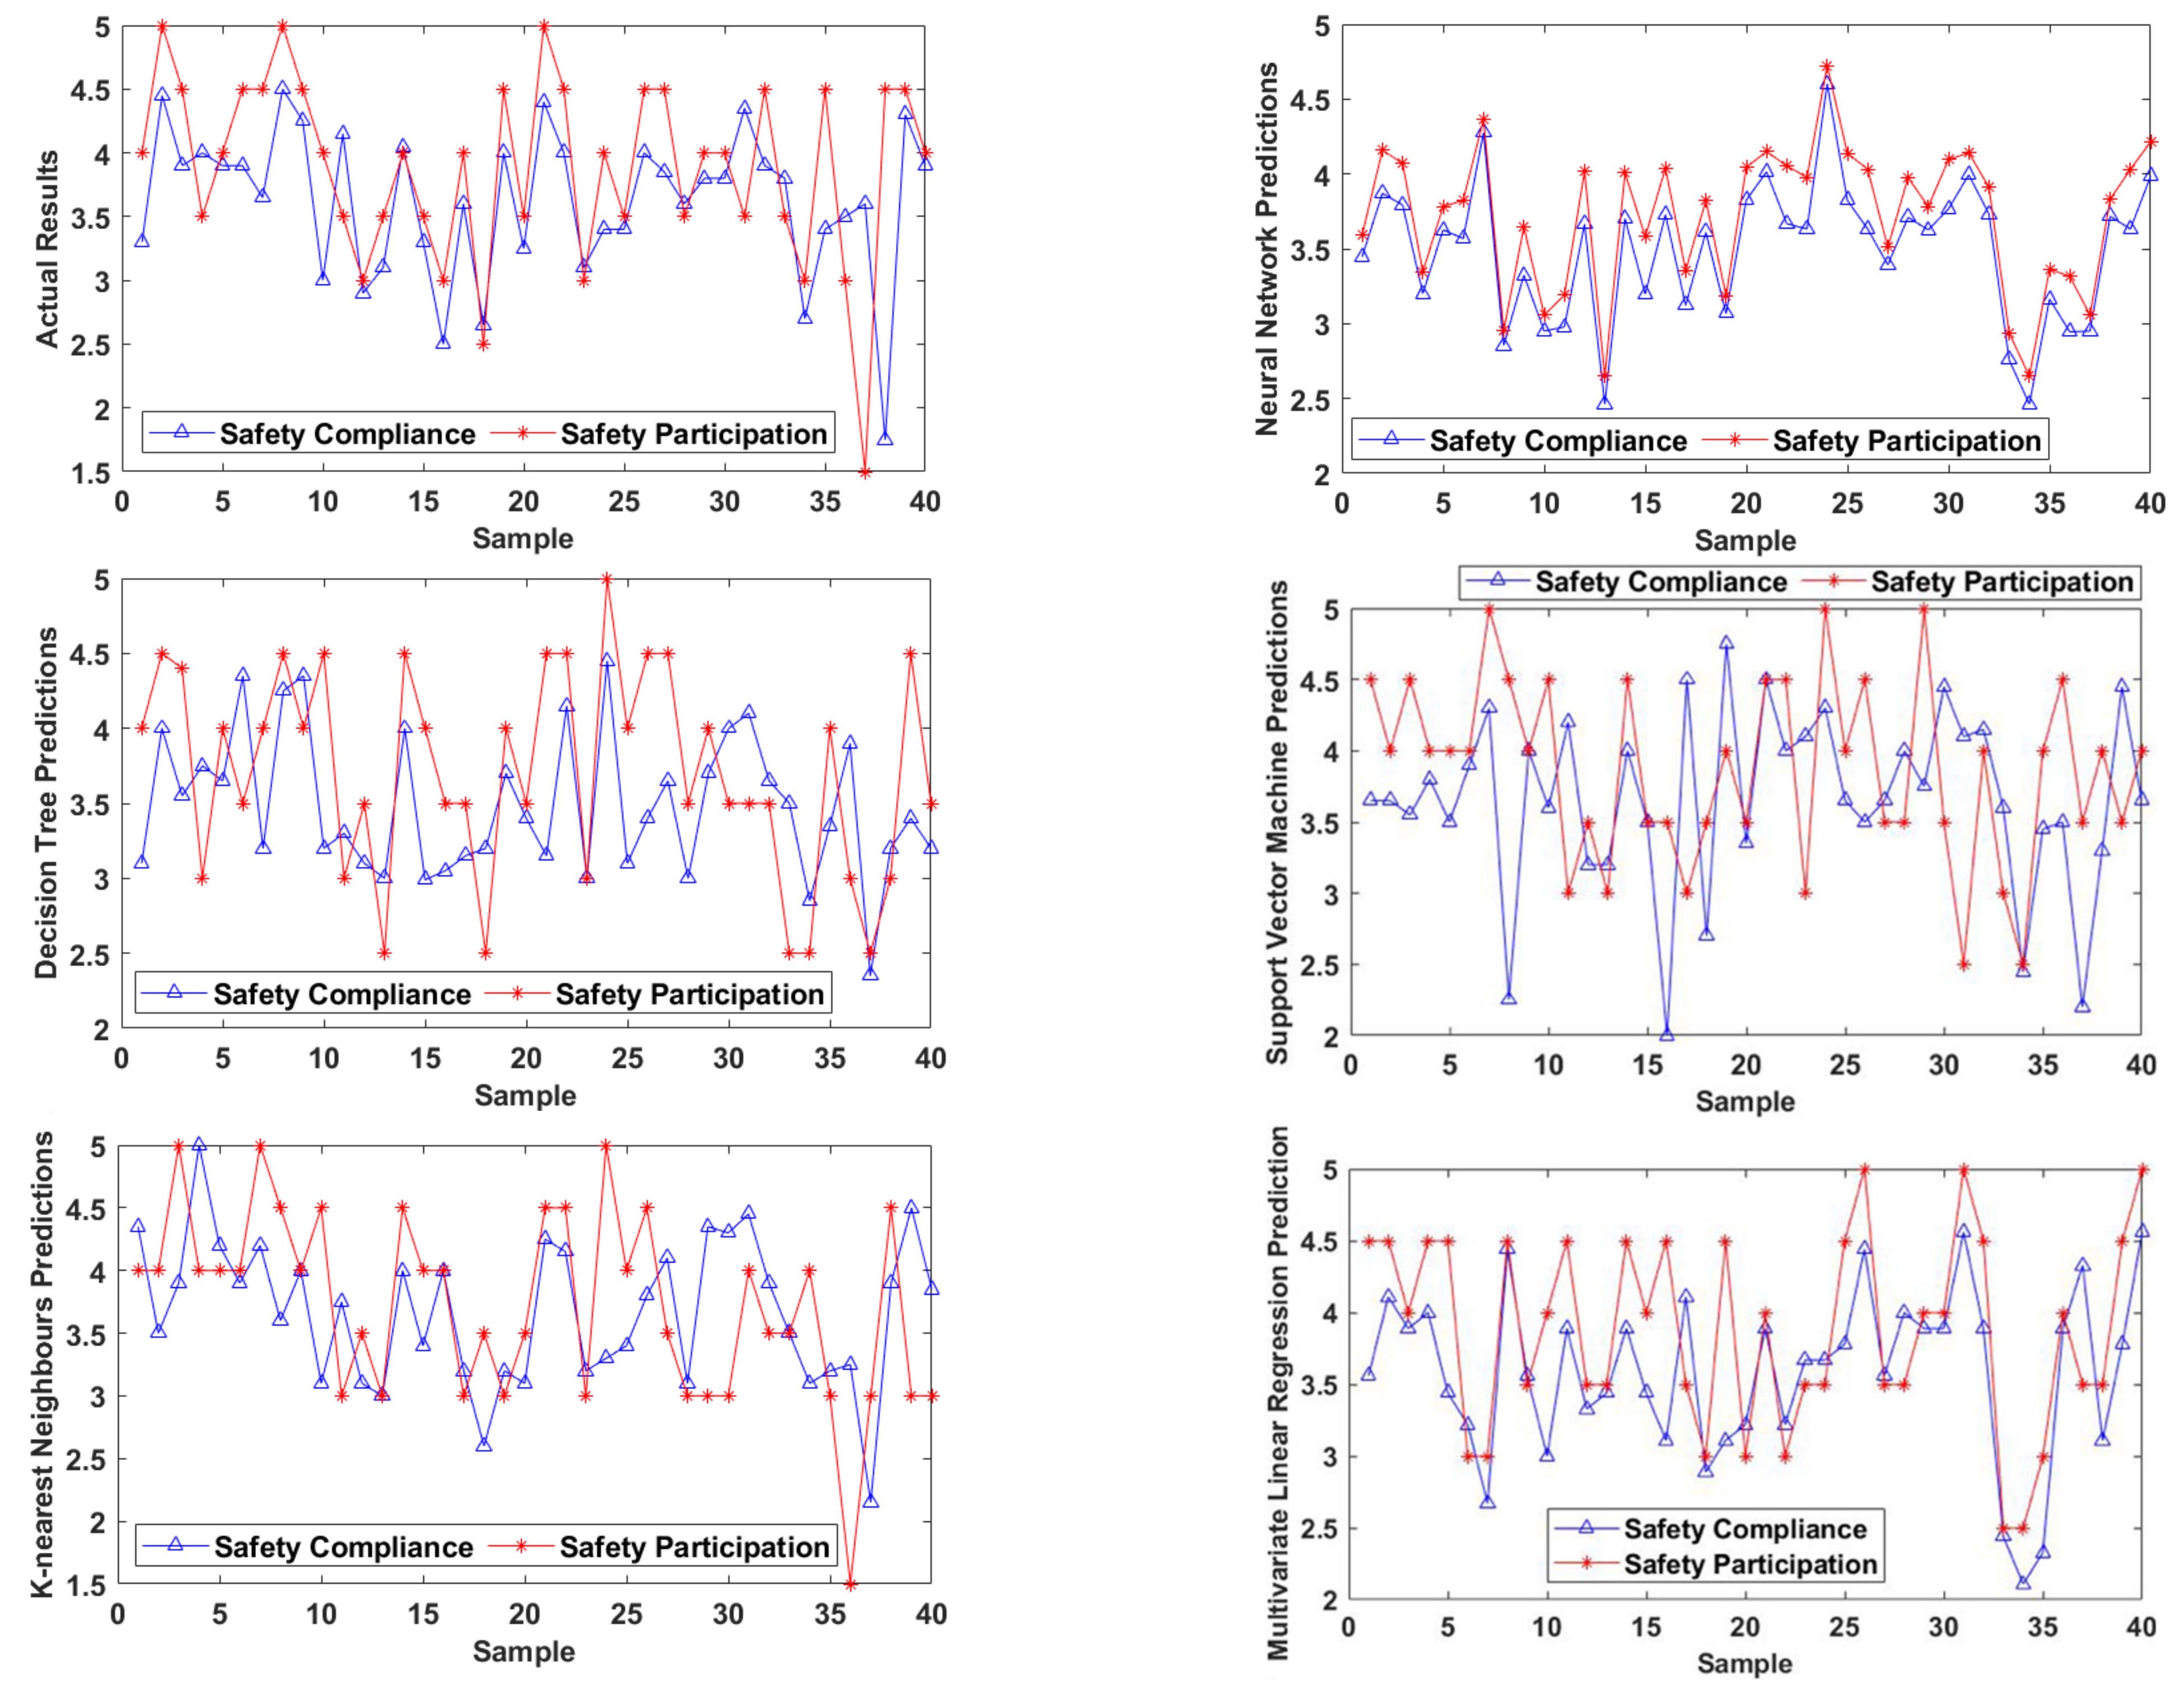
54]. Since there are a variety of ML algorithms that can perform data mining tasks, this research experimented with different ML algorithms and evaluated which algorithm is more accurate to capture the predictive relationship between workers’ personality configurations and behavioural intentions, to establish a robust and reliable predictive model. Specifically, five ML algorithms—backpropagation neural network (BP-NN), decision tree (DT), support vector machine (SVM), k-nearest neighbours (KNN), and multivariate linear regression (MLR)—were utilised in this research (Figure 2).
A BP-NN consists of multiple layers, where the neurons in the input, hidden, and output layers are responsible, respectively, for receiving input signals, processing the received signals, and decoding the processed signals into the outputs [55]. During a training process, the BP-NN iteratively adjusts the weights (i.e., connection strength between neurons in the input, hidden, and output layers) to minimise the squared difference between the BP-NN estimated values and the actual values in the training dataset [56]. Once trained, the BP-NN is able to obtain outputs for a given set of inputs. DT imitates a tree structure, where binary recursive partitioning is performed to identify the best criteria to divide the standardised inputs into terminal branches such that the squared difference between the values in the terminal branches and the corresponding outputs in the training dataset can be minimised [
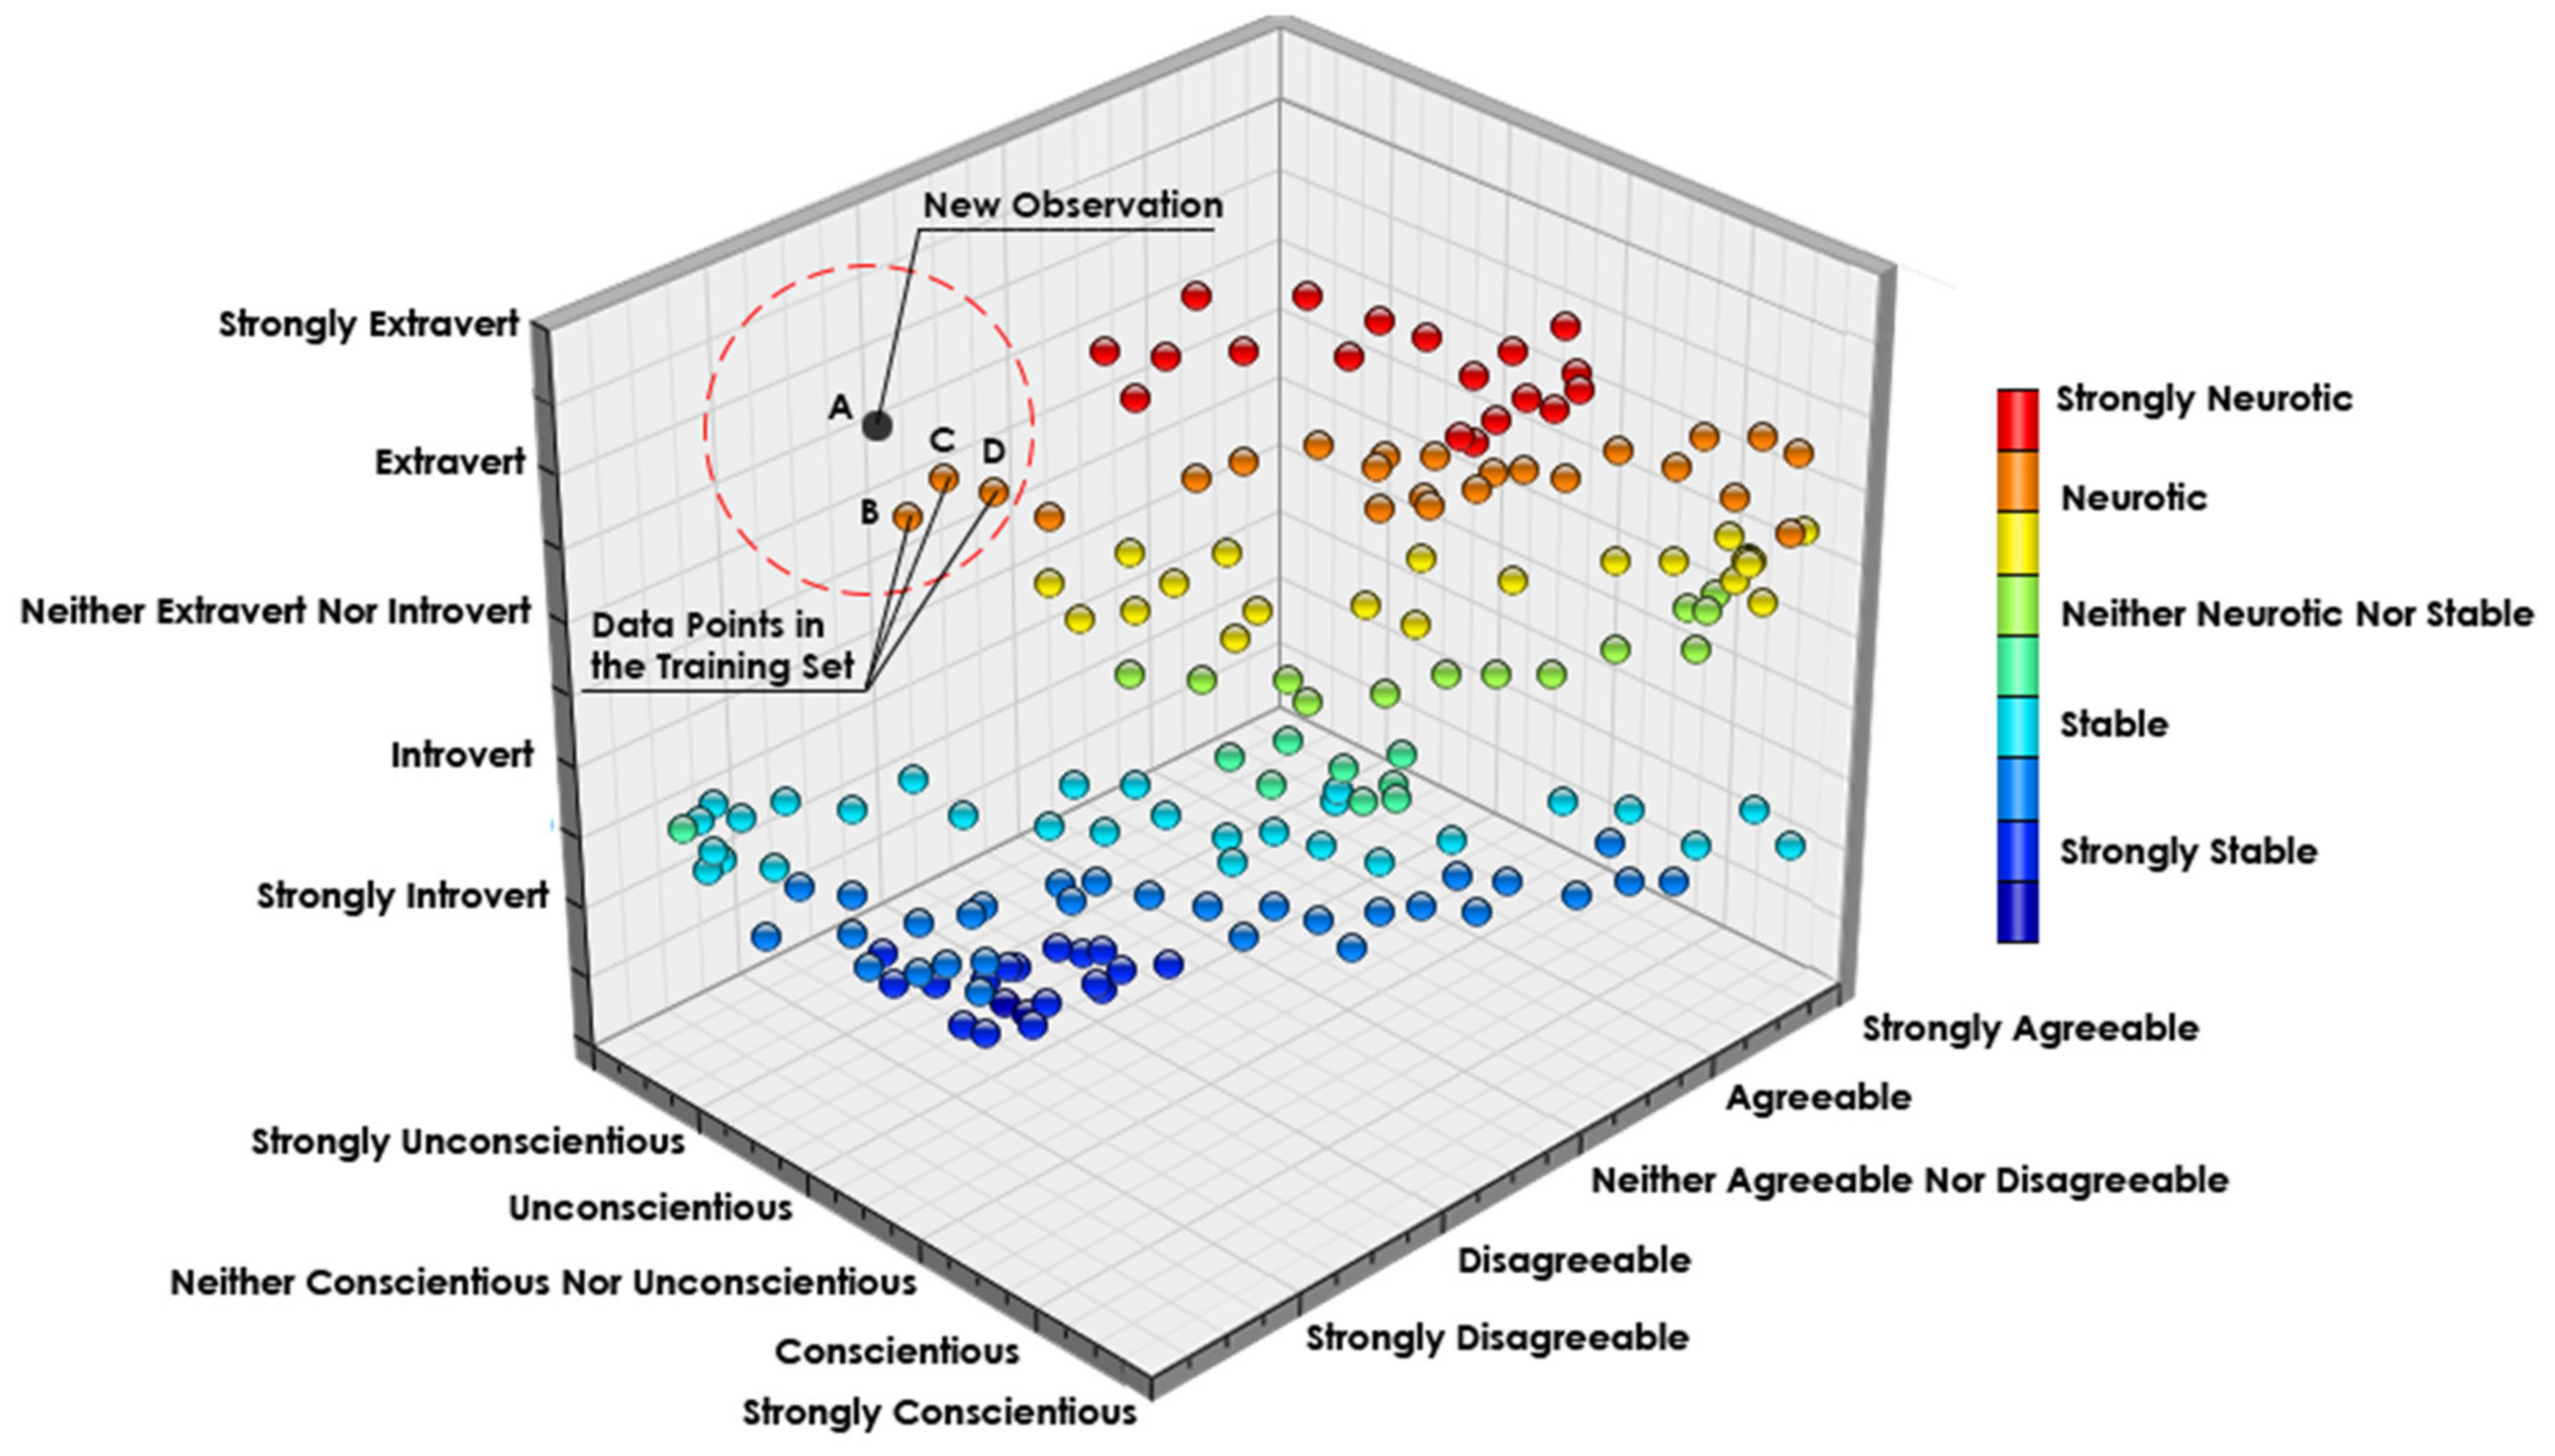
6]. In KNN, a new observation is predicted based on its similarity to the features of certain existing data points in the training set [6]. KNN analyses the Euclidean distance between a new observation and all the existing data points in the training set and assigns the new observation to the respective class that indicates the shortest distance, as well as the most similar features [54]. SVM identifies optimal separating hyperplanes to break off an n-dimensional space into classes such that a new observation can fall into the rightful boundaries for decision making [55]. MLR indicates that the sole output to be predicted is a linear function of one or more explanatory variables [57]: y = b 0 + b 1 x 1 + b 2 x 2 + + b i x i .
The authors acknowledge that these five methods (BP-NN, DT, SVM, KNN, and MLR) are chronologically not the most up-to-date techniques, as they were firstly published in 1970 [58], 1986 [59], 1992 [60], 1992 [61], and 1979 [62], respectively. There could be machine learning methods that are chronologically relatively new compared to the five methods used in this research. For example, the convolutional neural network (CNN), which represents a major breakthrough in computer vision, has propelled the deep learning field [63]. However, as suggested by data scientists [63], in data analytics, choosing a suitable algorithm for a particular use case (i.e., data type) is an essential task. A CNN approach works well with data containing spatial features and is mainly used for image processing, classification and segmentation [63]. This is because neighbouring pixels of image data indicate spatial features, which are represented in a two-dimensional array format and are thus suitable for feeding into the architecture of a CNN [63]. In this research, the data gathered on construction workers’ personality and behavioural intentions is in a tabular format, which does not form a spatial pattern linking different subjects in the table; thus, a CNN is not ideal. An extensive review of the existing literature reveals that the five methods (BP-NN, DT, SVM, KNN, and MLR) are widely used in today’s research to generate predictions from tabular data. Supporting examples identified in the literature are from 2018, 2020, and 2021, including technical papers from high-impact journals such as the Journal of Construction Engineering and Management [6], Automation in Construction [55], Advanced Engineering Informatics [64], and Safety Science [65,66]. The validity of BP-NN, DT, SVM, KNN, and MLR has been well-scrutinised not only by their original authors, as mentioned above, but also by other researchers who have employed these methods, e.g., [55,64,65,66], and they have been proven highly valid and robust for tabular data particular use.
BP-NN, DT, SVM, and KNN are data-driven methods that allow for identifying natural patterns between variables without assuming any preconception in terms of the mathematical structure of the data [55]. MLR is the rule-driven method in ML which derives the relationships between variables by imposing a linearity assumption on the relationships [57]. Although MLR is one of the simplest statistical methods for developing predictive models and only supports linear solutions, it was utilised in this research in order to evaluate the performance of a linear method against the other non-linear ones given the following considerations:
MLR can sometimes outperform data-driven methods such as BP-NN when the underlying relationship is closer to a linear fashion and a smaller number of predictors is involved [67].
The personality–intention relationship has been observed in some cases to be linear [1,52], and the number of personality traits included as the predictors (i.e., extraversion, neuroticism, agreeableness, and conscientiousness) is relatively smaller.
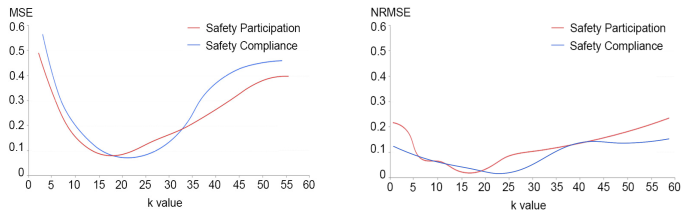
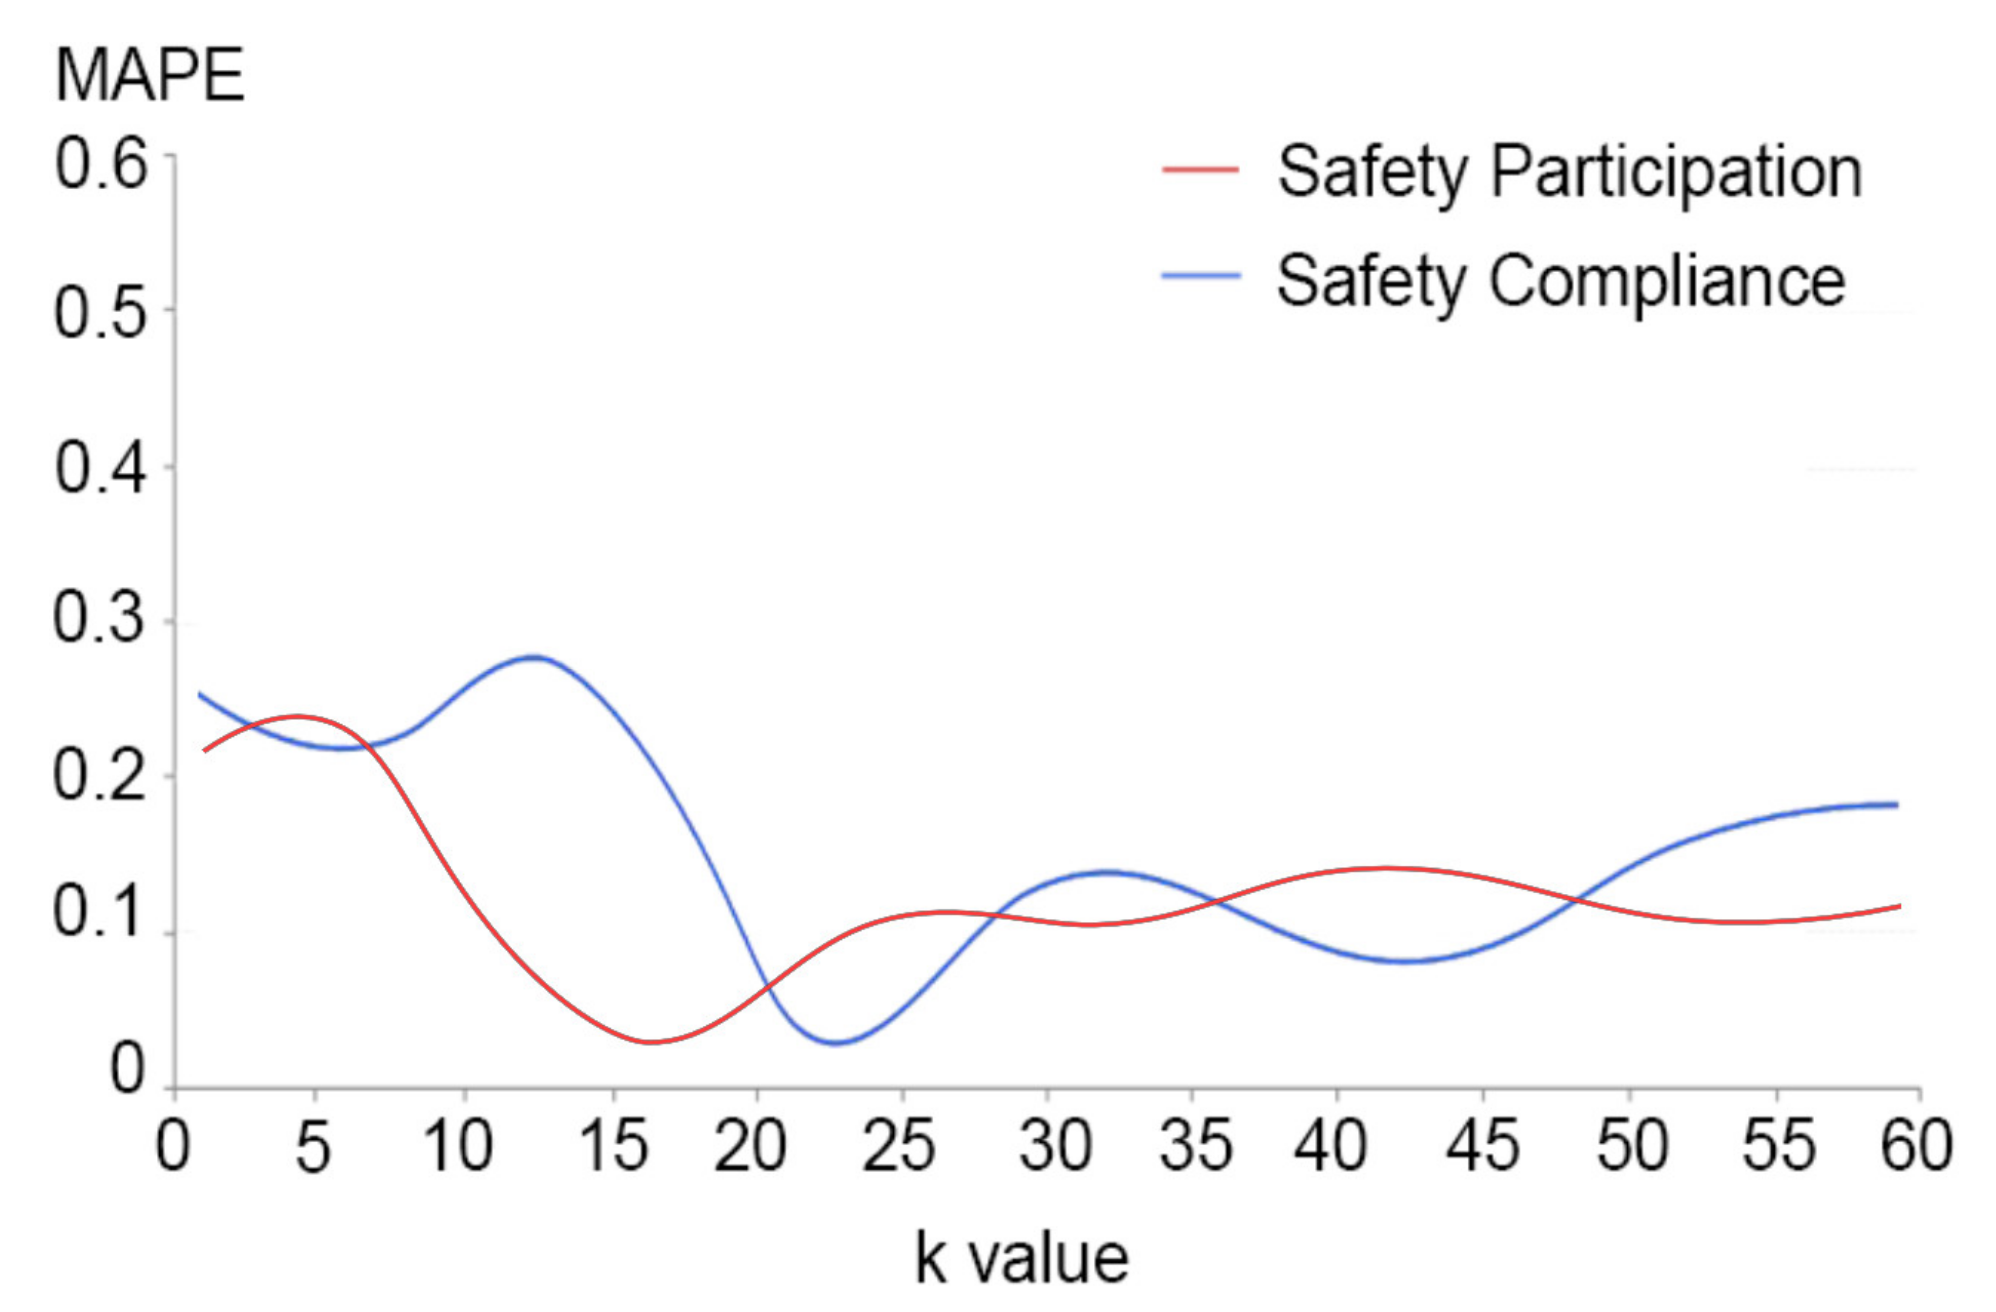
A greater model performance (i.e., minimal prediction loss) usually implies that a more accurate mapping of the authentic relationships between variables has been captured [
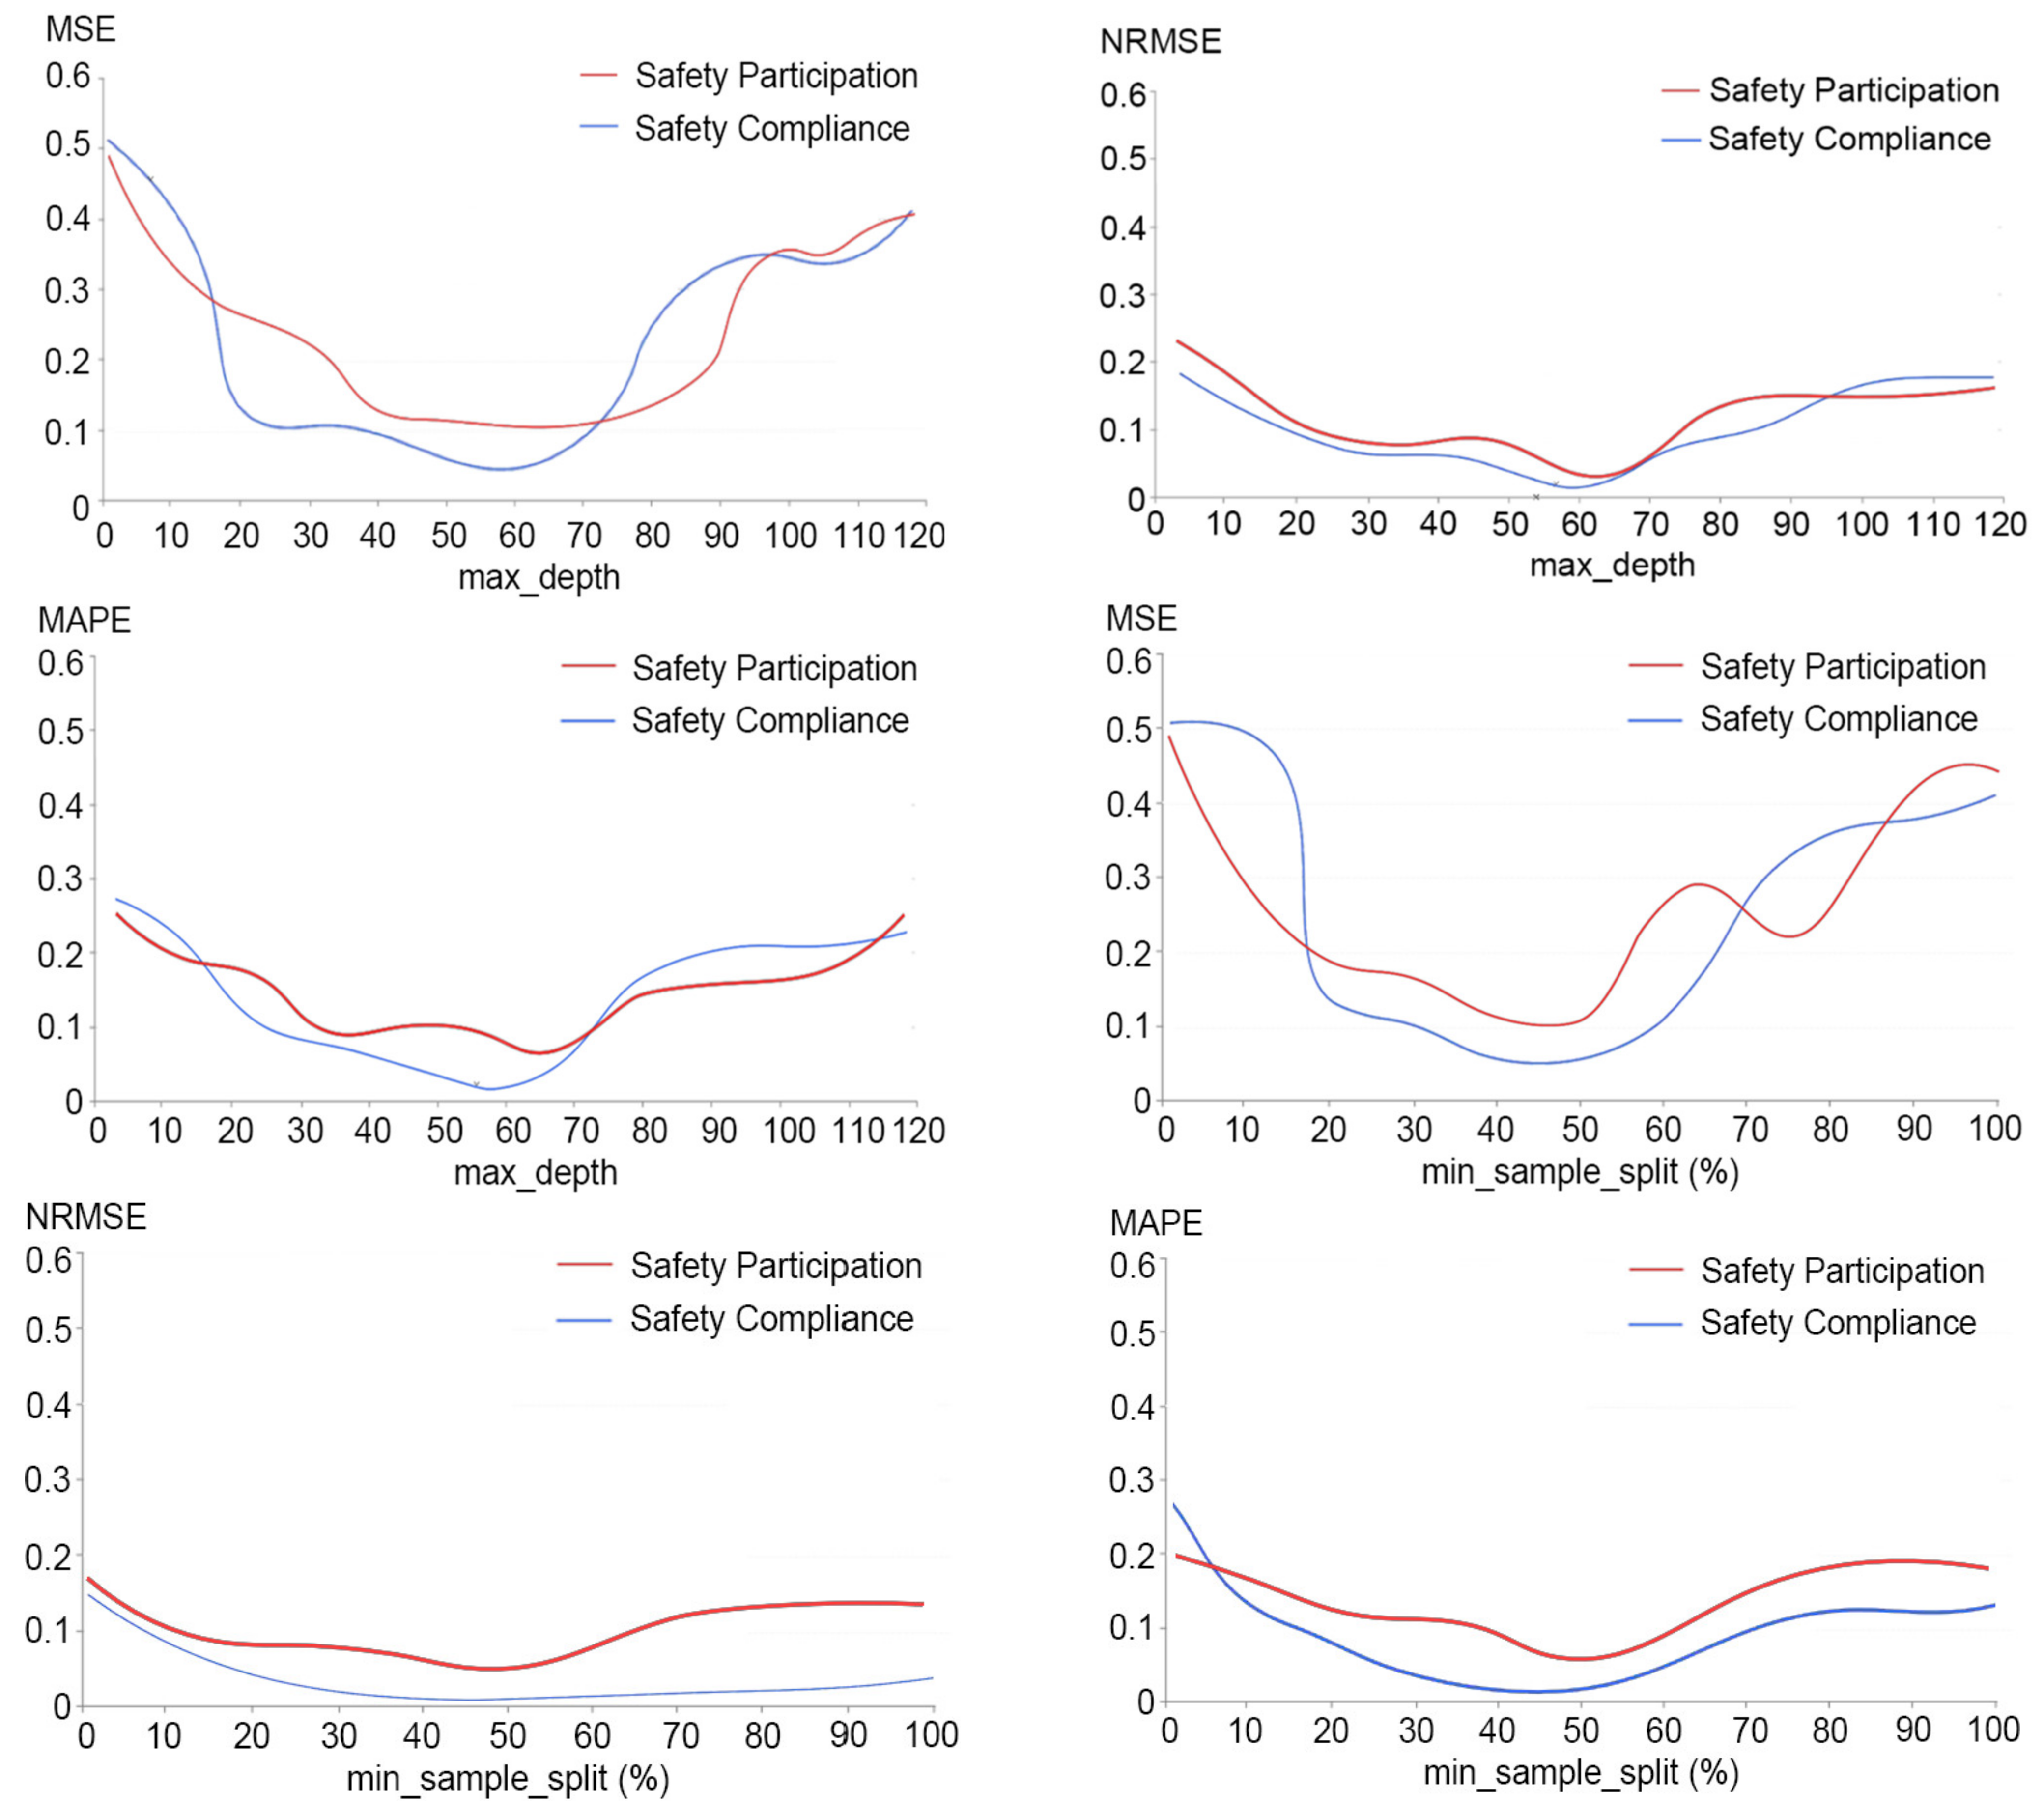
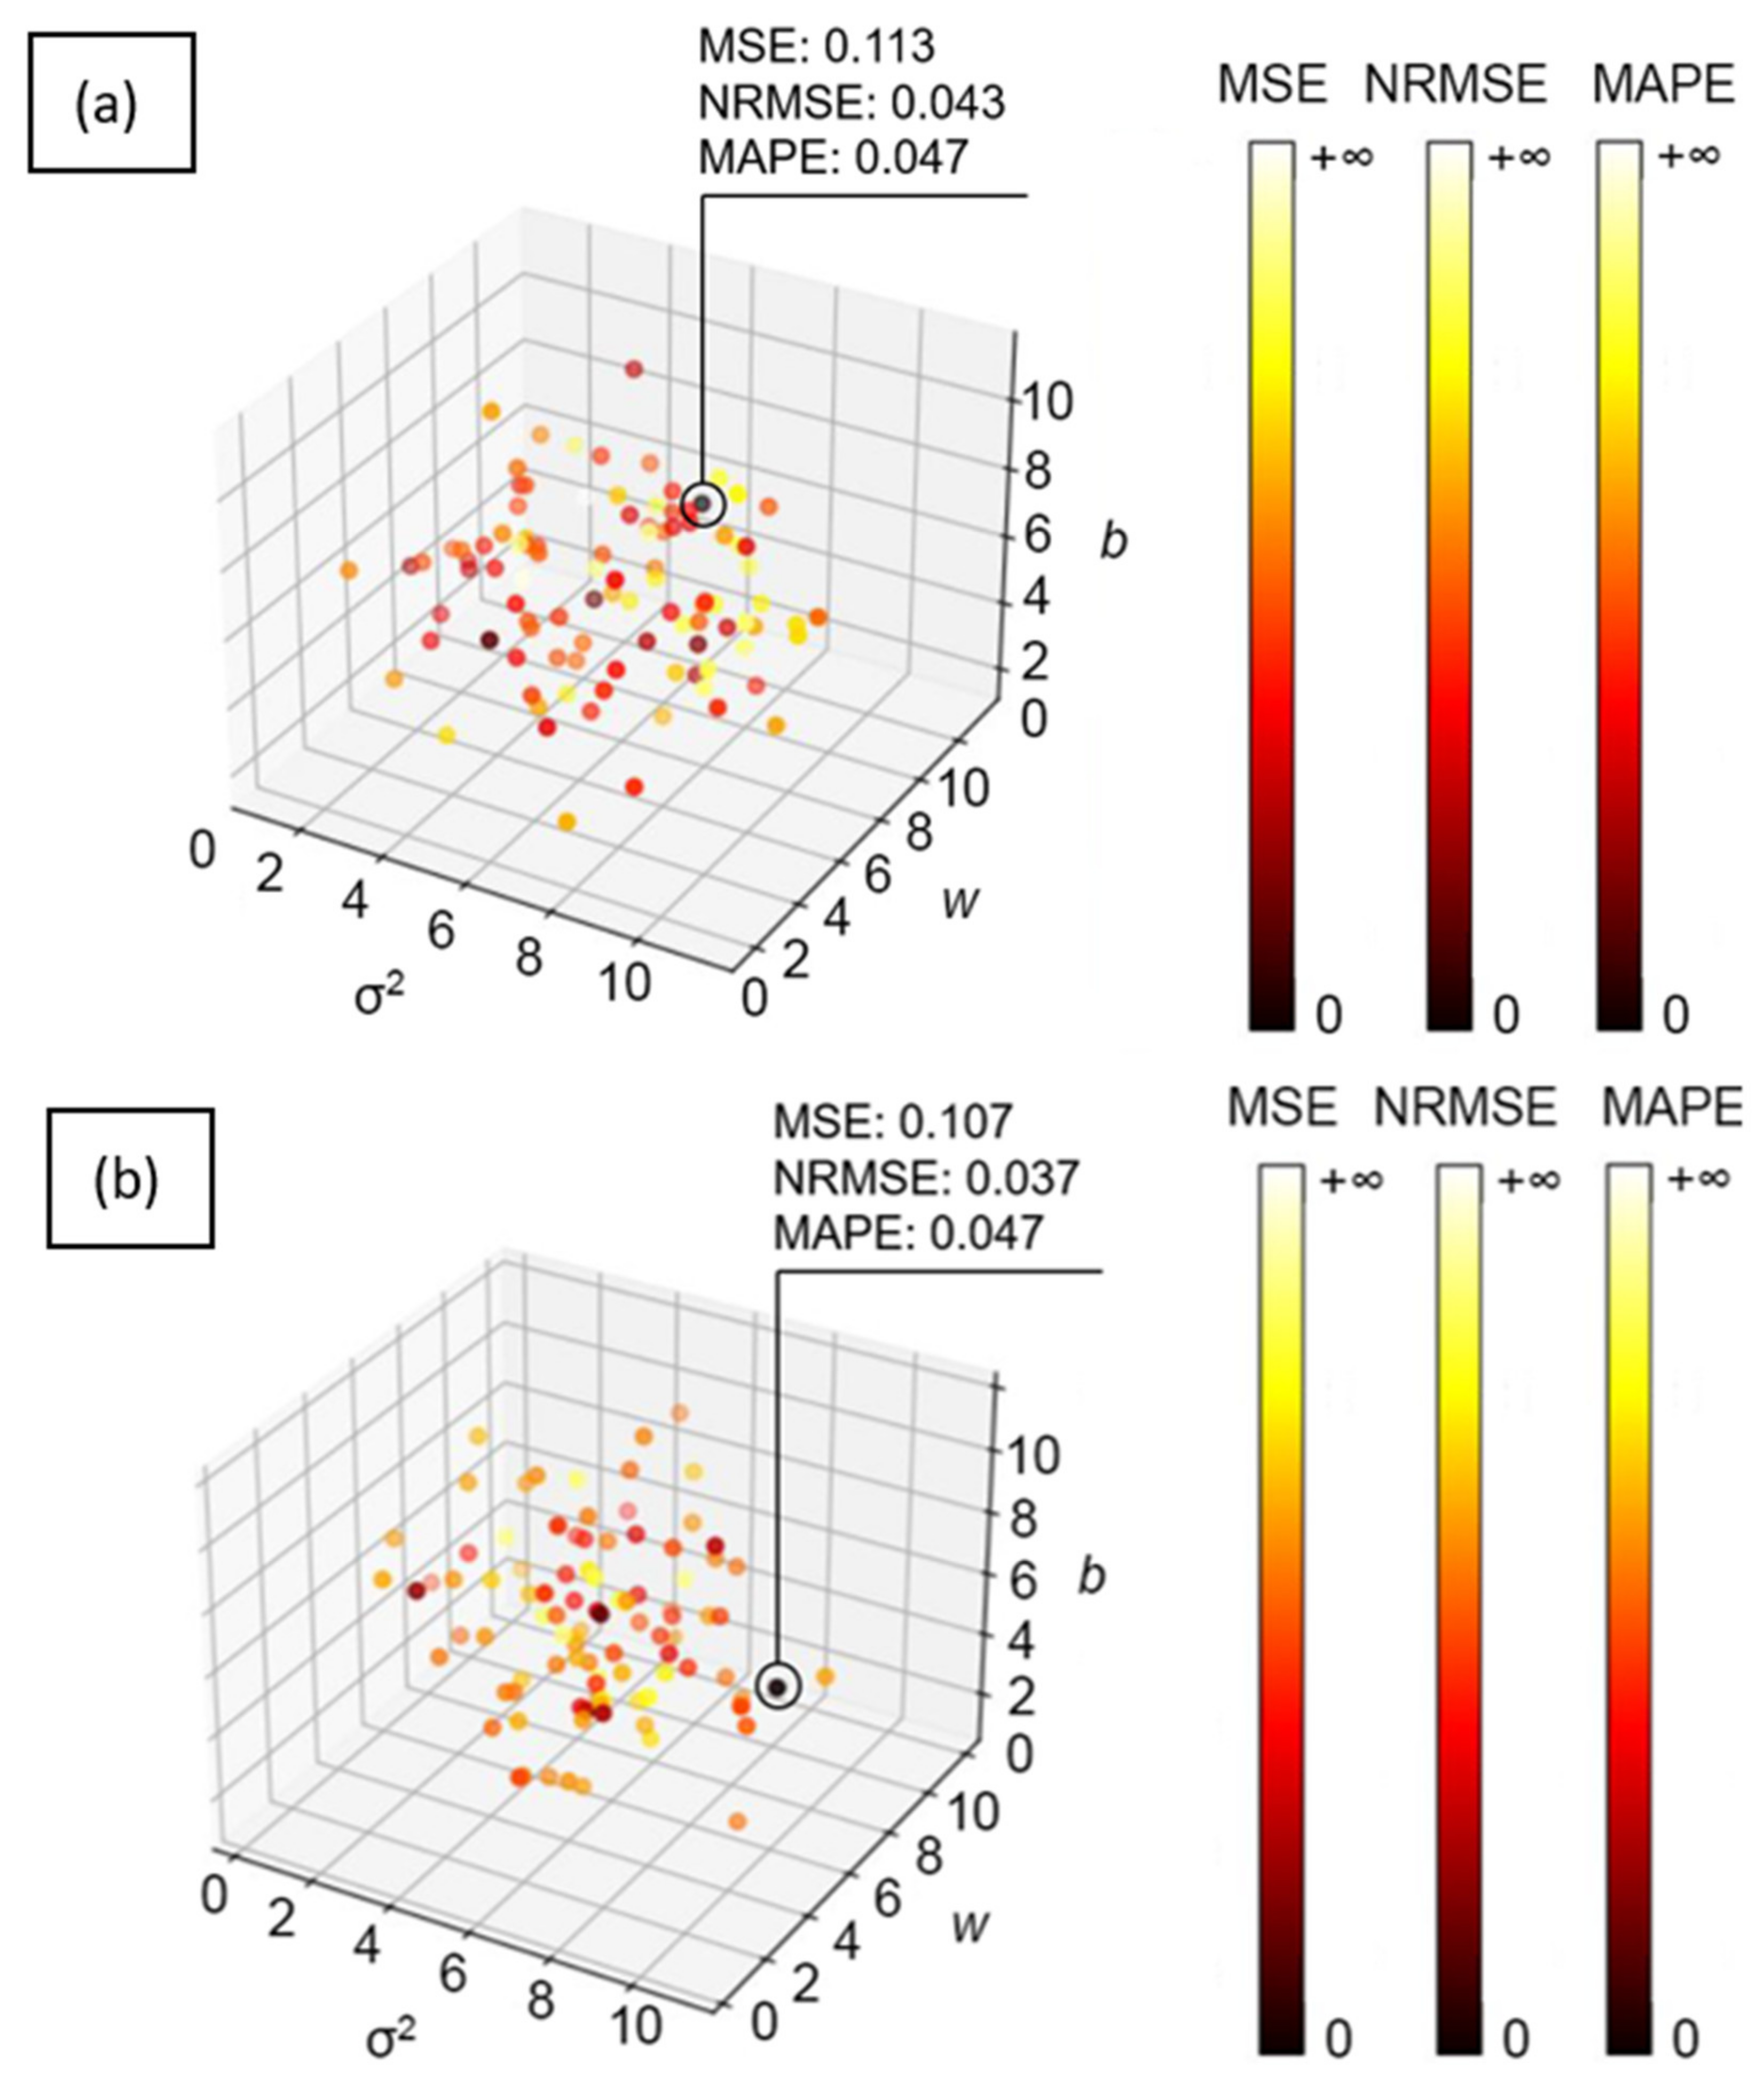
67]. In order to explore which algorithm can best model the predictive relationship between workers’ personality configurations and behavioural intentions, the prediction loss of the BP-NN, DT, SVM, KNN, and MLR models was evaluated using loss functions including mean squared error (MSE), normalized root mean square error (NRMSE), and mean absolute percentage error (MAPE) [68] (see the results section). To gain further insights into the weight of each trait in the personality configurations for workers’ behavioural intentions, weight analysis was conducted on the ML model that indicated the best prediction performance, which is discussed in greater detail in the results section. The theoretical and practical implications of the predictive model are interpreted in the discussion section.

4. Data Collection

Collecting relevant data for numerical simulations is a critical step, which was conducted with the objective of gathering data concerning the conceptual model in terms of inputs (personality traits) and outputs (behavioural intention dimensions) from workers. The following subsections discuss in detail the determination of the instruments for data collection on workers’ personality traits and safety behavioural intentions as well as the demographic information of the participants.

4.1. Personality Traits

Personality has scales and is hierarchically measurable via its dimensions, including extraversion, conscientiousness, agreeableness, and neuroticism [27]. The existing scales measure personality dimensions along a five-category Likert scale continuum [27] (Table 1).
The latest research trends indicate that personality is currently being assessed through explicit techniques [51]. Explicit techniques refer to self-ratings, where individuals are explicitly asked to report their or others’ personality characteristics using a number of measurable items in response to certain situations (e.g., “I see myself as someone who tends to be quiet”; on a five-point Likert scale with anchors ranging from “strongly disagree” to “strongly agree”) [69]. As researchers have pointed out [51,70], the easy-to-administer personality items used in explicit measures could offer an optimal balance between diagnostic accuracy and feasibility. The explicit instruments—the Big Five Inventory (BFI) [71], NEO Five-Factor Inventory (NEO-FFI) [72], Revised NEO Personality Inventory (NEO-PI-R) [73], and Frame-of-Reference Big Five Inventory (FOR-BFI) [74]—were introduced in the late 80s and early 90s and are to date the most widely used measures of personality [69]. These instruments are easy to administer and cost-effective, and they are not merely screening tools but are built on relevant personality and psychometric theories that were ascertained through decades of research and testing with individuals [75,76]. The psychometric properties (i.e., reliability and validity) of these instruments have been well-scrutinised not only by their original authors, as mentioned above, but also by numerous researchers who have employed these instruments afterwards [51,77,78,79,80], proving to be highly reliable and valid instruments.
Among the above four prevalent instruments, BFI, as well as NEO-FFI and NEO-PI-R, were developed purposely for a non-contextualised measure of personality [76,81]. A non-contextualised assessment is an assessment that examines personality without reference to any particular context [82]. For instance, the conscientiousness items in BFI, which include items such as “I see myself as someone who can be somewhat careless” and “I see myself as someone who tends to be disorganised”, are not contextually defined and are open to interpretation across a range of contexts (e.g., at work, at home, at school) [83]. In recent years, psychology researchers have reached the consensus that non-contextualised personality items are mostly useful in predicting non-context-dependent criteria (e.g., internet addiction disorder, conduct disorder) but suboptimal for behaviours or intentions that take place under certain contexts (e.g., intentions to engage in unsafe behaviours in the workplace) [80,82,83,84,85,86]. Such consensus reached in the literature also suggests that “specifying situational contexts will likely reduce the range of expectations given a person’s dispositional tendency, leading to more accurate predictions in linking personality to behaviour or intention in a certain context” [84] (p. 302). The improvement of predictive validity by means of contextualisation is referred to as the frame-of-reference (FOR) effect (viz., FOR-BFI instrument, as mentioned) [83]. Invented by [74], the FOR notion is to reference a personality instrument to certain contexts via the appendage of contextual references (e.g., “at work”, “at home”, or “at school”) to each item in the instrument. As research suggests [82], “simply by asking participants to complete personality scales with a particular context in mind, the predictive validity of the consequent personality models can be significantly improved” (p. 153). For example, a meta-analysis [87] and recent psychology research [82,88] found that instruments composed of contextualised personality items were able to explain at least two times more variance in individuals’ job performance than instruments that did not specify a context.
Taking the above considerations into account, FOR-BFI (in a work context) was used as the instrument for collecting personality data in this research. FOR-BFI (in a work context) measures the dimensions extraversion, agreeableness, conscientiousness, and neuroticism of human personality along a five-point Likert scale (from 1 = disagree strongly to 5 = agree strongly), which is available from https://forms.gle/eREQZH1UpXQH2uFDA (accessed on 16 May 2022).

4.2. Safety Behavioural Intentions

As ascertained in the conceptual model section, the safety behavioural intention we aim to evaluate in this paper consists of two components: safety compliance and safety participation. An extensive review of the existing literature reveals that there are several instruments—namely the Safety Behaviour Scale (SBS) [89], Safety Diagnosis Questionnaire (SDQ) [90], Safety Climate Index: Workers’ Health and Safety Behaviour (SCI-WHSB) [91], Work Safety Scale (WSS) [92], and Safety Performance Scale (SPS) [93]—which appear to be popular and have been widely used by researchers in occupational safety domains (e.g., construction, manufacturing) over the years, e.g., [51,70,94,95,96,97,98]. The reliability and validity of these instruments have been well-scrutinised not only by their original authors, as mentioned above, but also by other researchers, e.g., [51,94,95,96,97,98] who have employed these instruments and have been proven to be highly reliable and valid. However, it has been found that some of the instruments (i.e., SDQ, SCI-WHSB, and WSS) fail to provide a thorough measure of behavioural intention and lack the evaluation of safety participation, whereas SBS and SPS have focused on both the safety compliance and safety participation dimensions of behavioural intention.
SBS and SPS were designed to cover the measurement of the sub-dimensions of safety compliance and participation [89,93], namely, not taking shortcuts, using safety equipment, following safety procedures and rules, reporting safety problems, keeping the workplace clean, and caring for colleagues’ safety. However, it has been found that SPS contains six items that are all positively worded (e.g., “I use personal protective equipment for the task I am doing”) [93]. Using purely positive-worded items in an instrument is considered imbalanced and has the potential to induce positive bias [89]. Meanwhile, in SBS, the majority of statements (i.e., 10 out of 11 items) are framed using both positive and negative items [89] (which is available from https://forms.gle/Ht65oKjXyhZh9cuC9 (accessed on 16 May 2022)):
  • Safety Compliance: Q1 and Q2, Q3 and Q8, Q4 (Q7) and Q9 (from the weblink above).
  • Safety Participation: Q6 (Q11) and Q10 (from the weblink above).
In addition, SBS is a concise instrument (11 items) and at the same time contains adequate contextualised items as needed to measure human intentions to engage in safety-related behaviours in the work context [94]. Taking the above considerations into account, SBS was chosen for use in this research to collect data on construction workers’ safety behavioural intentions.

4.3. Participants and Demographic Information

Ethical approval was granted by the University of Auckland Human Participants Ethics Committee. In June 2019, the authors visited six construction projects in Auckland, New Zealand, and asked frontline workers encountered if they were willing to respond to an online survey, which was self-administered and anonymous. Gatekeeper permission was obtained from managers prior to approaching on-site workers. To avoid interference with the construction progress, workers who agreed to the request were provided with a web link so that they could respond to the online survey during off-duty hours. Two hundred and eighty workers finally provided their responses. Twelve out of the 280 responses were deemed unusable due to having unanswered items and dropped from this study. Table 2 reports the distribution of demographic characteristics of the respondents. In responding to self-referential statements, individuals are led to recall relevant episodes from their memory system [94]. It is therefore of great importance that such episodes appear to exist in, or at least make sense to, the participants, which has been found to be determined, in most cases, by individuals’ personal experience in the context that is measured (e.g., at work). To understand whether the participants had adequate on-site experience such that they were able to provide useful responses, information on their years of work experience and types of trade was requested for self-reporting. As seen (Table 2), the participants were composed of individuals employed in different construction trades, and more than half of them had worked for a minimum of five years on construction projects. It thus appeared that the participants had adequate on-site experience to generate useful responses.

5. Results

5.1. Data Split Ratio

As specified in the research method section, five ML algorithms—BP-NN, DT, SVM, KNN, and MLR—were adopted to carry out the numerical simulations of the conceptual model proposed. To ascertain which algorithm best modelled the predictive relationship, the performance (i.e., prediction loss) of the five ML algorithms was evaluated and compared. As such, the whole dataset was split into three groups: the training, validation, and testing datasets. The training dataset is used to iteratively adjust the modelling parameters (e.g., the weights between input and hidden neurons of BP-NN) in the ML algorithms such that the algorithms could be optimised to best map the input–output modelling framework and produce minimal prediction losses [55]. The validation dataset was used to determine when training should terminate in order to prevent overfitting [56]. The testing dataset was used to test the eventual prediction losses of the ML algorithms after the training process [56].
The criteria for determining the dataset split ratio have been recommend in the literature [99,100]: (1) The training dataset should be more than two-thirds of the whole dataset and the validation and testing datasets should be equally split among the rest. (2) Each of the validation and testing datasets should be approximately one-fourth to one-eighth of the training dataset. Given the criteria, the commonly applied split ratios include 70:15:15 and 80:10:10 for training, validation and testing datasets [100]. Additionally, the 70:15:15 has been reported to be a more balanced split ratio than 80:10:10, as it includes as many data points for training as possible and also preserves sufficient data portions for validation and testing [99]. Thus, the 70:15:15 ratio was selected for use in this research. The whole dataset had a total of 268 valid samples, of which 188 (70%), 40 (15%), and 40 (15%) samples were randomly assigned for training, validating, and testing of the five ML algorithms.

5.2. Training Process

Training of the five ML algorithms was performed using MATLAB software. During the training process, iterative optimisation of the five ML algorithms was performed to seek the minimal differences between the actual values (i.e., self-reported intentions to engage in unsafe behaviours from samples included in the training set) and the predictions from the algorithms. The functions for difference minimisation are referred to as loss functions (i.e., MSE, NRMSE, and MAPE), where a lower MSE, NRMSE, or MAPE value indicates a decreased actual–algorithm prediction gap as well as a reduced prediction error [68]. According to the literature [101], MSE, NRMSE, and MAPE values lower than 0.25, 0.1, and 0.1, respectively, are the thresholds that a satisfactory error minimisation must achieve. The equations of the loss functions are as follows:
MSE = 1 n i = 1 n ( y i y ^ i ) 2
NRMSE = MSE y m i n m a x
MAPE = 1 n i = 1 n y i y ^ i y i
where n = the number of samples in a dataset; y i = the actual value for the ith sample; y ^ i = the algorithm estimated value for the ith sample; y max = the maximum actual value in the dataset; and y min = the minimum actual value in the dataset.
Through the training process, the prediction error was iteratively minimised and resulted in the MSE, NRMSE, and MAPE values shown in Table 3. BP-NN outperformed the other algorithms and yielded the lowest errors on the training dataset. According to the mentioned threshold (MSE < 0.25, NRMSE < 0.1 and MAPE < 0.1), the optimisation performance of BP-NN, DT, SVM, and KNN was found to be highly satisfactory, whereas MLR revealed a less-than-satisfactory performance.
Training to determine the parameters of BP-NN, DT, SVM, KNN, and MLR is interpreted in the following sub-sections.

5.2.1. BP-NN

In this research, the BP-NN consists of four input neurons (one corresponds to each personality trait) and two output neurons (one corresponds to each behavioural intention dimension). To determine the number of hidden neurons, a method widely recommended and used in the literature was followed: m n 2 m , where n is the number of hidden neurons and m is the number of input neurons, e.g., [102,103,104]. The BP-NN was thereby trained repeatedly with varying numbers of hidden neurons (from four to eight) and hidden layers to identify the number of hidden neurons and hidden layers that can demonstrate the optimal performance on prediction loss (i.e., minimal MSE). As shown in Table 4, one hidden layer with eight hidden neurons exhibited the optimal performance among its alternatives on the loss functions (i.e., minimal MSE, NRMSE, and MAPE for safety compliance and safety participation predictions), and further addition to the number of hidden layers and neurons appeared to be no longer able to lead to improved BP-NN performance.
The computation inside a neuron is carried out by means of an activation function, which determines the output of that neuron, given a set of inputs [54]. As suggested in the literature [105], rectified linear unit (ReLU), SoftPlus, tansig, logsig, and purelin are current widely used activation functions. The BP-NN was trained repeatedly with varying combinations of these activation functions in the hidden and output layers to identify the combination that demonstrated the optimal performance on the loss functions MSE, NRMSE, and MAPE. It was found that the use of tansig and ReLU in the hidden and output layers, respectively, exhibited the optimal performance for safety compliance and safety participation predictions (see Table 5), which was thereby determined for the BP-NN.
The computation inside the three-layer BP-NN (i.e., one input layer, one hidden layer, one output layer) can therefore be expressed using Equations (4)–(7) below.
H k = j = 1 N j w j , k I H I j + b i a s k H
H k = f H H k = t a n s i g H k = 2 1 + e 2 H k 1
O i = k = 1 N k w k , i H O H k + b i a s i O
O i = f O O i = R e L U O i = 0 O i   for for   O i 0   O i > 0
where H k = input to the kth hidden neuron; I j = input to the kth hidden neuron from the jth input neuron (the value of I j is an individual’s score on each personality dimension); w j , k I H = weight between the jth input neuron and kth hidden neuron (the values are provided in Table 6); N j = the number of input neurons ( N j = 4); b i a s k H = bias of the kth hidden neuron (the values are provided in Table 6); H k = output of the kth hidden neuron; f H x = activation function for the hidden layer (i.e., tansig); O i = input to the ith output neuron; w k , i H O = weight between the kth hidden neuron and ith output neuron (the values are provided in Table 6); N k = the total number of hidden neurons ( N k = 8); b i a s i O = bias of the ith output neuron (the values are provided in Table 6); O i = output of the ith output neuron (i = 1, O i = the prediction for safety compliance intention; i = 2, O i = the prediction for safety participation intention); and f O x = activation function for the output layer (i.e., ReLU).

5.2.2. DT

During the training process, the following parameters of DT were tuned in order to best fit the training dataset: max_depth, min_sample_split [106]. The parameter max_depth indicates how deep a DT can be [106]. The parameter min_sample_split represents the minimum percentage of samples required to split an internal node [106]. As presented in Figure 3, the training results revealed that (1) for safety compliance prediction, max_depth = 58 and min_sample_split = 45% indicated the optimal performance among its alternatives on the loss functions MSE = 0.051, NRMSE = 0.013, and MAPE = 0.018; (2) for safety participation prediction, max_depth = 64 and min_sample_split = 48% indicated the optimal performance among its alternatives on the loss functions MSE = 0.103, NRMSE = 0.055, and MAPE = 0.076. The above values of max_depth and min_sample_split were therefore determined for the DT model in this research.

5.2.3. SVM

To fit a set of input–output training data [xi, yi] (where xi = input data, yi = output data, i = the number of data points), SVM maps the input data’s original space into a higher dimensional feature space using a nonlinear Gaussian kernel function φ x , x = e x p x 2 x 2 / 2 σ 2 [55]. The function indicates that for any two input instances, x and x , the Euclidean distance (i.e., x x 2 ) of their corresponding points as mapped in the higher dimensional space is less than the value of σ 2 . In the higher dimensional feature space, the task becomes the construction of an optimal surface y = ω φ x + b to fit the input–output data, where ω is the weight and b is the bias [55].
To find the best fit, SVM was trained to mathematically identify the optimal σ 2 , ω , and b values that indicated the minimal prediction loss on MSE. As suggested in the literature, the parameters σ 2 , ω , and b have no defined value range limits [107]. According to the training results presented in Figure 4, it was found that (1) for safety compliance prediction, σ 2 = 4.5 , ω = 11.3 , and b = 4.4 exhibited the optimal performance among its alternatives on the loss functions (MSE = 0.113, NRMSE = 0.043, and MAPE = 0.047); (2) for safety participation prediction, σ 2 = 6.9 , ω = 11.8 , and b = 0.1 exhibited the optimal performance among its alternatives on the loss functions (MSE = 0.107, NRMSE = 0.037, MAPE = 0.047). The above values of σ 2 , ω , and b were thus used for the SVM model in this research.

5.2.4. KNN

KNN analyses the Euclidean distance between a new observation and all the existing data points in the training set (Figure 5) and assigns the new observation to the respective class that indicates the close points as well as the most similar features [54].
E u c l i d e a n   D i s t a n c e :   i = 1 k x i y i 2
where k = the number of data points to be considered as the close neighbours to a new observation; xi = feature values of a new observation (i.e., personality scales in this research); and yi = feature values of an existing data point in the training dataset (i.e., personality scales in this research).
Training of KNN is done to mathematically identify the optimum k value for a given training dataset, which refers to the number of close neighbours to look at when assigning a new observation to any respective class for decision making. As presented in Figure 6, the training results revealed that for a low value of k, KNN overfitted on the safety compliance and participation datasets, which resulted in high errors on the loss functions MSE, NRMSE, and MAPE. For a high value of k, KNN considered an excessive number of data points as close neighbours, which led to poor performance as well. The loss functions reached minima at values of k = 23 for the safety compliance dataset (MSE = 0.067, NRMSE = 0.020, and MAPE = 0.030) and k = 16 for the safety participation dataset (MSE = 0.075, NRMSE = 0.023, and MAPE = 0.027). The optimum k values were therefore determined for the KNN model (i.e., k = 23 for safety compliance, k = 16 for safety participation).

5.2.5. MLR

MLR indicates that the sole output to be predicted is a linear function of one or more explanatory variables [108]: y = b 0 + b 1 x 1 + b 2 x 2 + + b i x i . Gradient descent is an optimisation algorithm that is used to identify the optimal values for the collection of MLR model parameters ( b 0 , b 1 , …, b i ) [108]. The aim of gradient descent [108] is to identify a point of inflection where J b 0 ,   b 1 ,   ,   b i = ( y y ^ ) 2 = ( b 0 + b 1 x 1 + b 2 x 2 + + b i x i y ^ ) 2 yields a minimum ( y = MLR prediction given training inputs; y ^ = actual value in the training examples). To identify the point of inflection, the gradient of J b 0 ,   b 1 ,   ,   b i was determined as follows:
J b 0 ,   b 1 ,   ,   b i = J b 0 , J b 1 , ,   J b i
In this research, the architecture of the MLR prediction of construction workers’ intended safety behaviour was as follows:
y 1 = b 1 , 0 + b 1 , 1 x 1 + b 1 , 2 x 2 + b 1 , 3 x 3 + b 1 , 4 x 4
y 2 = b 2 , 0 + b 2 , 1 x 1 + b 2 , 2 x 2 + b 2 , 3 x 3 + b 2 , 4 x 4
where y1 = safety compliance; y2 = safety participation; x1 = extraversion; x2 = agreeableness; x3 = conscientiousness; x4 = neuroticism; b 1 , 1 , b 1 , 2 , b 1 , 3 , b 1 , 4 , b 2 , 1 , b 2 , 2 , b 2 , 3 , b 2 , 4 = weights of x1, x2, x3, x4 in the prediction of y1 and y2; b 1 , 0 , b 2 , 0 = constants in the prediction of y1 and y2.
Through the process of investigating point of inflection using the training dataset, the minimum of J b 0 ,   b 1 ,   ,   b i was identified to be 43.20 and 52.87 for the safety compliance and safety participation datasets, respectively. The corresponding weights and constants were as follows: b 1 , 0 = 0.658, b 1 , 1 = −0.086, b 1 , 2 = 0.554, b 1 , 3 = 0.543, b 1 , 4 = −0.166, b 2 , 0 = 1.011, b 2 , 1 = −0.132, b 2 , 2 = 0.755, b 2 , 3 = 0.343, b 2 , 4 = −0.170.

5.3. Prediction Performance

After carrying out the optimisation on the ML algorithms, the prediction performance (i.e., prediction loss) of the algorithms was evaluated on the testing dataset. The results for ML predictions on safety compliance and participation intentions are plotted in Figure 7, showing a comparison between the predicted results and actual results (i.e., workers’ self-reported intentions to engage in unsafe behaviours) for all the testing samples. The horizontal axis of the plot outlines 40 samples in the testing dataset, and the vertical axis represents one’s score on safety compliance and participation intentions, where a higher score indicates better performance in terms of intending to behave safely at work.
Based on the plot (Figure 7), the prediction performance of the ML algorithms was evaluated using the loss functions MSE, NRMSE, and MAPE (1)–(3), which are measures of how accurate a trained algorithm’s predictions are compared to the actual results for previously unseen data [101]. The resulting MSE, NRMSE, and MAPE values are presented in Table 7. As can be seen, BP-NN continued the outstanding performance to yield the lowest errors in predicting both safety compliance and participation intentions for the testing samples. According to the threshold, as mentioned (MSE < 0.25, NRMSE < 0.1, and MAPE < 0.1), the prediction performance of BP-NN, DT, SVM, and KNN was found to be highly satisfactory, whereas MLR revealed a less-than-satisfactory performance in the prediction of both safety compliance and participation intention.
Given the five ML algorithms’ performance on both the training and testing datasets, it was substantiated that:
  • NN outperformed DT, SVM, KNN, and MLR in capturing the modelling framework of construction workers’ personality traits and intentions to engage in safety-related behaviours.
  • NN, DT, SVM, and KNN all showed highly satisfactory performance in predicting both safety compliance and participation intentions.
  • MLR yielded greater prediction errors, which significantly exceeded the upper thresholds (MSE < 0.25, NRMSE < 0.1, and MAPE < 0.1). This implies that a nonlinear relationship exists between construction workers’ personality traits and safety behavioural intentions, as the linear method MLR was unable to satisfactorily capture the relationship.

5.4. Weight Analysis

As interpreted in the Introduction section, it is not a single trait but a configuration of traits that constitute individuals’ behavioural intentions. Previous studies [1,22] have either been descriptive in nature or provided insufficient insights into the weight of each trait in the personality configuration for workers’ safety behavioural intentions, which prevented these studies from establishing a robust predictive basis. This research tested five ML algorithms, with BP-NN producing the best performance in modelling the predictive relationship between workers’ personality configuration and behavioural intentions. In order to provide further insights, weight analysis was performed on BP-NN, applying Equation (12), as suggested by Garson [109] and presented below. This method is used to analyse the weight of each input variable in the configuration of a BP-NN for predicting the outputs [109], which has been widely utilised in today’s BP-NN research and proven to be highly effective and reliable e.g., [110,111].
w j , i = k = 1 N k w j , k I H j = 1 N j w j , k I H × w k , i H O j = 1 N j k = 1 N k w j , k I H j = 1 N j w j , k I H × w k , i H O
where w j , i = the weight of the jth input variable on the ith output variable; the definitions and values of N j , N k , w j , k I H , and w k , i H O can be found in Table 8.
The weights of each trait on workers’ behavioural intentions were computed based on Equation (12) and the values provided in Table 8, and the results are presented in percentage format in Table 9.
It can be observed that conscientiousness with weights of 38.19% and 40.59% exerts the maximum regulatory effects on workers’ safety compliance and participation intentions. This result aligns well with the findings of existing meta-analyses of personality traits and occupational safety [27,112]. One possible explanation for this finding may lie in the nature of conscientiousness itself. Conscientiousness is the personality trait of being responsible [71]. The responsibility-oriented nature of conscientiousness leads individuals to consistently be responsible for both their own and team members’ well-being and behave safely at work [27]. Such a personality trait would result in the highest involvement in safety behaviour [29,56,113]. It can also be observed that extraversion, with weights of 11.29% and 18.48%, exerts minimal regulatory effects on workers’ safety compliance and participation intentions. This result is in agreement with the findings of previous studies in the occupational and traffic safety field [113,114]. According to these studies [113,114], extraversion constitutes a relatively less significant factor in workplace unsafe behaviours compared to the other personality traits (agreeableness, neuroticism, and conscientiousness). Lajunen [113] analysed that a possible reason for this finding is that extraversion is characterised as the extent to which an individual is energetic/active, which implies how susceptible to fatigue they are [27]. Extraversion-related human errors were found to occur when fatigue symptoms start to develop, which are at times compared to other traits that can exert time-continuous influences (e.g., conscientiousness) [113,114]. This is also reflected in industrial statistics. According to the National Safety Council (NSC), fatigue accounted for a small portion of construction injuries (less than 5%) in 2019 in the United States [115].
In addition to conscientiousness and extraversion, the predictive basis also consisted of agreeableness and neuroticism in the configuration, with the weight values being 32.58% and 24.85%, and 17.94%, and 16.08%, respectively (see Table 9). Previous studies have provided insights to explain why agreeableness and neuroticism play significant roles in the prediction of workers’ intentions to engage in safety-related behaviours [27,116]. According to the theory of purposeful work behaviour [116], personality traits set individuals out on different intention trajectories in terms of attaining certain goals in the workplace. Agreeableness induces a craving for the goal of communion, where individuals with a high level of agreeableness were found to express a reduced intention to perform unsafely, as unsafe behaviours could put their colleagues’ well-being at risk and damage interpersonal relationships as a result [27,116]. Neuroticism reduces the craving for the goal of self-control, where individuals with a high level of neuroticism were found to express a stronger intention to behave impulsively in the workplace, which could result in risky actions [27,116].

6. Discussion

6.1. Theoretical Implications

In the literature, extensive empirical evidence has shown that (1) the formation of human intentions has personality origins [27,35] and (2) individual variation in trait scores is reflected upon different scales measuring individuals’ intentions about behaving safely (e.g., “strongly proactive”, “proactive”, “neither proactive nor negative”, “reactive”, “strongly reactive”) [25,49,50,51,52]. Based on the findings, it has been suggested that the intention to engage in safety-related behaviours at the individual level can be predicted on the basis of quantifying individual variation in personality [16,47]. However, a dearth of research in the construction sector provides little empirical evidence. The studies by [22] and Zhang, Xiang, Zhang, Chen and Ren [1] called attention to this field. However, their studies are descriptive in nature and provide insufficient insights into the constitution of personality predictors for workers’ behavioural intentions, which prevents these studies from reaching an operative prediction framework. This research is an extension of the existing studies, which addresses the knowledge gap by providing a ML-based approach to help understand workers’ intentions to engage in unsafe behaviours by quantifying workers’ individual variations in personality.
There are two other knowledge gaps that are addressed in this research. First, this research finds that a nonlinear relationship exists between construction workers’ personality traits and inner intentions to engage in unsafe behaviours, as the linear method MLR was unable to satisfactorily capture the relationship and yielded greater prediction errors than the other nonlinear ML methods. Second, this research gains an enhanced understanding of the weights of each personality trait in the constitution of prediction practice for workers’ intentions to engage in unsafe behaviours.
In addition, the authors have reviewed papers that aim at predicting human behaviour in other areas such as criminal behaviour using ML techniques [113,117,118]. Our model did not have higher accuracy compared to these studies, as they have all shown fair prediction outcomes. However, our research has a technical advantage in the method design compared to these studies. These studies [113,117,118], only utilised one ML technique to develop the prediction model (e.g., k-means clustering). In our study, five ML architectures—backpropagation neural network, decision tree, support vector machine, k-nearest neighbours, and multivariate linear regression—were used to capture the predictive relationship between construction workers’ personalities and their intentions to engage in unsafe behaviours, and the five models were compared. Backpropagation neural network outperformed other algorithms, yielding minimal prediction loss, and was determined to be the best approach.

6.2. Practical Implications

The BP-NN approach can be utilised to generate quantifiable predictions to help understand the extent of workers’ intentions to engage in unsafe behaviours. According to the decisions of the ML approach, a “low safety compliance” prediction implies a stronger intention of engaging in non-compliant work behaviours such as taking shortcuts, not using safety equipment, and violating safety procedures and rules. A “low safety participation” prediction implies reduced intent to perform solicitous safety activities such as reporting co-workers’ safety problems, keeping the workplace clean, and caring for colleagues’ safety. Such knowledge is useful for understanding undesirable aspects in different workers (at the individual level) in order to recommend suitable preventive strategies for workers with different needs. Preventive strategies can be safety training programmes to promote individuals’ behavioural adherence to safety standards and desire to contribute to organisational safety. For individuals with different “safety compliance” and “safety participation” scores (predicted), variation in safety training in terms of the range of intensity can be implemented. Therefore, this study highlights the significance of predicting workers’ inner intentions to engage in unsafe behaviours for the design of safety training programmes. In the next step of this research, the safety training intensity taxonomy in relation to individuals’ prediction scores on “safety compliance” and “safety participation” will be further studied.

7. Conclusions

This research presents a machine learning (ML)-based approach to help understand workers’ inner intentions to engage in unsafe behaviours by quantifying workers’ individual variations in personality. The ML approach is based on the backpropagation neural network (BP-NN) architecture and utilises the fundamental configuration of human personality (i.e., extraversion, neuroticism, agreeableness, and conscientiousness) to predict workers’ intentions, which consist of safety compliance and safety participation dimensions.
The ML approach performed satisfactorily on the cross-validation test, yielding minimal prediction loss in the loss functions MSE, NRMSE, and MAPE for both the training and testing datasets (training dataset: MSE = 0.042, NRMSE: 0.010, and MAPE: 0.021; testing dataset: MSE = 0.047, NRMSE = 0.017, and MAPE = 0.030). Weight analysis was then performed on BP-NN to gain insights into the weights of each trait in the personality configuration for workers’ intentions to engage in safety-related behaviours, which constitutes the foundation for the modelling and prediction framework. The results showed that the weights of conscientiousness, agreeableness, neuroticism, and extraversion on workers’ safety compliance and participation intentions are 38.19% and 40.59%, 32.58% and 24.85%, 17.94% and 16.08%, and 11.29% and 18.49%, respectively. The ML approach can be utilised to generate quantifiable predictions to help understand the extent of workers’ intentions to engage in unsafe behaviours. Such knowledge is useful for understanding undesirable aspects in different workers (at the individual level) in order to recommend suitable preventive strategies for workers with different needs.
There are limitations to this research. First, due to resource constraints only a limited number of construction projects in NZ were visited to collect data. The sampling process might leave out sections of the population that could be significant to this study. Nevertheless, the researchers attempted to overcome this issue by approaching workers from as many construction sites as possible. It would be interesting for future research to expand the data collection from both New Zealand and the international construction community to test the ML approach. Second, as mentioned previously, for individuals with different “safety compliance” and “safety participation” scores (predicted), variation in safety training in terms of the range of intensity can be implemented. In the next step of this research, the safety training intensity taxonomy in relation to individuals’ prediction scores on “safety compliance” and “safety participation” will be further studied.

Author Contributions

Conceptualization, Y.G. and V.A.G.; methodology, Y.G. and V.A.G.; software, Y.G.; validation, Y.G.; formal analysis, Y.G.; investigation, Y.G.; resources, Y.G. and V.A.G.; data curation, Y.G.; writing—original draft preparation, Y.G.; writing—review and editing, Y.G., V.A.G., T.W.Y., G.C.-G. and R.D. All authors have read and agreed to the published version of the manuscript.

Funding

This research received no external funding.

Institutional Review Board Statement

The study was conducted in accordance with the Declaration of Helsinki, and approved by the UNIVERSITY OF AUCKLAND HUMAN PARTICIPANTS ETHICS COMMITTEE (protocol code 019515 and date of approval 16 June 2017).

Informed Consent Statement

Informed consent was obtained from all subjects involved in the study.

Data Availability Statement

The data that support the findings of this study are available from the corresponding author upon reasonable request.

Conflicts of Interest

The authors declare no conflict of interest.

Abbreviations

MLMachine Learning
BP-NNBackpropagation Neural Network
DTDecision Tree
SVMSupport Vector Machine
KNNK-nearest Neighbours
MLRMultivariate Linear Regression
TPBTheory of Planned Behaviour
SDTSelf-determination Theory
PPEPersonal Protective Equipment
CNNConvolutional Neural Network
MSEMean Squared Error
NRMSENormalized Root Mean Square Error
MAPEMean Absolute Percentage Error
BFIBig Five Inventory
NEO-FFINEO Five-Factor Inventory
NEO-PI-RRevised NEO Personality Inventory
FOR-BFIFrame-of-Reference Big Five Inventory
SBSSafety Behaviour Scale
SDQSafety Diagnosis Questionnaire
SCI-WHSBSafety Climate Index: Workers’ Health and Safety Behaviour
WSSWork Safety Scale
SPSSafety Performance Scale
NSCNational Safety Council

References

  1. Zhang, J.; Xiang, P.; Zhang, R.; Chen, D.; Ren, Y. Mediating Effect of Risk Propensity between Personality Traits and Unsafe Behavioral Intention of Construction Workers. J. Constr. Eng. Manag. 2020, 146, 04020023. [Google Scholar] [CrossRef]
  2. BLS. U.S. Bureau of Labor Statistics: Industry Injuries, Illnesses, and Fatalities Statistics. Available online: https://www.bls.gov/iif/oshover.htm (accessed on 16 May 2022).
  3. HSE. UK Health and Safety Executive: Statistics on Nonfatal and Fatal Injuries in the Workplace in Great Britain. Available online: http://www.hse.gov.uk/statistics/tables/index.htm (accessed on 16 May 2022).
  4. Gao, Y.; Gonzalez, V.A.; Yiu, T.W. The effectiveness of traditional tools and computer-aided technologies for health and safety training in the construction sector: A systematic review. Comput. Educ. 2019, 138, 101–115. [Google Scholar] [CrossRef] [Green Version]
  5. Li, X.; Li, H.; Skitmore, M.; Wang, F. Understanding the influence of safety climate and productivity pressure on non-helmet use behavior at construction sites: A case study. Eng. Constr. Archit. Manag. 2021. [Google Scholar] [CrossRef]
  6. Gondia, A.; Siam, A.; El-Dakhakhni, W.; Nassar, A.H. Machine Learning Algorithms for Construction Projects Delay Risk Prediction. J. Constr. Eng. Manag. 2020, 146, 04019085. [Google Scholar] [CrossRef]
  7. Leu, S.-S.; Chang, C.-M. Bayesian-network-based safety risk assessment for steel construction projects. Accid. Anal. Prev. 2013, 54, 122–133. [Google Scholar] [CrossRef] [PubMed]
  8. Patel, D.A.; Jha, K.N. Neural Network Model for the Prediction of Safe Work Behavior in Construction Projects. J. Constr. Eng. Manag. 2015, 141, 04014066. [Google Scholar] [CrossRef]
  9. Jitwasinkul, B.; Hadikusumo, B.H.W.; Memon, A.Q. A Bayesian Belief Network model of organizational factors for improving safe work behaviors in Thai construction industry. Saf. Sci. 2016, 82, 264–273. [Google Scholar] [CrossRef]
  10. Patel, D.A.; Jha, K.N. Evaluation of construction projects based on the safe work behavior of co-employees through a neural network model. Saf. Sci. 2016, 89, 240–248. [Google Scholar] [CrossRef]
  11. Patel, D.A.; Jha, K.N. Neural Network Approach for Safety Climate Prediction. J. Manag. Eng. 2015, 31, 05014027. [Google Scholar] [CrossRef]
  12. Yule, S.; Flin, R.; Murdy, A. The role of management and safety climate in preventing risk-taking at work. Int. J. Risk Assess. Manag. 2007, 7, 137–151. [Google Scholar] [CrossRef]
  13. Earle, A.M.; Napper, L.E.; LaBrie, J.W.; Brooks-Russell, A.; Smith, D.J.; de Rutte, J. Examining interactions within the theory of planned behavior in the prediction of intentions to engage in cannabis-related driving behaviors. J. Am. Coll. Health 2020, 68, 374–380. [Google Scholar] [CrossRef]
  14. Moiron, M.; Laskowski, K.L.; Niemelä, P.T. Individual differences in behaviour explain variation in survival: A meta-analysis. Ecol. Lett. 2020, 23, 399–408. [Google Scholar] [CrossRef]
  15. Guerin, R.J.; Toland, M.D. An application of a modified theory of planned behavior model to investigate adolescents’ job safety knowledge, norms, attitude and intention to enact workplace safety and health skills. J. Saf. Res. 2020, 72, 189–198. [Google Scholar] [CrossRef]
  16. Ajzen, I. From Intentions to Actions: A Theory of Planned Behavior. In Action Control: From Cognition to Behavior; Kuhl, J., Beckmann, J., Eds.; Springer: Berlin/Heidelberg, Germany, 1985; pp. 11–39. [Google Scholar] [CrossRef]
  17. Ryan, R.M.; Deci, E.L. Self-determination theory and the facilitation of intrinsic motivation, social development, and well-being. Am. Psychol. 2000, 55, 68–78. [Google Scholar] [CrossRef]
  18. Ahmed, E.; Ward, R. Analysis of factors influencing acceptance of personal, academic and professional development e-portfolios. Comput. Hum. Behav. 2016, 63, 152–161. [Google Scholar] [CrossRef]
  19. Blumstein, D.T. Applying behavioral ecology: A comment on Harding et al. Behav. Ecol. 2019, 30, 1512. [Google Scholar] [CrossRef] [Green Version]
  20. Mahdavi, A. Explanatory stories of human perception and behavior in buildings. Build. Environ. 2020, 168, 106498. [Google Scholar] [CrossRef]
  21. Thys, B.; Eens, M.; Aerts, S.; Delory, A.; Iserbyt, A.; Pinxten, R. Exploration and sociability in a highly gregarious bird are repeatable across seasons and in the long term but are unrelated. Anim. Behav. 2017, 123, 339–348. [Google Scholar] [CrossRef]
  22. Wong, D.B.; Lee, S.G. Modelling the predictors of intention in workplace safety compliance of a multi-ethnic workforce. Saf. Sci. 2016, 88, 155–165. [Google Scholar] [CrossRef]
  23. Abdelhamid, T.S.; Everett, J.G. Identifying Root Causes of Construction Accidents. J. Constr. Eng. Manag. 2000, 126, 52–60. [Google Scholar] [CrossRef]
  24. Feng, Z.; González, V.A.; Amor, R.; Lovreglio, R.; Cabrera-Guerrero, G. Immersive virtual reality serious games for evacuation training and research: A systematic literature review. Comput. Educ. 2018, 127, 252–266. [Google Scholar] [CrossRef] [Green Version]
  25. Laurent, J.; Chmiel, N.; Hansez, I. Personality and safety citizenship: The role of safety motivation and safety knowledge. Heliyon 2020, 6, e03201. [Google Scholar] [CrossRef] [Green Version]
  26. Tement, S.; Plohl, N.; Horvat, M.; Musil, B.; Jakus, G.; Sodnik, J.J.A. Is past behavior the best predictor of future behavior? Comparing the behavioral validity of self-reported speeding and driving simulator data. Age 2019, 30, 08. [Google Scholar]
  27. Hasanzadeh, S.; Dao, B.; Esmaeili, B.; Dodd Michael, D. Role of Personality in Construction Safety: Investigating the Relationships between Personality, Attentional Failure, and Hazard Identification under Fall-Hazard Conditions. J. Constr. Eng. Manag. 2019, 145, 04019052. [Google Scholar] [CrossRef] [Green Version]
  28. Gillison, F.B.; Rouse, P.; Standage, M.; Sebire, S.J.; Ryan, R.M. A meta-analysis of techniques to promote motivation for health behaviour change from a self-determination theory perspective. Health Psychol. Rev. 2019, 13, 110–130. [Google Scholar] [CrossRef]
  29. Beus, J.M.; Dhanani, L.Y.; McCord, M.A. A meta-analysis of personality and workplace safety: Addressing unanswered questions. J. Appl. Psychol. 2015, 100, 481–498. [Google Scholar] [CrossRef]
  30. Mentrikoski, J.M.; Duncan, C.L.; Enlow, P.T.; Aballay, A.M. Predicting Adolescents’ Intentions to Engage in Fire Risk Behaviors: An Application of the Theory of Planned Behavior. Burns 2019, 45, 1242–1250. [Google Scholar] [CrossRef] [PubMed] [Green Version]
  31. Neves, H.C.C.; Silva e Souza, A.C.; Medeiros, M.; Munari, D.B.; Ribeiro, L.C.M.; Tipple, A.F.V. Safety of nursing staff and determinants of adherence to personal protective equipment. Rev. Lat.-Am. Enferm. 2011, 19, 354–361. [Google Scholar] [CrossRef] [Green Version]
  32. Rose, A.; Rae, W.I.D. Personal Protective Equipment Availability and Utilization among Interventionalists. Saf. Health Work 2019, 10, 166–171. [Google Scholar] [CrossRef] [PubMed]
  33. Arsenie, P.; Hanzu-Pazara, R. Human errors and oil pollution from tankers. Int. J. Mar. Navig. Saf. Sea Transp. 2008, 2, 409–413. Available online: https://yadda.icm.edu.pl/baztech/element/bwmeta1.element.baztech-0d29bbbf-d521-4614-b65b-ff88524dc731 (accessed on 16 May 2022).
  34. Baldissone, G.; Comberti, L.; Bosca, S.; Murè, S. The analysis and management of unsafe acts and unsafe conditions. Data collection and analysis. Saf. Sci. 2019, 119, 240–251. [Google Scholar] [CrossRef]
  35. Jiang, Z.; Fang, D.; Zhang, M. Understanding the Causation of Construction Workers’ Unsafe Behaviors Based on System Dynamics Modeling. J. Manag. Eng. 2015, 31, 04014099. [Google Scholar] [CrossRef] [Green Version]
  36. Shakerian, M.; Jahangiri, M.; Alimohammadlou, M.; Nami, M.; Choobineh, A. Individual cognitive factors affecting unsafe acts among Iranian industrial workers: An integrative meta-synthesis interpretive structural modeling (ISM) approach. Saf. Sci. 2019, 120, 89–98. [Google Scholar] [CrossRef]
  37. Norman, P.; Webb, T.L.; Millings, A. Using the theory of planned behaviour and implementation intentions to reduce binge drinking in new university students. Psychol. Health 2019, 34, 478–496. [Google Scholar] [CrossRef]
  38. Li, A.S.W.; Figg, G.; Schüz, B. Socioeconomic Status and the Prediction of Health Promoting Dietary Behaviours: A Systematic Review and Meta-Analysis Based on the Theory of Planned Behaviour. Appl. Psychol. Health Well-Being 2019, 11, 382–406. [Google Scholar] [CrossRef]
  39. Hakim, J.D.; Chami, J.; Keay, K.A. μ-Opioid and dopamine-D2 receptor expression in the nucleus accumbens of male Sprague-Dawley rats whose sucrose consumption, but not preference, decreases after nerve injury. Behav. Brain Res. 2020, 381, 112416. [Google Scholar] [CrossRef]
  40. Corr, P.J.; Matthews, G. The Cambridge Handbook of Personality Psychology; Cambridge University Press: Cambridge, UK, 2009; Available online: https://www.cambridge.org/core/books/cambridge-handbook-of-personality-psychology/8E0820BD8B627FB17B009A34E81A5DEB (accessed on 16 May 2022).
  41. Delvecchio, G.; Bellani, M.; Altamura, A.C.; Brambilla, P. The association between the serotonin and dopamine neurotransmitters and personality traits. Epidemiol. Psychiatr. Sci. 2016, 25, 109–112. [Google Scholar] [CrossRef] [Green Version]
  42. Hennig, J.; Netter, P.; Munk, A.J.L. Interaction between serotonin and dopamine and impulsivity: A gene × gene—Interaction approach. Personal. Individ. Differ. 2020, 169, 110014. [Google Scholar] [CrossRef]
  43. Fong, M.; Zhao, K.; Smillie, L.D. Personality and competitiveness: Extraversion, agreeableness, and their aspects, predict self-reported competitiveness and competitive bidding in experimental auctions. Personal. Individ. Differ. 2020, 169, 109907. [Google Scholar] [CrossRef]
  44. Huang, M.-W.; Chiang, T.-A.; Lo, P.-Y.; Huang, C.-S. Relationship among methadone dose, polymorphisms of dopamine D2 receptor and tri-dimensional personality questionnaire in heroin-addicted patients. Behav. Brain Funct. 2016, 12, 24. [Google Scholar] [CrossRef] [Green Version]
  45. London, E.D. Human Brain Imaging Links Dopaminergic Systems to Impulsivity; Springer: Berlin/Heidelberg, Germany, 2020. [Google Scholar]
  46. Hosken, D.J.; Hunt, J.; Wedell, N. Genes and Behaviour: Beyond Nature-Nurture; John Wiley & Sons: Hoboken, NJ, USA, 2019. [Google Scholar]
  47. Bell, A.M.; Hankison, S.J.; Laskowski, K.L. The repeatability of behaviour: A meta-analysis. Anim. Behav. 2009, 77, 771–783. [Google Scholar] [CrossRef] [PubMed] [Green Version]
  48. Barańczuk, U. The five factor model of personality and emotion regulation: A meta-analysis. Personal. Individ. Differ. 2019, 139, 217–227. [Google Scholar] [CrossRef]
  49. Pletzer, J.L.; Bentvelzen, M.; Oostrom, J.K.; de Vries, R.E. A meta-analysis of the relations between personality and workplace deviance: Big Five versus HEXACO. J. Vocat. Behav. 2019, 112, 369–383. [Google Scholar] [CrossRef]
  50. Pei, W.; Xiao, D. Curriculum Development and Research on Construction Safety Psychology and Behavior. In Proceedings of the 2017 2nd International Seminar on Education Innovation and Economic Management (SEIEM 2017), Penang, Malaysia, 28–30 December 2017; pp. 270–273. [Google Scholar] [CrossRef] [Green Version]
  51. Fischer, R.; Lee, A.; Verzijden, M.N. Dopamine genes are linked to Extraversion and Neuroticism personality traits. Sci. Rep. 2018, 8, 1733. [Google Scholar] [CrossRef] [Green Version]
  52. Ray, S.; Fritzon, K. Overview of the Impact of Psychopathy and Other Problematic Personality Constructs in the Workplace. In Corporate Psychopathy: Investigating Destructive Personalities in the Workplace; Fritzon, K., Brooks, N., Croom, S., Eds.; Springer International Publishing: Cham, Switzerland, 2020; pp. 199–253. [Google Scholar] [CrossRef]
  53. Isler, L.; Fletcher, G.J.O.; Liu, J.H.; Sibley, C.G. Validation of the four-profile configuration of personality types within the Five-Factor Model. Personal. Individ. Differ. 2017, 106, 257–262. [Google Scholar] [CrossRef]
  54. Castanier, C.; Scanff, C.L.; Woodman, T. Who Takes Risks in High-Risk Sports? A Typological Personality Approach. Res. Q. Exerc. Sport 2013, 81, 478–484. [Google Scholar] [CrossRef]
  55. Landay, K.; Wood, D.; Harms, P.D.; Ferrell, B.; Nambisan, S. Relationships between personality facets and accident involvement among truck drivers. J. Res. Personal. 2020, 84, 103889. [Google Scholar] [CrossRef]
  56. Gao, Y.; Gonzalez, V.A.; Yiu, T.W. Exploring the Relationship between Construction Workers’ Personality Traits and Safety Behaviour. J. Constr. Eng. Manag. 2020, 146, 04019111. [Google Scholar] [CrossRef]
  57. Rau, P.-L.P.; Liao, P.-C.; Guo, Z.; Zheng, J.; Jing, B. Personality factors and safety attitudes predict safety behaviour and accidents in elevator workers. Int. J. Occup. Saf. Ergon. 2018, 1, 719–727. [Google Scholar] [CrossRef]
  58. Panuwatwanich, K.; Al-Haadir, S.; Stewart, R.A. Influence of safety motivation and climate on safety behaviour and outcomes: Evidence from the Saudi Arabian construction industry. Int. J. Occup. Saf. Ergon. 2017, 23, 60–75. [Google Scholar] [CrossRef]
  59. Alloghani, M.; Al-Jumeily, D.; Mustafina, J.; Hussain, A.; Aljaaf, A.J. A Systematic Review on Supervised and Unsupervised Machine Learning Algorithms for Data Science. In Supervised and Unsupervised Learning for Data Science; Berry, M.W., Mohamed, A., Yap, B.W., Eds.; Springer International Publishing: Cham, Switzerland, 2020; pp. 3–21. [Google Scholar] [CrossRef]
  60. Antwi-Afari, M.F.; Li, H.; Yu, Y.; Kong, L. Wearable insole pressure system for automated detection and classification of awkward working postures in construction workers. Autom. Constr. 2018, 96, 433–441. [Google Scholar] [CrossRef]
  61. Tümer, A.E.; Edebali, S. Modeling of Trivalent Chromium Sorption onto Commercial Resins by Artificial Neural Network. Appl. Artif. Intell. 2019, 33, 349–360. [Google Scholar] [CrossRef]
  62. Jorgensen, B. Theory of Linear Models; Routledge: New York, NY, USA, 2019. [Google Scholar] [CrossRef]
  63. Linnainmaa, S. The Representation of the Cumulative Rounding Error of an Algorithm as a Taylor Expansion of the Local Rounding Errors. Master’s Thesis, University of Helsinki, Helsinki, Finland, 1970. [Google Scholar]
  64. Quinlan, J.R. Induction of decision trees. Mach. Learn. 1986, 1, 81–106. [Google Scholar] [CrossRef] [Green Version]
  65. Boser, B.E.; Guyon, I.M.; Vapnik, V.N. A training algorithm for optimal margin classifiers. In Proceedings of the Fifth Annual Workshop on Computational Learning Theory, Pittsburgh, PA, USA, 27–29 July 1992; pp. 144–152. [Google Scholar] [CrossRef]
  66. Altman, N.S. An Introduction to Kernel and Nearest-Neighbor Nonparametric Regression. Am. Stat. 1992, 46, 175–185. [Google Scholar] [CrossRef] [Green Version]
  67. Mardia, K.; Kent, J.; Bibby, J. Multivariate Analysis; Academic Press Inc.: Cambridge, MA, USA, 1979; Volume 15, p. 518. Available online: https://www.elsevier.com/books/multivariate-analysis/mardia/978-0-08-057047-1 (accessed on 16 May 2022).
  68. Sony, S.; Dunphy, K.; Sadhu, A.; Capretz, M. A systematic review of convolutional neural network-based structural condition assessment techniques. Eng. Struct. 2021, 226, 111347. [Google Scholar] [CrossRef]
  69. Gao, C.; Elzarka, H. The use of decision tree based predictive models for improving the culvert inspection process. Adv. Eng. Inform. 2021, 47, 101203. [Google Scholar] [CrossRef]
  70. Amin, S. Backpropagation—Artificial Neural Network (BP-ANN): Understanding gender characteristics of older driver accidents in West Midlands of United Kingdom. Saf. Sci. 2020, 122, 104539. [Google Scholar] [CrossRef]
  71. Hongtao, N. Smart safety early warning model of landslide geological hazard based on BP neural network. Saf. Sci. 2020, 123, 104572. [Google Scholar] [CrossRef]
  72. Christodoulou, E.; Ma, J.; Collins, G.S.; Steyerberg, E.W.; Verbakel, J.Y.; Van Calster, B. A systematic review shows no performance benefit of machine learning over logistic regression for clinical prediction models. J. Clin. Epidemiol. 2019, 110, 12–22. [Google Scholar] [CrossRef]
  73. Bai, Y.; Chen, Z.; Xie, J.; Li, C. Daily reservoir inflow forecasting using multiscale deep feature learning with hybrid models. J. Hydrol. 2016, 532, 193–206. [Google Scholar] [CrossRef]
  74. Costa, P.T.; McCrae, R.R.; Löckenhoff, C.E. Personality Across the Life Span. Annu. Rev. Psychol. 2019, 70, 423–448. [Google Scholar] [CrossRef]
  75. Hofmann, D.A.; Burke, M.J.; Zohar, D. 100 years of occupational safety research: From basic protections and work analysis to a multilevel view of workplace safety and risk. J. Appl. Psychol. 2017, 102, 375–388. [Google Scholar] [CrossRef]
  76. John, O.P.; Donahue, E.M.; Kentle, R.L. The Big Five Inventory—Versions 4a and 54. Available online: https://www.ocf.berkeley.edu/~johnlab/bfi.php (accessed on 16 May 2022).
  77. Costa, P.T.; McCrae, R.R. NEO Five-Factor Inventory (NEO-FFI). Available online: https://www.parinc.com/Products/Pkey/274 (accessed on 16 May 2022).
  78. Costa, P.T.; McCrae, R.R. Revised NEO Personality Inventory (NEO PI-R) and NEO Five-Factor Inventory (NEO-FFI): Professional Manual; Psychological Assessment Resources, Incorporated: Lutz, FL, USA, 1992; Available online: https://books.google.co.nz/books?id=D5CdtwAACAAJ (accessed on 16 May 2022).
  79. Schmit, M.J.; Ryan, A.M.; Stierwalt, S.L.; Powell, A.B. Frame-of-Reference Effects on Personality Scale Scores and Criterion-Related Validity. J. Appl. Psychol. 1995, 80, 607–620. [Google Scholar] [CrossRef]
  80. Soutter, A.R.B.; Bates, T.C.; Mõttus, R. Big Five and HEXACO Personality Traits, Proenvironmental Attitudes, and Behaviors: A Meta-Analysis. Perspect. Psychol. Sci. 2020, 15, 913–941. [Google Scholar] [CrossRef]
  81. Feher, A.; Vernon, P.A. Looking beyond the Big Five: A selective review of alternatives to the Big Five model of personality. Personal. Individ. Differ. 2020, 169, 110002. [Google Scholar] [CrossRef]
  82. Kerry, N.; Murray, D.R. Strong personalities: Investigating the relationships between grip strength, self-perceived formidability, and Big Five personality traits. Personal. Individ. Differ. 2018, 131, 216–221. [Google Scholar] [CrossRef]
  83. Hamby, T.; Taylor, W.; Snowden, A.K.; Peterson, R.A. A Meta-Analysis of the Reliability of Free and For-Pay Big Five Scales. J. Psychol. 2016, 150, 422–430. [Google Scholar] [CrossRef]
  84. Kunnel John, R.; Xavier, B.; Waldmeier, A.; Meyer, A.; Gaab, J. Psychometric Evaluation of the BFI-10 and the NEO-FFI-3 in Indian Adolescents. Front. Psychol. 2019, 10, 1057. [Google Scholar] [CrossRef] [PubMed] [Green Version]
  85. Beckmann, N.; Birney, D.P.; Beckmann, J.F.; Wood, R.E.; Sojo, V.; Bowman, D. Inter-individual differences in intra-individual variability in personality within and across contexts. J. Res. Personal. 2020, 85, 103909. [Google Scholar] [CrossRef]
  86. Anglim, J.; O’Connor, P. Measurement and research using the Big Five, HEXACO, and narrow traits: A primer for researchers and practitioners. Aust. J. Psychol. 2019, 71, 16–25. [Google Scholar] [CrossRef] [Green Version]
  87. Swift, V.; Peterson, J.B. Contextualization as a means to improve the predictive validity of personality models. Personal. Individ. Differ. 2019, 144, 153–163. [Google Scholar] [CrossRef]
  88. Simonet, D.V.; Castille, C.M. The search for meaningful work: A network analysis of personality and the job characteristics model. Personal. Individ. Differ. 2020, 152, 109569. [Google Scholar] [CrossRef]
  89. Woo, S.E.; Jin, J.; LeBreton, J.M. Specificity Matters: Criterion-Related Validity of Contextualized and Facet Measures of Conscientiousness in Predicting College Student Performance. J. Personal. Assess. 2015, 97, 301–309. [Google Scholar] [CrossRef]
  90. Hirschfeld, R.R.; Lawson, L. Predicting Individuals’ Interest After a Performance Result: The Roles of Motivational Orientations at High and Low Performance. J. Appl. Soc. Psychol. 2008, 38, 557–584. [Google Scholar] [CrossRef]
  91. Wang, Q.; Bowling, N.A. A Comparison of General and Work-specific Personality Measures as Predictors of Organizational Citizenship Behavior. Int. J. Sel. Assess. 2016, 24, 172–188. [Google Scholar] [CrossRef]
  92. Shaffer, J.A.; Postlethwaite, B.E. A Matter of Context: A Meta-Analytic Investigation of the Relative Validity of Contextualized and Noncontextualized Personality Measures. Pers. Psychol. 2012, 65, 445–494. [Google Scholar] [CrossRef]
  93. Smith, R.W.; DeNunzio, M.M. Examining personality—Job characteristic interactions in explaining work outcomes. J. Res. Personal. 2020, 84, 103884. [Google Scholar] [CrossRef]
  94. Hayes, B.E.; Perander, J.; Smecko, T.; Trask, J. Measuring perceptions of workplace safety: Development and validation of the work safety scale. J. Saf. Res. 1998, 29, 145–161. [Google Scholar] [CrossRef]
  95. Hoyos, C.G.; Ruppert, F. Safety diagnosis in industrial work settings: The safety diagnosis questionnaire. J. Saf. Res. 1995, 26, 107–117. [Google Scholar] [CrossRef]
  96. Garcia, A.M.; Boix, P.; Canosa, C. Why do workers behave unsafely at work? Determinants of safe work practices in industrial workers. Occup. Environ. Med. 2004, 61, 239–246. [Google Scholar] [CrossRef]
  97. Mearns, K.; Flin, R.; Gordon, R.; Fleming, M. Human and organizational factors in offshore safety. Work Stress 2001, 15, 144–160. [Google Scholar] [CrossRef]
  98. Griffin, M.A.; Neal, A. Perceptions of safety at work: A framework for linking safety climate to safety performance, knowledge, and motivation. J. Occup. Health Psychol. 2000, 5, 347–358. [Google Scholar] [CrossRef] [PubMed]
  99. Singh, A.; Misra, S.C. A Dominance based Rough Set analysis for investigating employee perception of safety at workplace and safety compliance. Saf. Sci. 2020, 127, 104702. [Google Scholar] [CrossRef]
  100. Müller, S.L.; Shehadeh, M.A.; Schröder, S.; Richert, A.; Jeschke, S. An overview of work analysis instruments for hybrid production workplaces. AI Soc. 2018, 33, 425–432. [Google Scholar] [CrossRef]
  101. Ugwu, F.O.; Idike, A.N.; Ibiam, O.E.; Akwara, F.A.; Okorie, C.O. Transformational leadership and management safety practices: Their role in the relationship between work pressure and compliance with safety work behaviour in a health-care sector industry. J. Psychol. Afr. 2020, 30, 1–8. [Google Scholar] [CrossRef]
  102. Stratman, J.L.; Youssef-Morgan, C.M. Can positivity promote safety? Psychological capital development combats cynicism and unsafe behavior. Saf. Sci. 2019, 116, 13–25. [Google Scholar] [CrossRef]
  103. Wen Lim, H.; Li, N.; Fang, D.; Wu, C. Impact of Safety Climate on Types of Safety Motivation and Performance: Multigroup Invariance Analysis. J. Manag. Eng. 2018, 34, 04018002. [Google Scholar] [CrossRef]
  104. Reddy, A.S.B.; Juliet, D.S. Transfer Learning with ResNet-50 for Malaria Cell-Image Classification. In Proceedings of the 2019 International Conference on Communication and Signal Processing (ICCSP), Chennai, India, 4–6 April 2019; pp. 0945–0949. [Google Scholar] [CrossRef]
  105. Krzykowska, K.; Krzykowski, M. Forecasting Parameters of Satellite Navigation Signal through Artificial Neural Networks for the Purpose of Civil Aviation. Int. J. Aerosp. Eng. 2019, 2019, 7632958. [Google Scholar] [CrossRef]
  106. Singaravel, S.; Suykens, J.; Geyer, P. Deep-learning neural-network architectures and methods: Using component-based models in building-design energy prediction. Adv. Eng. Inform. 2018, 38, 81–90. [Google Scholar] [CrossRef]
  107. Desai, S.D.; Giraddi, S.; Narayankar, P.; Pudakalakatti, N.R.; Sulegaon, S. Back-Propagation Neural Network Versus Logistic Regression in Heart Disease Classification. In Advanced Computing and Communication Technologies; Springer: Singapore, 2019; pp. 133–144. [Google Scholar]
  108. Lafif Tej, M.; Holban, S. Determining Optimal Multi-layer Perceptron Structure Using Linear Regression. In Business Information Systems—BIS 2019; Springer: Cham, Switzerland, 2019; pp. 232–246. [Google Scholar]
  109. Velasco, L.C.P.; Estoperez, N.R.; Jayson, R.J.R.; Sabijon, C.J.T.; Sayles, V.C. Performance Analysis of Artificial Neural Networks Training Algorithms and Activation Functions in Day-Ahead Base, Intermediate, and Peak Load Forecasting. In Advances in Information and Communication; Springer: Cham, Switzerland, 2020; pp. 284–298. [Google Scholar] [CrossRef]
  110. Scardapane, S.; Van Vaerenbergh, S.; Totaro, S.; Uncini, A. Kafnets: Kernel-based non-parametric activation functions for neural networks. Neural Netw. 2019, 110, 19–32. [Google Scholar] [CrossRef] [Green Version]
  111. Yang, L.; Liu, S.; Tsoka, S.; Papageorgiou, L.G. A regression tree approach using mathematical programming. Expert Syst. Appl. 2017, 78, 347–357. [Google Scholar] [CrossRef] [Green Version]
  112. Liu, M.; Zou, L.; Yu, X.; Zhou, Y.; Wang, X.; Tang, B. Knowledge Aided Covariance Matrix Estimation via Gaussian Kernel Function for Airborne SR-STAP. IEEE Access 2020, 8, 5970–5978. [Google Scholar] [CrossRef]
  113. Lajunen, T. Personality and accident liability: Are extraversion, neuroticism and psychoticism related to traffic and occupational fatalities? Personal. Individ. Differ. 2001, 31, 1365–1373. [Google Scholar] [CrossRef]
  114. Garson, G.D. Interpreting Neural-Network Connection Strengths. AI Expert 1991, 6, 46–51. [Google Scholar]
  115. Lee, S.; Lee, K.-K.; Yoon, H. Using artificial neural network models for groundwater level forecasting and assessment of the relative impacts of influencing factors. Hydrogeol. J. 2019, 27, 567–579. [Google Scholar] [CrossRef]
  116. Sharifi, Y.; Hosseinpour, M.; Moghbeli, A.; Sharifi, H. Lateral Torsional Buckling Capacity Assessment of Castellated Steel Beams Using Artificial Neural Networks. Int. J. Steel Struct. 2019, 19, 1408–1420. [Google Scholar] [CrossRef]
  117. Clarke, S.; Robertson, I.T. A meta-analytic review of the Big Five personality factors and accident involvement in occupational and non-occupational settings. J. Occup. Organ. Psychol. 2005, 78, 355–376. [Google Scholar] [CrossRef]
  118. Barrick, M.R.; Mount, M.K.; Li, N. The Theory of Purposeful Work Behavior: The Role of Personality, Higher-Order Goals, and Job Characteristics. Acad. Manag. Rev. 2013, 38, 132–153. [Google Scholar] [CrossRef]
Figure 1. (a) Conceptual model; (b) Simulink model.
Buildings 12 00841 g001
Figure 2. The architecture of utilised machine learning algorithms: (a) neural network; (b) decision tree; (c) support vector machine; (d) K-nearest neighbours; (e) multivariate linear regression.
Buildings 12 00841 g002
Figure 3. max_depth, min_sample_split—loss functions (MSE, NRMSE, and MAPE) diagram.
Buildings 12 00841 g003
Figure 4. σ 2 , ω , b —loss functions (MSE, NRMSE, and MAPE) diagram: (a) for safety compliance prediction; (b) for safety participation prediction.
Buildings 12 00841 g004
Figure 5. KNN space.
Buildings 12 00841 g005
Figure 6. k-value—loss functions (MSE, NRMSE, and MAPE) diagram.
Buildings 12 00841 g006aBuildings 12 00841 g006b
Figure 7. Actual–predicted plot (safety compliance and participation intentions).
Buildings 12 00841 g007
Table 1. Scales of personality dimensions.
ExtraversionConscientiousnessAgreeablenessNeuroticism
Scale 1Strongly ExtravertStrongly ConscientiousStrongly AgreeableStrongly Neurotic
Scale 2ExtravertConscientiousAgreeableNeurotic
Scale 3Neither Extravert Nor IntrovertNeither Conscientious Nor UnconscientiousNeither Agreeable Nor DisagreeableNeither Neurotic Nor Stable
Scale 4IntrovertUnconscientiousDisagreeableStable
Scale 5Strongly IntrovertStrongly UnconscientiousStrongly DisagreeableStrongly Stable
Table 2. Demographic characteristics.
FeaturesCategoriesRespondents
FrequencyPercentile (%)
Age Range20–2916461.2
30–397528.0
40–492710.1
>5020.7
Work Experience (Years)0–513249.3
6–104516.7
11–153412.7
16–203613.4
>20217.9
Type of TradeMason4416.4
Carpenter and Joiner207.5
Electrician134.9
Foreman114.1
Miscellaneous Labourer8431.3
Plant Operator259.3
Plumber249.0
Welder259.3
Project Manager155.6
Painter72.6
Table 3. MSE, NRMSE, and MAPE for algorithm optimisation on the training dataset.
ML AlgorithmsSafety Compliance IntentionSafety Participation Intention
MSENRMSEMAPEMSENRMSEMAPE
BP-NN0.0420.0100.0210.0730.0220.027
DT0.0510.0130.0280.103 0.0550.076
SVM0.1130.0430.0470.107 0.0370.047
KNN0.0670.0200.0300.075 0.0230.027
MLR0.4500.1620.1740.634 0.1890.213
Table 4. MSE, NRMSE, and MAPE results on BP-NN training with varying numbers of hidden neurons and layers.
Results on Safety Compliance
Number of Hidden NeuronsNumber of Hidden Layers = 1Number of Hidden Layers = 2
MSENRMSEMAPEMSENRMSEMAPE
40.2030.0510.1230.4530.1130.228
50.2340.0590.1420.3420.0860.181
60.1760.0440.0880.3110.0780.156
70.0990.0250.0510.2970.0810.149
80.0420.0100.0210.1250.0320.065
Results on Safety Participation
Number of Hidden NeuronsNumber of Hidden Layers = 1Number of Hidden Layers = 2
MSENRMSEMAPEMSENRMSEMAPE
40.2570.0640.1420.5510.1370.286
50.1920.0480.1320.3670.0920.184
60.1630.0410.0820.3240.0850.162
70.1030.0260.0520.2850.0730.143
80.0730.0220.0270.1120.0250.051
Table 5. MSE, NRMSE, and MAPE results on BP-NN training with varying combinations of activation functions in hidden and output layers.
Activation FunctionsResults on Safety ComplianceResults on Safety Participation
Hidden LayerOutput LayerMSENRMSEMAPEMSENRMSEMAPE
ReLUSoftPlus0.1320.0350.0760.2510.0620.125
ReLUtansig0.6510.1620.3250.7230.1800.361
ReLUlogsig0.4420.1100.2210.5710.1420.285
ReLUpurelin0.0870.0220.0440.0960.0240.048
SoftPlusReLU0.4240.1060.2120.5710.1420.285
SoftPlustansig0.8710.2180.4360.9560.2390.478
SoftPluslogsig0.6540.1640.3270.5900.1470.295
SoftPluspurelin0.2450.0610.1230.3290.0820.164
tansigReLU0.0420.0100.0210.0730.0220.027
tansigSoftPlus0.1340.0340.0670.1890.0470.094
tansiglogsig0.4650.1160.2320.4670.1160.233
tansigpurelin0.5890.1470.2950.6740.1680.337
logsigReLU0.2430.0610.1220.3860.0960.193
logsigSoftPlus0.3510.0880.1750.4670.1160.233
logsigtansig0.0890.0220.0440.0570.0140.028
logsigpurelin0.1670.0410.0830.1890.0470.094
purelinReLU0.0920.0230.0460.0890.0220.044
purelinSoftPlus0.6320.1580.3160.7890.1970.394
purelintansig0.5620.1400.2810.6840.1710.342
purelinlogsig0.3670.0910.1840.4790.1190.239
Table 6. BP-NN weights and biases.
Input/Output Neurons (Ij/Oi)Weights/BiasHidden Neurons (Hk)
H1H2H3H4H5H6H7H8
I1 w 1 , k I H 0.6170.100−0.4590.0653.9251.4343.006−2.514
I2 w 2 , k I H −4.3681.439−2.9760.3423.888−0.6711.4561.332
I3 w 3 , k I H 1.888−1.0362.561−0.369−0.734−8.384−1.2241.200
I4 w 4 , k I H 2.222−0.7221.070−0.186−1.412−0.7833.4610.957
b i a s k H −1.303−1.2552.168−0.1360.1903.7763.004−5.919
O1 w k , 1 H O −0.4692.4930.325−5.3340.2001.5350.0381.301
O2 w k , 2 H O −0.717−0.363−1.189−4.9060.2844.369−0.8263.982
b i a s i O 0.774 (for O1)0.513 (for O2)
Table 7. MSE, NRMSE, and MAPE for predictions on safety compliance and participation intentions.
ML AlgorithmsSafety Compliance IntentionSafety Participation Intention
MSENRMSEMAPEMSENRMSEMAPE
NN0.0470.0170.0270.080 0.0230.030
DT0.0610.0210.0330.110 0.0300.045
SVM0.1070.0410.0370.093 0.0270.041
KNN0.0830.0230.0420.087 0.0270.032
MLR0.4310.1590.1620.6160.1740.193
Table 8. BP-NN weights.
Input/Output Neurons (Ij/Oi)WeightsHidden Neurons (Hk)
H1H2H3H4H5H6H7H8
I1 w 1 , k I H 0.6170.100−0.4590.0653.9251.4343.006−2.514
I2 w 2 , k I H −4.3681.439−2.9760.3423.888−0.6711.4561.332
I3 w 3 , k I H 1.888−1.0362.561−0.369−0.734−8.384−1.2241.200
I4 w 4 , k I H 2.222−0.7221.070−0.186−1.412−0.7833.4610.957
O1 w k , 1 H O −0.4692.4930.325−5.3340.2001.5350.0381.301
O2 w k , 2 H O −0.717−0.363−1.189−4.9060.2844.369−0.8263.982
Note: N j = the number of input neurons ( N j = 4); N k = the number of hidden neurons ( N k = 8); w j , k I H = weight between the jth input neuron and kth hidden neuron; w k , i H O = weight between the kth hidden neuron and ith output neuron.
Table 9. Weights of personality configuration on workers’ safety behavioural intentions.
Personality ConfigurationWeights on Safety Behavioural Intentions (%)
Safety Compliance IntentionSafety Participation Intention
Extraversion11.2918.48
Agreeableness32.5824.85
Conscientiousness38.1940.59
Neuroticism17.9416.08
Overall100.00100.00
Publisher’s Note: MDPI stays neutral with regard to jurisdictional claims in published maps and institutional affiliations.

