Article

Identification of Urban Functional Areas Based on the Multimodal Deep Learning Fusion of High-Resolution Remote Sensing Images and Social Perception Data

Department of Geography and Spatial Information Techniques, Ningbo University, Ningbo 315211, China
*
Author to whom correspondence should be addressed.
Buildings 2022, 12(5), 556; https://doi.org/10.3390/buildings12050556
Submission received: 1 April 2022 / Revised: 20 April 2022 / Accepted: 22 April 2022 / Published: 27 April 2022
(This article belongs to the Collection Strategies for Sustainable Urban Development)

Abstract

:
As the basic spatial unit of urban planning and management, it is necessary to know the distribution status of urban functional areas in time. Due to the complexity of urban land use, it is difficult to identify the urban functional areas using only remote sensing images. Social perception data can provide additional information for the identification of urban functional areas. However, the sources of remote sensing data and social perception data differ, with some differences in data forms. Existing methods cannot comprehensively consider the characteristics of these data for functional area identification. Therefore, in this study, we propose a multimodal deep learning method with an attention mechanism to fully utilize the data features of these two modalities and apply it to the recognition of urban functional areas. First, the pre-processed remote sensing images, points of interest, and building footprint data are divided into block-based target units of features by the road network. Next, the remote sensing image features and social perception data features of the target unit are extracted separately using a two-branch convolutional network. Finally, features are extracted sequentially along two separate dimensions, being channel and spatial, to generate an attention weight map for the identification and classification mapping of urban functional areas. The model framework was finally applied to the Ningbo dataset for testing, and the recognition accuracy was above 93%. The experimental results deduce, as a whole, that the prediction performance of the deep multimodal fusion model framework with an attention mechanism is comparatively superior to other traditional methods. It can provide a reference for the classification of urban land use and provide data support for urban planning and management.

1. Introduction

Urban functional areas are the important spatial carriers of various urban economic and social functions, as well as the specific performance units of natural and socio-economic resources. As rapid urbanization is taking place around the world, various elements are being taken into different spaces of the city, thus forming functional area differentiation at different regional scales. As such, unreasonable urban planning will lead to an array of tangible problems, such as a single-function structure, spatial differentiation, and improper resource allocation in cities. Therefore, accurately identifying the urban spatial and social structures is important to reasonably delineate urban functional areas, thereby functionally coordinating human-land relations, effectively optimizing urban spatial strategies, and improving urban planning [1,2,3,4,5,6].
With accelerated advances in remote sensing technology, we are able to acquire high-resolution satellite and aerial imagery, allowing us obtain more texture detail from high-altitude images than ever before. Traditionally, urban functional zone identification relies on planning maps of land use and field surveys. Nevertheless, the survey-based methodology often consumes significant labor resources and a large amount of time, and even the reliability is presumably influenced by the subjectivity of human perceptions. Moreover, the information obtained from a single data source is not comprehensive enough and is, therefore, limited. There is enormous potential in extracting and analyzing the functions of urban areas from high-resolution spatial remote sensing imagery, which influences the evolution of research regarding urbanization. Further, this technique has proven to be one of the most convenient and effective methods in many applications such as Earth observation and urban structure analysis [7,8,9]. For instance, Pacifici [10] employed multi-scale texture metrics from very high-resolution panchromatic images to classify urban land use categories. Pacifici’s outcomes demonstrate that, in a multi-scale approach, it is possible to discriminate different asphalt surfaces, such as roads, highways, and parking lots due to the different textural information content. Later, Soe [11] experimentally verified that the spectral information presented by pixels plays a pivotal role in the process of classification. Zhang [12] developed a joint deep learning model that fully incorporates a multilayer perceptron (MLP) and convolutional neural network to enhance the spatial and spectral representation, subsequently achieving land refinement classification. Li [13] completed the urban land classification based on the geometric, morphological, and contextual attributes of the target objects with the corresponding land use indicators. However, most of these studies employ physical features of ground components (e.g., spectral, shape, and textural features) to extract urban land use patterns, which can only be associated with low-level semantic land covered with the information of ground features, and it is difficult to harvest high-level semantic information of urban spatial structures [14,15,16,17,18].
It is noteworthy to mention that the fusion of remote sensing images with social perception data is a new, alternative direction [19]. A series of recent studies have reflected that the exploitation of social sensing data, such as Point of Interest (POI), taxi track data, cell phone data, social media data, and street view data, performs well in identifying functional urban areas [20,21,22,23,24,25]. Take, for example, the case of TU [26] combining remotely sensed images with cell phone location data, landscape, and activity indicators that are calculated to cluster functional areas. Gong [27] combined nighttime remote sensing images, satellite images, POI, and cell phone data in order to create a national land use map. Liu [28] integrates probabilistic thematic models and support vector machines (SVM) to fuse natural physical features from high-resolution images and socio-economic semantic features from multi-source social media data, working to build a lexicon of land use words in a framework to analyze fine-grained urban structures and to monitor urban land use changes. These studies encourage the great potential of multimodal data in revealing the functional zoning of urban areas.
However, remotely sensed and socially sensed data are relatively different in terms of sources and modalities. In general, remotely sensed images cover a study area, where as social sensing data are location-based and are represented as points, dashes, or polygons. In addition, the features of social sensing data may be time-based rather than space-based [29]. To fuse these two types of multi-source and multi-modal data is not an easy task, especially when mitigating the modal gaps and heterogeneity between them [30,31]. Nicolas [32] exploited the multi-source satellite sensor data through an improved Segnet network, thus providing better performance for urban feature recognition compared to the one that uses fully connected convolutional networks (FCN). Cao [33] integrated the long short-term memory (LSTM) extraction of user time series feature data with Resnet extraction of remote sensing image features as it seeks to work out functional area identification. Although the extracted modal data features are able to accomplish the classification task, the features independently existed without any interrelationship between them. It is likely that when the deficiency occurred in data collecting, the recognition effect could be influenced by the gap between data forms.
Deep-learning-based fusion methods have great potential for integrating multi-source, multi-modal remote sensing and social remote sensing data. Significant improvements have been made in many domains so far, including hyperspectral image analysis [34], image scene classification [35], target detection [36], and so forth. The main advantage of deep learning methods lies in its capability of learning high-level features from large amounts of data automatically, which is crucial to bridge the gap between different data patterns at the feature level. In particular, the recently emerged attention mechanism [37] further strengthens the feature representation and advances the functions of multi-source multimodal data in urban functional area identification applications.
In this paper, we propose a deep-learning-based framework where multi-modal data are perfectly fused in urban functional zoning recognition, which consists of three main contributions. First, a multimodal data fusion framework is proposed to reveal the layout of urban functional zones by introducing building footprint and POI data. Second, after feature extraction by deep convolutional neural networks, an attention mechanism is introduced to focus on the main features of multimodal data and enhance the interconnection of different modal data. The results show that using the multimodal network model based on the attention mechanism to extract features can improve the prediction performance. Third, we further compare different fusion methods with different fusion stages to further validate the robustness of the method. Therefore, our method can help to refine the urban land use classification and provide data to support the refinement of urban management.
The paper is organized as follows: 
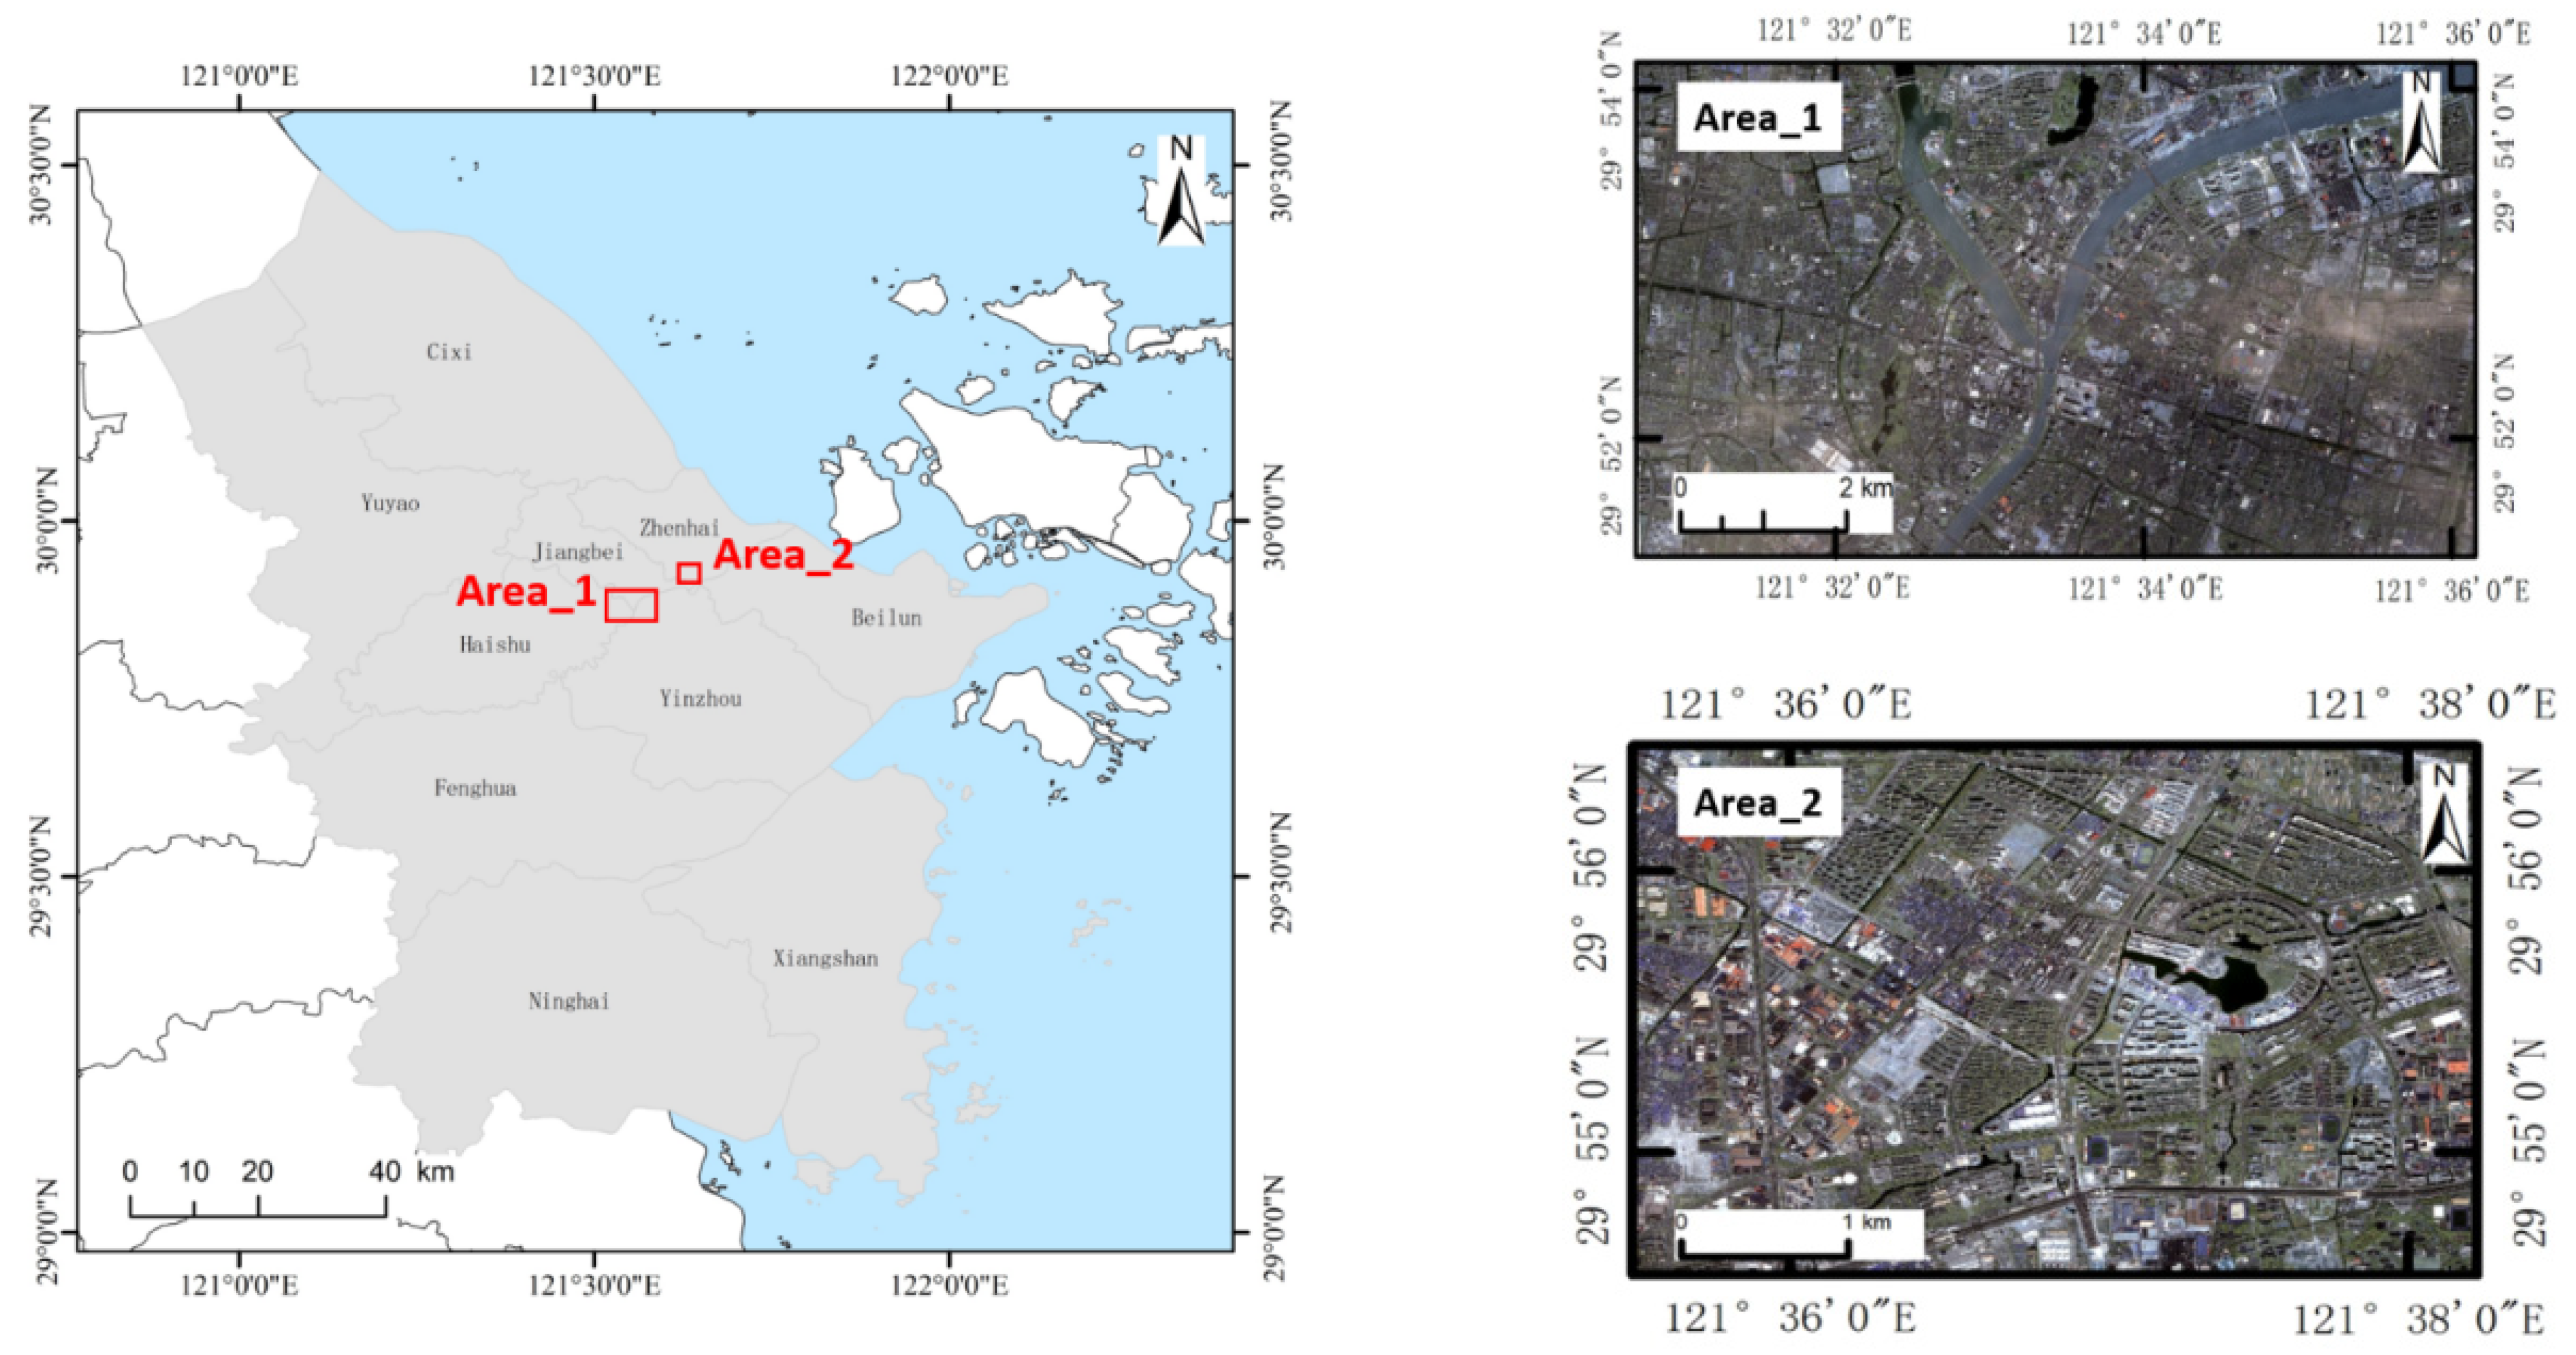
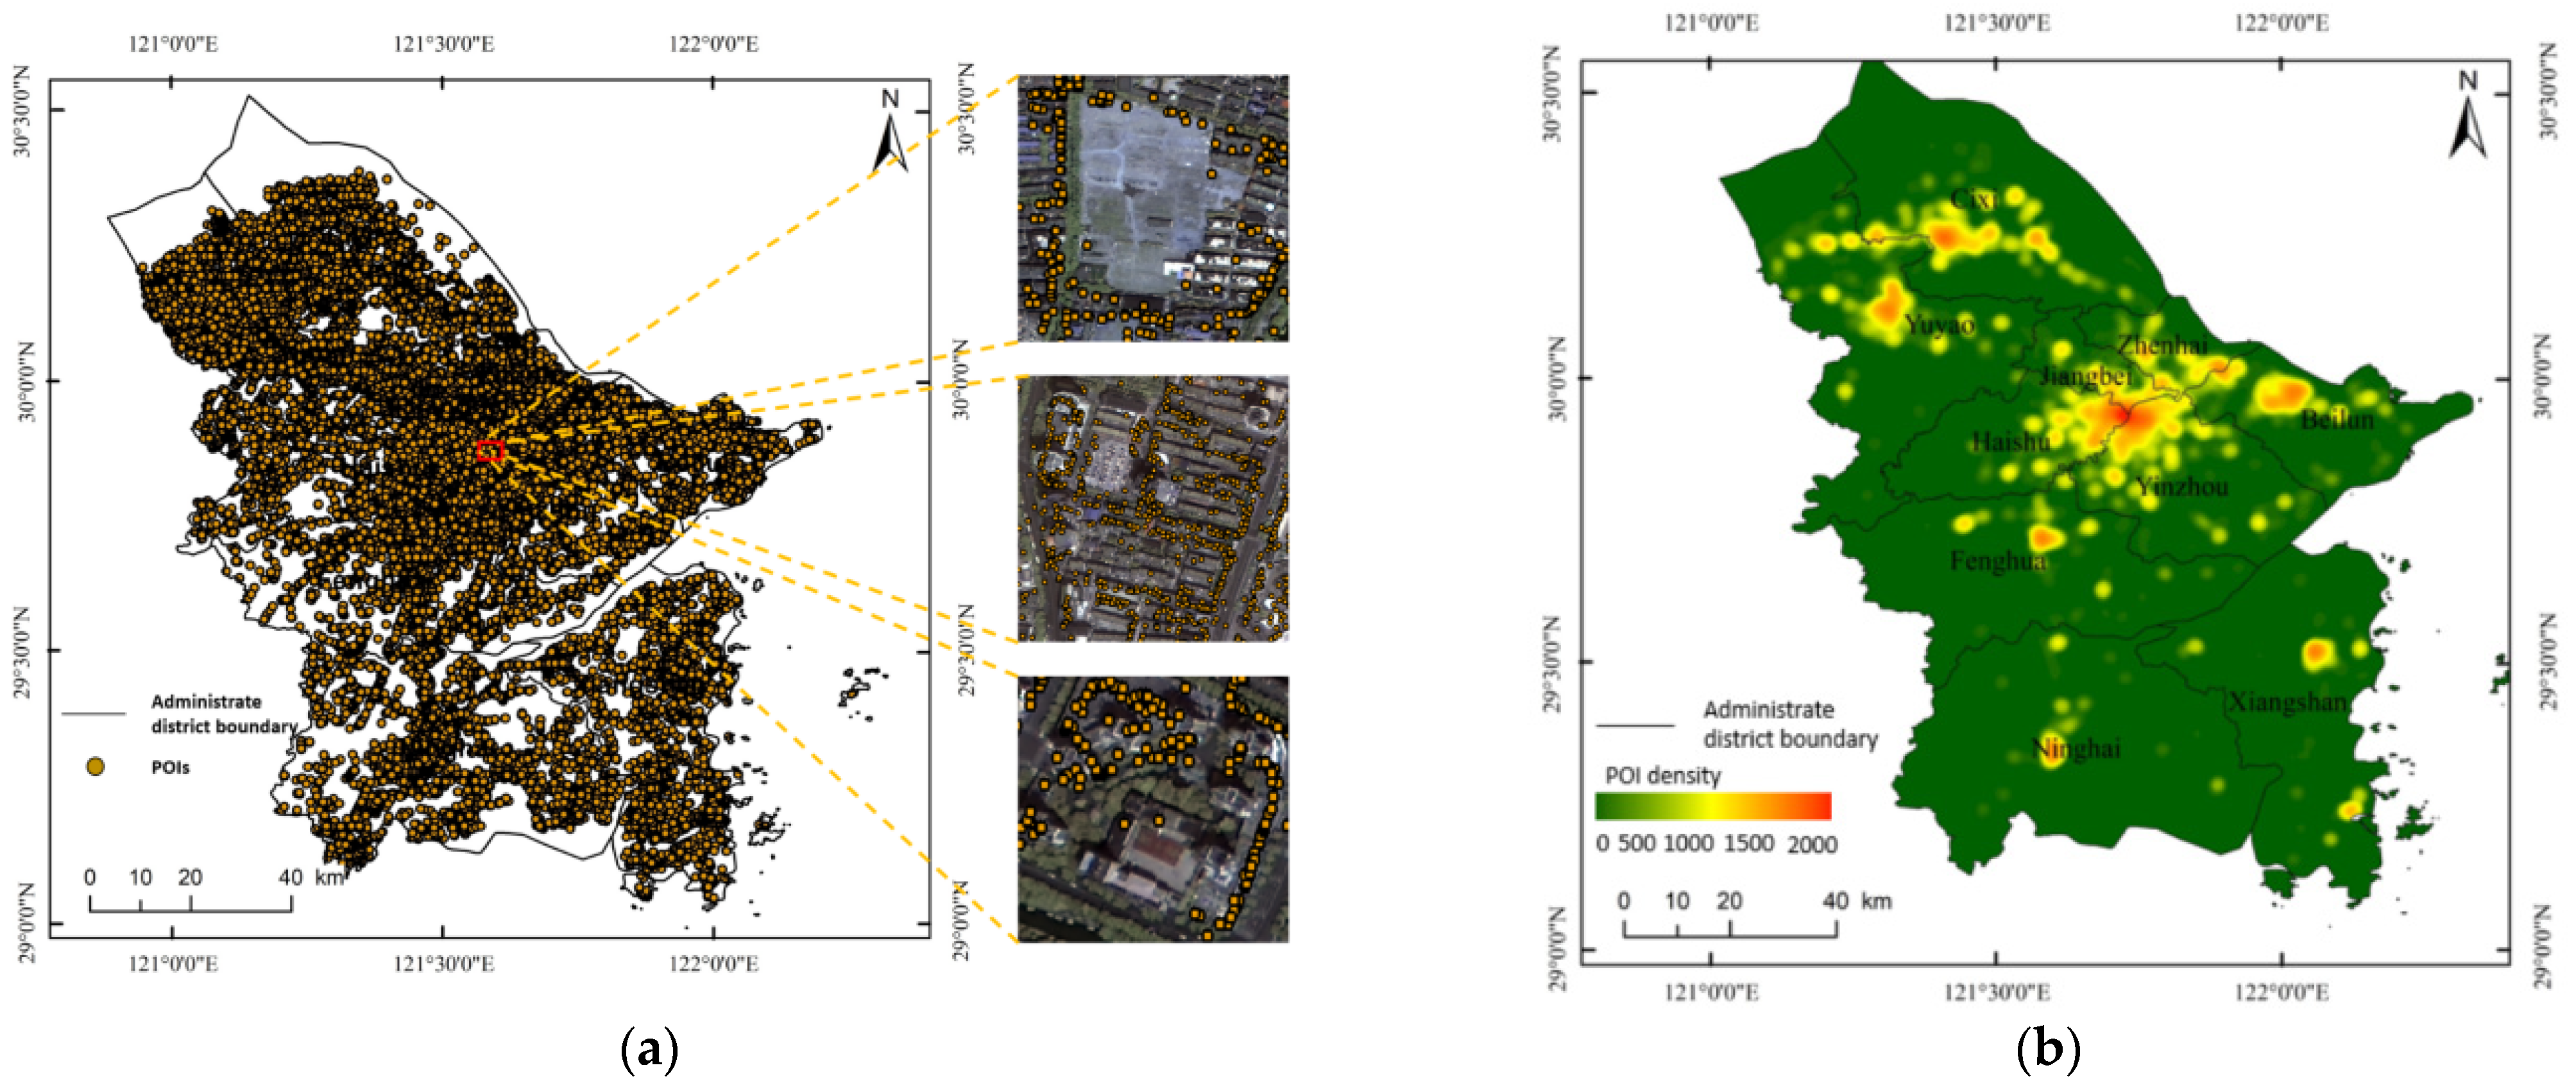
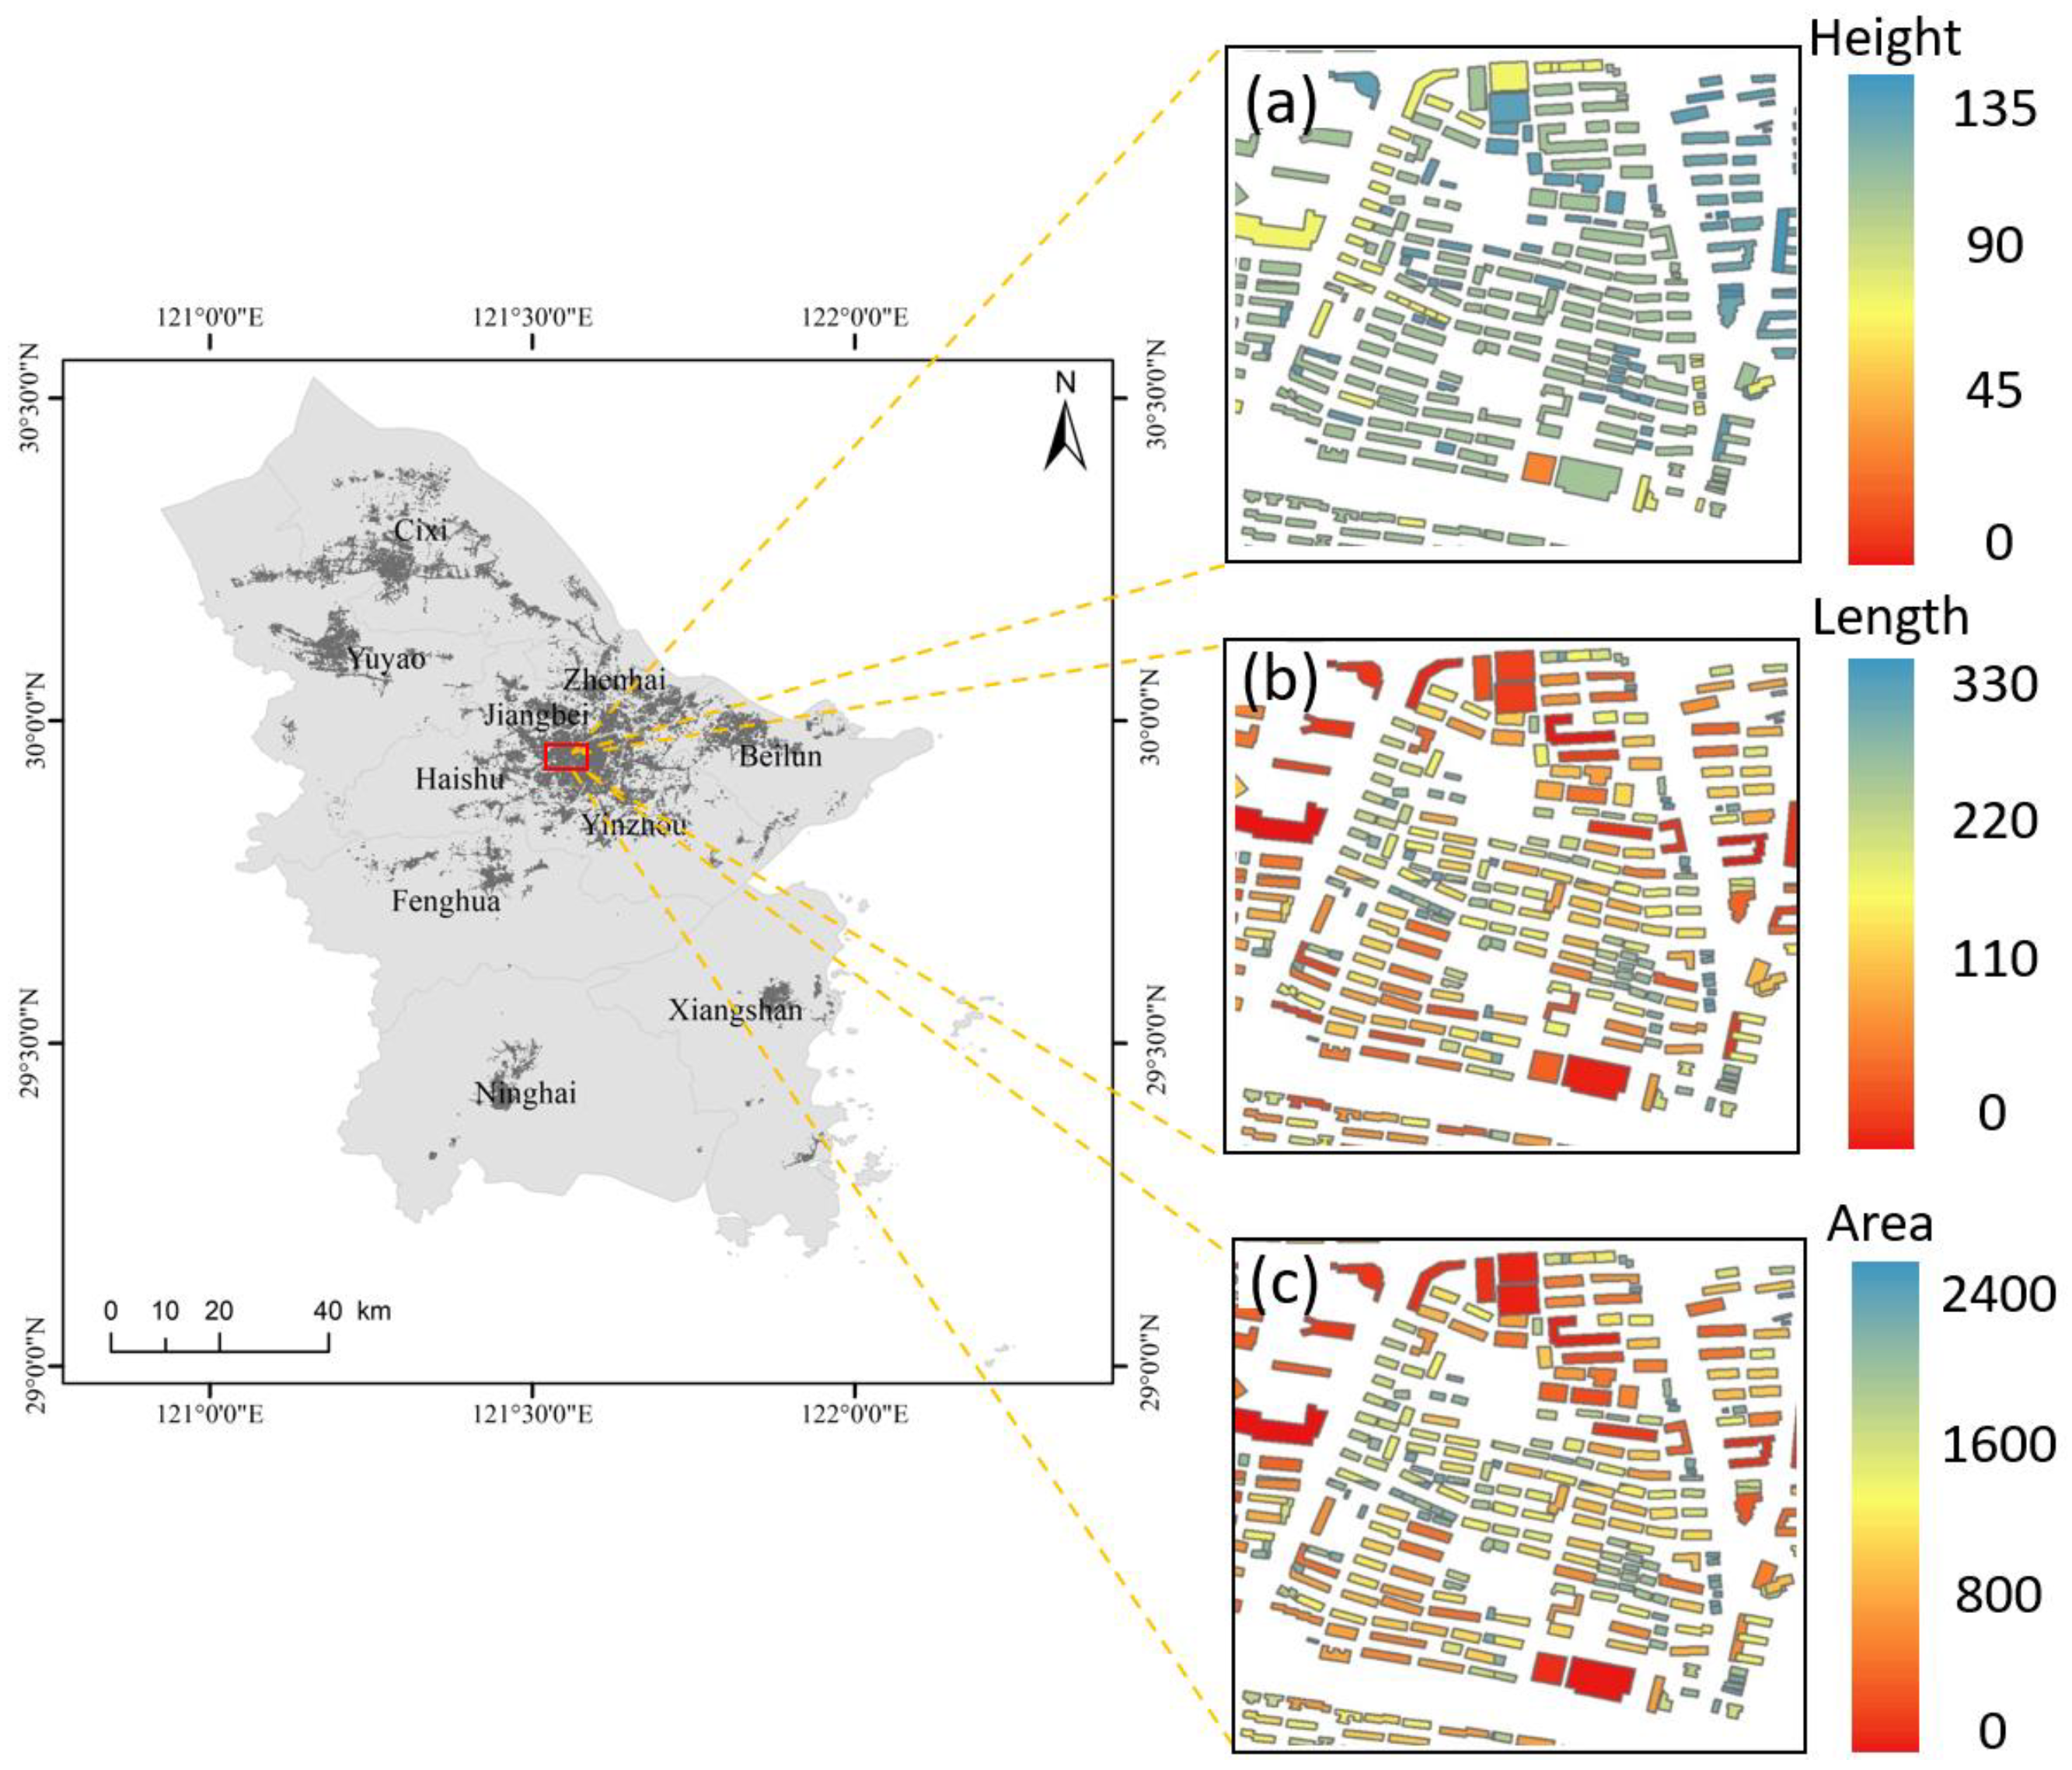
Section 2 brings forward how the dataset was created for the region of Ningbo. In Section 3, we present the proposed model in detail. Section 4 illustrates the experimental setup and results, while in Section 5 the applicability of the method is comprehensively discussed. Section 6 concludes the paper.

2. Study Area and Data Sources

2.1. Study Area

Located on the southeast coast of China, Ningbo is home to 9.4 million people, with an area of 9816 km2. As an important economic center of the Yangtze Delta megalopolis, Ningbo has continuously established rich types of urban functions to meet the needs of the booming advances in tertiary industries and fast expansion in foreign trade. The research area of this paper encompasses several parts of Ningbo. Study area 1 is situated on the intersection of the Jiangbei District, the Haishu District, and the Yinzhou District, with an area of about 48.78 km2, including Tianyi Square, which is the largest urban commercial area that integrates recreation, commerce, tourism, catering, and shopping in Ningbo. Study area 2 is Vanke Square, a newly developed commercial center with its surrounding areas in Zhenhai District, covering an area of 17.63 km2. There is much common ground between these two regions. Both are highly concentrated on the commercial and industrial development, residential and public services, medical and health care, and sports and leisure facilities, with a similar distribution of regional buildings and rich POI data, setting good examples to give the full picture of a comparative study of urban functional zoning in this paper. The two study areas are shown in Figure 1.

2.2. Data Sources

Gaofen (GF)-2 data are used as the high-resolution spatial remote sensing data source in this experiment. Launched in 2014, the satellite was equipped with panchromatic and multispectral sensors with resolutions of 1 m and 4 m, respectively. The images of the study areas were acquired on 16 June 2019. Preprocessing the illustrations intensively helps us make the full use of high-resolution spatial image information and spectral feature information. First, the parameters given by the China Resources Satellite Data and application center are used for radiometric calibration. Second, atmospheric correction is carried out to eliminate the errors caused by atmospheric scattering, absorption, and reflection. Third, the rational polynomial model is used for positive correction. Next, multispectral images and panchromatic images are fused to obtain multispectral data with a 1 m spatial resolution. Finally, according to the range of the study areas, the images of two study areas are cut from the preprocessed images. The size of study area 1 is 6217 × 11,544 pixels and that of study area 2 is 4327 × 4782 pixels.
Drawing from Gaode map API (https://lbs.amap.com/tools/picker) in 1 June 2019, four types of attributes involving the name, function, address, longitude and latitude constitute the POI data. It is worth noting that POI is not generated by physical information on the surface, but by attribute labels and geographical points triggered by human economic activities. To some extent, it shed light on the people’s activities in specific places. We collected 48,886 records covering the study area from Gaode API. Although POI data contains semantic information that largely mirrors the socio-economic attributes inside the buildings, not all POI data can help identify urban functional areas and may even provoke interference to a certain degree. It is those invalid factors, such as public toilets, newspaper kiosks, traffic stations, etc., that are removed from the original data. First POI data is filtered to exclude the data without detailed category identification and coordinate information. Second, derived from the standard of classification and planning of urban land for Construction, issued by the Ministry of Housing and Urban Rural Development of the People’s Republic of China, the POI is reclassified into 14 categories, including public facilities, catering services, education and cultural services, shopping services, companies and enterprises, medical services, accommodation services, commercial residences, life services, landscapes, transportation facilities services, financial and insurance services, sports and leisure services, government agencies, and social organizations. Finally, the aforementioned POI data is corrected from the Mars Coordinate System referenced by Gaode Map to the WGS84 Coordinate System with the remote sensing image techniques. After going through these intense processes, study area 1 contains 31,240 POI data records and study area 2 contains 5632. The distribution of the POIs is shown in Figure 2.
Building contour data, obtained in 1 June 2019, are from Bigemap (http://www.bigemap.com). Study area 1 contains 6808 data records, with 3510 records being contained in study area 2. It is obvious that a closed topological relationship exists between buildings and their corresponding plot units. The differences in the physical properties of a building complex reflect the functional attributes of a region, such as a residential area. The building contour data we obtained encompasses three types of attributes: area, length, and floor. First, area represents the actual floor area of a building. We calculated the total area and average area of all buildings in the region, and counted the frequency of buildings in a certain area range. Some differences appear in the fluctuation range of the average area of different functional areas. For example, the internal building area of the residential area is similar, and the building height is unified. The floor area of the office building is small, while the floor area of the shopping center is large. Regional functional attributes can be inferred from the difference of the area. Second, the building perimeter distinctly expresses the length of the building outline, which measures the length difference between buildings in an area. Different types of functional zoning can be inferred by calculating the total perimeter and average perimeter, as well as by counting the frequency of buildings in a certain range interval. The differences in the height of buildings reflected in floors are variously distributed in different functional areas. For example, business office constructions are usually located in the center of the area, with a floor height that is higher than ordinary residential buildings. Here, we employ floor height, average floor height, and statistics of the frequency of buildings within a certain height range to infer the functional attributes of the area. The distribution of the building footprint is shown in the Figure 3.
It is worth mentioning that OSM data, obtained in 1 June 2019, comes from OpenStreetMap (https://www.openstreetmap.org), which is currently the largest open authorized geospatial data database. OpenStreetMap gives a full picture of different sorts of GIS information, including road infrastructure, built environment, etc., thus, to some extent, providing an alternative solution to proprietary or authoritative data in many projects, as several studies have evaluated the spatial accuracy of OSM. In short, an array of literature verifies the reliability of OSM data.

3. Method

The features extracted by traditional methods of identifying urban functional area are independent of each other among the modal data since the features are not interrelated with each other. However, multimodal feature fusion on the basis of deep learning maps all features into a common subspace as well as completes the classification task in the light of the similarity and measurability of data between modalities, somehow marginalizing the main features of the modal data and weakening the feature extraction expression capability of the network. Therefore, this study improves the ability of the convolutional structure in the network to extract each modal data by using the modal data reconstruction loss function. In addition, an attention mechanism is introduced to strengthen the feature expression capability and optimize the network performance by giving more weight to the main features from both spatial and channel dimensions.
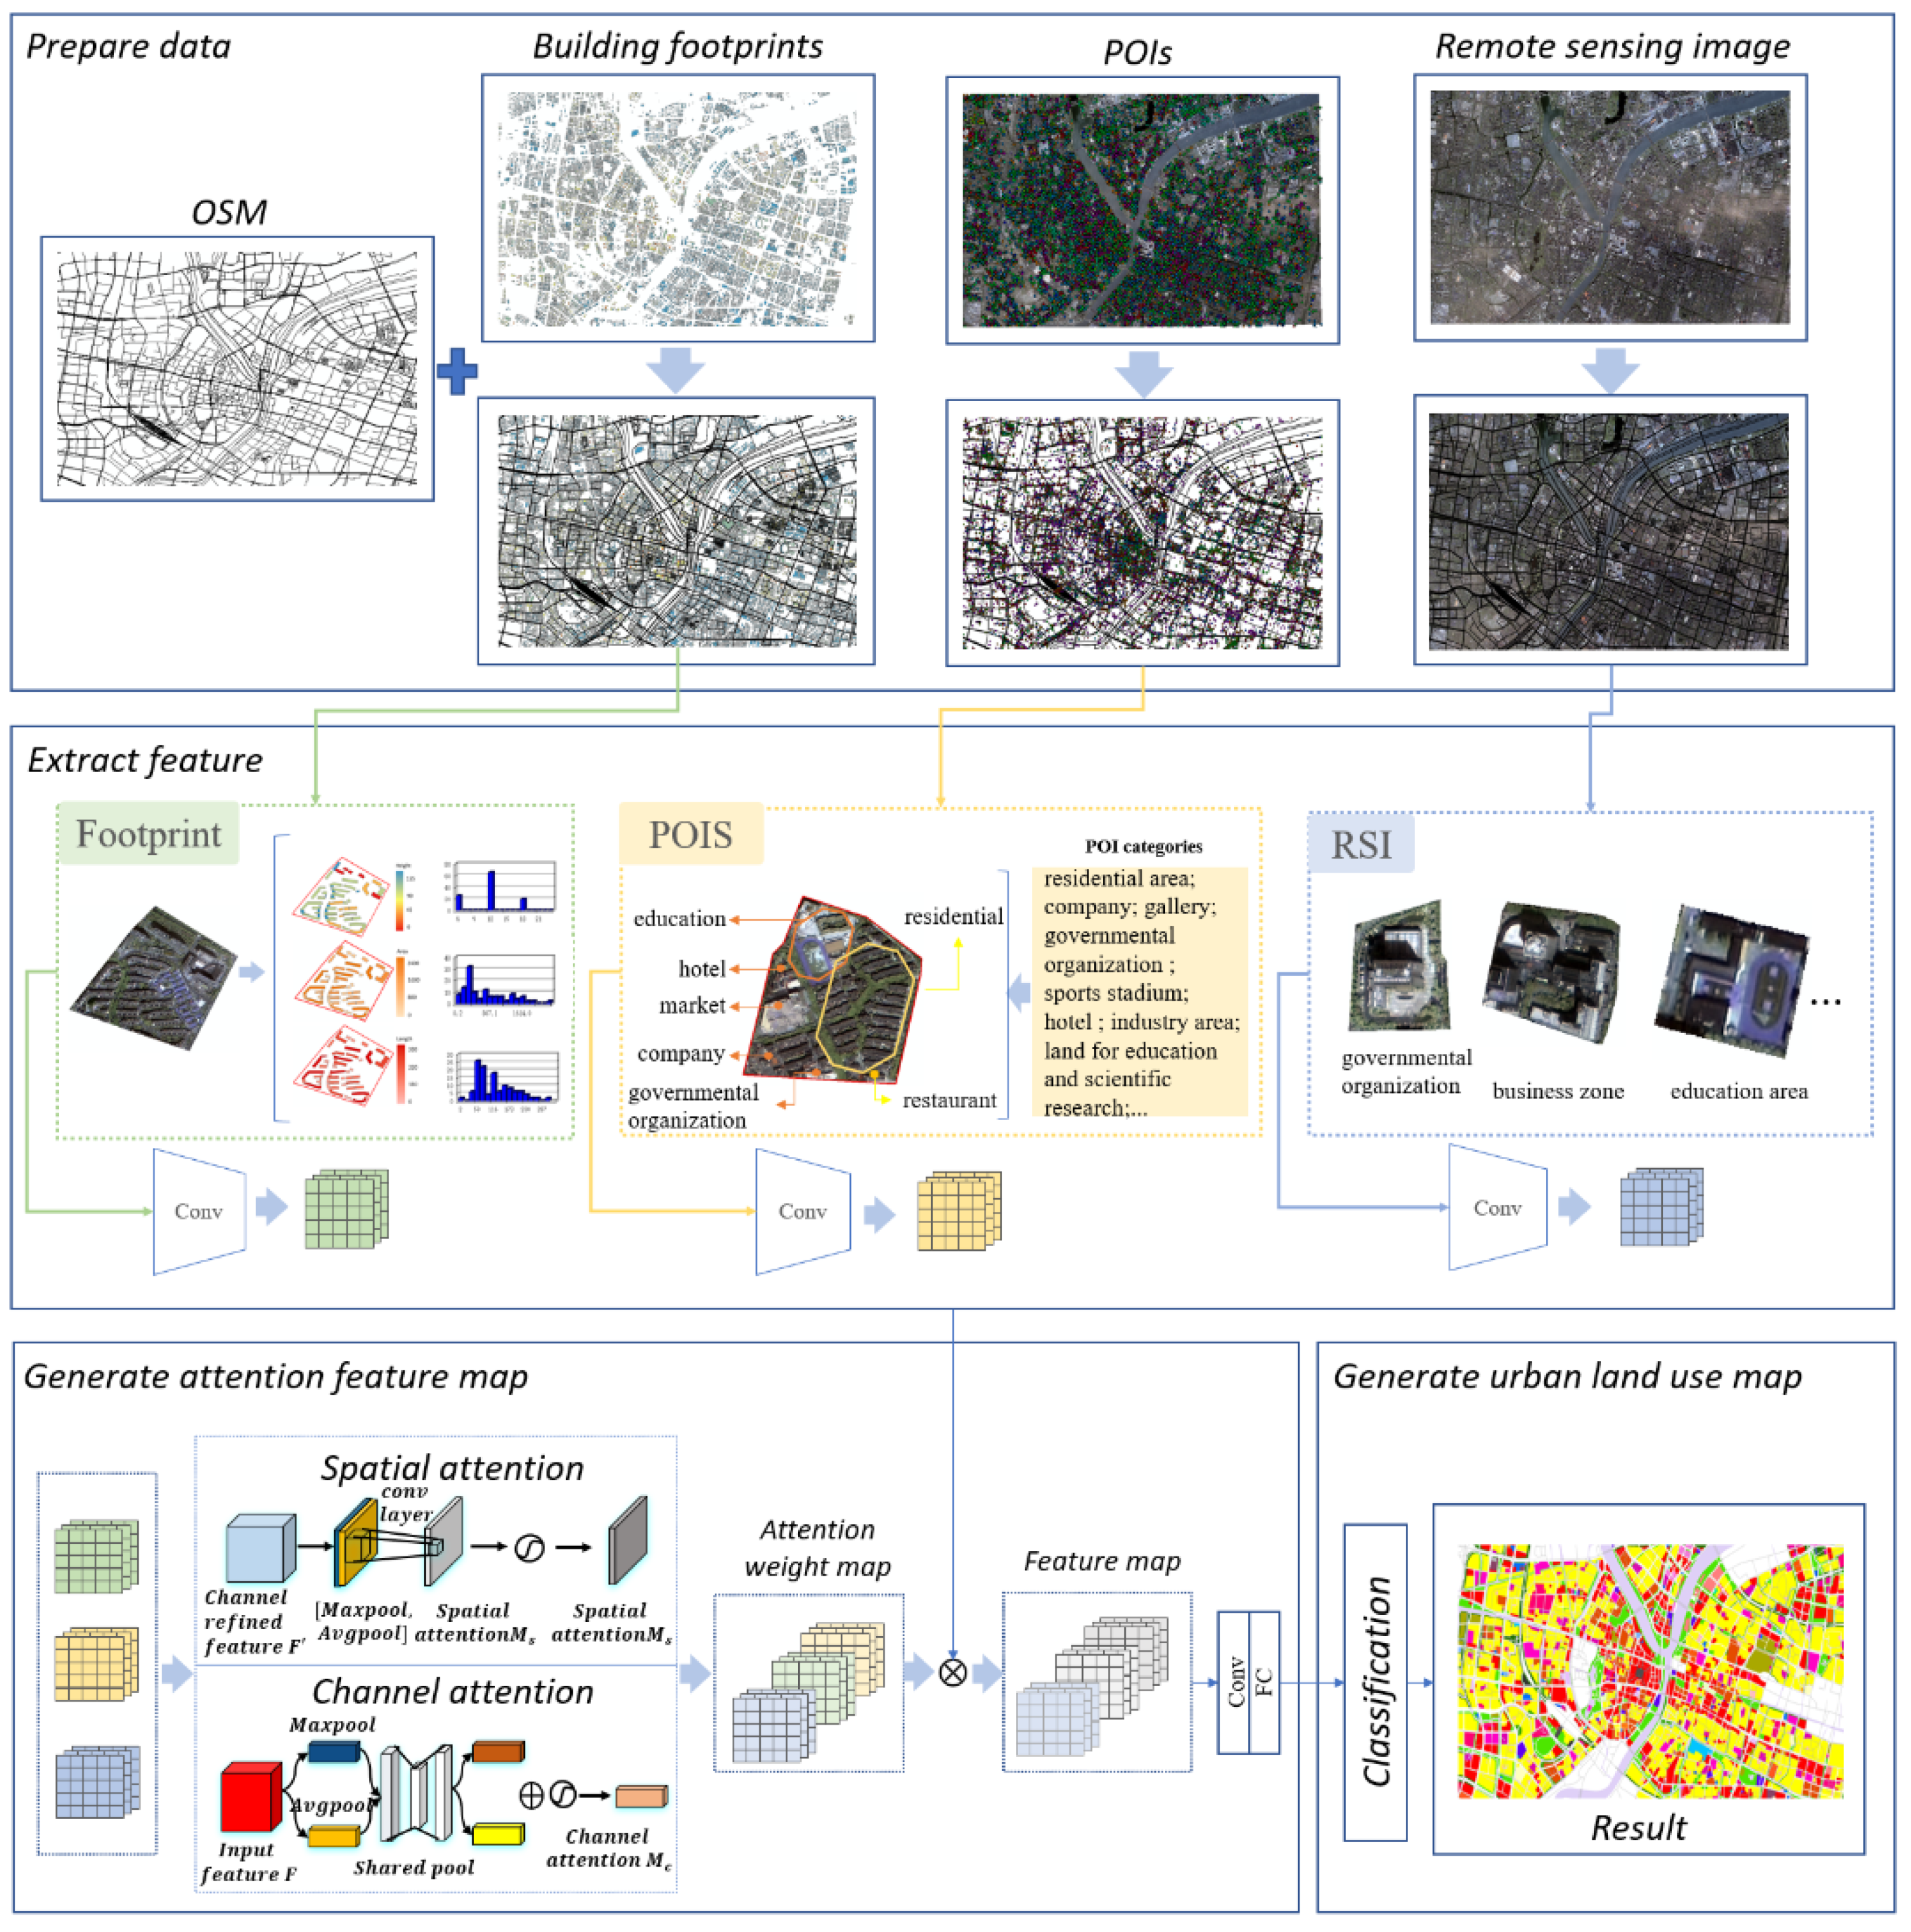
In this paper, the urban functional area identification framework is implemented by a perfect combination of remotely sensed images and socio-economic attribute data, such as points of interest (POI), road networks, and building footprints. As shown in Figure 4, three major steps are involved in the process of the multi-modal urban functional area identification framework. First, it is clear that the road network segments the preprocessed remote sensing image, POIs, and building footprint data. Next, in the light of the segmented block, the convolution network is applied to further extract the features. Third, the features picked up by step 2 are input into the spatial attention mechanism and channel attention mechanism modules as it looks to fetch the attention weight map. Finally, we multiply the features used in step 1 with the generated feature attention map in step 2 to harvest the final feature map, a key factor to settle city functional area recognition classification mapping.

3.1. Block Generation by Osm

Blocks are the basic units that carry social and economic functions in urban management and urban planning. Long and Liu contend that the land parcel is a polygon surrounded by a road network as the dividing boundary of the urban area [38]. In this study, we adopted this method, using OSM road network data to form block units. As shown in Figure 5a–c, first, preprocessing operations such as simplification, merging, and geometric correction are performed on the road network data. Second, it is important to forge a buffer zone hinged on the road network of different levels. Finally, we divide the research area into a string of independent blocks determined from the established buffer zone.
However, in the whole process, few high-purity samples prevail, since the medical and administrative categories are usually mixed with other land uses. Therefore, in order to ensure the integrity and independence of the function blocks, we manually edit the following samples in Figure 5d,e, seeking to connect original unconnected lines into road sections. These steps help to form an independent unit and to guarantee a purity of each sample that exceeds 90%.

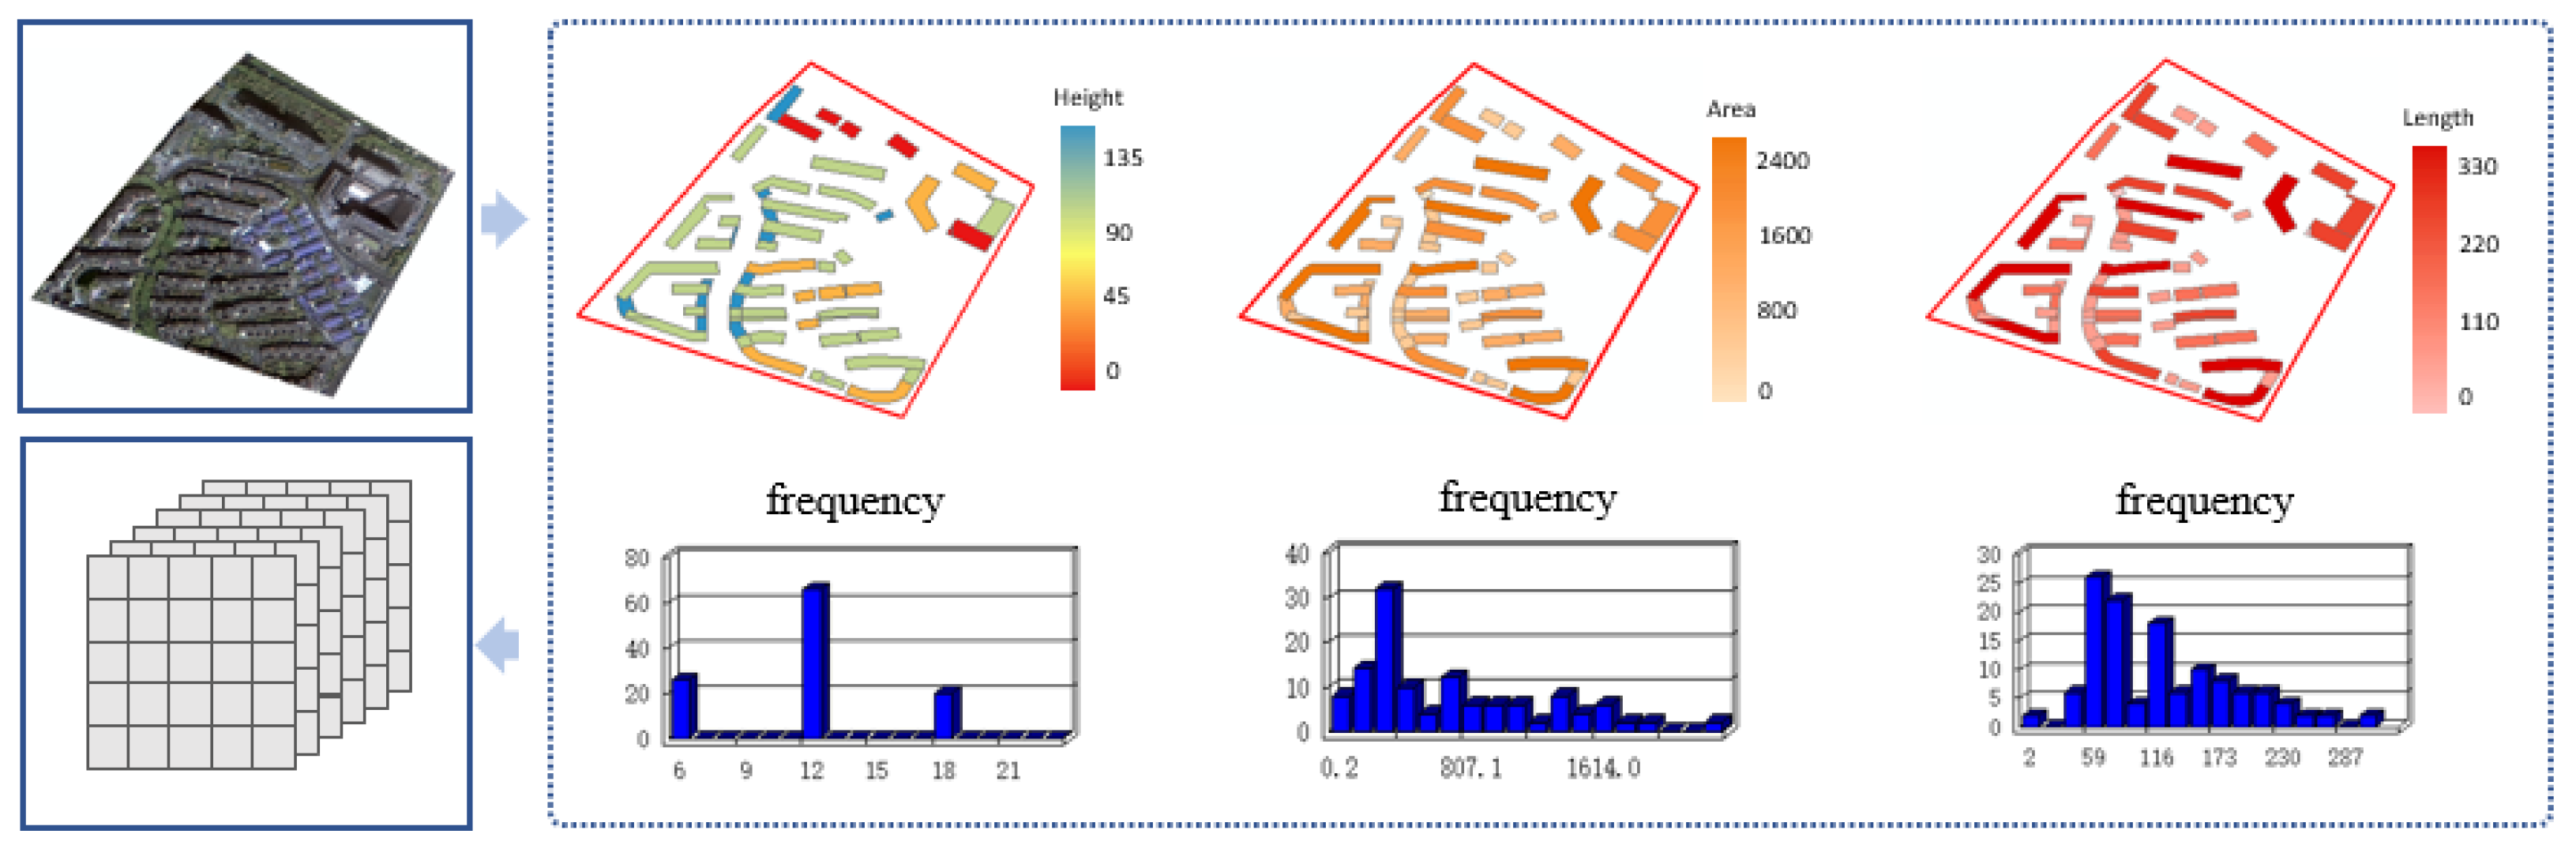
3.2. Generating the Feature Tensor

Generation of the footprint feature tensor: As shown in Figure 6, the spatial connection method of ArcMap10.6 (Environmental Systems Research Institute, Inc., Redlands, CA, USA) is first applied to connect buildings with intersecting parcels while obtaining information of all buildings within a parcel. Next, the metrics are calculated according to the statistical method. Finally, the feature vectors representing the building information are generated.
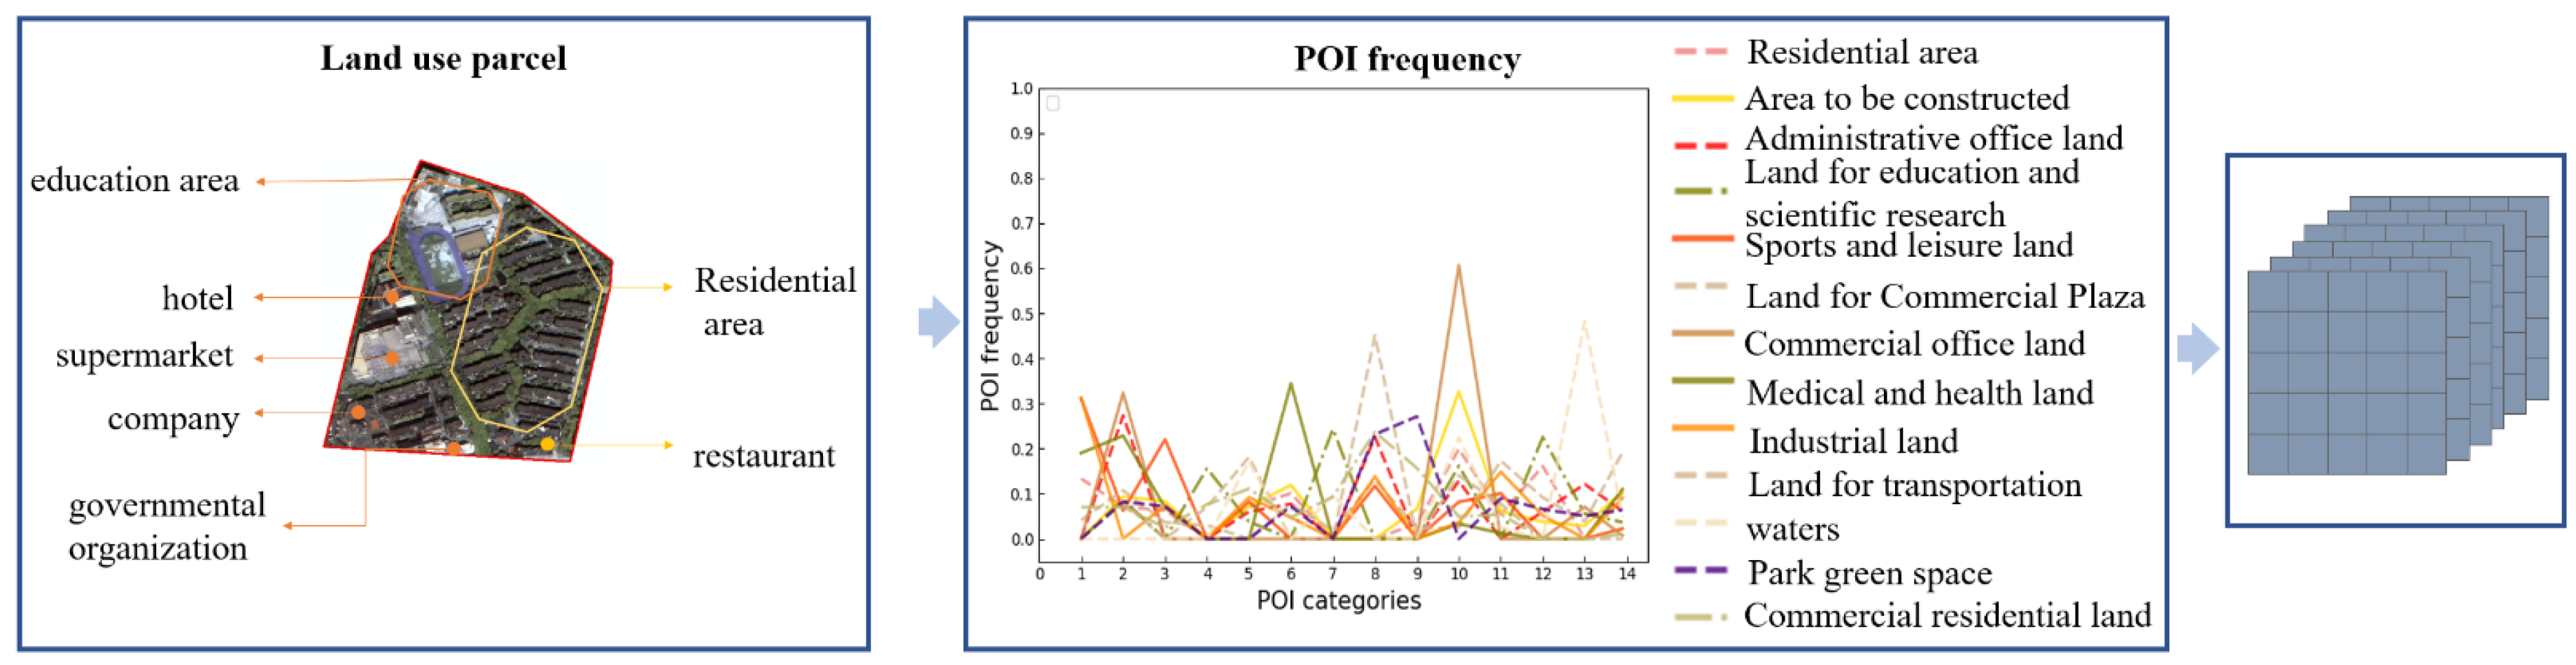
Generation of the POI feature tensor: As shown in Figure 7, the spatial connectivity method is first implemented in ArcMap10.6 as it seeks to count the number of various POIs in the neighborhood. Second, the type ratio of each unit is calculated on the basis of the formula, and the type ratio value is used as a criterion to judge the functional nature of the neighborhood. Finally, feature vectors are generated to represent building information [39]. The calculation method is as follows:
F i = n i N i ( i = 1 , 2 , 3 , , 14 )
C i = F i i = 1 14 F i ( i = 1 , 2 , 3 , , 14 )
where i represents the type of POI, n i serves as the number of the i -th type of POI in the block, N i stands for the total number of the i -th type of POI, F i acts as the frequency density of the i -th type of POI in the total number of POIs of this type, and C i represents the ratio of the frequency density of the i -th type of POI to the frequency density of all types of POI in the block.
Generation of the image feature tensor: When extracting the features of high-resolution remote sensing images, instead of separately attaining the low-level semantic features, such as texture, spectrum, and SIFT of the image, we take advantage of CNN to capture high-level semantic features from images. Next, we will continue our research with respect to the items of multi-modal network feature extraction and fusion in greater detail.

3.3. Feature Extraction and Feature Fusion

In this section, our team explores the details of the proposed deep multimodal fusion network, laying a foundation for integrating remote sensing images with social-economic attribute data. This encourages one to better recognize the urban region functions in our study.
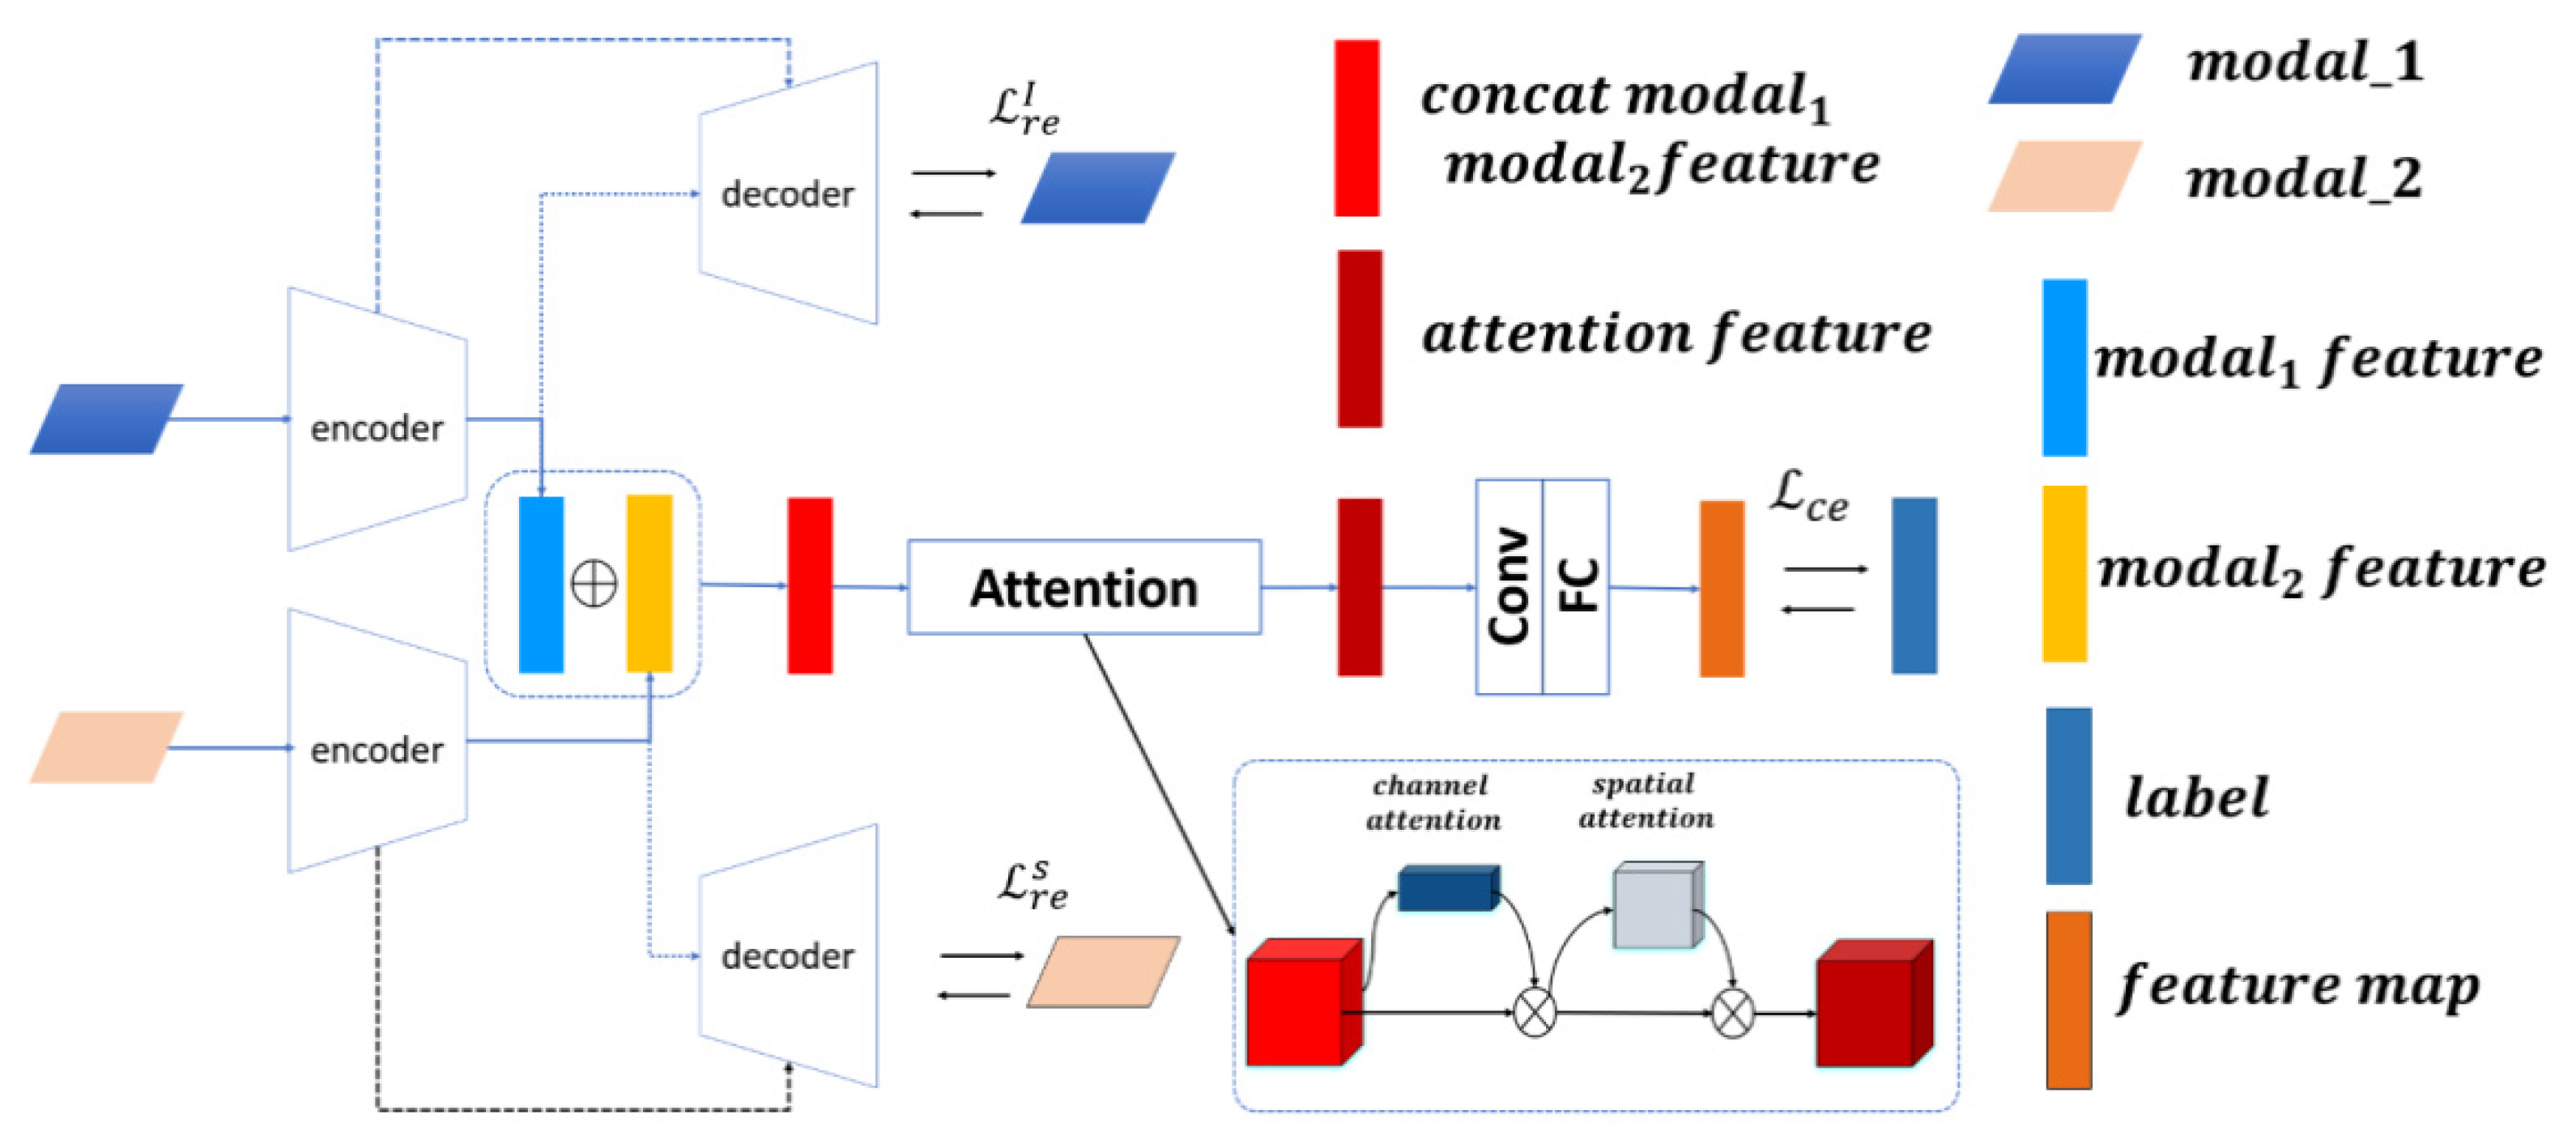
The illustration (Figure 8) below clearly unveils the overall architecture of the proposed deep multimodal fusion network. The convolution structure has efficient feature extraction and representation capabilities, so two identical convolutional branch structures are employed here to obtain remote sensing image features and socioeconomic attributes, respectively. The network ϕ is composed of three major parts, being the image encoder and socioeconomic attribute encoder, the data fusion module, and the decoder of the image and socioeconomic attributes. The network takes satellite images I and socioeconomic attribute S   as   the inputs. The outputs are demonstrated by the predicted probability distribution   P over all the categories, i.e., p = ϕ ( I , S ) . In particular, it is better to garner the images and socioeconomic attributes data features with the assistance of encoder and decoder structures. Moreover, the extracted features are further fused through the spatial attention mechanism as well as the channel attention mechanism while being classified by introducing the softmax layer after passing through the convolutional layer and being fully connected. The key of the network is to learn a joint embedding space through two attention mechanisms, such that the image and social-economic characteristics are able to be well combined for prediction. Apart from the conventional cross entropy loss for classification task, we propose an auxiliary loss.

3.3.1. Feature Extraction

The network is an encoder–decoder backbone network with a residual network architecture and two convolution branches [40,41], i.e., the remote sensing image branch and the socioeconomic attributes data branch. The backbone network, specifically designed for conducting the diversity of remote sensing data and socioeconomic attribute data, aims to integrate complementary information, alleviate the complexity of heterogeneous information, and accomplish the purpose of classification.
Each branch encoder section utilizes a similar structure to the VGG16 [42]., with four convolution blocks, each of which contains a convolutional layer with a kernel size of 3 × 3 with a rectified linear unit (Relu) and a batch normalization (
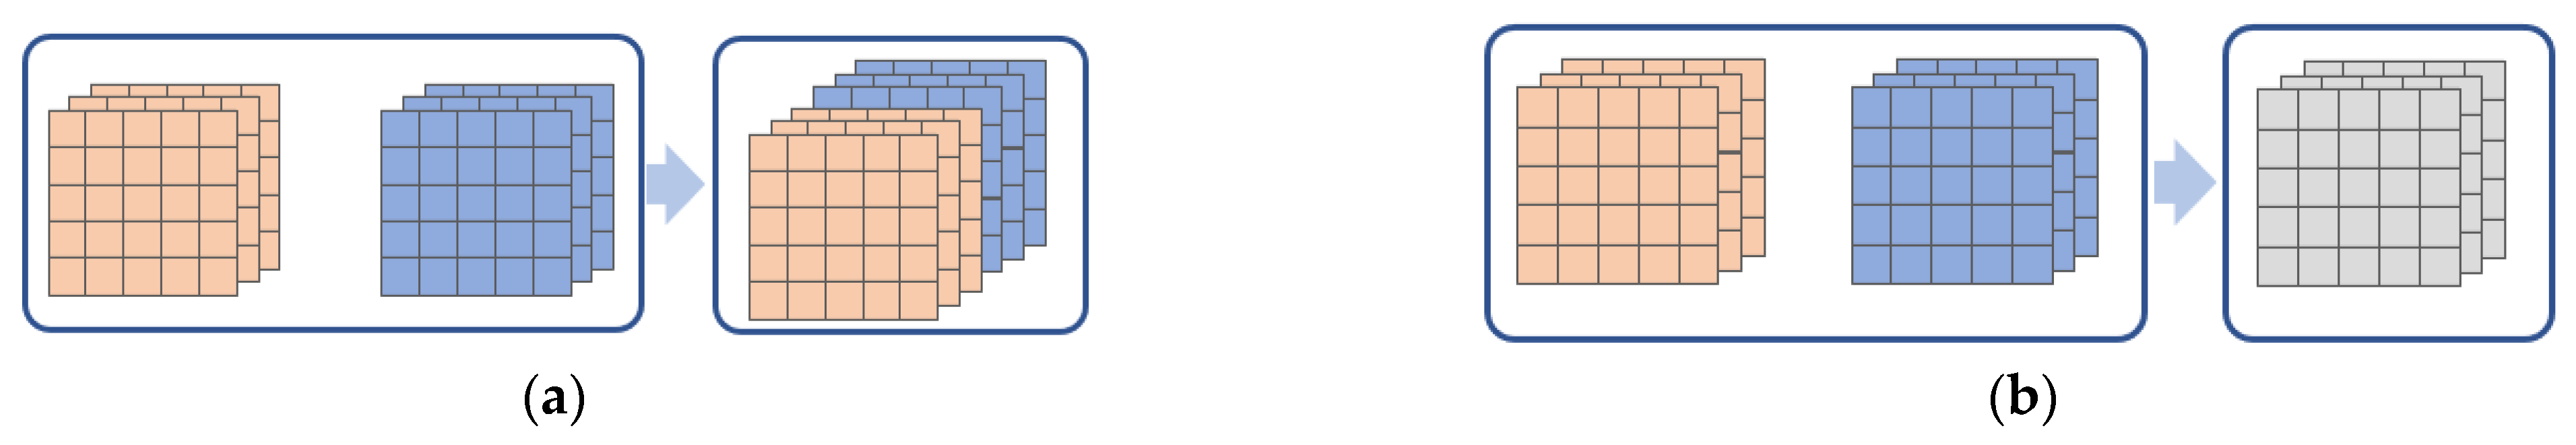
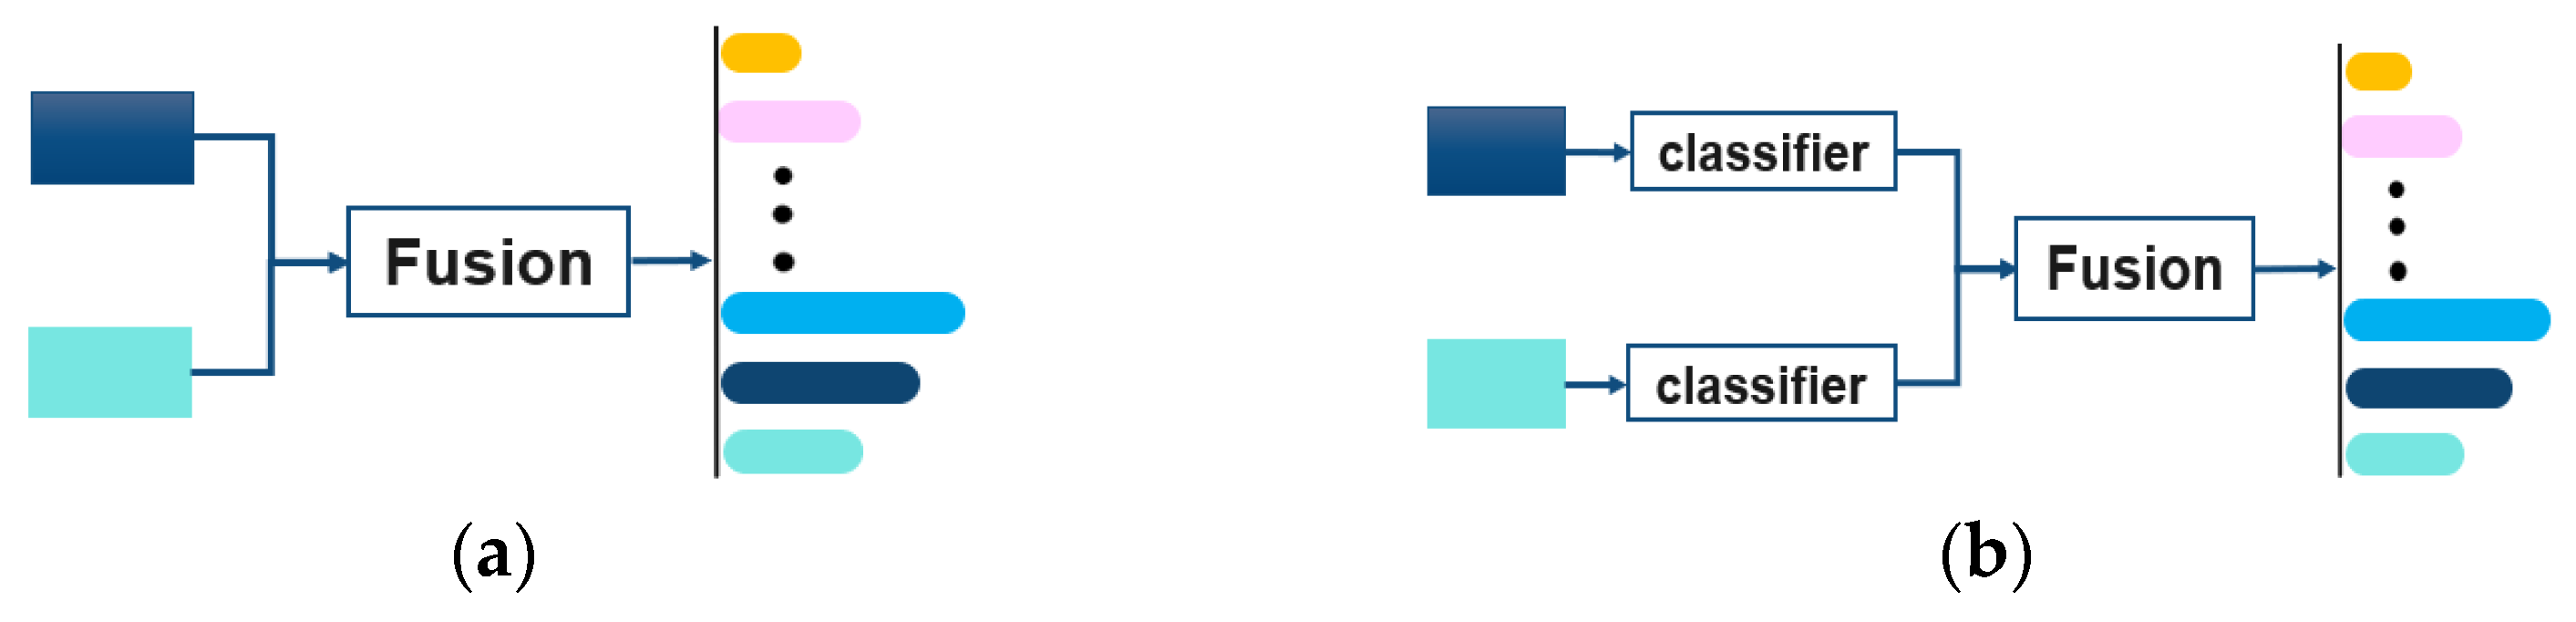
BN). The second and fourth blocks use a max-pooling layer of size of 2 × 2. The features extracted by the encoder are divided into two channels; one is the decoder branch corresponding to the encoder branch for reconstruction and the other is a fusion with the features garnered by other branch networks. The extracted features are transferred to a module with an attention mechanism, working to create an attention feature map for classification. Specifically, two methods need to fuse the extracted features of two different patterns before sending them to the attention module, i.e., concatenation and element summation. For concatenation, F = [ F I , F S ] , and F 2 n . For the element-wise sum, F = F I + F S , and F n . The illustration of the two fusion methods is shown in Figure 9. Furthermore, the fused feature x is then fed into the attention module to create the attention feature map.
The structure of the decoder part is symmetrical with respect to the encoder part. First, four deconvolution layers with 2 × 2 up-sampling are sequentially added at the end of the encoder section. Second, the final layer is a single 2 × 2 deconvolution layer and the size of the final output is equal to the input. We add these encoders’ features into the decoder features using the skip concatenation function, enabling the decoder network to form finer feature maps. Finally, the reconstructed data is exported.

3.3.2. Feature Fusion

The features obtained after the convolution and pooling operations of the encoder are of equal importance among the features. In addition, the convolutional and the fully connected layer are expected to construct the feature space with the aim of completing the classification of the similarity and measurability between the modal data task. This method has been used previously [43,44]. However, for specific extraction and classification tasks, the importance of the features of each channel is not the same, and the feature cannot be fully concentrated on “where” is the most informative part and “what” is the most meaningful input feature map during the interactive fusion. In order to avoid the influence of invalid features on the network model, a channel and spatial attention module is embedded to distribute the weight of spatial information and channel information [
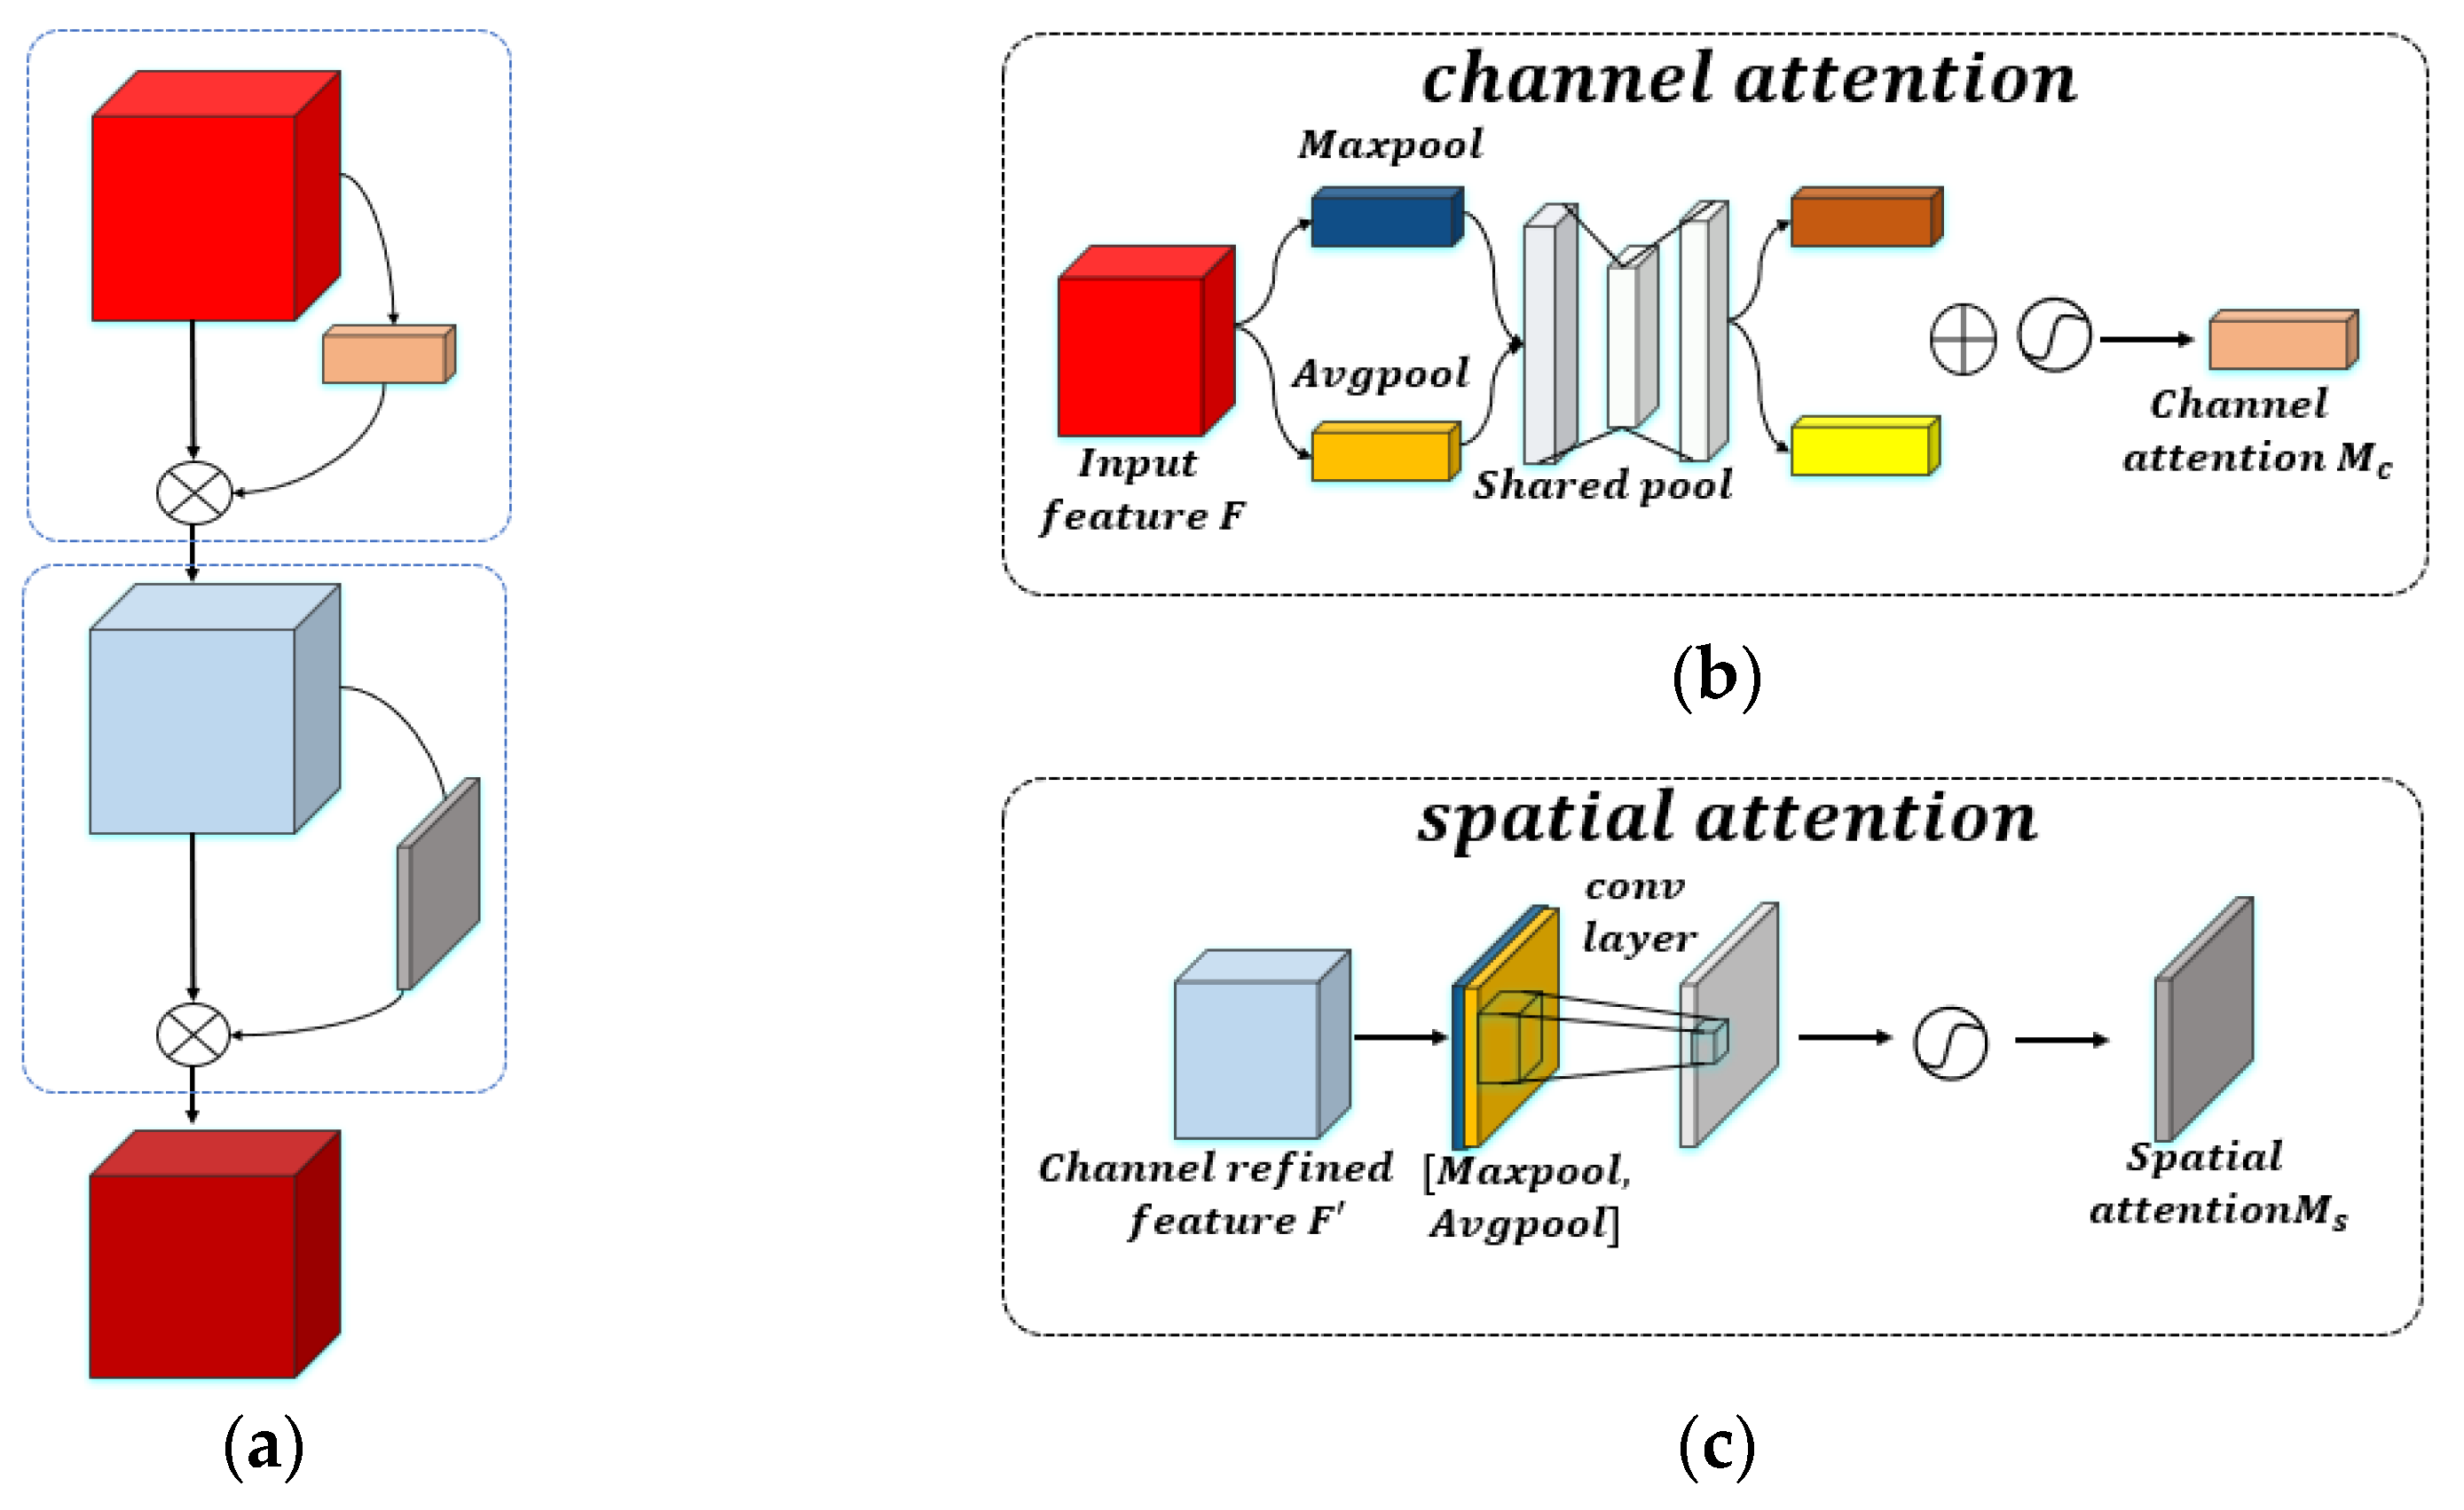
45]. Hence, we adopt the channel and spatial attention module (Figure 10). Each branch could potentially learn the “what” and “where” in the channel dimension and the spatial dimension separately, thus effectively helping the information flow in the network.
The intermediate feature map F C × H × W acts as the input to infer the 1D channel attention map M c C × 1 × 1 and the 2D spatial attention map M s 1 × H × W , as illustrated in Figure 10a. The overall attention process can be summarized as:
F = M c ( F ) F ,
F = M c ( F ) F ,
where represents element-wise multiplication and F is the final attention output feature.
Channel attention: As shown in Figure 10b, the average pooling and maximum pooling operations are first used to aggregate the spatial information of the feature map, bringing about two different spatial context feature descriptions. F a v g c , F m a x c respectively serve as the average pool feature and the maximum pool feature. Next, these two features go through a shared neural network. The number of neurons in the first layer is C/r, the activation function is Relu, and the number of neurons in the second layer is C, as the neural network parameters of the two layers are shared. After adding the two features gathered through a Sigmoid activation function, the weight coefficient M c C × 1 × 1 is grabbed. Finally, the weight coefficient and the original feature F are multiplied to obtain the scaled new features. The channel attention is calculated as follows:
M c ( F ) = σ ( MLP ( A v g P o o l ( F ) ) + MLP ( M a x P o o l ( F ) ) ) = σ ( W 1 ( W 0 ( F a v g c ) ) + W 1 ( W 0 ( F m a x c ) ) )
where σ is the sigmoid activation function, W 0 C / r × C , W 1 C r × C   is the weight of the fully connected layer, and r is the compression ratio, using the Relu activation function to process W 0 .
Spatial attention: As shown in Figure 10c, the average pooling and maximum pooling operations are first used to aggregate the channel information of the feature map as it looks to work out two 2D feature maps F a v g s 1 × H × W and   F m a x s 1 × H × W . Next, the two feature descriptions to be spliced together are used according to the channel after a 7 × 7 convolutional layer, where the activation function is Sigmoid, and the weight coefficient M s is obtained. Finally, multiply the weight coefficient and the feature F to get the attention feature. The spatial attention is calculated as follows:
M c ( F ) = σ ( f 7 × 7 ( [ A v g P o o l ( F ) ; M a x P o o l ( F ) ] ) ) = σ ( f 7 × 7 [ F a v g s ;   F m a x s ] )  
where σ is the sigmoid activation function and f 7 × 7 is a convolution operation with a size of 7 × 7.
Eventually, the fused features pass through both the convolutional layer and the fully connected layer for the output classification.

3.4. Loss Function

Aiming to achieve an effective classification and make the network more robust to missing patterns, two losses, the main loss and the auxiliary loss, are introduced to constrain the network training. The major loss is the cross entropy c e for the classification task. The auxiliary losses, a u , are used to complement the major loss in an attempt to increase the model robustness with missing modalities. The overall loss is formulated as follows:
= c e + a u
Widely used in classification tasks, the cross-entropy loss is used to regularize the network to learn from category labels. It can be formulated as follows:
c e = i k = 1 C y i , k log ( p i , k )
where y i , k and p i , k are the ground truth label and predicted probability value of class k for the i -th sample, respectively, and C is the total number of classes.
The auxiliary loss is the mean square error (MSE) loss, which is mainly employed to rein in the extracted features to be more representative through the loss triggered by the reconstruction. It can be formulated as follows:
a u = r e I + r e S
r e I = 1 N I = 1 N ( I i R i I ) 2  
r e S = 1 N I = 1 N ( S i R i S ) 2
where r e I and r e S denote the remote sensing image and socioeconomic attribute data structure losses, respectively, with   R I   and   R S being the reconstructed remote sensing image and socioeconomic attribute data, respectively.

4. Experiments

4.1. Experimental Setup

The experiments were performed on a Windows Operating System, using CPU (AMD Ryzen 9 5950X 16-Core 3.4 GHz), RAM (64 GB), and GPU (NVIDIA GeForce RTX 3080Ti 12 GB). Additionally, the deep-learning framework favored TensorFlow1.14. The hyperparameters of momentum and epsilon in the batch normalization function were set as 0.95 and 1 × 10⁻⁵, respectively. The adaptive moment estimation (Adam) algorithm was engaged in optimizing all models. The batch size was set as 64. Meanwhile, the maximum training iteration is set to 100 epochs. The cross-entropy function and mean squared error was sorted out as the loss function. All models were trained at once until the training loss converged.
The models can theoretically take images with an arbitrary size as input. However, the available memory is limited, and all input within a batch must have the same shape. Our method is based on CNN patches, so we processed the block into patch data that could be fed into the network for computation. Nevertheless, different functional areas possess different object compositions and spatial scales. Only one sort of objects develops in the window when the patch is too small, which fails to demonstrate the complexity of the functional area. Conversely, when the patch is too large, objects belonging to other functional areas will presumably be embodied in the patch. To accomplish the task of functional area identification, our team takes the smallest one as the reference basis for patch processing, where 725 functional blocks of study area 1 have been processed, with 205 in study area 2 (as shown in Table 1). Therefore, 71,000 patch images of size 32 × 32 were cropped from study area 1 and 20,500 were cropped from study area 2, where cropping was done by sliding the patch window with no overlap and cropping randomly to maintain the diversity of training samples. Ultimately, the data are divided at random into a training set and a test set at a ratio of 4:1.
It can be observed that when using the model for urban functional area identification, the original test image is first partitioned into small patches, and then, the predicted patches are concatenated into a final complete classification result. Obviously, the classification of patch images only acts as an intermediate stage in the classification process of urban functional area identification. Consequently, to evaluate the accuracy, the object of evaluation is actually not the small pieces directly output by the recognition model, but the complete classification result that eventually corresponds to the whole original test image.

4.2. Evaluation Metrics

To evaluate the classification results, our team resolves to embrace overall accuracy, the Kappa coefficient, and the F1 score as evaluation metrics. All of them can be computed by calculating the confusion matrix, which forms an informative table, allowing a direct visualization of the performance on each class, as well as analyzing the errors and confusions between different classes easily. OA is defined as the number of correctly classified data divided by total test data, which is the most intuitive measure to reveal the classification performance on the test data as a whole. Kappa is thought to be a more robust measure than a simple percent agreement calculation because it takes into account the possibility of the agreement occurring by chance. The F1 score, an effective metric for the categorical accuracy, is the weighted average of precision and recall. The aforementioned precision is the ratio of correctly predicted data to the total predicted data along with the recall, the ratio of correctly predicted data to all data in the actual label. The formulas are as follows:
Overall accuracy: p 0 = i = 1 n x i i N
Kappa coefficient: K = p 0 p e 1 p e
F 1   score: F 1 i = 2 p i r i p i + r i
Average F 1   score: F 1 ¯ = 1 n i = 1 n F 1 i
where x i i   denotes the element of the i -th row and the j -th column in the confusion matrix, i.e., p e = i = 1 n ( j = 1 n x i , j j = 1 n x j , i ) / N 2   , the number of samples of class i that is predicted to be in class j , n stands for the number of classes, and N serves as the total number of all the samples. p i and r i represent the precision and recall score of class i , respectively, p i = x i i / j = 1 n x i j , r i = x i i / j = 1 n x j i . F 1 i   measures the classification result of a certain class i . The average F 1 score ( F 1 ¯ ) constitutes the average of all the F 1 scores of different categories.

4.3. Experimental Results and Analysis

4.3.1. Results of the Network Model

We propose a multimodal deep learning fusion framework in preparation for the identification of urban functional areas using remotely sensed images and socioeconomic attribute data. The remote sensing images can extract the semantic features of low-level regional spatial distribution. Further, high-level semantic features of human economic activities show up through the analysis of social perception data. In general, they all reflect the use of functional areas from a certain perspective. By changing the input, different results can be obtained, depending on our framework. The overall classification outcomes of Area_1 and Area_2, as well as the results for each category, are presented in Table 2 and Table 3, respectively.
As can be seen from Table 2 and Table 3, the recognition accuracy is above 50% when using remote sensing images alone for functional area identification. The accuracy of study area 2 is higher than that of study area 1, mainly because of the simple structural composition of the functional areas. It is evident that our network enjoys some stability in the old urban areas with dense functional areas and the new urban areas with sparse functional areas.
When adding building footprint data, the overall accuracy of study Area 1 is decreased to 2%, with the accuracy of study Area 2 increasing to 4.75%. Since several differences vary in the building composition of functional areas, after the building footprint data have been attached, the identification accuracy of residential, education and research, administrative office, and commercial and industrial areas has been going through some improvement, and the increase of Research Area 2 reaches more than 6%. In terms of park green areas, building footprints are originally physical information shown by artificial features, and the structural composition of park green areas is simple, so it is convenient to procure this physical attribute information from remote sensing images. The step of adding building data is helpful for areas with large differences in building composition, such as residential areas, but data redundancy emerges with regard to park green space recognition, thus continuously impinging upon the recognition effect. In our experiments, the recognition accuracy of park green areas in study area 1 and study area 2 was significantly mitigated with the aid of building footprint data, with the reduction exceedingly more than 9%.
Unlike building footprint data, POI data showcases high-level semantic information tightly related to human economic activities. When POI data is added, the overall accuracy of study area 1 is boosted an impressive 29%, with the F1 score rising up considerably to 56%. At the same time, the overall accuracy of study area 2 increases to 20%, with the F1 experiencing an increase of 37%. Compared with the former, the latter is not improved as significantly as study area 1, which further upholds that the complete POI data better encourages urban functional area identification.
The noteworthy point is that employing building footprint data provokes some data redundancy in recognition concerning functional areas with simple compositions such as parks and green areas, but can enhance the corresponding physical features, as well as improve the recognition effect in terms of the regions with significant differences in building composition, such as residential and commercial areas. For this reason, we took remote sensing images, building footprint data, and POI data as input and further explored the social perception data contribution in urban functional areas. The overall accuracy is improved by 2% relative to remote sensing images and POI data input, as seen in Table 2 and Table 3. In comparison to a single satellite image, many refinements have been seen in the recognition effect with the assistance of socioeconomic attribute data, which further underline the importance of social perception data in regional function recognition applications.
By conducting experiments in two study areas, we set forth two main objectives: (1) to investigate the influence of social perception data on the identification of urban functional areas by adding corresponding multimodal data; and (2) to investigate the impact of the completeness of social perception data on functional area identification by setting up two study areas, new and old.

4.3.2. Results of the Proposed Method and Compared Methods

In order to compare the classification performance, SVM, ResNet-18, FCN, MLP, and 3D-Densenet are selected to perform the classification in this study. It is acknowledged that the traditional methods designed to meet the needs of feature extraction and classification of high-resolution images, especially for complex urban cities, only consider shallow information. When fitting in the data with high-level semantic information, such as socioeconomic data, the traditional method fails to make the features interact with each other as it works to complete the classification work. Therefore, if one kind of data was missing, the classification effect would be profoundly disturbed. With respect to deep learning, this method effectively helps the features to interactively be fused with each other, thus making up for the effects generated by the missing data, and accomplishing the classification task. However, the features incautiously neglect some key features when they are cross-fused, but classify all the features after cross-fusion, which presumably gives rise to the redundancy of information features, as well as imposes an impact on the recognition effect. Due to this, we specify five comparison methods from three aspects to explore the reliability of our method: (1) classification based on direct feature extraction by traditional methods; (2) feature fusion classification based on deep learning; and (3) feature fusion classification based on deep learning by an attention mechanism.
A comparison of the overall accuracy, kappa, and F1 score of the five methods can be found in Table 4. From the table, it is obvious that the traditional method, SVM, does not take the feature interaction problem into account, potentially leading to the absence of the recognition effect, with the overall accuracy turning up at 69.51% and the kappa scoring 60.05%. Multi-layer perceptron layers are fully connected to each other. To avoid overfitting, we use three hidden layers in our experiments. Compared with the SVM, the overall accuracy of the study area 1 is improved by 2.64%, with a kappa of 3.65% and F1 score of 3.69%. Meanwhile, the overall accuracy of study area 2 is improved by 4.39%, with the kappa getting to 5.21% and the F1 score reaching 9.31%. The FCN uses convolutional layers for feature extraction, which enjoys a better feature extraction ability compared to the multilayer perceptron. The table below clearly reveals that study area 1 has an overall accuracy of 79.66%, a kappa of 74.05%, and an F1 score of 62.62%, while study area 2 bears an overall accuracy of 86.60%, a kappa of 70.58%, and an F1 score of 74.92%. Convolutional networks or fully connected networks will suffer from information loss and attrition when passing information, constantly causing gradient disappearance or gradient explosion, which is about to result in very deep networks that cannot be trained. However, Resnet solves this problem, to some extent, by introducing a skip-connected structure that efficiently protects the integrity of the information through directly driving the input information around to the output. As a result, study area 1 shows an overall accuracy of 86.80%, a kappa of 83.07%, and an F1 score of 73.69%. Study area 2 expresses an overall accuracy of 84.16%, a kappa of 50.47%, and an F1 score of 66.31%. Resnet mainly uses the repetition of the original data features only, and the completeness of the data does exert a certain influence on the recognition results, which corresponds to our previous experimental outcomes. This is also the reason why the recognition accuracy of Resnet is lower than that of FCN. In addition, compared to the ResNet, 3D-DenseNet is expected to exploit a more aggressive dense connectivity mechanism: interconnecting all layers. Specifically, each layer accepts all its preceding layers as its additional input. The essence of fusion is supposed to remove redundancy and increase the amount of predictive deterministic information by putting two or more feature maps through some sorts of computation. However, the large heterogeneity of multimodal data seemingly contributes to a reduction in recognition performance that is also begotten by the inability to focus more on the main features during interactive fusion. Based on the above approach, our method adopts the encode–decode idea, uses a similar skip structure as Resnet, uses an attention mechanism to focus on the main features during feature fusion, and uses two losses to impose control on the discrepancy. After enduring the extensive experiments, our method achieves a better performance. Study area 1 has an overall accuracy of 93.65%, a kappa of 91.36%, and an F1 score of 89.54%. Study area 2 has an overall accuracy of 93.27%, a kappa of 93.84%, and an F1 score of 86.00%.
The classification accuracy of each category is shown in Table 5 and Table 6; our method possibly does not reap the best realization in all categories, but our method is the best in general. The visualization results of all compared methods are shown in Figure 11. Combined with the qualitative results in Figure 11, the traditional method, SVM, without involving the modal interaction fusion problem achieves an accuracy of 97.74% and 93.57% for regions lacking socioeconomic attribute data such as water. The multi-layer perceptron takes heed of the modal interaction problem, practically promoting the performance in areas with social attribute data such as residential and commercial areas compared to SVM. The superiority of convolutional layers not only lies in feature extraction but also in feature fusion. The above illustrates why FCN performs better than MLP. Although Densenet, in reusing features, places a great impact on the overall classification performance due to the large heterogeneity of multimodal data, a better classification performance of 93.73% and 98.67% was achieved for health care and industrial sites in study area 1. Resnet, unlike Densenet, employs a residual structure on the upper layer of features, allowing a better interactive fusion of multimodal data. In short, the results from study areas 1 and 2 show a greater improvement compared to 3D-Densenet. As claimed by the visualization results, our method has witnessed a more advanced performance in the identification of urban functional areas.

5. Discussion

In this part, we discuss two main points: (1) the existence of social perception data and the impact of social perception data of different urban structures on the identification of urban functional areas; and (2) the stability of the method from different fusion methods and fusion stages.

5.1. Discussion of Social Perceptual Data Presence and Urban Structure Implications

The results of our experiments have been clearly shown in Table 2 and Table 3. Including social perception data in the research has a strong comparative advantage over only using remote sensing images in identifying urban functional areas, with the overall accuracy obtaining an improvement greater than 20%. The composition of urban functional areas is not only characterized by natural physical attributes, but also by human socioeconomic activities. Therefore, it is relatively difficult to accomplish accurate results by only relying on natural features without taking into account the fact that social perception data matters in the recognition task. Given that study area 1 and study area 2 are at different levels of development phases, and have thus formed different structural compositions of urban functional areas, apparent differences exist in social perception data. A better performance in the recognition effect has been witnessed in study area 1 compared with study area 2, according to the aforementioned outcomes in Table 2 and Table 3. It is further verified that the urban spatial structure of areas with high levels of urban development can provide more useful information in the identification task.

5.2. Discussion of Method Stability

5.2.1. Ablation Study of Loss Functions and Attention Mechanisms

For the multimodal data in study region 1, the proposed network in this paper gives the best overall results with the attention module and the auxiliary loss. The purpose of the auxiliary loss is to maximize the features of both data sources, making them more representative, while the attention mechanism is to focus on the main features with the suppression of unnecessary features, thus allowing a better integration of the extracted features. As shown in Table 7, the overall performance increases the accuracy rate by 2.41% compared to the loss-only case.

5.2.2. Comparison of Different Stages of Feature Fusion

The proposed feature-level (early) fusion method and the baseline decision-level (late) fusion method are shown in Figure 12a,b, respectively. From Table 8, it is obvious that the classification results of late fusion are significantly higher than those of early fusion, with the accuracy rate being raised more than 18% in both study area 1 and study area 2. Early fusion is performed at the feature level, where the features extracted from two different data sources are fused as the final classifier is trained, while in the latter one, a fusion classification evidently showcases the classification outcomes. Compared to early fusion methods, late methods are easily interpreted because the prediction scores of unimodal classifiers are much easier to extract before the decision fusion as it seeks to give weight to direct measurement of the contributions of different input data, thus predicting the classification results of the target in a more accurate way.

5.2.3. Comparison of Different Fusion Methods

In our experiments, illustrated in Table 9, a comparison between two study areas was made for the results of using different fusion methods (Figure 9), i.e., series and element-by-element summation. It can be observed that there is no significant difference between the test results between the two fusion methods, since almost all the variations of the obtained metric are close to 1%. This indicates that the choice of fusion methods employed in the proposed deep multimodal fusion network is of no great importance in assembling the experimental dataset.

6. Conclusions

The feature forms and semantic features possessed by remote sensing data and social perception data differ. How to make full use of the low-level semantic information related to remote sensing and high-level semantic information of social perception data is the key to improve the recognition accuracy of urban functional areas. In this paper, based on the advantage of feature extraction and expression of deep convolutional networks, we propose a framework to complete urban identification by fusing satellite images, POI, and building footprint data. This framework, compared with other modeling methods, achieves the feature fusion process by leveraging a multi-branch network structure with an attention mechanism that can focus attention on the most informative part of the most meaningful feature map, such that the semantic attributes of the input features can be fully expressed.
In terms of the method, this paper makes the convolutional structure extract as many features as possible by constructing a loss function, but not all features have the same importance, which may increase the computational burden of the network to some extent. The attention mechanism introduced in this paper strengthens the recognition ability by giving a large weight to the main features during feature fusion, but the attention mechanism may not be fully utilized compared to the network as a whole. The experimental results show that the model recognition ability is greatly improved by adding socially perceptive data. However, some problems that need to be further solved still exist. For example, the recognition effect is not significantly improved after adding building outline data, to some degree, influencing the accurate recognition of some functional areas. Presumably, the main reason for this is that the building footprint data that inherently exhibit is physical attribute features, invoking a data redundancy problem and impacts the recognition performance.
In future work, we will first fully explore the application of social perception data in urban function recognition, such as street view. Second, for the construction of the method, we will take the suitable feature extraction method from the data’s own characteristics as much as possible, as well as make the network simpler and easier to reproduce to the furthest extent. Finally, our method has been proved to be effective for the analysis of Ningbo, but its adaptability to other regions in China and the world needs further validation.

Author Contributions

Conceptualization, L.X.; methodology, L.X.; software, C.Z.; validation, Y.D., J.H. and K.L.; formal analysis, J.H. and K.L.; data curation, Y.D.; writing—original draft preparation, L.X.; writing—review and editing, X.F.; visualization, J.H.; supervision, Y.D. All authors have read and agreed to the published version of the manuscript.

Funding

Science and technology project of Zhejiang Provincial Department of Natural Resources (2021-30, 2021-31).

Institutional Review Board Statement

Not applicable.

Informed Consent Statement

Not applicable.

Data Availability Statement

Not applicable.

Conflicts of Interest

The authors declare no conflict of interest.

References

  1. Tonne, C.; Halonen, J.I.; Beevers, S.D.; Dajnak, D.; Gulliver, J.; Kelly, F.J.; Wilkinson, P.; Anderson, H.R. Long-term traffic air and noise pollution in relation to mortality and hospital readmission among myocardial infarction survivors. Int. J. Hyg. Environ. Health 2016, 219, 72–78. [Google Scholar] [CrossRef] [PubMed] [Green Version]
  2. Liu, Y.; Liu, X.; Gao, S.; Gong, L.; Kang, C.; Zhi, Y.; Chi, G.; Shi, L. Social Sensing: A New Approach to Understanding Our Socioeconomic Environments. Ann. Assoc. Am. Geogr. 2015, 105, 512–530. [Google Scholar] [CrossRef]
  3. Long, Y.; Shen, Z. V-BUDEM: A Vector-Based Beijing Urban Development Model for Simulating Urban Growth. In Geospatial Analysis to Support Urban Planning in Beijing; GeoJournal Library; Springer: Cham, Switzerland, 2015; pp. 91–112. [Google Scholar]
  4. Zhang, P.; Li, Y.; Jing, W.; Yang, D.; Zhang, Y.; Liu, Y.; Geng, W.; Rong, T.; Shao, J.; Yang, J.; et al. Comprehensive Assessment of the Effect of Urban Built-Up Land Expansion and Climate Change on Net Primary Productivity. Complexity 2020, 2020, 8489025. [Google Scholar] [CrossRef]
  5. Anelli, D.; Sica, F. The Financial Feasibility Analysis of Urban Transformation Projects: An Application of a Quick Assessment Model. In New Metropolitan Perspectives; Springer: Cham, Switzerland, 2021; pp. 462–474. [Google Scholar]
  6. Anttiroiko, A.-V. Urban Planning 2.0. Int. J. E-Plan. Res. 2012, 1, 16–30. [Google Scholar] [CrossRef]
  7. Banzhaf, E.; Netzband, M. Monitoring urban land use changes with remote sensing techniques. In Applied Urban Ecology: A Global Framework; Wiley: Hoboken, NJ, USA, 2011; pp. 18–32. [Google Scholar]
  8. Herold, M.; Couclelis, H.; Clarke, K.C. The role of spatial metrics in the analysis and modeling of urban land use change. Comput. Environ. Urban. Syst. 2005, 29, 369–399. [Google Scholar] [CrossRef]
  9. Leichtle, T.; Geiß, C.; Wurm, M.; Lakes, T.; Taubenböck, H. Unsupervised change detection in VHR remote sensing image—An object-based clustering approach in a dynamic urban environment. Int. J. Appl. Earth Obs. Geoinf. 2017, 54, 15–27. [Google Scholar] [CrossRef]
  10. Pacifici, F.; Chini, M.; Emery, W. A neural network approach using multi-scale textural metrics from very high-resolution panchromatic imagery for urban land-use classification. Remote Sens. Environ. 2009, 113, 1276–1292. [Google Scholar] [CrossRef]
  11. Myint, S.W.; Gober, P.; Brazel, A.; Grossman-Clarke, S.; Weng, Q. Per-pixel vs. object-based classification of urban land cover extraction using high spatial resolution imagery. Remote Sens. Environ. 2011, 115, 1145–1161. [Google Scholar] [CrossRef]
  12. Zhang, C.; Sargent, I.M.J.; Pan, X.; Li, H.; Gardiner, A.; Hare, J.; Atkinson, P.M. Joint Deep Learning for land cover and land use classification. Remote Sens. Environ. 2019, 221, 173–187. [Google Scholar] [CrossRef] [Green Version]
  13. Li, M.; Stein, A.; Bijker, W.; Zhan, Q. Urban land use extraction from Very High Resolution remote sensing imagery using a Bayesian network. ISPRS J. Photogramm. Remote Sens. 2016, 122, 192–205. [Google Scholar] [CrossRef]
  14. Zhong, Y.; Zhu, Q.; Zhang, L. Scene Classification Based on the Multifeature Fusion Probabilistic Topic Model for High Spatial Resolution Remote Sensing Imagery. IEEE Trans. Geosci. Remote Sens. 2015, 53, 6207–6222. [Google Scholar] [CrossRef]
  15. Wen, D.; Huang, X.; Zhang, L.; Benediktsson, J.A. A Novel Automatic Change Detection Method for Urban High-Resolution Remotely Sensed Imagery Based on Multiindex Scene Representation. IEEE Trans. Geosci. Remote Sens. 2016, 54, 609–625. [Google Scholar] [CrossRef]
  16. Zhu, Q.; Sun, X.; Zhong, Y.; Zhang, L. High-resolution remote sensing image scene understanding: A review. In Proceedings of the IGARSS 2019-2019 IEEE International Geoscience and Remote Sensing Symposium, Yokohama, Japan, 28 July–2 August 2019; pp. 3061–3064. [Google Scholar]
  17. Yang, Y.; Newsam, S. Bag-of-visual-words and spatial extensions for land-use classification. In Proceedings of the 18th SIGSPATIAL International Conference on Advances in Geographic Information Systems, San Jose, CA, USA, 2–5 November 2010; pp. 270–279. [Google Scholar]
  18. Zhu, Q.; Zhong, Y.; Zhao, B.; Xia, G.-S.; Zhang, L. Bag-of-Visual-Words Scene Classifier with Local and Global Features for High Spatial Resolution Remote Sensing Imagery. IEEE Geosci. Remote Sens. Lett. 2016, 13, 747–751. [Google Scholar] [CrossRef]
  19. Feng, Y.; Huang, Z.; Wang, Y.L.; Wan, L.; Liu, Y.; Zhang, Y.; Shan, X. An SOE-Based Learning Framework Using Multisource Big Data for Identifying Urban Functional Zones. IEEE J. Sel. Top. Appl. Earth Obs. Remote Sens. 2021, 14, 7336–7348. [Google Scholar] [CrossRef]
  20. Bao, H.; Ming, D.; Guo, Y.; Zhang, K.; Zhou, K.; Du, S. DFCNN-Based Semantic Recognition of Urban Functional Zones by Integrating Remote Sensing Data and POI Data. Remote Sens. 2020, 12, 1088. [Google Scholar] [CrossRef] [Green Version]
  21. Zhao, W.; Bo, Y.; Chen, J.; Tiede, D.; Blaschke, T.; Emery, W.J. Exploring semantic elements for urban scene recognition: Deep integration of high-resolution imagery and OpenStreetMap (OSM). ISPRS J. Photogramm. Remote Sens. 2019, 151, 237–250. [Google Scholar] [CrossRef]
  22. Zhang, X.; Du, S.; Zheng, Z. Heuristic sample learning for complex urban scenes: Application to urban functional-zone mapping with VHR images and POI data. ISPRS J. Photogramm. Remote Sens. 2020, 161, 1–12. [Google Scholar] [CrossRef]
  23. Schultz, M.; Voss, J.; Auer, M.; Carter, S.; Zipf, A. Open land cover from OpenStreetMap and remote sensing. Int. J. Appl. Earth Obs. Geoinform. 2017, 63, 206–213. [Google Scholar] [CrossRef]
  24. Yao, Y.; Li, X.; Liu, X.; Liu, P.; Liang, Z.; Zhang, J.; Mai, K. Sensing spatial distribution of urban land use by integrating points-of-interest and Google Word2Vec model. Int. J. Geogr. Inf. Sci. 2016, 31, 825–848. [Google Scholar] [CrossRef]
  25. Hu, T.; Yang, J.; Li, X.; Gong, P. Mapping Urban Land Use by Using Landsat Images and Open Social Data. Remote Sens. 2016, 8, 151. [Google Scholar] [CrossRef]
  26. Tu, W.; Hu, Z.; Li, L.; Cao, J.; Jiang, J.; Li, Q.; Li, Q. Portraying urban functional zones by coupling remote sensing imagery and human sensing data. Remote Sens. 2018, 10, 141. [Google Scholar] [CrossRef] [Green Version]
  27. Gong, P.; Chen, B.; Li, X.; Liu, H.; Wang, J.; Bai, Y.; Chen, J.; Chen, X.; Fang, L.; Feng, S. Mapping essential urban land use categories in China (EULUC-China): Preliminary results for 2018. Sci. Bull. 2019, 65, 182–187. [Google Scholar] [CrossRef] [Green Version]
  28. Liu, X.; He, J.; Yao, Y.; Zhang, J.; Liang, H.; Wang, H.; Hong, Y. Classifying urban land use by integrating remote sensing and social media data. Int. J. Geogr. Inf. Sci. 2017, 31, 1675–1696. [Google Scholar] [CrossRef]
  29. Tu, W.; Cao, J.; Yue, Y.; Shaw, S.-L.; Zhou, M.; Wang, Z.; Chang, X.; Xu, Y.; Li, Q. Coupling mobile phone and social media data: A new approach to understanding urban functions and diurnal patterns. Int. J. Geogr. Inf. Sci. 2017, 31, 2331–2358. [Google Scholar] [CrossRef]
  30. Srivastava, S.; Vargas-Muñoz, J.E.; Tuia, D. Understanding urban landuse from the above and ground perspectives: A deep learning, multimodal solution. Remote Sens. Environ. 2019, 228, 129–143. [Google Scholar] [CrossRef] [Green Version]
  31. Hong, D.; Gao, L.; Yokoya, N.; Yao, J.; Chanussot, J.; Du, Q.; Zhang, B. More Diverse Means Better: Multimodal Deep Learning Meets Remote-Sensing Imagery Classification. IEEE Trans. Geosci. Remote Sens. 2021, 59, 4340–4354. [Google Scholar] [CrossRef]
  32. Audebert, N.; Le Saux, B.; Lefèvre, S. Beyond RGB: Very high resolution urban remote sensing with multimodal deep networks. ISPRS J. Photogramm. Remote Sens. 2018, 140, 20–32. [Google Scholar] [CrossRef] [Green Version]
  33. Cao, R.; Tu, W.; Yang, C.; Li, Q.; Liu, J.; Zhu, J.; Zhang, Q.; Li, Q.; Qiu, G. Deep learning-based remote and social sensing data fusion for urban region function recognition. ISPRS J. Photogramm. Remote Sens. 2020, 163, 82–97. [Google Scholar] [CrossRef]
  34. Li, S.; Song, W.; Fang, L.; Chen, Y.; Ghamisi, P.; Benediktsson, J.A. Deep learning for hyperspectral image classification: An overview. IEEE Trans. Geosci. Remote Sens. 2019, 57, 6690–6709. [Google Scholar] [CrossRef] [Green Version]
  35. Cheng, G.; Han, J.; Lu, X. Remote sensing image scene classification: Benchmark and state of the art. Proc. IEEE 2017, 105, 1865–1883. [Google Scholar] [CrossRef] [Green Version]
  36. Cheng, G.; Han, J. A survey on object detection in optical remote sensing images. ISPRS J. Photogramm. Remote Sens. 2016, 117, 11–28. [Google Scholar] [CrossRef] [Green Version]
  37. Haut, J.M.; Paoletti, M.E.; Plaza, J.; Plaza, A.; Li, J. Visual attention-driven hyperspectral image classification. IEEE Trans. Geosci. Remote Sens. 2019, 57, 8065–8080. [Google Scholar] [CrossRef]
  38. Liu, X.; Long, Y.E.; Planning, P.B. Design. Automated identification and characterization of parcels with OpenStreetMap and points of interest. Environ. Plan. B Plan. Des. 2016, 43, 341–360. [Google Scholar] [CrossRef]
  39. Zhang, K.; Ming, D.; Du, S.; Xu, L.; Ling, X.; Zeng, B.; Lv, X. Distance Weight-Graph Attention Model-Based High-Resolution Remote Sensing Urban Functional Zone Identification. IEEE Trans. Geosci. Remote Sens. 2021, 60, 1–18. [Google Scholar] [CrossRef]
  40. Jiang, J.; Zheng, L.; Luo, F.; Zhang, Z. Rednet: Residual encoder-decoder network for indoor rgb-d semantic segmentation. arXiv 2018, arXiv:1806.01054. [Google Scholar]
  41. Badrinarayanan, V.; Kendall, A.; Cipolla, R. Segnet: A deep convolutional encoder-decoder architecture for image segmentation. IEEE Trans. Pattern Anal. Mach. Intell. 2017, 39, 2481–2495. [Google Scholar] [CrossRef]
  42. Qassim, H.; Verma, A.; Feinzimer, D. Compressed residual-VGG16 CNN model for big data places image recognition. In Proceedings of the 2018 IEEE 8th Annual Computing and Communication Workshop and Conference (CCWC), Las Vegas, NV, USA, 8–10 January 2018; pp. 169–175. [Google Scholar]
  43. Hong, D.; Hu, J.; Yao, J.; Chanussot, J.; Zhu, X.X. Multimodal remote sensing benchmark datasets for land cover classification with a shared and specific feature learning model. ISPRS J. Photogramm. Remote Sens. 2021, 178, 68–80. [Google Scholar] [CrossRef]
  44. Cao, R.; Zhu, J.; Tu, W.; Li, Q.; Cao, J.; Liu, B.; Zhang, Q.; Qiu, G. Integrating aerial and street view images for urban land use classification. Remote Sens. 2018, 10, 1553. [Google Scholar] [CrossRef] [Green Version]
  45. Woo, S.; Park, J.; Lee, J.-Y.; Kweon, I.S. Cbam: Convolutional block attention module. In Proceedings of the European Conference on Computer Vision (ECCV), Munich, Germany, 8–14 September 2018; pp. 3–19. [Google Scholar]
Figure 1. The two study areas utilized in this paper.
Buildings 12 00556 g001
Figure 2. Point of interest (POI) data for Ningbo in June 2019. (a) Spatial distribution of POIs. (b) Density of POIs counted in segmentation units.
Buildings 12 00556 g002
Figure 3. Building footprint of the study area. (a) building height distribution. (b) building length distribution. (c) building area distribution.
Buildings 12 00556 g003
Figure 4. Framework of urban functional area identification.
Buildings 12 00556 g004
Figure 5. Road network processing and block generation: (a) original OSM road network; (b) road buffers from OSM; (c) segmentation results based on OSM road buffers; (d) raw image; (e) the OSM before editing; and (f) the OSM after editing.
Buildings 12 00556 g005
Figure 6. Generation of the footprint feature tensor.
Buildings 12 00556 g006
Figure 7. Generation of the footprint feature tensor.
Buildings 12 00556 g007
Figure 8. Multimodal fusion network.
Buildings 12 00556 g008
Figure 9. Method of feature fusion: (a) feature cascade; (b) feature element-wise sum.
Buildings 12 00556 g009
Figure 10. (a) CBAM module, (b) channel attention module, and (c) spatial attention module.
Buildings 12 00556 g010
Figure 11. Visualization results: (a) Area_1 Visualization results; (b) Area_2 Visualization results.
Buildings 12 00556 g011aBuildings 12 00556 g011b
Figure 12. Different stages of integration: (a) early fusion; and (b) late fusion.
Buildings 12 00556 g012
Table 1. Number of functional blocks (A: Residential area, B: Administrative office land, C: Land for education and scientific research, D: Sports and leisure land, E: Land for Commercial Plaza, F: Commercial office land, G: Medical and health land, H: Industrial land, I: Land for transportation, J: Park green space, K: waters, L: Area to be constructed, M: Commercial residential land).
NameABCDEFGHIJKLMSUM
Area_12912756674932523144416615725
Area_247317241853466931311205
Table 2. Overall classification results and per category results for Area_1. (I: image, F: building footprint, P: points of interest).
NameABCDEFGHIJKLMOAAAKappaAvg.F1
I56.9836.3031.8365.1744.9440.427.4229.8142.7060.6596.2368.1043.0661.8351.6973.5029.69
I + F60.3349.1710.2665.0131.5034.716.5937.8266.7621.9897.7660.8948.3058.8449.3671.4530.54
I + P96.2488.3695.9799.8998.8496.8853.5696.1279.8282.4994.4167.8099.9891.26 89.3190.5786.46
I + P + F96.8691.0096.5499.9497.9186.7572.1497.4697.4271.3894.0775.8899.9893.5591.2491.2688.46
Table 3. Overall classification results and per category results for Area_2. (I: image, F: building footprint, P: points of interest).
NameABCDEFGHIJKLMOAAAKappaAvg.F1
I58.3335.2663.0976.5959.4543.9542.4566.2756.0158.2091.2059.6146.8671.6461.2379.3945.85
I + F66.8653.1570.0377.5263.1358.3555.1973.1063.5348.3491.8969.8154.7376.3967.5482.4056.92
I + P95.8866.3098.1384.2486.5677.9792.6187.8578.6567.1589.2876.4087.4091.9584.8993.0283.23
I + P + F96.9770.7398.1285.6287.2977.5993.1388.4483.0275.9792.2978.5285.6792.7686.6793.5284.77
Table 4. Overall classification results of the compared methods.
MethodArea_1Area_2
OAKappaAvg.F1OAKappaAvg.F1
SVM69.5160.0554.7772.0666.2447.08
MLP72.1563.7058.4676.4571.4556.39
FCN79.6674.0562.6286.6070.5874.92
3D-Densenet76.8869.4459.4673.6143.0034.85
Resnet86.8083.0773.6984.1650.4766.31
ours93.6591.3689.5493.2793.8486.00
Table 5. Per category results for Area_1. The best results are highlighted in bold.
NameABCDEFGHIJKLMAvg.F1
SVM69.3032.5063.2297.5456.3045.1954.3045.8687.5166.2897.7439.8696.5054.77
MLP72.3484.9574.5297.2760.0541.3273.8062.3572.3052.7788.2643.7299.5858.46
FCN88.8729.0352.9799.3679.3372.6855.7690.7277.9152.8550.5655.8184.0862.62
3D-Densenet73.3358.2781.5695.6790.1393.7398.6777.1388.9479.7544.4855.5389.3659.46
Resnet94.4332.3567.4790.8093.5093.3269.6678.9881.1968.0668.5175.8151.0073.69
ours94.2383.2690.6099.9399.5183.4890.5597.3198.0781.5696.3681.7899.9989.54
Table 6. Per category results for Area_2. The best results are highlighted in bold.
NameABCDEFGHIJKLMAvg.F1
SVM58.2358.7063.8869.4058.6752.0460.3668.3558.0652.0093.5765.1655.0772.06
MLP67.2961.3970.7776.4170.0864.3540.6872.1853.5950.4789.6465.0353.6876.45
FCN79.6356.4397.0381.9683.4466.8995.2781.5273.3770.5992.0374.5264.1786.60
3D-Densenet75.596.2180.9080.2438.4575.4733.8357.1760.57————38.1647.5773.61
Resnet87.800.1081.7363.8695.9192.6793.3484.7270.2650.6585.5776.5258.9184.16
ours96.8377.0698.4786.3088.0783.6992.7188.8987.1373.8693.1680.2889.0186.00
Table 7. Ablation study of loss functions and attention mechanisms. The best results are highlighted in bold (Area_1).
Auxiliary LossAttentional MechanismsAccuracyKappaAvg.F1
91.2491.2688.46
91.9690.7489.72
93.6591.3689.54
● means use this module, ○ means do not use this module.
Table 8. Comparison of testing results with different fusion methods.
RegionFusion MethodMetric
AccuracyKappaAvg.F1
Area_1Early fusion65.7872.5247.85
Late fusion91.2491.2688.46
Area_2Early fusion68.6079.3447.54
Late fusion86.6793.5284.77
Table 9. Comparison of testing results with different fusion methods. The best results are highlighted in bold.
RegionFusion MethodMetric
AccuracyKappaAvg.F1
Area_1concat91.2491.2688.46
sum90.1491.3787.62
Area_2concat86.6793.5284.77
sum87.9193.7085.69
Publisher’s Note: MDPI stays neutral with regard to jurisdictional claims in published maps and institutional affiliations.

