Article

Application of Iron Ore Tailings and Phosphogypsum to Create Artificial Rockfills Used in Rock-Filled Concrete

1
CITIC Construction Co., Ltd., Beijing 100027, China
2
College of Civil and Transportation Engineering, Hohai University, Nanjing 210098, China
3
School of Geography and Planning, Sun Yat-sen University, Guangzhou 510006, China
4
State Key Laboratory of Hydroscience and Engineering, Tsinghua University, Beijing 100084, China
*
Author to whom correspondence should be addressed.
Buildings 2022, 12(5), 555; https://doi.org/10.3390/buildings12050555
Submission received: 31 March 2022 / Revised: 21 April 2022 / Accepted: 22 April 2022 / Published: 26 April 2022

Abstract

:
Rock-filled concrete (RFC) has good performance in terms of energy savings, cost reduction, and CO2 emissions as a novel massive concrete construction technology. There have been studies into replacing natural rocks in RFC with large blocks of solid waste, and this method has been used on several construction sites. However, the granular and powdery solid waste utilized in RFC is limited, as a consequence of the special requirement of self-compacting concrete (SCC) in RFC. The goal of this paper is to increase the amount of granular and powdery solid waste in RFC. Iron ore tailing (IOT) and phosphogypsum (PG) were used separately as granular and powdery solid waste. The modified PG, ground blast-furnace slag (GBFS), steel slag, and cement clinker are combined to form parathion gypsum slag cement in a specific proportion, with the ratio of PG, GBFS, steel slag, and cement being 47:47:2:2. To replace the natural rocks in RFC, artificial rockfills made of IOT and parathion gypsum slag cement are used to increase the dosage of solid waste. The artificial rockfills were formed using three methods: compressing, roller compacting, and normal vibrating. When the compressive strength and material costs of the three types of artificial rockfills are compared, the compressing method is the best for maximizing the IOT. In artificial rockfills, the mass fraction of granular solid waste is 83.3%, and the mass fraction of total solid waste is 99.3%.

1. Introduction

With the advancement of global economic development and industrialization, a large number of industrial solid wastes such as tailings, industrial waste residue, and construction waste are produced in the mining and infrastructure construction processes [1]. Iron ore tailing (IOT) is an industrial solid waste produced after the extraction and processing of iron ores that is classified as a fast-accumulating waste. In 2021, global iron ore production was estimated to be around 2.6 billion tons and the world usable iron ore production was led by Australia, Brazil, China, and India [2]. In Western Australia, the production of one ton of iron ore leads to the accumulation of two tons of IOT [3]. According to experts, each ton of beneficiated iron ore induces 0.4 tons of tailings, and Brazil generates 260–275 million tons of IOT each year [4,5]. Tailings generation accounts for approximately 10–25 wt% of total iron ore mine production in India [6]. In China, the comprehensive utilization ratio of tailings was below 30% in 2018 [7,8,9]. Another type of waste is phosphogypsum (PG), which is a by-product of the phosphate fertilizer industry [10]. Per ton of phosphoric acid produced, nearly five tons of PG are generated [11]. The accumulation of substantial quantities of IOT or PG not only takes up a large percentage of land [12,13], but also incurs significant financial costs for construction and maintenance. Furthermore, serious ecological environmental destruction risks, such as groundwater pollution, dust pollution, and land desertification, are occurring in the vicinity of IOT or PG dams [12,14]. The tailing dams are also regarded as a danger to the health and safety of residents. When tailing dams fail, tailings leakage causes large areas to flood, resulting in human fatalities and long-term devastation to communities, ecosystems, and the environment [15,16]. The significant proportion of PG is nevertheless able to be disposed of in sizable storage facilities and into bodies of water, resulting in serious contamination of soil, water, and the atmosphere [12]. Radon gas, F ion contamination in the atmosphere, radionuclide contamination in groundwater, acidity or mobile anions, radioactive dust inhalation, direct exposure to radiation, and water seepage during long-term downward leaching can all cause contamination [17]. As a result, the reuse of IOT and PG is a critical issue. Recycling valuable components, manufacturing construction materials, and land reclamation are the three main directions for the development and utilization of IOT [18,19]. A large number of construction materials are required during the industrialization and urbanization processes. If a considerable portion of industrial waste material can be reprocessed and is used in infrastructural development, the environment and residents will be improved and the cost of building materials will be reduced [20,21,22,23].
The use of rock-filled concrete (RFC) in mass concrete construction is a fairly new concept [24]. More than half of the volume of RFC is made up of rockfills with diameters greater than 300 mm, with the remainder composed of self-compacting concrete (SCC) with good filling performance [25,26]. Large particle size solid wastes with particle sizes larger than 300 mm, such as waste concrete and waste stone, can be used directly to replace natural rockfill in RFC. Granular industrial solid wastes with particle sizes ranging from 0.075 to 20 mm, such as IOT, can be used in place of natural gravel aggregate for SCC [27,28]. Powdery industrial solid waste, such as PG, with particle sizes less than 0.075 mm, can be used as powder material for SCC [11,29]. SCC with high fluidity and segregation resistance has stringent particle size and gradation requirements for its coarse and fine aggregates [30,31,32]. As a result, granular industrial solid wastes such as IOT must generally be sieved and graded before they can be used to replace a portion of the aggregate in SCC, and their utilization is limited. SCC, on the other hand, requires a certain strength, which necessitates a certain amount of cementitious materials in powder materials and limits the use of powdered solid waste in SCC to a certain extent. At the same time, the volume of a rockfill takes up more than half the volume of RFC, decreasing the quantity of powdered solid waste in RFC even further. If IOT and PG are used to make artificial rockfills instead of natural rockfills, the utilization of IOT and PG can be increased. Artificial rockfills with no calcination, low cement consumption, and high waste content have become a solution in terms of low energy consumption and improving the utilization rate of IOT and PG.
The composition and fineness of IOT are relatively stable. The chemical composition of IOT analysis reveals that the majority of the iron phase in the tailings exists in a stable form, which does not produce rust and has no negative impact on the performance of concrete. The composition of IOT meets the requirements of construction sand and gravel [33]. Cai et al. prepared C70 pumping concrete by completely replacing natural sand with IOT sand and replacing crushed gravel with IOT coarse aggregate gravel [34]. The fineness modulus of IOT sand used was only 2.5, which belongs to medium sand. Compared with concrete using natural sand, the concrete with IOT has poor workability and segregation resistance [35]. As current mining and processing technology primarily employs three-stage grinding, the discharged waste particles are becoming much finer. This method is insufficient for the use of fine-grained IOT. Zhao et al. established ultra-high performance concrete (UHPC) by replacing natural sand with IOT sand with varying content. They discovered that the overall mechanical properties of concrete deteriorated as the IOT content increased [36]. As the IOT sand in the target concrete is ultra-fine sand, its content is higher than in ultra-fine sand concrete and contains less cement. These two characteristics indicate that the target concrete is a type of dry and hard cement concrete. This type of concrete is typically formed using a vibration rolling forming method, such as roller compacted concrete, and a pressure forming method, such as pressing unburned bricks and blocks [37,38]. Ding et al. used phosphogypsum, ground blast-furnace slag (GBFS), steel slag, and cement clinker in proportions of 45%, 48%, 2%, and 5% as cementitious materials to prepare parathion gypsum slag cement concrete with a 28 d strength of 38 MPa [39]. Microscopic analysis revealed a significant amount of ettringite, C-S-H, and a slight amount of calcium hydroxide in the hydration process. The chloride ion permeability of parathion phosphogypsum slag cement concrete is better than that of Portland slag cement concrete and conventional Portland cement concrete. This is because parathion gypsum slag cement can generate more ettringite to solidify chloride ions. Parathion gypsumbecause slag cement was created by combining phosphogypsum with GBFS, steel slag, cement clinker, or limestone powder. The phosphogypsum content can reach 50%, and the 28 d strength can reach 50 MPa. The high phosphogypsum content and the adhesive strength similar to ordinary Portland cement contribute to the widespread use of phosphogypsum in construction materials.
Although research into the use of IOT and PG in concrete is being conducted, rockfills using IOT and PG with various forming methods are still lacking. Thus, this paper aims to obtain a kind of artificial rockfill that does not require calcination, steam curing, or a strength grade greater than C20 by using parathion gypsum slag cement instead of ordinary Portland cement and IOT sand instead of natural sand in order to improve the utilization rate of granular and powdered industrial solid waste in rock-filled concrete.

2. Materials and Methods
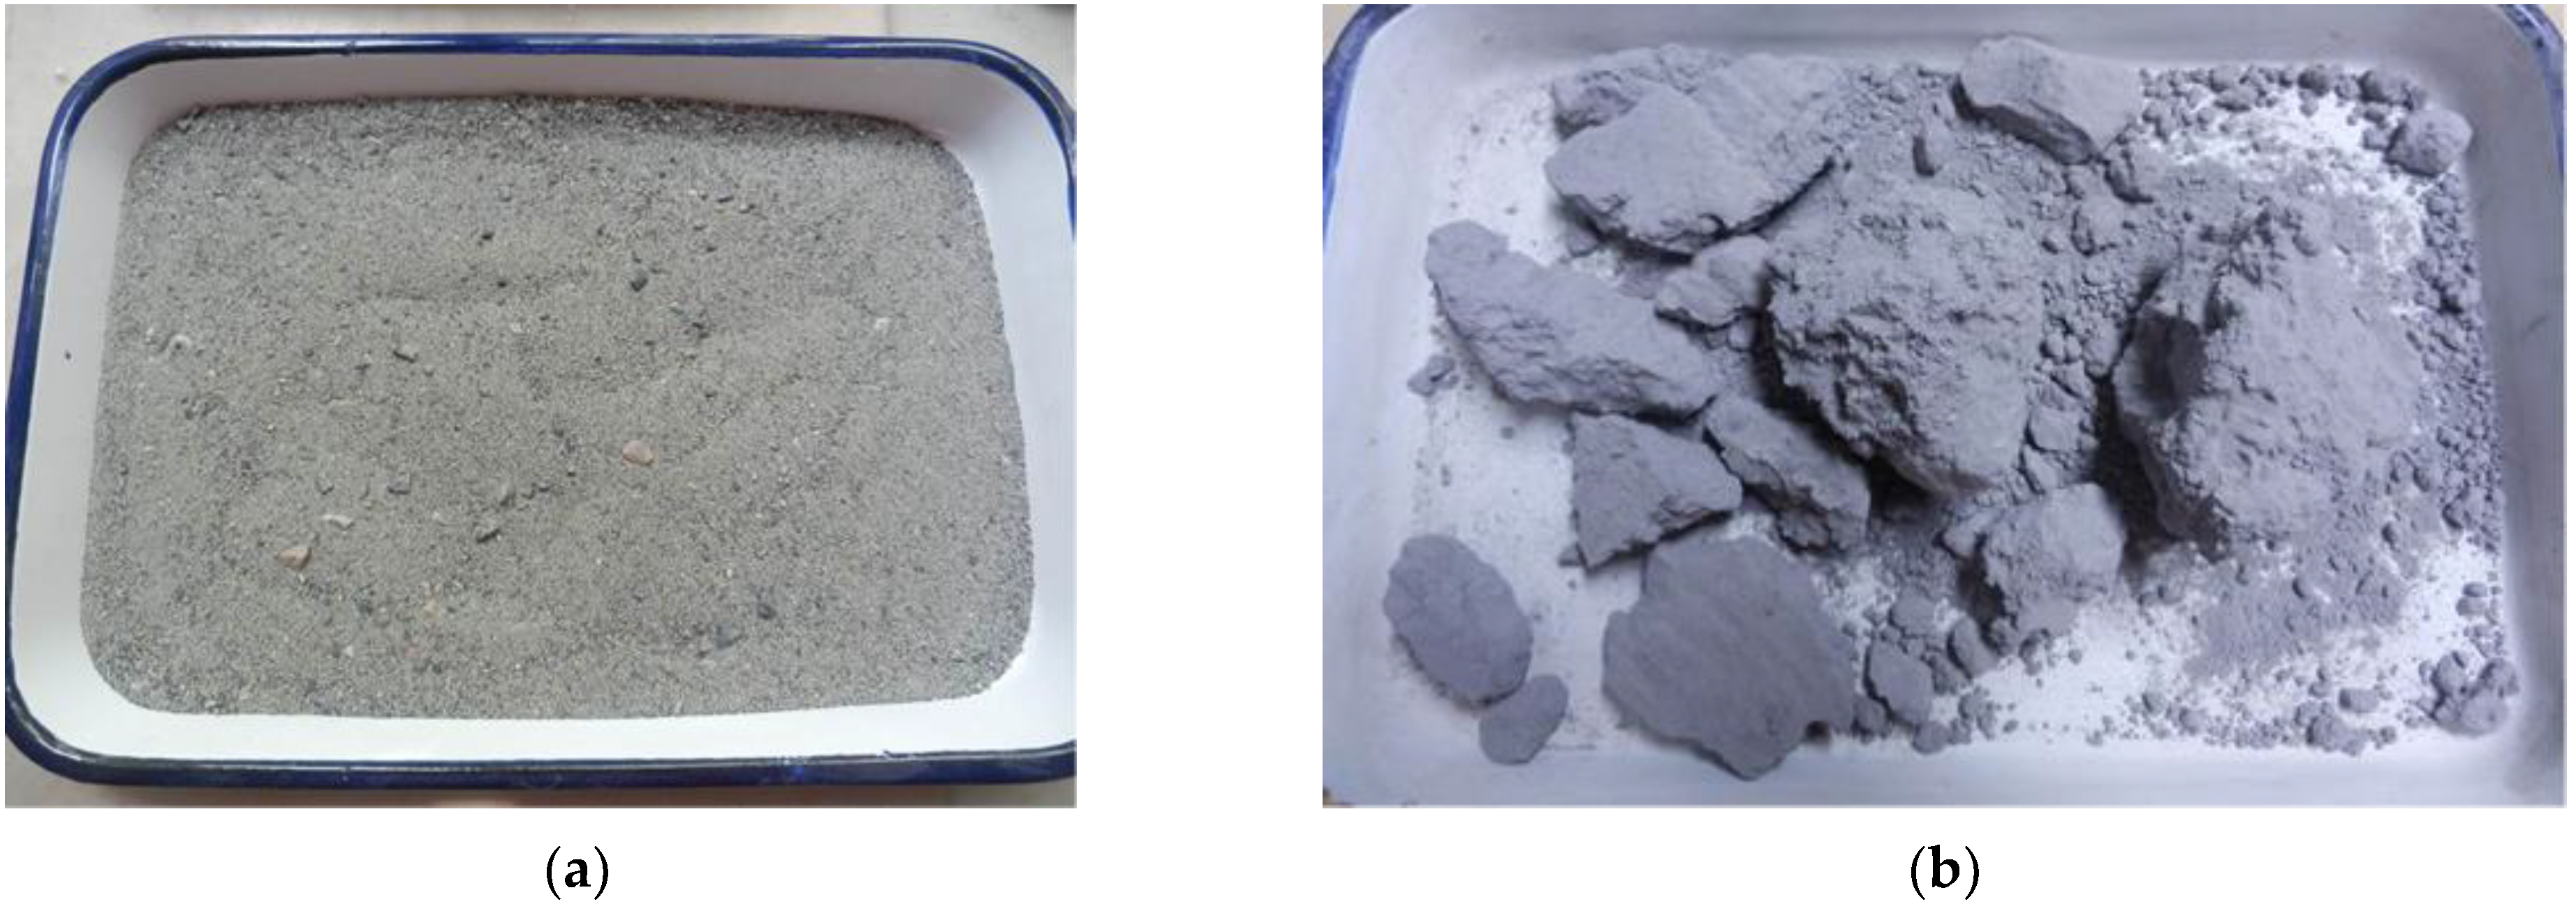
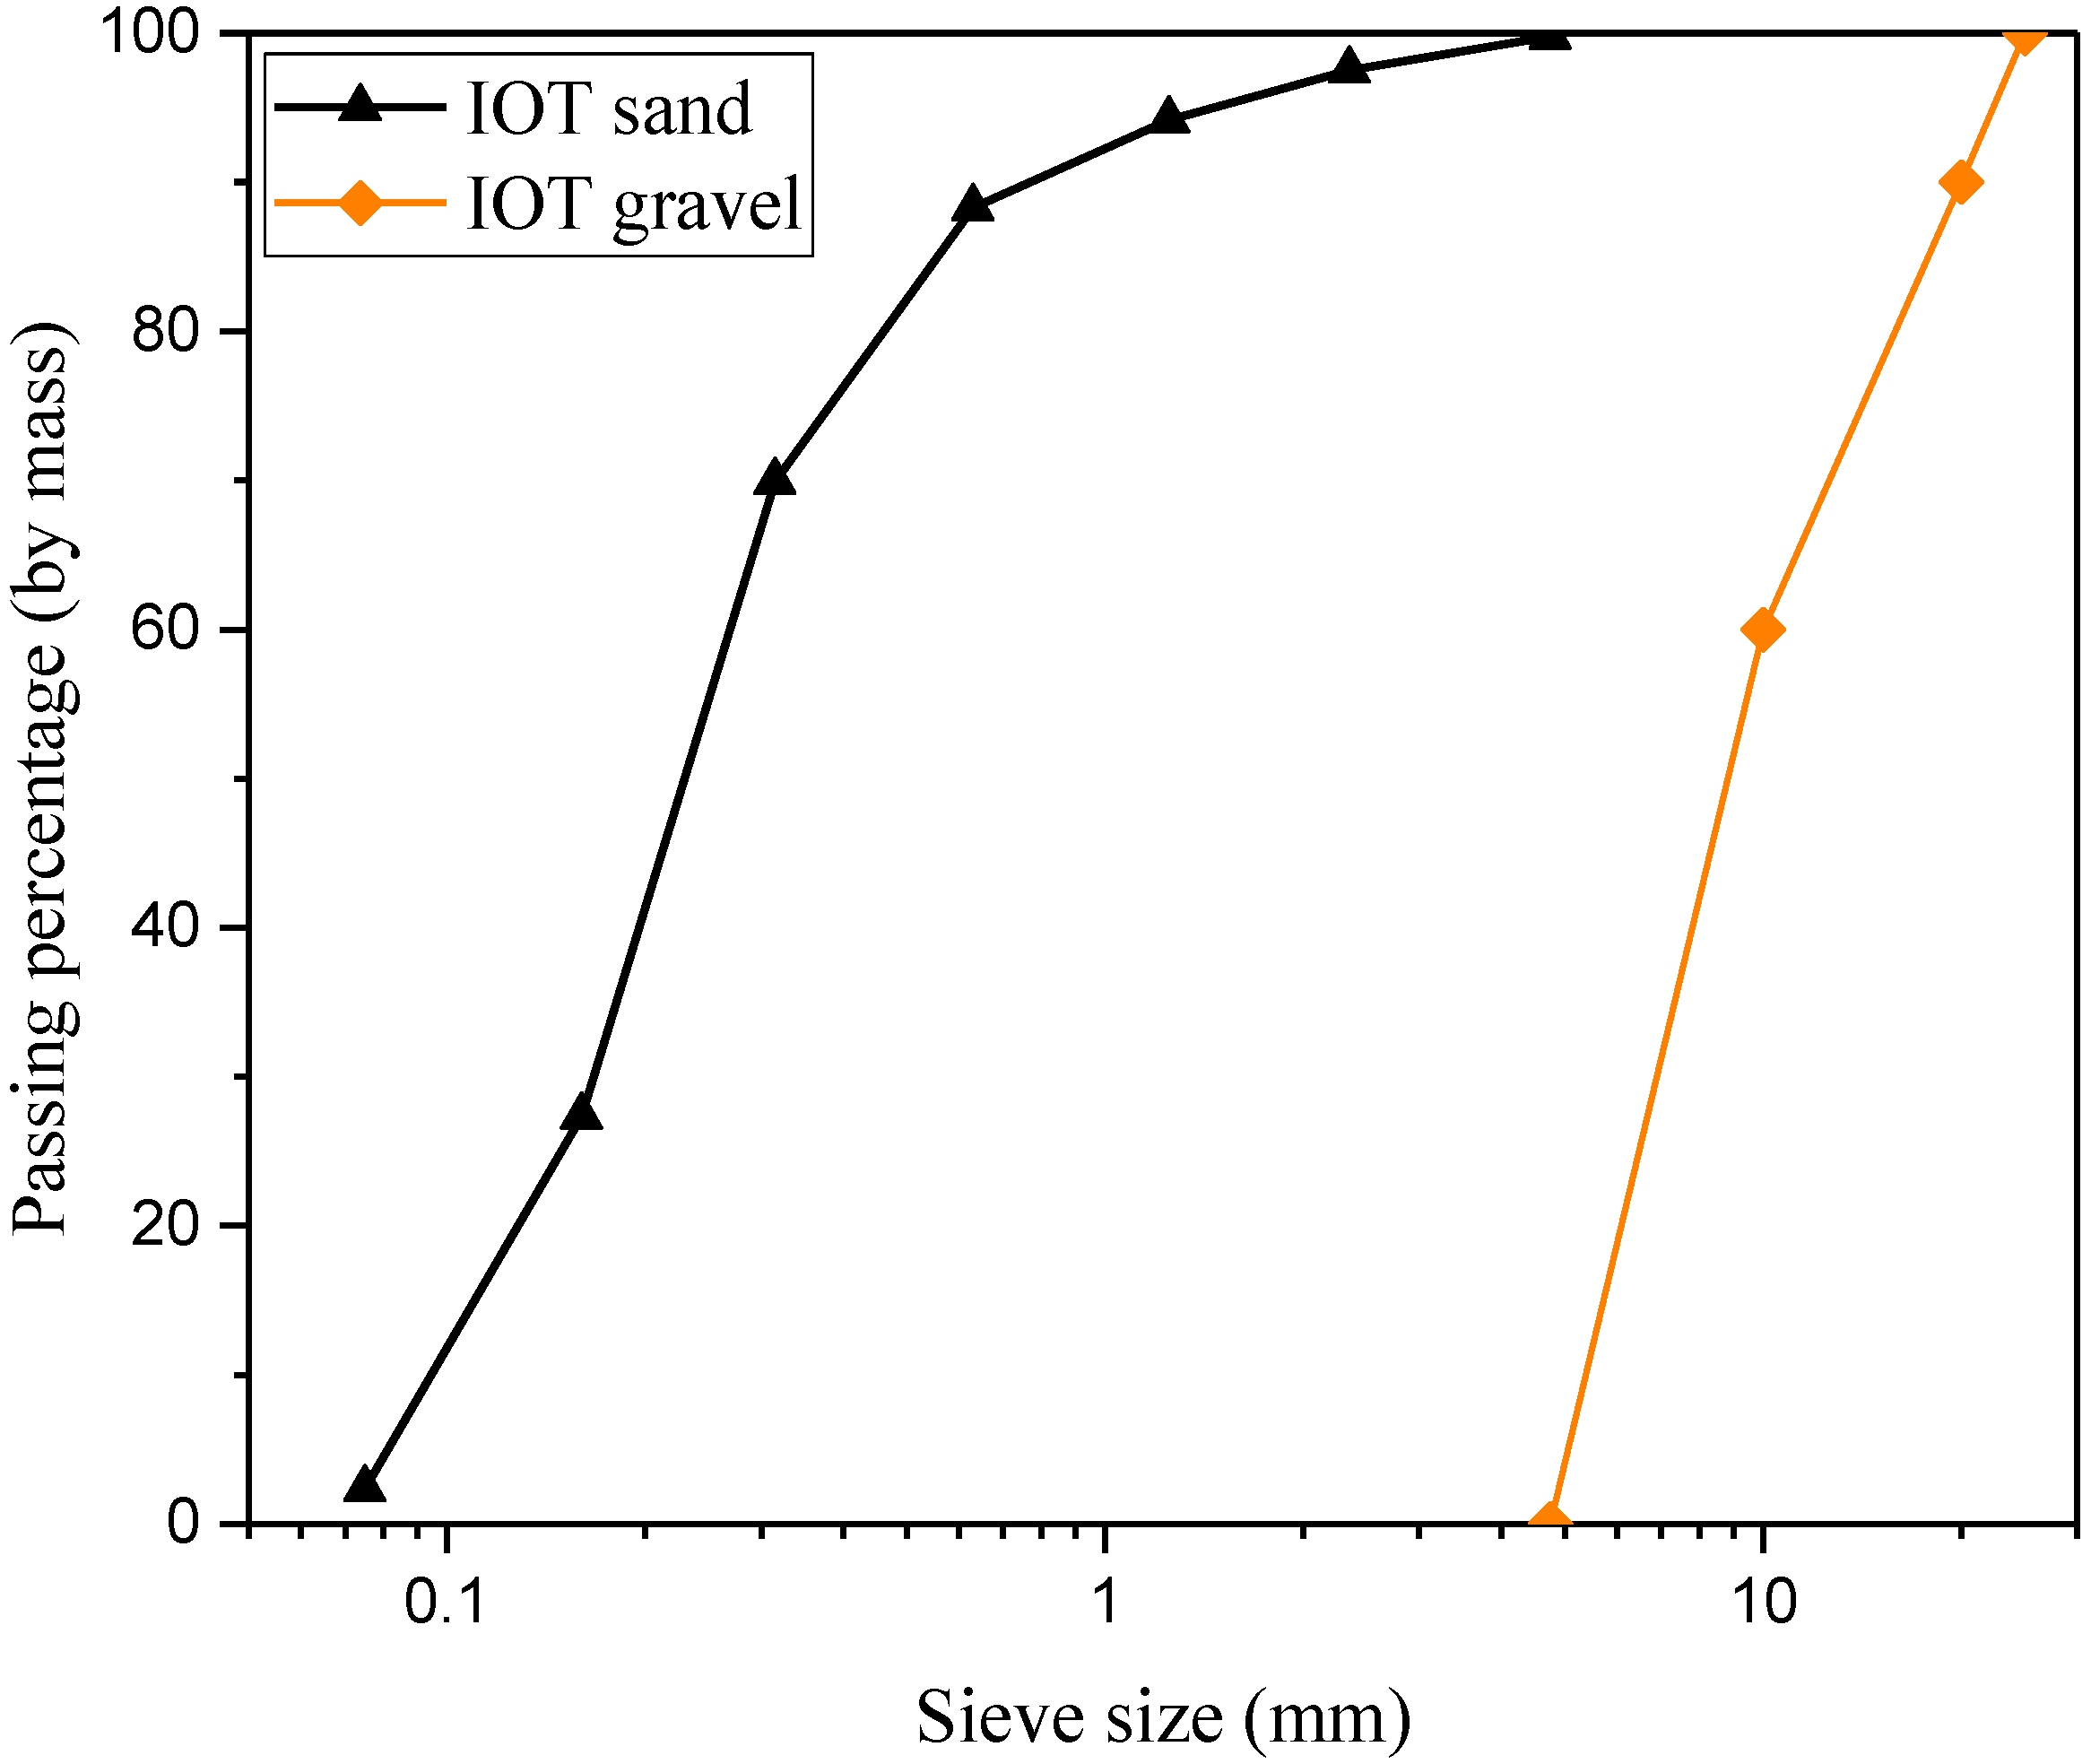
2.1. Materials

The IOT sand from the Shouyun Mining Co., Ltd. in Beijing, China was used in this study. Figure 1a depicts the accumulation state of IOT sand. Tongling Chemical Industry Group Co., Ltd., in Tongling, Anhui, China, provided the phosphogypsum (PG). The moisture content of PG varies over time, and lumps form during storage, as shown in Figure 1b, making it unsuitable for direct mixing of PG into concrete. The specific gravity of PG is 2.35. Figure 2 depicts the particle size distribution curves of IOT sand and IOT coarse aggregate gravel. The fineness modulus of the IOT sand is 1.23 based on the particle size distribution, which shows that IOT sand is a kind of extra-fine sand. The particle size of IOT gravel is limited to no more than 25 mm. The specific gravity of IOT sand and IOT gravel is 2.73 and 2.66, respectively. The water absorption of IOT sand and IOT gravel was 1.2% and 1.3%, respectively. A wet milling method was used to modify the physical and chemical properties of PG. PG and steel slag were mixed in a 47:2 weight ratio and then placed in a mill filled with ZrO2 ball with water twice the weight of the solids. The reason for using wet grinding is to remove soluble impurities in PG. The mixture was milled for one hour before being stored in an airtight jar for eight hours. After pre-treatment, the modified PG (MPG) paste became alkaline and hydro stable, and it was used in the study. Figure 3 depicts the particle size distribution curves of PG and MPG. The particles of MPG are finer than that of PG. The MPG, GBFS, and cement are combined to form parathion gypsum slag cement in a specific proportion, with the ratio of PG, GBFS, steel slag, and cement being 47:47:2:2. The chemical compositions of the PG, GBFS, steel slag and cement are shown in Table 1. The above-mentioned cement is type 42.5 ordinary Portland cement manufactured by Lafarge. BASF Company’s PCE-type superplasticizer was used.

2.2. Forming Method of Artificial Rockfills

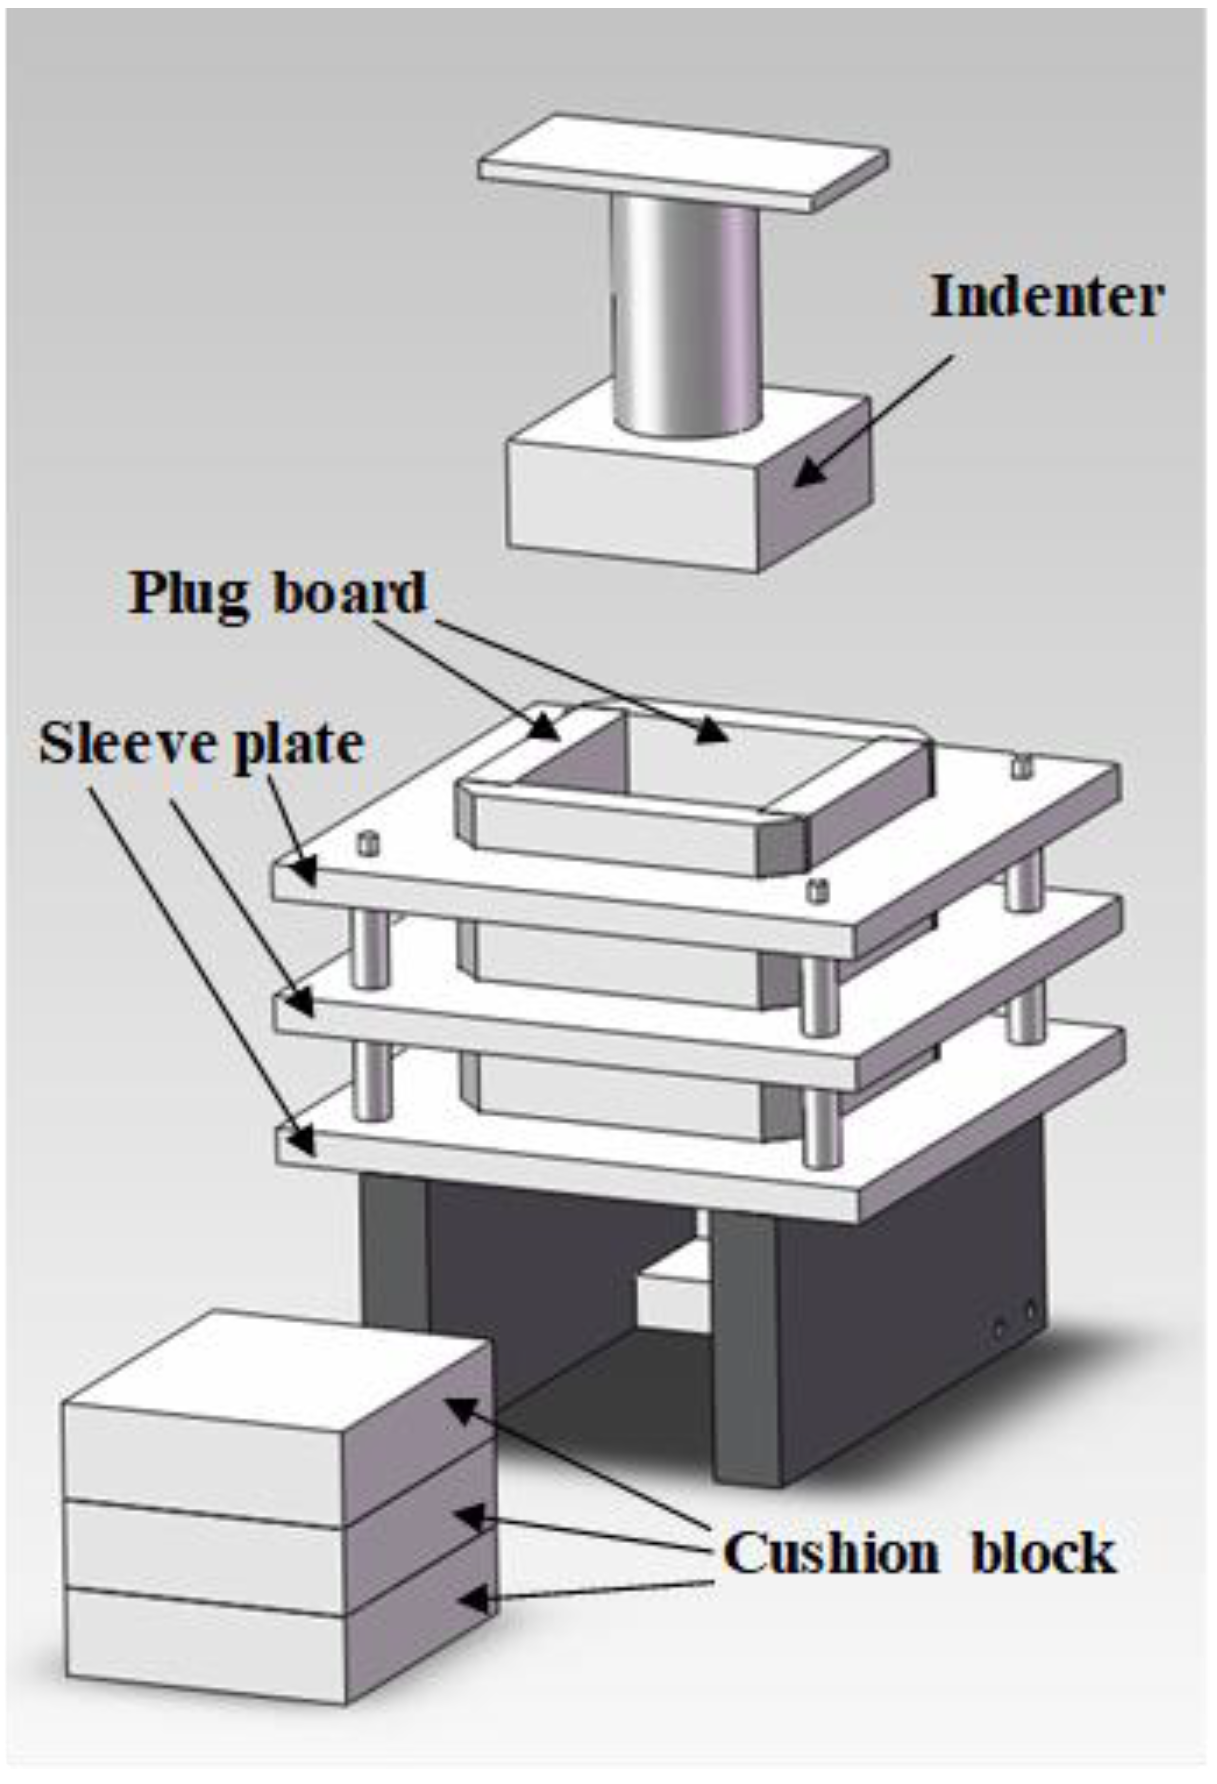
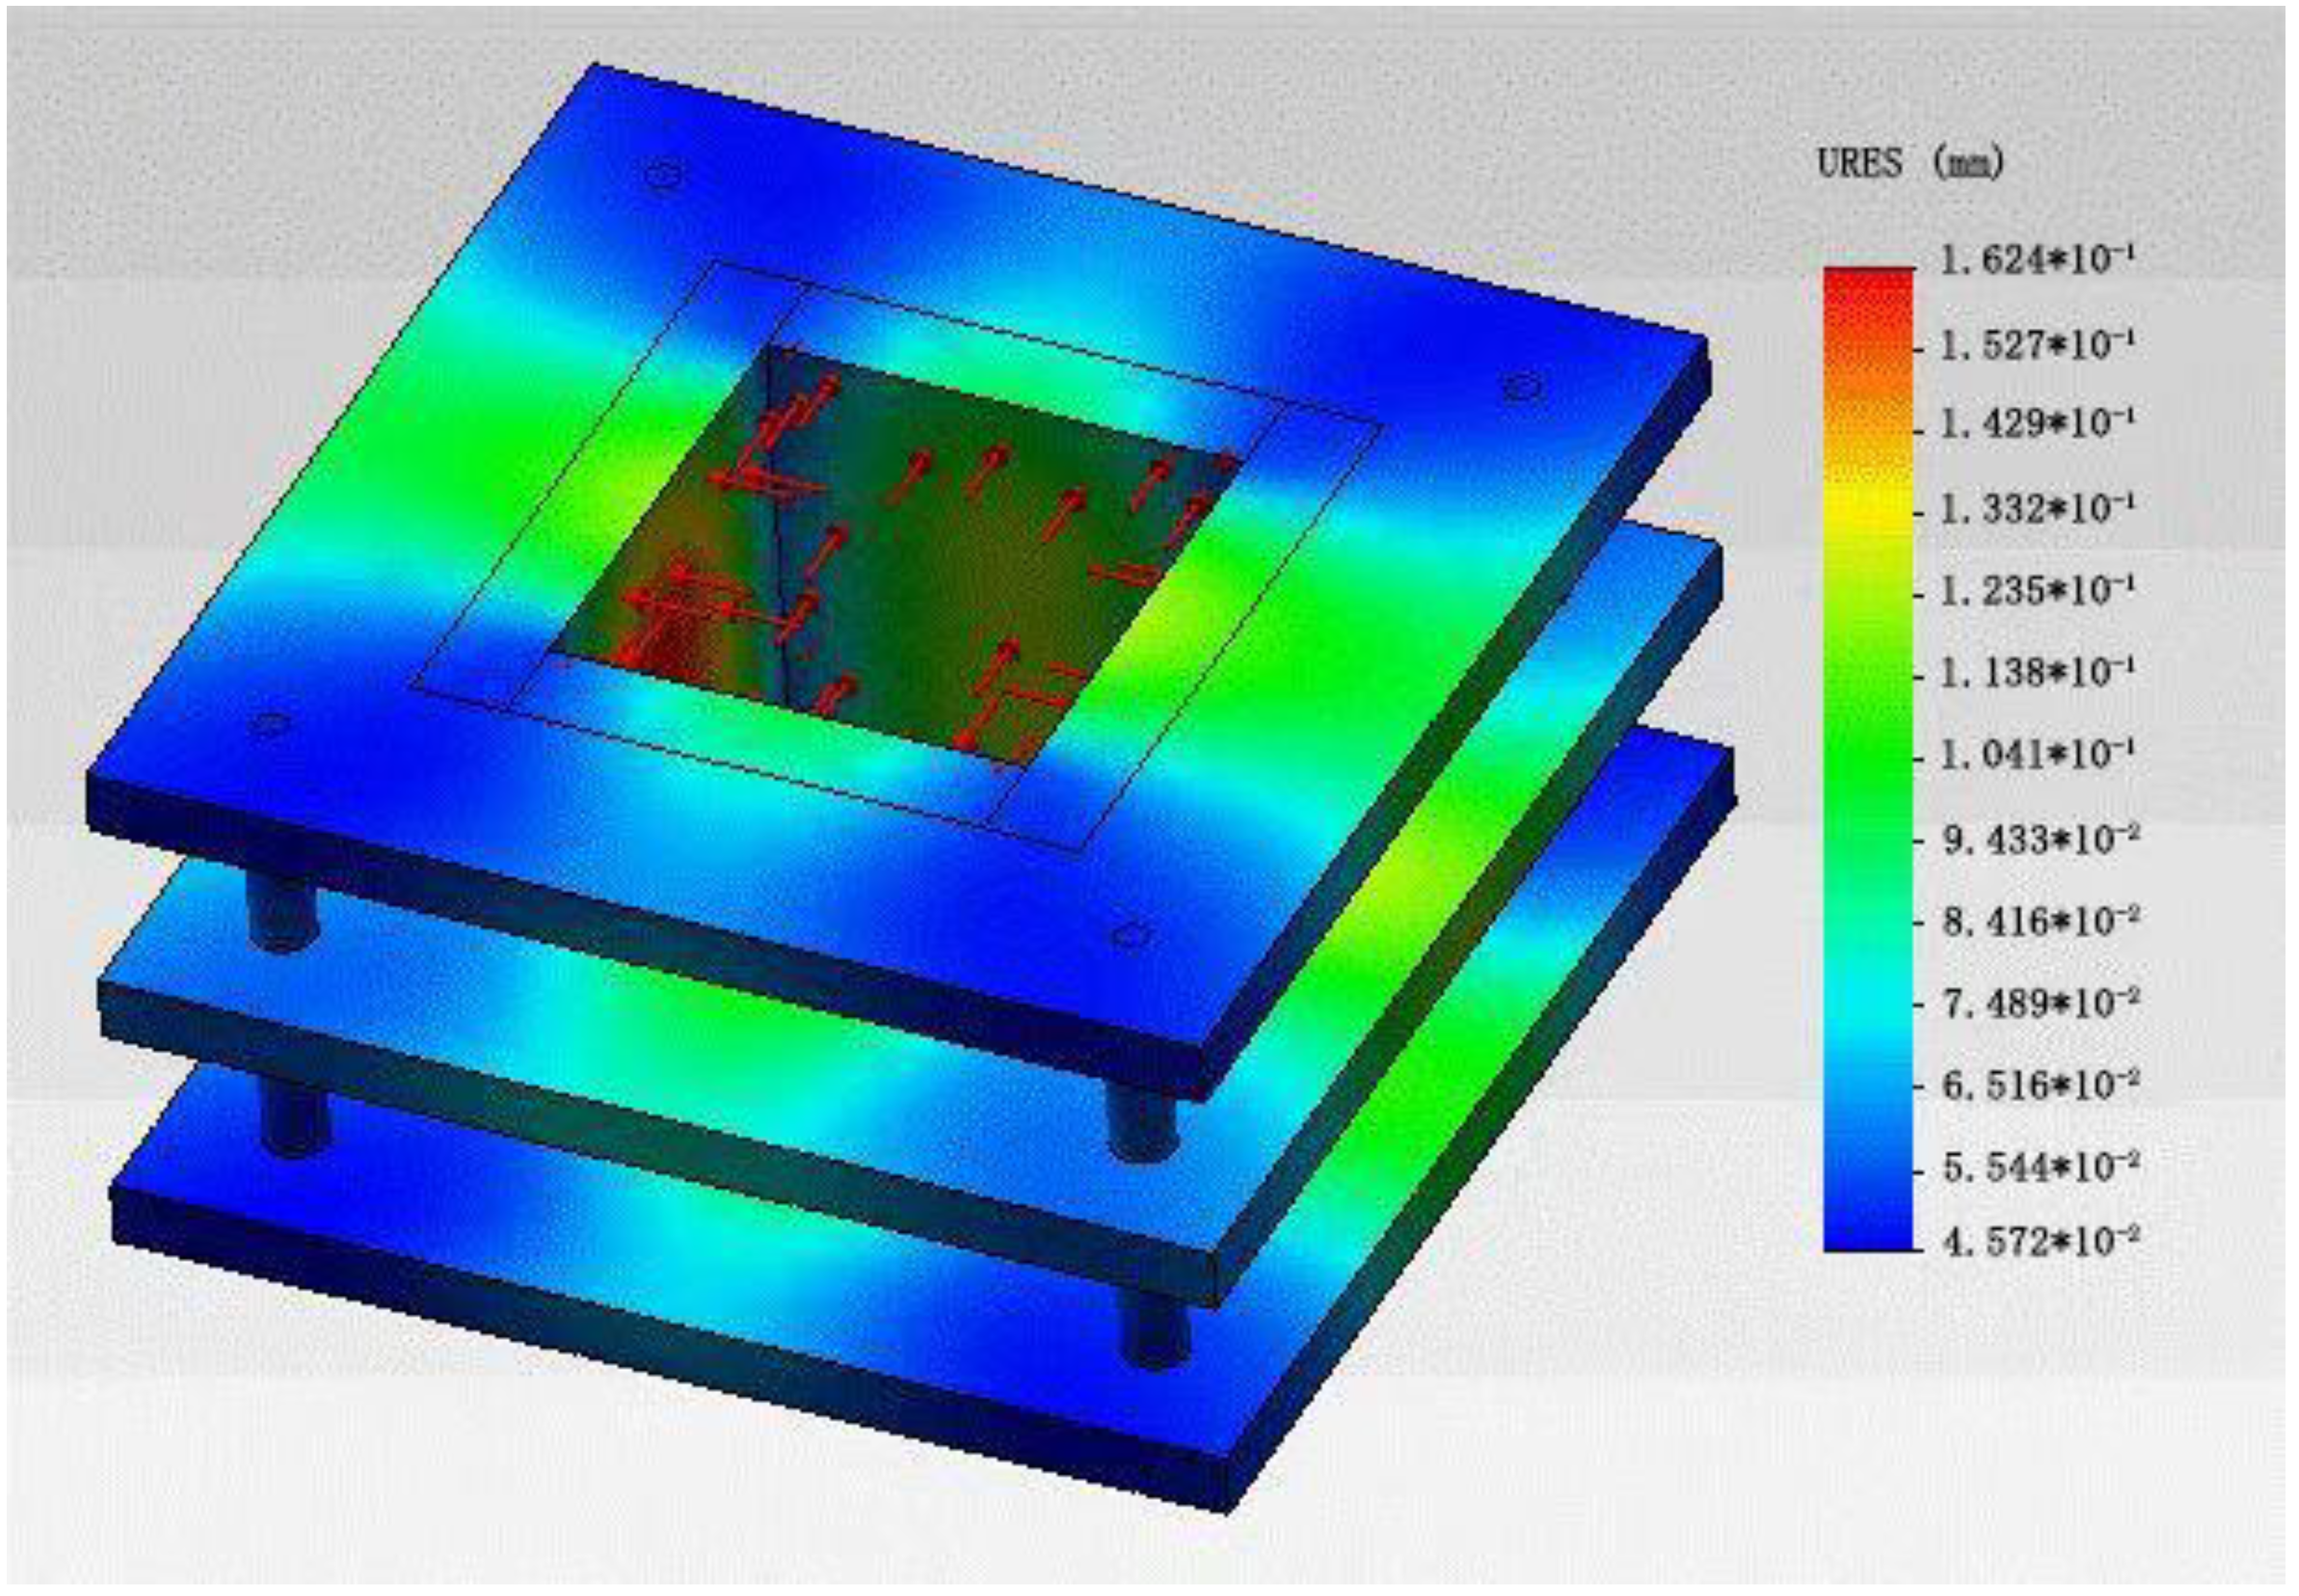
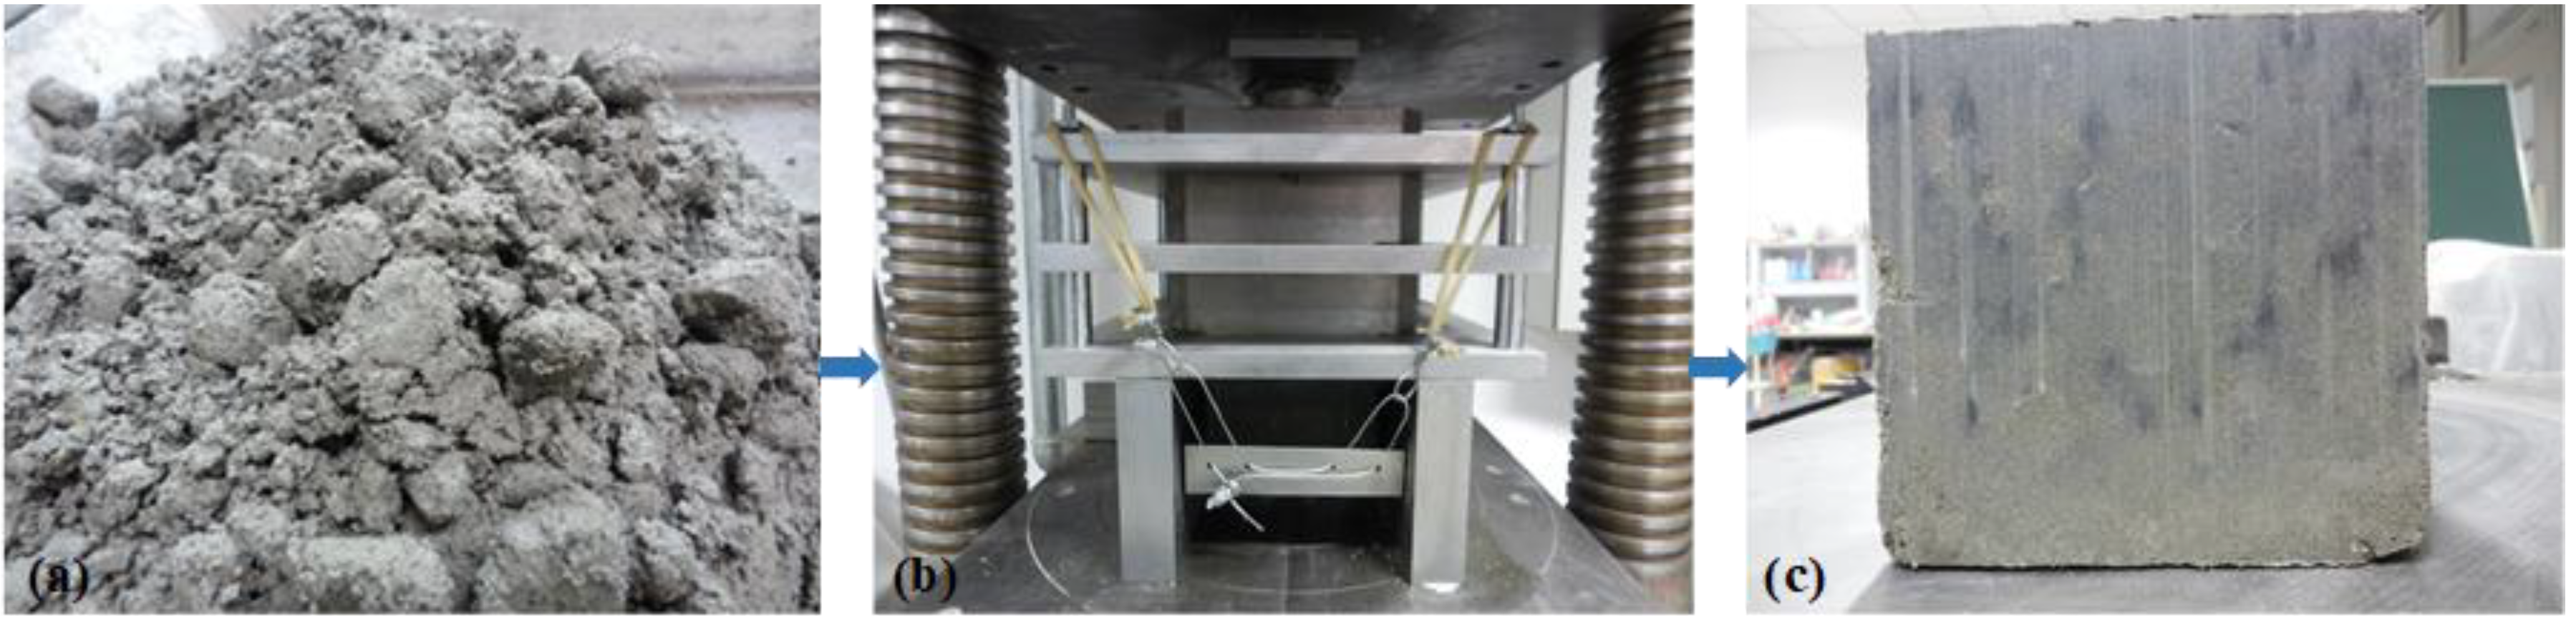
2.2.1. Pressure Forming Method

The pressure forming method was implemented using a self-designed pressing mould, as shown in Figure 4. The No. 45 steel mould was made up of an indenter, plugboard, sleeve plate, and cushion block. To improve hardness and reduce surface abrasion during the pressing process, the indenter and inner wall of the mould were quenched and tempered. The inner wall measures 150 mm in length and width and 250 mm in height. In terms of mould deformation, the maximum design deformation of the inner wall of the mould is 0.16 mm as determined by finite element calculation (Figure 5), which meets the requirement that the side length error of the cube specimen be less than 1/150 as defined by the China Test Code SL352-2006.
The following is the procedure for preparing an artificial rockfill using the pressure forming method (Figure 6):
(1)
Evenly distributed the concrete mixture.
(2)
Placed the mould in the pressure testing machine and filled it with the concrete mixture. Started the press until the pressure reached 900 kN, then turned off the press’s oil feeding. Continued to feed oil after the concrete mixture had been drained for 1 min. When the pressure reached 900 kN, adjusted the oil feeding speed of the press to maintain the pressure for 1 min.
(3)
Unloaded the pressure and drew out the three cushion blocks at the bottom of the mould. Continued to press down on the test block and pushed it out of the mould. Finally, placed the test block in the standard curing room to cure.

2.2.2. Vibration Rolling Forming Method

The following is the process of an artificial rockfill prepared by vibration rolling forming method, according to the China Test Code SL352-2006:
(1)
Applied a layer of demoulding oil to the mould’s inner wall.
(2)
Poured the concrete mixture twice into the mold and tamped it 25 times.
(3)
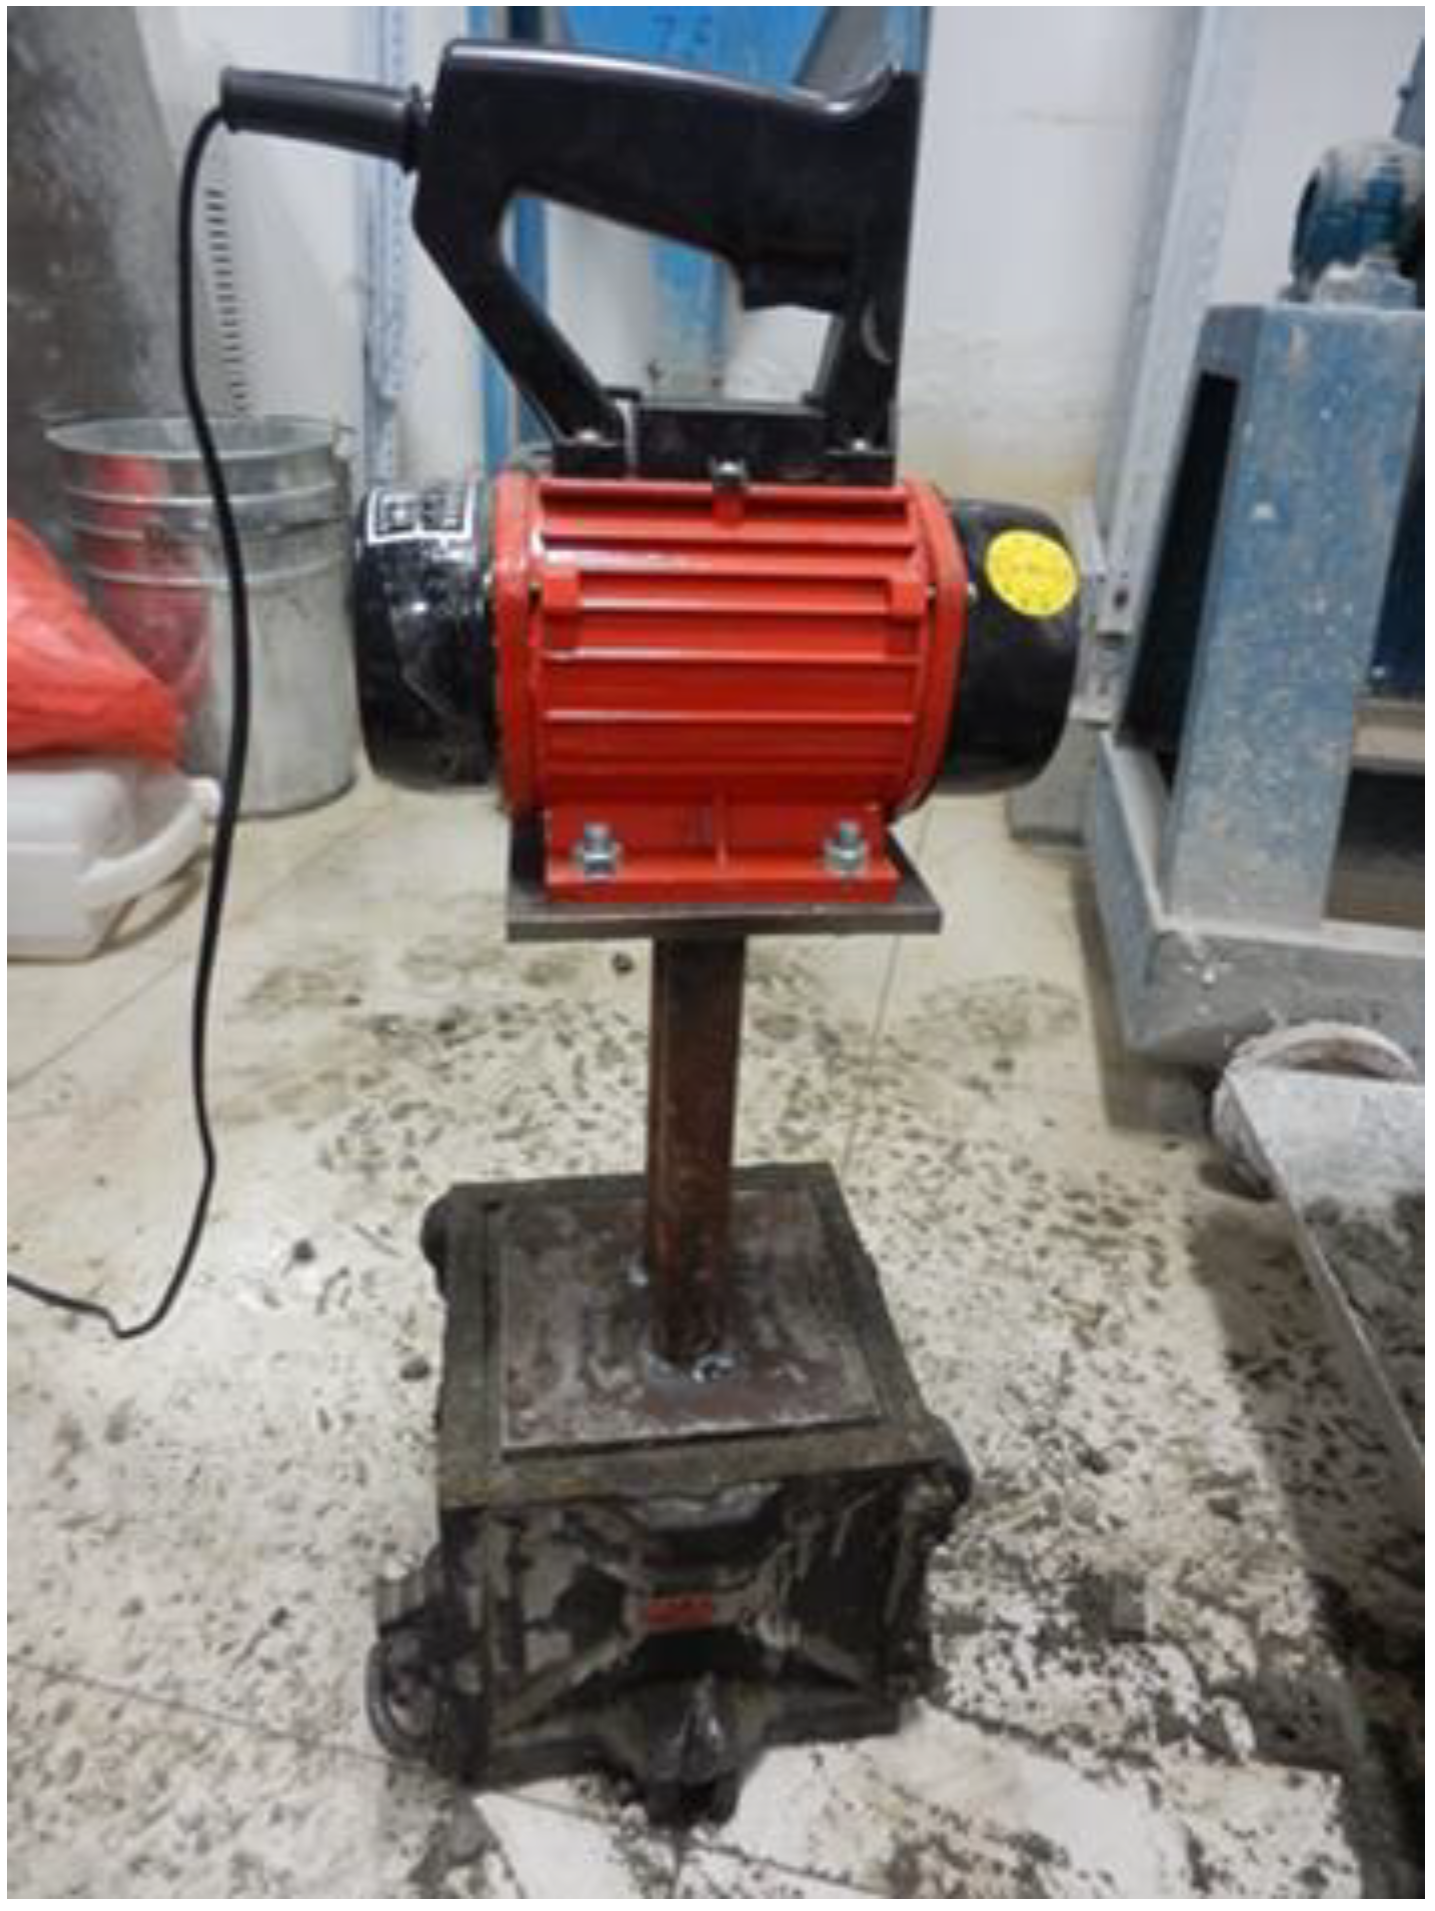
Placed the vibrator (Figure 7) vertically on the surface of the concrete mixture in the mould and began vibrating until slurry flooded on the concrete mixture’s surface.

2.2.3. Ordinary Concrete Forming Method

The following is the process of an artificial rockfill prepared by the Ordinary concrete forming method, according to the China Test Code SL352-2006:
(1)
Applied a layer of demoulding oil to the mould’s inner wall.
(2)
Filled the mould with the concrete mixture, 100 mm at a time, and began tamping with a vibrator in a spiral direction from the edge to the center. When inserting and tamping, kept the vibrator vertical. The vibrating rod must be inserted into the bottom of the mould when tamping the bottom layer of concrete. When tamping the upper layer of concrete, the vibrating rod should penetrate about 20–30 mm into the lower layer.
(3)
Inserted and tamped several times with a spatula along the inner wall of the mould and plaster.

3. Mix Proportion Design of an Artificial Rockfill

The formula currently used in concrete mix proportion design is shown in Equation (1) according to the specifications for mix proportion design of ordinary concrete in China.
W B = α a f b f c u , 0 + α a α b f b ,
where W/B is the water binder ratio of concrete; αa and αb are the regression coefficients related to gravel type. When crushed gravel is used as coarse aggregate, αa = 0.53 and αb = 0.20; fcu,0 is the mixing strength of concrete; fb is the 28 d mortar compressive strength of cementitious material (MPa). When fb has no measured value, fb = γfγffce, where γf and γf are the influence coefficients of fly ash and granulated blast furnace slag, respectively. fce is the 28 d mortar compressive strength of cement (MPa). When fce has no measured values, fce = γcfce,g, where γc is the margin coefficient of cement strength grade. When type 42.5 ordinary Portland cement is used, the coefficient value of γc is 1.16. fce,g is the strength grade of cement (MPa).
In addition to the influence coefficients of fly ash and granulated blast furnace slag, it is thought that an influence coefficient X exists between the strength of parathion gypsum slag cement mortar and the strength of type 42.5 ordinary Portland cement mortar. That is, the 28 d mortar compressive strength for parathion gypsum slag cement is related to fce.
f b = X f c e ,
Equation (3) can be obtained by substituting Equation (2) into Equation (1).
W B = α a X f c e f c u , 0 + α a α b X f c e ,
Table 2 shows the proportion and compressive strength of a parathion gypsum slag cement concrete. MPG has a moisture content of 33.3 percent. The dry weight of the cement, GBFS, and MPG are added together to form the binding material. The concrete’s water binder ratio is 0.34, and the 28 d mixing strength is 42.5 MPa.
X = 0.59 can be obtained by putting the known data into Equation (3). To achieve a similar 28 d compressive strength with type 42.5 ordinary Portland cement and parathion gypsum slag cement, the amount of parathion gypsum slag cement in concrete should be 1.72 times that of type 42.5 ordinary Portland cement in concrete. The amount of parathion gypsum slag cement in concrete, on the other hand, is roughly twice that of type 42.5 ordinary Portland cement in concrete.
Based on experimental practice [40], the water binder ratio of the concrete using type 42.5 ordinary Portland cement as cementitious material is set at 0.9 to make it easy to compact. The mixing strength of concrete (fcu,0) can be calculated using Equation (3). Under the same mixing strength conditions, the water binder ratio of concrete using parathion gypsum slag cement is 0.55. The water binder ratios of concrete using the ordinary concrete forming method were set to 0.40, 0.45, and 0.50 based on the principles of low sand ratio, low slump, low cement dosage, and use of PCE-type superplasticizer [41]. Table 3 shows the test proportions of each concrete.

4. Results and Discussion

4.1. Results of Compressive Strength and Cost

Table 3 displays the outcomes of each concrete. The mixture ID is written as AB-C, where A represents the forming method (P: pressure forming method; V: vibration rolling forming method; O: ordinary concrete forming method), B stands for the type of cement (O: ordinary Portland cement; P: parathion gypsum slag cement), and C denotes the amount of binder in the concrete.
The compressive strength of the artificial rockfill in each group was tested after 7 days and 28 days. The failure mode of tested concrete specimen is the same as that of ordinary cubic specimen [42,43]. The material cost of each artificial rockfill group was calculated, and the price of each raw material was determined based on the practical project budget of the relevant rock-filled concrete dam and the production cost budget of the parathion gypsum slag cement products. Some raw material costs: cement, $56.6 per ton; GBFS, $34.6 per ton; steel slag, $23.6 per ton; phosphogypsum, $0 per ton; water, $1.1 per ton; IOT sand, $3.9 per ton; IOT gravel, $4.7 per ton; and PCE-type superplasticizer, $942.7 per ton.
The results of each concrete are shown in Table 3. The mixture ID is represented in the form of AB-C, where A stands for the forming method (P: pressure forming method; V: vibration rolling forming method; O: ordinary concrete forming method), B stands for the type of cement (O: ordinary Portland cement; P: parathion gypsum slag cement), and C stands for the amount of the binder in concrete.
The cost of materials and transportation of the artificial rockfill were considered in this analysis. Labor and machinery were not considered, nor was the solid waste treatment cost of solid waste phosphogypsum. According to the powder components of parathion gypsum slag cement mentioned above, the material cost of parathion gypsum slag cement was calculated to be $19.0 per ton. Table 3 shows the compressive strength at 7 d and 28 d, as well as the cost of each group of artificial rockfill.

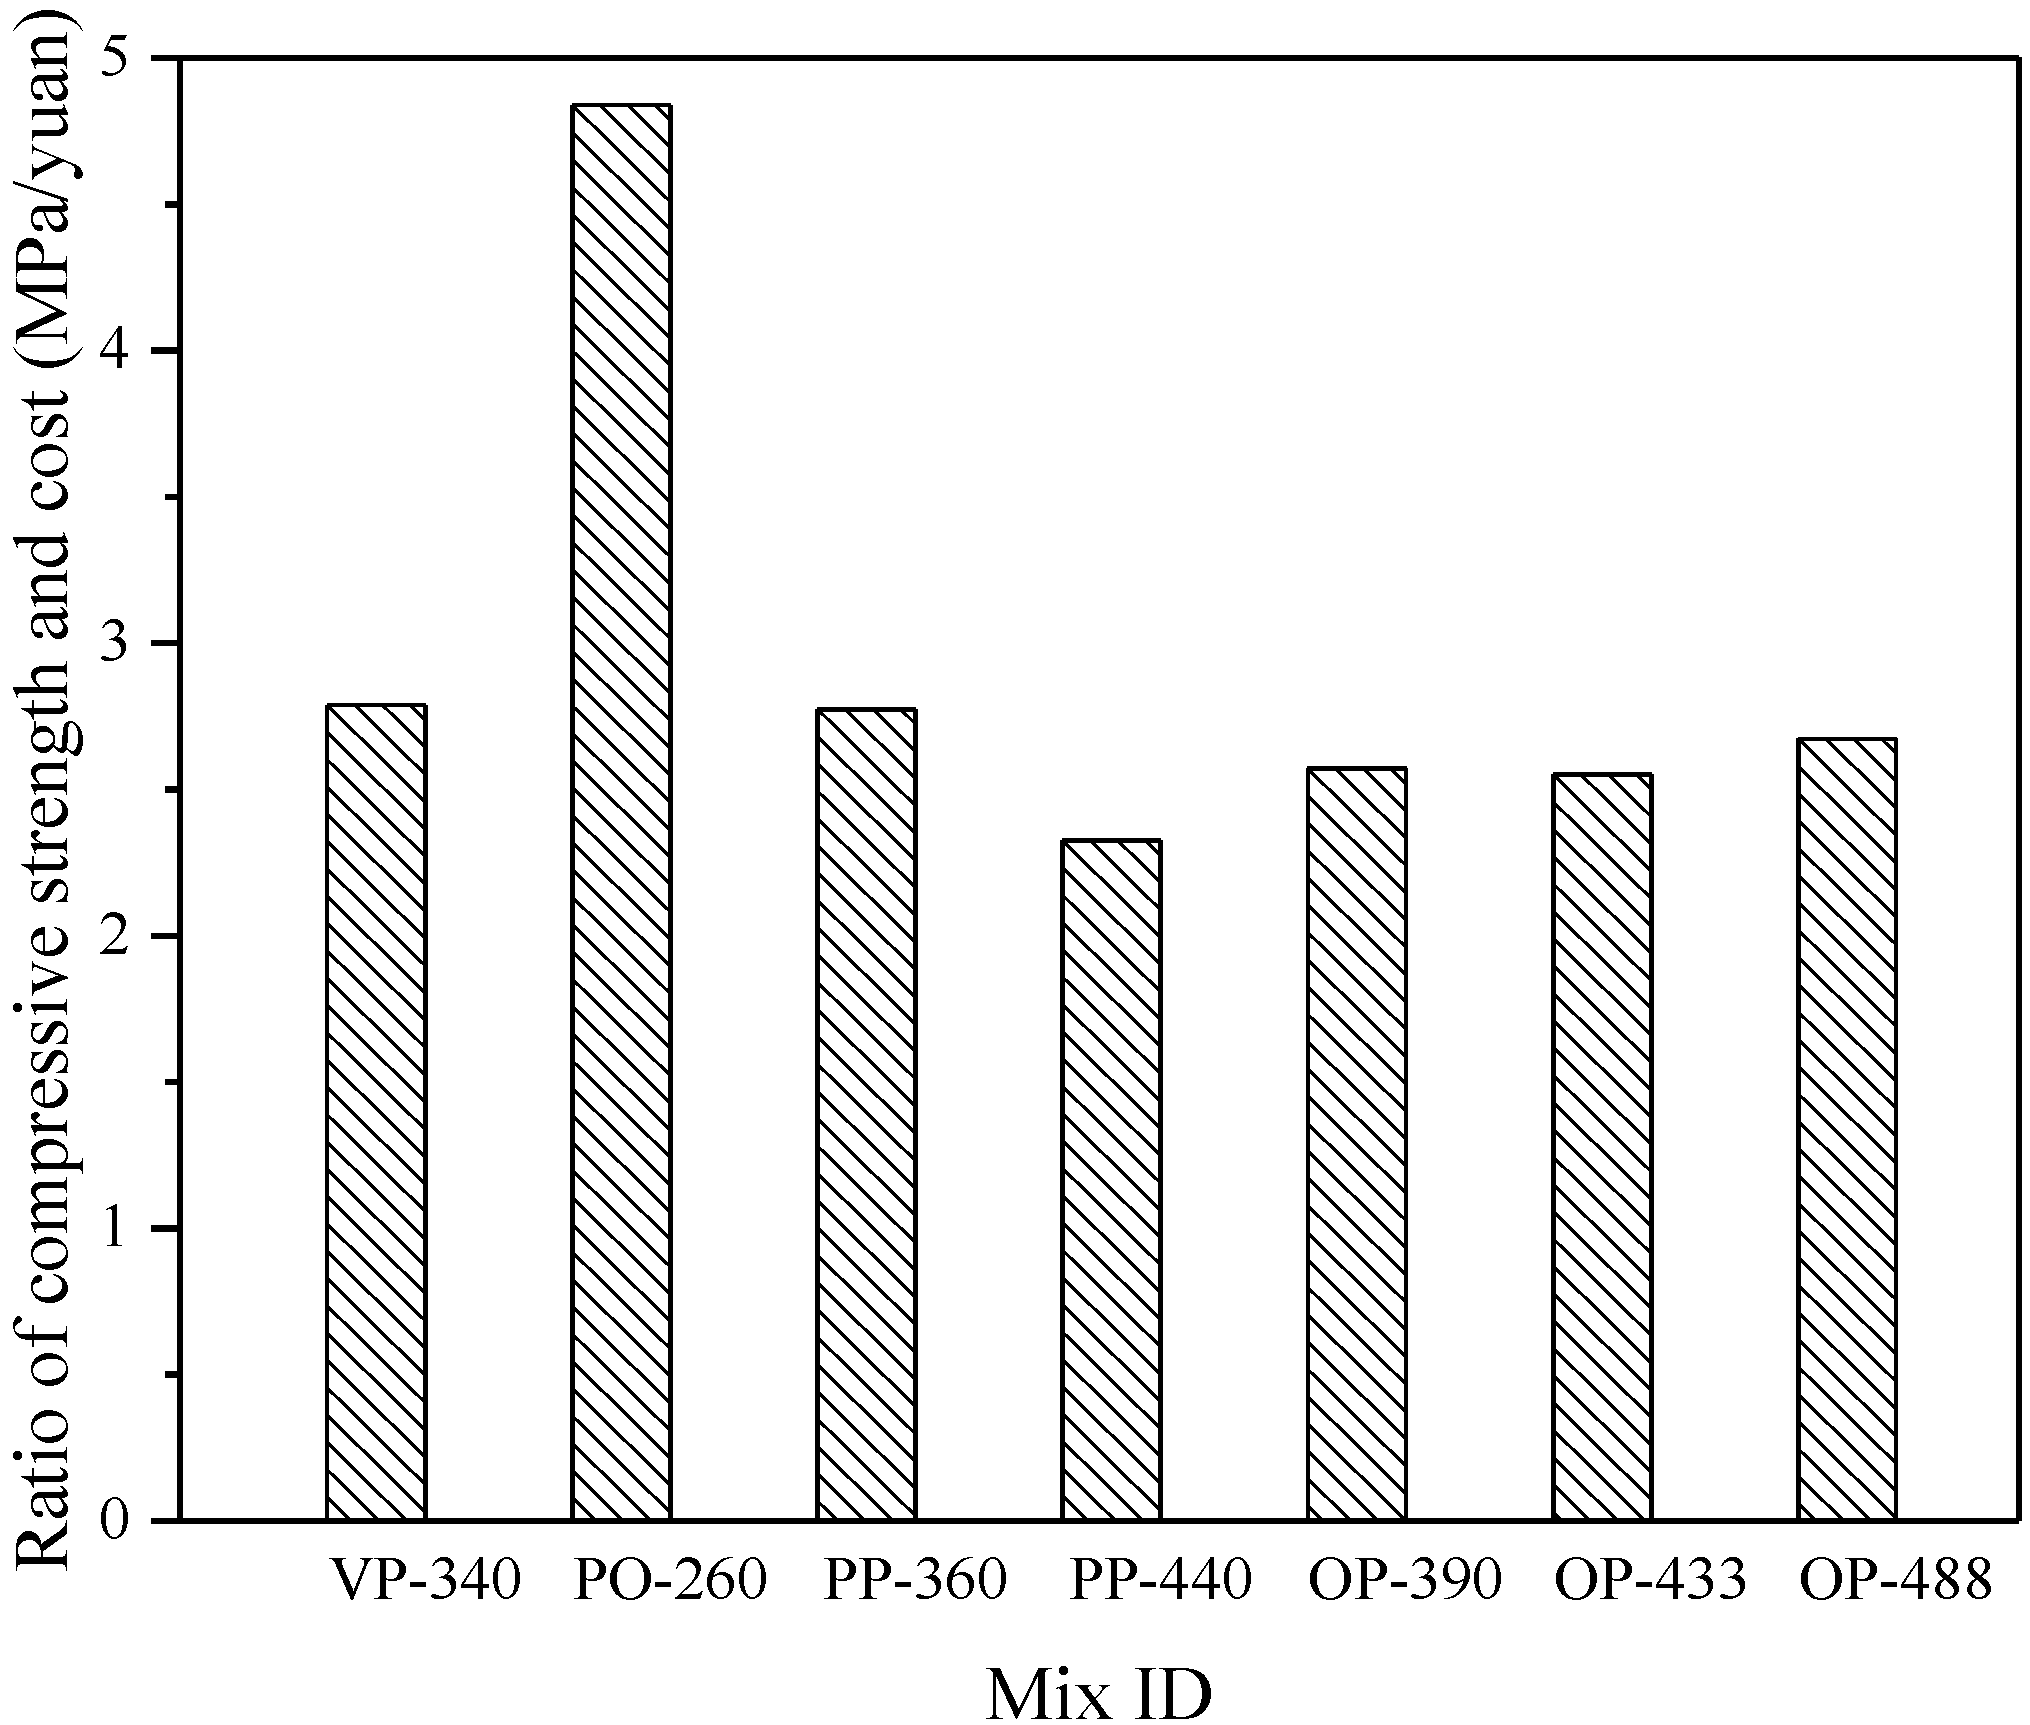
4.2. Analysis of Strength Cost Ratio of the Artificial Rockfills

Researchers conclude that when IOT was used to substitute all of the natural sand in concrete preparation, the performance and strength of the concrete were greatly reduced [36,44]. However, rockfills do not have high requirements for compressive strength, so IOT was applied to replace all the natural sand used to prepare concrete in this study. As shown in Table 3, a mixture with a low water cement ratio or a less amount of binder had a 28 d compressive strength of less than 30 MPa, which does not meet the requirements of an artificial rockfill for compressive strength. Therefore, the mixtures with 28 d compressive strength greater than 30 MPa were selected for strength cost analysis. The strength cost ratio was defined as the ratio of 28 d compressive strength to material cost, which was used as an index to evaluate the comprehensive performance of an artificial rockfill.
PO-260 with 260 kg ordinary Portland cement in a cubic meter of concrete has the best strength-to-cost ratio, as shown in Figure 8. This is due to the lower mortar strength of parathion gypsum slag cement compared to ordinary Portland cement. However, using ordinary Portland cement does not allow for the effective use of parathion gypsum slag cement and does not achieve the goal of using solid waste. As an alternative, a high strength-to-cost ratio can be achieved by using parathion gypsum slag cement instead of ordinary Portland cement, such as VP-340 and PP-360, as shown in Figure 8. The reason for this is that parathion gypsum slag cement contains nearly half of the cost of solid waste phosphogypsum and low-cost GBFS. Using these two main powders to their full potential reduces the material cost of parathion gypsum slag cement significantly.
When the mix proportions of VO-170 and VP-180 were compared using the vibration rolling forming method, it was discovered that the amount of ordinary Portland cement in VO-170 was slightly lower than the amount of parathion gypsum slag cement in VP-180, but its 28 d compressive strength was higher. This was due to a coefficient relationship of X = 0.59 between the strength of ordinary Portland cement mortar and the strength of parathion gypsum slag cement mortar, indicating that the strength of mortar containing the same amount of ordinary Portland cement was greater than that of mortar containing parathion gypsum slag cement. This conclusion also applied to the vibration rolling forming method’s artificial rockfills.
As the strength of parathion gypsum slag cement mortar was 0.59 times that of ordinary Portland cement mortar, the dosage of parathion gypsum slag cement was set at twice the dosage of cement to ensure that the strength of the artificial rockfills with different cementitious materials was close. When the strength of VO-90 and VP-180, VO-130 and VP-260, and VO-170 and VP-340 were compared, it was revealed that when the dosage of parathion gypsum slag cement was twice that of ordinary Portland cement, the 3 d compressive strength of the artificial rockfill with parathion gypsum slag cement was at least 1.79 times that of ordinary Portland cement. The 28 d compressive strength of the artificial rockfill with parathion gypsum slag cement was at least 3.04 times that of ordinary Portland cement. It demonstrates that the difference in 3 d compressive strength is less than that of 28 d compressive strength.
The comparison of 3 d and 28 d strength between PO-180 and PP-360, as well as PO-220 and PP-440, revealed a similar change trend. The artificial rockfill with parathion gypsum slag cement had a 3 d compressive strength that was at least 2.13 times that of ordinary Portland cement. The 28 d compressive strength of the artificial rockfill with parathion gypsum slag cement was at least 3.05 times that of ordinary Portland cement. It can be seen that the design with the dosage of parathion gypsum slag cement twice that of type 42.5 ordinary Portland cement was very conservative. In other words, the coefficient of X could have been larger.

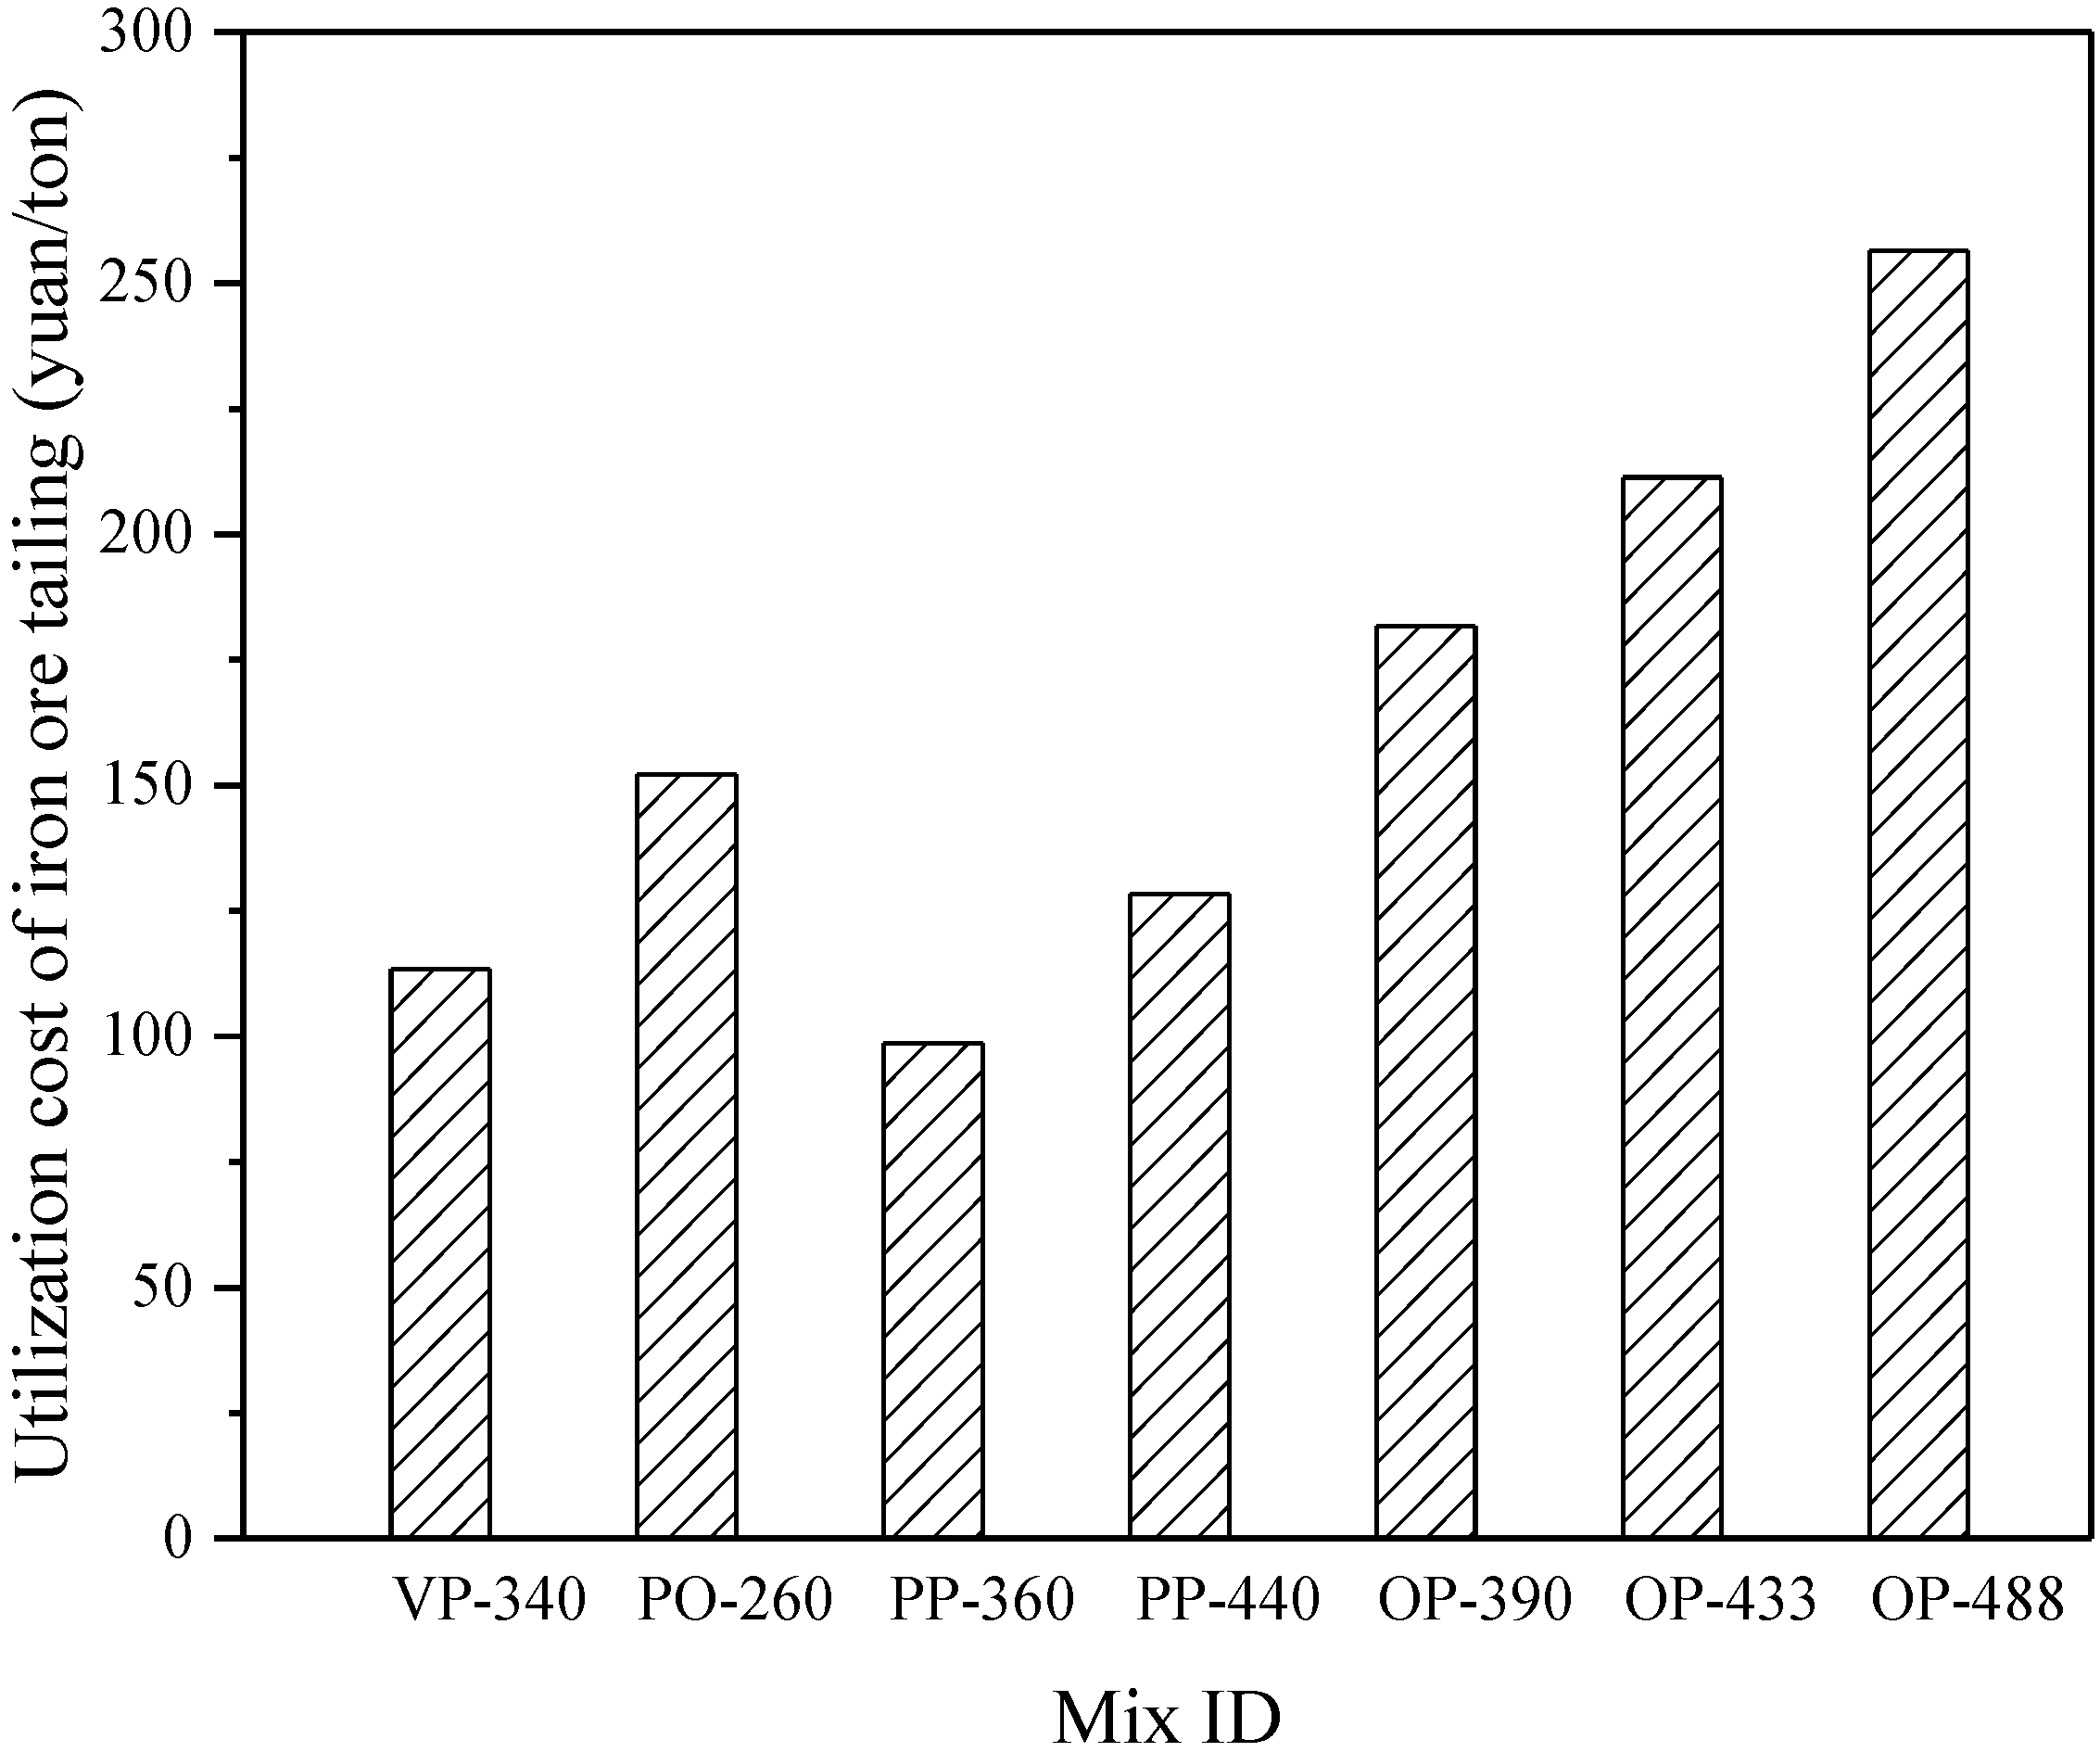
4.3. Utilization Cost Analysis of Unit IOT

IOT gravel is used in the same way as conventional gravel, whereas IOT sand is a very ultra-fine sand that is difficult to use. As a result, the utilization cost of IOT sand must be assessed. The utilization cost of IOT sand per ton was compared between mix proportions with 28 d strengths greater than 30 MPa. The three groups of OP-390, OP-433, and OP-488 were the artificial rockfills formed using the ordinary concrete forming method and parathion gypsum slag cement as a cementitious material, as shown in Figure 9. The utilization cost of IOT sand in these three groups was higher when compared to other groups. It was because the IOT sand ratio in ultra-fine sand ordinary concrete was lower than that of ordinary concrete. The group of PP-360 formed by the pressure forming method had the lowest IOT sand utilization cost. In PP-360, the cementitious material dosage was 360 kg/m3, and the IOT sand dosage was 1055 kg/m3. In comparison to PP-360, the cementitious material of VP-340 formed by the vibration rolling forming method was 340 kg/m3, with only 829 kg/m3 of IOT sand. When the 28 d compressive strengths of PP-360 and VP-340 were compared, it was found that the 28 d compressive strengths were 37.48 MPa and 33.71 MPa, which were close to each other. The material cost of PP-360 is 10% higher than that of VP-340. However, the PP-360 used 226 kg/m3 more IOT sand than the VP-340, and the PP-360’s IOT sand utilization cost was 13% lower. As a result, PP-360 was the best artificial rockfill test group in terms of fully utilizing IOT sand.
In terms of solid waste content in artificial rockfills, the dosage of PP-360 cementitious material was 360 kg/m3, of which only 4% was cement and the rest was solid wastes such as phosphogypsum, GBFS, and steel slag. Simultaneously, all aggregates were replaced with IOT sand and IOT gravel. The artificial rockfill contained 99.3% solid waste, with granular solid waste accounting for 83.3% of the mass of solid materials. As a result, PP-360 was also the best artificial rockfill test group in terms of solid waste utilization rate in artificial rockfills.

5. Conclusions

To increase the dosage of granular and powdery solid waste in RFC, IOT sand and PG were used separately as granular and powdery solid waste. To replace the natural rocks in RFC, the dosage of solid waste was increased by producing artificial rockfills with IOT and parathion gypsum slag cement. Three methods were used to form the artificial rockfills: pressure forming, vibration rolling forming, and ordinary concrete forming. The following are some possible outcomes.
(1)
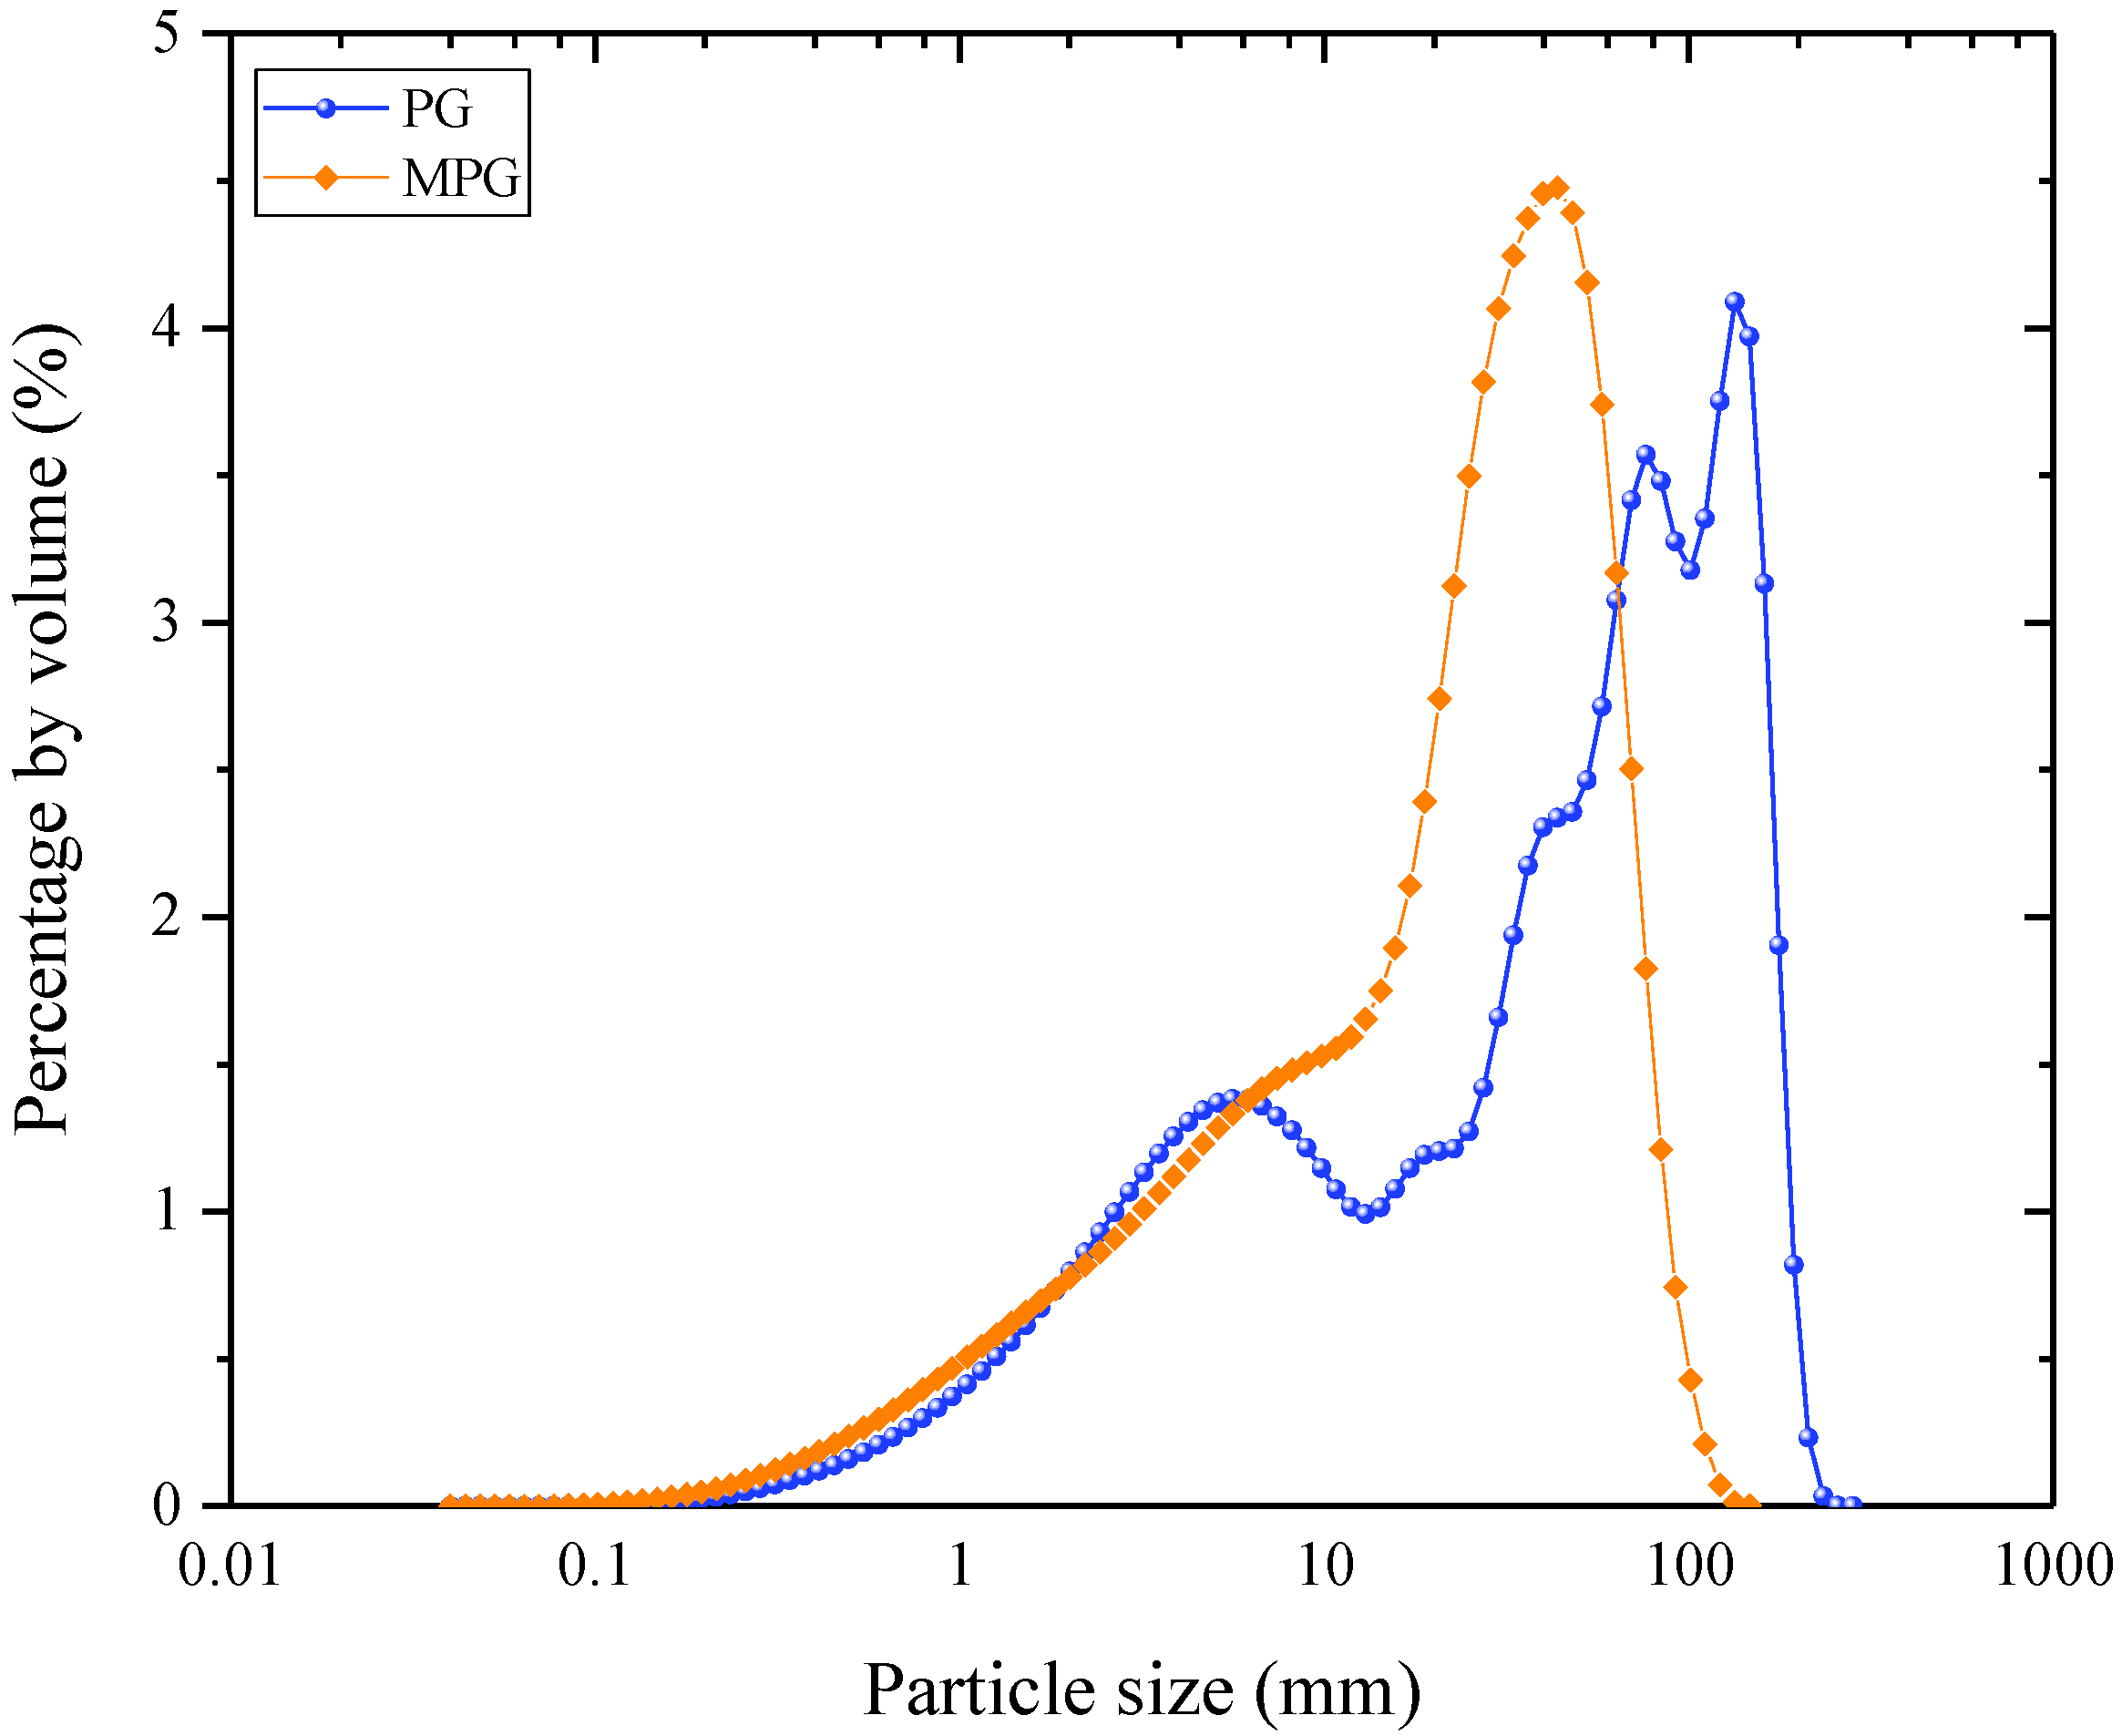
IOT and PG were successfully used separately as granular and powder solid waste. The modified PG, ground blast-furnace slag (GBFS), steel slag, and cement clinker are combined to form parathion gypsum slag cement in a specific proportion, with the ratio of PG, GBFS, steel slag, and cement being 47:47:2:2. To replace the natural rocks in RFC, artificial rockfills made of IOT and parathion gypsum slag cement are used to increase the dosage of solid waste.
(2)
A higher strength-to-cost ratio, such as VP-340 and PP-360, can be obtained by making full use of solid waste phosphogypsum and cheap GBFS and replacing ordinary Portland cement with parathion gypsum slag cement. The strength of parathion gypsum slag cement mortar was 0.59 times that of ordinary Portland cement mortar, and the design with the dosage of parathion gypsum slag cement twice that of cement was very conservative.
(3)
The three forming methods can produce artificial rockfills with a strength grade of C20. When the compressive strength and material costs of the three types of artificial rockfills were compared, the compressing method was found to be the most effective in making full use of the IOT sand. The mass fraction of granular solid waste in the PP-360 artificial rockfill was 83.3%, and the mass fraction of total solid waste was 99.3%.
However, the compressive strength of concrete samples was only tested at 7 and 28 days in this paper. After 2 or 3 months, soil-cement composites in geotechnical engineering may show significant gains in strength and stiffness. As a result, in the future, maintained compression tests with strain-stress relationships will be performed, allowing not only compressive strength but also E modulus to be determined.

Author Contributions

Conceptualization, G.H., J.Z. and X.A.; methodology, J.Z. and G.H.; validation, G.H., J.Z., H.S., Z.W. and Y.H.; formal analysis, G.H. and J.Z.; investigation, G.H.; writing—original draft, G.H. and J.Z.; writing—review and editing, D.S. and S.M.M.; visualization, G.H. and J.Z.; supervision, X.A.; project administration, X.A.; funding acquisition, J.Z. All authors have read and agreed to the published version of the manuscript.

Funding

This research was funded by the National Natural Science Foundation of China (No. 52109153), the Fundamental Research Funds for the Central Universities (B210201012), the Jiangsu Planned Projects for Postdoctoral Research Funds (2021K055A), and the Doctor of Entrepreneurship and Innovation in Jiangsu Province (JSSCBS20210261).

Institutional Review Board Statement

Not applicable.

Informed Consent Statement

Not applicable.

Data Availability Statement

The data presented in this study are available on request from the corresponding author. The data are proprietary or confidential in nature and may only be provided with restrictions.

Conflicts of Interest

The authors declare no conflict of interest.

References

  1. Kalonji-Kabambi, A.; Bussière, B.; Demers, I. Hydrogeochemical Behavior of Reclaimed Highly Reactive Tailings, Part 1: Characterization of Reclamation Materials. Minerals 2020, 10, 596. [Google Scholar] [CrossRef]
  2. United States Geological Survey—USGS. Mineral Commodity Summaries, Iron Ore. 2022. Available online: https://pubs.usgs.gov/periodicals/mcs2022/mcs2022.pdf (accessed on 31 January 2022).
  3. Kuranchie, F.A.; Shukla, S.K.; Habibi, D. Electrical resistivity of iron ore mine tailings produced in Western Australia. Int. J. Min. Reclam. Environ. 2015, 29, 191–200. [Google Scholar] [CrossRef]
  4. Dauce, P.D.; de Castro, G.B.; Lima, M.M.F.; Lima, R.M.F. Characterisation and magnetic concentration of an iron ore tailings. J. Mater. Res. Technol. 2019, 8, 1052–1059. [Google Scholar] [CrossRef]
  5. Carrasco, E.; Magalhaes, M.; Santos, W.; Alves, R.; Mantilla, J. Characterization of mortars with iron ore tailings using destructive and nondestructive tests. Constr. Build. Mater. 2017, 131, 31–38. [Google Scholar] [CrossRef]
  6. Das, S.K.; Kumar, S.; Ramachandrarao, P. Exploitation of iron ore tailing for the development of ceramic tiles. Waste Manag. 2000, 20, 725–729. [Google Scholar] [CrossRef]
  7. Wei, Z.; Jia, Y.; Wang, S.; Li, Z.; Li, Y.; Wang, X.; Gao, Y. Utilization of iron ore tailing as an alternative mineral filler in asphalt mastic: High-temperature performance and environmental aspects. J. Clean. Prod. 2022, 335, 130318. [Google Scholar] [CrossRef]
  8. Lv, X.; Lin, Y.; Chen, X.; Shi, Y.; Liang, R.; Wang, R.; Peng, Z. Environmental impact, durability performance, and interfacial transition zone of iron ore tailings utilized as dam concrete aggregates. J. Clean. Prod. 2021, 292, 126068. [Google Scholar] [CrossRef]
  9. Ullah, S.; Yang, C.; Cao, L.; Wang, P.; Chai, Q.; Li, Y.; Wang, L.; Dong, Z.; Lushinga, N.; Zhang, B. Material design and performance improvement of conductive asphalt concrete incorporating carbon fiber and iron tailings. Constr. Build. Mater. 2021, 303, 124446. [Google Scholar] [CrossRef]
  10. Clapperton, A.; Bazin, C.; Downey, D.; Marois, J.-S. Production of a Phosphate Concentrate from the Tailings of a Niobium Ore Concentrator. Minerals 2020, 10, 692. [Google Scholar] [CrossRef]
  11. Rashad, A.M. Phosphogypsum as a construction material. J. Clean. Prod. 2017, 166, 732–743. [Google Scholar] [CrossRef]
  12. Tayibi, H.; Choura, M.; Lopez, F.A.; Alguacil, F.J.; Lopez-Delgado, A. Environmental impact and management of phosphogypsum. J. Environ. Manag. 2009, 90, 2377–2386. [Google Scholar] [CrossRef] [Green Version]
  13. Reijnders, L. Cleaner phosphogypsum, coal combustion ashes and waste incineration ashes for application in building materials: A review. Build. Environ. 2007, 42, 1036–1042. [Google Scholar] [CrossRef]
  14. Haridasan, P.P.; Maniyan, C.G.; Pillai, P.M.B.; Khan, A.H. Dissolution characteristics of 226Ra from phosphogypsum. J. Environ. Radioact. 2002, 62, 287–294. [Google Scholar] [CrossRef]
  15. Adamo, N.; Al-Ansari, N.; Sissakian, V.; Laue, J.; Knutsson, S. Dam Safety: The Question of Tailings Dams. J. Earth Sci. Geotech. Eng. 2020, 11, 1–26. [Google Scholar] [CrossRef]
  16. Omachi, C.Y.; Siani, S.M.O.; Chagas, F.M.; Mascagni, M.L.; Cordeiro, M.; Garcia, G.D.; Thompson, C.C.; Siegle, E.; Thompson, F.L. Atlantic Forest loss caused by the world’s largest tailing dam collapse (Fundão Dam, Mariana, Brazil). Remote Sens. Appl. Soc. Environ. 2018, 12, 30–34. [Google Scholar] [CrossRef]
  17. Rutherford, P.; Dudas, M.; Samek, R. Environmental impacts of phosphogypsum. Sci. Total Environ. 1994, 149, 1–38. [Google Scholar] [CrossRef]
  18. Mendes, B.C.; Pedroti, L.G.; Fontes, M.P.F.; Ribeiro, J.C.L.; Vieira, C.M.F.; Pacheco, A.A.; de Azevedo, A.R.G. Technical and environmental assessment of the incorporation of iron ore tailings in construction clay bricks. Constr. Build. Mater. 2019, 227, 116669. [Google Scholar] [CrossRef]
  19. Xu, J.; Li, T.; Zhan, M.; Chen, X.; Xu, F.; Wang, S. Study on Erosion Characteristics and Mechanisms of Recycled Concrete with Tailings in Salt Spray Environments. Buildings 2022, 12, 446. [Google Scholar] [CrossRef]
  20. Yang, S.; Zhang, J.; An, X.; Qi, B.; Shen, D.; Lv, M. Effects of fly ash and limestone powder on the paste rheological thresholds of self-compacting concrete. Constr. Build. Mater. 2021, 281, 122560. [Google Scholar] [CrossRef]
  21. Zhang, J.; Lv, M.; An, X.; Shen, D.; He, X.; Nie, D.; Tang, S. Improved Powder Equivalence Model for the Mix Design of Self-Compacting Concrete with Fly Ash and Limestone Powder. Adv. Mater. Sci. Eng. 2021, 2021, 1–12. [Google Scholar] [CrossRef]
  22. Rybak, J.; Kongar-Syuryun, C.; Tyulyaeva, Y.; Khayrutdinov, A.M. Creation of Backfill Materials Based on Industrial Waste. Minerals 2021, 11, 739. [Google Scholar] [CrossRef]
  23. Okereafor, U.; Makhatha, M.; Mekuto, L.; Mavumengwana, V. Gold Mine Tailings: A Potential Source of Silica Sand for Glass Making. Minerals 2020, 10, 448. [Google Scholar] [CrossRef]
  24. An, X.; Wu, Q.; Jin, F.; Huang, M.; Zhou, H.; Chen, C.; Liu, C. Rock-filled concrete, the new norm of SCC in hydraulic engineering in China. Cem. Concr. Compos. 2014, 54, 89–99. [Google Scholar] [CrossRef]
  25. Okamura, H.; Ouchi, M. Self-compacting concrete. J. Adv. Concr. Technol. 2003, 1, 5–15. [Google Scholar] [CrossRef]
  26. Zhang, X.; Zhang, Z.; Li, Z.; Li, Y.; Sun, T. Filling capacity analysis of self-compacting concrete in rock-filled concrete based on DEM. Constr. Build. Mater. 2020, 233, 117321. [Google Scholar] [CrossRef]
  27. Zhang, N.; Tang, B.; Liu, X. Cementitious activity of iron ore tailing and its utilization in cementitious materials, bricks and concrete. Constr. Build. Mater. 2021, 288, 123022. [Google Scholar] [CrossRef]
  28. Gopez, R.G. Utilizing Mine Tailings as Substitute Construction Material: The Use of Waste Materials in Roller Compacted Concrete. Open Access Libr. J. 2015, 2, 1–9. [Google Scholar] [CrossRef]
  29. Ghorpade, V.G.; Sudarsana Rao, H.; Ramana, B. Deriving Mix Proportions for Different Grades of Phosphogypsum Based Self Compacting Concrete. Int. J. Eng. Res. Appl. 2013, 3, 467–473. [Google Scholar]
  30. Zhang, J.; An, X.; Nie, D. Effect of fine aggregate characteristics on the thresholds of self-compacting paste rheological properties. Constr. Build. Mater. 2016, 116, 355–365. [Google Scholar] [CrossRef]
  31. Zhang, J.; An, X.; Yu, Y.; Nie, D. Effects of coarse aggregate content on the paste rheological thresholds of fresh self-compacting concrete. Constr. Build. Mater. 2019, 208, 564–576. [Google Scholar] [CrossRef]
  32. Yang, S.; Zhang, J.; An, X.; Qi, B.; Li, W.; Shen, D.; Li, P.; Lv, M. The Effect of Sand Type on the Rheological Properties of Self-Compacting Mortar. Buildings 2021, 11, 441. [Google Scholar] [CrossRef]
  33. Yu, L.; Tian, J.S.; Zhang, J.X.; Yang, R.J. Effect of iron ore tailings as fine aggregate on pore structure of mortars. Adv. Mater. Res. 2011, 250, 1017–1024. [Google Scholar] [CrossRef]
  34. Cai, J.W.; Lü, Z.H.; Gao, G.L.; Wu, J.X. Effects of Micro Fines Content on Performances of Mortar Prepared with Mill Tailings from Magnetite. Adv. Mater. Res. 2011, 287, 729–732. [Google Scholar] [CrossRef]
  35. Feng, X.X.; Xi, X.L.; Cai, J.W.; Chai, H.J.; Song, Y.Z. Investigation of drying shrinkage of concrete prepared with iron mine tailings. Key Eng. Mater. 2011, 277, 37–41. [Google Scholar] [CrossRef]
  36. Zhao, S.; Fan, J.; Sun, W. Utilization of iron ore tailings as fine aggregate in ultra-high performance concrete. Constr. Build. Mater. 2014, 50, 540–548. [Google Scholar] [CrossRef]
  37. Liu, L.; Cheng, X.; Miao, X.; Shi, Y.; Zhang, M.; Guo, M.; Cheng, F.; Zhang, M. Preparation and characterization of majority solid waste based eco-unburned permeable bricks. Constr. Build. Mater. 2020, 259, 120400. [Google Scholar] [CrossRef]
  38. Cai, J.; Lv, N.; Jia, X.; Zhang, R.; Xu, G.; Cai, L.; Tian, Q. Properties of permeable ceramic brick prepared with felsite tailing. J. Build. Eng. 2021, 44, 103426. [Google Scholar] [CrossRef]
  39. Ding, S.; Shui, Z.; Chen, W.; Lu, J.; Tian, S. Properties of supersulphated phosphogysumslag cement (SSC) concrete. J. Wuhan Univ. Technol.-Mater. Sci. Ed. 2014, 29, 109–113. [Google Scholar] [CrossRef]
  40. Kang, J.; Shen, D.; Li, C.; Li, M.; Wang, X.; Hu, H. Effect of water-to-cement ratio on internal relative humidity and autogenous shrinkage of early-age concrete internally cured by superabsorbent polymers. Struct. Concr. 2022. [Google Scholar] [CrossRef]
  41. Li, P.; Jiang, Z.; An, X.; Maekawa, K.; Du, S. Time-dependent retardation effect of epoxy latexes on cement hydration: Experiments and multi-component hydration model. Constr. Build. Mater. 2022, 320, 126282. [Google Scholar] [CrossRef]
  42. Wang, L.; Li, G.; Li, X.; Guo, F.; Tang, S.; Lu, X.; Hanif, A. Influence of reactivity and dosage of MgO expansive agent on shrinkage and crack resistance of face slab concrete. Cem. Concr. Compos. 2022, 126, 104333. [Google Scholar] [CrossRef]
  43. Wang, L.; Song, X.; Yang, H.; Wang, L.; Tang, S.; Wu, B.; Mao, W. Pore Structural and Fractal Analysis of the Effects of MgO Reactivity and Dosage on Permeability and F–T Resistance of Concrete. Fractal Fract. 2022, 6, 113. [Google Scholar] [CrossRef]
  44. Shettima, A.U.; Hussin, M.W.; Ahmad, Y.; Mirza, J. Evaluation of iron ore tailings as replacement for fine aggregate in concrete. Constr. Build. Mater. 2016, 120, 72–79. [Google Scholar] [CrossRef]
Figure 1. Accumulation states of iron (a) ore tailing sand and (b) phosphogypsum.
Buildings 12 00555 g001
Figure 2. Particle size distribution curves of IOT sand and IOT gravel.
Buildings 12 00555 g002
Figure 3. Particle size distribution curves of PG and MPG.
Buildings 12 00555 g003
Figure 4. Mould schematic diagram for pressure forming method.
Buildings 12 00555 g004
Figure 5. Deformation of the inner wall of the mould by finite element calculation.
Buildings 12 00555 g005
Figure 6. The process of an artificial rockfill prepared by pressure forming method: (a) concrete mixing; (b) loading; (c) curing.
Buildings 12 00555 g006
Figure 7. A handheld vibrator equipped with a pressing plate.
Buildings 12 00555 g007
Figure 8. Comparison of strength cost ratio of the artificial rockfills.
Buildings 12 00555 g008
Figure 9. Comparison of utilization cost of unit IOT.
Buildings 12 00555 g009
Table 1. Chemical compositions of the PG, GBFS, steel slag and cement.
Chemical CompositionPG (%)GBFS (%)Steel Slag (%)Cement (%)
SiO29.6533.1719.4821.78
Al2O30.7916.282.675.10
Fe2O30.370.2616.763.40
CaO29.7138.2247.5565.05
MgO0.308.097.582.12
K2O0.490.580.031.35
Na2O0.260.370.070.12
MnO0.0030.231.89/
TiO20.0871.511.23/
P2O51.030.1021.76/
SO336.62///
LOI20.52///
Table 2. Mix proportion of parathion gypsum slag cement concrete.
W/BCement
(kg/m3)
GBFS
(kg/m3)
MPG
(kg/m3)
SP
(kg/m3)
Sand
(kg/m3)
Gravel
(kg/m3)
Water
(kg/m3)
Compressive Strength (MPa)
3 d7 d28 d
0.3421.76272375.362.18584103759.9717.629.142.5
Table 3. Compressive strength and cost of the artificial rockfills.
Mix IDW/BBinder
(kg/m3)
Water
(kg/m3)
IOT Sand
(kg/m3)
IOT Gravel
(kg/m3)
SP
(kg/m3)
Compressive Strength (MPa)Cost
($)
7 d28 d
VO-900.90908110771317/1.521.6615.7
VO-1300.9013011710191245/3.353.5417.4
VO-1700.901701539581170/6.367.6719.2
VP-1800.5518099100812320.722.725.0513.4
VP-2600.5526014391811231.048.0314.4014.0
VP-3400.5534018782910131.3616.4533.7114.8
PO-1800.9018016213107981.4410.6712.2920.7
PO-2200.9022019811757981.7614.2519.0422.9
PO-2600.9026023410457982.0825.1032.8625.0
PP-1800.551809914857980.728.7912.3113.8
PP-3600.5536019810557981.4422.7837.4816.3
PP-4400.554402428657981.7632.1247.7417.4
OP-3900.5039019555612100.3918.8539.2815.9
OP-4330.4543319551112100.8721.9742.3417.0
OP-4880.4048719545612101.4623.5543.7818.4
Publisher’s Note: MDPI stays neutral with regard to jurisdictional claims in published maps and institutional affiliations.

