Article

Response of Functionally Graded Preplaced Aggregate Fibrous Concrete with Superior Impact Strength

by
Gunasekaran Murali
1,3,*,
Nandhu Prasad
1,
Sallal R. Abid
2 and
Nikolai Ivanovich Vatin
3
1
School of Civil Engineering, SASTRA Deemed to Be University, Thanjavur 613401, India
2
Civil Engineering Department, Wasit University, Kut 52003, Iraq
3
Peter the Great St. Petersburg Polytechnic University, 195251 St. Petersburg, Russia
*
Author to whom correspondence should be addressed.
Buildings 2022, 12(5), 563; https://doi.org/10.3390/buildings12050563
Submission received: 25 December 2021 / Revised: 16 January 2022 / Accepted: 17 January 2022 / Published: 27 April 2022

Abstract

:
This research examines the modified drop-mass impact performance on functionally graded preplaced aggregate fibrous concrete (FPAFC) against repeated low-velocity impacts. Three-layered FPAFCs were prepared with the outer layers reinforced with steel and polypropylene fibers to evaluate the impact resistance. For comparison, both one- and two-layered concretes were cast simultaneously. The modified version of the impact test was suggested to the ACI 544 drop-mass impact test to decrease the scattered test data. The modification was a replacement of the steel ball with a steel bar to apply a line impact instead of the single-point impact. This modification distributes the impact energy over a broader area and reduces the scattering of results. The study parameters for the tests were impact numbers, which cause first cracking and failure; ductility index; and mode of failure. In addition, three methods of the two-parameter Weibull distribution were used to examine the dispersed test results, which were presented in terms of reliability. Results revealed that the specimens comprising 3.6% steel fibers at the top layer and no fiber at the middle layer exhibited the highest percentage improvements of 633% and 2732% recorded for the cracking and failure impact number, respectively. The percentage difference in impact strength results between these two methods ranged from −14% to 75% for cracking impact number and from 6.8% to 57.2% for failure impact number. The coefficient of variation value calculated from the modified impact test was reduced and ranged from 20.3% to 56.1% for cracking impact number and from 15.2% to 65.3% for failure impact number, compared with the same mixtures from the ACI 544 test method. This phenomenon indicates that the modified impact test delivered a lower scattering of results by introducing a line of impact using a steel bar rather than a single-point impact.

1. Introduction

Concrete structures are often subjected to with various stresses [1]. Regarding these sorts of loads, impact loads have a low likelihood of occurring within the life span of a building [2]. However, in the last several decades, the necessity of impact analysis has risen due to terrorist operations. Impact loads can be created by falling rocks hitting insurance exhibits, airplane and missile impacts on nuclear containments, vehicle accidents, ice or ships’ wrecks, or dropped items striking on industrial and nuclear plants due to handling activities. Even if composite materials’ mechanical and durability qualities have been improved, there is a need to assess the material’s resistance to impact loading since this is an essential quality for building materials.
In recent times, composite structures using biomaterial have gained heightened focus among researchers because of their high impact resistance and innovative hierarchical structures [3]. Investigating a biologically inspired structure permits investigators to develop innovative designs. The use of biomaterials is a novel idea in materials science, with this research area also being named biomimicry. The creative combination of biology and the properties of higher impact resistance can be obtained in biological composite materials (e.g., a shell of a turtle). At the meso-/micro-/nanoscale levels, organic and inorganic components are often found in hierarchically ordered complex structures. The turtle’s shell perfectly protects it from impact loading and also ensures flexible mobility. The sandwich-type carapace shell of the turtle is illustrated in Figure 1 [4]. There are three layers of the turtle shell: layer 1 has a high density, which provides defense against impact and is called endocortical; layer 2 is trabecular, which is porous and serves as an impact absorber. Layer 3 is very dense and is called exocortical, which imparts shielding [4]. This shell offers excellent armor behavior and inspires the endocortical layer to prevent penetration and the impact force absorbed by the trabecular layer. The exceptional impact resistance of biomaterials is attributed to their structural and compositional systems variations. A concrete structure experiencing to impact load can be a single-point impact or line of impact depending upon the size and type of the impactor. The impact of aircraft landing on runways is an example of single-point impact. Car accidents on highway barriers and sea wave impacts on offshore constructions are examples of a line of impact.

1.1. Preplaced Aggregate Fibrous Concrete

Preplaced aggregate fibrous concrete (PAFC) is an advanced, conventional fibrous concrete with diverse fabrication methods. Initially, the premixing of fibers and coarse aggregates is performed and piled up into an empty mold. This fabrication method allows more coarse aggregates and fibers piled into the mold and facilitates interlocking, thereby forming a natural skeleton. For example, the number of contact points between coarse aggregates is increased by interlocking [5]; there is excellent stress distribution when they are loaded [6]. PAFC contains a more aggregate and less cementitious phase [7]. Coarse aggregate components in concrete display better volume stability, resistance to cracking, modulus of elasticity, durability, and strength. At the same time, they ensure environmental and economic benefits by reducing cement and lessening carbon dioxide emissions [8]. The conception of aggregates interlocking with fibers to develop a novel composite has been an evolving area of investigation over the past few years. Unfortunately, there is only limited literature available on PAFC impact resistance. Recently, researchers have shown that PAFC shows exceptional mechanical properties [9], creep and lower drying shrinkage [10], resistance to elevated temperature [11], and excellent resistance to impact [12].
Mohan et al. [13] investigated the impact resistance of preplaced aggregate fibrous concrete composed of asphalt-coated coarse aggregates. Coarse aggregates with 25%, 50%, 75%, and 100% substitution of natural aggregates are exposed to single and double asphalt precoating with a 2.5% dosage of steel fiber. Findings indicated that the impact strength of double asphalt-coated aggregate concrete was greater than that of single asphalt-coated aggregate. The double-coated nonfibrous concrete outperformed the single-coated specimen by 60% to 51% for the first crack and 11% to 16% for failure. The same pattern recorded a 78%–36% first crack and a 20%–15% failure rate in fibrous concrete. According to the findings of Salaimanimagudam et al. [14], the PAFC showed a significant improvement in compressive strength of up to 56.9% compared with nonfibrous concrete. In fibrous concrete beams with a 4% fiber addition, the first crack and failures were recorded at 2725 J and 9842 J, respectively, compared with nonfibrous concrete beams that have 122 and 203 J. Abirami et al. [15] reported that the impact behavior of PAFC comprises 4% and 5% dosages of 5D hooked end steel fiber. Results indicated that the failure impact energy improved by 3134% and 3636%, respectively, compared with a nonfibrous specimen. Steel composite fender behavior was studied by Manohar et al. [16] using the PAFC concept. The fender featured PAFC panels on the inside and outside and a corrugated steel plate in the center with a 1 and 2 mm thickness. Results indicated that repeated hits caused localized damage to the outer panel in the shape of a hemispherical hole. According to this phenomenon, corrugated steel plates with a thickness of 2 mm have a better energy absorption capability than 1 mm thick steel plates. Corrugated steel plate fenders combined with PAFC has outstanding low-velocity impact resistance. Abirami et al. [17] investigated three-layered PAFC, and they found that the dose of hooked end steel fiber was 2.5%, with between-layer glass fiber mesh having varying sizes. The larger glass fiber mesh diameter insertion in PAFC showed excellent impact energy absorption. The absorbed impact energy was decreased when a greater number of glass fiber meshes were inserted in between the top and middle and a smaller number were provided between the middle and bottom layers. The concrete crack propagation was slowed down due to the glass fiber mesh, which acted as a barricade.

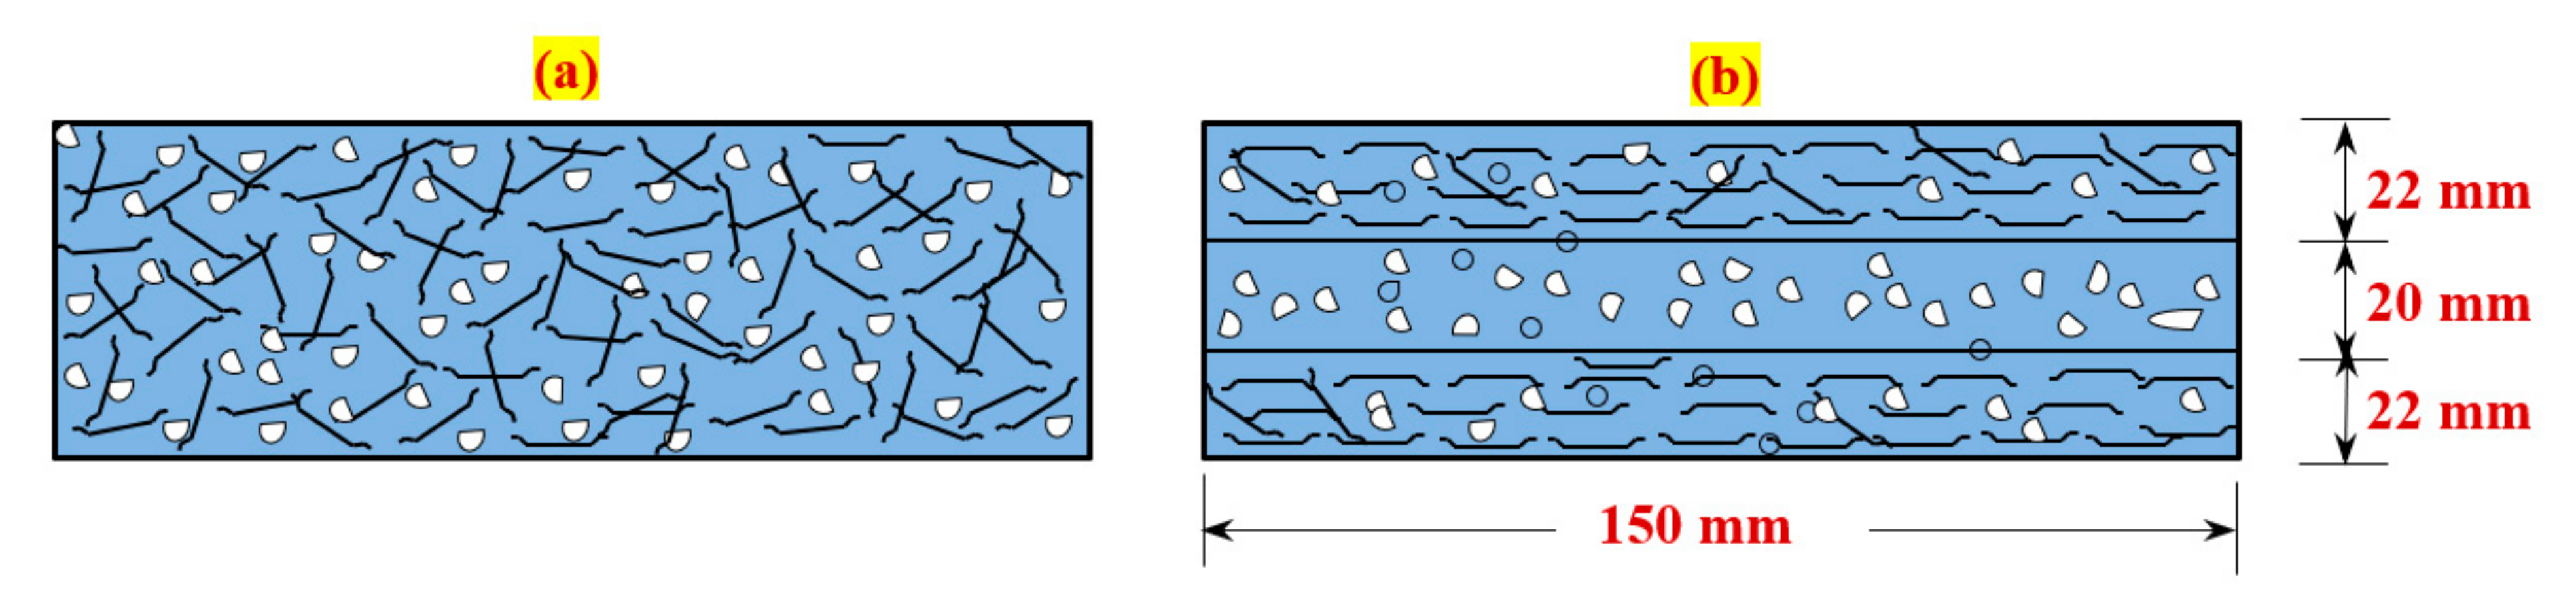
1.2. Functionally Graded Concrete

Advancement in materials science has increased the advent of novel forms of composite materials known as functionally graded concrete (FGC), with the possibility of utilizing them in many engineering fields [18]. Fibrous concrete is used successfully in construction, and extensive research has been conducted worldwide to explore its strength and durability [19]. An evolution of fiber-reinforced concrete with better advancement is called functionally graded fibrous concrete (FGFC). Innovating concrete composite with improved mechanical properties, such as FGFC, ensures the necessary behavior by changing its properties. A higher density with a strong fiber matrix can be achieved in FGFC, which exhibits excellent properties, namely, impact resistance, toughness, and uniaxial tensile strength [20]. Moghadam and Omidinasab [21] investigated the behavior of FGFC slabs comprising 1% dosage of steel fiber, nylon fiber, and a hybrid combination. In comparison with steel fiber, nylon fiber showed less increase in FGFC flexural strength. Nylon, steel, and hybrid fibers enhanced flexural strength 1.2, 2.6, and 1.7 times, respectively. A significant enhancement in the flexural strength was observed in FGFC compared with conventional fibrous concrete. This enhancement is due to the fiber bridging action.
Mastali et al. [22] explored the impact response of five-layered FGFC curved slabs by adding different steel fiber dosages in each layer. The dosages of the fibers added from the top to the bottom layers (five) were 2%, 1%, 0.5%, 1%, and 2%, and their effectiveness was compared with the traditional fibrous slab comprising 1.3% dosage of fiber (same fiber content of FGFC). Conclusions indicated that the impact energy absorption of the five-layered FGFC was greater than that of the standard fibrous slab. Nandhu Prasad and Murali [20] studied the falling impact performance of two- and three-layered FGFC beams of three different sizes. The dimensions of small, medium, and large beams were 250 × 50 × 50 mm, 400 × 100 × 100 mm, and 550 × 150 × 150 mm, respectively. In all beams, mono (same type of fibers) and hybrid combinations (different types of fibers) of steel and polypropylene fibers were used to strengthen them with an average dosage of 2.4% per beam. The findings indicate that the three-layered FGFC exhibited higher impact resistance. Only limited research is available in the literature concerning the development of FGFC with preplaced aggregate concrete. Therefore, research studies that explore the energy absorption potential and impact performance of this material are still required.

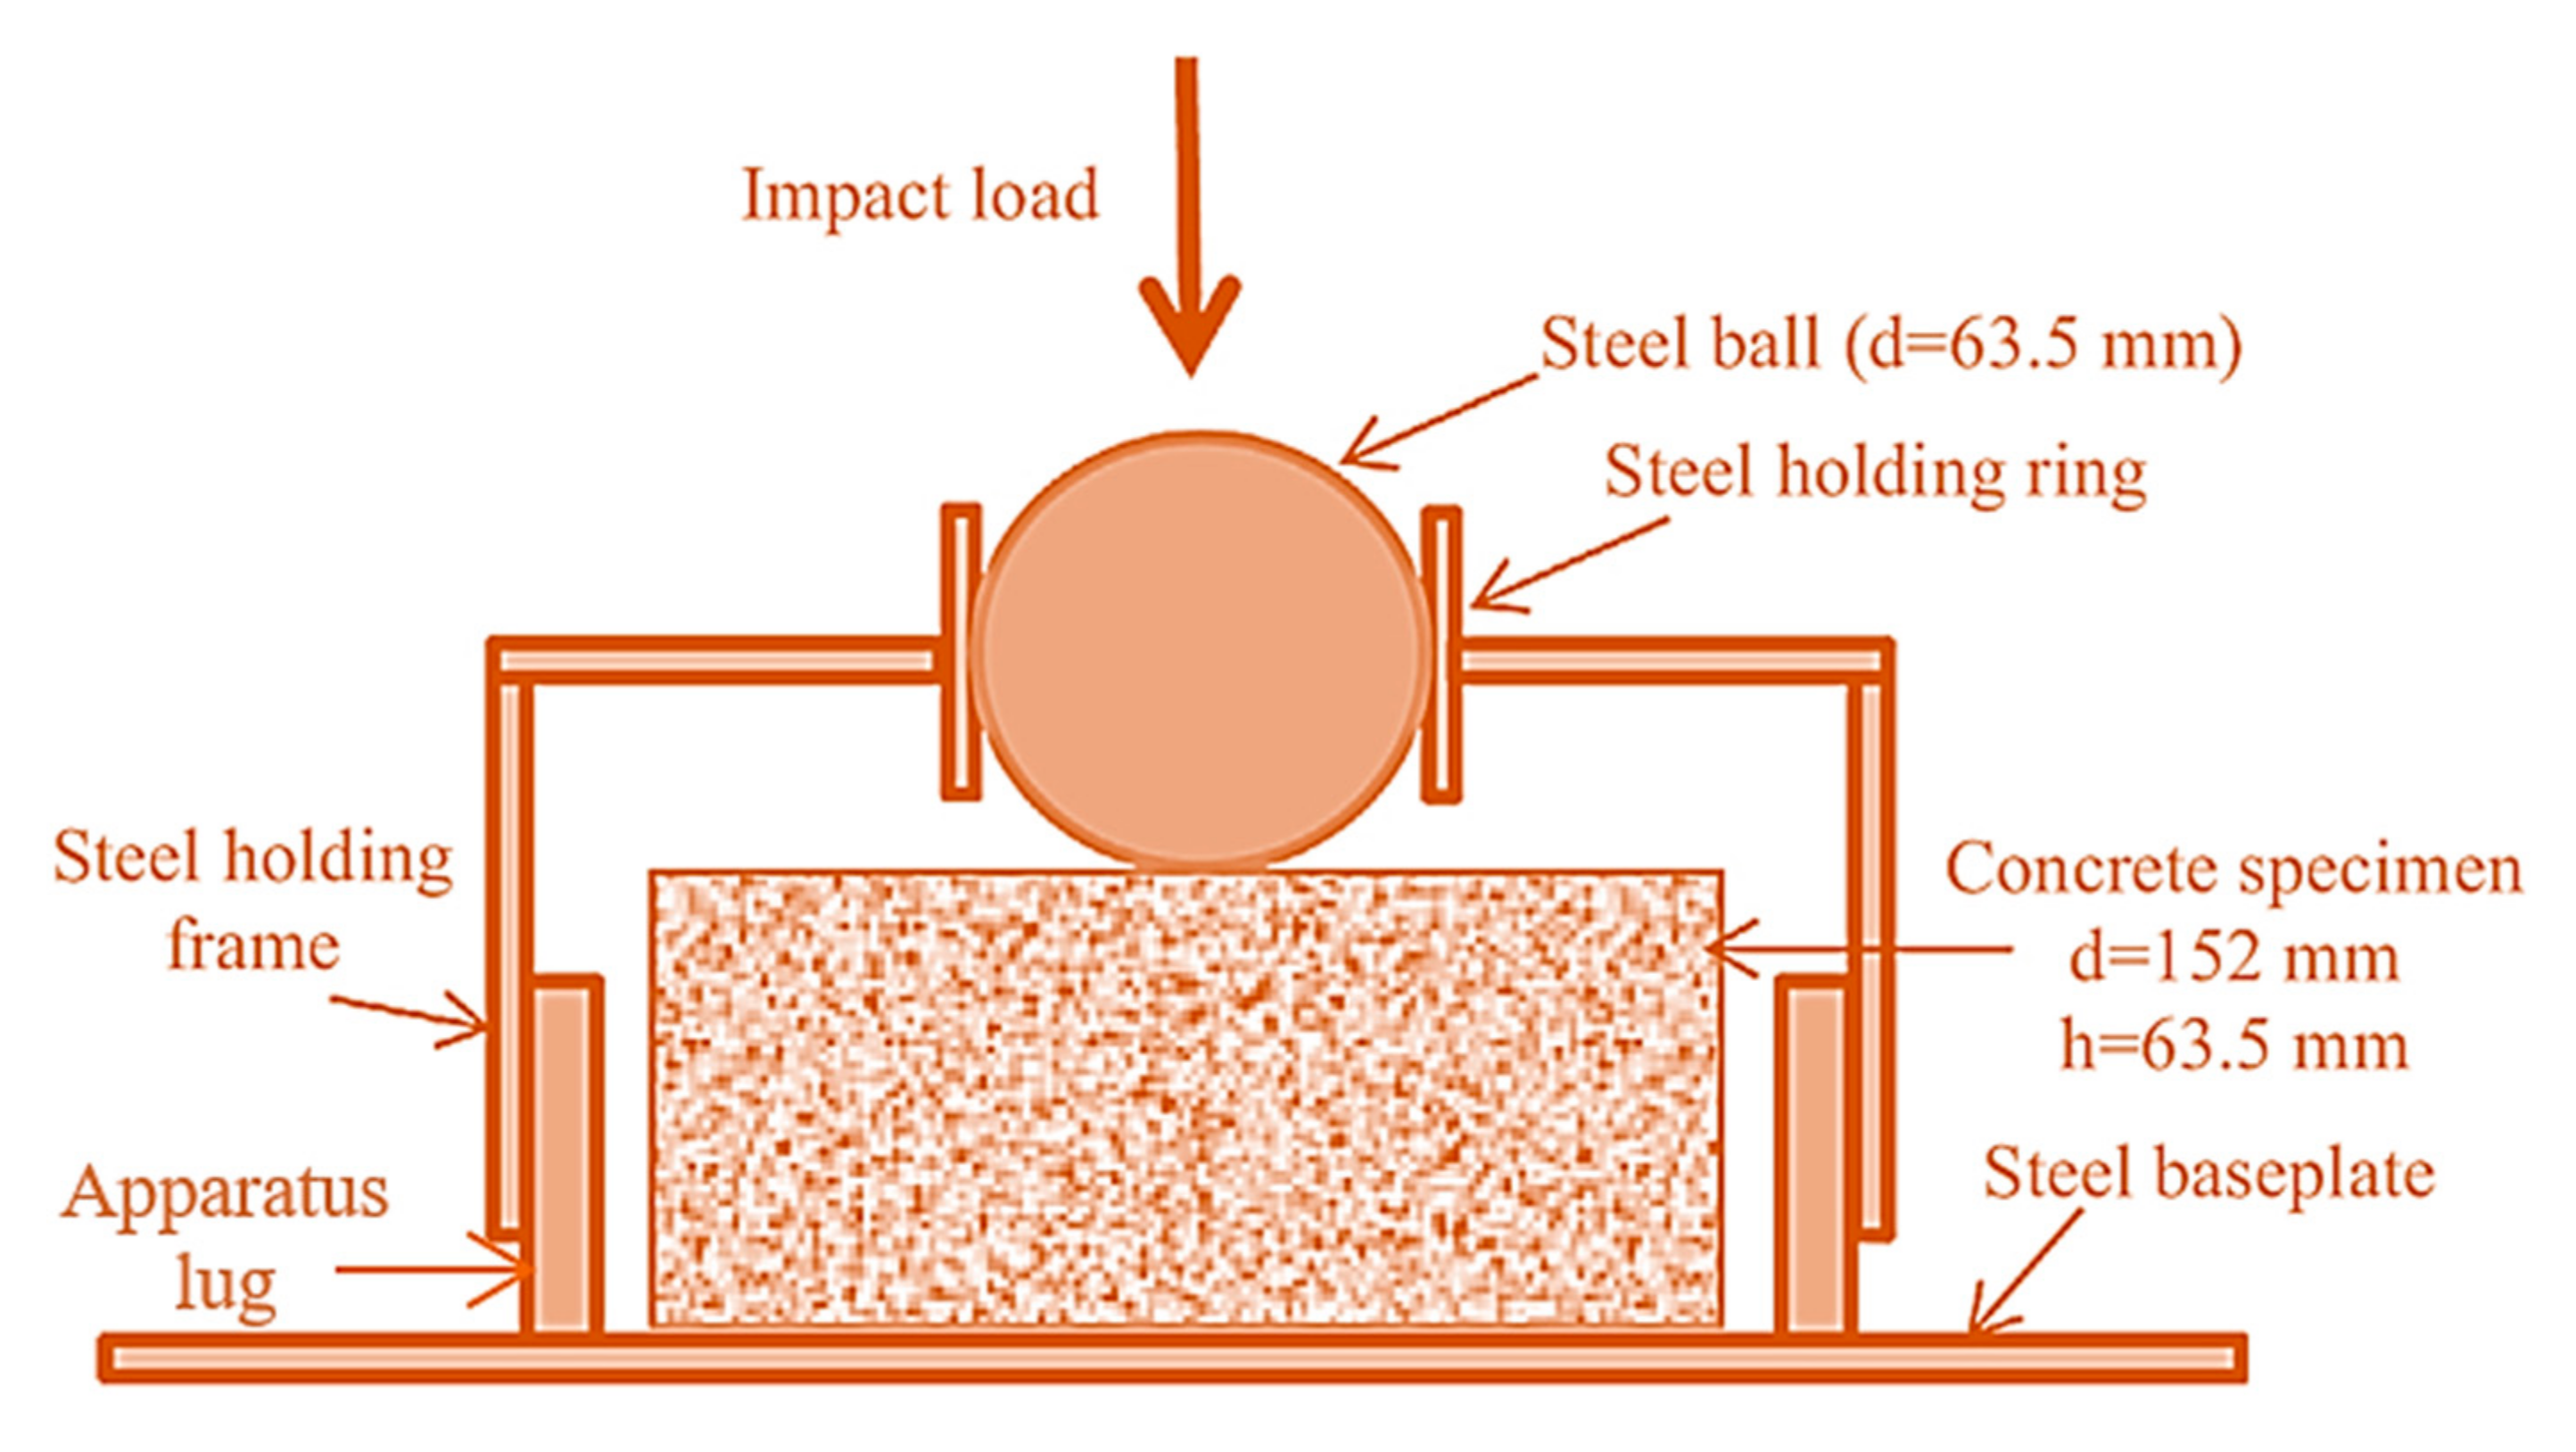
1.3. ACI 544.2R-89 Drop-Weight Impact Test

Figure 2 depicts an ACI 544 [23] drop-weight impact testing device. Table 1 demonstrates pilot studies of the falling mass impact tests conducted on various types of concrete. The coefficient of variation in Table 1 indicates that the ACI impact test results were greatly scattered, which was due to the following reasons: (1) In any direction and any area of the specimens, cracks are allowed to happen. This further reinforces the test subjectivity while cracking, which is examined through visual observation, which is complicated. (2) The impact applied on the specimen is a single point, and this phenomenon raises the window of opportunity for incorrect results. The point of impact might be a soft area of the cement matrix or the hard region in the coarse aggregate. (3) There is no standard procedure suggested for specimen preparation. Therefore, specimens possibly have smooth mold-faced surfaces. (4) Specimen failure is described by the cracks propagated that reach the specimen bottom and the apparatus lug. This failure observation can cause a repeated impact on the specimen even if failure occurred with excessive crack width. (5) There is no standard suggesting the acceptance or rejection of the failure pattern, resulting in scattered test results. Despite the ACI falling mass impact test’s many advantages, scattering results are the main drawback and need to be reduced.

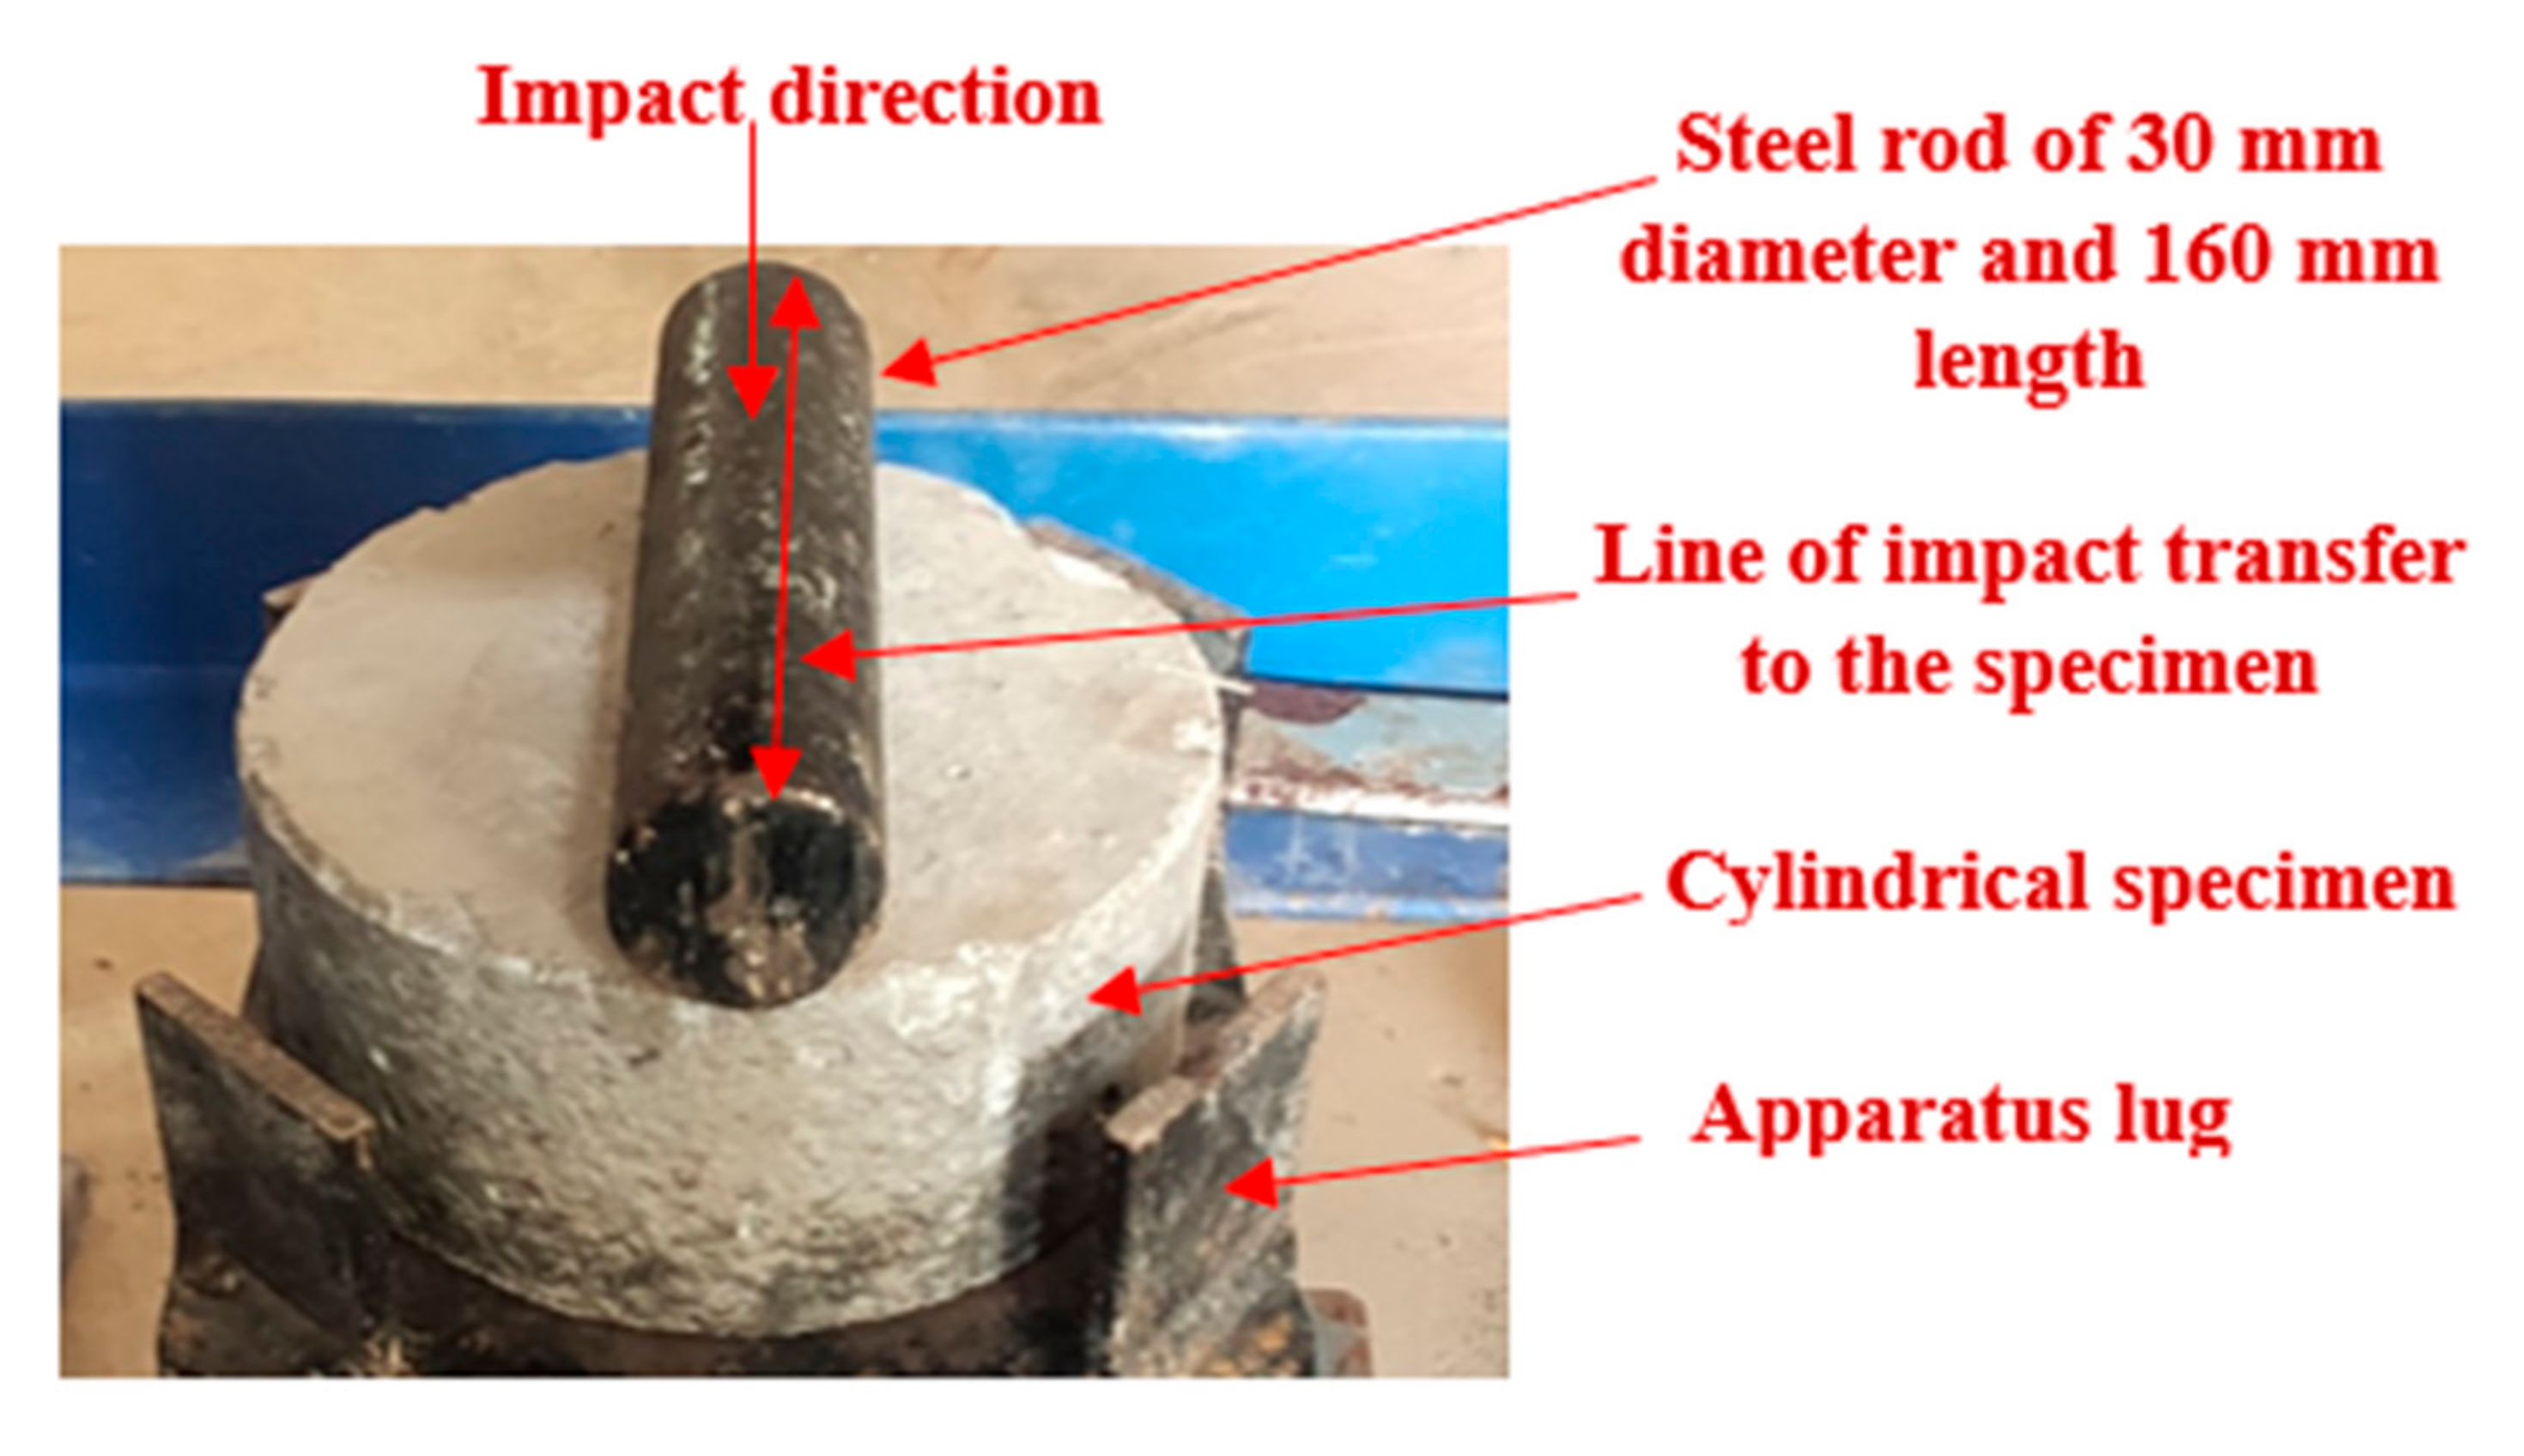
1.4. Modification Suggested to ACI Drop-Weight Impact Test

Literature revealed many sources of error in the existing ACI drop-weight test [23]. This research considers the primary two sources of error, and modifications are suggested accordingly. At first, the probability of inaccurate results is higher at the single spot of impact, which causes a localized impact on the small area of the material. Second, cracks occur anywhere on the specimen’s top surface, resulting in increased test subjectivity. The modification suggested here introduces the line of impact using a 30 mm diameter steel bar placed horizontally on the specimen, as shown in Figure 3. The steel hammer is free-fallen onto the steel bar, and the impact load is dissipated to more area instead of to a single spot. This modification allows cracks to occur parallel to the line of impact and splits the specimens into two pieces together with multiple cracks in a radial direction. This modification predefines the crack path and specimen failure, resulting in a reduction in result scattering.
The objective of the study is to propose a modified impact test to the ACI 544 drop-mass impact test to decrease the scattered test data. The modification was proposed by the replacement of the steel ball with a steel bar to apply a line impact instead of the single-point impact. This modification distributes the impact energy over a broader area and reduces the scattering of results. The proposed modification was applied on the three-layered FPAFC comprising steel and polypropylene fiber. Several combinations of fiber dosage and fiber hybridization were used to reinforce each layer. The impact strength of first cracking and failure impact numbers was assessed.

2. Significance of Research

The literature on modified ACI drop-weight testing procedures is still deficient. It is still a fact that scientists across the globe are using a variety of statistical approaches to examine the large amount of dispersal in ACI 544 test findings. It is interesting to conduct the modified impact test and attain a rational conclusion to reduce scattering results. However, only limited research was conducted to reduce scattering results that remain in this field of study. In pursuit of fill gaps in this research field, this study intended to investigate the FPAFC impact behavior by conducting a modified impact test. Instead of a single-point hit, a steel bar positioned horizontally is offered as a straightforward solution for reducing dispersion consequences. Additionally, three techniques of the two-parameter Weibull distribution were used to study the scattering findings and assess the impact’s strength in terms of reliability.

3. Experimental Investigation

3.1. Base Materials

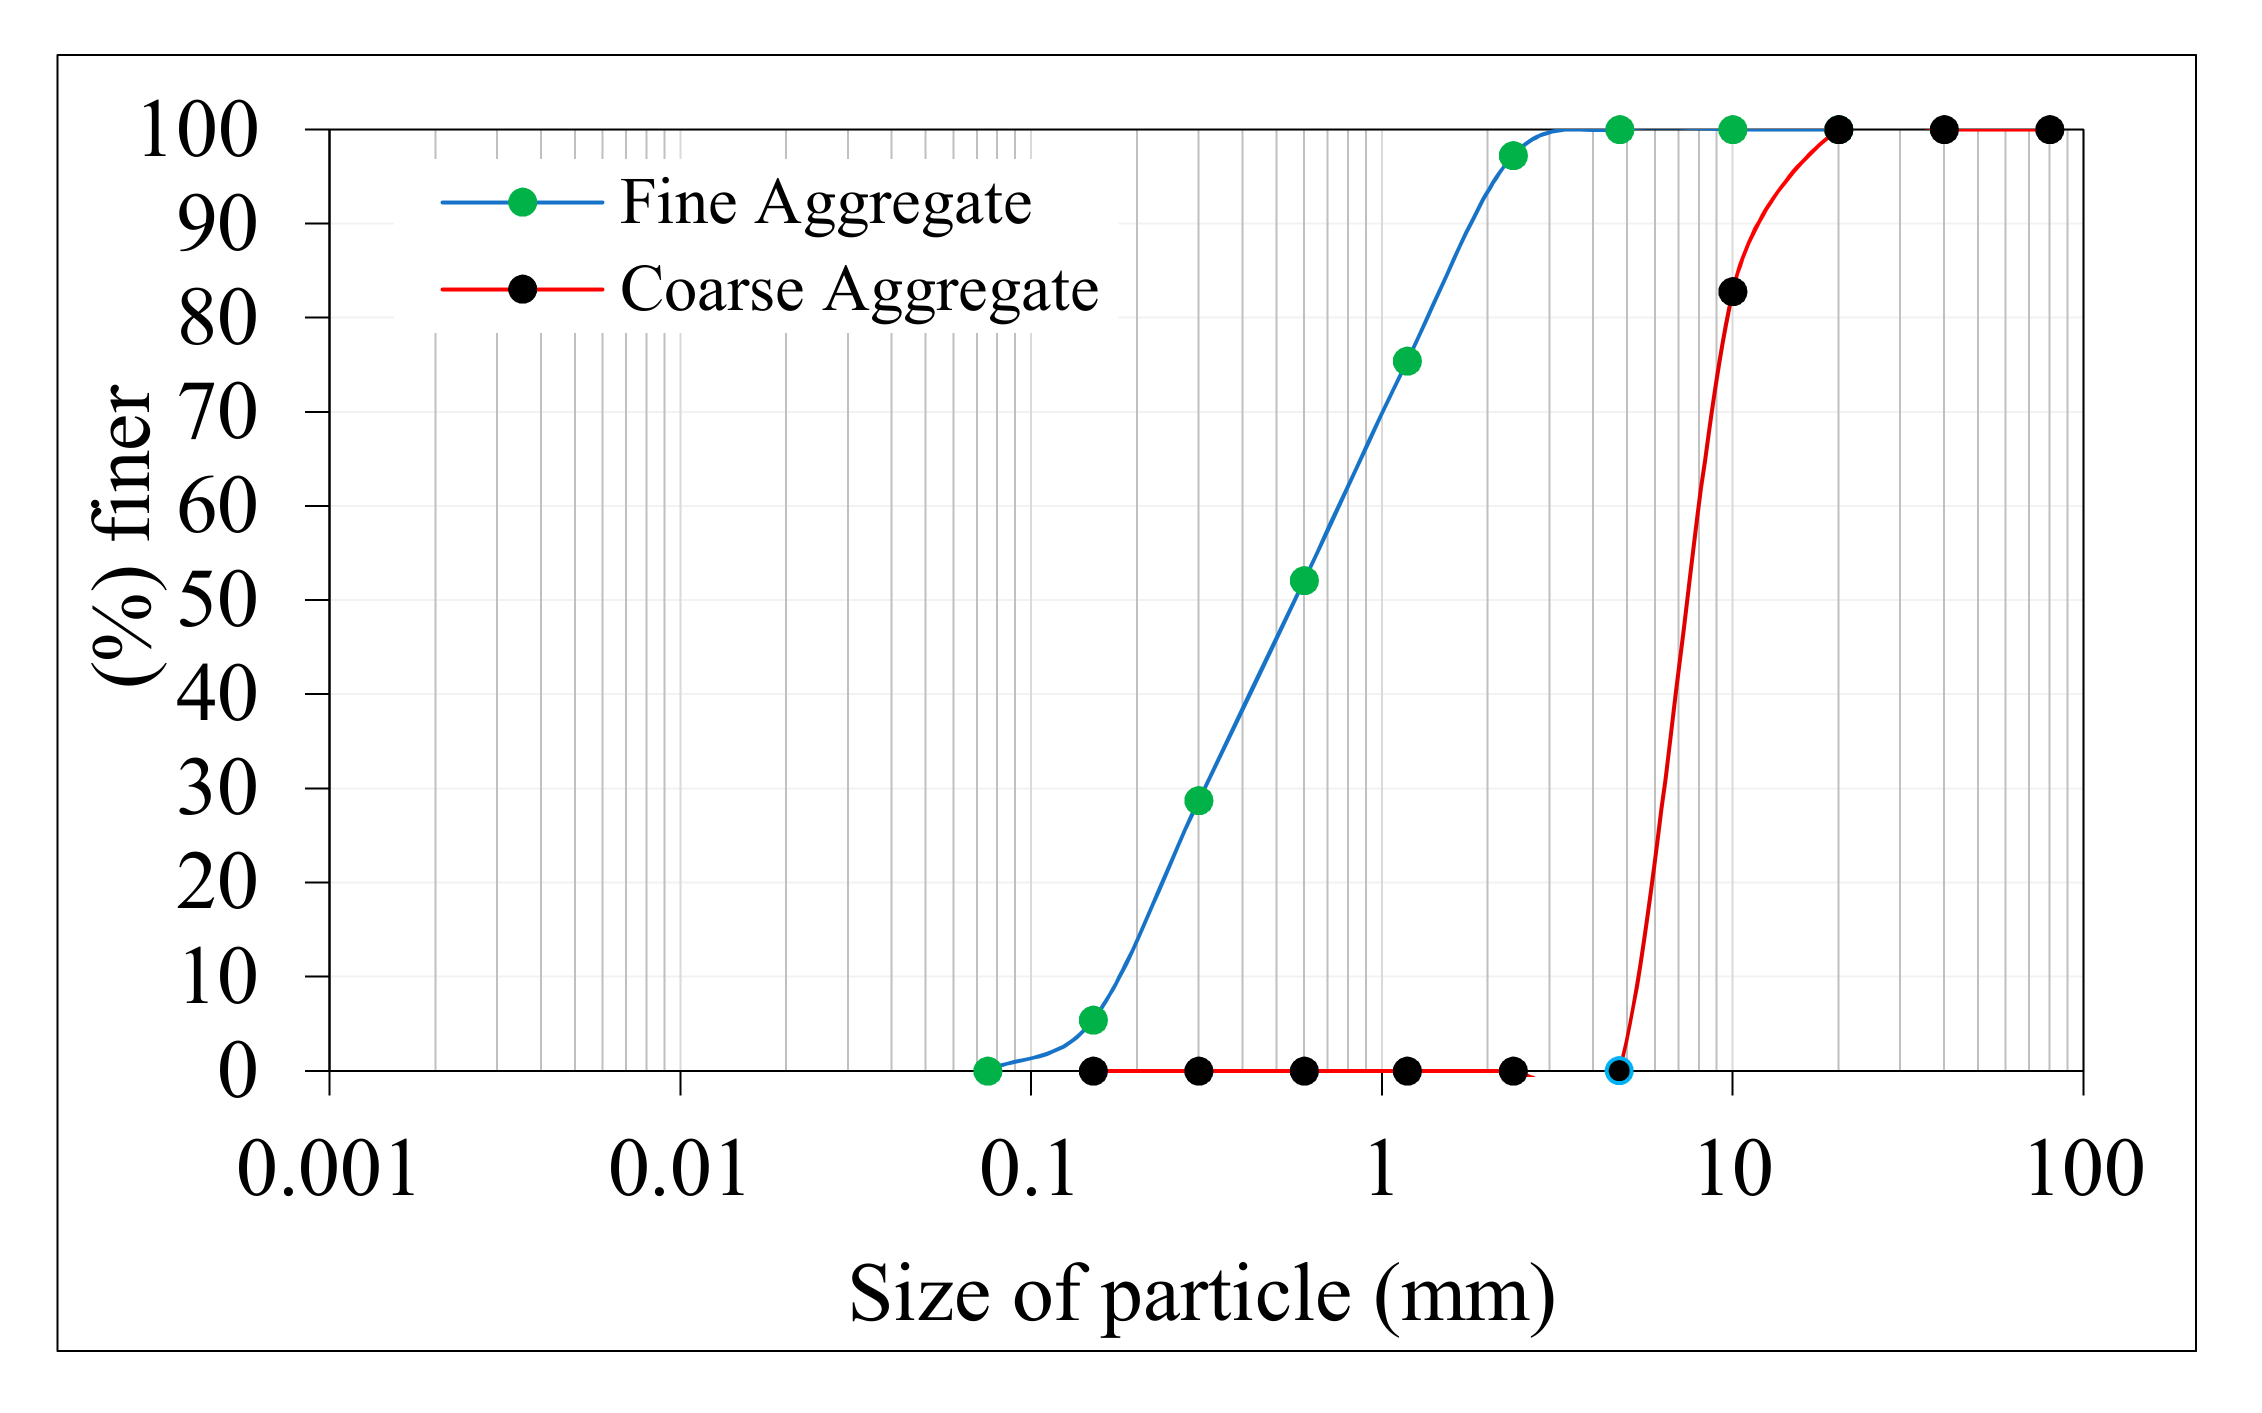
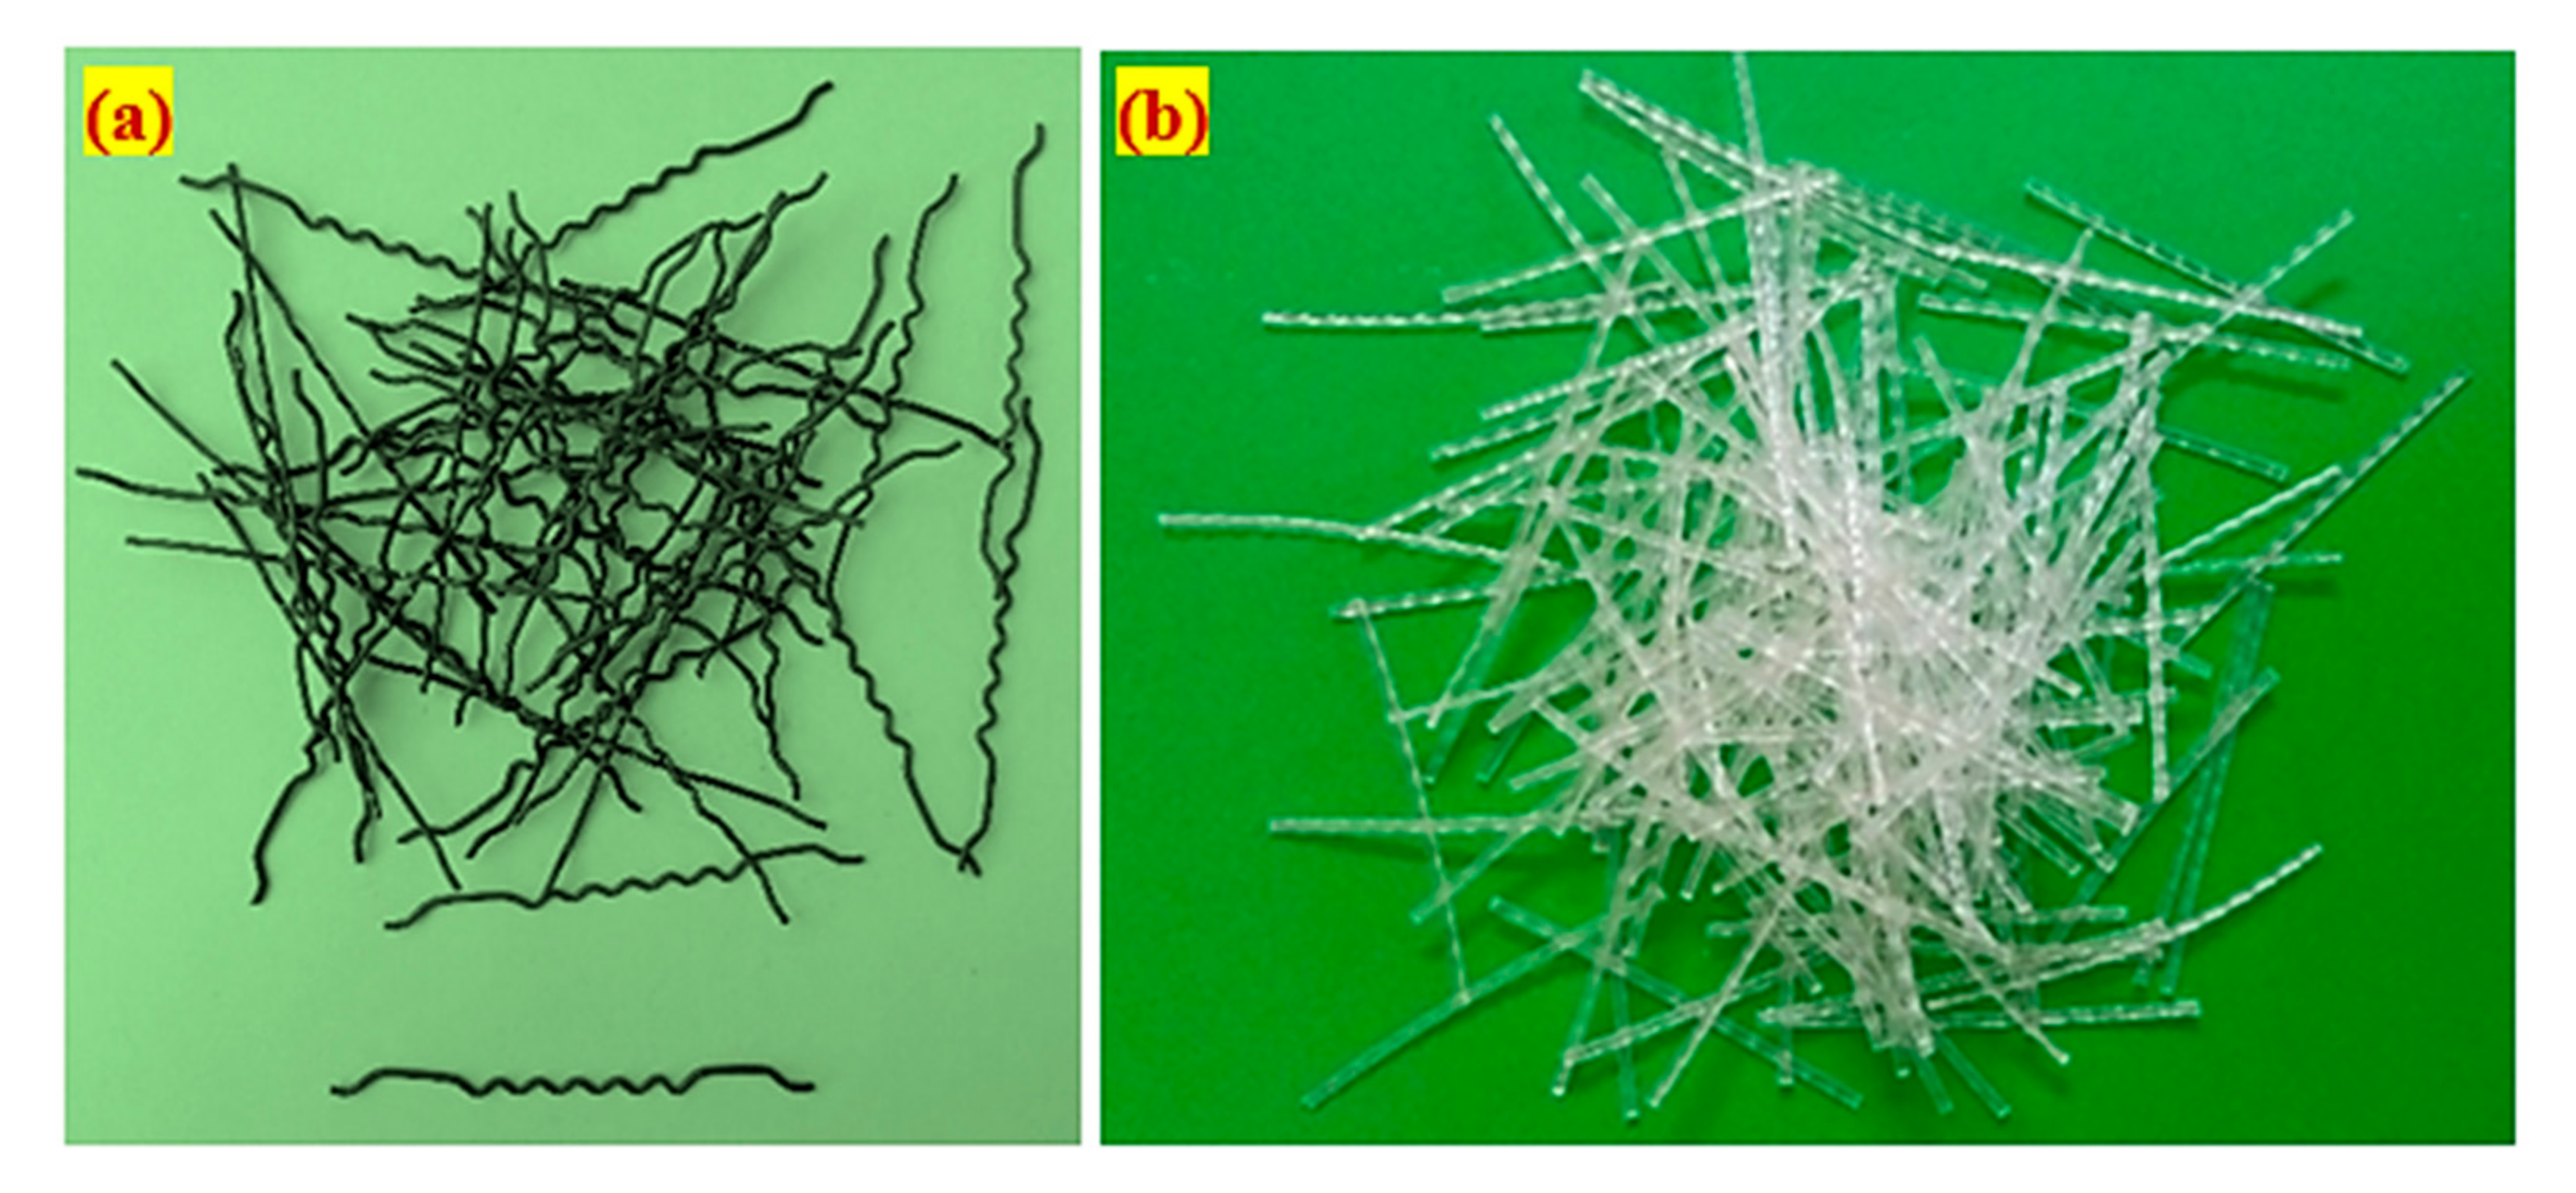
  • Pozzolana Portland general-purpose cement was used in the experiments, which meets IS: 1489-2015 [33]. The cement has a specific gravity of 3.09 and a specific surface area of 318 kg/m2. Normal river sand was used as fine aggregate. In addition, the fineness modulus, water absorption, and specific gravity of the used fine aggregate were 2.41%, 1.15%, and 2.65%, respectively. The granulometric curve of the adopted sand is consistent with Zone II per IS: 383-2016 [34], with particle size of no more than 2.36 mm to ensure excellent flowable grout mixture in line with ASTM C939/C939M-16a [35]. As a result, a flowable grout was obtained to fill voids entirely and effectively. Crushed granite gravel with a normal density and a 12.5 mm maximum size was used as coarse aggregate with a water absorption and specific gravity of 0.59% and 2.69 respectively. The granulometric curve for the fine and coarse aggregates used in this experiment is illustrated in Figure 4. The flowable grout was made using a premium high-range water reducer (Tec Mix 640) with a density of 1.08 0.01 at 25 °C and a pH value of 7–9. Different dosages (0.3% to 0.5% by cement weight) were used to produce the grout for nonfibrous and fibrous specimens. Fiber is now a part of concrete reinforcement as it has many benefits for concrete. A 1 mm diameter and a 50 mm length of hybrid hooked-end crimped fiber was used, which had a tensile strength of 1200 MPa and was made using a novel geometrically shaped steel fiber (SF) and macro polypropylene fiber (PF). The PF had a tensile strength of 500 MPa and measured 45 mm in length with a diameter of 0.8 mm. Figure 5 demonstrates the SF and PF appearance.

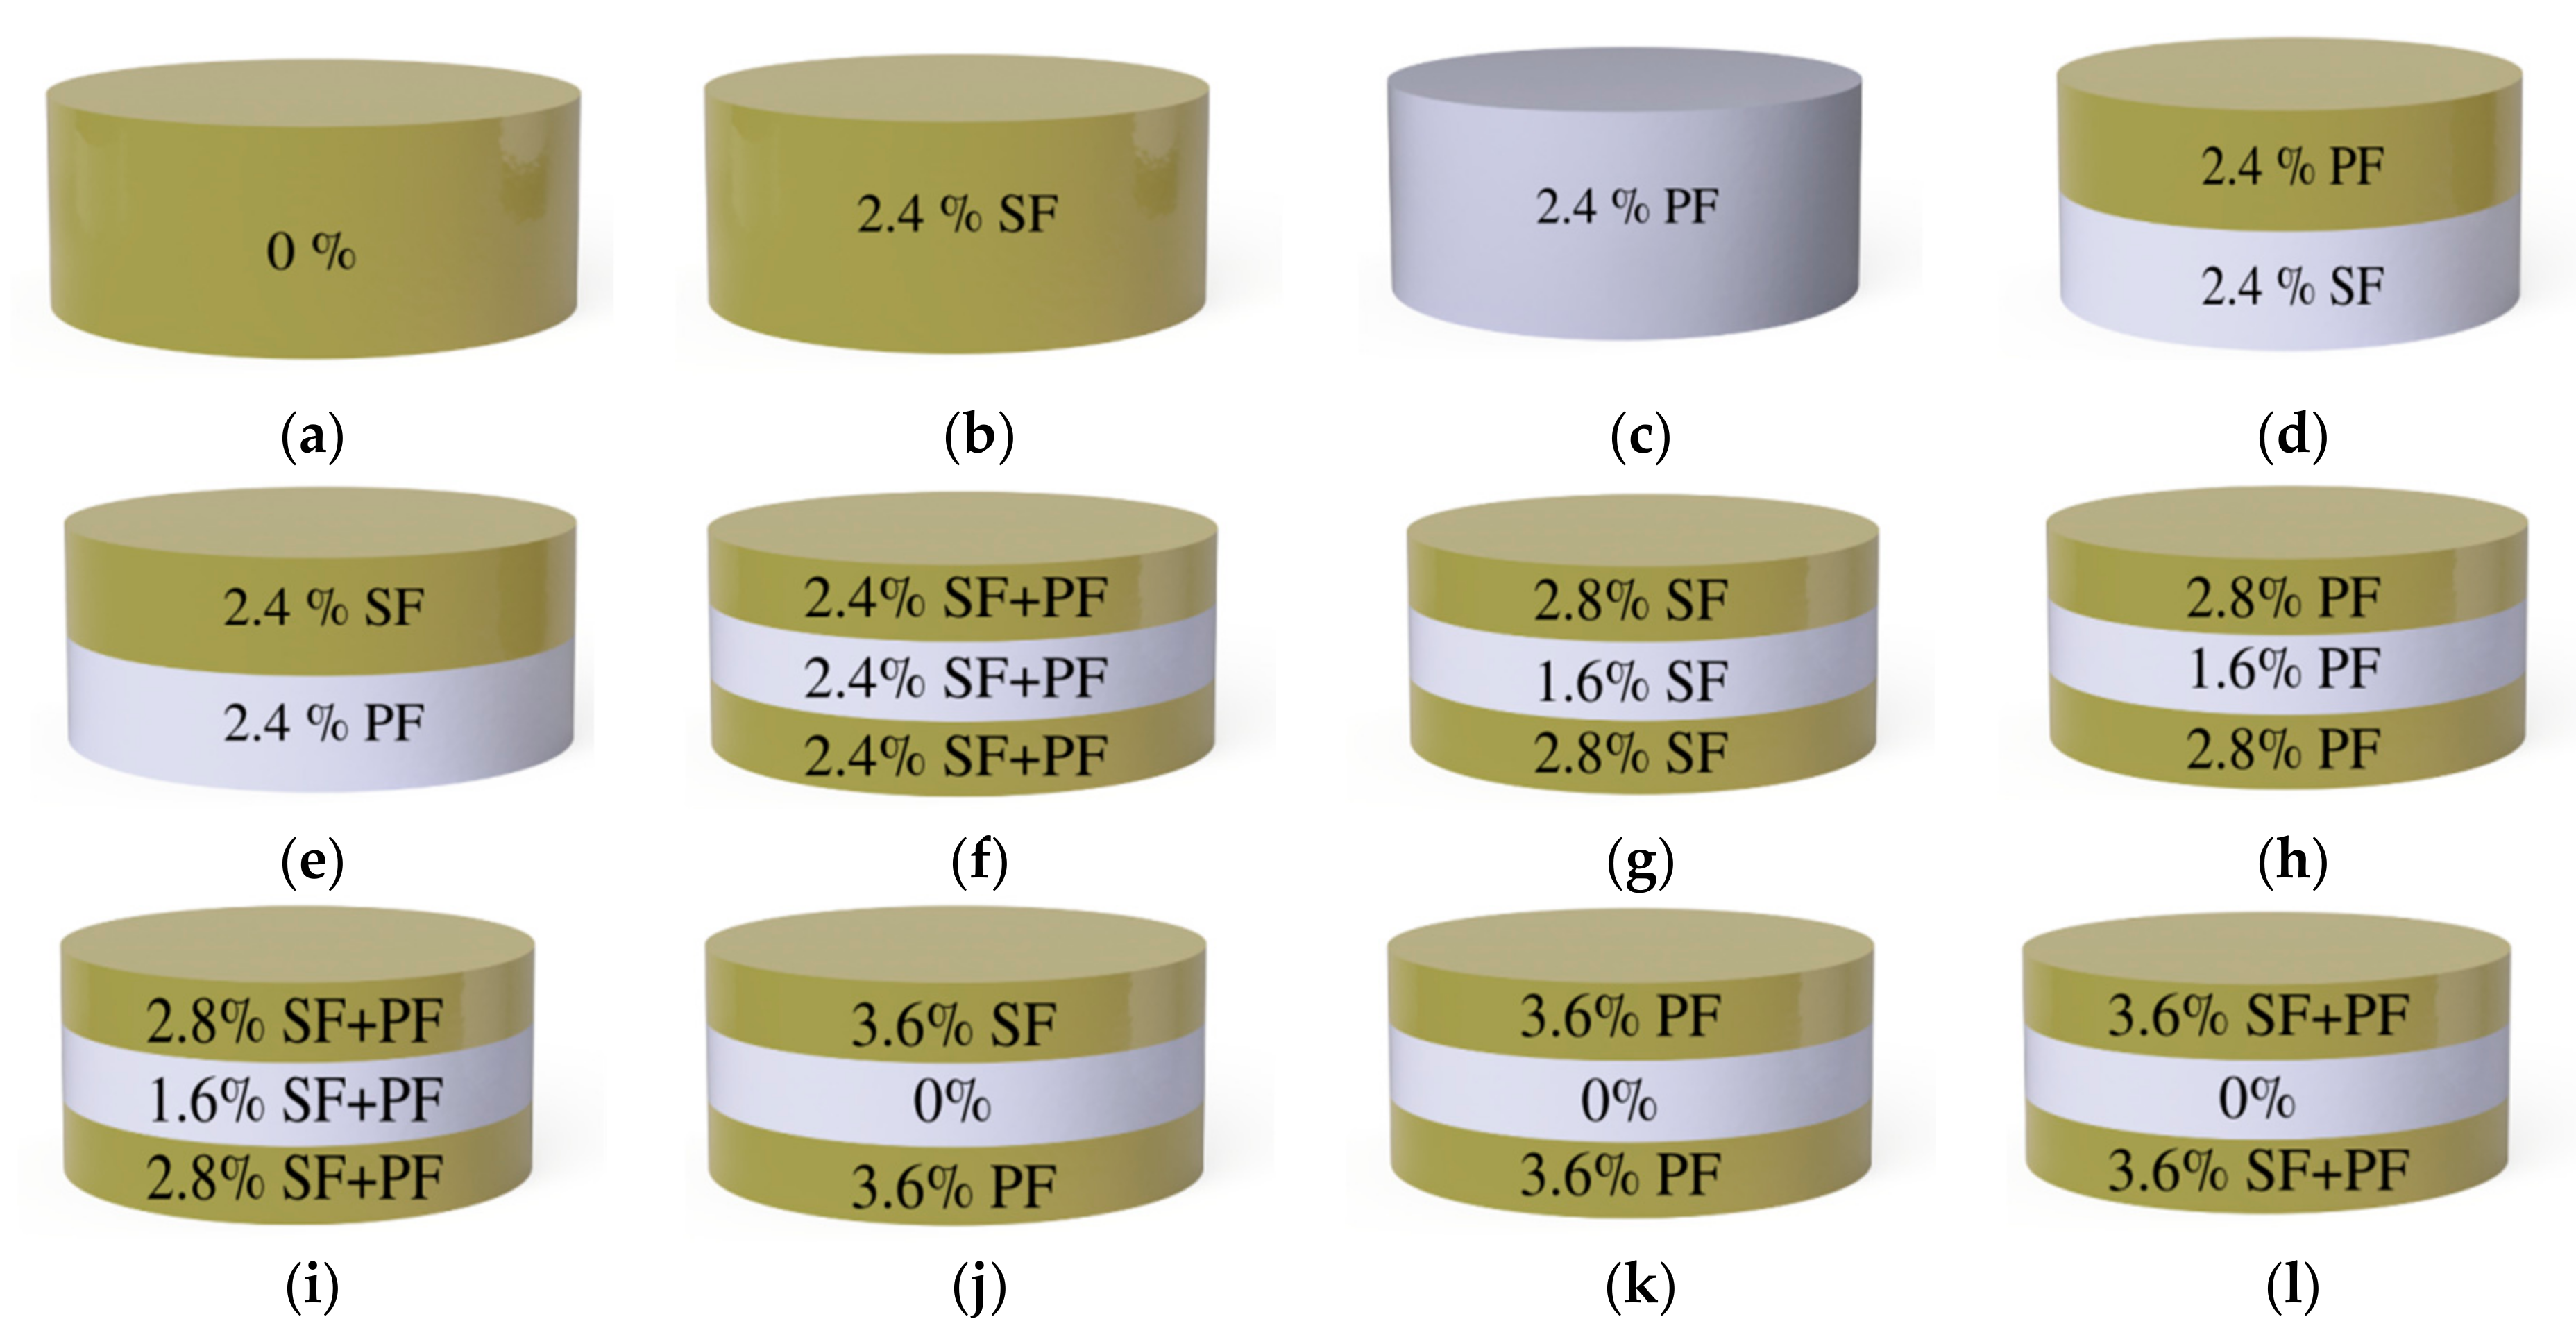
3.2. Mixing Composition

In the current research, 12 diverse concrete mixtures were produced to evaluate their impact resistance. A series of grout mixtures were prepared to choose optimum grouts based on efflux time from the cone test, which fulfilled compressive strength and flowable grout requirements. Efflux time for optimized grout ranged from 35 to 40 s in accordance with ASTM C939 [35]. The optimized ratios for sand to binder and water to cement were 1.0 and 0.45, respectively. A high-range water reducer (Tec Mix 640 superplasticizer) was added to water to improve the grout flowability. Its dosage was 0.3% for nonfibrous specimens and 0.5% for fibrous specimens. The composition of the 12 mixtures with different fibers and dosages in each layer of FPAFC are demonstrated in Table 2. The first mixture was considered the reference specimen, prepared without fiber and designated as PAC. The second and third mixtures were single-layer fibrous concrete added with SF and PF. This group of mixtures was designated as S-SF and S-PF, as the first letter ‘S’ denoted a single-layer concrete and the second (e.g., SF or PF) denoted the type of fiber used. The fourth and fifth mixtures were double-layered FPAFC and designated as D-SF-PF and D-PF-SF, respectively. For this group, the first letter denoted a double-layered FPAFC, while the second and third designated the fiber type used in the top and bottom layers. The last seven mixtures were three-layered FPAFCs by adding different fiber schemes with 2.4% dosage, and these were named T-FG1 to T-FG7. The different fiber dosages used for each layer are shown in Figure 6.

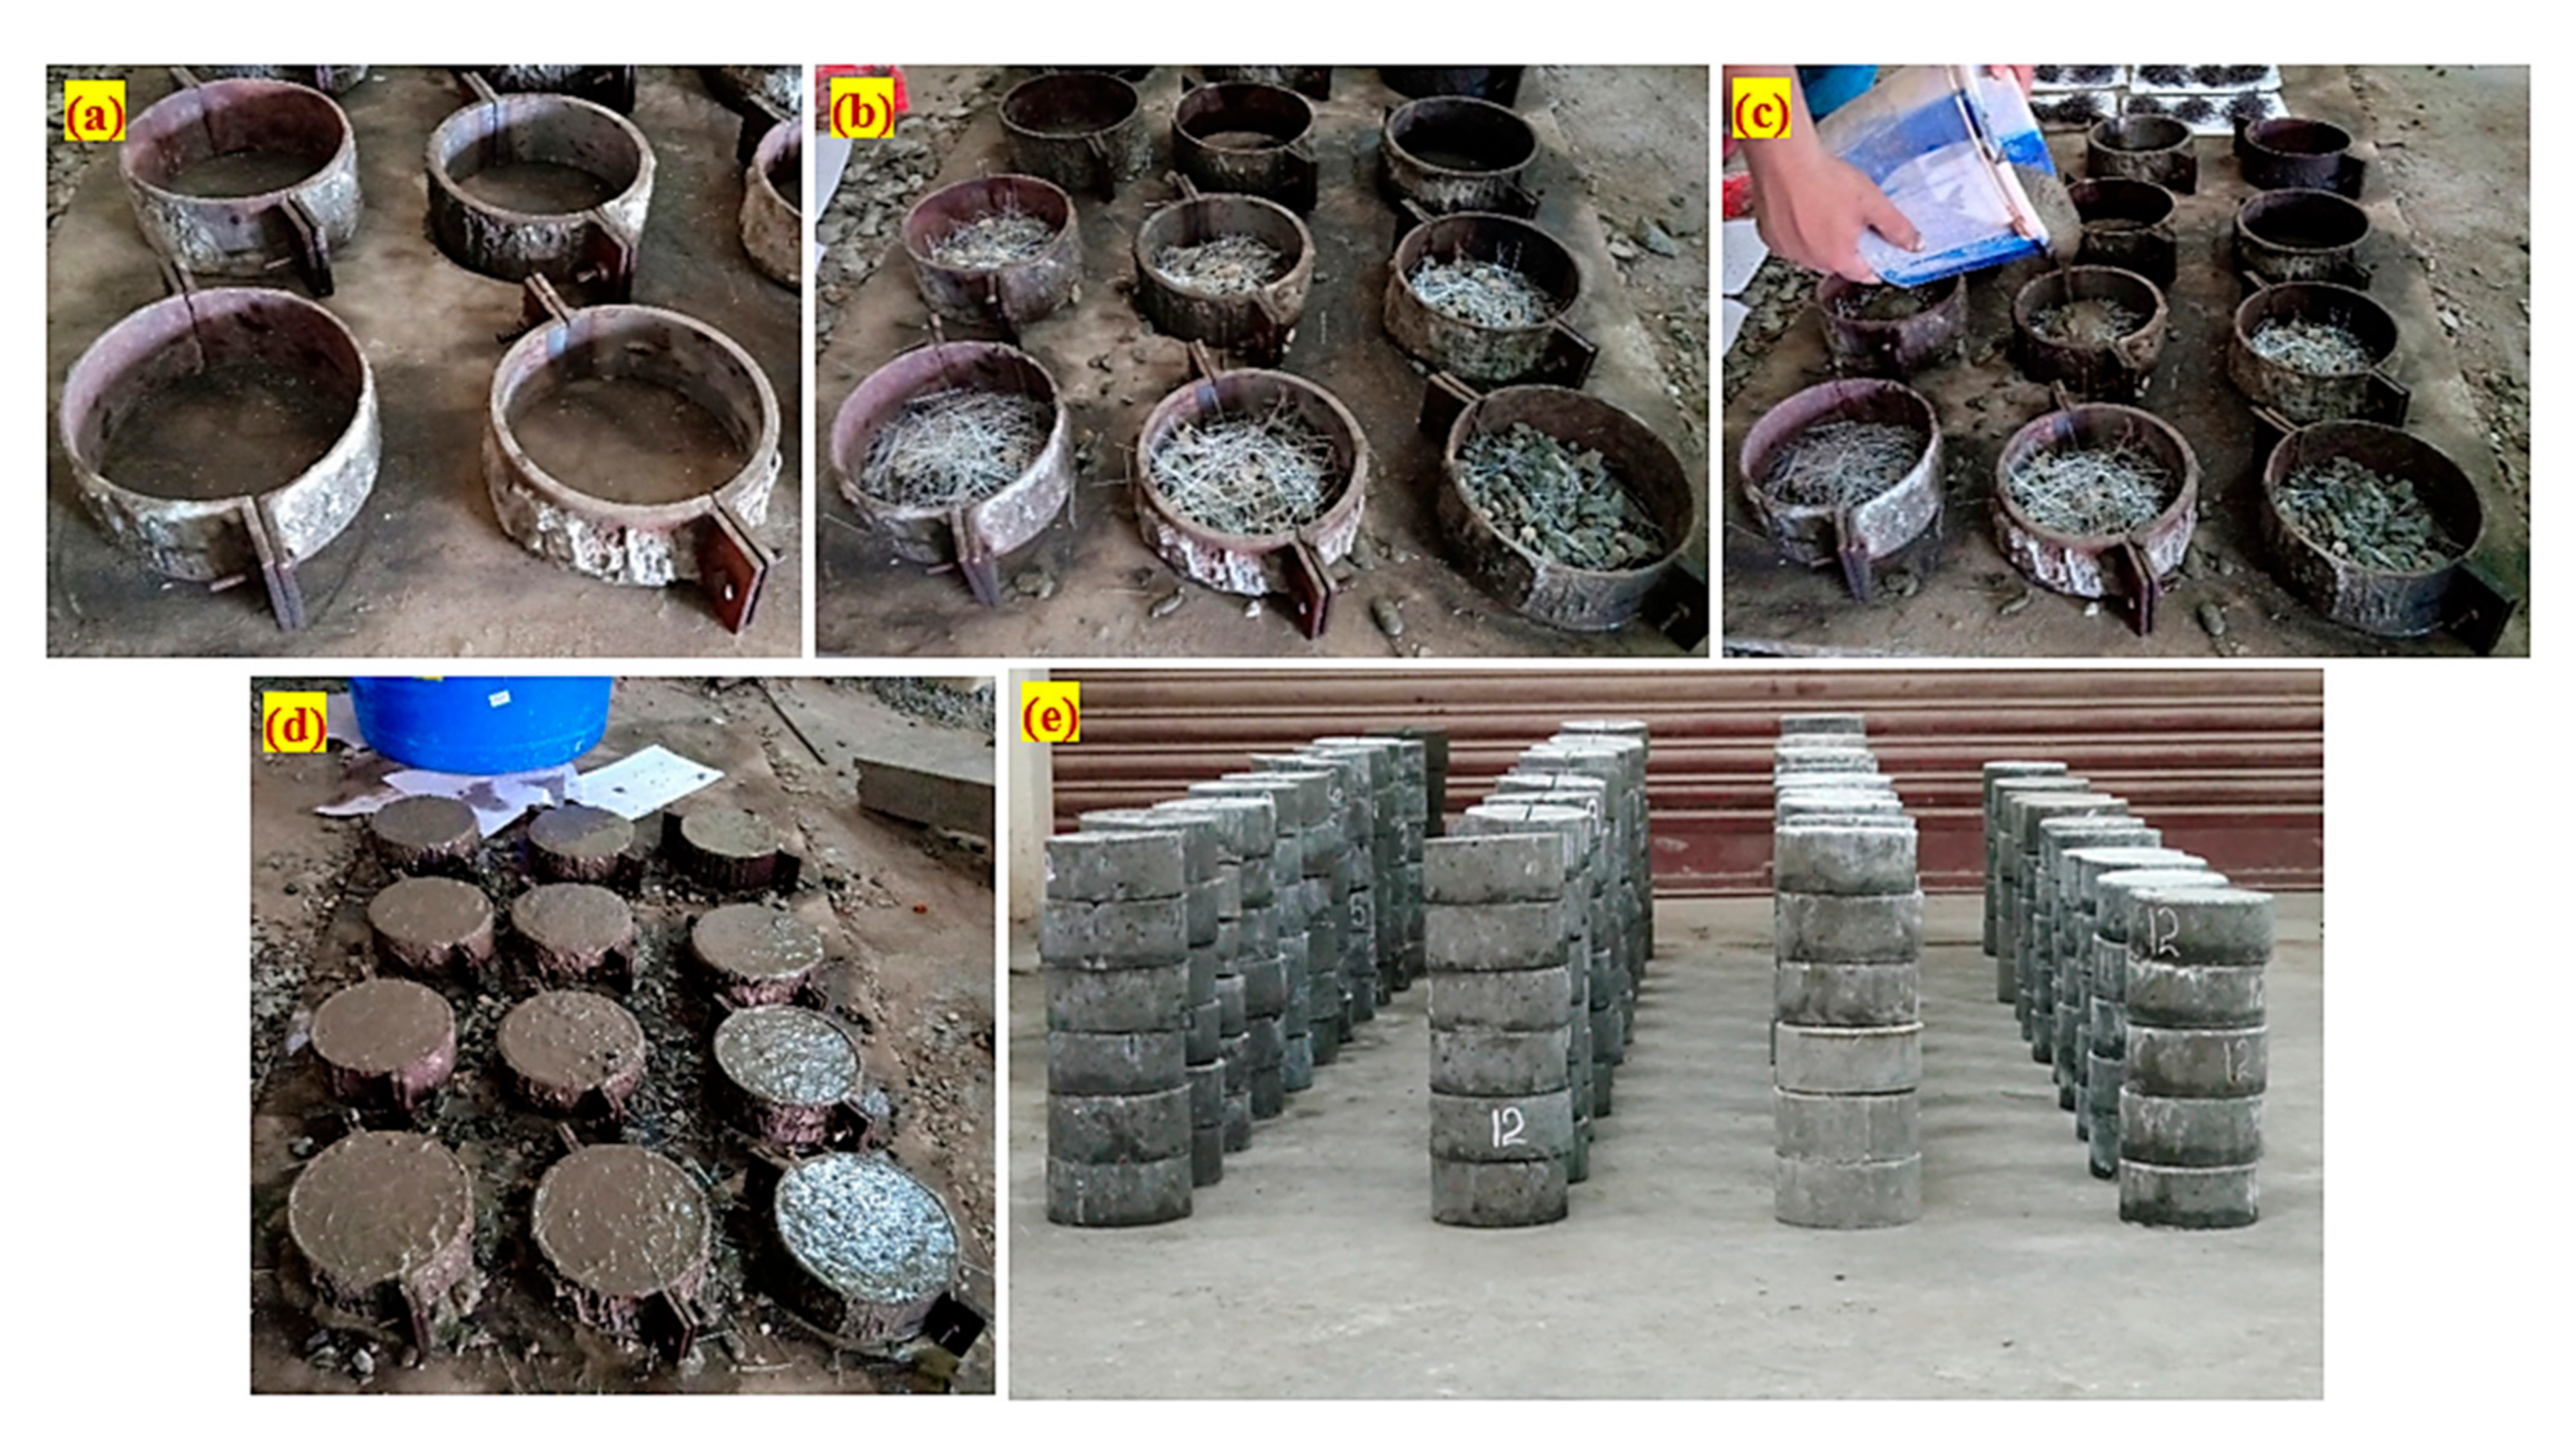
3.3. Specimen Preparation

One hundred eighty cylindrical specimens were prepared with a count of 15 per mixture. Impact strength was assessed using 152 mm diameter and 64 mm high cylindrical specimens. The stage-by-stage method of FPAFC casting comprises three key processes, as shown in Figure 7. First, the oil was applied to all internal surfaces of an empty cylindrical mold after it was placed on a level surface, as shown in Figure 7a. Second, a natural skeleton was created by first combining aggregates and fibers, and then packing them into an empty mold, as shown in Figure 7b. A cement grout was applied to the skeleton’s surface and allowed to fill the spaces while gravity took its course. Figure 7c shows the grout filled in all the spaces after a compaction was applied using a 6 mm diameter tamping steel rod. This compaction eradicates honeycombing. Figure 7d depicts the appearance of specimens after they were grouted. Figure 7e shows the looks of all of the specimens after they were demolded for 24 h. The three layers of FPAFC were produced one by one. The coarse aggregate and fibers were filled up to the level of first layer (61 mm height), followed by grout injection. The second (22 mm height) and third layers (61 mm height) were cast immediately (within 10 min) after the completion of the first layer. The same casting technic was adopted to complete the second and third layers. The specimens that were retrieved from the mold were allowed a 28-day curing process in water immersion before being tested.

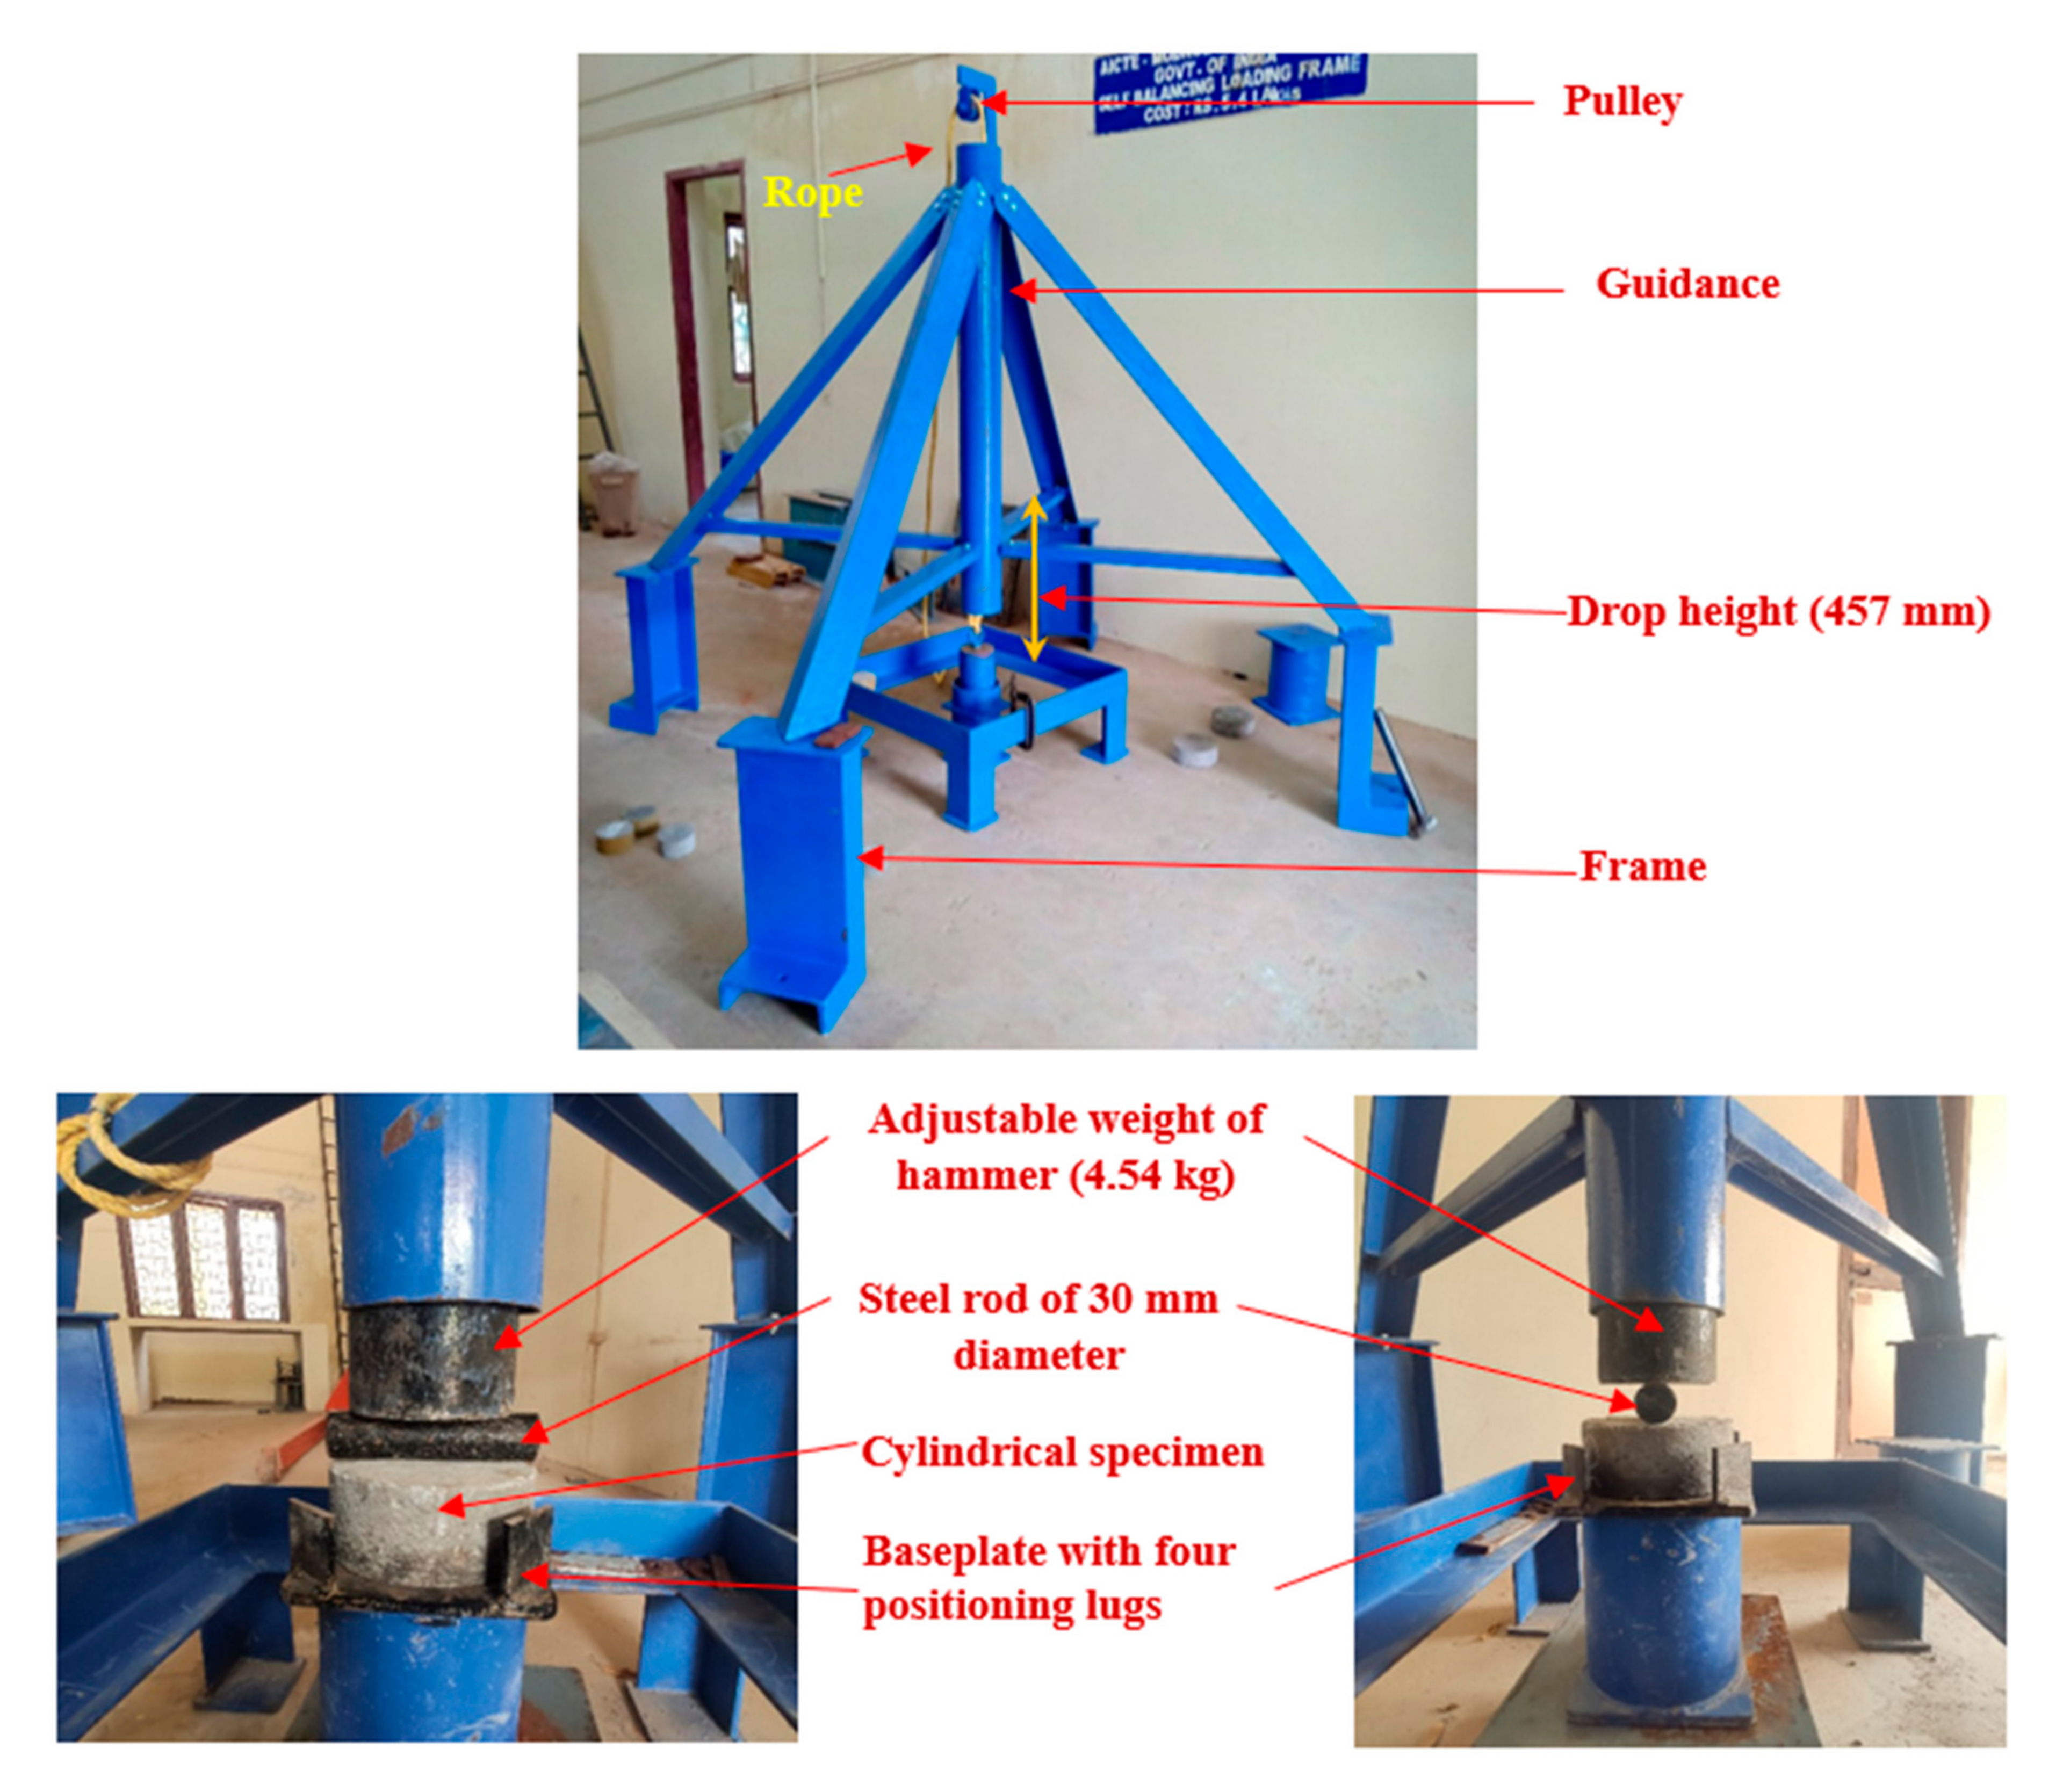
3.4. Drop Mass Impact Testing Device

The FPAFC specimens underwent a modified impact test to determine their impact strength in accordance with ACI Committee 544-2R [23]. The simplified drop-weight impact test had a simple testing technique and method since it did not need measuring vibration, time history, and displacement. It was necessary to raise and drop a 4.45 kg steel hammer free-fallen from a height of 457 mm on the top surface of a horizontal steel bar placed on top of the specimen in order to perform the test. Figure 8 shows the modified drop-weight impact testing device employed in this study. The impact numbers that cause a specimen’s first visible cracking (Q1) and failure (Q2) were noted and inspected visually. The crack defined the failure when it reached the specimen at the bottom and split it into two pieces. The alteration recommended here establishes the line of impact using a 30 mm diameter steel bar positioned horizontally on the specimen, as illustrated in Figure 3. The steel hammer is free-fallen upon the steel bar, and the impact load is distributed to a larger area instead of to a single location. This alteration permits fractures to form parallel to the path of impact and separates the specimens into two parts coupled with several cracks in a radial orientation. This alteration predefined the fracture route and specimen failure, resulting in a reduction in result scattering.

3.5. Compressive Strength Test

Three cubical specimens were cast from each type of mixture and evaluated for compressive strength. All specimens were tested using a 300 T compressive testing machine, and the average results were used for the discussions.

4. Results and Discussions

4.1. Compressive Strength

Figure 9a depicts the single-layer preplaced aggregate fibrous concrete’s compressive strength after adding SF and PF. Compared with the PAC specimen, the S-SF specimen showed a 59.56% increase in compressive strength. This improvement was due to the presence of SF that provided effective bridging action in the cracking zone, leading to postponing crack initiation and further growth [36]. The S-PF specimen showed only an 18.6% increase in compressive strength over PAC. PF exhibited compressive strength that was lower than that of SF. This trend was due to the lower tensile strength and PF density than that of SF [20]. Figure 9b shows that the compressive strengths of the D-SF-PF and D-PF-SF double-layered specimens were 26.1% and 23.0% higher than those of PAC. Adding SF to both single- and double-layered concrete significantly increased compressive strength, according to the findings. Additionally, the performance of single-layered concrete was superior to that of double-layered concrete. This can be explained by the uniform distribution of fibers with three-dimensional orientation in the concrete, enhancing its load-carrying capacity under compression. On the other hand, double-layered concrete had fiber with planar alignment, resulting in lower compressive strength compared with single-layered concrete.
Comparing three-layered FPAFC with PAC, the compressive strength increased from 5.2% to 54.4% when various fiber doses were used in each layer. Figure 9c shows that the T-FG6 combination had the lowest compressive strength when compared with PAC, with a 5.2% improvement. This was due to the 3.6% of PF with low tensile strength provided at the top and bottom layers, while the middle layer was of nonfibrous concrete. T-FG2 specimens with 2.8% SF in the top and bottom layers and 1.6% in the intermediate layer, in contrast to PAC, had compressive strength improvements of around 54.4%. The reason for this improvement is the higher dosage of SF provided at top and bottom layers, which can effectively bridge the cracks. The compressive strength of all other three-layered FPAFC specimens increased, as predicted. Significant improvements in compressive strength were the result of a higher dosage of mono and hybrid fibers added to the different schemes. Adding fibers to concrete provided exceptional ability of bridging. The path of the crack was tortuous, needing a huge amount of energy to pull out the action of fibers [20]. Due to workability concerns, consistent fiber distribution and fiber conglobation create more voids in the concrete and cause internal defects, which reduces the compressive strength. Fiber dosage was thus limited to 2% in classic fibrous concrete. Conversely, the FPAFC casting method eradicated these issues as the coarse aggregate and fibers were premixed and preplaced into the mold before grouting [18]. In summary, the influence of SF in improving compressive strength was significantly greater than in PF for various layers of concrete.

4.2. Modified Falling Mass Test Results

As detailed in Table 3 and Figure 6, three specimen categories were prepared for the modified impact test: single-, double-, and triple-layer specimens. The average volumetric fiber content of all mixtures was the same, which was 2.4%, while the distribution and type of fiber in different layers was the distinguishing factor among the different specimen groups. The following sections discuss the obtained experimental results in terms of cracking and failure impact numbers, impact ductility index (ratio of failure impact number to cracking impact number), and failure mode.

4.2.1. Cracking and Failure Impact Number

Figure 10a compares the cracking impact number (Q1) of the single-layered specimens incorporating steel (S-SF) and polypropylene (S-PF) with the reference normal concrete specimens (PAC), while Figure 11a is a comparison of the failure impact numbers (Q2). As shown in the figures, both SF and PF increased impact resistance dramatically compared with PAC. However, the influence of SF was obviously higher than that of PF at both the cracking and failure stages. As shown in Figure 10a, the cracking impact resistance of S-SF increased from 15 to 95 impacts, recording a 533% increase compared with PAC, while that of S-PF achieved a percentage increase of 280% with a recorded Q1 of 57. On the other hand, Figure 11a shows that a distinguishable jump was recorded in Q2 for the SF-reinforced specimens with a percentage increase of 1980%, while the percentage increase in the failure stage of the PF-reinforced specimens was 440%. To improve the matrix’s strength, fibers were used to provide high-stress absorption across cracks by bridging them. After the first impact drop, a facture of the matrix started on a microscopic scale with the creation of micro cracks [18]. These fine interior cracks were linked and became wider with increased impacts. The progress of cracking, widening, and propagation in the matrix of the PAC specimens did not take too long until the appearance of the first surface continuous crack after 15 impacts, while full fracture failure occurred after 25 impacts. The presence of short, discrete, and well-distributed fiber-reinforcing elements crosses the created cracks and shared significant amounts of tensile stresses that try to open the cracks due to the fiber’s high tensile strength, which slows the opening of initiated cracks, resulting in higher impact energy absorptivity [18].
When comparing the activities of fibers at the cracking and failure stages, it was obvious that fibers increased Q2 by a much higher percentage than Q1. This was due to the initiation and sequence of fiber-reinforcing activity, where the main job of fibers as crack-reinforcing elements starts after crack evolution from a micro- to macroscale, which actively transferred tensile stresses from the matrix to the fibers until failure caused by loss of bond or fiber breaking [37,38]. The differences in shape and tensile strength between SF and PF adopted in this study explain the improved performance of SF to enhance cracking and failure impact resistances. As shown in Figure 4, the hooked-end crimped shape of SF ensures a perfect bond between the matrix and fibers and was an anchor at the opposite ends of the cracks. On the other hand, the tensile strength of SF (1150 MPa) was 2.3 times that of PF, which allowed SF to withstand a higher concentrated stress level before breaking.
The effects of fiber type and distribution on the impact performance of the double-layered specimens are depicted in Figure 10b and Figure 11b, which reveal that both double-layer mixtures exhibited noticeably higher impact performance at the cracking and failure stages compared with PAC. Regarding the single-layer group, improvement at the failure stage was much higher than that at the cracking stage for both mixtures. The two double-layer mixtures exhibited comparable Q1 and Q2 records; however, the specimens with the top layer reinforced with SF (D-SF-PF) exhibited slightly higher impact records compared with that of the PF-reinforced top layer (D-PF-SF), where the percentage increases in Q1 for the mixtures D-SF-PF and D-PF-SF were 480% and 473%, respectively, while those of Q2 were 1100% and 1505%, respectively. This behavior was due to the higher tensile strength and better bond performance of SF compared with PF, where the top layer absorbed higher concentrated impact energy than the bottom layer due it its location with respect to the applied drop load, which in turn determined the total impact capacity of the specimen [18].
The third group of specimens included three subgroups that differ in the distribution of fiber content in each of the three layers. T-FG1 represents the first subgroup, which was also the reference for the two other subgroups, where all three layers incorporate the same fiber content of 2.4%, which is a mix of 1.2% SF and 1.2% PF. Fiber content was increased gradually in the following two subgroups in the top and bottom layers and decreased in the middle layer, as detailed in Figure 6 and Table 2, keeping the same average fiber content of 2.4%. Two points can be discussed in this group: the first is the type of fiber, and the second the fiber content in different layers. As shown in Figure 10c and Figure 11c, all fibrous T-FG specimens retained distinguishably higher Q1 and Q2 records compared with the reference specimens’ PAC, which was anticipated due to the matrix reinforcing action of the fibers.
Comparing the mixtures of the second subgroup (T-FG2, T-FG3, and T-FG4) with 2.8% fiber in the top and bottom layers and 1.6% in the middle layer, it was obvious that the specimens with pure SF (T-FG2) retained higher Q1 and Q2 records than that of pure PF (T-FG3). The percentage improvements in Q1 of T-FG2 and T-FG3 over PAC were 540% and 647%, respectively, while those of Q2 were 1748% and 864%, respectively. A similar result was also recorded for the corresponding specimens in the third subgroup (T-FG5 and T-FG6), where the top and bottom layers incorporated 3.6% fiber, while the middle layer was plain. Q1 of T-FG5 (with pure SF) and T-FG6 (with pure PF) exhibited percentage improvements of 633% and 460%, respectively, and Q2 exhibited percentage improvements of 2732% and 1008%, respectively. This result agrees with the results obtained for the single- and double-layer groups, which were caused by improved bond strength of SF due to its crimped and hooked-end configuration in addition to its significantly higher tensile strength compared with PF [20]. On the other hand, when the full SF specimens were compared with the hybrid fiber specimens, the results differed between the second and third subgroups. The hybrid specimens’ T-FG4 retained higher Q1 and Q2 records for the second subgroup with 2.8% fiber at the top and bottom layers, while the opposite was recorded for the third subgroup (with 3.6% fiber content at the top and bottom layers), while the full SF specimens (T-FG5) retained higher impact records than the hybrid fiber specimens (T-FG7). For instance, the Q1 and Q2 percentage improvements of T-FG2 and T-FG4 were 540% and 607%, respectively, and 1748 and 2192%, respectively. On the other hand, the percentage improvements in Q1 and Q2 for T-FG5 and T-FG7 were 633% and 544%, respectively, and 2732 and 1284%, respectively. The reason for this improvement was higher dosage of SF and hybrid combination of fiber provided at the top and bottom layers, which can offer more resistance at the point of impact. The initial cracks are delayed at the top surface due to the presence of more amount of steel fibers and restrict the crack propagation to the bottom layers [20].
Comparing the specimens with the same fiber type from the second and third subgroups, it could be said that in most cases, increasing the fiber content in the top and bottom layers and decreasing it in the middle layer improved the impact performance of the tested specimens. Hence, comparing the pure SF specimens T-FG2 and T-FG5, it is clear that incorporating 3.6% fibers in the top and bottom layers and reducing it to zero in the middle layer increased both Q1 and Q2. The percentage increases in Q1 and Q2 of T-FG5 over T-FG2 that incorporated pure SF were 14.6% and 53.2%, respectively, while the corresponding percentage improvements in Q1 and Q2 of T-FG6 over T-FG3 (pure PF) were 2.4% and 14.9%, respectively. An explanation of this result is that the top and bottom layers undergo a higher concentration of impact stresses owing to their location in direct contact with the applied falling mass and the supporting baseplate. Hence, strengthening these contact layers would positively affect the total impact performance of the test specimens. For the hybrid specimens (T-FG1, T-FG4, and T-FG7), as shown in Figure 10c and Figure 11c, both T-FG4 (with 2.8% fiber in the top and bottom layers) and T-FG7 (with 3.6% fiber in the top and bottom layers) retained higher Q1 and Q2 records than T-FG1 with 2.4% fiber in all layers, which thus agrees with the results of the pure SF and pure PF fibers. However, T-FG7 exhibited 9.4% decrease in Q1 and 39.6% decrease in Q2 compared with T-FG4, which was caused by the previously stated explanation of the possibility of exceeding the optimum content of SF and PF hybridization.

4.2.2. Ductility of Specimens

Flexural ductility is measured for reinforced concrete beams under three- or four-point loading by dividing the deflection at failure with that at the yield of steel reinforcement, which is then used to evaluate the beam’s capacity to withstand plastic deformations. A similar definition was used in this article to evaluate the ability of the introduced mixtures to withstand repeated impacts after surface cracking. In previous studies [15,19], the impact ductility index (IDI) was defined as the ratio of failure impact number to cracking impact number, which was also used in this research, where IDI equals the ratio of Q2 to Q1 for each mixture. This index introduces another comparison tool between fibrous mixtures, which ensured better evaluation of impact performance for different fibrous mixtures [17]. The calculated IDI records of the three groups of specimens are shown in Figure 12.
Figure 12a shows that the IDI of fibrous specimens was generally higher than that of the reference specimen. The IDI values of PAC, S-SF, and S-PF were 1.67, 5.47, and 2.37, which meant that the incorporation of PF led to an improvement of approximately 42% IDI, while using SF improved ductility by approximately 228%. This result reflects the positive influence of fibers not only in increasing Q1 and Q2, but also in their ability to extend the failure to a higher number of impacts after surface cracking. The higher IDI of S-SF specimens was attributed to the better crack arresting performance of SF after cracking compared with PF owing to its better configuration and higher tensile strength. Regarding their QI and Q2, records (Figure 10b, Figure 11b, and Figure 12b) show that both double-layer mixtures exhibited approximately the same ductility, where the IDI of D-SF-PF (with SF top layer) was 3.45 with a percentage improvement over PAC of approximately 107%, which was slightly higher than that of D-PF-SF (with PF top layer), which recorded an IDI of 3.36 around 102% improvement. The approximately equal IDI values were attributed to the incorporation of the same contents of the same fiber types, while the slightly higher IDI of D-SF-PF was due to the front location (with respect to applied loads) of the better performance fiber (SF).
Comparison between IDIs of the triple-layer mixtures is depicted in Figure 12c, where it is obvious that the ductility of all triple-layer mixtures (T-FG1-T-FG7) was apparently higher than that of the reference mixture PAC. The IDI values of T-FG1, T-FG2, T-FG3, T-FG4, T-FG5, T-FG6, and T-FG7 were 3.58, 4.81, 2.94, 5.41, 6.44, 3.30, and 3.60, respectively, while the IDI of PAC was 1.67. This meant that the percentage increase in the IDI of the T-FG specimens compared with PAC was in the range of approximately 76% to 286%, which reflected the positive influence of fibers on the postcracking impact performance of the specimens. Evaluating the effect of fiber type and fiber distribution by comparing the three subgroups of the triple-layer group, the same conclusions are drawn for the Q1 and Q2 records. The first conclusion is that the PF specimens exhibited the lowest IDI for both the 2.8% and 3.6% top and bottom layers’ fiber contents, while the hybrid specimens exhibited higher IDI for the second subgroup (2.8%, 1.6%, 2.8%), while the SF specimens exhibited the highest ever IDI for the third subgroup (3.6%, 0%, 3.6%). This behavior was due to the superiority of steel fibers in terms of bond and strength compared with the adopted type of polypropylene fiber. It can also be recorded that in most cases, increasing the fiber content in the top and bottom layers and decreasing it in the middle layer led to higher ductility, which was noticed by comparing the SF specimens T-FG2 and T-FG5 in addition to the PF specimens T-FG3 and T-FG6, as shown in Figure 12c. All FPAFC specimens exhibited different IDI values due to the various dosages of fibers used at the top layer, which can experience the point of impact. The amount of fiber presence at the point of impact can show a different postcrack resistance, which indicates different IDIs.

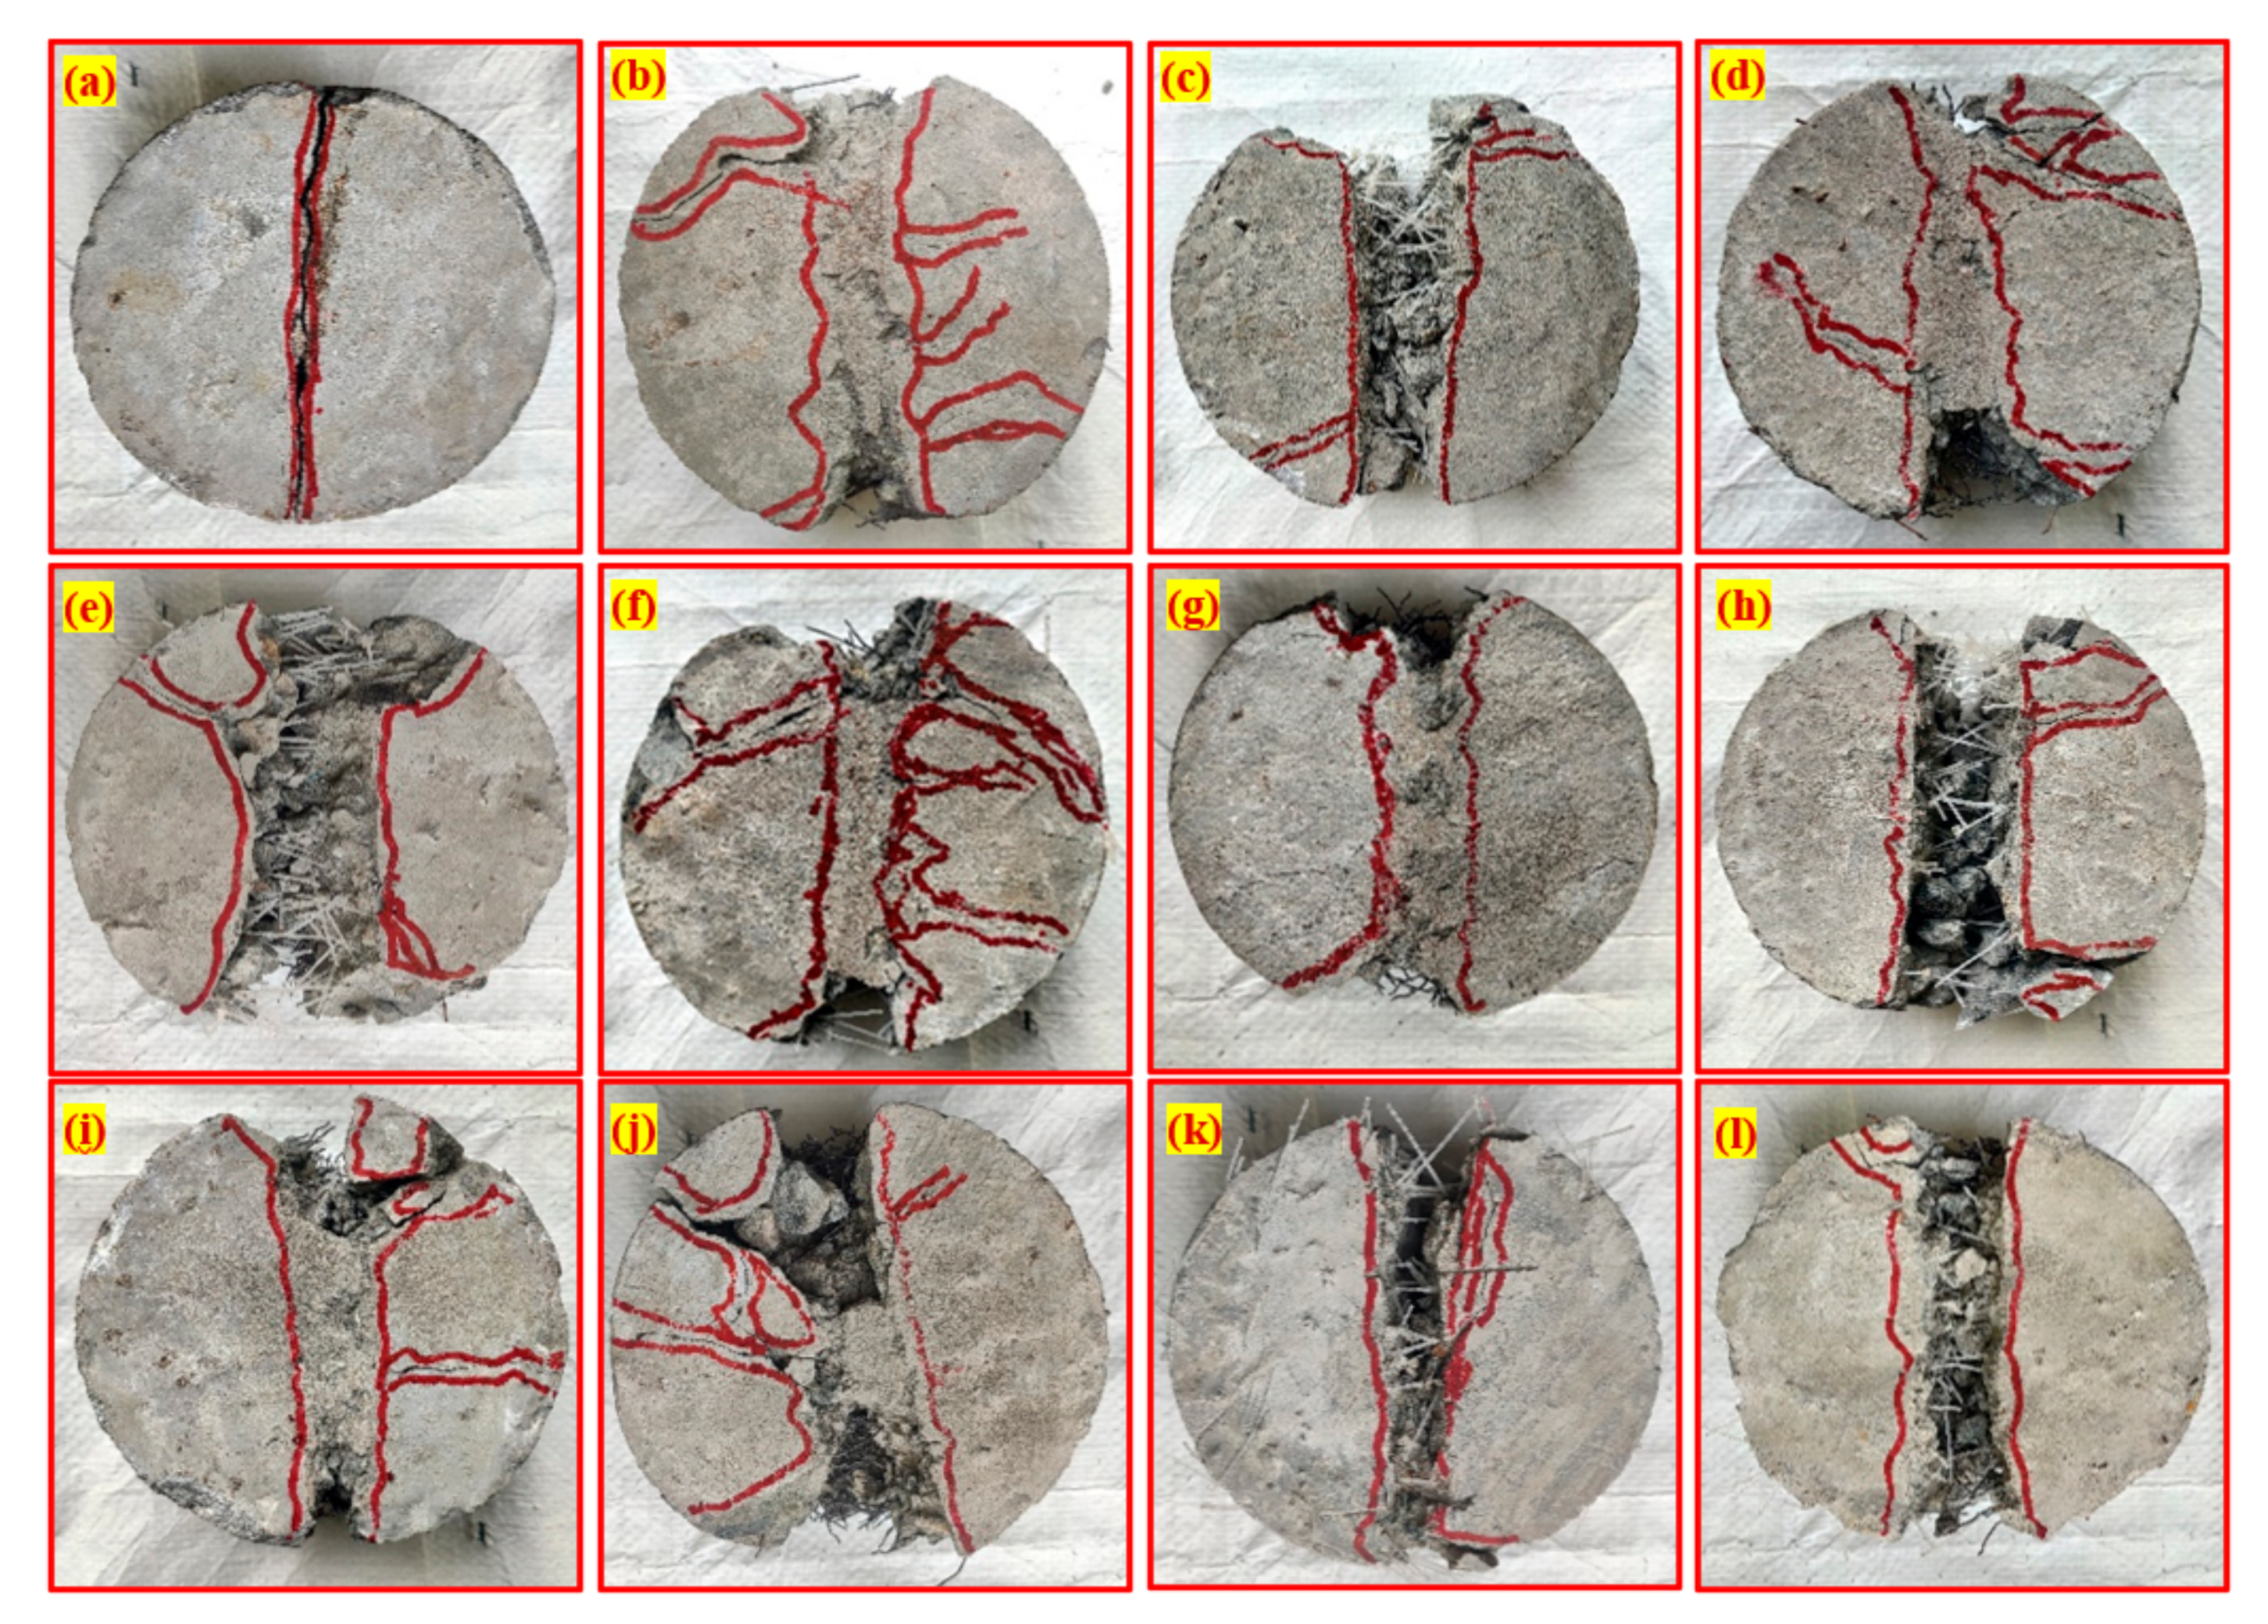
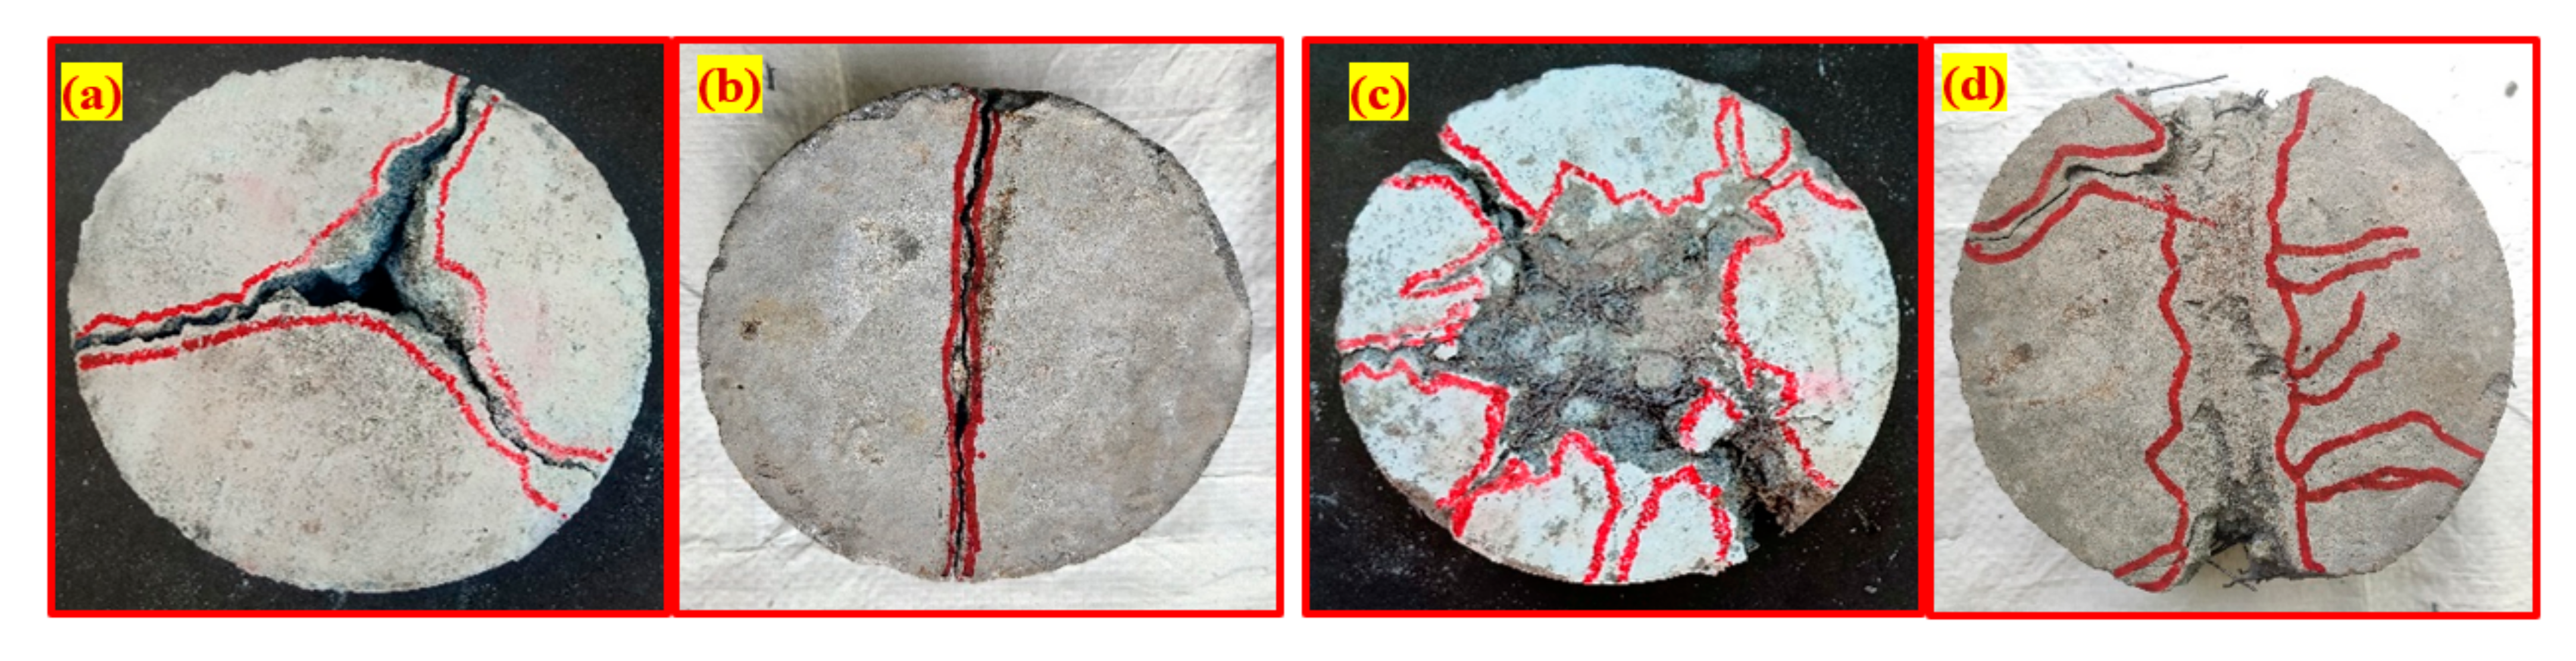
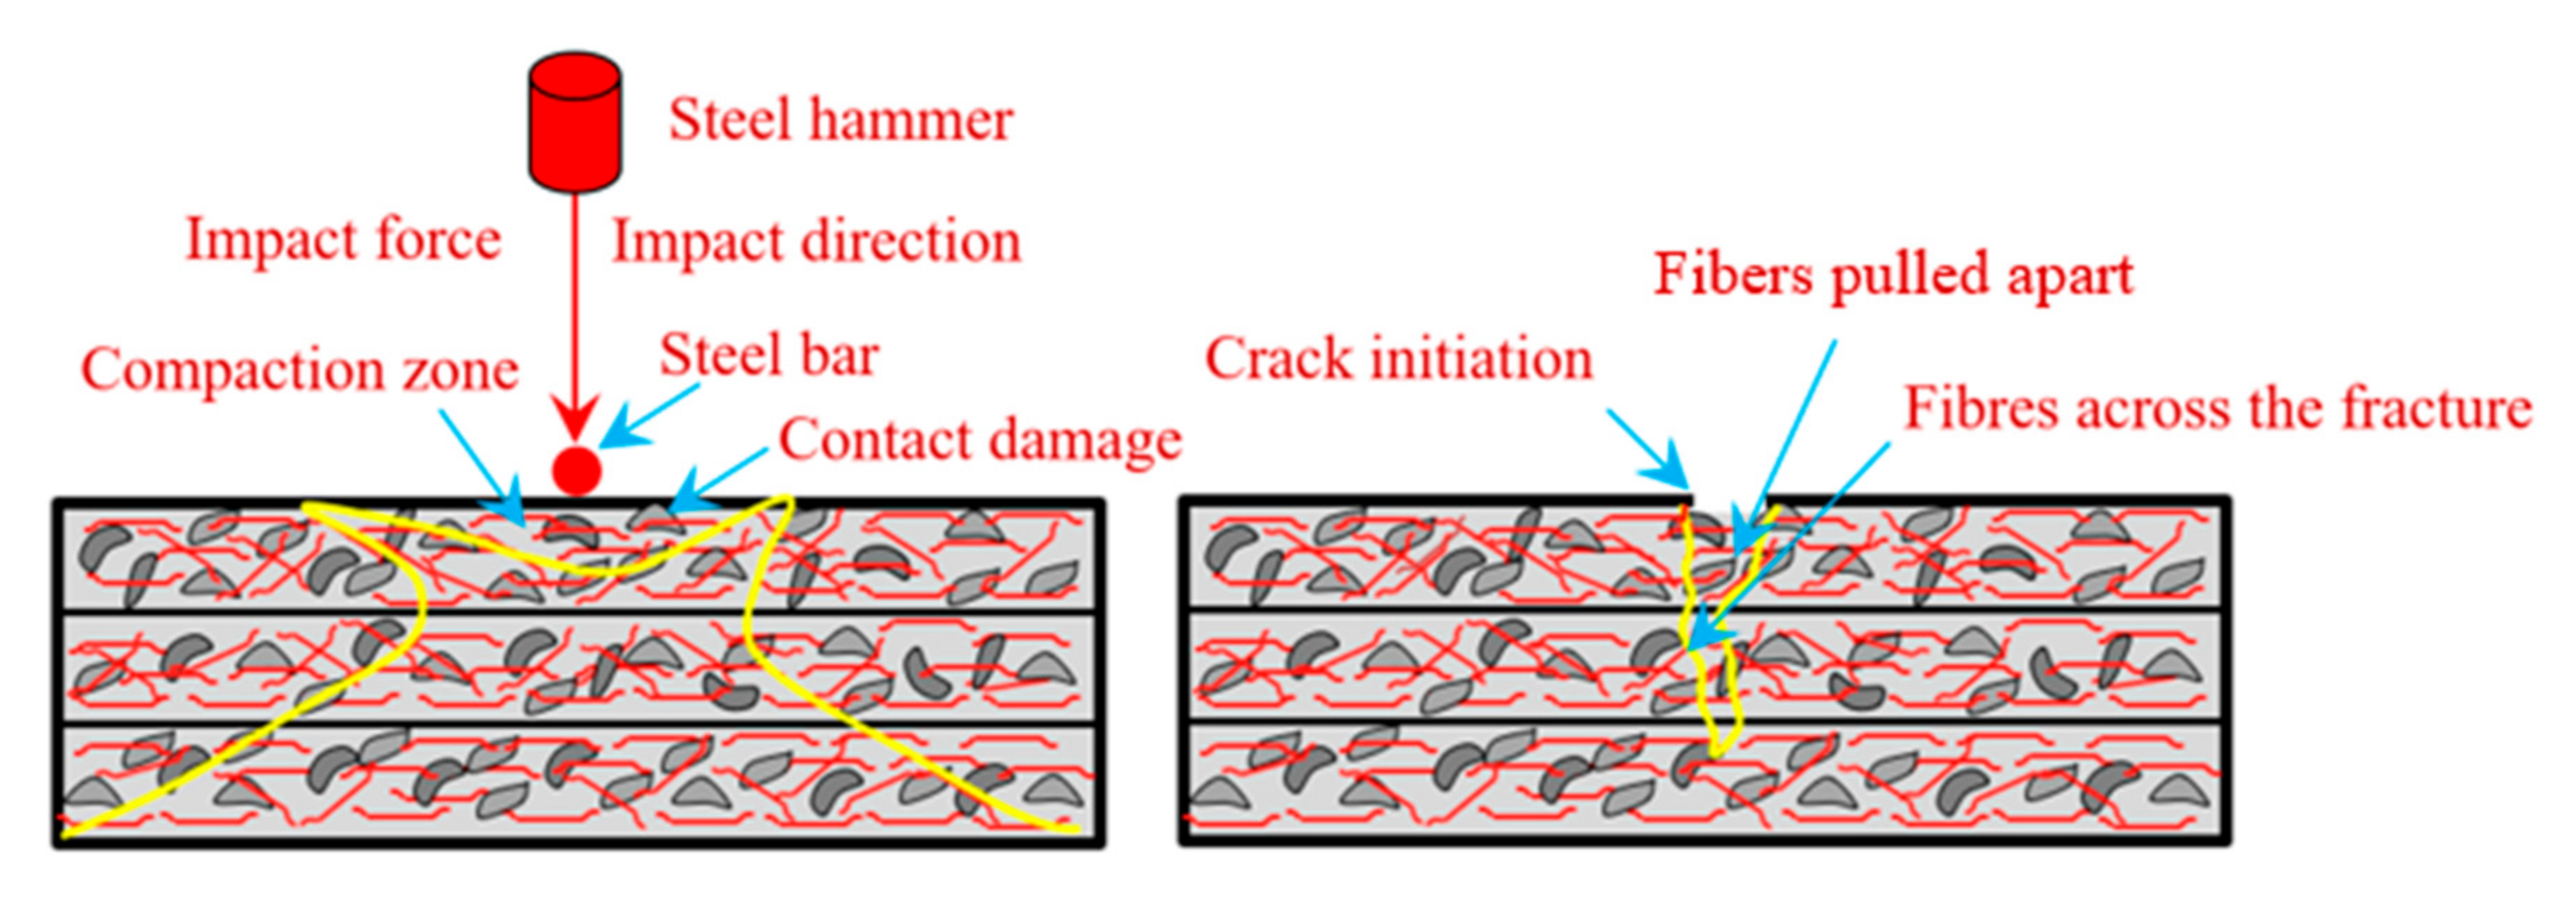
4.2.3. Failure Mode of Specimens under Impact Loading

Figure 13 shows the fracture on the top surfaces of all tested mixtures after failure. The first observation that can be recorded after the comparison between Figure 13a for the plain reference PAC specimens and Figure 13b–i for the fibrous specimens is the simple and direct line cracking of PAC along the line load–distributor rod, while a wide fracture line zone occurred in the fibrous specimens along the steel rod. Direct and uniform cracking reflects the brittle nature of the tested PAC specimens, while the wider fracture zone reflects the more ductile behavior of fibrous specimens under repeated impact. In addition, it reflects the ability of the suggested modification, which is the use of a line load distributed under the drop impact load, to control cracking and fracture of the specimens along a specified path. Cracking and fracture of the specimens along different paths was defined as a factor that increased variation in test results [15]. Hence, the aim of using this rod to reduce a variation in test results by controlling the cracking and failure path is considered satisfied for both plain and fibrous specimens.
The adequacy of the introduced modification (line rod) to control the cracking path is also obvious for the fibrous specimens, as shown in Figure 13b–i. However, this behavior is associated with some lateral cracks or end fracture zones, caused by the presence of fibers and their reinforcing action, where fibers have the ability to redirect tensile stresses on different paths by crack bridging, thereby affording stress relief for the concrete matrix. Comparing these specimens, it is obvious that specimens reinforced with PF (S-PF, T-FG3, and T-FG6) failed due to the lack of a bond between fibers and the matrix (Figure 13c,h,k). This behavior was also recorded for the double-layered specimen with the top layer being reinforced with PF, as shown in Figure 13e, while such behavior was not recorded in the SF specimens. The main reason for this behavior was the weak bond between PF and the matrix due to the straight shape and smooth surface, as shown in Figure 5. Consequently, the bond along the fiber length and the anchorage at its ends were lower than the applied tensile stresses across the bridged cracks, resulting in fiber pullout from the matrix [39].
Specimens reinforced with SF exhibited a different behavior, where the bond between fibers and the matrix did not break until the failure of the specimens at the end fracture zones on the outer perimeter of the cracking line path, as shown in Figure 13b,d,g,j for the specimens S-SF, D-SF-PF, T-FG2, and T-FG5. Failure was associated with several lateral surface cracks, which reflected the perfect bridging and stress transfer capability of steel fibers so that impact stresses created new cracking paths other than the main one. The ductile fracture of SF-reinforced specimens was attributed to the perfect bond with the surrounding matrix due to the strong bond along the fibers following the crimpled shape and the strong end anchorage of the hooked ends of the fibers. Specimens reinforced with hybrid steel and polypropylene fibers (T-FG1, T-FG4, and T-FG7) exhibited a mixed mode of failure, where, as shown in Figure 13f,i, fiber pullout failure occurred partially within the end fracture zone, and failure was associated with some lateral surface cracks, while the failure of the specimen T-FG7 was closer to that of PF-reinforced specimens.

4.2.4. Comparison of Failure Modes of the ACI 544 and Modified Test Setups

Figure 14 is a comparison between similar plain and fibrous specimens tested under the standard ACI 544 test setup (with a steel ball as a load distributer) and the suggested modified test setup using a line-load steel rod distributer. When the above-discussed failure modes of the fibrous specimens were compared with the failure modes of the corresponding specimens tested under the standard test setup [20], two major notes needed to be addressed. The first was that the central semicircular fracture zone under the load distributer steel ball (Figure 14c) was replaced by a more uniform line cracking and fracture path that ended at with a perimeter fracture zone in some cases (Figure 14d). This was a sign of the successful role of stress direction and crack path controlling the suggested line load distributer. Such control could reduce test result variability and help suggest more controlling cracking and failure criteria for the specimens using the repeated impact test. This observation was recorded for single-layer specimens (S-SF and S-PF), double-layered specimens (D-SF-PF and D-PF-SF), and triple-layered specimens (T-FG1 to T-FG7). The same result was also obtained for the PAC plain reference specimens, where cracking was multidirectional under the standard steel ball setup (Figure 14a), while it was unidirectional under the suggested steel rod distributed, as shown in Figure 14b. The second point to be noticed was that the number of radial cracks from the fracture zone toward the outer perimeter was greater using the standard steel ball test setup, while such uncontrolled cracks were fewer or even did not exist using the suggested steel rod setup. This reflected better crack directional control, enabling better understanding of the effect of the investigating parameters due to limited variation in failure patterns. Hence, it ensured a fairer and easier justification of the obtained test results.

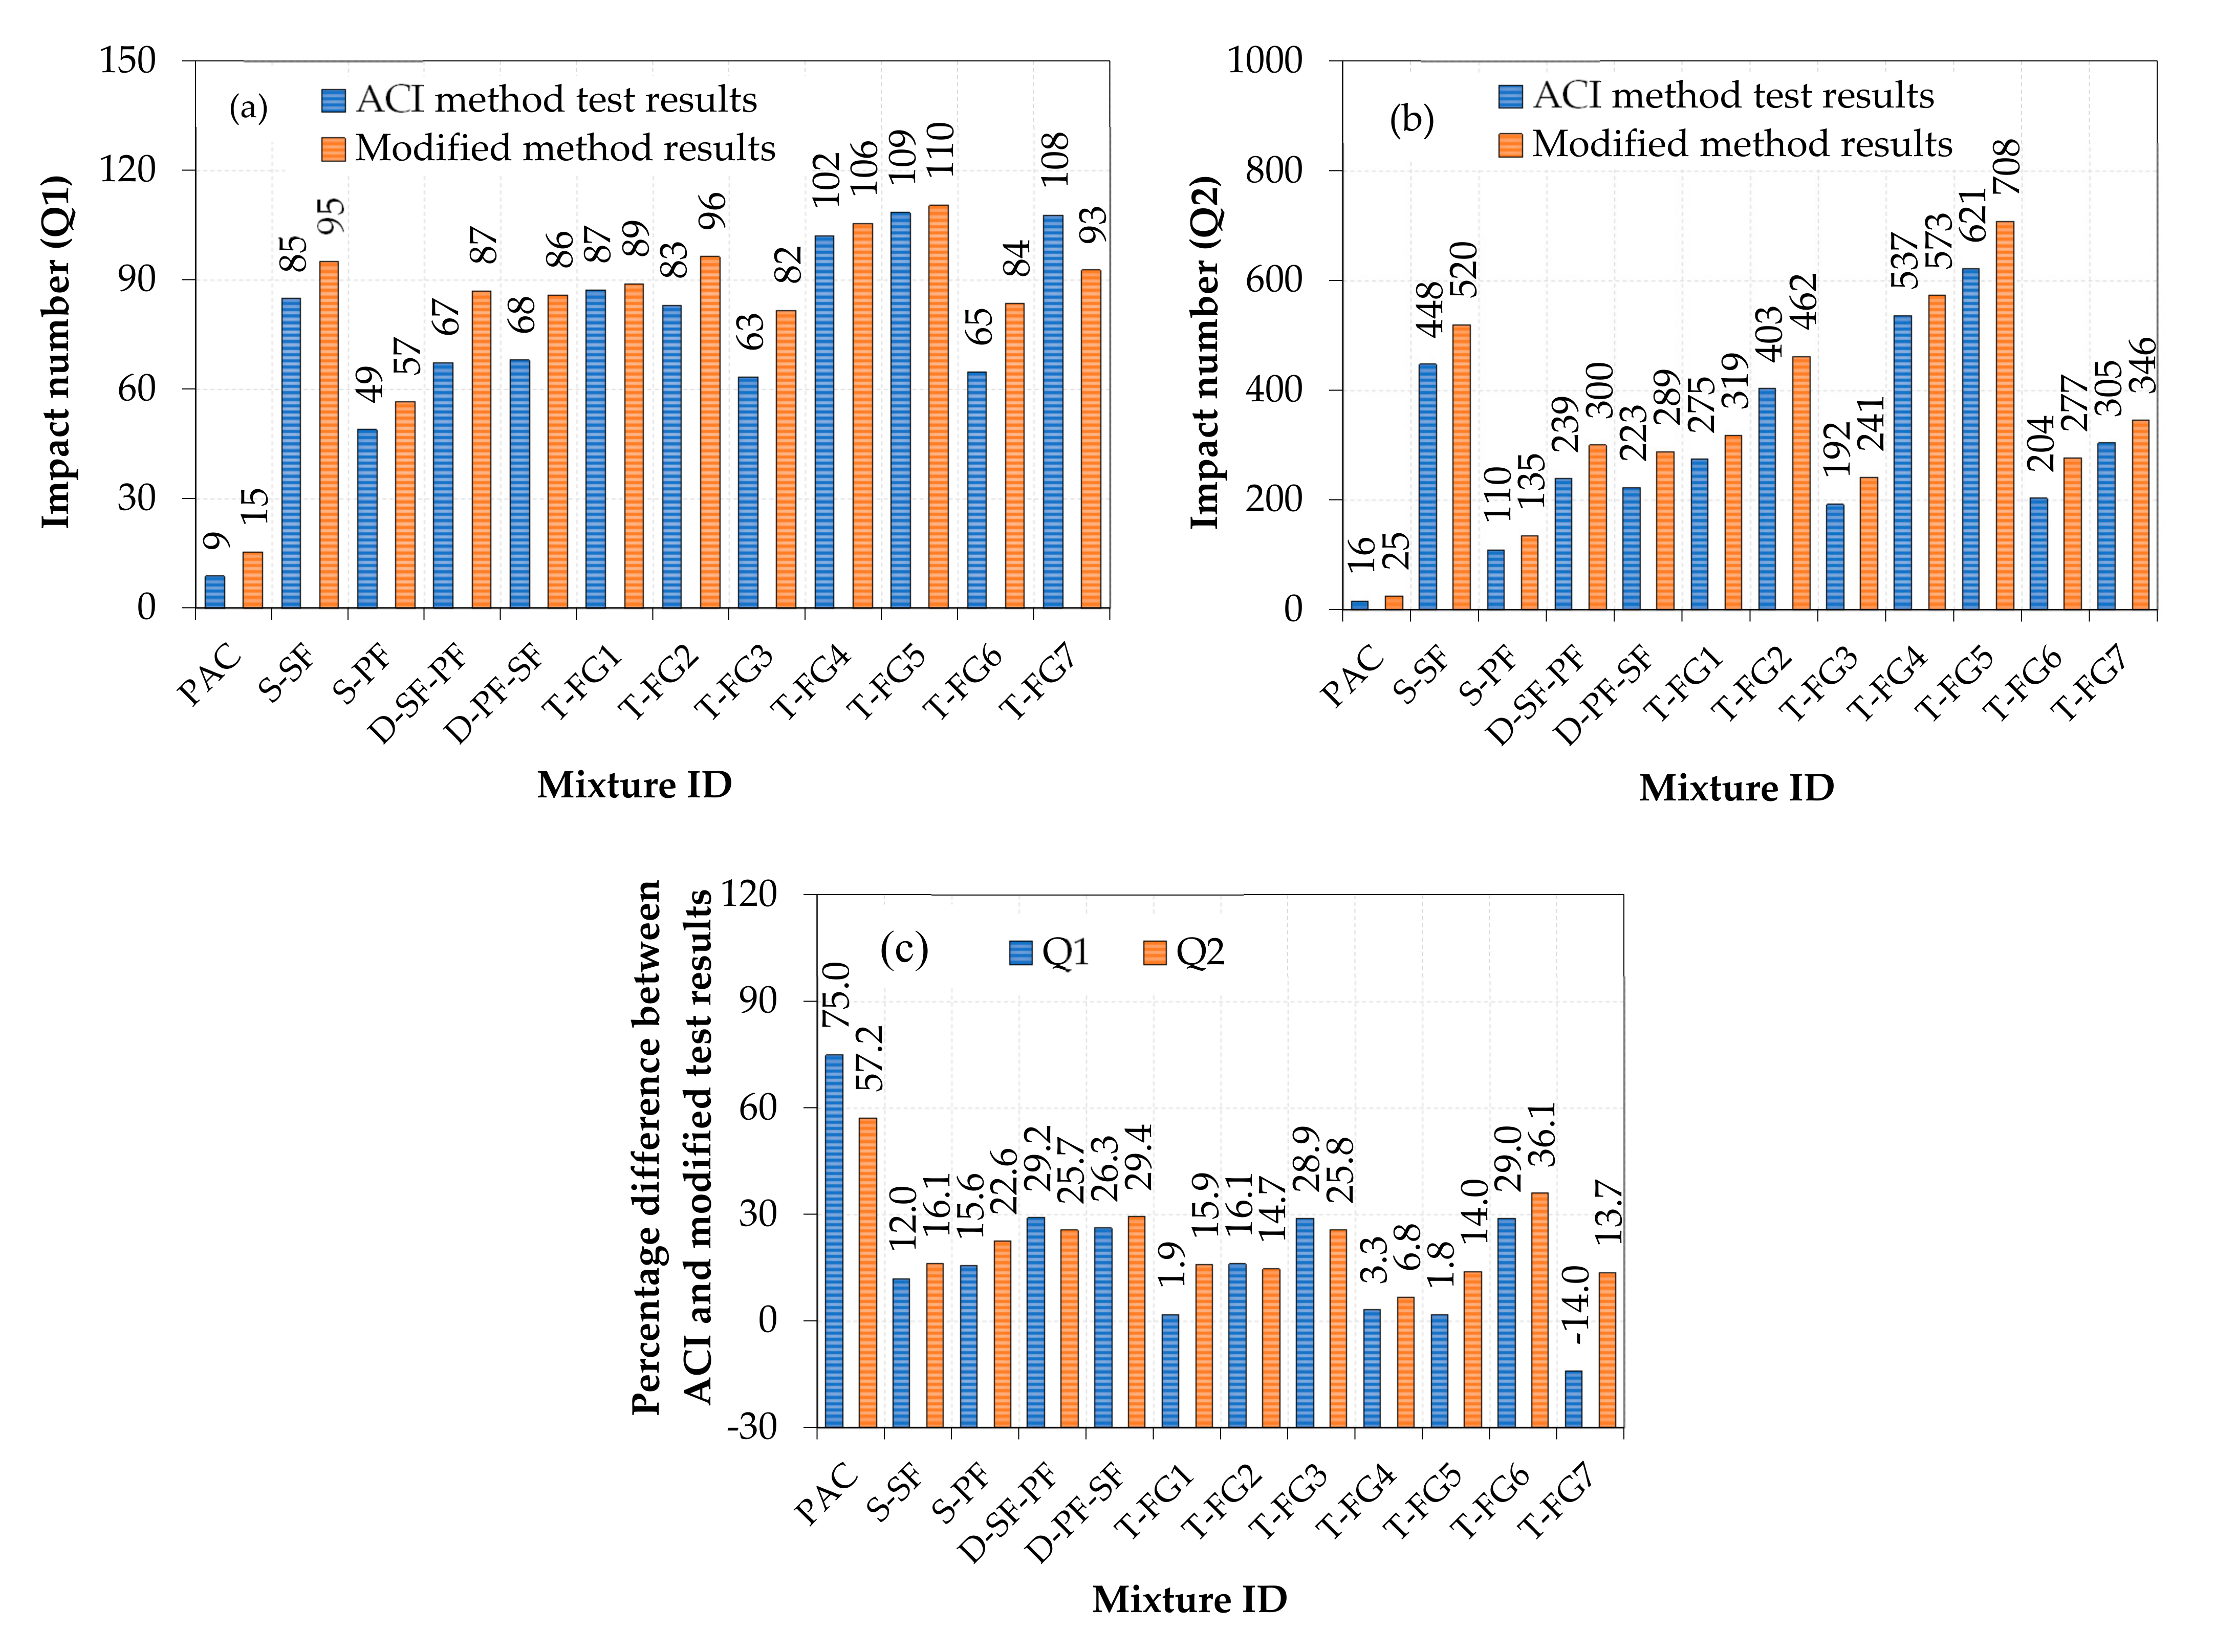
4.2.5. Modified and ACI Test Result Comparison

A comparative analysis of modified test results from the current study with the test finding obtained from the previous study with the ACI method [20] for the same mixtures with exactly the same fiber dosages and schemes is shown in Figure 15. Impact test results from the modified impact were significantly higher in Q1 and Q2 than in the ACI method, as shown in Figure 15a,b. This trend was the same for all mixtures, irrespective of the concrete layer. The percentage difference in results between these two methods ranged from −14% to 75% for Q1 and from 6.8% to 57.2% for Q2, as shown in Figure 15c. These results were attributable to specimens being exposed to a single force that had a localized influence on the specimens’ small size and so had lower Q1 and Q2 values. As a result of applying this single-point impact, the impact energy will be focused on just a small area of a small cylindrical specimen. Radial cracking occurs as a result of this process and propagates further under multiple impacts, leading to quick failure. On the other side, all FPAFC specimens from the modified impact test exhibited higher impact strength values. The phenomenon was because the impact load was dissipated over a larger area by providing the steel bar horizontally on the top specimen’s surface and repeatedly subjecting the drop-weight impact. As a result, the modified test method eradicated the single-point impact load on a soft area or hard area, or on the fibers. Hence, failure of the specimens did not happen quickly due to the application of the line impact load that was dissipated over a broad area.

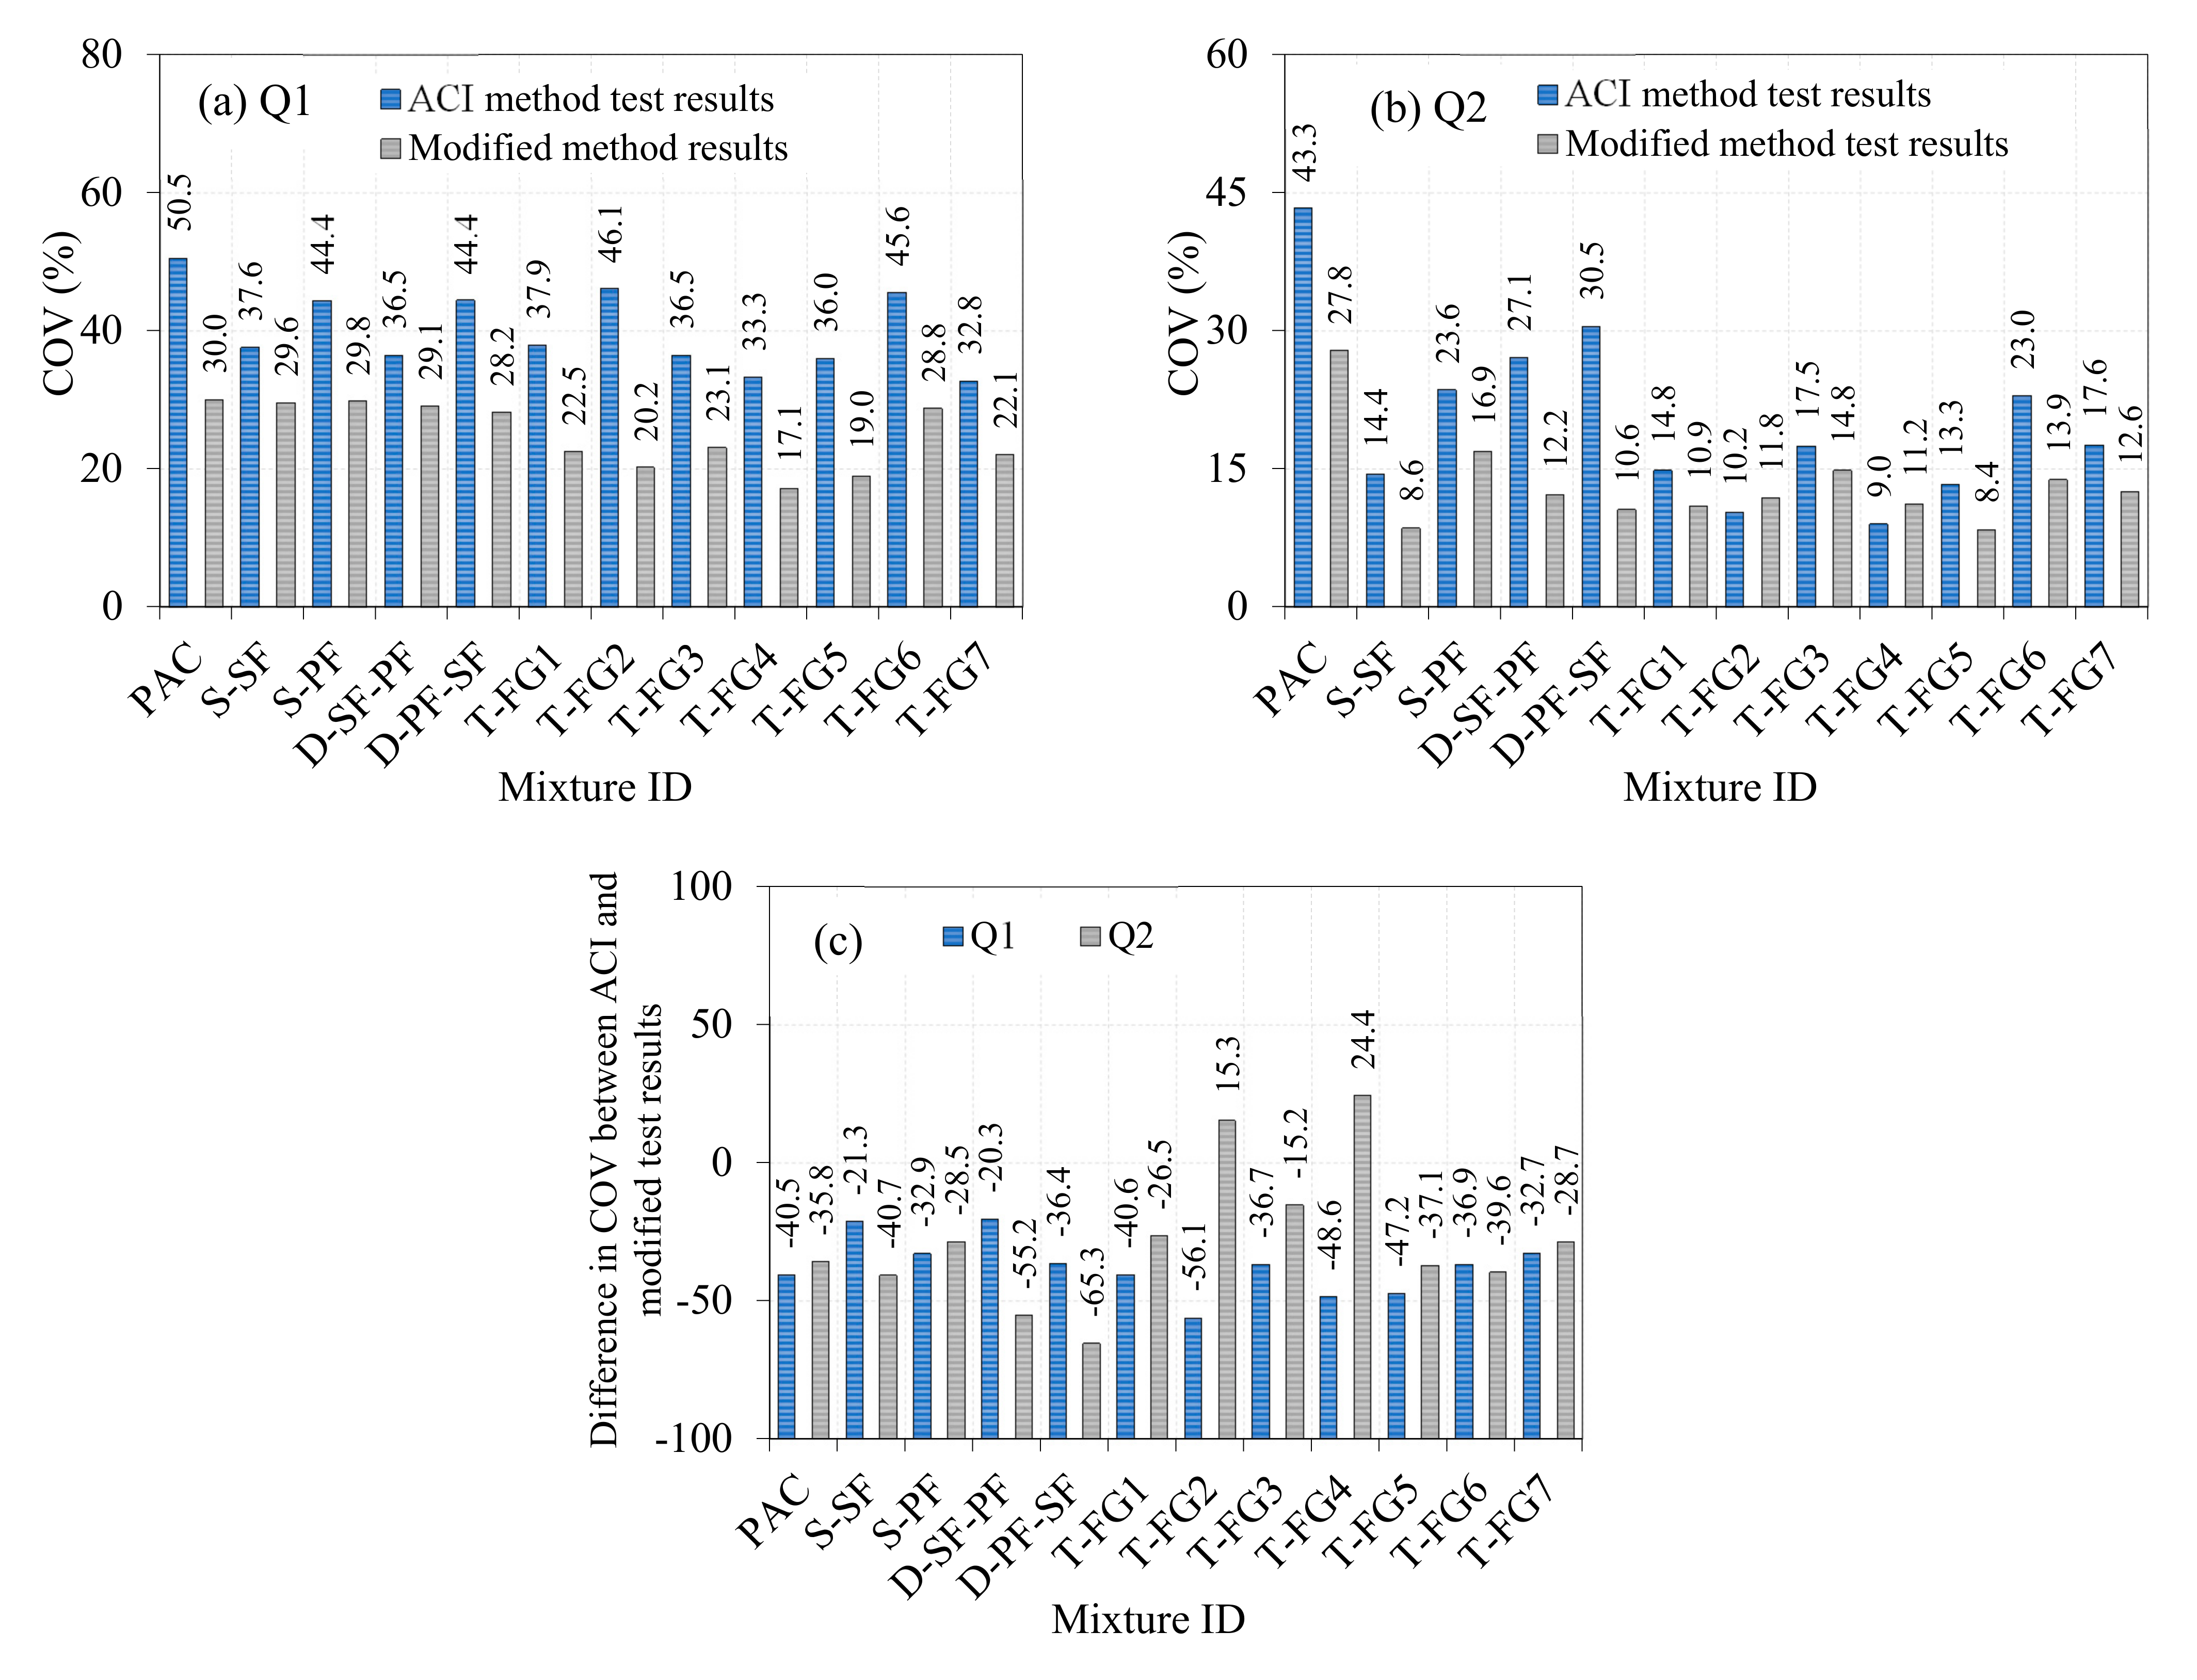
4.2.6. Comparison between ACI and Modified Approach Impact Test Findings’ Coefficients of Variance

COV analyzes statistical data that support the assessment of relative variation or measures the distribution of impact test results. Higher and lower COV values provide greater and smaller dispersion levels of the impact test results, respectively. In general, a lower COV is preferred in any and reflects a precise estimate. Figure 16 illustrates a comparison of COV obtained from modified impact test results with the ACI method impact test results from an earlier study [20]. It is noticed in Figure 16a,b that the COV for Q1 and Q2 ranged from 32.8% to 50.5% and from 9.0% to 43.3%, respectively, for the 12 mixtures. The source of higher COV values from the ACI method impact test is discussed in earlier sections (Section 1.3). Several researchers reported a higher COV from the drop-weight impact test, as demonstrated in Table 1. It is clear that the falling mass impact results on different types of fibrous concrete exhibited high scattering in test results, and this agrees with earlier studies [24,25,26]. Besides, modified impact test results exhibited a lower COV for all 12 mixtures ranging from 9.0% to 43.3% in Q1 and from 8.4% to 27.8% in the case of Q2. In Figure 16c, the COV value calculated from the modified impact test was reduced and ranged from 20.3% to 56.1% in Q1 and from 15.2% to 65.3% in Q2, compared with the same mixtures from the ACI test method. This phenomenon clearly indicates that the modified impact test delivered lower scattering of results by introducing a line of impact using a steel bar rather than a single-point impact. This investigation highlighted the source of result scattering and provided an appropriate solution to lessen these sources by laying a foundation for the emergence of a new and modified impact testing method.

4.2.7. Orientation of Fibers in FPAFC

Fiber orientation, which can be improved by several factors, results in considerable improvement in impact resistance. This includes electromagnetic induction [40], extrusion and formwork boundaries [41], and the method of mixing and placement [42]. All FPAFC specimens predominantly had a planar orientation of fibers. Mastali et al. [22] reported that an FGFC concrete curved slab with a planar fiber alignment showed higher impact strength than a three-dimensional fiber orientation (Figure 17). Planar aligned fibers perpendicular to the direction of loading have a higher capacity of crack bridging, while three-dimensional fiber orientation would miss fewer cracks [43]. Therefore, FPAFC specimens with three approximately 22 mm layers enabled planar aligned fibers, which increased their impact strength.

4.2.8. Failure Mechanism of FPAFC Specimens against Impact Loading

The effects of damage observed in the specimens against impact loading were contact damage, matrix failure, fiber failure, and fiber debonding/delamination. These damage effects happened in a short time, and hence, it is hard to describe their proper sequence [44,45]. The damage mechanism for the aforementioned effects is illustrated in Figure 18, which includes localized damage at the contact point between the load transfer steel rod and the specimen. Delamination occurs in the internal structure as a result of transverse shear stress/strain. Tensile wave transfer during impact causes failure of the matrix and fiber debonding/delamination to the surrounding zones caused by compressive and tensile bending at the top and bottom surfaces, respectively. Fiber debonding/delamination is one such vital phenomenon of failure that disturbs the integrity of the matrix composite [46]. Additionally, more energy is dissipated by these fibers during secondary crack development, which is highly complex to identify at the time of service. When the first crack is initiated, transfer of substantial kinetic energy occurs in the fibers, which can restrict crack evolution and energy distribution to adjacent areas [47].

5. Weibull Distribution

Many statistical approaches were utilized by the researchers to assess the composites’ dispersed experimental outcomes. The Weibull distribution has recently been used to look at dispersed outcomes. Weibull devised a distribution function based on torsional, bending, and tensional testing, which is mostly utilized for materials that are brittle [48]. Weibull was a pathfinder in statistical data analysis, opening the door to the development of probability distributions for use in concrete failure analysis. Shape and scale parameters, which are accorded fundamental significance in reliability analysis, describe the Weibull distribution at this stage. Various Weibull distribution methods are available to evaluate the scale and shape parameters. For clarification, this research employed the Weibull two-parameter distribution to define the impact strength distribution.

5.1. Graphical Method

In this method, the impact strength is assessed using the least-squares concept by a straight-line interpolation. The Weibull function f(Rf) in Equation (1) is used in the mathematical nomenclature to describe the impact strength distribution [49]. The transformation double logarithmic can be used to represent the equations in this method:
f M f   = s R g R 0 R a R 0 R g R 0 s 1 exp R a M 0 R g R 0 s R 0 R f <
where s is the shape parameter (slope of Weibull), Rg is the scale parameter, and R0 is the impact numbers with the lowest degree of certainty. The impact strength, indicated by Rf, is represented by the Weibull variable. R defines the impact strength (Q1 and Q2) in terms of survival probability. Deriving Equation (1) results in the distribution function F(R) being expressed in Equation (2) [50].
F R p   = P R a < R p   = 1 exp R p R 0 R g R 0 s
If the probability of failure P is (Rf < R), whereby:
P R a > R p   = 1 P R a < R p   = exp R p R 0 R g R 0 s
Using Equation (3), we can determine the probability of survival by knowing the s, Rg, and R0 values. These values contribute to determining the R-value, whereas the Q1 and Q2 values are randomly distributed; therefore, R0 is set to zero [50]. Therefore, the two-parameter Weibull function in Equation (4) may be simplified as follows:
f M f   = s M g M a M g s 1 exp M a M g s M 0 M a <
The probability of survival p is expressed in Equation (5) as follows:
p = exp M a M g s
p = 1 p = 1 exp M a M g s
Equation (7) may be reached by using natural logarithms on both sides of Equation (6) as shown below:
ln ln 1 p   = slnM a slnM g
Equation (7) is rearranged in the form of a linear equation and expressed as follows:
Let   Y =   ln ln 1 p   =   ln ln 1 1 p ,   X =   lnM a ,   a = slnM g
Equation (9) shows the regression equation as a result of the previous steps:
Y = sX a
Q1 and Q2 were defined in the Weibull function in a linear equation form and were expressed in Equation (9). A simple linear regression was performed on the Q1 and Q2 results. If X- and Y-axes provide a linear relationship, it indicates a sound option of line within the data points, and the results follow the two-parameter Weibull distribution [48]. The correlation between Rf and p is provided in Equation (10) as follows [18]:
p = 1 c n + 1
where c is the specimens’ serial number, and n is the total number of tested specimens. Figure 19 shows a graph between ln[ln(1/p)] and ln (Q1 and Q2). With the use of the least-square approach, we were able to find a linear fit and then use it to calculate the form parameter (see Figure 19). Equation (11) may be used to estimate the scale parameter by finding the line intersection in the ln[ln(1/p)] axis and writing it as follows:
R g = e a / s

5.2. Empirical Method of Lysen

This method is used in the moment method and is suggested by [51], and shape and scale parameters are calculated directly using Equations (12) and (13) as follows:
s = σ Q ¯ 1.086
R g = Q ¯ 0.568 + 0.433 α 1 α

5.3. Method of Moments

The method of moments is an alternative approach broadly used in the parameter estimation field. The parameters of scale and shape readily available in the Weibull distribution are expressed in Equations (14) and (15) as follows [51]:
s = 0.9874 σ Q ¯ 1.086
R g = Q ¯ Ґ 1 + 1 / γ
Table 4 shows the obtained shape parameters from the three methods of two-parameter Weibull distribution. Average results were used for the reliability analysis. As a result, in Equation (12), Q1 and Q2 may be assessed in terms of the desired reliability level (Rx) [52].
= R g ( ln R x 1 / s
Figure 20a–l illustrates that the Q1 and Q2 values for all 12 mixtures were offered in terms of reliability. The PAC mixture’s Q1 and Q2 values were determined by looking at the 0.9 reliability. Due to the decreasing degree of reliability, these values rose. For the single-layered specimens, Q1 and Q2 values were calculated by 54 and 448 for the S-SF mixtures and 32 and 99 for the S-SF mixtures. By considering the same reliability level for the two-layered specimens, Q1 and Q2 values were 49 and 241 for D-SF-PF and 50 and 239 for D-PF-SF. The Q1 values were 58, 66, 53, 77, 77, 48, and 61 for the three-layered specimens T-FG1, T-FG2, T-FG3, T-FG4, T-FG5, T-FG6, and T-FG7, respectively. Likewise, the Q2 values were 262, 377, 184, 469, 611, 216, and 275 for the three-layered mixtures mentioned above. Based on the desired degree of dependability, a design engineer may choose the Q1 and Q2 values needed for design calculations. Moving ahead, the reasonable technique to examining dispersed impact test findings will be the Weibull distribution, which provides impact strength in terms of reliability.

6. Conclusions

Based on the detailed examination, the most crucial outcomes were as follows:
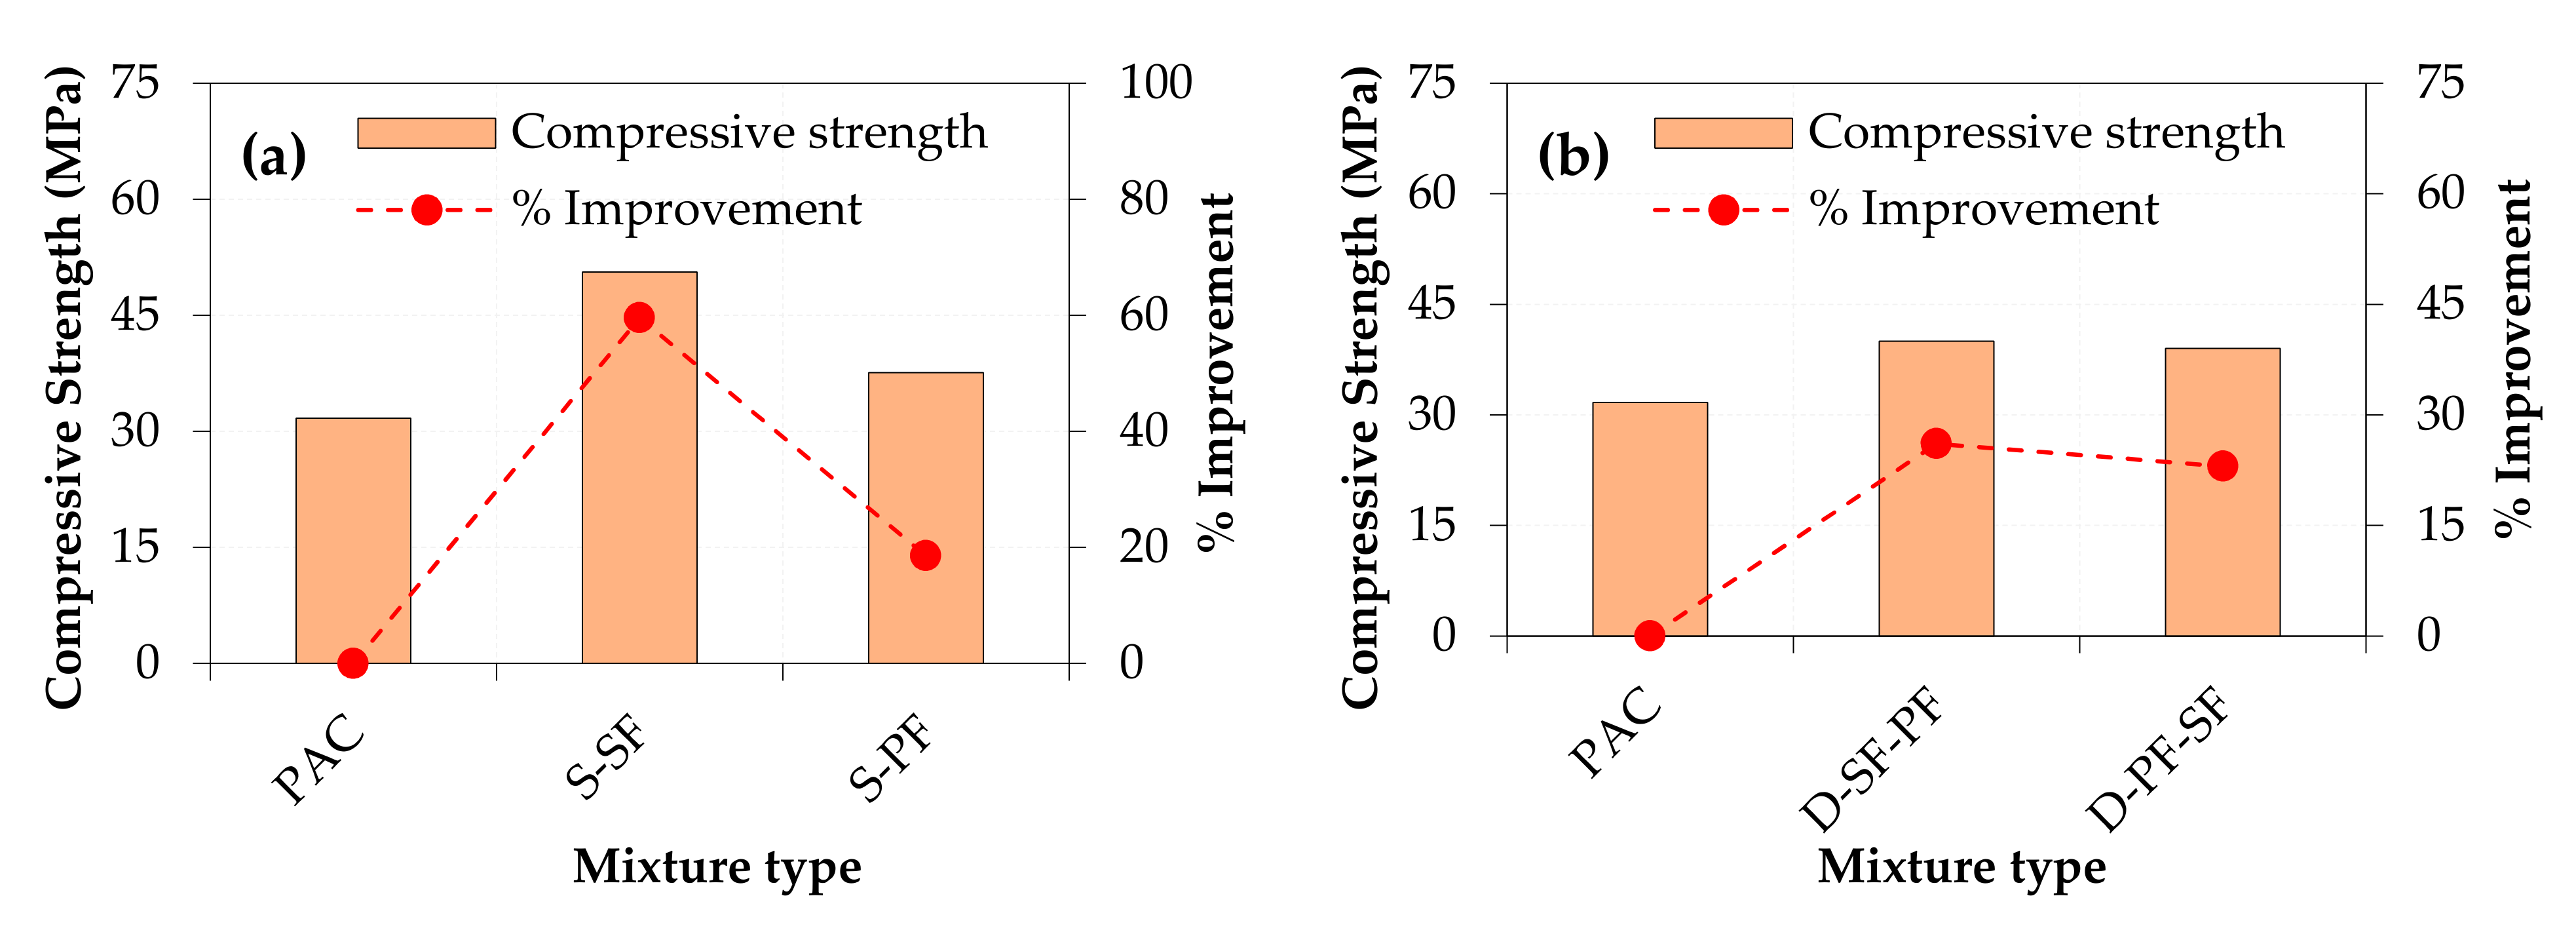
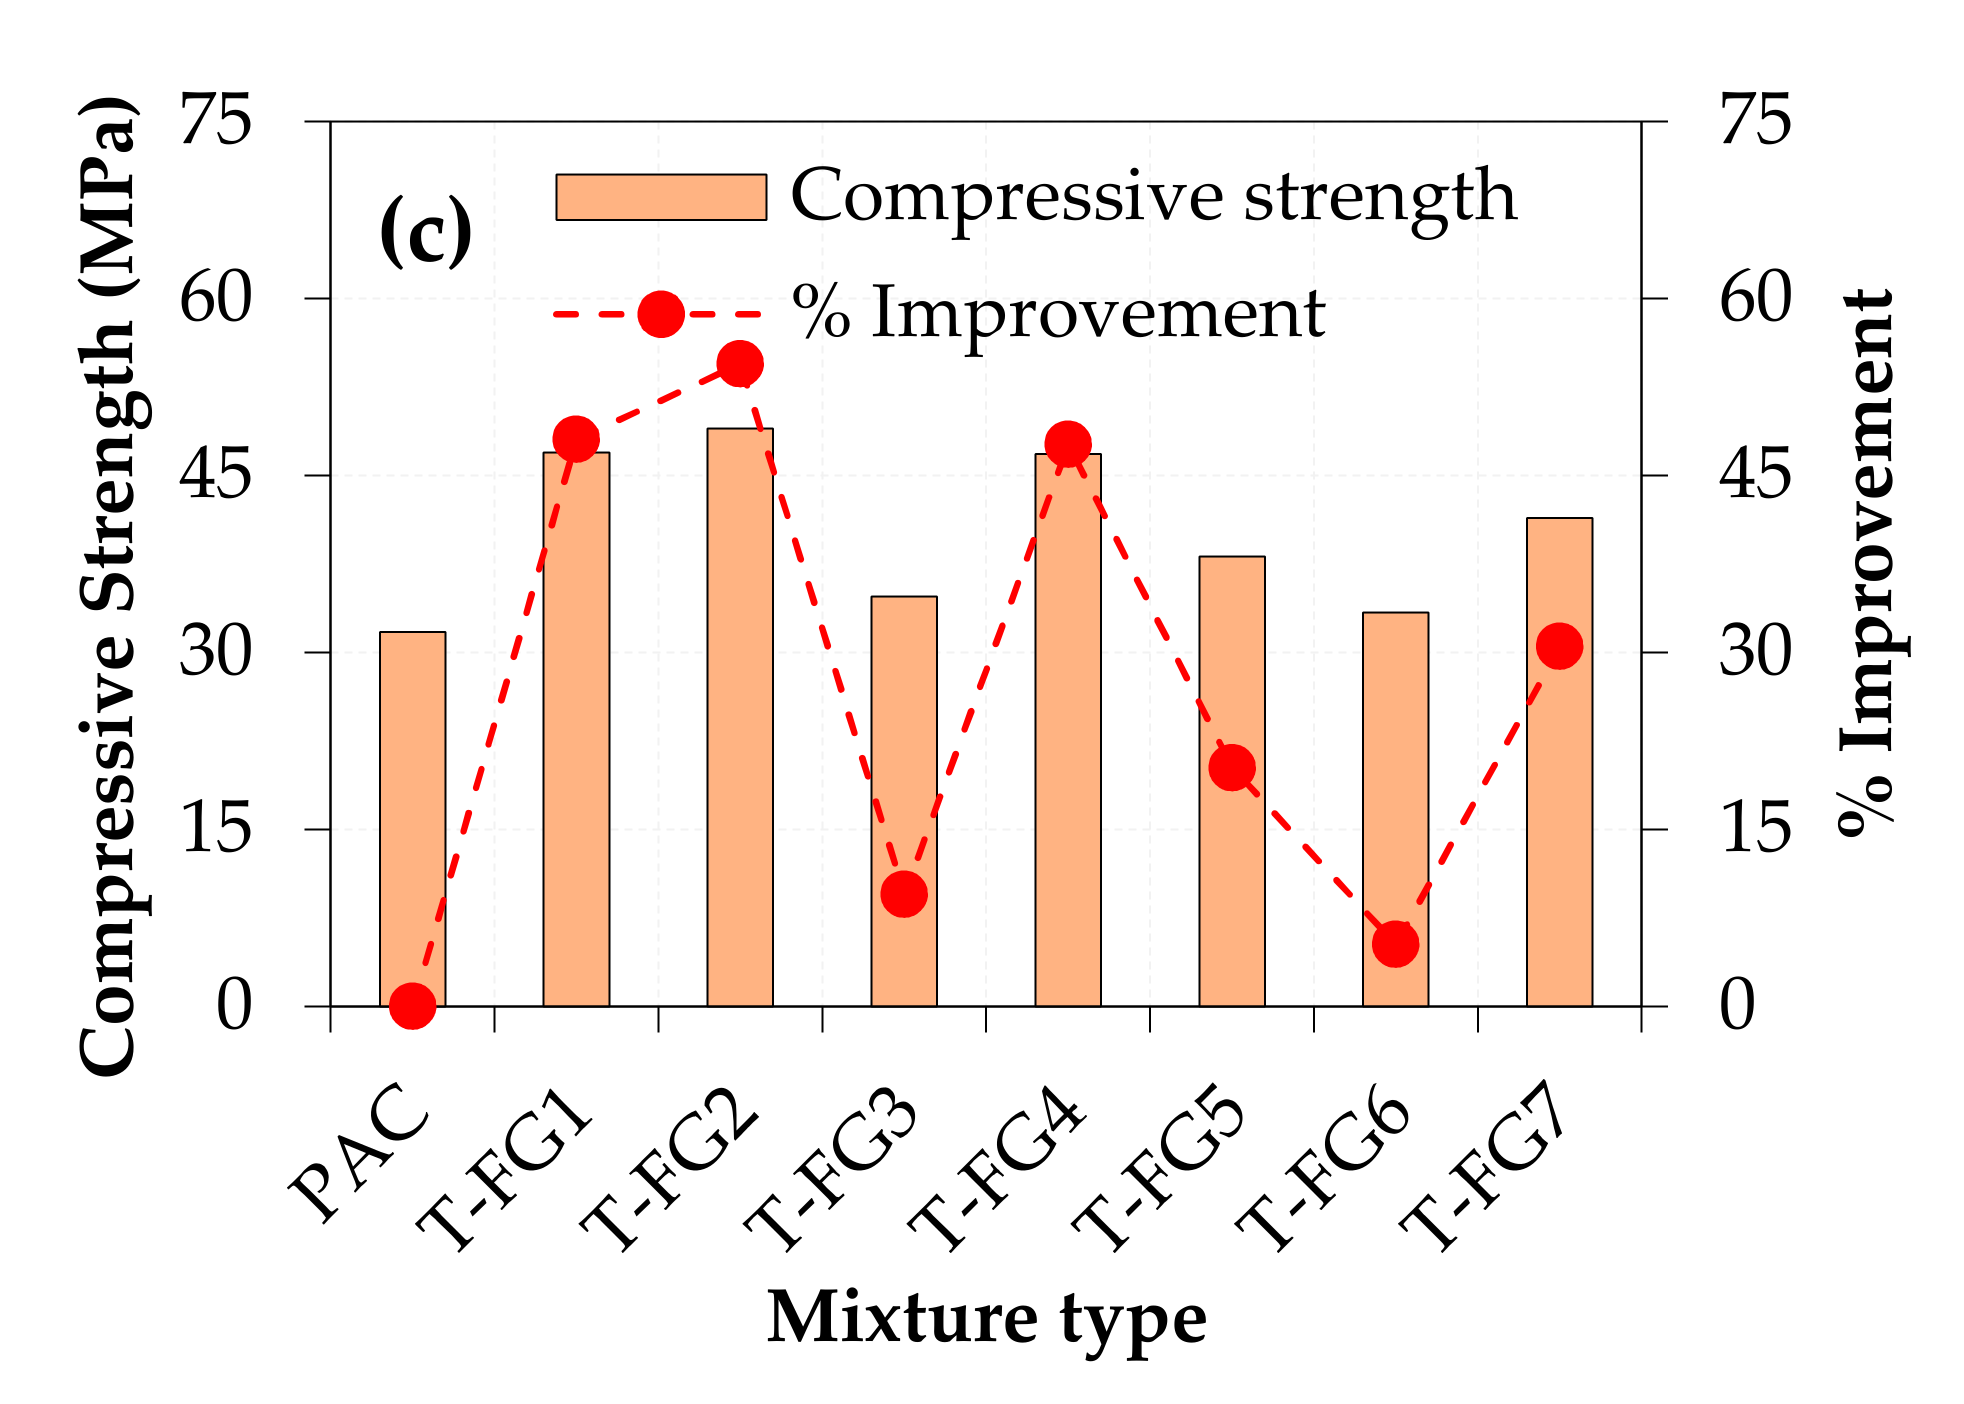
  • The highest compressive strength was exhibited by the S-SF specimen, which showed 59.6% enhancement compared with PAC. The second highest compressive strength with 54.4% improvement was recorded for the T-FG2 specimen, which comprised 2.8% SF at the top and bottom layers and 1.6% at the middle layer. Thus, the performance of single-layered concrete was superior to that of three-layered FPAFC under compression.
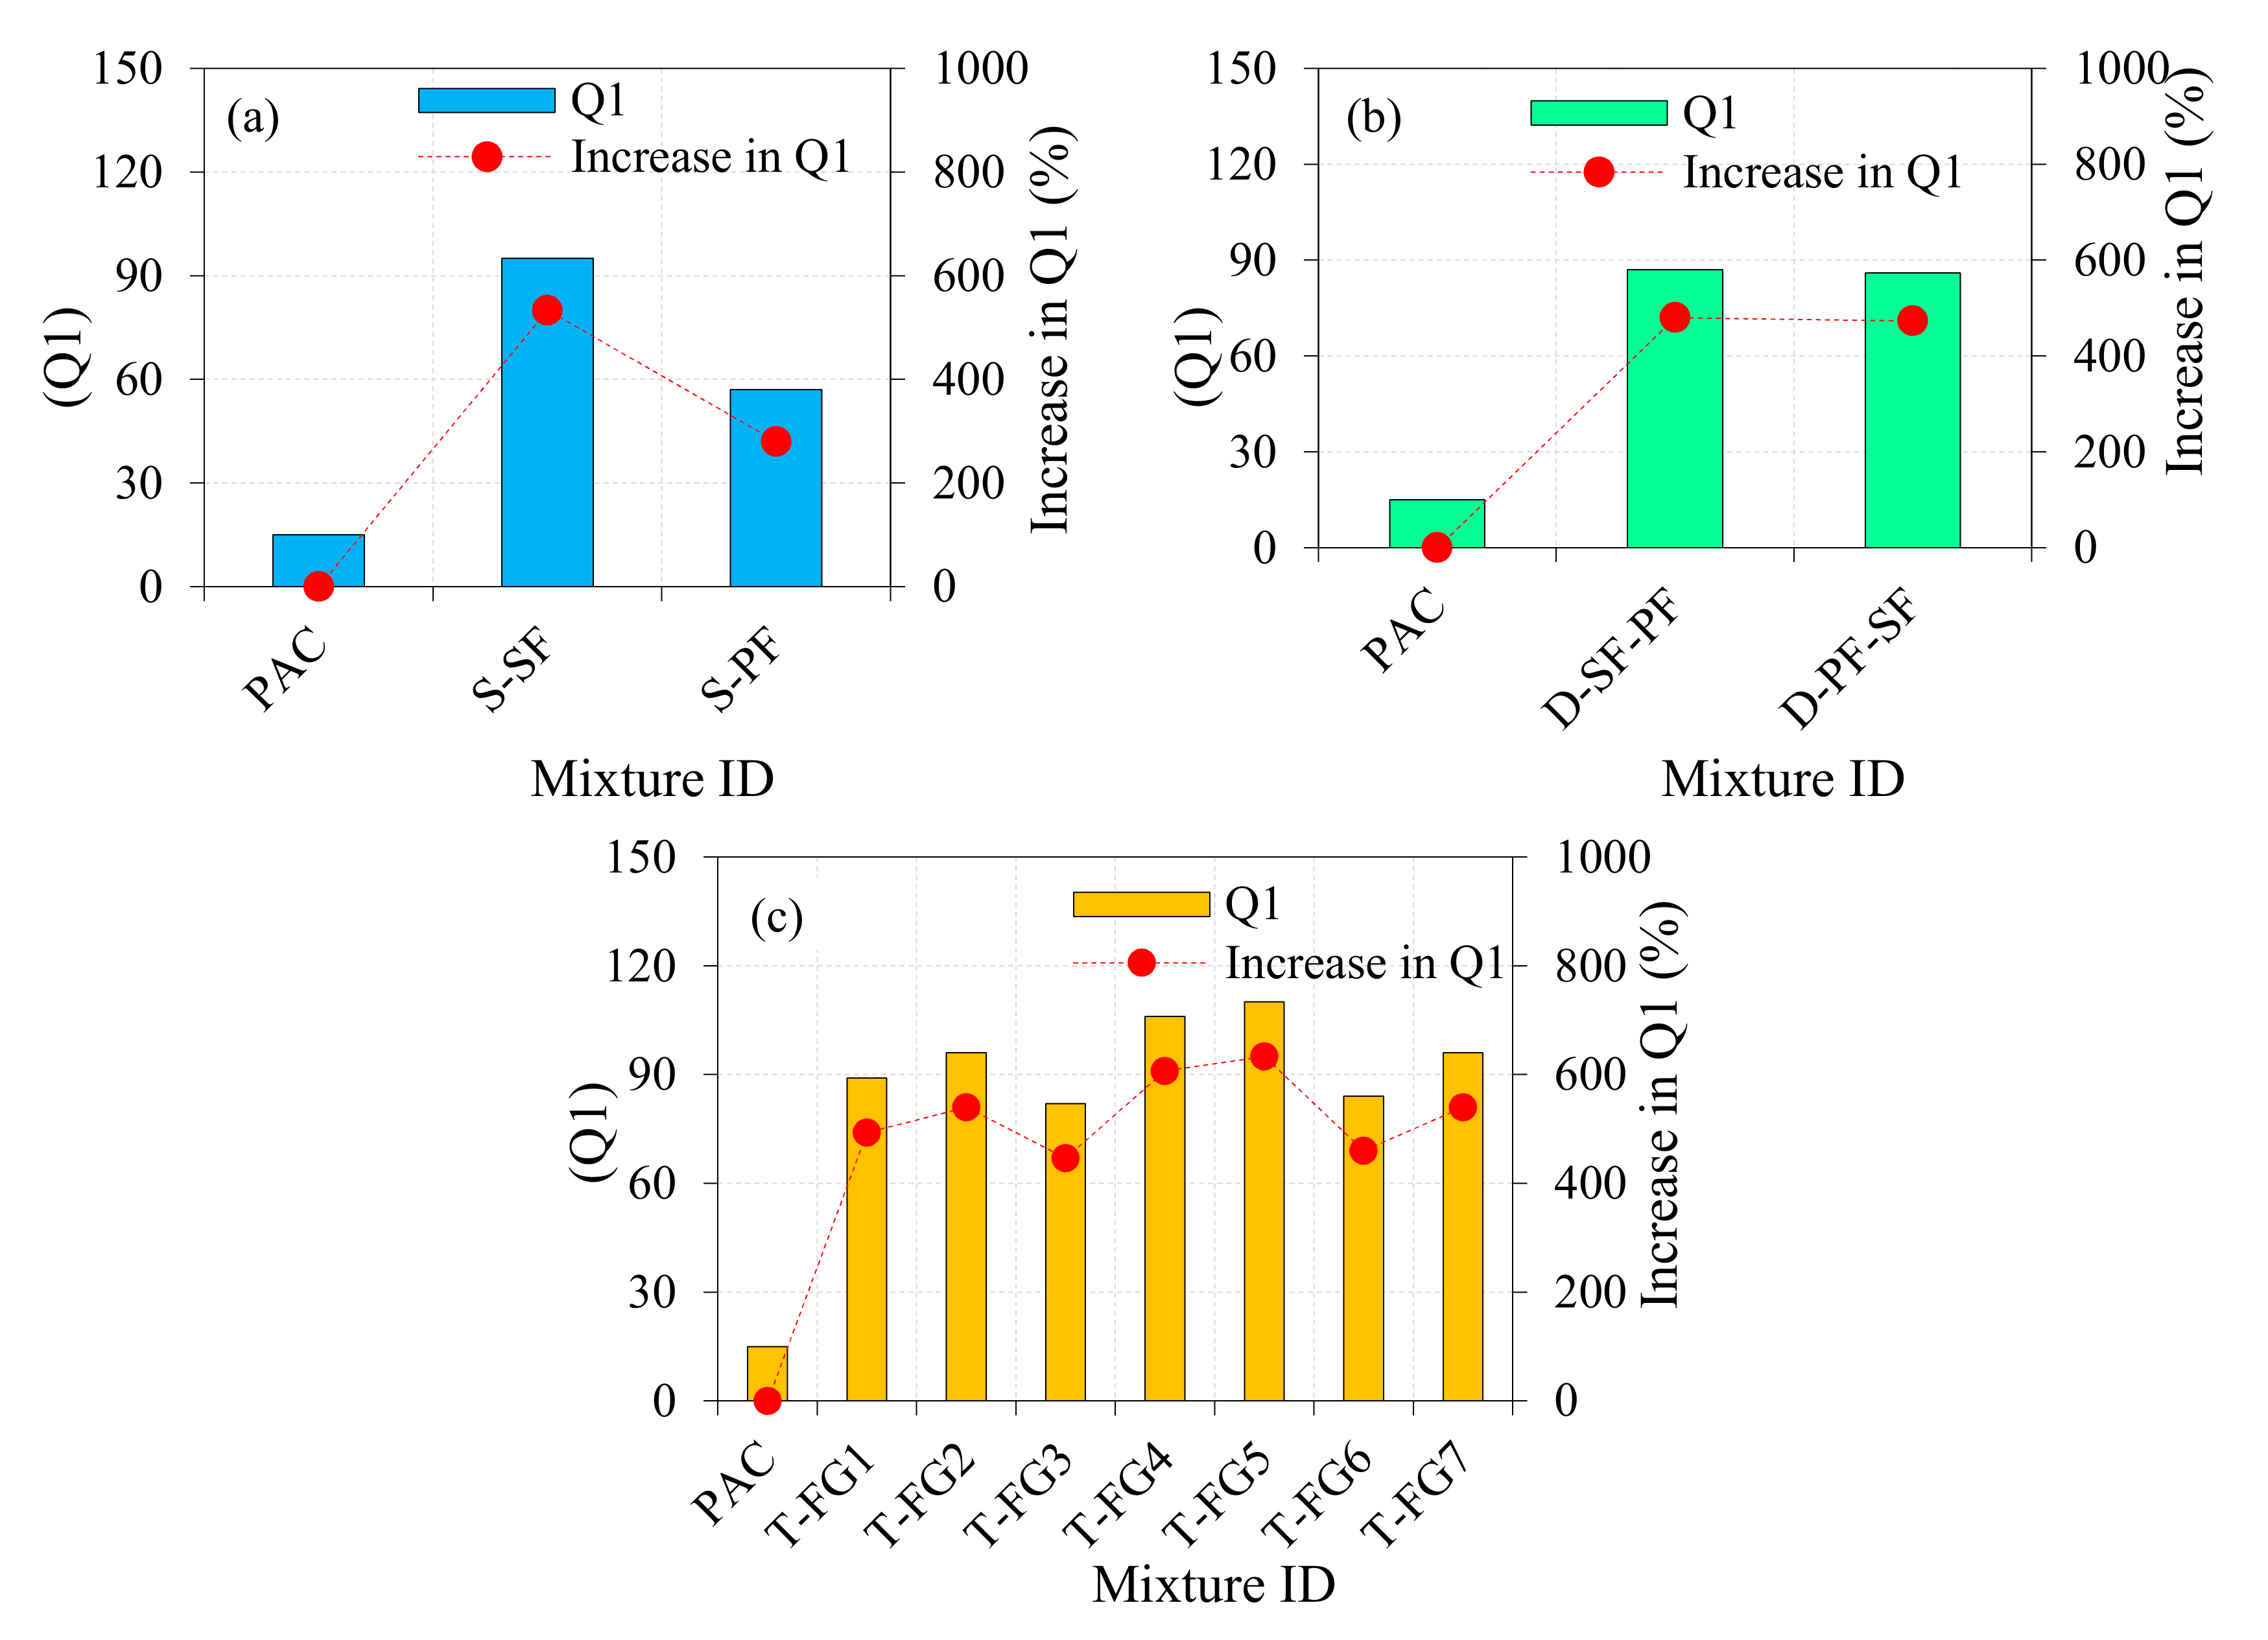
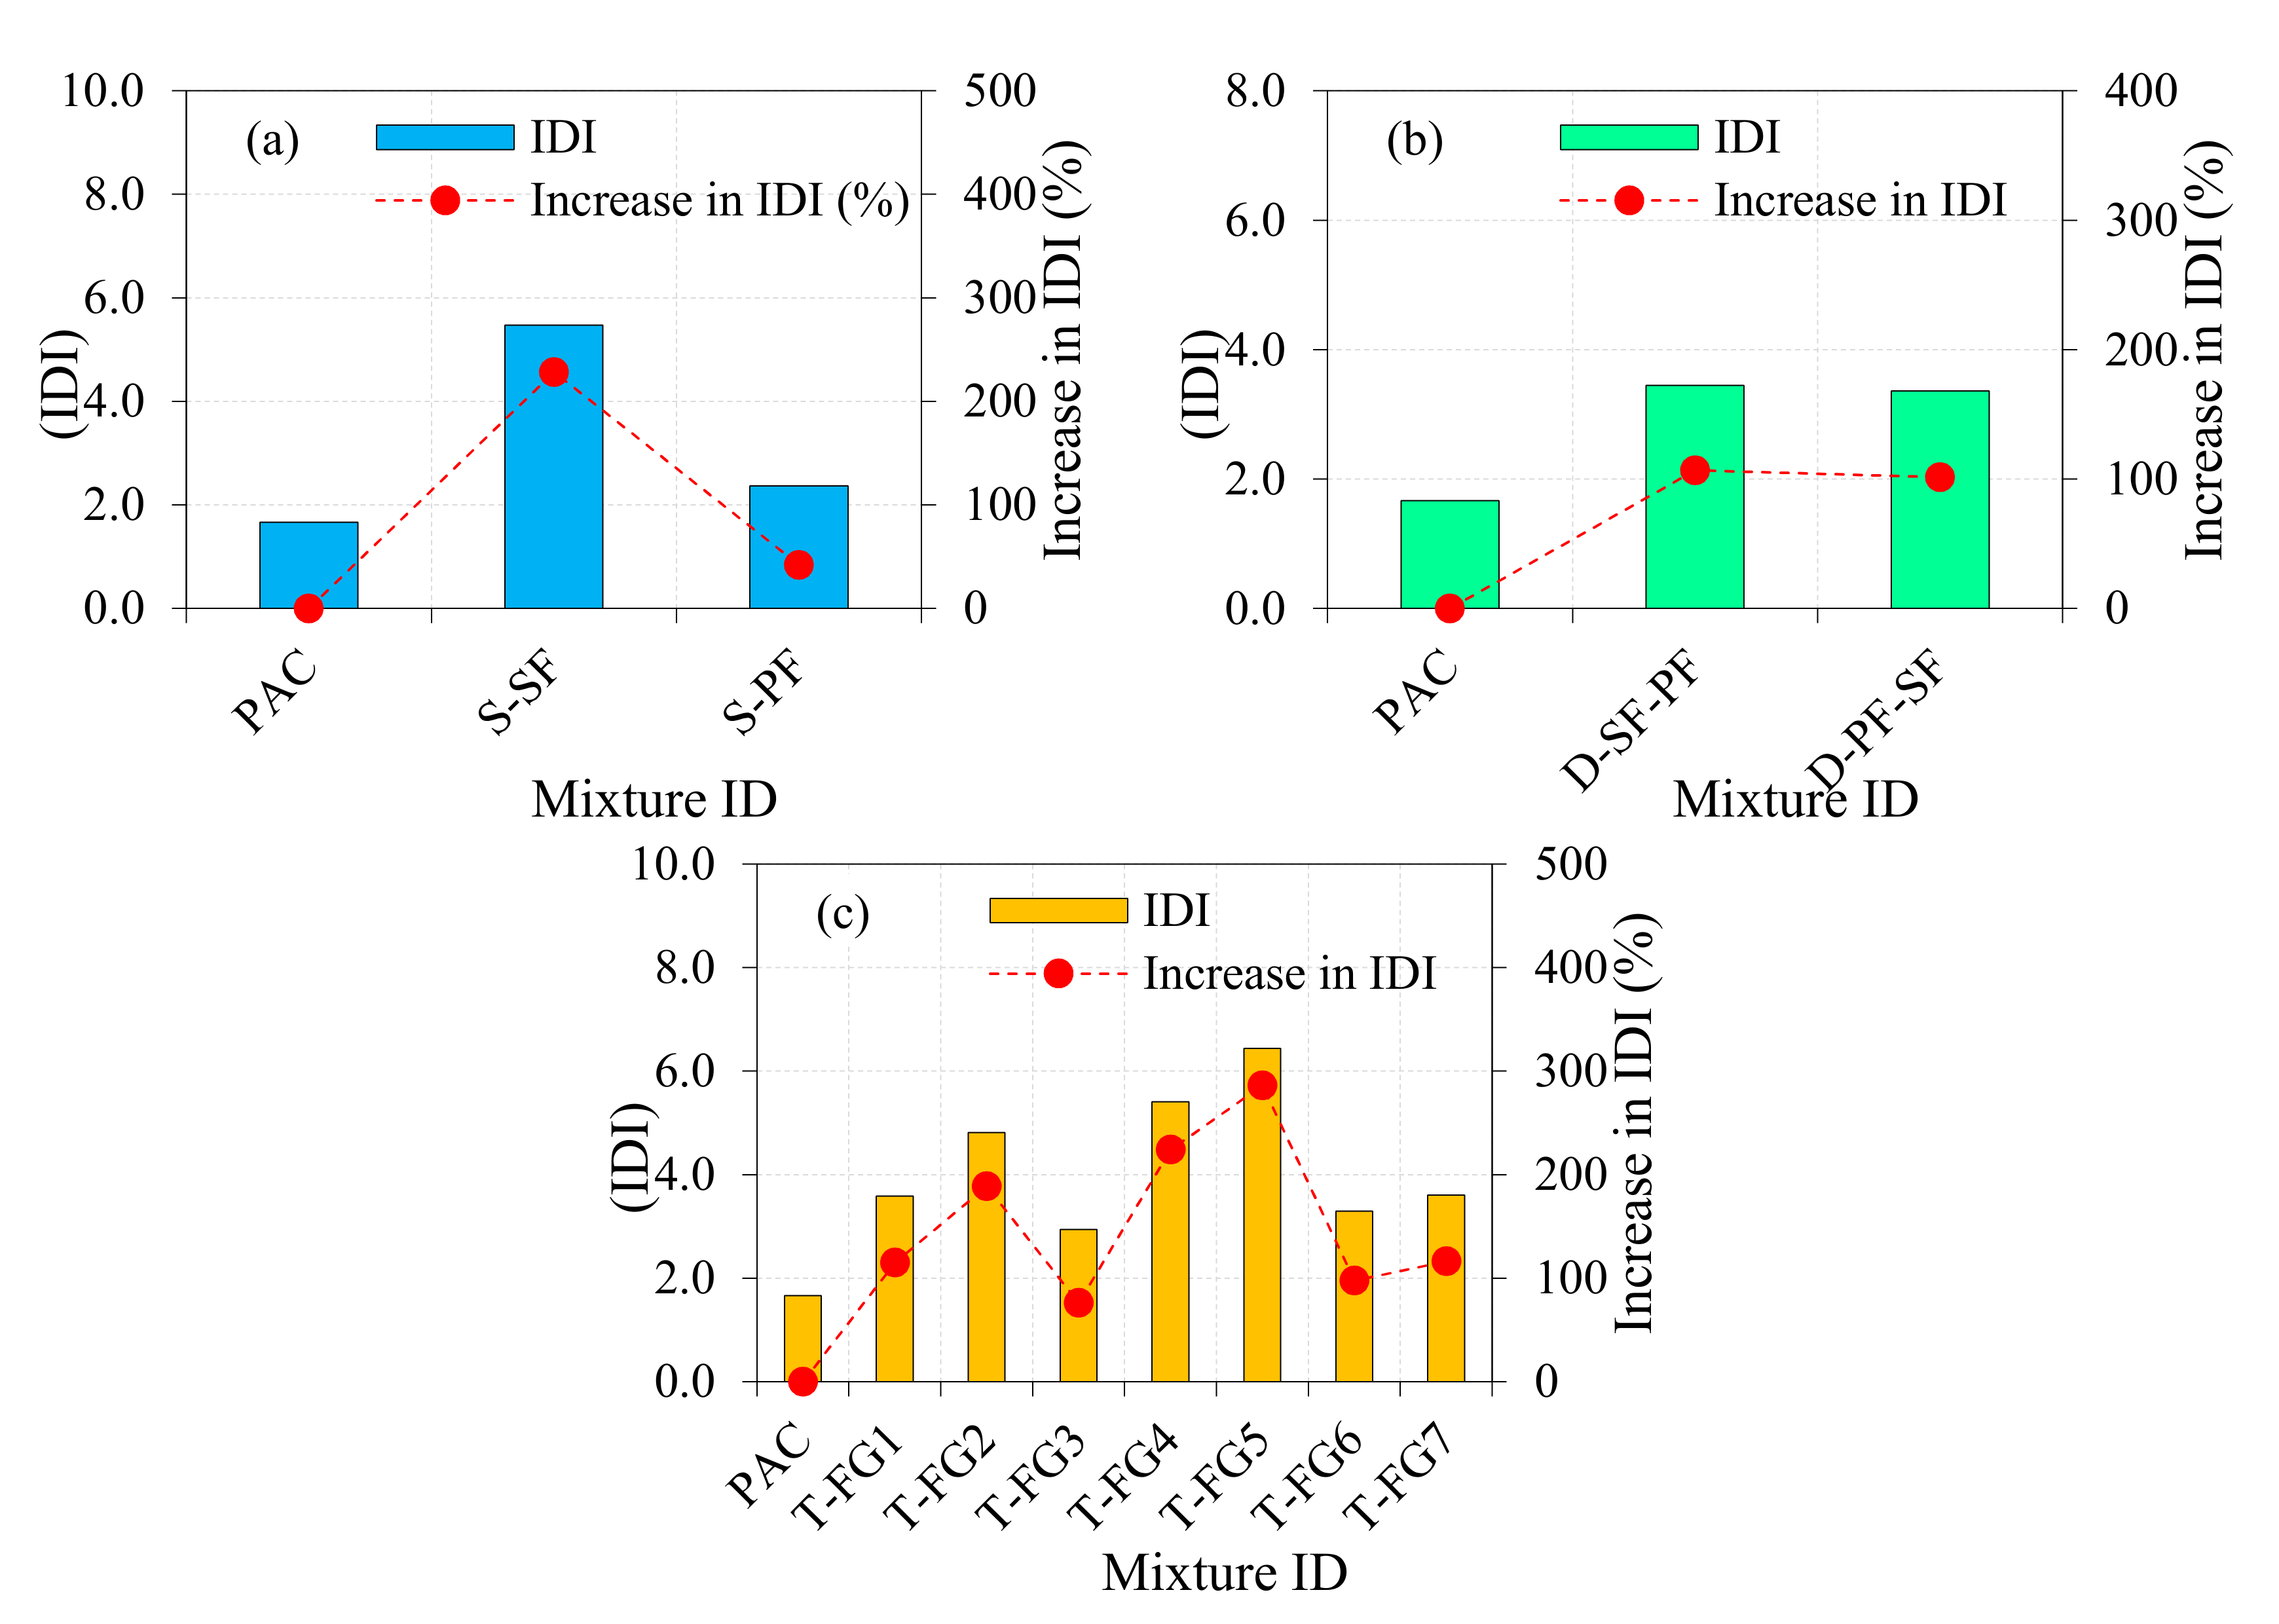
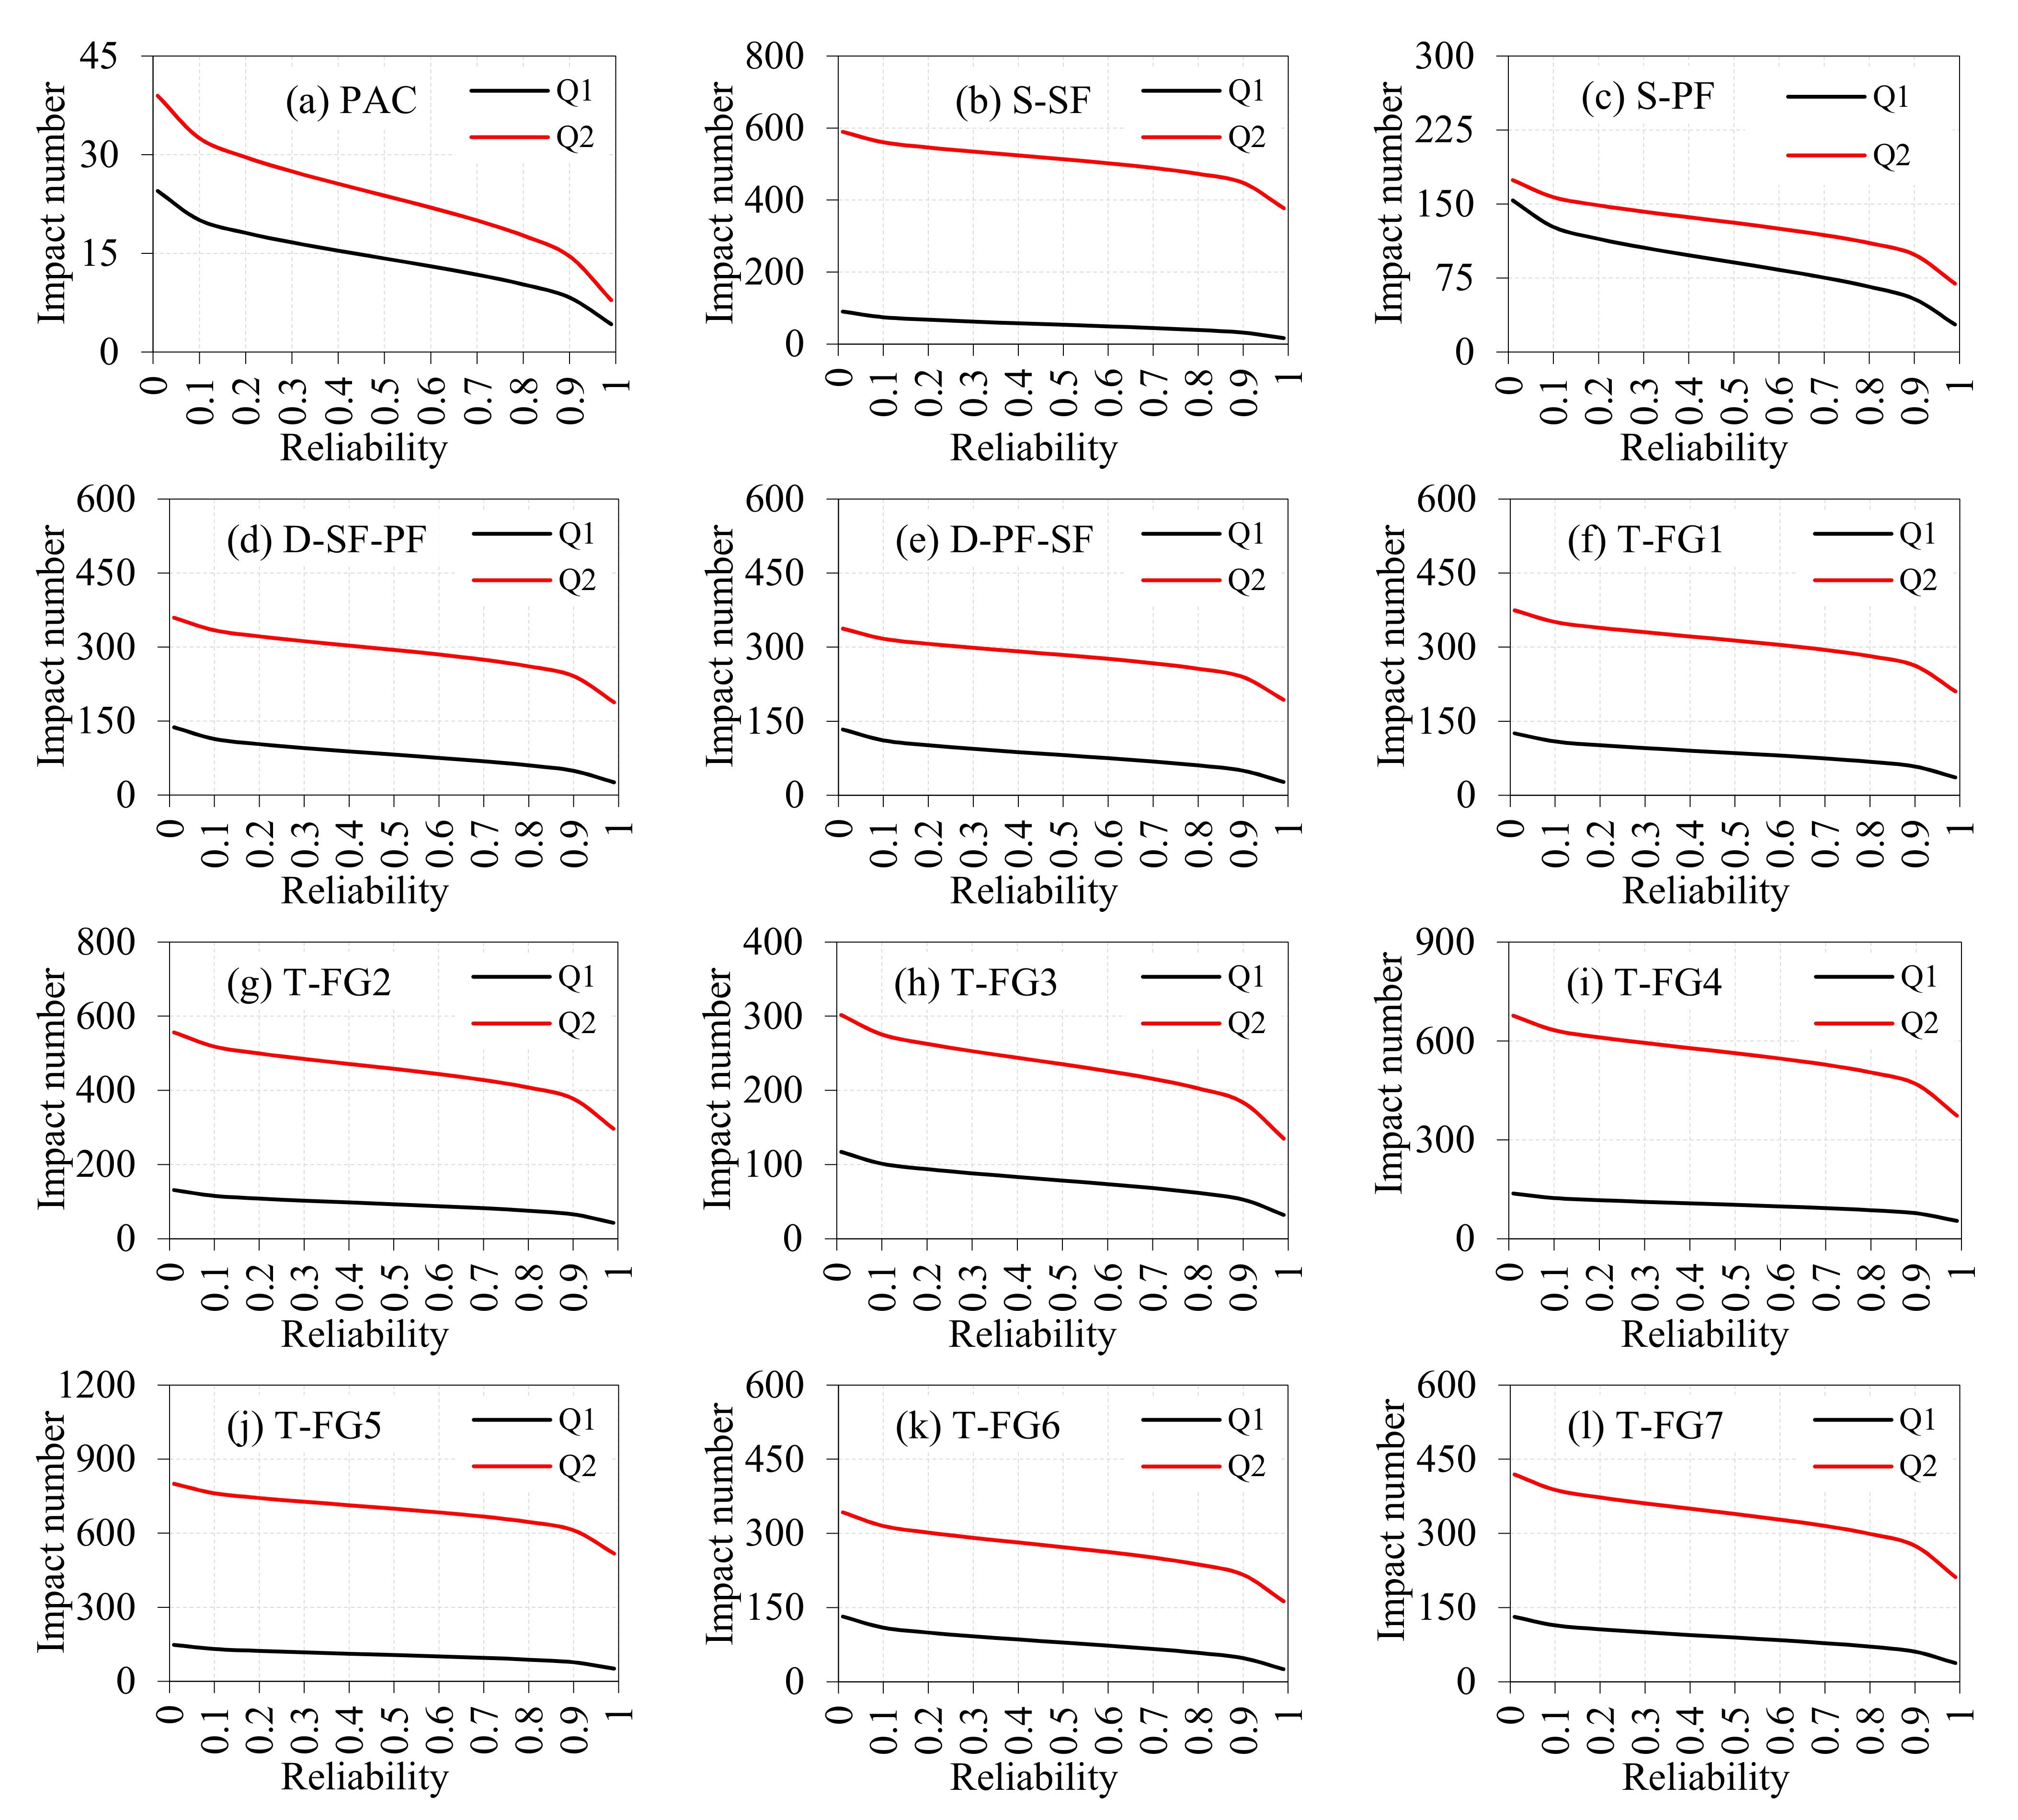
  • For the S-SF and S-PF specimens, the recorded Q1 increased by about 533% and 280%, respectively. Likewise, the recorded Q2 increased by about 1980% and 440% compared with PAC. The percentage increases in Q1 for the mixtures D-SF-PF and D-PF-SF were 480% and 473%, respectively, while those in Q2 were 1100% and 1505%, respectively. The presence of well-distributed fiber-reinforcing elements crosses the created cracks and shared significant amounts of tensile stresses that try to open the cracks due to the fiber’s high tensile strength, which slows the opening of initiated cracks, resulting in higher impact energy absorptivity.
  • The highest percentage improvements of 633% and 2732% were recorded in Q1 and Q2, respectively, for the T-FG5 mixture from the T-FG group. This occurred because the top and bottom layers, which were in close touch with the falling mass and the supporting baseplate, were given a larger SF dose and hence experienced higher concentrations of impact stresses.
  • The percentage difference between the findings of the ACI and the modified impact test varied from −14% to 75% for Q1 and from 6.8% to 57.2% for Q2. Concerning COV for all 12 mixtures, the calculated values were lower by 20.3% to 56.1% in Q1 and 15.2% to 65.3% for Q2 as compared with the ACI test procedure. Hence, the proposed modification from the impact testing can improve the results’ reliability, is easy to conduct, and provides a valuable contribution to future material technology.
  • Direct and uniform cracking occurred in PAC specimens, which reflects the brittle nature, while the wider fracture zone reflects the more ductile behavior of fibrous specimens under repeated impact. A line load distributed under the drop impact load was used to control cracking and fracture of the specimens along a specified path.
  • By considering the same reliability level, the Q1 values were 58, 66, 53, 77, 77, 48, and 61 for the three-layered T-FG1, T-FG2, T-FG3, T-FG4, T-FG5, T-FG6, and T-FG7 specimens, respectively. Likewise, Q2 values were 262, 377, 184, 469, 611, 216, and 275, respectively. A good linear connection between the dispersed experimental impact test results and the two-parameter Weibull distribution is shown to be effective for all specimens in the study.

Author Contributions

Conceptualization, N.P. and G.M.; writing—original draft preparation, N.P., G.M. and N.I.V.; writing—review and editing, N.P., G.M., S.R.A. and N.I.V.; resources, G.M. and N.P.; validation, N.P.; software, N.P.; methodology, G.M. and N.P.; supervision, G.M.; visualization, G.M.; investigation, G.M. and N.P.; formal analysis, G.M. and N.P.; data curation and project administration, G.M.; funding acquisition, N.I.V. The paper has been reviewed and approved by all of the authors in its published form. All authors have read and agreed to the published version of the manuscript.

Funding

The research is partially funded by the Ministry of Science and Higher Education of the Russian Federation under the strategic academic leadership program ‘Priority 2030’ (Agreement 075-15-2021-1333 dated 30.09.2021).

Institutional Review Board Statement

Not applicable.

Informed Consent Statement

Not applicable.

Data Availability Statement

Not applicable.

Acknowledgments

The authors would like to express their gratitude to the School of Civil Engineering at SASTRA Deemed University for their assistance and support.

Conflicts of Interest

The authors declare no conflict of interest.

References

  1. Wang, L.; Zeng, X.; Yang, H.; Lv, X.; Guo, F.; Shi, Y.; Hanif, A. Investigation and Application of Fractal Theory in Cement-Based Materials: A Review. Fractal Fract. 2021, 5, 247. [Google Scholar] [CrossRef]
  2. Wang, L.; Jin, M.; Guo, F.; Wang, Y.A.N.; Tang, S. Pore structural and fractal analysis of the influence of fly ash and silica fume on the mechanical property and abrasion resistance of concrete. Fractals 2021, 29, 2140003. [Google Scholar] [CrossRef]
  3. Ong, C.W.R.; Zhang, M.H.; Du, H.; Pang, S.D. Functionally layered cement composites against projectile impact. Int. J. Impact Eng. 2019, 133, 103338. [Google Scholar] [CrossRef]
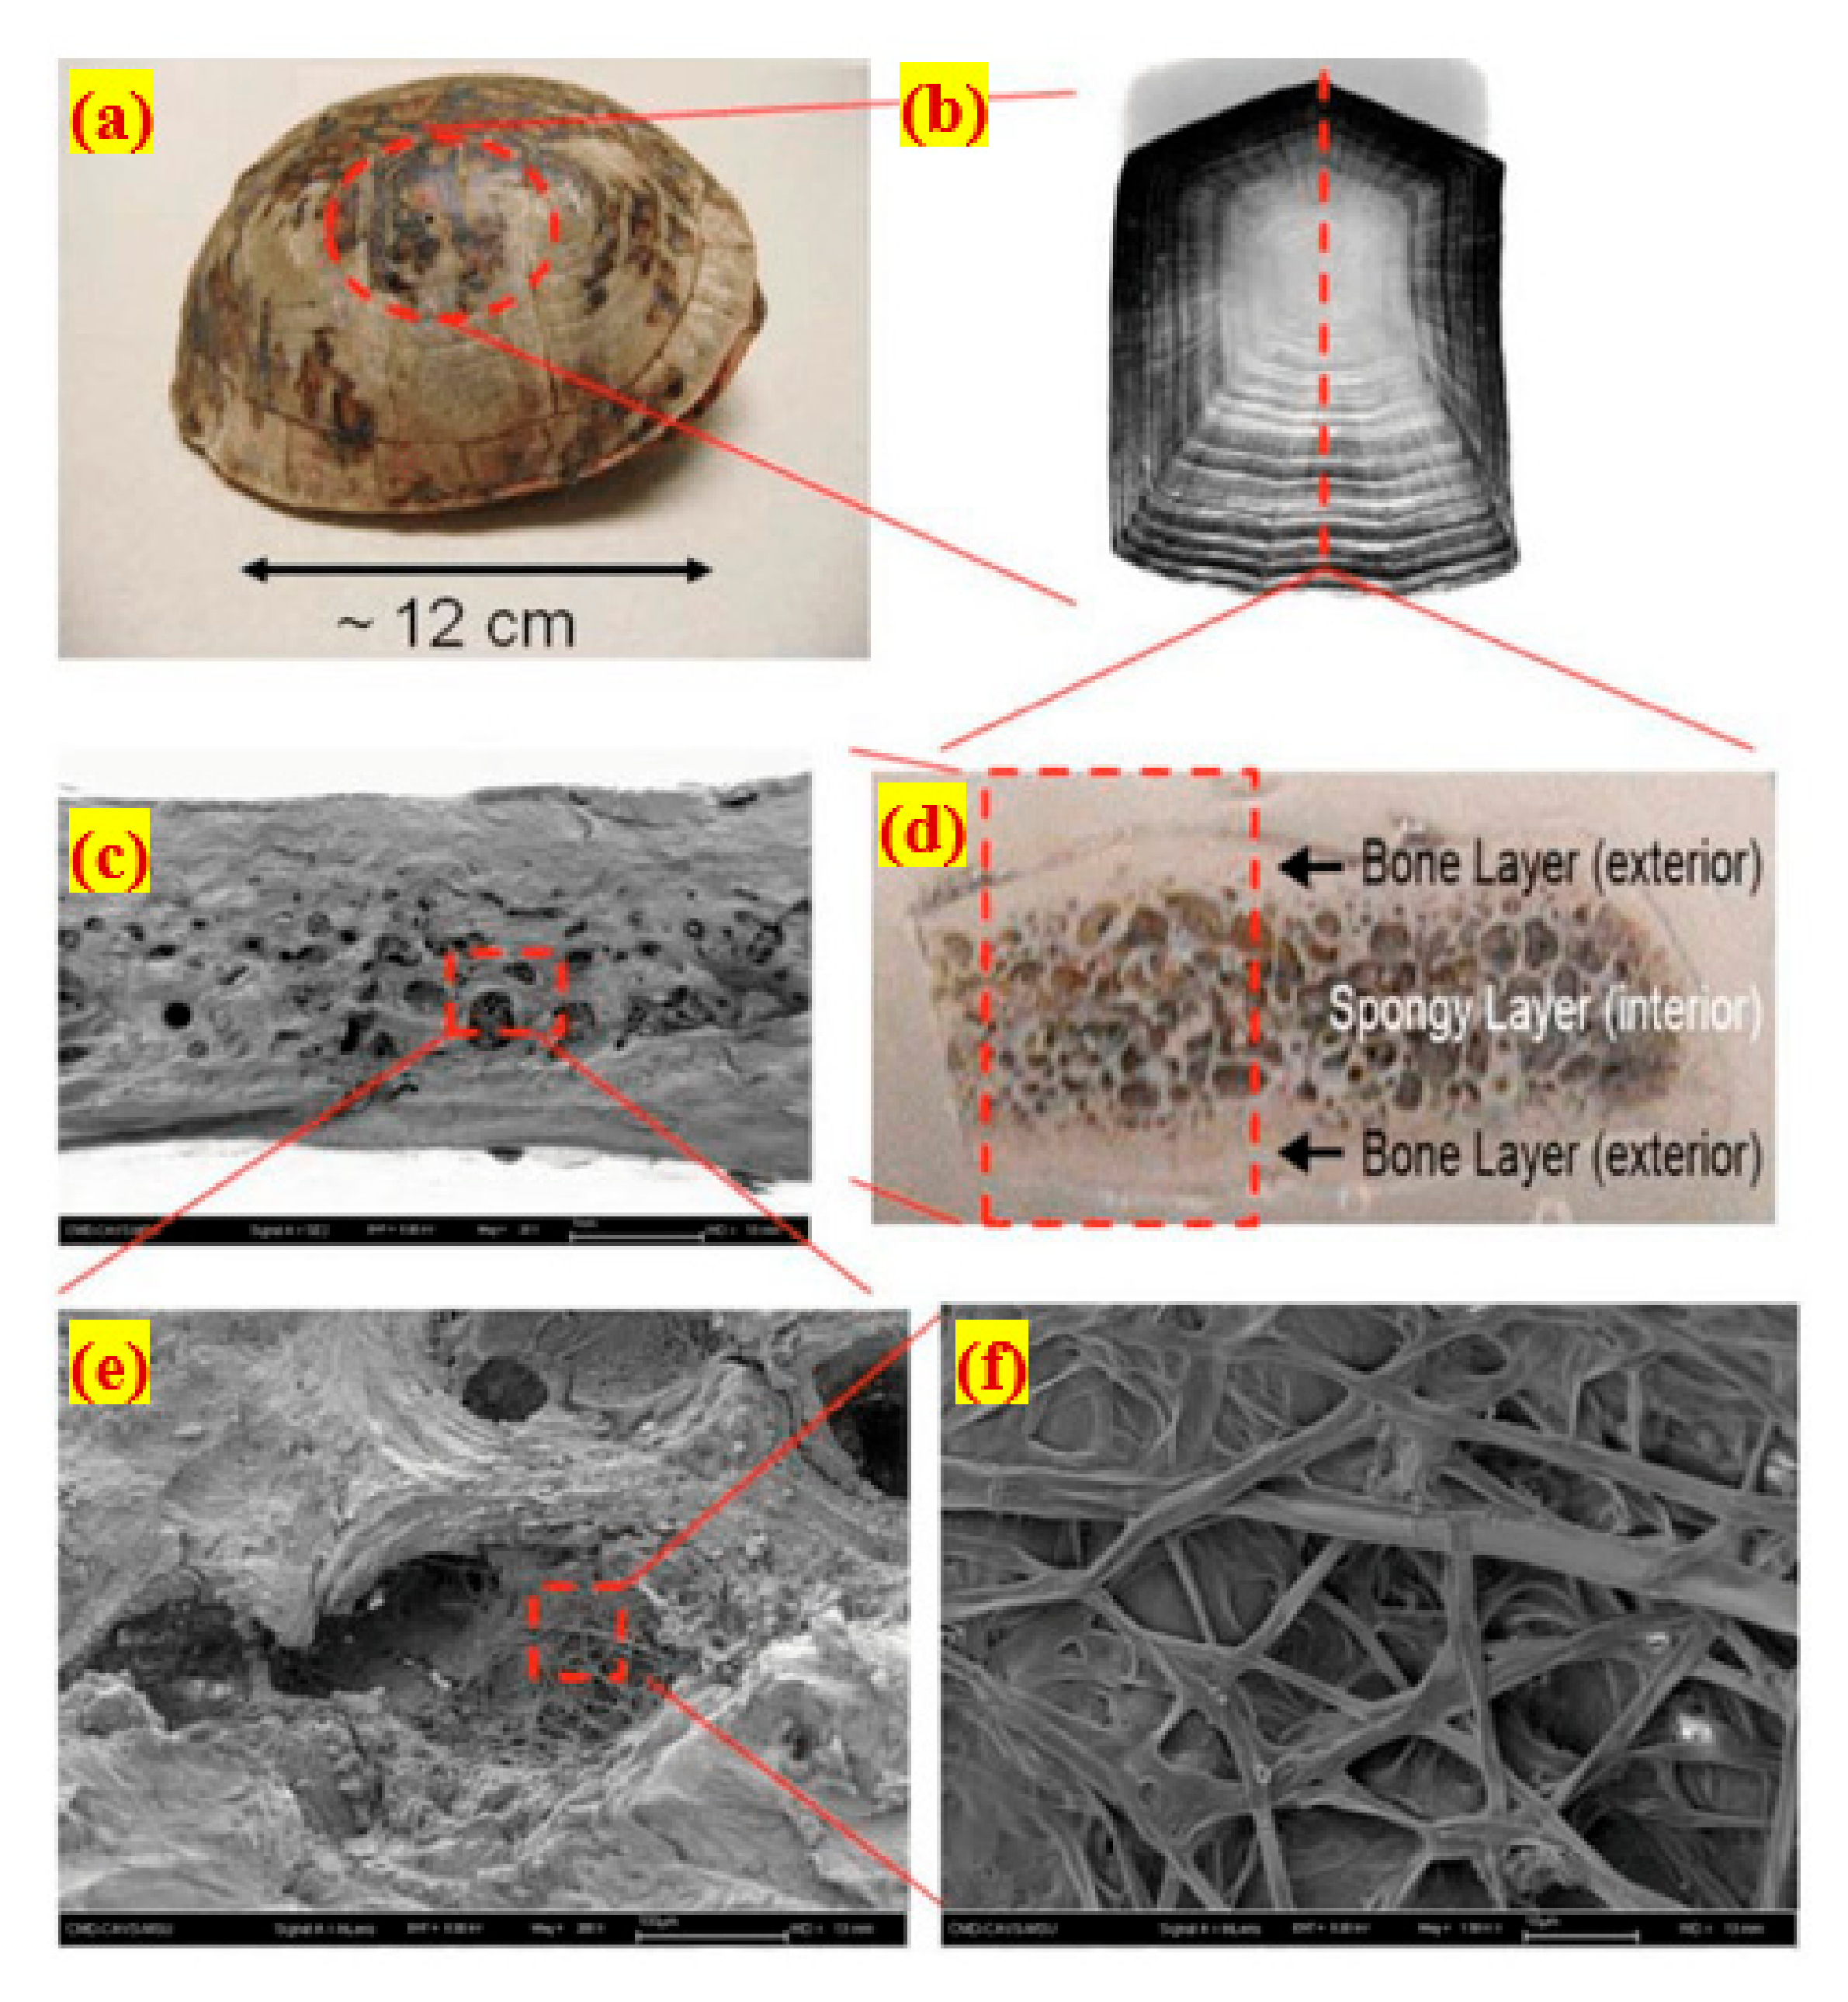
  4. Balani, K.; Patel, R.R.; Keshri, A.K.; Lahiri, D.; Agarwal, A. Multi-scale hierarchy of Chelydra serpentina: Microstructure and mechanical properties of turtle shell. J. Mech. Behav. Biomed. Mater. 2011, 4, 1440–1451. [Google Scholar] [CrossRef] [PubMed]
  5. Coo, M.; Pheeraphan, T. Effect of sand, fly ash and limestone powder on preplaced aggregate concrete mechanical properties and reinforced beam shear capacity. Constr. Build. Mater. 2016, 120, 581–592. [Google Scholar] [CrossRef]
  6. Najjar, M.F.; Soliman, A.M.; Nehdi, M.L. Critical overview of two-stage concrete: Properties and applications. Constr. Build. Mater. 2014, 62, 47–58. [Google Scholar] [CrossRef]
  7. Cao, Q.; Jia, J.; Zhang, L.; Ye, H. Steel reinforced post-filling coarse aggregate concrete columns under eccentric compression. Constr. Build. Mater. 2021, 270, 121420. [Google Scholar] [CrossRef]
  8. Nehdi, M.L.; Najjar, M.F.; Soliman, A.M.; Azabi, T.M. Novel steel fibre-reinforced preplaced aggregate concrete with superior mechanical performance. Cem. Concr. Compos. 2017, 82, 242–251. [Google Scholar] [CrossRef]
  9. Alrshoudi, F.; Mohammadhosseini, H.; Tahir, M.M.; Alyousef, R.; Alghamdi, H.; Alharbi, Y.; Alsaif, A. Drying shrinkage and creep properties of prepacked aggregate concrete reinforced with waste polypropylene fibers. J. Build. Eng. 2020, 32, 101522. [Google Scholar] [CrossRef]
  10. Mohammadhosseini, H.; Alrshoudi, F.; Tahir, M.M.; Alyousef, R.; Alghamdi, H.; Alharbi, Y.R.; Alsaif, A. Performance evaluation of novel prepacked aggregate concrete reinforced with waste polypropylene fibers at elevated temperatures. Constr. Build. Mater. 2020, 259, 120418. [Google Scholar] [CrossRef]
  11. Al-Ameri, R.A.; Abid, S.R.; Murali, G.; Ali, S.H.; Özakça, M.; Vatin, N.I. Residual Impact Performance of ECC Subjected to Sub-High Temperatures. Materials 2022, 15, 454. [Google Scholar] [CrossRef]
  12. Prasad, N.; Murali, G.; Abid, S.R.; Vatin, N.; Fediuk, R.; Amran, M. Effect of Needle Type, Number of Layers on FPAFC Composite against Low-Velocity Projectile Impact. Buildings 2021, 11, 668. [Google Scholar] [CrossRef]
  13. Mohan, K.S.R.; Diviyabharrathi, K.B.; Murali, G. Research on the Development of High Impact Resistant Preplaced Aggregate Fibrous Concrete by the Inclusion of Coarse Aggregates Coated with Asphalt. Arab. J. Sci. Eng. 2021. [Google Scholar] [CrossRef]
  14. Salaimanimagudam, M.P.; Murali, G.; Vivek Vardhan, C.M.; Amran, M.; Vatin, N.; Fediuk, R.; Vasilev, Y. Impact response of preplaced aggregate fibrous concrete hammerhead pier beam designed with topology optimization. Crystals 2021, 11, 147. [Google Scholar] [CrossRef]
  15. Abirami, T.; Loganaganandan, M.; Murali, G.; Fediuk, R.; Vickhram Sreekrishna, R.; Vignesh, T.; Januppriya, G.; Karthikeyan, K. Experimental research on impact response of novel steel fibrous concretes under falling mass impact. Constr. Build. Mater. 2019, 222, 447–457. [Google Scholar] [CrossRef]
  16. Manohar, T.; Suribabu, C.R.; Murali, G.; Salaimanimagudam, M.P. A novel steel-PAFRC composite fender for bridge pier protection under low velocity vessel impacts. Structures 2020, 26, 765–777. [Google Scholar] [CrossRef]
  17. Abirami, T.; Murali, G.; Saravana Raja Mohan, K.; Salaimanimagudam, M.P.; Nagaveni, P.; Bhargavi, P. Multi-layered two stage fibrous composites against low-velocity falling mass and projectile impact. Constr. Build. Mater. 2020, 248, 118631. [Google Scholar] [CrossRef]
  18. Prasad, N.; Murali, G. Exploring the impact performance of functionally-graded preplaced aggregate concrete incorporating steel and polypropylene fibres. J. Build. Eng. 2021, 35, 102077. [Google Scholar] [CrossRef]
  19. Gunasekaran, M.; Thangavel, M.; Nemichandran, N.K.; Ravikumar, I.; Glarance, H.J.; Kothandapani, K. Impact response and strength reliability of green high performance fibre reinforced concrete subjected to freeze-thaw cycles in NaCl solution. Medziagotyra 2017, 23, 384–388. [Google Scholar] [CrossRef] [Green Version]
  20. Prasad, N.; Murali, G. Research on flexure and impact performance of functionally-graded two-stage fibrous concrete beams of different sizes. Constr. Build. Mater. 2021, 288, 123138. [Google Scholar] [CrossRef]
  21. Moghadam, A.S.; Omidinasab, F. Assessment of hybrid FRSC cementitious composite with emphasis on flexural performance of functionally graded slabs. Constr. Build. Mater. 2020, 250, 118904. [Google Scholar] [CrossRef]
  22. Mastali, M.; Ghasemi Naghibdehi, M.; Naghipour, M.; Rabiee, S.M. Experimental assessment of functionally graded reinforced concrete (FGRC) slabs under drop weight and projectile impacts. Constr. Build. Mater. 2015, 95, 296–311. [Google Scholar] [CrossRef]
  23. ACI 544.2R-89: Measurement of Properties of Fiber Reinforced Concrete; American Concrete Institute: Farmington Hills, MI, USA, 1989; Volume 89, pp. 1–12.
  24. Nataraja, M.C.; Dhang, N.; Gupta, A.P. Statistical variations in impact resistance of steel fiber-reinforced concrete subjected to drop weight test. Cem. Concr. Res. 1999, 29, 989–995. [Google Scholar] [CrossRef]
  25. Song, P.S.; Wu, J.C.; Hwang, S.; Sheu, B.C. Assessment of statistical variations in impact resistance of high-strength concrete and high-strength steel fiber-reinforced concrete. Cem. Concr. Res. 2005, 35, 393–399. [Google Scholar] [CrossRef]
  26. Rahmani, T.; Kiani, B.; Shekarchi, M.; Safari, A. Statistical and experimental analysis on the behavior of fiber reinforced concretes subjected to drop weight test. Constr. Build. Mater. 2012, 37, 360–369. [Google Scholar] [CrossRef]
  27. Badr, A.; Ashour, A.F.; Platten, A.K. Statistical variations in impact resistance of polypropylene fibre-reinforced concrete. Int. J. Impact Eng. 2006, 32, 1907–1920. [Google Scholar] [CrossRef] [Green Version]
  28. Murali, G.; Karthikeyan, K.; Haridharan, M.K. Statistical scrutiny of variations in impact strength of green high performance fibre reinforced concrete subjected to drop weight test. Revista Romana de Materiale 2018, 48, 214–221. [Google Scholar]
  29. Ding, Y.; Li, D.; Zhang, Y.; Azevedo, C. Experimental investigation on the composite effect of steel rebars and macro fibers on the impact behavior of high performance self-compacting concrete. Constr. Build. Mater. 2017, 136, 495–505. [Google Scholar] [CrossRef] [Green Version]
  30. Abid, S.R.; Gunasekaran, M.; Ali, S.H.; Kadhum, A.L.; Al-Gasham, T.S.; Fediuk, R.; Vatin, N.; Karelina, M. Impact performance of steel fiber-reinforced self-compacting concrete against repeated drop weight impact. Crystals 2021, 11, 91. [Google Scholar] [CrossRef]
  31. Jabir, H.A.; Abid, S.R.; Murali, G.; Ali, S.H.; Klyuev, S.; Fediuk, R.; Vatin, N.; Promakhov, V.; Vasilev, Y. Experimental tests and reliability analysis of the cracking impact resistance of uhpfrc. Fibers 2020, 8, 74. [Google Scholar] [CrossRef]
  32. Asrani, N.P.; Murali, G.; Parthiban, K.; Surya, K.; Prakash, A.; Rathika, K.; Chandru, U. A feasibility of enhancing the impact resistance of hybrid fibrous geopolymer composites: Experiments and modelling. Constr. Build. Mater. 2019, 203, 56–68. [Google Scholar] [CrossRef]
  33. IS 1489; (Part 1)–Indian Standard Portland Pozzolana Cement (Fly Ash Based)-Specification. Bureau of Indian Standards: New Delhi, India, 2015.
  34. IS 383; 2016 Coarse and Fine Aggregate for Concrete–Specification. 3rd ed. Bureau of Indian Standards: New Delhi, India, 2016.
  35. Astm:C939-10; Standard Test Method for Flow of Grout for Preplaced-Aggregate Concrete (Flow Cone Method). ASTM International: West Conshohocken, PA, USA, 2010.
  36. Prasad, N.; Murali, G.; Vatin, N. Modified falling mass impact test performance on functionally graded two stage aggregate fibrous concrete. Materials 2021, 14, 5833. [Google Scholar] [CrossRef]
  37. Ramkumar, V.R.; Murali, G.; Asrani, N.P.; Karthikeyan, K. Development of a novel low carbon cementitious two stage layered fibrous concrete with superior impact strength. J. Build. Eng. 2019, 25, 100841. [Google Scholar] [CrossRef]
  38. Murali, G.; Ramprasad, K. A feasibility of enhancing the impact strength of novel layered two stage fibrous concrete slabs. Eng. Struct. 2018, 175, 41–49. [Google Scholar] [CrossRef]
  39. Abid, S.R.; Murali, G.; Amran, M.; Vatin, N.; Fediuk, R.; Karelina, M. Evaluation of mode II fracture toughness of hybrid fibrous geopolymer composites. Materials 2021, 14, 349. [Google Scholar] [CrossRef] [PubMed]
  40. Wijffels, M.J.H.; Wolfs, R.J.M.; Suiker, A.S.J.; Salet, T.A.M. Magnetic orientation of steel fibres in self-compacting concrete beams: Effect on failure behaviour. Cem. Concr. Compos. 2017, 80, 342–355. [Google Scholar] [CrossRef]
  41. Huang, H.; Su, A.; Gao, X.; Yang, Y. Influence of formwork wall effect on fiber orientation of UHPC with two casting methods. Constr. Build. Mater. 2019, 215, 310–320. [Google Scholar] [CrossRef]
  42. Maya Duque, L.F.; Graybeal, B. Fiber orientation distribution and tensile mechanical response in UHPFRC. Mater. Struct. Mater. Constr. 2017, 50, 55. [Google Scholar] [CrossRef]
  43. Ramakrishnan, K.; Depak, S.R.; Hariharan, K.R.; Abid, S.R.; Murali, G.; Cecchin, D.; Fediuk, R.; Mugahed Amran, Y.H.; Abdelgader, H.S.; Khatib, J.M. Standard and modified falling mass impact tests on preplaced aggregate fibrous concrete and slurry infiltrated fibrous concrete. Constr. Build. Mater. 2021, 298, 123857. [Google Scholar] [CrossRef]
  44. Rithanyaa, R.; Murali, G.; Salaimanimagudam, M.P.; Fediuk, R.; Abdelgader, H.S.; Siva, A. Impact response of novel layered two stage fibrous composite slabs with different support type. Structures 2021, 29, 1–13. [Google Scholar] [CrossRef]
  45. Murali, G.; Abid, S.R.; Abdelgader, H.S.; Amran, Y.H.M.; Shekarchi, M.; Wilde, K. Repeated Projectile Impact Tests on Multi-Layered Fibrous Cementitious Composites. Int. J. Civ. Eng. 2021, 19, 635–651. [Google Scholar] [CrossRef]
  46. Salaimanimagudam, M.P.; Suribabu, C.R.; Murali, G.; Abid, S.R. Impact response of hammerhead pier fibrous concrete beams designed with topology optimization. Period. Polytech. Civ. Eng. 2020, 64, 1244–1258. [Google Scholar] [CrossRef]
  47. Murali, G.; Abid, S.R.; Mugahed Amran, Y.H.; Abdelgader, H.S.; Fediuk, R.; Susrutha, A.; Poonguzhali, K. Impact performance of novel multi-layered prepacked aggregate fibrous composites under compression and bending. Structures 2020, 28, 1502–1515. [Google Scholar] [CrossRef]
  48. Haridharan, M.K.; Matheswaran, S.; Murali, G.; Abid, S.R.; Fediuk, R.; Mugahed Amran, Y.H.; Abdelgader, H.S. Impact response of two-layered grouted aggregate fibrous concrete composite under falling mass impact. Constr. Build. Mater. 2020, 263, 120628. [Google Scholar] [CrossRef]
  49. Lv, J.; Zhou, T.; Du, Q.; Li, K. Experimental and analytical study on uniaxial compressive fatigue behavior of self-compacting rubber lightweight aggregate concrete. Constr. Build. Mater. 2020, 237, 117623. [Google Scholar] [CrossRef]
  50. Chang, T.P. Performance comparison of six numerical methods in estimating Weibull parameters for wind energy application. Appl. Energy 2011, 88, 272–282. [Google Scholar] [CrossRef]
  51. Kumar, K.S.P.; Gaddada, S. Statistical scrutiny of Weibull parameters for wind energy potential appraisal in the area of northern Ethiopia. Renew. Wind. Water Sol. 2015, 2, 14. [Google Scholar] [CrossRef] [Green Version]
  52. Murali, G.; Santhi, A.S.; Mohan Ganesh, G. Impact resistance and strength reliability of fiber reinforced concrete using two parameter weibull distribution. J. Eng. Appl. Sci. 2014, 9, 554–559. [Google Scholar]
Figure 1. Multiscale hierarchy and the shell of the turtle: (a) a morphology of the turtle shell, (b) a costal scute showing the growth pattern’s (c) surface fracture in SEM, (d) a view of the carapace’s inside showing the composite layer, (e) SEM of the cell structure, and (f) SEM of the cell’s internal fibrous structure.
Buildings 12 00563 g001
Figure 2. Falling mass impact test apparatus and specimen recommended by the ACI Committee [23].
Buildings 12 00563 g002
Figure 3. Modification suggested to the ACI drop-weight test.
Buildings 12 00563 g003
Figure 4. Gradiometric curve for the used aggregates.
Buildings 12 00563 g004
Figure 5. Fiber appearance: (a) hybrid shape of hooked-end crimped and (b) macro polypropylene fiber.
Buildings 12 00563 g005
Figure 6. Details of fiber content used in the layers. (a) PAC, (b) S-SF, (c) S-PF, (d) D-SF-PF, (e) D-PF-SF, (f) T-FG1, (g) T-FG2, (h) T-FG3, (i) T-FG4, (j) T-FG5, (k) T-FG6, (l) T-FG7.
Buildings 12 00563 g006
Figure 7. Casting procedure: (a) empty mold, (b) filling the mold with premixed fibers and coarse aggregate, (c) grout pouring process, (d) specimen appearance after casting, and (e) after demolding, where the specimens were left on the floor.
Buildings 12 00563 g007
Figure 8. Device for measuring the impact of falling masses at low velocity.
Buildings 12 00563 g008
Figure 9. Observed compressive strength of FPAFC (a) Single layer, (b) Double layer, and (c) Triple layer.
Buildings 12 00563 g009aBuildings 12 00563 g009b
Figure 10. Cracking impact number (Q1) of the modified impact test: (a) single-layer specimens, (b) double-layer specimens, (c) triple-layer specimens.
Buildings 12 00563 g010
Figure 11. Failure impact number (Q2) of the modified impact test: (a) single-layer specimens, (b) double-layer specimens, (c) triple-layer specimens.
Buildings 12 00563 g011
Figure 12. Ductility of specimens tested under of the modified impact test: (a) single-layer specimens, (b) double-layer specimens, (c) triple-layer specimens.
Buildings 12 00563 g012
Figure 13. Failure pattern of specimens (a) PAC, (b) S-SF, (c) S-PF, (d) D-SF-PF, (e) D-PF-SF, (f) T-FG1, (g) T-FG2, (h) T-FG3, (i) T-FG4, (j) T-FG5, (k) T-FG6, (l) T-FG7.
Buildings 12 00563 g013
Figure 14. Comparison of failure pattern of specimens from ACI Committee 544 [38] and modified falling mass impact test: (a) ACI-nonfibrous, (b) modified-nonfibrous, (c) ACI- fibrous, (d) modified-fibrous.
Buildings 12 00563 g014
Figure 15. Results of ACI and a modified technique comparison, (a) Q1, (b) Q2, (c) Percentage difference ACI and modified test results.
Buildings 12 00563 g015
Figure 16. COV results of the ACI and the modified technique impact tests are compared (a) Q1, (b) Q2, (c) Percentage difference ACI and modified test results.
Buildings 12 00563 g016
Figure 17. Fiber alignment or orientation in concrete: (a) three-dimensional, (b) planar.
Buildings 12 00563 g017
Figure 18. Failure mechanism.
Buildings 12 00563 g018
Figure 19. Weibull lines (a) Q1, (b) Q2.
Buildings 12 00563 g019
Figure 20. Q1 and Q2 in terms of reliability (a) PAC, (b) S-SF, (c) S-PF, (d) D-SF-PF, (e) D-PF-SF, (f) T-FG1, (g) T-FG2, (h) T-FG3, (i) T-FG4, (j) T-FG5, (k) T-FG6, (l) T-FG7.
Buildings 12 00563 g020
Table 1. A summary of the ACI falling mass impact findings.
Ref.Type of Concrete and
Mixture ID
Type of FiberAmount of FiberTested Specimen per Mixture (Numbers)Failure Impact Number for the Material to FailSDCOV
(%)
[24]Fiber-reinforced concrete (G1, G2)Steel 2.5%15358, 417207, 18558, 44
[25]High-strength fiber-reinforced concrete (HSFRC)Hooked-end steel fiber1%48189680242
[26]Fiber-reinforced concrete (PC, CFRC, PRFC, SFRC)Cellulose fiber, polypropylene fiber, steel fiber0.15%, 0.15%, 0.5%3248, 118, 71, 22828, 53, 36, 9057, 45, 51, 39
[27]Fiber-reinforced concrete (B1, B2)Polypropylene fiber3 kg/m32084, 7644, 3752, 49
[28]Green high-performance plain and FRC (GHPC, GHPSFRC)Steel 0.5%40177, 24081, 9446, 39
[29]Fiber-reinforced concrete
(NC, PP4, PP6, SF20, SF35)
Polypropylene, steel 4, 6, 20, 35 kg/m3615, 33, 40, 52, 55(7, 7, 5, 27, 24)47, 21, 12, 52, 44
[30]Self-compacting fiber-reinforced concrete
(SC30-0, SC30-0.5, SC30-0.75, SC30-1.0)
Steel 0.5%, 0.75%, 1.0%61.8, 7.3, 11.3, 17.20.8, 1.6, 1.6, 4.841.1, 22.3, 14.4, 27.9
[31]Fiber-reinforced concrete (M1)Steel 2.5%121274737
[15]Two-stage fibrous concrete (PC, CF1.5, CF3.0, CF5.0, HF1.5, HF3.0, HF5.0)Crimped steel, hooked-end steel1.5, 3.0, 5.0%1584, 312, 737, 1209, 424, 918, 137825, 86, 113, 151, 64, 78, 12230, 27, 15, 12, 15, 9, 9
[32]Geopolymer fiber-reinforced concrete (M0, M1, M2, M3)Steel, polypropylene, glass1.6, 0.3, 0.3%514, 101, 32, 354.7, 20.3, 9.5, 11.733.5, 20.1, 30.1, 33.6
Table 2. Mixing details of developed FPAFC.
Mix IDS/B
Ratio
W/B
Ratio
Fiber Dosage in the First Layer (%)Fiber Dosage in the Second Layer (%)Fiber Dosage in the Third Layer (%)SP
(%)
SFPFSFPFSFPF
PAC1.00.4500.3
S-SF2.4 SF0.4
S-PF2.4 PF0.4
D-SF-PF2.4 SF2.4 PF0.4
D-PF-SF2.4 PF2.4 SF0.4
T-FG11.21.21.21.21.21.20.4
T-FG22.801.602.800.4
T-FG302.801.602.80.4
T-FG41.41.40.80.81.41.40.4
T-FG53.60003.600.4
T-FG603.60003.60.4
T-FG71.81.8001.81.80.4
S: sand, B: binder, W: water, and SP: superplasticizer.
Table 3. Test results of modified falling mass impact.
Mix IDPACS-SFS-PFD-SF-PFD-PF-SFT-FG1T-FG2T-FG3T-FG4T-FG5T-FG6T-FG7
Q1Q2Q1Q2Q1Q2Q1Q2Q1Q2Q1Q2Q1Q2Q1Q2Q1Q2Q1Q2Q1Q2Q1Q2
19155845634101482425623164266693855419277481726124421561261
29166246136105512595924865272724045519580492836214922163272
310186747839110612676025469288754116120188504916385923866294
411197148841114642736326674294794186421292516956546124670319
512227749044118692826527677299804256821995524966766825581323
6132380499481217628671282803068643475221985381026947426688341
71424855054912781290762888231392442762261005521087017927191356
81524945095313485294822918631896452812381055761107118627995359
91726104528591409629989292883201024618524610658511272290282100367
101827110533631489930195298933221044749225911160111973494289105372
1119301185466915110231499303963271094859726111661112474999295109380
1220311275557515611532810931110033311350199277120625129756105306112381
13213313256977161116340115319107356117524102283128641135771109318115386
14213514658180164120354121325119375121550108294132664137785117331116391
15223915160683169123375128344135389132569109298135685144801119345119395
Mean1525955205713587300862898931996462822411065731107088427793346
SD4.67.128.144.516.922.725.336.524.330.520.134.719.554.618.935.818.164.221.059.324.138.420.543.5
COV%30.027.829.68.629.816.929.112.228.210.622.510.920.211.823.114.817.111.219.08.428.813.922.112.6
SD: standard deviation, COV: coefficient of variance.
Table 4. Weibull parameters obtained using three methods.
Mixture IDImpact NumberGraphical MethodMethod of LysenMethod of MomentsAverage
sRgsRgsRgsRg
PACQ13.24173.61143.61173.4915.80
Q23.66283.92233.93283.8426.16
S-SFQ13.271103.75863.761053.60100.47
Q212.0754114.4450214.6753913.73527.27
S-PFQ13.39633.74513.75633.6359.27
Q26.031456.931266.991446.65138.40
D-SF-PFQ13.37973.82793.83963.6790.69
Q28.553179.852859.973159.46305.82
D-PF-SFQ13.60953.95783.95953.8389.43
Q29.7730211.5027711.6630210.98293.71
T-FG1Q14.69975.03825.05974.9391.92
Q29.4833411.1330511.2833410.63324.31
T-FG2Q15.061055.65895.681045.4699.11
Q28.7548710.1744010.294999.74475.54
T-FG3Q14.34904.92754.94894.7384.76
Q26.922577.932278.012567.62246.78
T-FG4Q16.021136.82996.871136.57108.62
Q29.2160210.7754710.9160010.30583.22
T-FG5Q15.321196.041026.081185.81113.38
Q212.3473614.7868415.0273314.05717.67
T-FG6Q13.37933.88763.89933.7187.35
Q27.462948.552628.642978.22284.50
T-FG7Q14.381025.17865.191014.9196.13
Q27.763679.513299.623648.96353.40
Publisher’s Note: MDPI stays neutral with regard to jurisdictional claims in published maps and institutional affiliations.

