Article

Influence of Organisational Culture on Total Quality Management Implementation in the Australian Construction Industry

School of Built Environment, University of New South Wales, Sydney 2052, Australia
*
Author to whom correspondence should be addressed.
Buildings 2022, 12(4), 496; https://doi.org/10.3390/buildings12040496
Submission received: 24 March 2022 / Revised: 11 April 2022 / Accepted: 13 April 2022 / Published: 16 April 2022
(This article belongs to the Special Issue Construction Management and Disaster Risk Management)

Abstract

:
This study explores the relationship between organisational culture and total quality management (TQM) implementation in Australia, with the purpose of identifying the particular culture that dominants the Australian construction industry, and distinguishing which cultures determine the successful implementation of TQM. Although the application of the competing values framework (CVF) for evaluating organisational culture (OC) in the construction industry has been studied by some scholars, research into OC and its impact on TQM procedures in connection to the CVF in project-based industries such as construction has received less attention. Thus, this research intends to determine the relationship between OC and TQM regarding the CVF in the Australian construction industry. The research methodology used the validated organisational culture assessment instrument (OCAI) CVF to frame OC, and TQM practices identified from the literature review. An online questionnaire was distributed through Qualtrics, whereby 42 valid responses representing various construction organisations in Australia were analysed through IBM SPSS Statistics 26 through endorsing k-means cluster analysis, and analysis of variance. The findings support that Australian construction organisations are dominated by the market and external focused cultures according to the CVF of organisational classification. Furthermore, the findings acknowledge that organisations that are dominated by hierarchical cultural characterises could provide an unfavourable environment for the successful implementation of TQM. Whilst an organisation that obtains a mix of cultures, specifically with the adhocracy and market cultures dominating could provide a favourable environment for the successful implementation of TQM.

1. Introduction

A construction project’s primary aim is to achieve three basic requirements of cost, time, and quality [1,2]. Construction projects are, however, plagued by a slew of quality concerns that result in budget overruns, delays, financial losses, environmental harm, and even death [3]. Over recent decades, total quality management (TQM) has been implemented in various organisations as a philosophy to endorse the quality and improve organisational competitiveness [4,5]. Although TQM includes several elements, such as teamwork, customer satisfaction, etc., the literature has identified the more intangible and technical aspects of TQM, such as culture, which can enhance TQM’s successful implementation. In fact, one of the most critical factors in the success or failure of TQM implementation is organisational culture (OC) [4]. In fact, TQM and OC are traditionally related [6]. Therefore, having a clear perception of OC is pivotal to increase the quality of construction projects [7]. Several reasons, including the fragmented nature of construction projects, dynamic nature of site management, the highly transient approach of the workforce, etc., have resulted in the increasing importance of OC in the construction industry [8]. Thus, OC needs to be studied in order to achieve successful TQM implementation in the construction industry.
Although there are various established benefits of TQM adoption, such as reduced rework and greater revenues [9], certain research documents have illustrated the patterns of failure in its implementation process (e.g., [10]). Conflicts, misunderstandings, confrontations, and dissimilarities among different project stakeholders, all of which are influenced by the OC, have been addressed as the primary causes of these failures [10,11,12]. Thus, it is necessary to look into the impact of OC on TQM implementation. One of the most reliable and widely used instruments for assessing OC is through the competing values framework (CVF) [13], which was initially developed by Quinn and Rohrbaugh [14]. CVF presents four cultures—market, clan, hierarchical, and adhocracy—alongside two dimensions. The first dimension emphasises flexibility and discretion against stability and control, whereas the second dimension indicates internal orientation and focus against external orientation and differentiation [15]. The distinctive contribution of this study is that the organisational culture in construction industry plays crucial role in successful implementation of quality management tools and techniques. This study uses CVF to evaluate the OC for the successful implementation of TQM in the construction industry.
Although the application of CVF for evaluating OC in the construction industry has been studied by some scholars, for instance, Low, et al. [16] in Malaysia, Atuahene and Baiden [17] in Ghana, and Worrall [18] in the United Kingdom, etc., research into OC and its impact on TQM procedures in connection to the CVF in project-based industries such as construction has received less attention. As a result, this research intends to determine the relationship between OC and TQM regarding the CVF in the Australian construction industry. To achieve this aim, the existing literature was discussed in relation to OC and the practices of TQM to acknowledge which types of cultures can be projected to endorse the successful implementation of TQM. Following an in-depth literature review, two hypotheses were developed. The first hypothesis examines whether Australian construction organisations dominated by either clan or adhocracy culture can positively influence the successful TQM implementation. The second hypothesis examines whether Australian construction organisations dominated by either hierarchy or market culture can negatively influence the successful TQM implementation. Subsequentially, data are collected from Australian organisations. Finally, data are analysed, results are presented, and discussion and conclusions are presented. The fundamental implication of this study highlights the importance for organisations to be able to adapt varying objectives to enable diverse structures which endorse flexibility through different management styles, between control and flexibility, and internal and external orientations, to gain from the implementation of TQM.

2. Background

2.1. Total Quality Management (TQM)

Total quality management (TQM) can be defined as a philosophy, management tool and set of principles that may be applied to all activities and processes of an organisation in order to continually enhance product and service quality, meet customer satisfaction at all times, and lower production costs [19]. TQM’s primary goal is to meet customers’ expectations and satisfaction by “doing it correctly the first time, every time” [20]. Two main aspects of TQM have been emphasised in previous studies: technical aspects of TQM, such as problem-solving tools [21], and intangible aspects of TQM, such as company culture, teamwork, empowerment, leadership, continuous improvement, etc. [22,23,24,25,26,27]. TQM in the construction industry mainly refers to addressing the needs of the client, design professionals, contractor, architect and other stakeholders [28]. The strength of these stakeholders’ bonds influences the success of construction projects [29]. TQM is beneficial in the construction sector because it aids in the development of long-term relationships, the enhancement of skills, professionalism and communication, and the achievement of project goals [30]. TQM adoption in the construction industry, however, is a difficult endeavour. Although the ephemeral nature of projects, lack of standardisation, various stakeholders, and the conservative ethos of the construction sector are all contributing to the challenge in implementing TQM [31,32], the pivotal role of culture in its successful implementation in organisations cannot be neglected [12]. In fact, one of the most important aspects of TQM adoption is recognising and converting customer demands and expectations into organisational action plans [33]. In this regard, organisational culture (OC) influences quality management techniques to support quality improvement objectives and produces an organisational climate [34]. Therefore, organisations must be able to systematically define and assess the OC using a well-developed framework [35].

2.2. Organisational Culture (OC)

It is difficult to define OC predominately as it possesses intangible characteristics [36]; however, this study adheres to Schein [37]‘s widely accepted definition of OC, which refers to shared basic assumptions, beliefs, and values that provide an understanding of how the organisation functions. OC has a significant impact on employees’ behaviour and performance outcomes, as well as the organisation’s external environment [38]. One widely applied framework to determine OC in any organisation is the competing values framework (CVF) [12]. The CVF framework was initially established by Quinn and Rohrbaugh [14]. Considering this concept, culture is defined by two dimensions: the first component concerns the company’s focus on stability versus flexibility, as measured by the priority placed on control and order (stability) versus creativity and dynamism in responding to external changes (flexibility); the second component is the company’s orientation, which can be external, when the focus is on customers, competitors, and the environment, or internal, when the focus is on the organisation’s people, products, and procedures [4]. Quinn and Rohrbaugh [14] offered four sorts of culture by integrating these two dimensions: adhocratic, clan, market, and hierarchy. The adhocratic culture encourages flexibility, although it is externally oriented. Creativity, risk-taking, originality, and initiative are among its goals [4,39]. Clan culture is built on internal emphasis and flexibility. It promotes teamwork, commitment, and involvement by treating the company as a family [17,40,41]. Market culture seeks an external perspective from which to distinguish itself from competitors, with the goal of producing a market leader; however, it achieves its goals of internal and external competitiveness and productivity through stability and control [42,43]. Finally, hierarchical culture is founded on internal concentration, stability, and control. It is defined by a wide number of standards aimed at improving efficiency, process standardisation, product standardisation, and so on [7,42,44,45,46]. Nevertheless, each organisation exhibits a mix of several cultural types; yet, one kind may take precedence over the other [47]. OC can be created, deciphered and measured in various ways [46]. For instance, organisational culture profile (OCP) [48] which was later modified by Gray and Allegritti [49] to endorse investigating the relationship between culture and organisational outcomes, including performance, employee commitment and trust within small organisations. However, the organisational culture assessment instrument (OCAI), which was developed by Cameron and Quinn [15], is deemed as the most frequently used instrument for assessing OC, as it has been endorsed by thousands of organisations in the past 2 decades [45,50,51]. Thus, it is deduced that the culture is characterised by a dynamic entrepreneurial environment through the appreciation of individual initiative and liberty [15,40].

2.3. The Relationship between Total Quality Management (TQM) and Organisational Culture (OC)

Many scholars have asserted that the success of Total Quality Management (TQM) implementation is predominantly dependent on the OC [52]. Similarly, several studies have determined the types of OC that are most suitable for TQM implementation by adopting the Competing Values Framework (CVF) developed by Quinn and Rohrbaugh [14]. In this regard, empowerment, employee engagement, teamwork, internal guidance, and support from management that exist in the clan culture as well as customer orientation, continuous improvement, training and motivation that are present in clan and adhocratic cultures have been proven to positively affect TQM [53]. Similarly, Patyal, Ambekar and Prakash [12] evaluated the relationship between the TQM and OC in the Indian construction industry and came up with the hierarchical culture as the dominant culture of CVF. Besides, Gimenez-Espin, Jiménez-Jiménez and Martínez-Costa [4] affirmed that adhocracy culture has a positive impact on TQM and further promoted that a mixed culture entailing adhocratic and clan-dominated cultural characteristics prove to be the most appropriate for TQM implementation. Conversely, some scholars have discovered that bureaucratic cultures that place a premium on control, such as hierarchical and market cultures, failed to explain successful TQM implementation [54]. In this case, the market culture is oriented towards set objectives and the pursuit of the lowest transaction costs with regard to suppliers, customers, and workers, whereas the hierarchical culture deals mainly with a high bureaucracy, which could sabotage TQM adoption [53]. In other words, clan and adhocracy cultures have been widely favored for the successful implementation of TQM [55], whereas the market and/or hierarchy culture(s) was often found to have no or negative effects on TQM implementation [4]. In addition, each organisation does not solely resemble one single culture, rather a combination of cultures with some being more dominant than others [12]. Furthermore, Cameron and Quinn [15] supported that TQM initiatives are often abandoned shortly after initial implementation due to the failure of integration between TQM and cultural change. Therefore, to foster successful TQM implementation and integration, numerous scholars recommend that organisations need to utilise OC dynamically [7]. To achieve this opportunity, organisations need to possess the ability to systematically identify and assess their OC through a well-established framework. In accordance with the studies presented above, this research proposes the following hypotheses to address the influence of OC and TQM implementation within the context of Australian construction organisations:
Hypothesis 1 (H1).
Australian construction organisations dominated by either clan or adhocracy cultures positively influence the success of total quality management implementation.
Hypothesis 2 (H2).
Australian construction organisations dominated by a hierarchy and/or market culture can negatively influence the success of total quality management implementation.

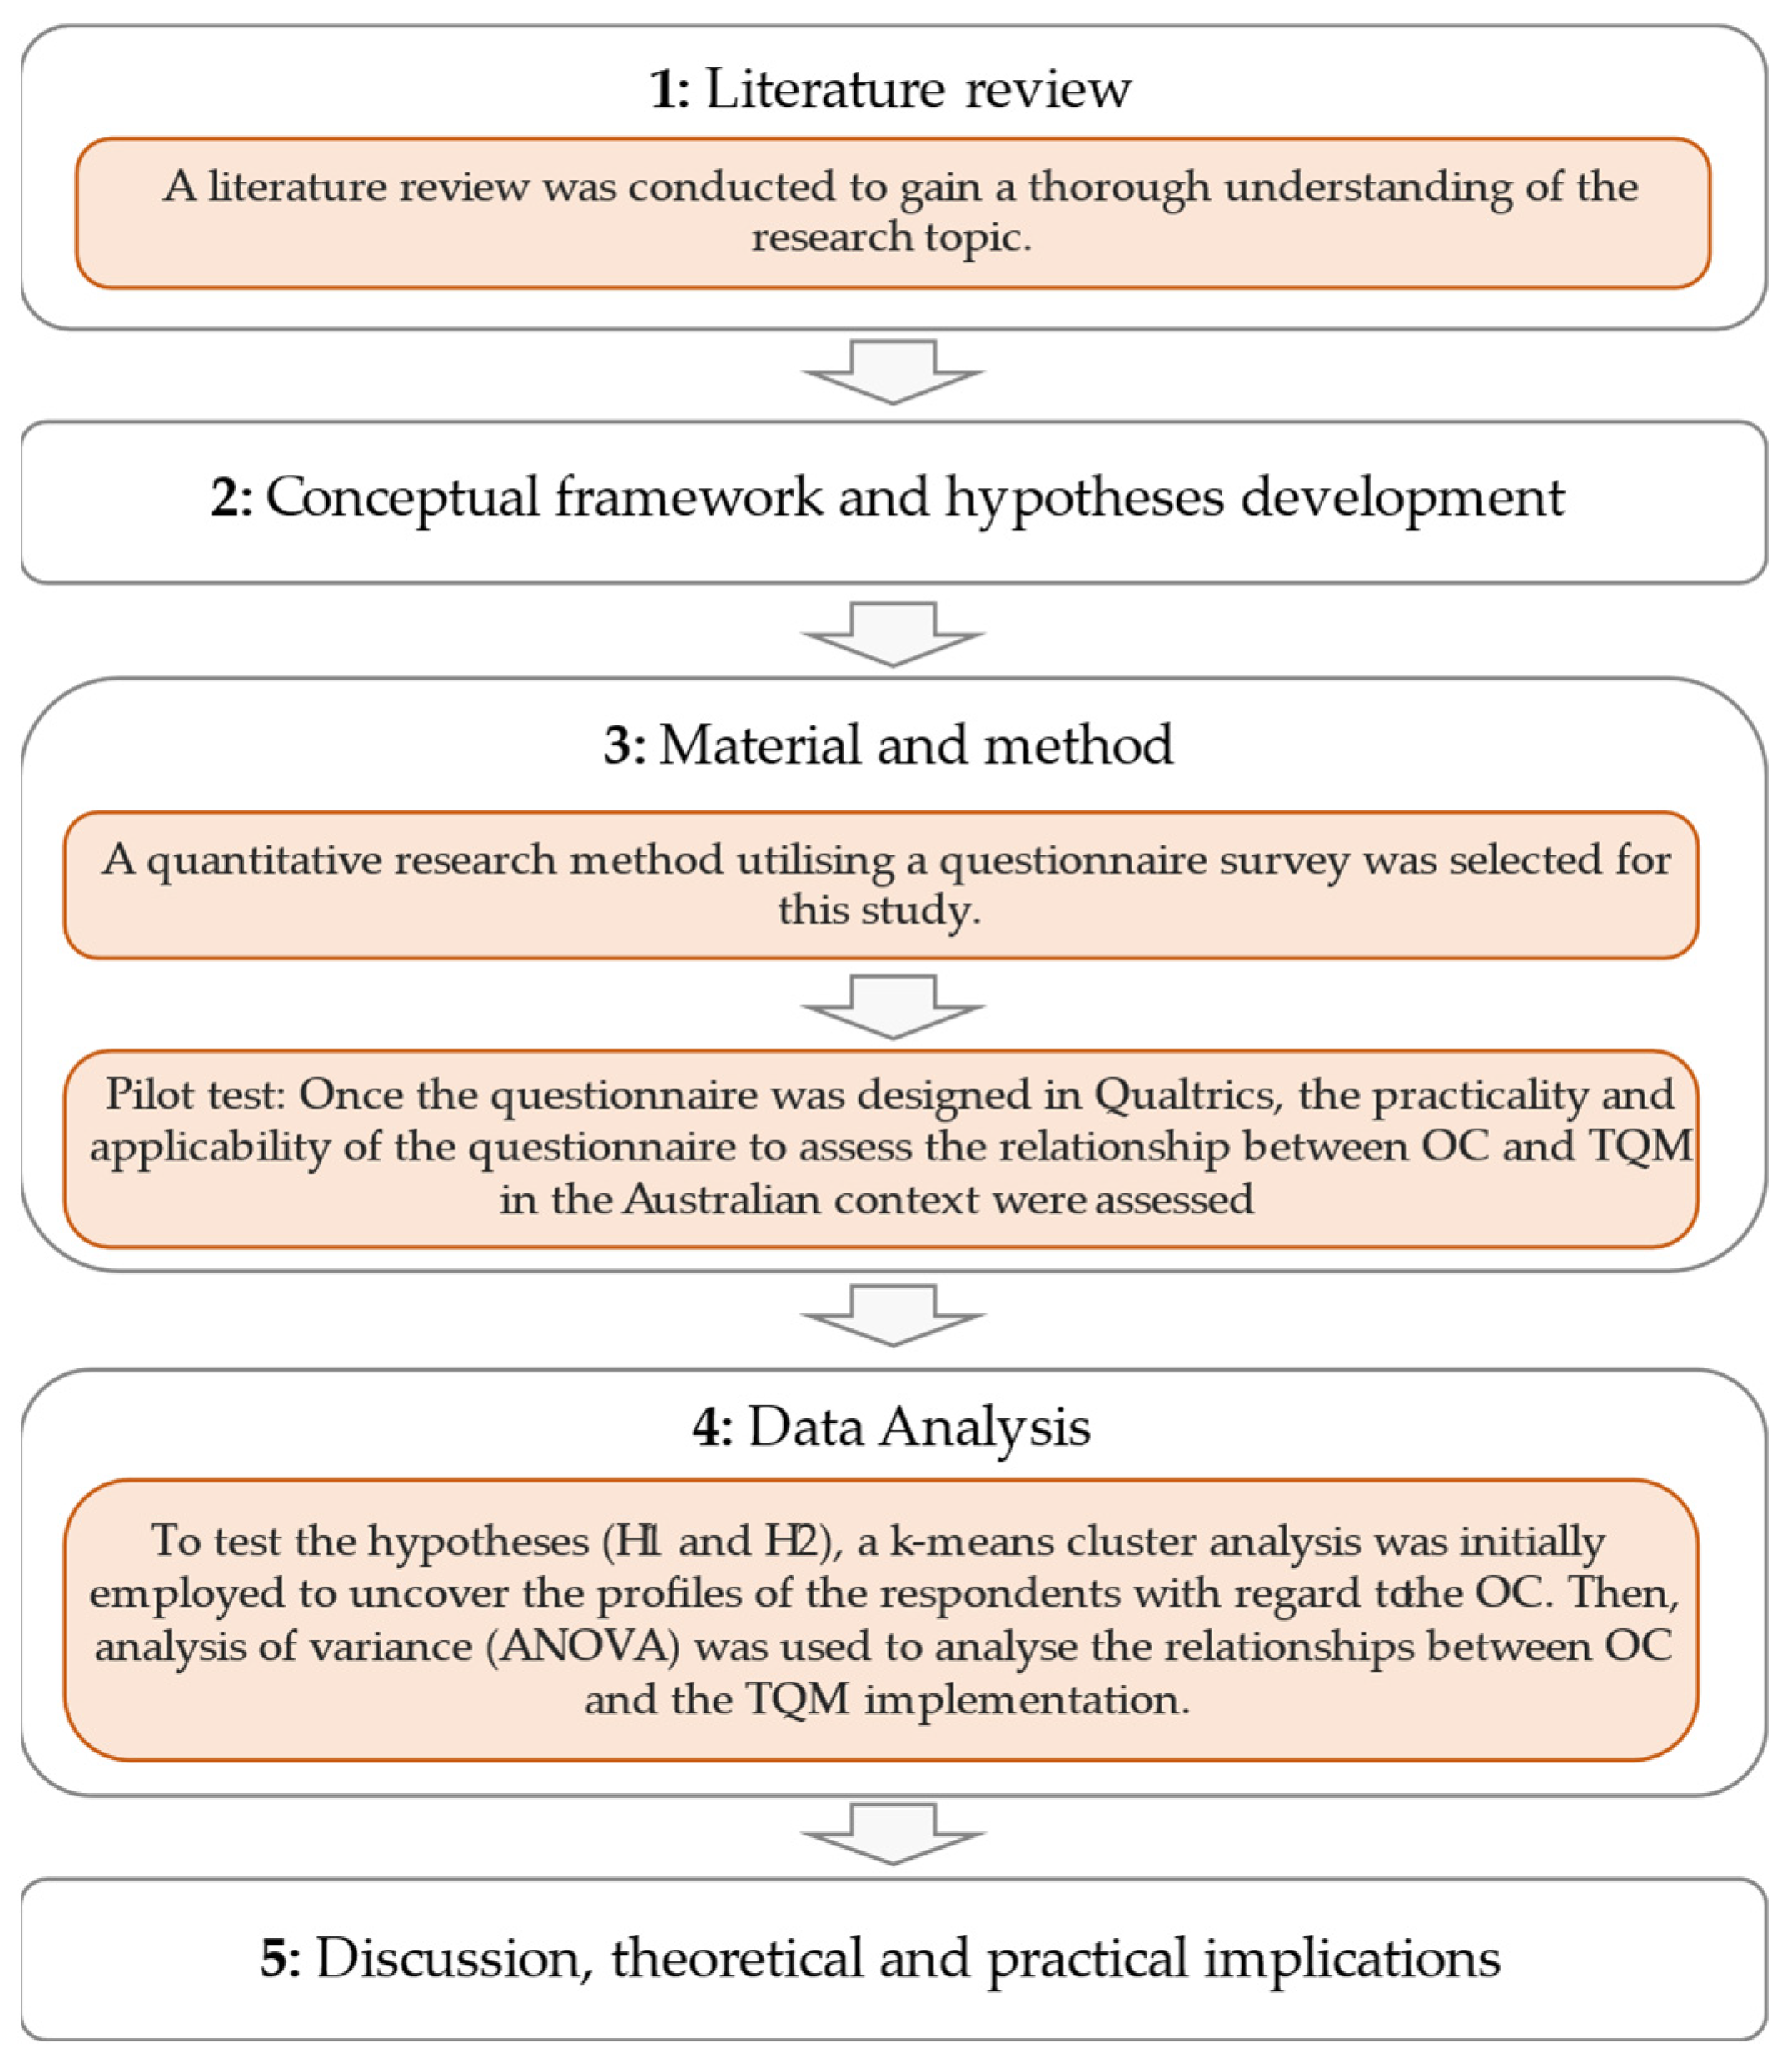
3. Research Methodology

Figure 1 depicts the research process. This research process provides an overview of the research components and their relationships. The following subsections discuss the various components of this figure in further detail.

3.1. Research Approach and Questionnaire Design

A quantitative research method utilising a questionnaire survey was selected for this study. An in-depth understanding of the research topic was gained through a literature review, followed by an analysis of quantitative data via the use of the OCAI developed by Cameron and Quinn [15]. The questionnaire was prepared according to the instructions given by Gillham [56] considering the clarity of language, good organisation for data collection, and ease to achieve research objectives. The questionnaire was designed in English and was distributed through Qualtrics, an online platform to administer the questionnaire. The distribution of the questionnaire was only executed once approval was granted for the negligible or low-risk research from the University of New South Wales Human Ethics Office. The questionnaire included three sections. The first section contained questions concerning the respondents and their organisational background, the second section included questions that aimed at assessing OC measures through utilising OCAI instrument, and the third section objectified the implementation of TQM integration within each respondent’s organisation.
To measure OC, this study endorsed four main cultural dimensions previously used in the study of Harinarain, et al. [57]. The aim of utilising the OCAI developed by Cameron and Quinn [15] was to investigate the core values, assumptions, interpretations, and approaches that characterise Australian construction organisations. The instrument entailed six components, including (1) dominant characteristics of the organisation, (2) style of organisational leadership, (3) management of employees, (4) organisational glue, (5) strategic emphasise of the organisation, and (6) success criteria, respectively. Each of the six components was described by four statements, and each of the four statements presented one of the four types of the OC according to the CVF. The four types of OCs were, respectively, (1) market, (2) clan, (3) hierarchical, and (4) adhocracy. The respondents were asked to distribute 100 points via a constant-sum scale across the four statements in a manner that best captures the characteristics of their organisations.
The study adopted seven TQM practices used by Jha and Iyer [58], and an additional factor presented by Androwis, et al. [59] as indicators of TQM implementation. However, only items that had normality based on the Kurtosis and Skewness indices were included. The respondents were asked to measure the TQM practices using a 5-point Likert Scale. The TQM practices employed were respectively: (1) top management commitment and leadership; (2) employee empowerment and participation; (3) customer focus and satisfaction; (4) training, education, and reward; (5) supplier management; (6) continuous improvement; (7) process control and improvement; and (8) information technology. The construct validity of the study was ensured by the logical assessment of the literature [60]. This process represents the extent to which the concept under research is represented by the scale’s items. Once the questionnaire was designed in Qualtrics, the practicality and applicability of the questionnaire to assess the relationship between OC and TQM in the Australian context were determined by sending the questionnaire to four experts, including two academics and two professionals with over 10 years of experience in quality management tools and techniques. The feedback was also requested to acknowledge, identify, and eliminate any errors existing in the online questionnaire. This process could be considered as a pilot stage. To test the hypotheses (H1 and H2), a k-means cluster analysis was initially employed to uncover the profiles of the respondents with regards to the OC. Then, analysis of variance (ANOVA) was used to analyse the relationships between OC and the TQM implementation.

3.2. Sampling Frame

Judgemental sampling was endorsed for this research to determine the type of targeted samples which was similarly done by Kriengsak and Thanh Tung [55]. Through this methodology, the researcher could ensure that the target population are suitable for the study, which enhances the ability of obtaining appropriate and usable responses. The sampling frame also utilised random sampling, convenience sampling, and snowball sampling to select appropriate respondents. The target population and sample of this research included organisational leaders, managers, experienced staff members, and/or contractors who were working in the Australian construction industry using publicly available contact details extracted from LinkedIn, Google, Instagram, and Facebook. An online questionnaire was administered to 213 individuals. A total of 42 valid responses were obtained, yielding a response rate of 19.7%, which was reasonable considering the normal rate of response in the construction industry [61]. Although the number of responses was relatively low, a statistical analysis could still be performed based on the central limit theorem that holds true if the sample size is more than 30.
The general characteristics of the respondents and characteristics of respondents’ organisations are presented in Table 1 and Table 2, respectively.
Table 2 indicates that 40.5% of respondents were from organisations with over 251+ employees, whilst only 19% of respondents belonged to organisations with 51 to 250 employees. Table 2 also represents the specific sector that respondents were involved in: 30.9% of the respondents belonged to organisations involved in commercial building, followed by organisations involved in infrastructure and planning/consultancy at 20%.

3.3. Data Analysis

The data obtained from the questionnaires were predominantly analysed using Microsoft Excel and IBM SPSS Statistics version 26, to assess their normality, to determine whether the results can be treated as a single dataset, to assess the OC profiles, and to assess the relationship between certain OC typologies and TQM practices. Preliminary analysis was executed through screening the dataset of all the individual responses to ensure the validity of responses, identifying any missing values, detecting outliers, and assessing normality. To identify any missing values, data screening was performed. In this step, three responses with missing data were removed from further analysis. Then, in order to detect outliers and to assess the normality, skewness and kurtosis statistics were conducted. Skewness refers to the symmetry of the data, whereas kurtosis acknowledges the pointiness of the data distribution [62]. The assumption of multivariate normality was to be ensured, with skewness and kurtosis indicated values larger than 5.00 to indicate non-normally distributed data [63]. Based on the analysis, “Employee empowerment and participation” and “Continuous improvement” represented kurtosis values of 5.009 and 5.011, respectively; thus, they represented non-normally distributed data. All the variables resulted in the values of skewness ranging from −1.853 to 0.877. Thus, the two variables which did not represent a normal distribution were removed from the study to enable the data to be assessed as normal. After removing those variables, the final values of skewness ranged from −1.853 to 0.877 and the values of kurtosis ranged from −1.252 to 1.795, indicating a normal distribution [64]. The reliability test was also performed on the data set of TQM practices and OC to assess the data reliability. In this regard, Cronbach’s coefficient alpha was calculated. Based on Pallant [65], when there are fewer than 10 items in a scale, the Cronbach alpha values can be relatively small and reliability between 0.5 and 0.6 is considered sufficient. Results indicated that Cronbach’s was 0.904, and therefore fell within the range. Following the attainment of main results of the study, a focus group discussion approach can be employed in order to further validate the results obtained [66,67,68].
Analysis of variance (ANOVA) was utilised to compare the different respondent groups to analyse and identify whether or not the data are homogenous across the groups. Based on the findings, the researcher can decide whether or not to maintain the data as a single data set or to separate the data into different sets for subsequent analyses [55]. The respondents were organised into different groups based on their experience, the size of their organisation, and the construction sector(s) that the organisation operated within. It was determined that the size of the organisations and the construction sector(s) that the organisations operated within might have more effects on the respondents’ perceptions than other factors. Therefore, a One-Way Analysis of Variance test (One-Way ANOVA) was performed on these factors. The values of F-statistics, mean differences and effect size identified that there were no significant differences among all the variables based on the size of the organisation and the construction sector(s) that the organisation operated within. In addition, this study empirically analysed the organisational factors such as Market, Clan, Hierarchy, and Adhocracy in four different clusters to compare the differences among means of clusters for four different organisational types. Therefore, the most suitable statistical technique to compare the means is ANOVA.

4. Results and Discussion

4.1. Organisational Culture of the Australian Construction Industry

The core part of this research study is derived through the use of the OCAI and follows the measurement methodology mentioned earlier. The average scores for all the participants indicating the current culture types of each organisation are displayed in Table 3. The findings highlight that the current dominant OC of the Australian construction organisations within the sample is the clan culture, with the highest mean of 29.44. This indicates that there is an expectation that individuals within the organisations are self-reliant, displaying initiative, and are rewarded based on their performance. Therefore, this study signifies that it is the clan culture that dominates the Australian construction industry, which challenges Hofstede [69]’s individualism score of the Australian culture. Furthermore, this finding of the Australian construction industry is contrary to that of Maloney and Federle [70] and the insight from Igo and Skitmore [71], who identified that the market culture was the dominant culture of the single, large, Australian engineering, procurement, and construction management consultancy. It is notable that the clan culture has the highest scores for four of the six cultural key dimensions.
The next dominant culture in the Australian construction industry is the market, with a mean value of 25.68. The insight is consistent with Hofstede [69]’s model of national cultures, which indicated a high score on the dimension of masculinity. The high score indicates that Australian society is driven by competition, achievement, and success through sharing goals whereby success is defined by winning, which aligns with the characteristics of the market culture.
The subsequent dominant culture in the Australian construction industry is hierarchy, with a mean value of 24.37. Unlike the insight between masculinity and the market culture, this insight argues against the alignment between national culture and OCs. According to Hofstede [69]’s model of national culture, Australia has been described as obtaining a relatively low score on the power distance value dimensions. This suggests that there is relative equality in societal and organisational authority structures [72]. The hierarchy culture suggests that the work environment is formalised and structured, with procedures governing actions which suggest that there is relative inequality in societal and organisational structures [73]. Therefore, Hofstede [69]’s power-distance rankings of Australia are endorsed by the hierarchical culture being the second least dominant typology of this study.
Lastly, the adhocracy culture was the least dominant culture of the four typologies measured in this study, at 20.57. This insight aligns with the characteristics of the construction industry as it is predominantly focused on achieving the objectives of the clients rather than being characterised by an entrepreneurial environment that appreciates internal initiative and liberty [8,15]. The average results of the overall Australian sample can be examined in greater detail through the sample subcategories, as presented in Table 4, Table 5, Table 6 and Table 7, which are analysed in the following sections of this paper.

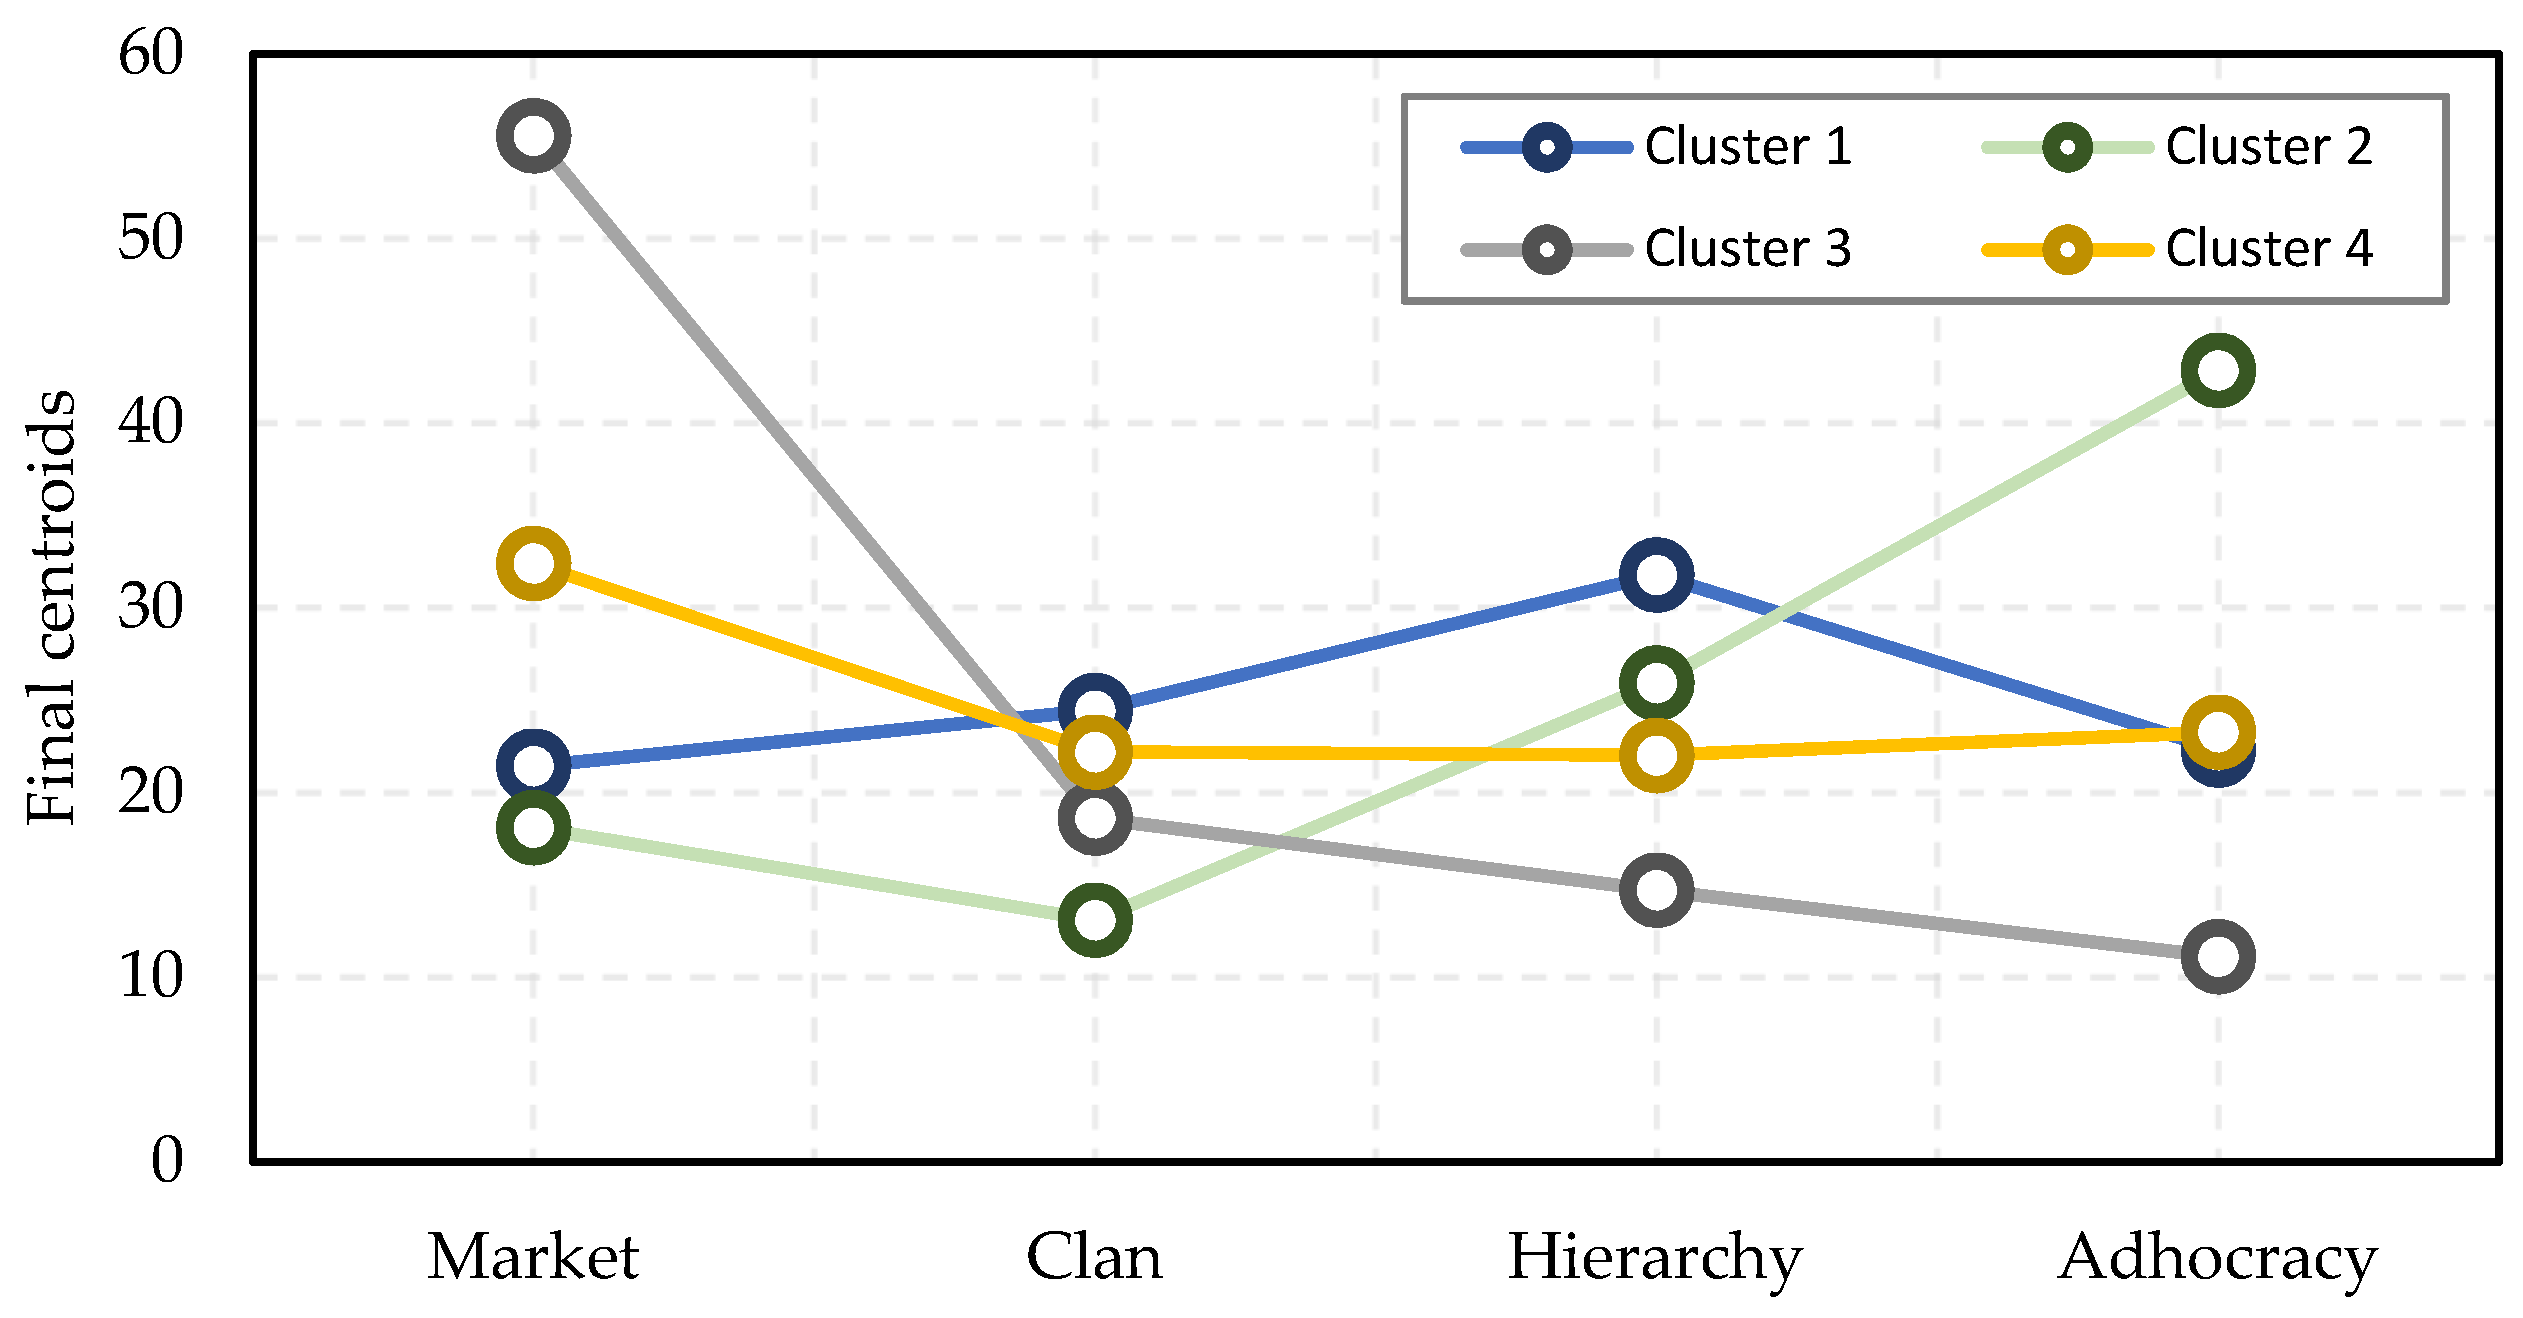
4.2. Organisational Culture Cluster Analysis

Through IBM SPSS Statistics 26, a hierarchical cluster analysis was first utilised to organise the combined surveyed respondents’ organisations into clusters that represent cultural configurations of organisations that possess similar cultural characteristics. This was completed as Dellana and Hauser [74] acknowledged that each organisation does not solely resemble one single culture, rather a combination of cultures with some being more dominant than others. The hierarchical cluster analysis utilised the Ward’s method, and squared Euclidean distance as the distance measurement, which had previously been performed by Giritli, et al. [75] and Kriengsak and Thanh Tung [55] in similar studies. The results from the hierarchical cluster analysis presented four underlying clusters of cultures among the surveyed respondents’ organisations. Subsequently, a k-means cluster analysis was executed, inputting the four-cluster solution from the hierarchical cluster analysis. The results illustrated in Table 4 acknowledge that the final centroids of the four clusters were all significant (the significant values of the F-statistic test are less than 0.05) across all the four factors of organisational clusters.
The results were transferred onto Figure 2 to present the centroid plots of the four clusters.
According to Table 4, the four articulated clusters illustrate four distinctive combinations of the OC factors. Firstly, cluster 1 (n = 14) is dominated by the hierarchy (31.79) and clan (24.46) cultures. Secondly, cluster 2 (n = 7) is dominated by the adhocracy (42.86), and hierarchy (25.95) cultures. Thirdly, cluster 3 (n = 6) is strongly dominated by the market culture (55.56). Finally, cluster 4 (n = 15) is predominantly dominated by market (32.4), and sequentially by adhocracy (23.27) cultures. Based on the CVF, the four formulated clusters can be distinguished through endorsing certain aspects of the two key dimensions which were identified by Cameron and Quinn [15]. The first cluster can be named internal focus, followed by the second cluster being acknowledged as balance focus, whilst the third cluster can be identified as market focus, and finally, the fourth cluster as external focus.
Table 5 illustrates the descriptive statistics regarding the construction sectors of the four cultural clusters. As is depicted in Table 5, the commercial building organisations from the sample are predominantly dominated by an internal focus cluster, with 7 of the 17 commercial building organisations possessing hierarchical and adhocracy cultural characteristics. The insight aligns with Ankrah and Langford [76]’s study, who argued that contracting organisations in the construction industry obtain a nature which is of formal procedures, activities are standardised and made into a routine, which is also a characteristic of the hierarchy culture. Moreover, this finding partially supports the study of Giritli, Öney-Yazıcı, Topçu-Oraz and Acar [75], who identified that contracting firms in the construction organisation was also dominated by a mixed cluster entailing hierarchical characteristics.
Through the exploration of cultural clusters among organisations of different sizes, evident in Table 6, it has been found that relatively medium-to-large organisations, which obtain a size between 51–250, possess an internal focus through hierarchical and clan characteristics. Contrary to the results of this study, Oney-Yazıcı, et al. [77] supported the notion that it is rather small organisations which obtain a strong emphasis on hierarchy and clan characteristics. This study further challenges Oney-Yazıcı, Giritli, Topcu-Oraz and Acar [77], as the three small organisations surveyed belong to an externally focused culture, entailing market and adhocracy cultures. Sandrk Nukic and Huemann [78] acknowledged that organisations with more than 500 employees could be identified as a market-type culture, whilst in this study, the market focus culture was represented mainly by small organisations. Although 7 of the 14 responses in the internal focus cluster, which does entail market characteristics, do represent an organisation of more than 251 employees, hence the findings are partially supported by Sandrk Nukic and Huemann [78] findings. Perhaps, it would be interesting to examine the discrepancies of the departments within those organisations which obtain more than 251 employees. Furthermore, 7 of the 14 organisations in the internal focus cluster, which entailed hierarchical and clan cultural characteristics, were from organisations of more than 251+ employees; hence this partially supports the notion that Cameron and Quinn [15] argue, i.e., that large organisations are generally dominated by hierarchical cultures.

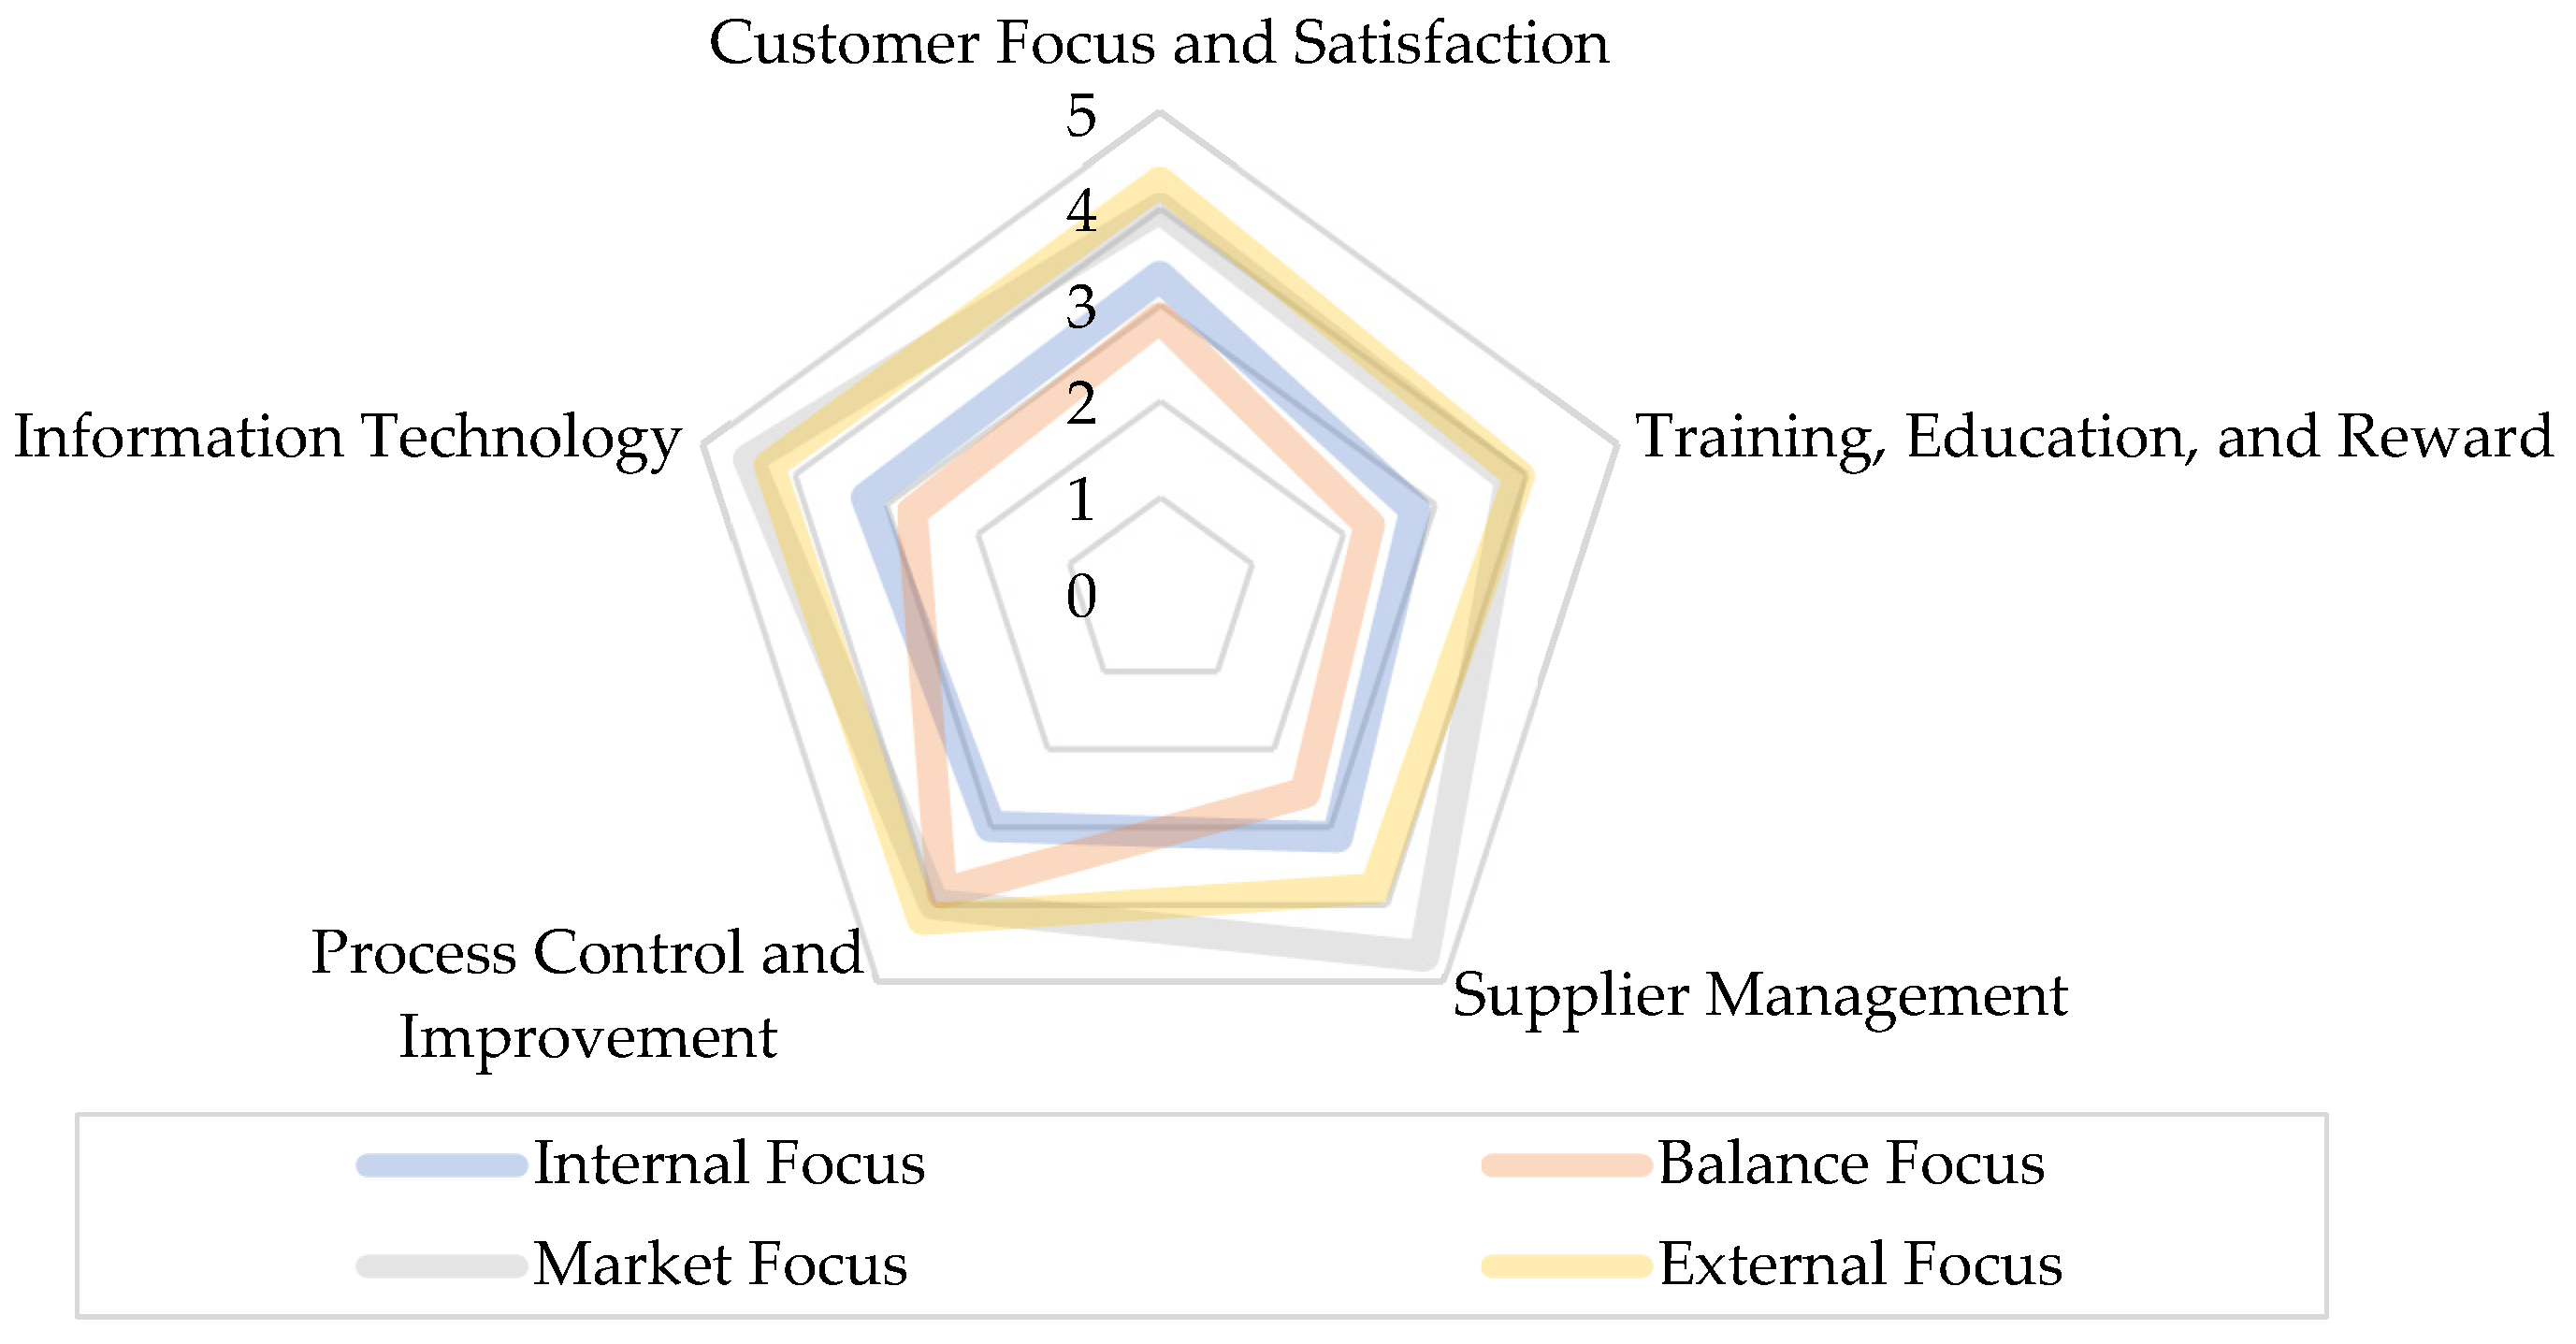
4.3. Organisational Culture and TQM Practices Analysis

Subsequentially, through the k-means cluster analysis, an analysis of variance was executed to analyse the differences of each of the eight TQM practices between the four clusters (Table 7).
The results illustrate that the significant values of all six TQM practices are below 0.05. This implies that there are significant differences between the mean scores due to the level of significance being less than 0.05 for certain dependent variables across the four clusters. The comparison can be further presented in Figure 3.
Results from the cluster analysis propose that the internal focus, market focus, and external focus clusters obtain similar and relatively high mean values, ranging from 2.79 to 4.67 for each of the six significant TQM practices. These values are statistically different from those of the balance focus cluster, ranging from 2.29 to 4. Hence, this supports that the external focus and market focus, are most favourable for TQM then followed by the balance focus and then internal focus clusters. In focus, and in order, the most favourable clusters for TQM integration are the external focus, market focus, balance focus, and then internal focus.

4.4. Organisational Culture and Use of TQM

As described earlier and illustrated through the cluster analyses results, the internal focus culture is overshadowed by the hierarchy and clan cultures. This type of culture focuses on enhancing formalisation and embracing collectivism through teamwork. There is a focus on internal procedures which fosters socio-technical systems and gain through human resource development, stability, and mutual consensus [15]. Moreover, the balance focus culture entailed adhocracy and hierarchical cultural characteristics, possessing a mixture of a dynamic entrepreneurial environment through the appreciation of individual initiative and liberty and the application of measurement and quality tools [15], whilst the market focus culture is concerned with the external environment through transaction costs, hence outpacing competitors through being the market leader [15]. Additionally, the external focus cultural conglomerate is dominated by the market and adhocracy typologies. This cluster emphasises the combination of embracing individual initiative and liberty by fostering an entrepreneurial environment, which aids in endorsing external competitiveness by focusing on developing competitive advantages [15]. Based on the analysis of the clusters and TQM integration, it is evident that the external and market focus clusters, which entail a mix of market and adhocracy cultural characteristics, are more favourable for TQM integration than the internal focus and balance focus clusters, which entail a mix of the hierarchy, clan, and adhocracy cultural characteristics.
As previously mentioned, the external focus cluster, which entails the market and adhocracy cultural characteristics, is the most favourable cluster towards TQM integration. Hence, these insights reinforce the significant role of the adhocracy typology for successful implementation as previously acknowledged by various scholars [4,55,74]. Further supported by Gimenez-Espin, Jiménez-Jiménez and Martínez-Costa [4], the culture for TQM obtains a mixed culture entailing the adhocracy typology. Despite the fact that that this cluster entails both the adhocracy and market cultural characteristics, Dellana and Hauser [74] argued that one typology of the CVF may be more important than the other when it comes to determining TQM success, emphasising that when TQM is initially implemented into an organisation, there may be a form of resistance due to change. The study argues that cultures that possess either a market and/or adhocracy typology are both flexibly oriented, and are supported through decentralisation, and differentiation, whilst control-oriented firms support centralisation and integration. Moreover, this study supports Igo and Skitmore [71]’s insight, that Australia is dominated by a culture which entails market characteristics. Hence, within those market and/or adhocracy-dominated cultures, the resistance to TQM integration is lessened due to their flexible nature, which may support why this study has found that the culture which obtains the adhocracy characteristics is the most favourable for TQM integration. Therefore, the first proposed hypothesis, (H1) Australian construction organisations dominated by either clan or adhocracy cultures positively influence the success of total quality management implementation can be supported.
Previous scholars argued that the hierarchy culture either does not have any connections to TQM implementation or has negative relationships with TQM [74,79]. This study acknowledges similar insights, whereby the internal and balance focus cultures entailed hierarchical characteristics and were the least favourable for TQM implementation. The results acknowledge that the internal and balance focus clusters obtained lower scores on numerous constructs of TQM than those of the market and external focus clusters. Therefore, this suggested that the internal and balance focus clusters, which entailed hierarchical characteristics, were the least favourable for TQM implementation. Therefore, the second proposed hypothesis, (H2) Australian construction organisations dominated by a hierarchy and/or market culture can negatively influence the success of total quality management implementation, can be accepted. This insight is consistent with the findings of [4,55], whereby the excessive focus on internal control may lead to the diminishing of freedom, and responsibility to participate and innovate mutually towards continuous organisational improvement.

5. Conclusions

This study endorsed the application of TQM as a tool which Australian construction organisations can utilise to improve their competitive position through improved performance as globalisation continues to accelerate competition. Thus, the study explored the notion of which types of OCs are more favourable than others for the successful implementation of TQM. The organisational cultural profile of Australian construction organisations appears to present the dominant characteristics of the external focus culture. This cultural typology was identified to entail a market and adhocracy focus as classified according to the results of the cluster analysis. Furthermore, the cluster analysis results acknowledged that the market focus and external focus clusters were most favourable for the implementation of TQM. Hence, it could be suggested that through these findings, certain Australian construction organisations generally provide an environment that fosters TQM application and integration. However, the internal focus and balance focus clusters were least favourable for the implementation of TQM. Therefore, this study highlights the importance of organisations’ ability to adapt varying objectives to enable diverse structures which endorse flexibility through different management styles, between control and flexibility, and internal and external orientations, in order to gain from the implementation of TQM.
This study is not without limitations. Firstly, the adoption of non-probability sampling techniques affects the generalisation of findings. Secondly, not all states and territories of Australia were analysed, which might have limited the scope of cultural profiles in the Australian construction industry. Thirdly, the limited sample size entailed in this study may not represent all construction organisations across the Australian construction industry. Hence, a larger sample would be required to address this limitation in future research. In this regard, future studies need to sample a larger number of respondents with similar job titles in order to provide a more homogenous and robust level of influence of organisational culture on total quality management implementation in the Australian construction industry.

Author Contributions

C.C.: writing—original draft, conceptualization, methodology, formal analysis, software; M.M.: writing—review and editing, supervision; K.K.: writing—review and editing, methodology; M.Y.: writing—review and editing, visualization. All authors have read and agreed to the published version of the manuscript.

Funding

This research received no external funding.

Institutional Review Board Statement

Not applicable.

Informed Consent Statement

Informed consent was obtained from all subjects involved in the study.

Data Availability Statement

Some or all data, models, or code generated or used during the study are available from the corresponding author by request.

Conflicts of Interest

The authors declare no conflict of interest.

References

  1. Zoghi, M.; Lee, D.; Kim, S. A computational simulation model for assessing social performance of BIM implementations in construction projects. J. Comput. Des. Eng. 2021, 8, 799–811. [Google Scholar] [CrossRef]
  2. Jang, J.; Ahn, S.; Cha, S.H.; Cho, K.; Koo, C.; Kim, T.W. Toward productivity in future construction: Mapping knowledge and finding insights for achieving successful offsite construction projects. J. Comput. Des. Eng. 2021, 8, 1–14. [Google Scholar] [CrossRef]
  3. Banobi, E.T.; Jung, W. Causes and Mitigation Strategies of Delay in Power Construction Projects: Gaps between Owners and Contractors in Successful and Unsuccessful Projects. Sustainability 2019, 11, 5973. [Google Scholar] [CrossRef] [Green Version]
  4. Gimenez-Espin, J.A.; Jiménez-Jiménez, D.; Martínez-Costa, M. Organizational culture for total quality management. Total Qual. Manag. Bus. Excell. 2013, 24, 678–692. [Google Scholar] [CrossRef]
  5. Pattanayak, D.; Koilakuntla, M.; Punyatoya, P. Investigating the influence of TQM, service quality and market orientation on customer satisfaction and loyalty in the Indian banking sector. Int. J. Qual. Reliab. Manag. 2017, 34, 362–377. [Google Scholar] [CrossRef]
  6. Akanji, B.; Mordi, C.; Ituma, A.; Adisa, T.A.; Ajonbadi, H. The influence of organisational culture on leadership style in higher education institutions. Pers. Rev. 2020, 49, 709–732. [Google Scholar] [CrossRef] [Green Version]
  7. Haffar, M.; Al-Karaghouli, W.; Djebarni, R.; Gbadamosi, G. Organisational culture and TQM implementation: Investigating the mediating influences of multidimensional employee readiness for change. Total Qual. Manag. Bus. Excell. 2019, 30, 1367–1388. [Google Scholar] [CrossRef] [Green Version]
  8. Teravainen, V.; Junnonen, J.-M.; Ali-Loytty, S. Organizational culture: Case of the Finnish construction industry. Constr. Econ. Build. 2018, 18, 48. [Google Scholar] [CrossRef] [Green Version]
  9. García-Bernal, J.; Ramírez-Alesón, M. Why and How TQM Leads to Performance Improvements. Qual. Manag. J. 2015, 22, 23–37. [Google Scholar] [CrossRef]
  10. Patyal, V.S.; Koilakuntla, M. Relationship between organisational culture, quality practices and performance: Conceptual framework. Int. J. Product. Qual. Manag. 2016, 19, 319–344. [Google Scholar] [CrossRef]
  11. Prince, M.; Palihawadana, D.; Davies, M.A.P.; Winsor, R.D. An Integrative Framework of Buyer–Supplier Negative Relationship Quality and Dysfunctional Interfirm Conflict. J. Bus. Bus. Mark. 2016, 23, 221–234. [Google Scholar] [CrossRef] [Green Version]
  12. Patyal, V.S.; Ambekar, S.; Prakash, A. Organizational culture and total quality management practices in Indian construction industry. Int. J. Product. Perform. Manag. 2020, 69, 895–913. [Google Scholar] [CrossRef]
  13. Losonci, D.; Kása, R.; Demeter, K.; Heidrich, B.; Jenei, I. The impact of shop floor culture and subculture on lean production practices. Int. J. Oper. Prod. Manag. 2017, 37, 205–225. [Google Scholar] [CrossRef]
  14. Quinn, R.E.; Rohrbaugh, J. A Spatial Model of Effectiveness Criteria: Towards a Competing Values Approach to Organizational Analysis. Manag. Sci. 1983, 29, 363–377. [Google Scholar] [CrossRef] [Green Version]
  15. Cameron, K.S.; Quinn, R.E. Diagnosing and Changing Organizational Culture: Based on the Competing Values Framework; John Wiley & Sons: Hoboken, NJ, USA, 2011. [Google Scholar]
  16. Low, W.W.; Abdul-Rahman, H.; Zakaria, N. Organisational culture of Malaysian international construction organisations. Int. J. Constr. Manag. 2020, 20, 105–121. [Google Scholar] [CrossRef]
  17. Atuahene, B.T.; Baiden, B.K. Organizational culture of Ghanaian construction firms. Int. J. Constr. Manag. 2018, 18, 177–188. [Google Scholar] [CrossRef]
  18. Worrall, L. Organizational cultures: Obstacles to women in the UK construction industry. J. Psychol. Issues Organ. Cult. 2012, 2, 6–21. [Google Scholar] [CrossRef] [Green Version]
  19. Othman, I.; Norfarahhanim Mohd Ghani, S.; Woon Choon, S. The Total Quality Management (TQM) journey of Malaysian building contractors. Ain Shams Eng. J. 2020, 11, 697–704. [Google Scholar] [CrossRef]
  20. Sharma, S.; Modgil, S. TQM, SCM and operational performance: An empirical study of Indian pharmaceutical industry. Bus. Process Manag. J. 2020, 26, 331–370. [Google Scholar] [CrossRef]
  21. Cottman, R.J. Total Engineering Quality Management; CRC Press: Boca Raton, FL, USA, 2020. [Google Scholar]
  22. Soltani, E.; Wilkinson, A. TQM and Performance Appraisal: Complementary or Incompatible? Eur. Manag. Rev. 2020, 17, 57–82. [Google Scholar] [CrossRef]
  23. Beraldin, A.R.; Danese, P.; Romano, P. Employee involvement for continuous improvement and production repetitiveness: A contingency perspective for achieving organisational outcomes. Prod. Plan. Control 2020, 1–17. [Google Scholar] [CrossRef]
  24. Karia, N.; Mahmoud Saleh, F.I. The effect of TQM practices on INGOs’ staff work-related attitudes. Benchmarking Int. J. 2022, 29, 596–621. [Google Scholar] [CrossRef]
  25. Puthanveettil, B.A.; Vijayan, S.; Raj, A.; Mp, S. TQM implementation practices and performance outcome of Indian hospitals: Exploratory findings. TQM J. 2021, 33, 1325–1346. [Google Scholar] [CrossRef]
  26. Kebede Adem, M.; Virdi, S.S. The effect of TQM practices on operational performance: An empirical analysis of ISO 9001: 2008 certified manufacturing organizations in Ethiopia. TQM J. 2021, 33, 407–440. [Google Scholar] [CrossRef]
  27. Mukhopadhyay, M. Total Quality Management in Education; SAGE Publications Pvt. Limited: Newcastle upon Tyne, UK, 2020. [Google Scholar]
  28. Harrington, H.J.; Voehl, F.; Wiggin, H. Applying TQM to the construction industry. TQM J. 2012, 24, 352–362. [Google Scholar] [CrossRef]
  29. Reinaldo, L.d.S.P.; Vieira Neto, J.; Goyannes Gusmão Caiado, R.; Gonçalves Quelhas, O.L. Critical factors for total quality management implementation in the Brazilian construction industry. TQM J. 2021, 33, 1001–1019. [Google Scholar] [CrossRef]
  30. Babatunde, O.K. A reprise of TQM practices among construction enterprises in Nigeria. TQM J. 2021; ahead-of-print. [Google Scholar] [CrossRef]
  31. Alawag, A.M.; Alaloul, W.S.; Liew, M.S.; Al-Aidrous, A.H.M.H.; Saad, S.; Ammad, S. Total Quality Management Practices and Adoption in Construction Industry Organizations: A Review. In Proceedings of the 2020 2nd International Sustainability and Resilience Conference: Technology and Innovation in Building Designs (51154), Sakheer, Bahrain, 11–12 November 2020; pp. 1–6. [Google Scholar]
  32. Dewan, R.; Patel, A.S.; Kuraishy, M.O. Implementation of Total Quality Management in Construction Industry. In Proceedings of Advances in Environment Engineering and Management; Springer: Cham, Switzerland, 2021; pp. 251–266. [Google Scholar]
  33. Shoshan, A.A.A.; Çelik, G. Application of TQM in the construction industry of developing countries-Case of Turkey. Anadolu Univ. J. Sci. Technol. A-Appl. Sci. Eng. 2018, 19, 177–191. [Google Scholar] [CrossRef]
  34. Sinha, N.; Dhall, N. Mediating effect of TQM on relationship between organisational culture and performance: Evidence from Indian SMEs. Total Qual. Manag. Bus. Excell. 2020, 31, 1841–1865. [Google Scholar] [CrossRef]
  35. Mohammad Mosadeghrad, A. Why TQM programmes fail? A pathology approach. TQM J. 2014, 26, 160–187. [Google Scholar] [CrossRef] [Green Version]
  36. Schabracq, M.J. Changing Organizational Culture: The Change Agent’s Guidebook; John Wiley & Sons: Hoboken, NJ, USA, 2007. [Google Scholar]
  37. Schein, E.H. Organizational Culture and Leadership; John Wiley & Sons: Hoboken, NJ, USA, 2010; Volume 2. [Google Scholar]
  38. Willar, D.; Trigunarsyah, B.; Coffey, V. Organisational culture and quality management system implementation in Indonesian construction companies. Eng. Constr. Archit. Manag. 2016, 23, 114–133. [Google Scholar] [CrossRef] [Green Version]
  39. Haffar, M.; Al-Hyari, K.A.; Djebarni, R.; Al-Shamali, A.; Abdul Aziz, M.; Al-Shamali, S. The myth of a direct relationship between organizational culture and TQM: Propositions and challenges for research. TQM J. 2021; ahead-of-print. [Google Scholar] [CrossRef]
  40. Sugita, M.; Takahashi, T. Influence of Corporate Culture on Environmental Management Performance: An Empirical Study of Japanese Firms. Corp. Soc. Responsib. Environ. Manag. 2015, 22, 182–192. [Google Scholar] [CrossRef]
  41. Tong, Y.K.; Arvey, R.D. Managing complexity via the Competing Values Framework. J. Manag. Dev. 2015, 34, 653–673. [Google Scholar] [CrossRef]
  42. Lee, K.-H.; Herold, D.M.; Yu, A.-L. Small and Medium Enterprises and Corporate Social Responsibility Practice: A Swedish Perspective. Corp. Soc. Responsib. Environ. Manag. 2016, 23, 88–99. [Google Scholar] [CrossRef]
  43. Nguyen, P.T.; Yandi, A.; Mahaputra, M.R. Factors That Influence Employee Performance: Motivation, Leadership, Environment, Culture Organization, Work Achievement, Competence And Compensation (A Study Of Human Resource Management Literature Studies). Dinasti Int. J. Digit. Bus. Manag. 2020, 1, 645–662. [Google Scholar]
  44. Chatterjee, A.; Pereira, A.; Bates, R. Impact of individual perception of organizational culture on the learning transfer environment. Int. J. Train. Dev. 2018, 22, 15–33. [Google Scholar] [CrossRef]
  45. Camacho, H.; Coto, M.; Jørgensen, K.M. How Does Organisational Culture Influence the Process of Change towards PBL? J. Probl. Based Learn. High. Educ. 2018, 6, 32–57. [Google Scholar]
  46. Hald, E.J.; Gillespie, A.; Reader, T.W. Causal and Corrective Organisational Culture: A Systematic Review of Case Studies of Institutional Failure. J. Bus. Ethics 2021, 174, 457–483. [Google Scholar] [CrossRef]
  47. Alessandri, T.M.; Cerrato, D.; Eddleston, K.A. The mixed gamble of internationalization in family and nonfamily firms: The moderating role of organizational slack. Glob. Strategy J. 2018, 8, 46–72. [Google Scholar] [CrossRef]
  48. O’Reilly, C.A.; Chatman, J.; Caldwell, D.F. People and organizational culture: A profile comparison approach to assessing person-organization fit. Acad. Manag. J. 1991, 34, 487–516. [Google Scholar] [CrossRef] [Green Version]
  49. Gray, M.; Allegritti, I. Towards culturally sensitive social work practice: Re-examining cross-cultural social work. Soc. Work-Stellenbosch 2003, 39, 312–325. [Google Scholar]
  50. Van Huy, N.; Thu, N.T.H.; Anh, N.L.T.; Au, N.T.H.; Phuong, N.T.; Cham, N.T.; Minh, P.D. The validation of organisational culture assessment instrument in healthcare setting: Results from a cross-sectional study in Vietnam. BMC Public Health 2020, 20, 316. [Google Scholar] [CrossRef] [PubMed]
  51. Ližbetinová, L.; Lorincová, S.; Caha, Z. The application of the organizational culture assessment instrument (OCAI) to logistics enterprises. NAŠE MORE Znan. Čas. Za More Pomor. 2016, 63, 170–176. [Google Scholar] [CrossRef]
  52. Georgiev, S.; Ohtaki, S. Critical success factors for TQM implementation among manufacturing SMEs. Benchmarking Int. J. 2020, 27, 473–498. [Google Scholar] [CrossRef]
  53. Krajcsák, Z. Successes of quality management systems through self-evaluation and commitment in different organizational cultures. Manag. Decis. 2018, 56, 1467–1484. [Google Scholar] [CrossRef]
  54. Kargas, A.D.; Varoutas, D. On the relation between organizational culture and leadership: An empirical analysis. Cogent Bus. Manag. 2015, 2, 1055953. [Google Scholar] [CrossRef]
  55. Kriengsak, P.; Thanh Tung, N. Influence of Organisational Culture on Total Quality Management Implementation and Firm Performance: Evidence from the Vietnamese Construction Industry. Manag. Prod. Eng. Rev. 2017, 8, 5–15. [Google Scholar] [CrossRef]
  56. Gillham, B. Developing a Questionnaire; A&C Black: London, UK, 2008. [Google Scholar]
  57. Harinarain, N.; Bornman, C.L.; Botha, M. Organisational culture of the South African construction industry. Acta Structilia 2013, 20, 22–43. [Google Scholar]
  58. Jha, K.N.; Iyer, K.C. Critical Factors Affecting Quality Performance in Construction Projects. Total Qual. Manag. Bus. Excell. 2006, 17, 1155–1170. [Google Scholar] [CrossRef]
  59. Androwis, N.; Sweis, R.J.; Tarhini, A.; Moarefi, A.; Hosseini Amiri, M. Total quality management practices and organizational performance in the construction chemicals companies in Jordan. Benchmarking Int. J. 2018, 25, 3180–3205. [Google Scholar] [CrossRef]
  60. Downing, S.M. Validity: On the meaningful interpretation of assessment data. Med. Educ. 2003, 37, 830–837. [Google Scholar] [CrossRef] [PubMed]
  61. Baruch, Y.; Holtom, B.C. Survey response rate levels and trends in organizational research. Hum. Relat. 2008, 61, 1139–1160. [Google Scholar] [CrossRef] [Green Version]
  62. Groeneveld, R.A.; Meeden, G. Measuring Skewness and Kurtosis. J. R. Stat. Soc. Ser. D 1984, 33, 391–399. [Google Scholar] [CrossRef]
  63. Mardia, K.V. Applications of Some Measures of Multivariate Skewness and Kurtosis in Testing Normality and Robustness Studies. Sankhyā Indian J. Stat. Ser. B 1974, 36, 115–128. [Google Scholar]
  64. West, S.G.; Finch, J.F.; Curran, P.J. Structural equation models with nonnormal variables: Problems and remedies. In Structural Equation Modeling: Concepts, Issues, and Applications; Sage Publications, Inc.: Thousand Oaks, CA, USA, 1995; pp. 56–75. [Google Scholar]
  65. Pallant, J. SPSS Survival Manual: A Step by Step Guide to Data Analysis Using IBM SPSS; Routledge: London, UK, 2020. [Google Scholar]
  66. Mohandes, S.R.; Sadeghi, H.; Fazeli, A.; Mahdiyar, A.; Hosseini, M.R.; Arashpour, M.; Zayed, T. Causal analysis of accidents on construction sites: A hybrid fuzzy Delphi and DEMATEL approach. Saf. Sci. 2022, 151, 105730. [Google Scholar] [CrossRef]
  67. Mohandes, S.R.; Abdelmageed, S.; Hem, S.; Yoo, J.S.; Abhayajeewa, T.; Zayed, T. Occupational Health and Safety in Modular Integrated Construction projects: The case of crane operations. J. Clean. Prod. 2022, 342, 130950. [Google Scholar] [CrossRef]
  68. Durdyev, S.; Mohandes, S.R.; Tokbolat, S.; Sadeghi, H.; Zayed, T. Examining the OHS of green building construction projects: A hybrid fuzzy-based approach. J. Clean. Prod. 2022, 338, 130590. [Google Scholar] [CrossRef]
  69. Hofstede, G. Culture’s Consequences: Comparing Values, Behaviors, Institutions and Organizations Across Nations; Sage Publications: Thousand Oaks, CA, USA, 2001. [Google Scholar]
  70. Maloney, W.F.; Federle, M.O. Practical Models for Organizational Assessment. J. Manag. Eng. 1993, 9, 64–81. [Google Scholar] [CrossRef]
  71. Igo, T.; Skitmore, M. Diagnosing the organizational culture of an Australian engineering consultancy using the competing values framework. Constr. Innov. 2006, 6, 121–139. [Google Scholar] [CrossRef] [Green Version]
  72. Goodman-Delahunty, J.; Martschuk, N.; Dhami, M.K. Interviewing High Value Detainees: Securing Cooperation and Disclosures. Appl. Cogn. Psychol. 2014, 28, 883–897. [Google Scholar] [CrossRef]
  73. Kim, J.S.; Han, S.-H. Examining the Relationship between Civil Servant Perceptions of Organizational Culture and Job Attitudes: In the Context of the New Public Management Reform in South Korea. Public Organ. Rev. 2017, 17, 157–175. [Google Scholar] [CrossRef]
  74. Dellana, S.A.; Hauser, R.D. Toward Defining the Quality Culture. Eng. Manag. J. 1999, 11, 11–15. [Google Scholar] [CrossRef]
  75. Giritli, H.; Öney-Yazıcı, E.; Topçu-Oraz, G.; Acar, E. The interplay between leadership and organizational culture in the Turkish construction sector. Int. J. Proj. Manag. 2013, 31, 228–238. [Google Scholar] [CrossRef]
  76. Ankrah, N.A.; Langford, D.A. Architects and contractors: A comparative study of organizational cultures. Constr. Manag. Econ. 2005, 23, 595–607. [Google Scholar] [CrossRef]
  77. Oney-Yazıcı, E.; Giritli, H.; Topcu-Oraz, G.; Acar, E. Organizational culture: The case of Turkish construction industry. Eng. Constr. Archit. Manag. 2007, 14, 519–531. [Google Scholar] [CrossRef]
  78. Sandrk Nukic, I.; Huemann, M. Organizational culture of the Croatian construction industry. Eng. Constr. Archit. Manag. 2016, 23, 237–260. [Google Scholar] [CrossRef]
  79. Zu, X.; Robbins, T.L.; Fredendall, L.D. Mapping the critical links between organizational culture and TQM/Six Sigma practices. Int. J. Prod. Econ. 2010, 123, 86–106. [Google Scholar] [CrossRef]
Figure 1. Research process.
Buildings 12 00496 g001
Figure 2. Centroid plots of four clusters.
Buildings 12 00496 g002
Figure 3. TQM practice contrast between the four clusters (clusters’ mean values).
Buildings 12 00496 g003
Table 1. Characteristics of respondents (N = 42).
Age Experience (Years)Number of RespondentsPercentage of Respondents
000%
<1921.4%
1–3614.3%
4–537.1%
6–9511.9%
10+1945.2%
Table 2. Characteristics of respondents’ organisations.
Number of OrganisationsPercentage of Organisations
Size (number of employees)
0–437.1%
5–1037.1%
11–501126.2%
51–250819.0%
251+1740.5%
Construction Sectors
Building (Residential)610.9%
Building (Commercial)1730.9%
Building (Infrastructure)1120.0%
Maintenance/Industrial Services59.1%
Planning/Consultancy Services1120.0%
Other59.1%
Table 3. Mean scores of the organisational culture dimensions of the sample (N = 42).
MarketClanHierarchyAdhocracy
Dominant characteristics24.7730.1224.3821.16
Organisational leadership27.8126.4024.6321.16
Management of employees28.2336.2315.7919.74
Organisational glue30.9129.8820.5618.65
Strategic emphasis23.2620.9830.3025.47
Success criteria19.1233.0530.5817.26
Cultural profile of sample25.6829.4424.3720.57
Table 4. ANOVA test result of cluster analysis.
OC FactorsCentroids ANOVA Test Statistics
Cluster 1 Cluster 2Cluster 3Cluster 4 FSig.
n = 14n = 7n = 6n = 15
Market21.4318.155.5632.4126.2540.000
Clan24.4613.118.6122.25.860.002
Hierarchy31.7925.9514.7222.0233.9550.000
Adhocracy22.3242.8611.1123.2747.7670.000
Table 5. Descriptive statistics of cultural clusters by construction sectors.
Construction SectorsNInternal FocusBalance FocusMarket FocusExternal Focus
n = 22n = 3n = 8n = 22
Building (residential)6 6
Building (commercial)177235
Building (infrastructure)114124
Maintenance/industrial services51 22
Planning/consultancy services116 14
Other54 1
Table 6. Descriptive statistics of cultural clusters by organisation size.
SizeNInternal FocusBalance FocusMarket FocusExternal Focus
0–43...3
5–103..3.
11–501144.3
51–25083.14
251+177325
Table 7. ANOVA test results comparing TQM practices between clusters.
TQM Practices Clusters’ Mean ValuesANOVA Test Statistics
Internal FocusBalance FocusMarket FocusExternal FocusFSig.
Top management commitment and leadership3.1443.54.333.8370.017
Customer focus and satisfaction3.292.8644.273.3890.028
Training, education, and reward2.792.293.833.934.7460.007
Supplier management3.142.574.673.84.4670.009
Process control and improvement33.8644.22.910.047
Information technology3.793.674.674.411.9450.000
Publisher’s Note: MDPI stays neutral with regard to jurisdictional claims in published maps and institutional affiliations.

