1. Introduction
Project configuration refers to the arrangement of project tasks to meet the client’s requirements [
1]. A well-designed project configuration results in a competitive advantage by enhancing client satisfaction [
2]. In construction projects, contractors are obligated to execute projects to fulfil clients’ expectations in terms of cost, time, and quality to remain in the competitive construction market [
3,
4,
5,
6]. Clients demand their desired project goals, and contractors should perform an appropriate trade-off between these goals [
7]. However, failure to recognise the external and internal factors creating the project risks leads to increased errors in managerial decisions, accurate estimation of project time and budget, and proper customisation based on client orders [
8]. In this regard, a well-defined project configuration can facilitate managing processes formally and systematically within the project framework during the project life cycle. Construction project configuration management aims to increase the likelihood of project successes through detecting/evaluating failure risks, providing some approaches to prevent or decrease these breakdowns, and maximising the opportunities [
9].
Various papers have shed light on the challenges and problems that are faced while performing tasks in construction projects. In mega construction projects performed in developing countries, improper decision making, not considering stakeholders’ consultation during the process, and lack of construction resources availability have been identified as challenges related to the design stage of construction projects [
10]. Regarding material delivery problems that occur in construction projects, the importance of flexible project management and availability of resources at task execution time have been indicated as influencing subjects [
11]. From the perspective of sustainable construction, problems like being over budget, being behind schedule, generating waste, polluting the environment and lacking resources are identified and expressed [
12]. Therefore, it is crucial to address challenges and problems faced in performing construction projects as they directly impact the contractor’s obligations and the client’s expectations as stakeholders in the project.
In order to improve construction project configuration, it is required to perform project tasks in accordance with the client’s requirements to increase client satisfaction. Previous studies that worked on project configuration improvement, didn’t provide solutions for issues incompatible with the client’s requirements. Therefore, it is necessary to first identify these issues and then investigate their causes, in order to take appropriate actions. While the time, cost, and quality of construction project implementation and improvement are significant factors that need to be considered thoroughly. Therefore, we were motivated to propose an approach capable of identifying and eliminating causes of issues incompatible with the client’s requirements in minimum time.
Thus, the main objective of this research is to develop a construction project configuration to provide a management tool for contractors to ensure high performance, which contains function, design, actualisation, audits, and change controls. This objective is addressed through the perspective of quality management and decision making as construction projects consist of various risks from design to implementation and contractors require aid in decision making when tackling problems faced in performing project tasks with respect to client’s requirements. Stakeholders in construction projects tend to deliver the project in minimum time and in accordance with the client’s needs. In the literature, no papers were found capable of identifying issues incompatible with the client’s needs and eliminating their causes to improve project configuration. Therefore, it was deemed necessary to propose an approach to address stakeholders’ objectives of delivering construction projects in minimum time and in line with the client’s needs. To the best of our knowledge, this is the first time that quality management techniques are integrated with multi-attribute decision-making (MADM) methods to propose an approach for construction project configuration. To better aid the contractor in a compromise between construction project goals through project configuration, an integrated fault tree analysis (FTA) with the failure modes and effect analysis (FMEA) tool is introduced for the improvement of construction project configuration based on causes of critical issues incompatible with client’s requirements which are selected by integrated analytical hierarchy process (AHP) and the technique for order preference by similarity to ideal solution (TOPSIS) method. In the proposed approach, the client’s needs and the market’s feedback are required to identify potential failures in fulfilling project goals. After identifying all potential failures, an integrated AHP-TOPSIS is applied to prioritise the most critical potential failures. Then, FTA is used to indicate minimal paths, and an inverse search in the operational model is performed to determine relevant tasks and to identify defective project tasks based on the work breakdown structure (WBS). Having identified minimal paths and defective project tasks, FMEA is applied to identify failure modes. In order to rank failure modes and select the most critical one, an integrated AHP-TOPSIS approach is utilised. Then, based on failure modes priority, corrective actions are performed, and project configuration is improved.
In addition, in this study, several construction resource suppliers are considered, and they have different policies, delivery lead times, warranty costs, and purchasing costs. In addition, different configuration systems such as series and parallel are taken into account in order to increase the probability of meeting client expectations. It is also possible to take advantage of redundancy allocation in terms of overtime for manpower and alternative material to increase the probability of accomplishing tasks in the desired time, in the resource constraint situations, or when the project is behind schedule. At last, in order to test the applicability of the proposed approach, the model is applied in a case study related to a building construction project.
The remainder of this paper is as follows:
Section 2 consists of the literature review of articles related to project configuration.
Section 3 involves the complete description of the proposed approach. The case study of this paper is presented in
Section 4, and
Section 5 includes the discussion. Finally, concluding remarks are mentioned in
Section 6.
2. Literature Review
This section examines several streams of previous research related to project configuration, particularly in the construction industry, and the methods used in the literature to improve configuration management, along with research gaps in four separate subsections.
2.1. Project Configuration
Project management is the application of processes, activities, approaches, knowledge, and skills to obtain specific project goals concerning the project acceptance criteria upon agreed parameters [
13]. In construction studies, project configuration and related topics have been defined and explored in a variety of ways, including managing changes, designing project management strategies, and defining appropriate sequences in work packages. Some researchers defined the project configuration as a method that project specialists can use to manage items throughout the project life cycle and make sure that their final deliverables are achievable within a finite timeframe and budget [
14]. Morozov, et al. [
15] developed a mathematical model for project configuration management by formulating the components of the project product, the characteristic of project tasks, and the consistency relation between them. Ruiz-Martin and Poza [
1] proposed an approach to identify a suitable sequence for developing the components of a project management plan, using network theory to configure the project plan with complex relations within entities. In another study, Schenk [
16] established configuration control boards to identify baseline requirements, control changes to the implemented baseline, and handle these changes by integrating technical and administrative decisions considering project goals. Ali and Kidd [
17] identified and prioritised the main barriers to the effective implementation of configuration management practices and categorised these bottlenecks into three key groups, including managerial barriers, implementation barriers, and process barriers.
As projects have become more complex, there have been growing concerns about the concept of project complexity [
18,
19,
20]. Understanding the complexity of projects and how to manage them is of remarkable importance for project managers since the decision-making and goal attainment processes are related to complexity [
21]. In this regard, Berzisa [
22] established a baseline configuration to reduce the complexity of configuring project management information systems based on project management requirements during their deployment. A list of typical project management scenarios, workflows, and relevant concepts are considered in their baseline project configuration. Jaafari [
23] developed a probabilistic method for project configuration optimisation and unit cost estimation. In this study, the deterministic approach is argued to lack conceptual relevance; hence, it should not be applied for decision-making regarding project viability, risk assessment, and configuration optimisation. Project configuration is also important for integrating projects; hence, Morozov, et al. [
24] described an approach for “project integration management” through project configuration management that includes identifying unbalanced tasks, changing their characteristics, and bringing them into a coherent state. In addition, configuration management is an efficient tool for project managers to utilise a reliable methodology to manage the status and changes of projects throughout their life cycle [
17]. Lindkvist, et al. [
25] presented a complex project configuration management structure in handling changes to the dataset and the related real-world engineering systems and applied this approach to civil engineering, nuclear research, and the aerospace industry. Whyte, Stasis, and Lindkvist [
2] addressed the challenges of managing complex projects to enable rapid, flexible forms of project organising using asset information. They utilised configuration management to establish and maintain the integrity of the product system and associated information, as well as managing changes on projects.
2.2. Construction Project Management
Although there are documented advantages of configuration management in increasing quality as well as avoiding and minimising delays in projects, configuration management has not been studied in construction project management literature adequately. Benevolenskiy, et al. [
26] proposed a new method that merges the ontology-based process modelling with the rule-based process configuration in the construction industry. The suggested configuration of complex construction tasks supports the generation of process schedules for construction programs. Schönbeck, et al. [
27] explored whether systematic product configuration information can be applied in construction projects to ensure high performance. They indicated that configuration information could be exerted to enhance control over construction projects as well as to cope with problems encountered in different stages of project implementation. Jensen, et al. [
28] designed a building system configuration to create design automation alternatives through the parameterisation of building components in the construction activities. In their configuration system, the downstream flow of design information and the upstream flow of constraints are considered from three perspectives: customer, engineering, and production viewpoints.
Project configuration can also be utilised to optimise and economise customisation construction projects to meet client expectations better. Cao and Hall [
29] proposed an ontology-based strategy as a foundation for building management-based product platform development for industrialised construction. Their project configuration maintains the project hierarchy required for project assembly and supports the rapid development of new projects with customised properties. Piroozfar, et al. [
30] designed a configuration platform for customisation and investigated the principles of modularisation and configuration to overcome challenges when applying building information modelling in the construction industry. Additionally, Jensen, et al. [
31] developed flexible product platforms based on the products-in-products concept and the mass customisation theory for applications in the construction industry. The results showed that the proposed project configuration concept is beneficial for enabling mass customisation in construction with affordable costs. Mohammadnazari, et al. [
32] developed an integrated multi-criteria decision-making approach to prioritise post-disaster reconstruction projects. Salari, et al. [
33] presented a construction project supply chain by developing a bi-objective mathematical problem in three stages: off-site factories, supplier warehouses, and construction sites. Mohammadnazari, et al. [
34] studied a hybrid novel method to evaluate resiliency and sustainability in construction environments using data envelopment analysis, principal component analysis, and mathematical modelling.
2.3. FTA and FMEA Approaches
As the construction project developed, more uncertain factors emerged, and the project management became increasingly complicated, making the conventional approaches of construction project management difficult to adjust to new conditions [
35,
36,
37,
38]. Thus, ensuring efficient control of large-scale construction projects, measuring demand among different objectives comprehensively, and improving the reliability of the entire construction system have become essential [
39]. Construction reliability refers to the effective completion of the expected project quality, within a limited time and within the prescribed cost target range in the construction process of the project [
40]. In order to improve reliability, Zhang, et al. [
41] came up with a systematic early fault elimination method that was based on sales data from computerised numerical control machine tools. They designed four steps to collect fault data, determine early faults, analyse them, assess the criticality of fault causes, and eliminate them. FTA and fault mode, effects, and criticality analysis (FMECA) methods were used in their model. Goo, et al. [
42] also worked on reliability, where they pointed to the difficulty of reliability prediction in the initial design stage. Their proposed methodology combines FMECA with axiomatic design to identify failures in the initial design stage and reduce their impact on other design parameters in order to improve reliability.
The analysis of failure in the concept of reliability is of great importance and Peeters, et al. [
43] implemented both FTA and FMEA recursively at the system level, function level, and component level to indicate and assess all critical failure modes. Similarly, Zhang, et al. [
44] proposed a hybrid multilevel FTA and FMEA approach for a flexible manufacturing system at the system level, function level, and component level in order to identify critical fault causes. Then, the TOPSIS method was used to analyse criticality. Mzougui and El Felsoufi [
45] presented a modified FMEA approach to outperform the conventional FMEA approach without information. They considered the anticipatory failure determination approach to identify all system failures and prioritise them using the AHP method with cost and maintainability as factors. Azadeh, et al. [
46] proposed an integrated FTA and Design FMEA (DFMEA) approach to identify product failures, calculate the reliability of product configurations, and consider warranty cost and purchasing cost of supplier, redundancy, and system type to evaluate each configuration for each configuration improvement. By taking both product configuration and production process into account, Pitiot, et al. [
47] proposed an evolutionary algorithm to minimise cost and cycle time in the production process. Their methodology offers two steps with the first one being an initial rough approximation of Pareto on total cost-cycle time diagram, and the second one being a more focused area of interest of the user on Pareto diagram.
As mentioned in this sub-section, FTA and FMEA have been used as quality management tools in analysing failures related to product configuration. These tools are applicable in the identification of faults, failure modes, and effects of a product in the design stage or the production process stage. They aid product configuration in better arranging components in order to increase the reliability of the product, as well as decrease the overall costs. Also, AHP and TOPSIS have been used as MADM methods in prioritising and ranking faults and failure modes of products in order to identify the most critical potential failures and failure modes. These methods help the product configuration in criticality analysis of failures related to different components of the product and help save time and cost by indicating critical failures regarding products instead of having to analyse all failures one by one. Therefore, integrating quality management tools such as FTA and FMEA with MADM methods such as AHP and TOPSIS can be a viable approach towards improvement of product configuration as seen in the work of Zhang, Li, Ran, and Zhang [
44], Mzougui and El Felsoufi [
45] and Azadeh, Sheikhalishahi, and Aghsami [
46]. To the best of our knowledge, these techniques and their integration have not been studied in the literature of project configuration and due to the viability and the efficiency of these techniques in the field of product configuration, it is worth exploring the applicability of these techniques in project configuration and especially in the construction environment. Due to the similarity of products and projects in having multiple components and multiple tasks, that require arrangement along with reliability and costs of configuration applicable to both products and projects, it is of great importance to explore enhancing project configuration through quality management and decision-making techniques which their contribution in product configuration is well established.
2.4. Research Gaps and Contributions
According to the above-mentioned discussion, the literature demonstrates that the concept of project configuration management is rarely addressed in construction programs despite its functional significance. Applying configuration in construction projects to develop process configuration was done through ontology-based process modelling of construction processes with the rule-based process configuration in the work of Benevolenskiy, Roos, Katranuschkov, and Scherer [
26]. Their work was limited in terms of process patterns and rule bases and risks regarding construction projects were not considered in process patterns. Reviewing the applicability of configuration information in construction projects based on the application of configuration management in product configuration was done in the work of Schönbeck, Löfsjögård, and Ansell [
27]. Their research concluded configuration information effectiveness in encountering various problems faced in construction projects, but it was limited to a conceptual model. Therefore, risk assessment of construction projects through configuration regarding problems related to delivering the project in desired time and in accordance with expected cost has not been investigated in the literature. This subject ought to bring significant value to stakeholders in construction projects as contractors would be able to evaluate project tasks and identify problems that occur in task implementation in order to relieve shortcomings in reaching project goals and also clients can be aware of the related risks in construction projects to better plan their expected project goals. In previous studies, a practical approach for the improvement of construction project configuration considering time, costs, and quality was not provided. While the first step to improving construction projects is identifying issues related to not meeting client expectations, which can directly impact project improvement time. Taking effective actions towards eliminating the causes of these issues is the second step to delivering improvements and optimal outputs in minimum time. As mentioned before, previous studies did not provide any functional approaches towards reaching these objectives important to construction project stakeholders. In addition, although there are several research articles in the field of project configuration and reliability analysis, the studies considering integrated failure identification by quality management tools and evaluation approaches by MADM methods are scarce. To the best of our knowledge, the implementation of FTA analysis and the FMEA approach together in order to identify potential failures and their effects on the system, as done in the work of Azadeh, Sheikhalishahi, and Aghsami [
46], has not been carried out in any project configuration study yet. Also, there is no research in the field of project configuration that has tried to extract and provide the fault tree from the WBS of the project, which contains the hierarchical decomposition of the tasks that should be carried out by the project team. Hence, this research applies an integrated FTA-DFMEA approach to improve project configuration, and the FTA is extracted according to the WBS since the fault tree is based on a task level and can be derived from WBS.
Moreover, the implementation of FTA to different possible failures is a very time-consuming method, and an efficient way of identifying the most significant failures has not been detected in former studies. Also, traditional criticality analysis based on the Risk Priority Number (RPN) is not precise enough to evaluate the FMEA method, as found in the study of Zhang, Li, Ran, and Zhang [
44]. So, in this study, we tried to eliminate such defects and applied an integrated AHP-TOPSIS method to analyse failure modes and effects. Finally, project configuration systems can be considered as series and parallel systems, which are not implemented in previous studies. Therefore, our main intention to present this paper is to fill these gaps. To overcome these shortcomings and fulfil the gaps in the literature, a new project configuration management framework is proposed to examine the trade-off between cost and time using an integrated FTA-DFMEA approach in order to improve construction project implementation. Client requirements and market feedback in the construction industry are considered to identify potential failures in fulfilling project goals, and instead of using the RPN method, an integrated AHP-TOPSIS method is utilised to select the most critical potential failure. Moreover, in this study, two types of series and parallel systems for the project configuration are taken into account to arrange project tasks based on their precedence and enhance construction projects in terms of carrying out the project at the desired time and cost.
3. Methodology
The proposed approach is described in this section, and mathematical equations are shown. The main idea comes from Azadeh, Sheikhalishahi, and Aghsami [
46]. They proposed an integrated FTA-DFMEA approach to identify product failures, calculate the reliability of product configurations, and consider warranty cost and purchasing cost of supplier redundancy, and system type to evaluate each configuration for improvement.
In this study, a practical-conceptual methodology is provided that pays attention to step-by-step and hierarchical improvement of construction project configuration by considering various criteria in order to provide optimal outputs in minimum time. This approach considers the application of quality management tools with MADM methods in the construction project configuration. Three parties are presented: the client, the contractor, and the construction resource suppliers. The client requirements and market feedback are taken into account to identify possible failures regarding fulfilling project goals. Then, an integrated AHP-TOPSIS method is applied to identify the most critical possible failure based on relevant criteria. After that, FTA is used to indicate failure modes based on WBS, and an integrated AHP-TOPSIS method is applied to rank failure modes based on relevant criteria. Then, an initial project configuration is considered, and the total cost and probability of project tasks accomplished in desired time are calculated. If either one is not acceptable to the contractor, DFMEA is used to take corrective actions and improve the project configuration.
In this study, several construction resource suppliers with different policies, delivery lead times, purchasing costs, and warranty costs are considered. Several types of manpower are also available at various costs. Redundancy allocation and different configuration systems such as parallel and series are taken into account to arrange project tasks based on their precedence. The main assumptions considered in the model are as follows:
Projects consist of different tasks, and they are configurable, which helps the decision-maker in reaching optimal project configuration;
Project tasks are arranged based on WBS, and the WBS of the construction project is assumed to be already provided.
Construction resources are supplied by a number of suppliers.
Warranty cost and purchasing cost of each construction resource supplied by each supplier is determined.
The contractor provides manpower, and the cost of each manpower is determined.
Different policies for supplying construction resources are available from each supplier.
Redundancy is considered in project configuration to excess probability of accomplishing tasks in desired time.
Project tasks can be replaced in the configuration phase and new ones can be added.
Tasks can be arranged in series or parallel form based on their precedence to form the project.
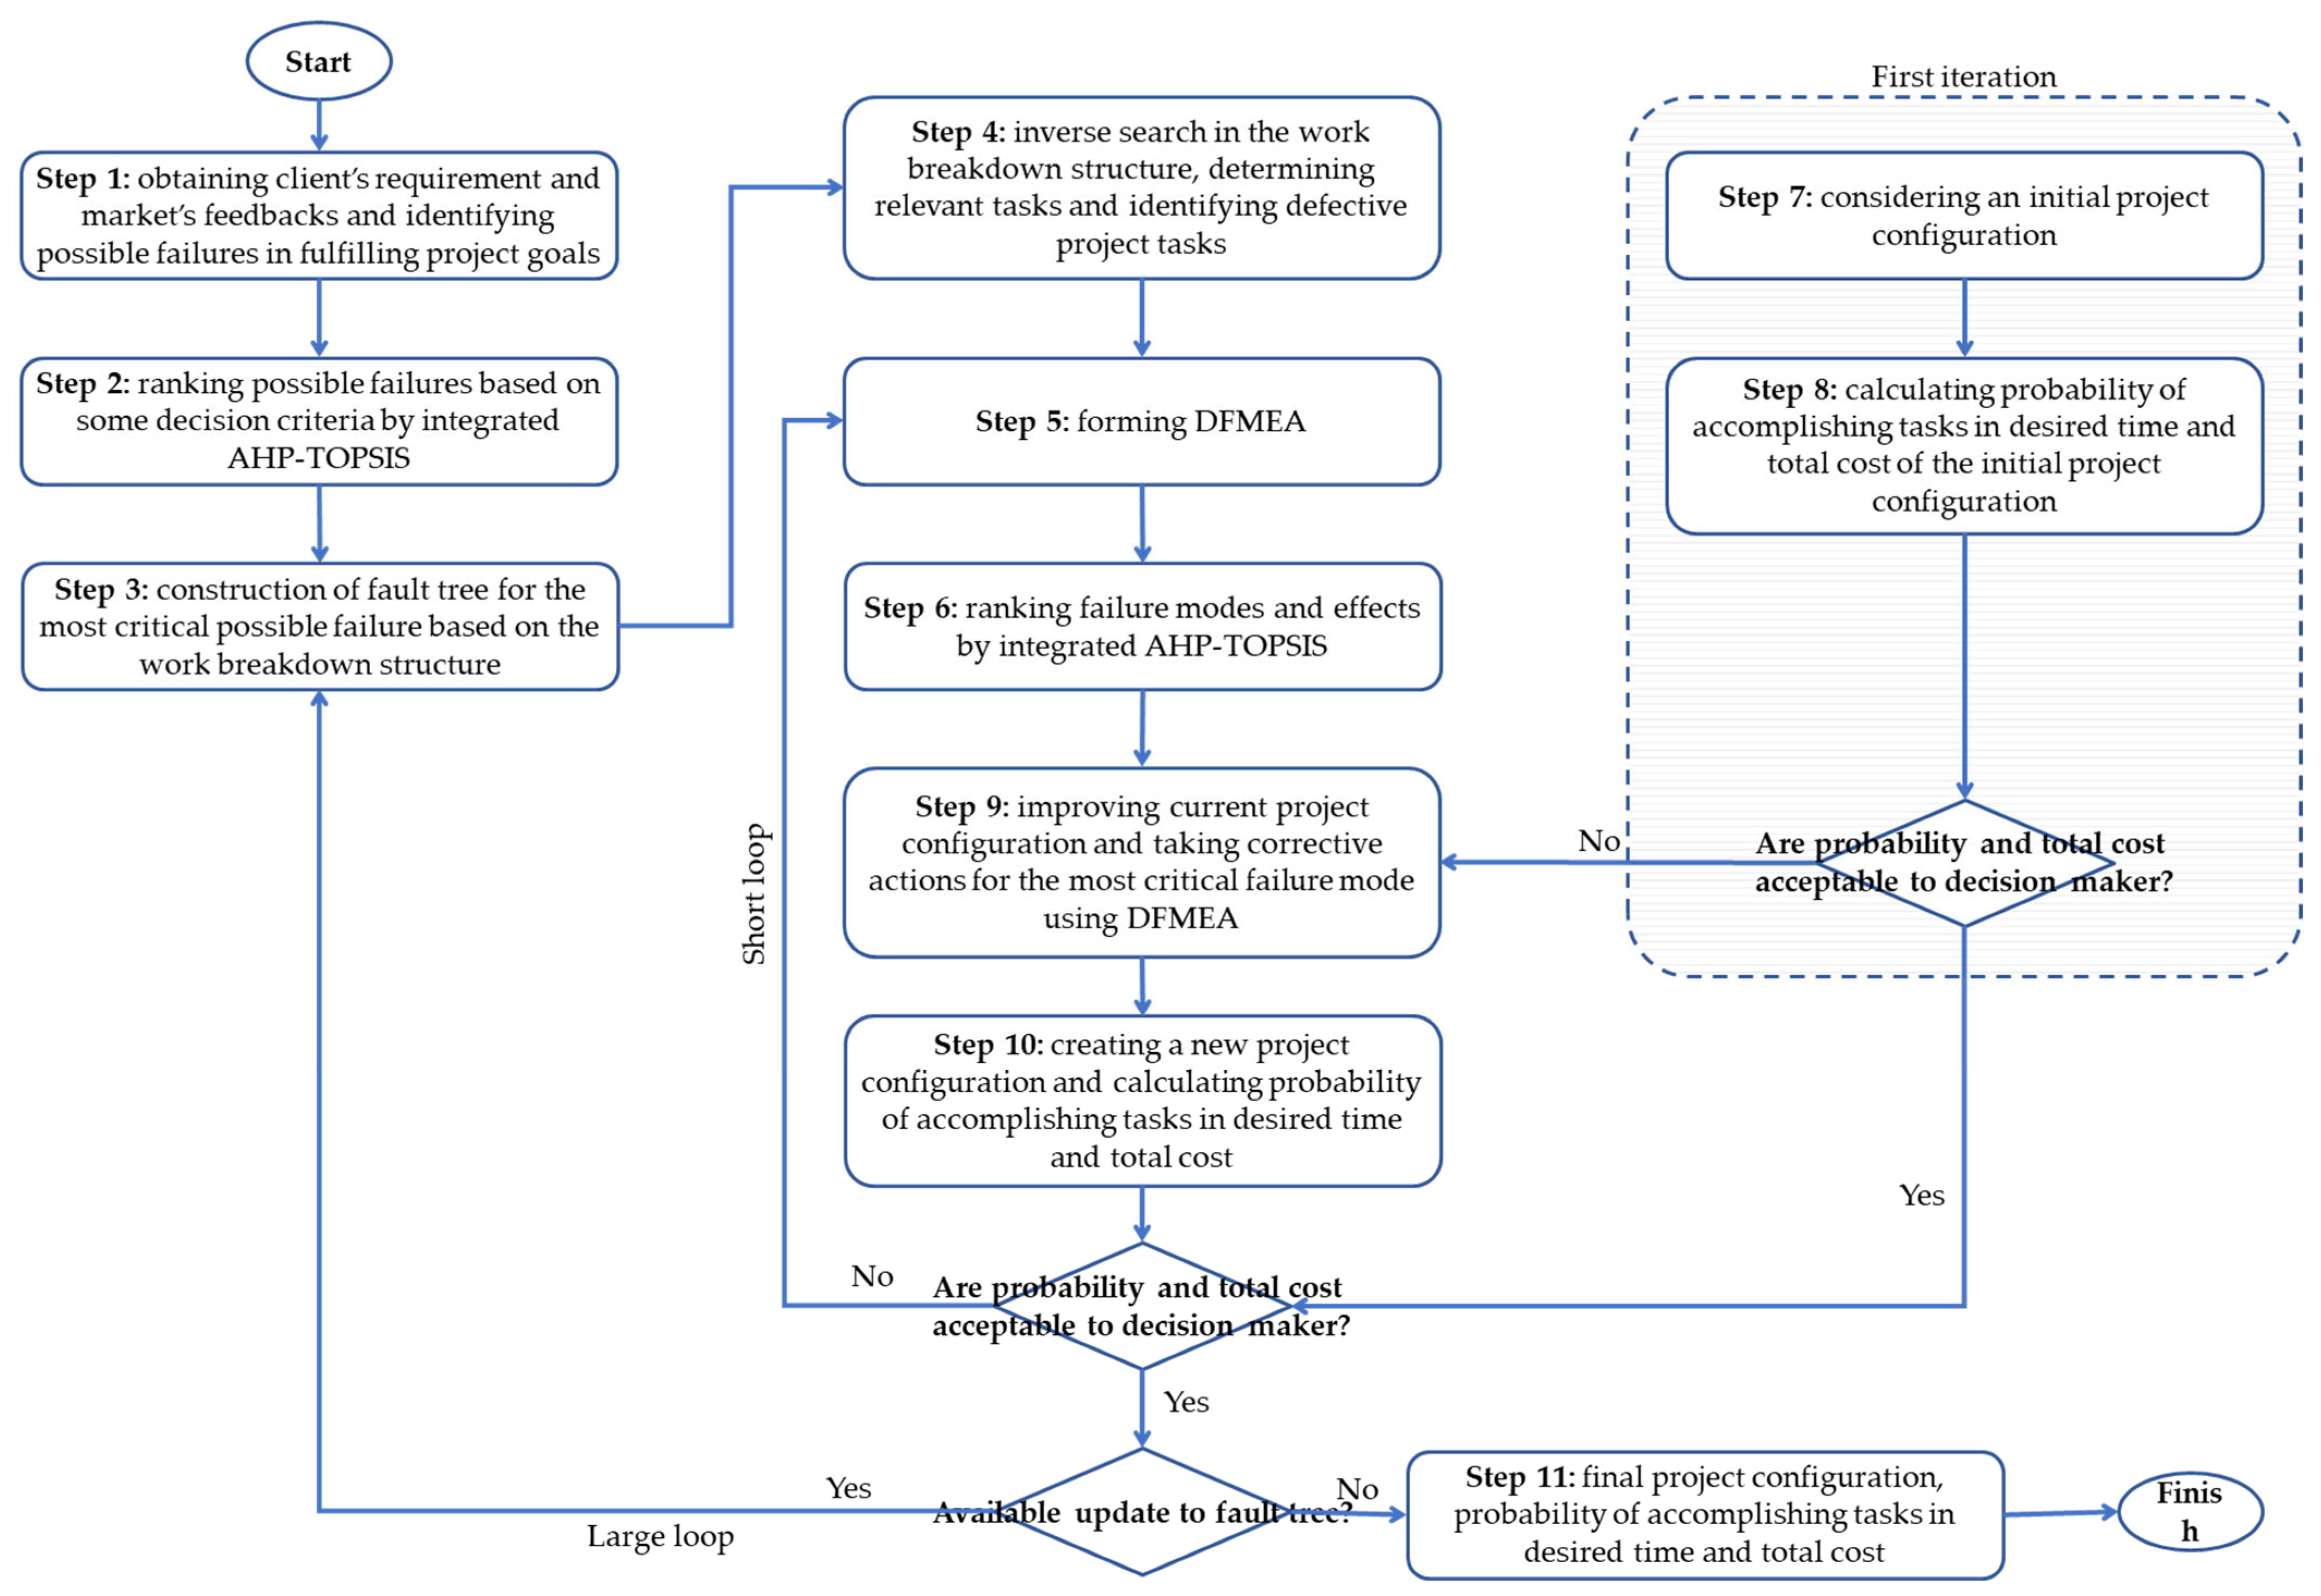
The detailed description of the methodology is as follows:
The client needs and market feedback should be obtained and possible failures in fulfilling the project’s goals during project implementation should be identified.
After the identification of possible failures, the most significant one must be recognised in order to resolve/fix failures sooner for more saving time. Thus, a number of relevant criteria are presented, and the AHP method is used to calculate the weight of these criteria. Then the TOPSIS method is applied to rank different possible failures to identify the most critical one.
Based on the above-mentioned steps and WBS, a fault tree is formed to indicate different failure modes and effects for the most critical possible failure.
Defective project tasks must be identified by analysing the top event of the fault tree.
With the use of a fault tree, and defective project tasks, DFMEA is formed for different failure modes and effects.
Criticality analysis of failure modes and effects is done by the integrated AHP-TOPSIS method to prioritise failure modes based on relevant criteria.
For the first iteration, an initial project configuration is considered.
The probability of accomplishing tasks in the desired time and total cost for the initial project configuration are calculated. If both of them are acceptable to the decision-maker, step 11 or 3 is the next step. If not, step 9 is the next step.
The current project configuration is improved by DFMEA and corrective actions are taken for the most critical failure mode.
A new project configuration is created and the probability of accomplishing tasks in desired time and the total cost is calculated. If both of them are acceptable to the decision-maker, step 11 or 3 is the next step. If either the probability of accomplishing tasks in the desired time or total cost is not acceptable to the decision-maker, step 5 is the next step (short loop).
If the fault tree is updated, step 3 is the next step (large loop). Otherwise, the last project configuration is the final configuration. Detection of new failures, the existence of new causes, the occurrence of new failures, and the alteration of the client’s needs are reasons to update the fault tree.
Figure 1 depicts the entire methodology of the study schematically.
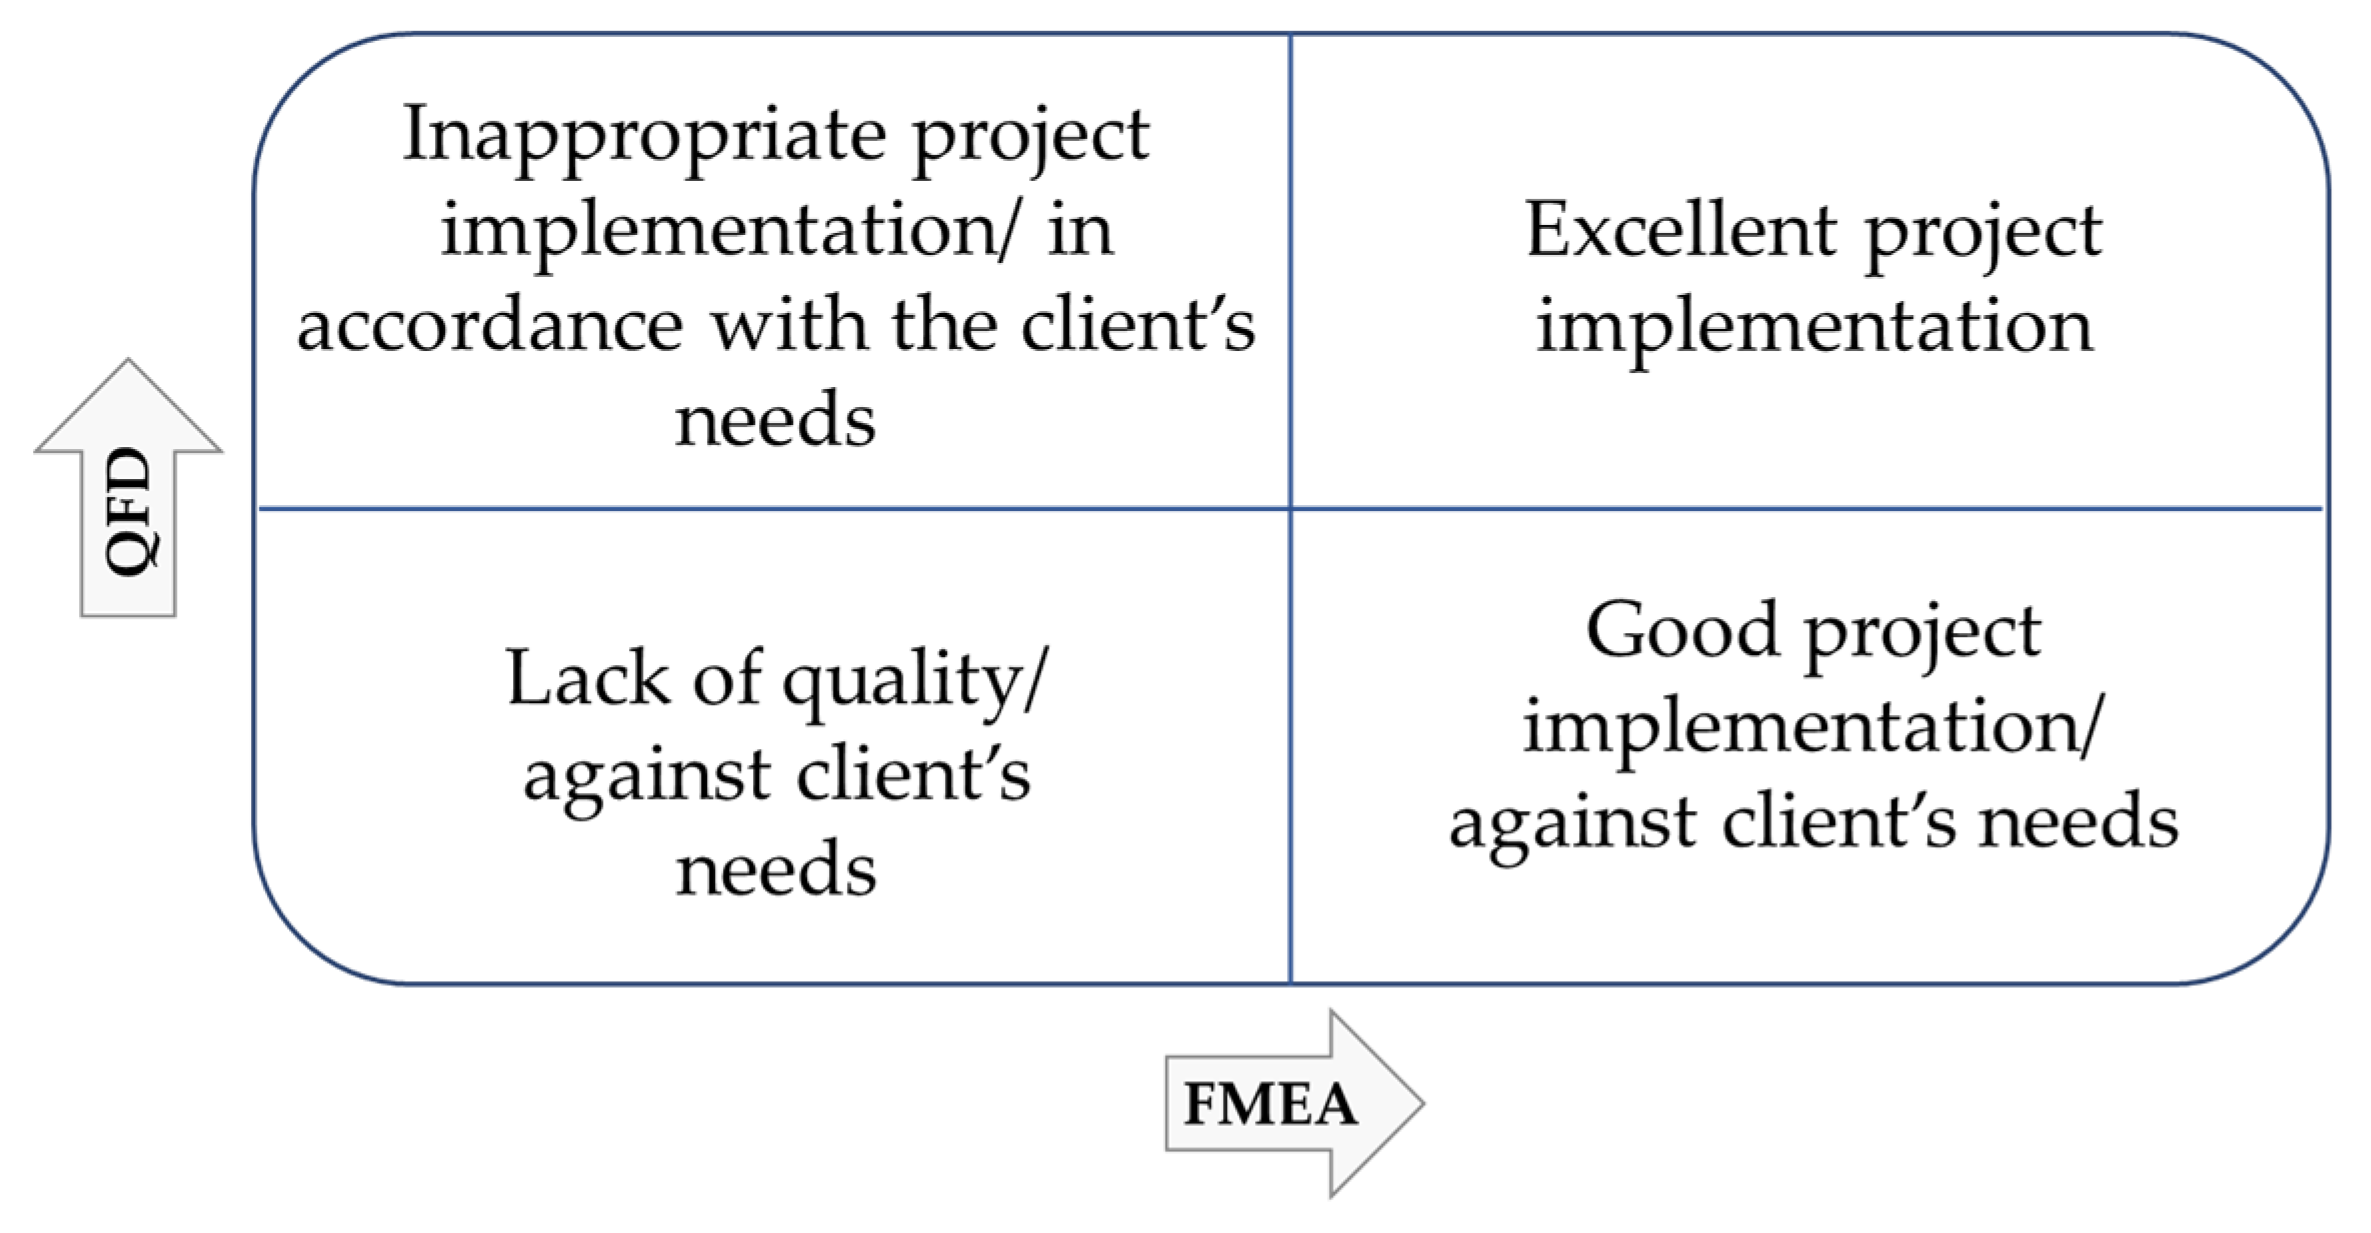
3.1. Client’s Needs and Market’s Feedback
In the project development process, the client needs and the market feedback are important factors that should be considered. Identifying possible failures in fulfilling project goals during project implementation is also important and should be considered. In order to have an excellent project implementation, the client needs and market feedback are addressed by FMEA and quality function deployment (QFD), which are shown in
Figure 2.
3.2. Ranking Possible Failures in Fulfilling Project Goals
Possible failures in fulfilling project goals are identified based on the client’s requirements and market feedback. It is important to direct time and effort towards the most critical possible failure because investigating all possible failures and constructing a fault tree for each of them to indicate failure modes and effects is a time-consuming task that largely extends the total optimisation time and decreases efficiency and applicability of the model. Therefore, an integrated AHP-TOPSIS method is used to identify the most significant possible failure to be dealt with. Eight different criteria are considered to help decision-makers to find the most critical possible failures, which are:
The total number of times a failure occurs (1/Mean Time to Failure (MTTF)).
The total time required to deal with the failure.
The total cost required to deal with the failure.
The grade of importance related to that failure from the client’s point of view.
The grade of importance related to that failure from the contractor’s point of view.
The ability of the failure to cause following failures.
The impact of the failure on the project’s quality.
The total missed opportunity cost related to dealing with that failure.
The weight of these criteria is calculated using the AHP method and the possible failures are ranked using the TOPSIS method. The output will be the identification of the most critical possible failure in fulfilling project goals.
3.3. Fault Tree Analysis
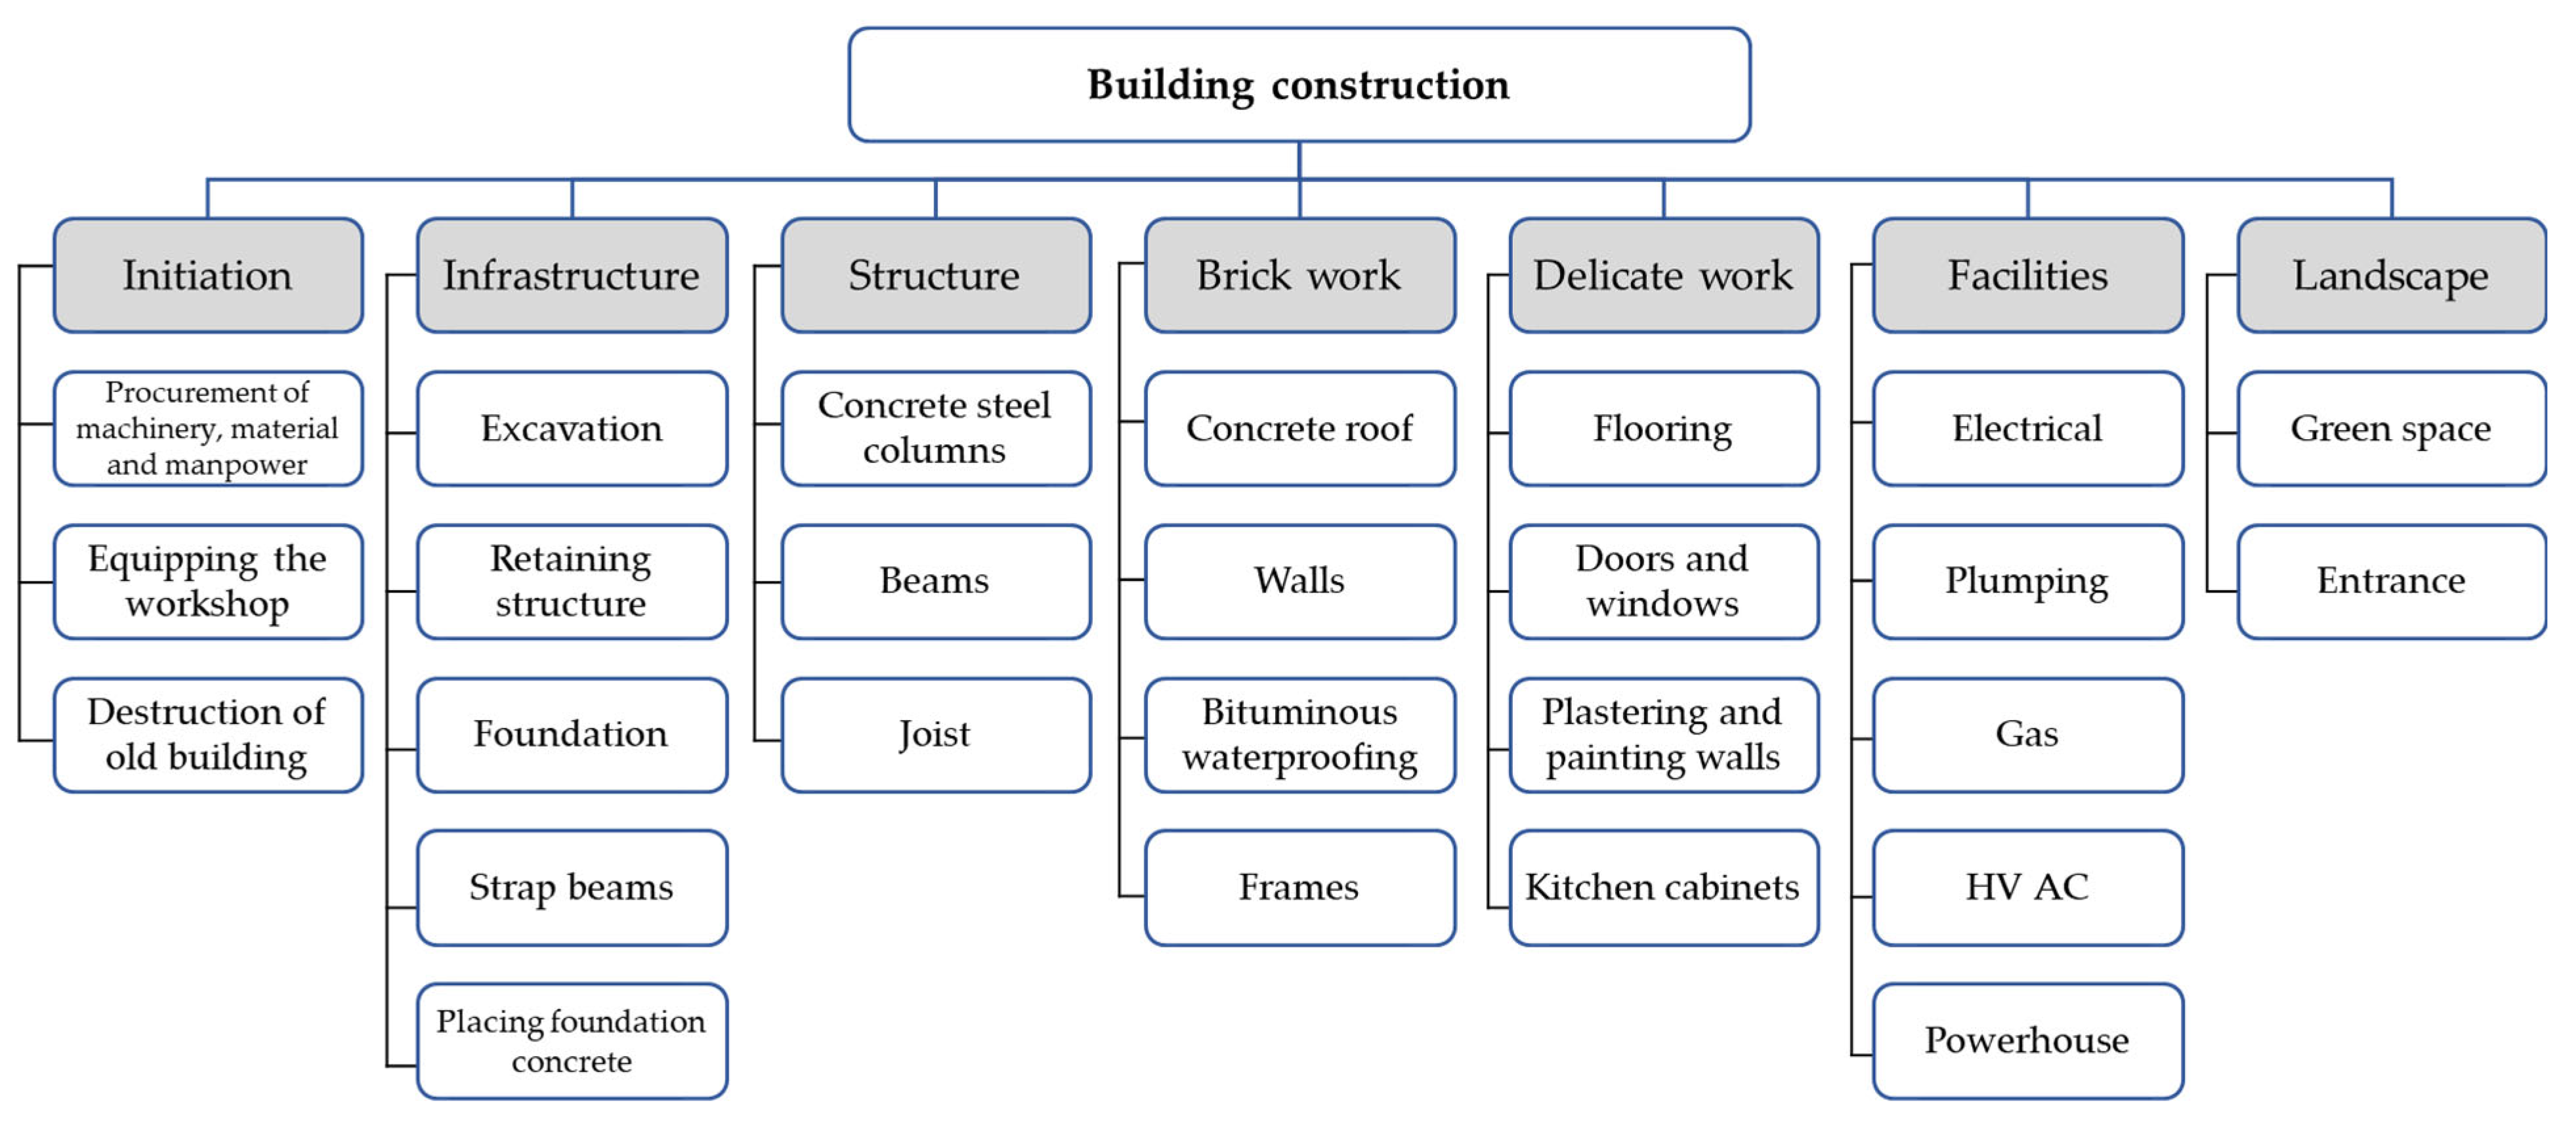
A fault tree represents different failures and identifies the causes of each defect. For each defect or functional requirement, a fault tree may be formed. A fault tree is constructed to indicate different failure modes and their effects for the most critical possible failure. To describe the hierarchical relationship between different tasks of a project, a WBS is required.
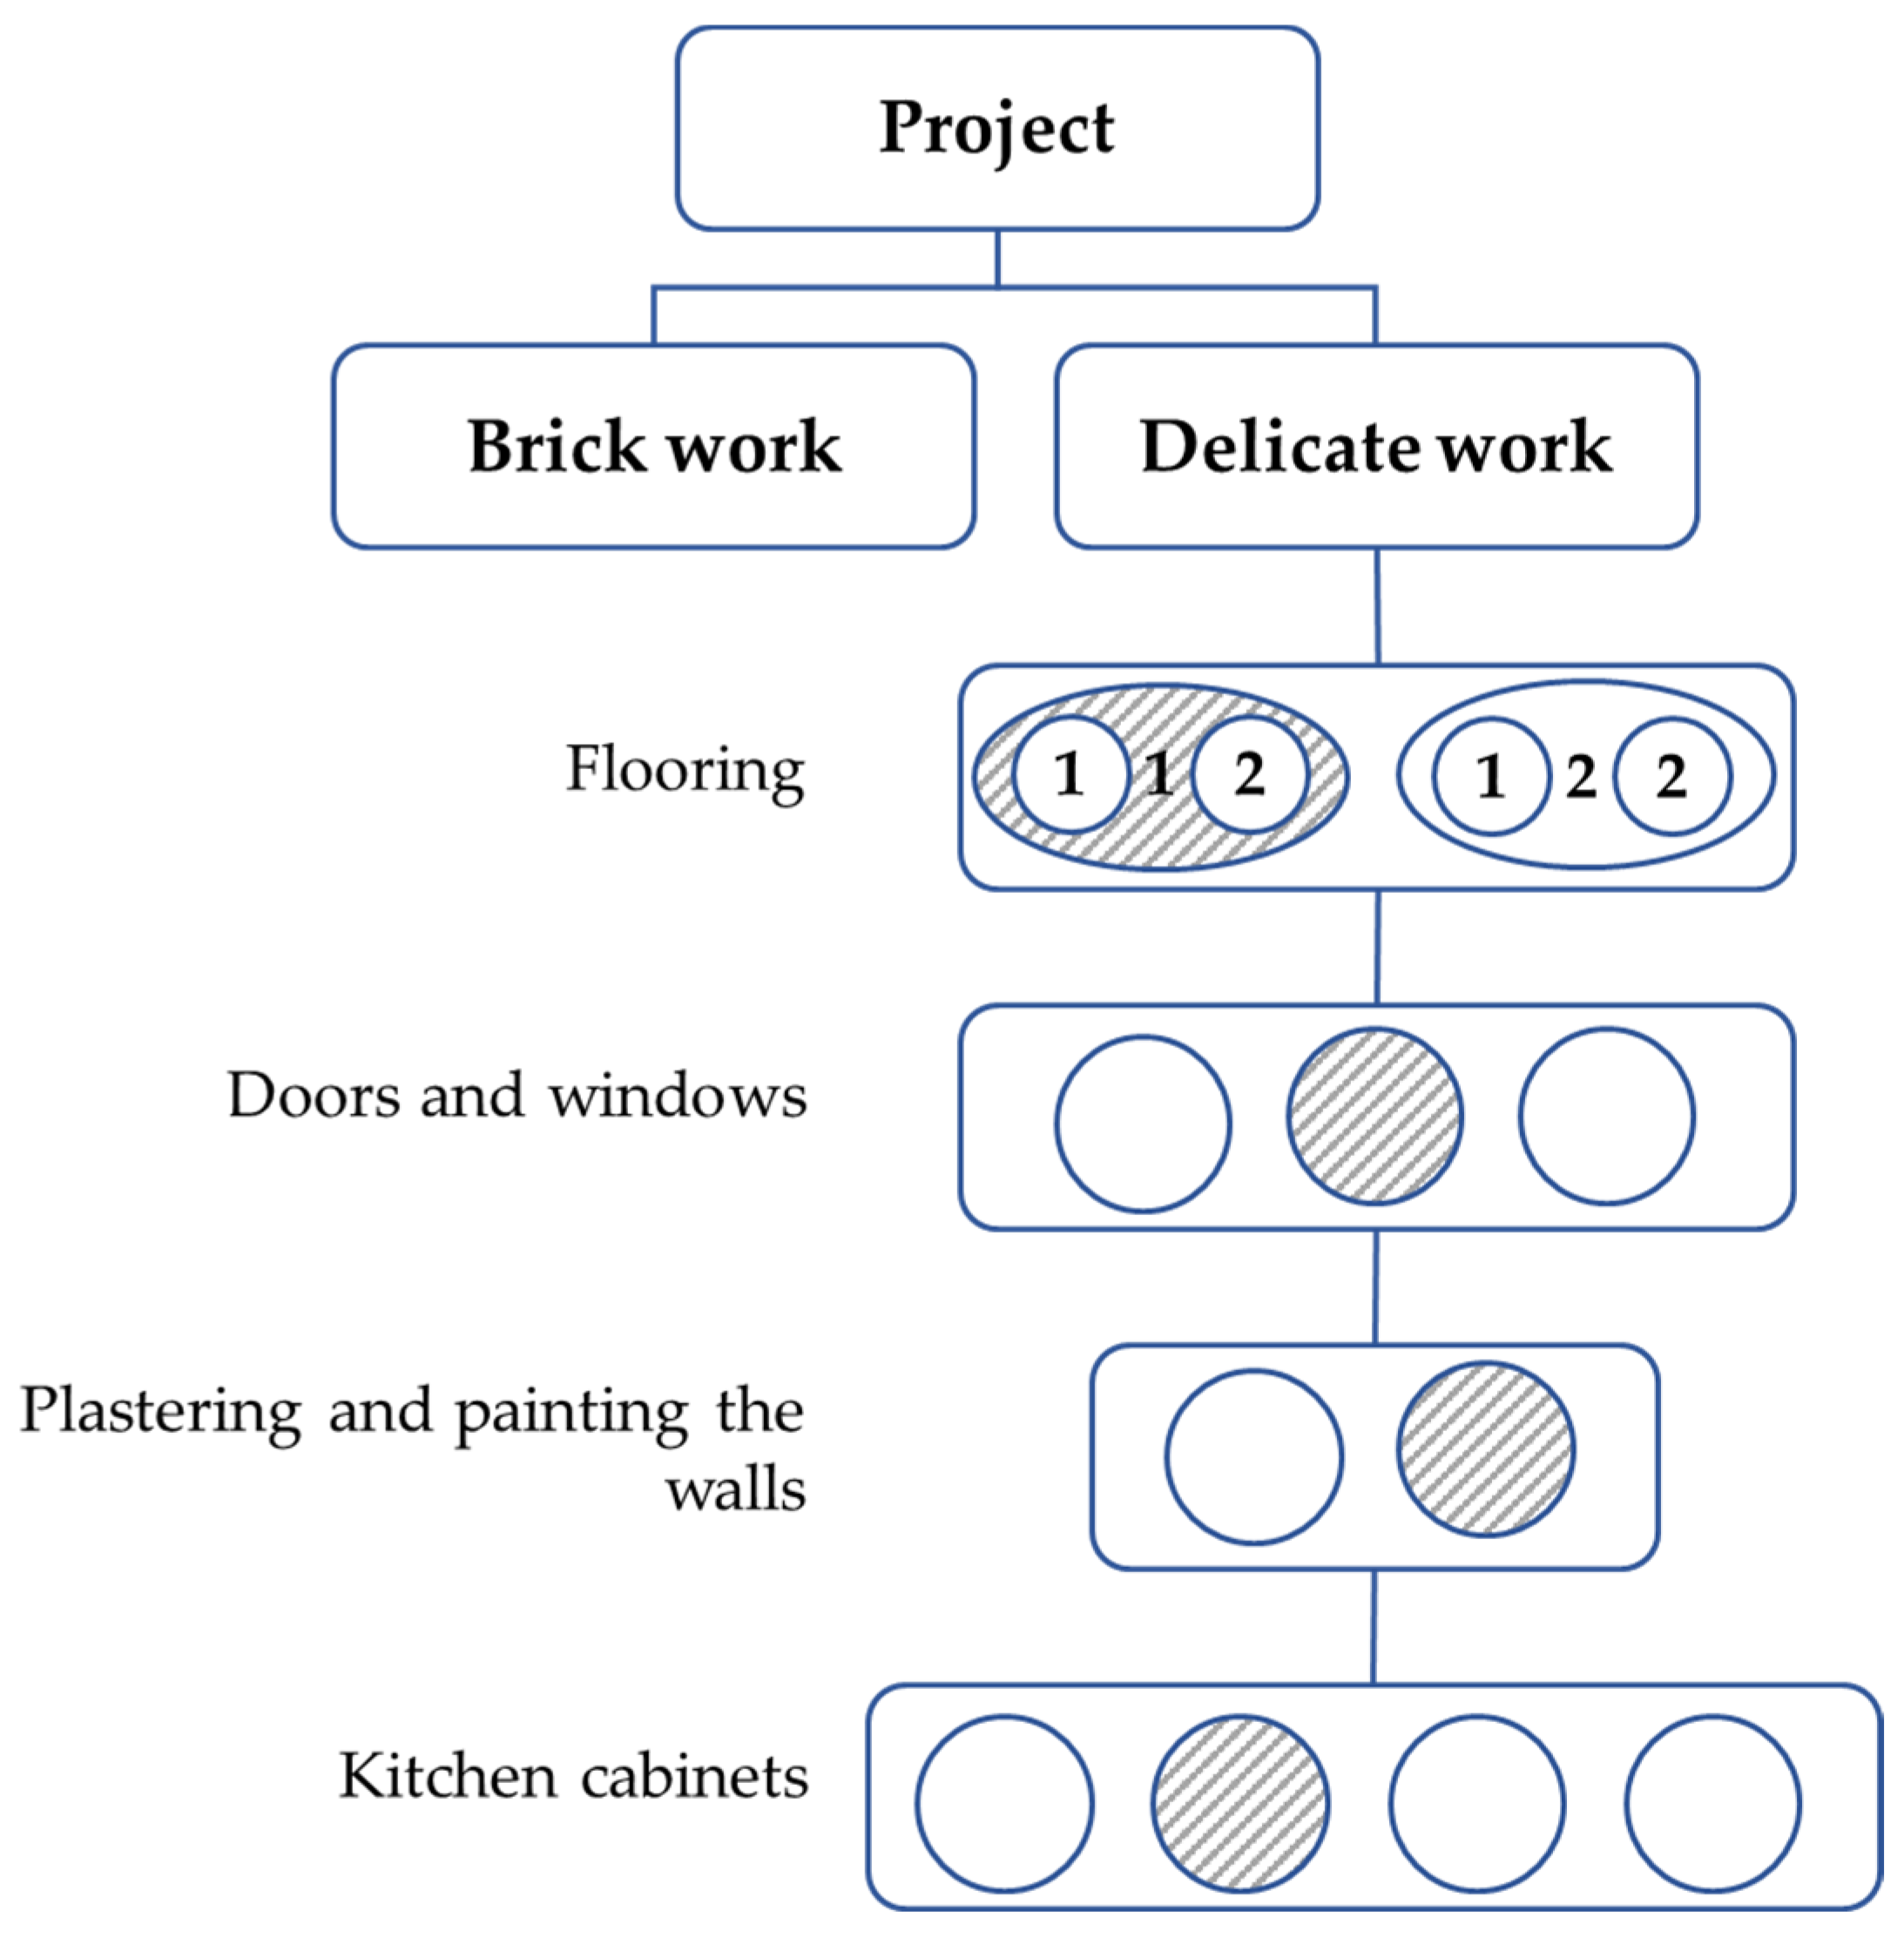
Figure 3 is an example of the WBS of a building construction project and it shows how a task breaks down to its sub-tasks.
A fault tree is based on a task level and can be derived from WBS. Specifying tasks that appear in the top event of the fault tree is the result of the connection between WBS and the fault tree. It is important to know which tasks of WBS are related to the event node of the fault tree, to specify tasks in the top event. An inverse search is carried out in this step of the proposed approach as follows:
In the WBS, mi represents the basic task of the project and a node at the lowest level of the WBS.
In the operational model, represents the construction resource of construction resource type j (e.g., machinery, manpower, and material). In the project configuration, this construction resource is the basic unit. and are positive integers.
Matrix A is described as:
where
if task
is done by construction resource
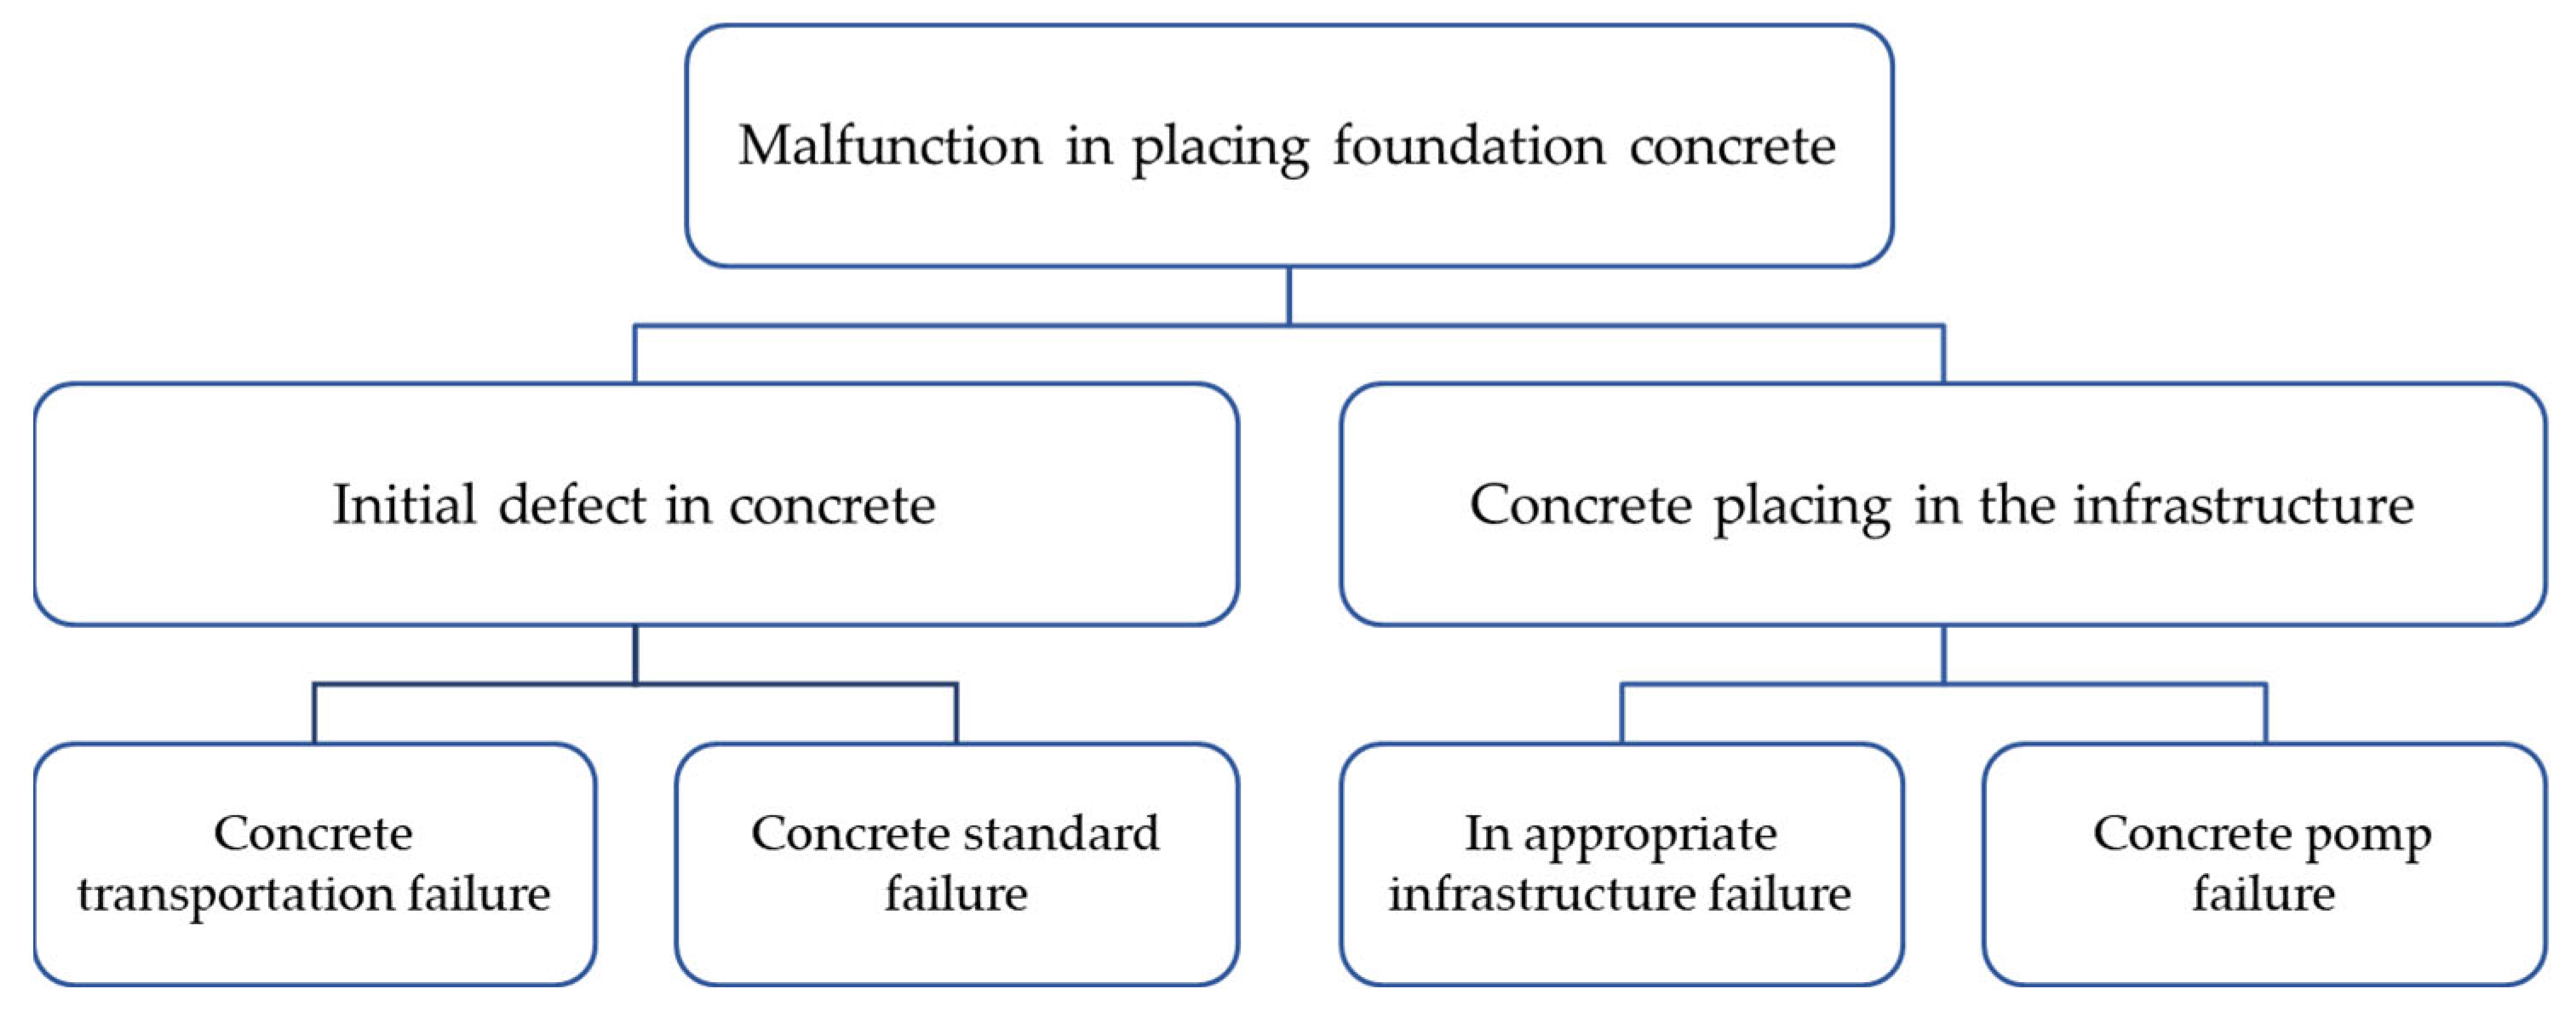
, otherwise it’s equal to 0. Matrix A is constant. We extract the fault tree corresponding to WBS depicted in
Figure 3 as
Figure 4. In the fault tree, the quickest way to initiate an event from fault is called a minimal cut set. Minimal cuts can be used to calculate the occurrence possibility of a top event. In the inverse search, nodes of the FTA will be explored by keywords from minimal cuts of the fault tree. When a node matches a keyword, it will be marked, and the inverse search is finished when all keywords are tested. The proposed approach implements the inverse search method [
46].
3.4. Feasible Project Configuration Generation
In the proposed approach, an initial feasible project configuration is considered for the first iteration, and for other iterations, the last created project configuration is used. Each project configuration is described as a binary matrix. Index
and
represent row and column, respectively, and the elements of
and
represent the relationship between the project’s task
and
. Matrix
represents the connection between tasks and matrix
represents the connection status of tasks in a project configuration. The relationship between matrix
and matrix
is shown by matrix
and is calculated by the following equation:
Matrix is a feasible project configuration.
3.5. Calculating the Probability of Accomplishing Tasks in Desired Time
According to the client’s requirements, the total time expected to complete a project is an important goal. Contractors are obligated to perform critical tasks without any delay to meet the client’s time goal. In order to consider the time uncertainty in performing tasks, the Program Evaluation & Review Technique (PERT) is applied, and the time required to complete each task is considered uncertain. Beta distribution with three parameters is used to calculate the average time and the time variance of each task. These parameters are Optimistic time (a), Most-likely time (m), and Pessimistic time (b). If, in 0% of times, each task takes no more than the pessimistic time and no less than the optimistic time, the average time and time variance are calculated based on the difference between optimistic and pessimistic time equal to six times of the distribution’s standard deviation as follows:
If, in 5% of times, each task takes more than the pessimistic time and less than the optimistic time, only the time variance is calculated based on the difference between optimistic and pessimistic time equal to 3.25 times of the distribution’s standard deviation as follows:
Estimation of
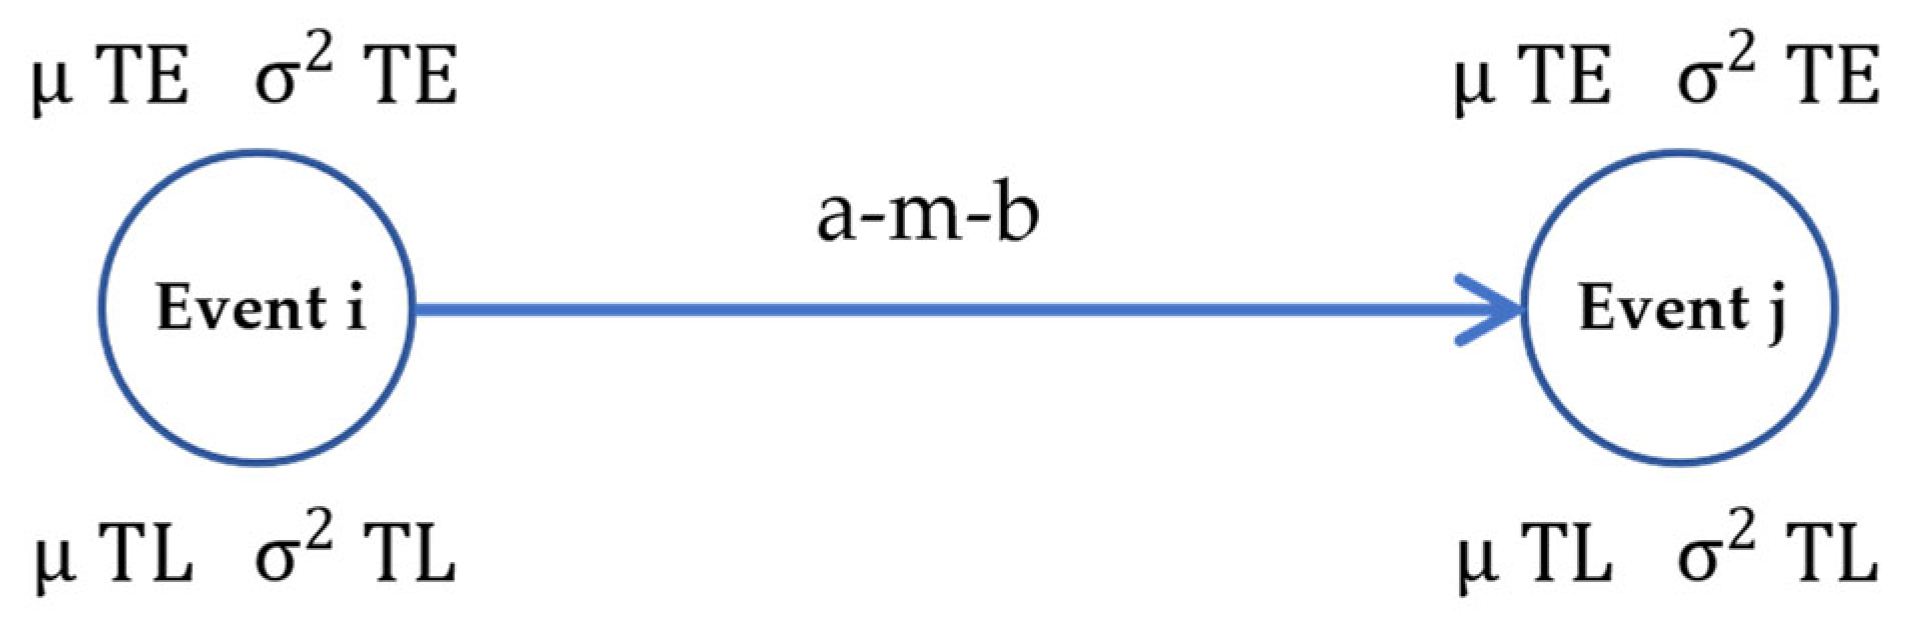
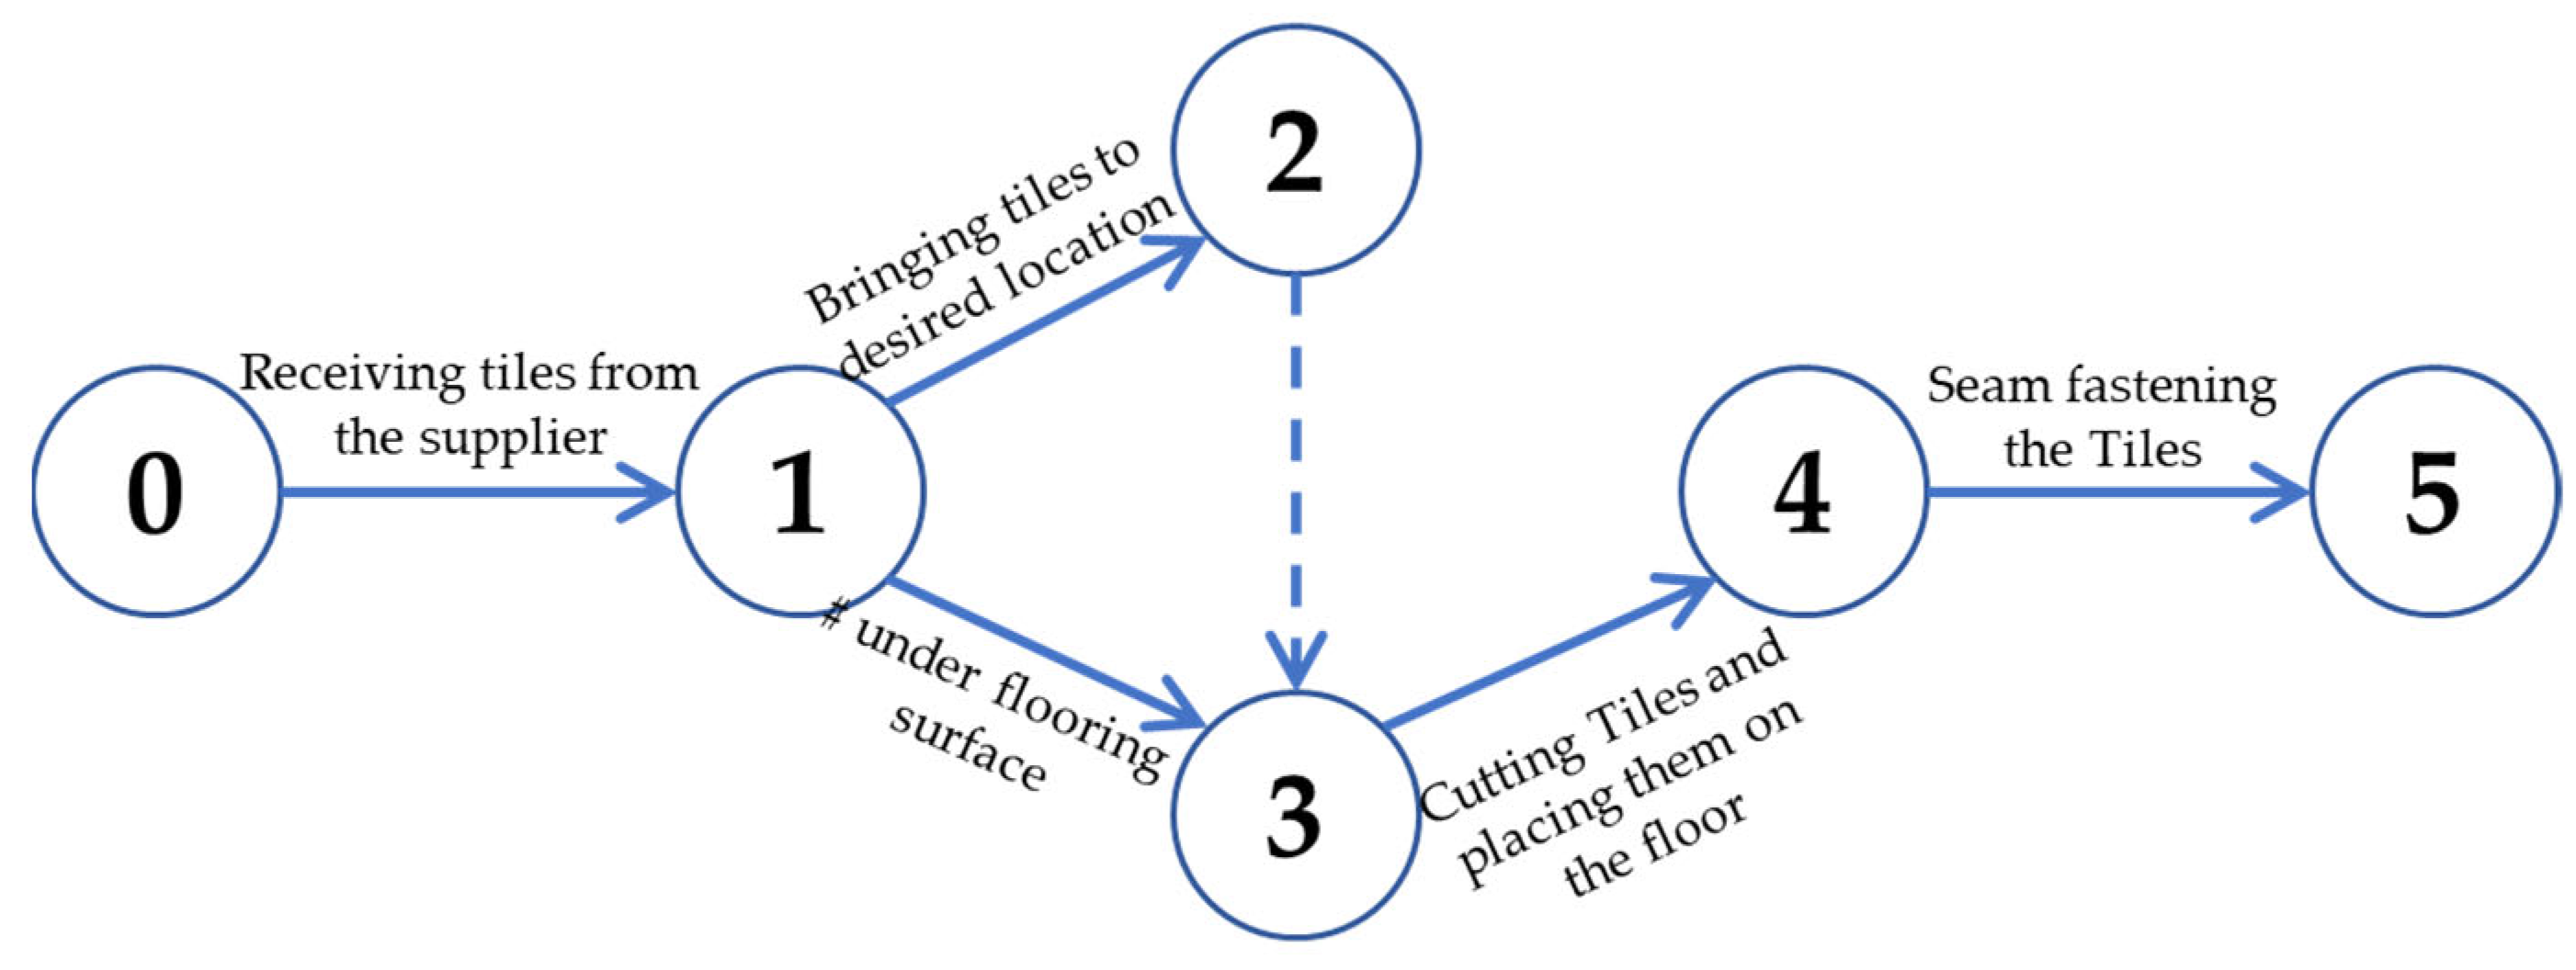
, m, and b based on 5% to 95% domain is more realistic than 0% to 100% domain and takes into account 5% of estimation fault. The client’s time limitation for the whole project should not affect the estimation of a, m, and b for each task. Alterations in time and place such as season change should be considered in the estimation. PERT networks are displayed by the activity on the arrow (AOA) system, an AOA sample of which is shown in
Figure 5. The difference between PERT networks and the critical path method (CPM) is that the forward and backward path time computations and expected float are calculated for the events. In addition,
Table 1 presents the notations.
In forward path computations, to calculate the earliest expected time to complete the entire project, the earliest expected time of the last event occurrence must be calculated. At first, the average time of each task between two events is calculated by Equation (3) and then the earliest expected time of each event occurrence is computed as follows:
In the case of a merge event, the earliest expected time of merge event occurrence is equal to the maximum of the earliest expected time calculated in each path reaching the merge event. In order to calculate the variance of the earliest time to complete the entire project, the variance of the earliest time of each task in the critical path must be calculated and summed up. At first, the time variance of each task between two events is calculated by Equation (4) or (5) and then the variance of the earliest time of each event occurrence is obtained as follows:
In the case of a merge event, the variance of the earliest time of merge event occurrence is equal to the variance calculated from the same path that the earliest expected time of merge event occurrence was calculated. In backward path computations, the latest expected time to complete the entire project is equal to the earliest expected time calculated before. Therefore, for the last event, the earliest and latest expected times for event occurrence are equal. To calculate the latest expected time for event occurrence, the following equation is used as follows:
In the case of a burst event, the latest expected time of burst event occurrence is equal to the minimum of the latest expected time calculated in each path reaching the burst event. In order to calculate the variance of the latest time to complete the entire project, the variance of the latest time of each task in the critical path must be calculated and summed up. The variance of the latest time of each event occurrence is given by:
In the case of a burst event, the variance of the latest time of burst event occurrence is equal to the variance calculated from the same path that the latest expected time of burst event occurrence was calculated. In the computation of the variance of the earliest and latest time of event occurrence, if there was more than one path with the same earliest or latest expected time of event occurrence, the path with the larger variance is selected. In PERT networks, it is possible to calculate the probability of accomplishing tasks in the desired time. To calculate this probability, different distributions for average time and time variance may be applied. If the completion time of
tasks in a path is equal to the sum of the completion time of each task separately and n is a large number, then based on the Central Limit Theorem, the completion time of the path is converted to a normal distribution with an average
µTE and variance
and to calculate the probability of an event’s occurrence or finishing the project in the desired time
, the following equation is used:
To obtain the probability of an event’s occurrence or finishing the project in a time window [
,
], the following equation is used:
If the project time is considered as an integer number, in probability computation, the continuity should be corrected. To calculate the time of an event’s occurrence or finishing of the project with a determined confidence level, the following equations are used:
The float of each event is equal to the difference between the earliest and the latest time of event occurrence, and in PERT networks, the earliest and latest time of event occurrence are random variables. Therefore, the event float is also a random variable and is calculated as follows:
The average and variance of event float are calculated as follows:
To calculate the probability of an event float equal to a desired amount, the following equation is used:
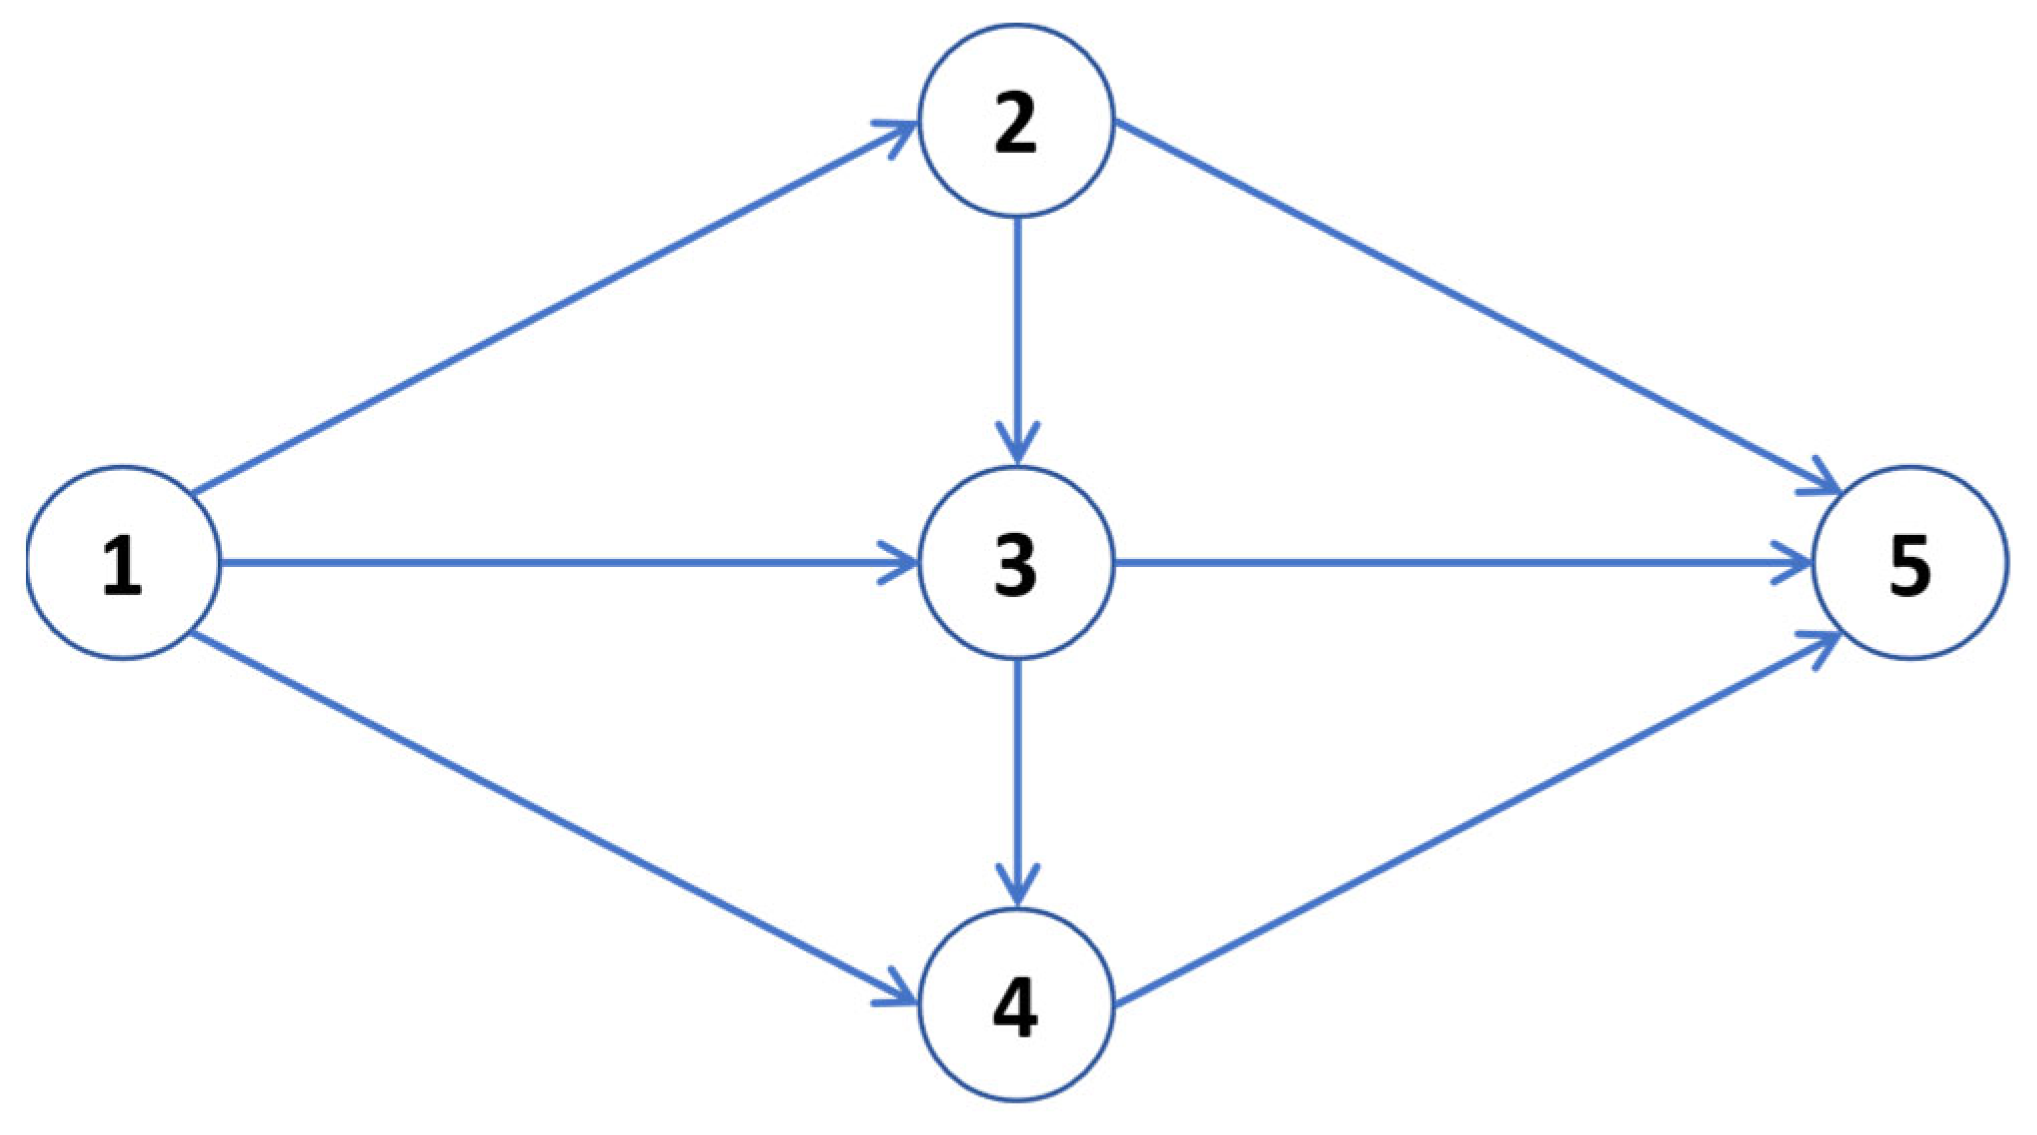
3.6. Project Tasks Precedence
In the proposed approach, project tasks are arranged in series or parallel forms based on their precedence. A task that can be performed only if the predecessor tasks are completed will be arranged in series form after the completed task. For example, first, excavation must be completed, then, retaining structure can start; therefore, these two tasks are in series form. Tasks that can be performed separately are arranged in parallel form. For example, when the walls of the third floor of a building are in progress, the plumbing of the second floor or the electrical work of the first floor can be performed simultaneously.
Figure 6 shows an example of a project displayed with the AOA system and the precedence of tasks.
3.7. Resource Constraint Problem
In case of resource constraints, a few alternatives are available as follows:
Rearranging tasks.
Trade-off between cost and time.
Trade-off between time and resources.
Trade-off between resources.
Redundancy allocation in terms of overtime for manpower and extra material.
Altering working shifts in the scheduling period.
Altering required resource allocation plan in the task processing time.
Altering maximum resource available plan.
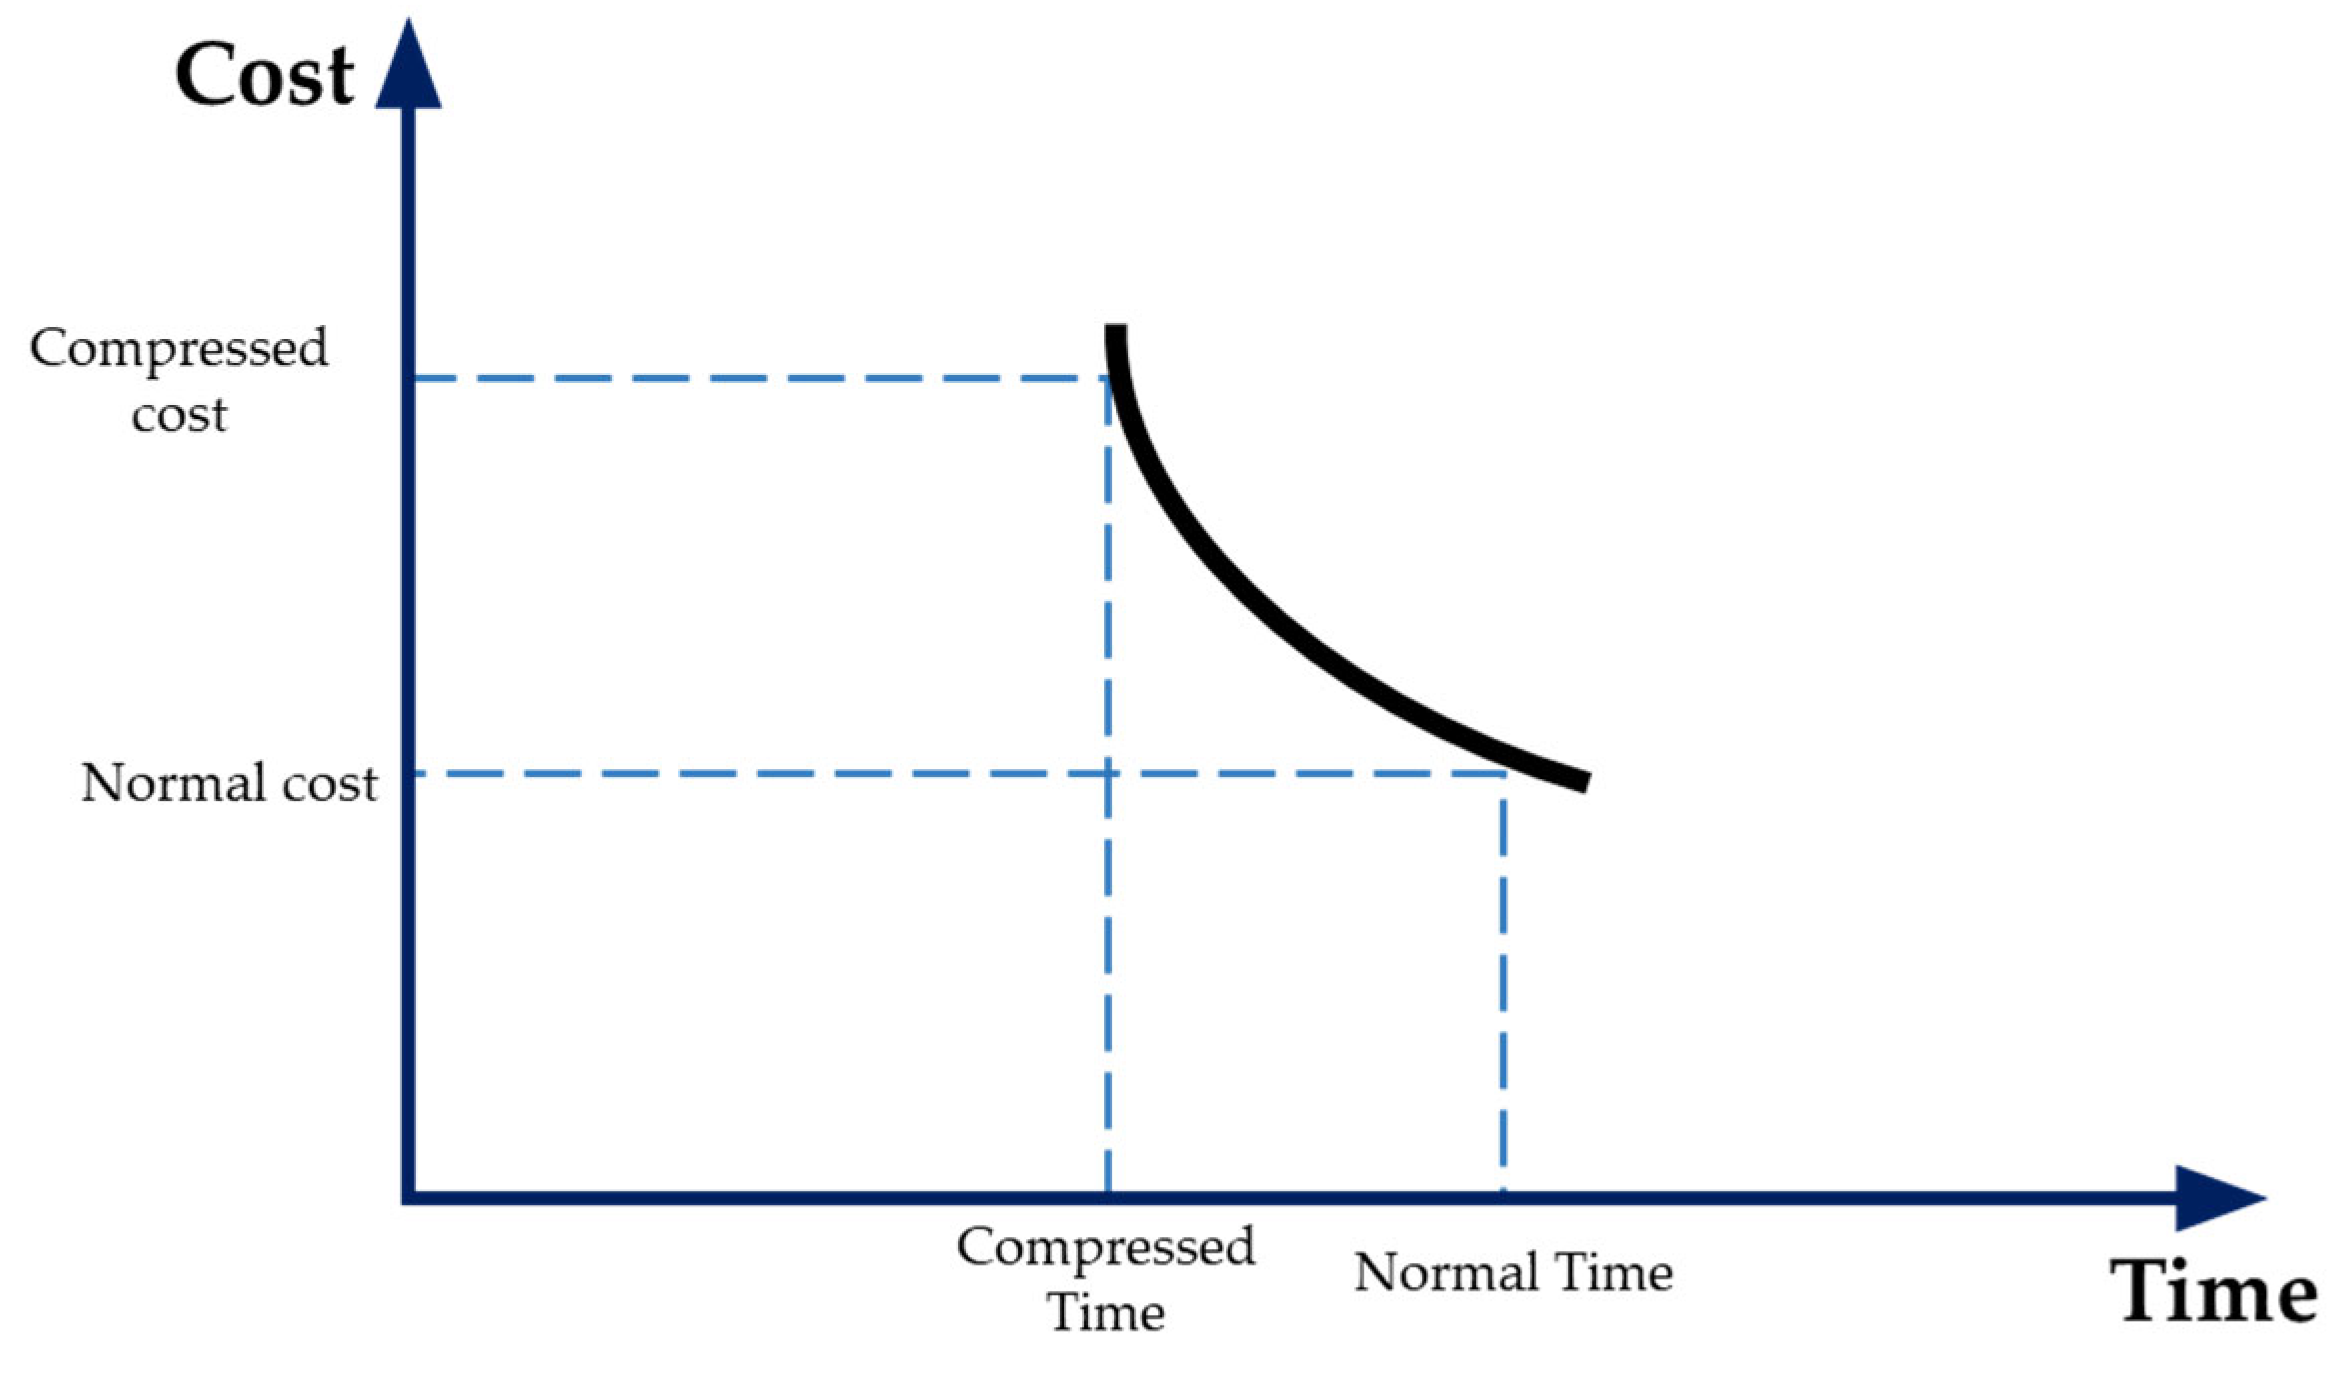
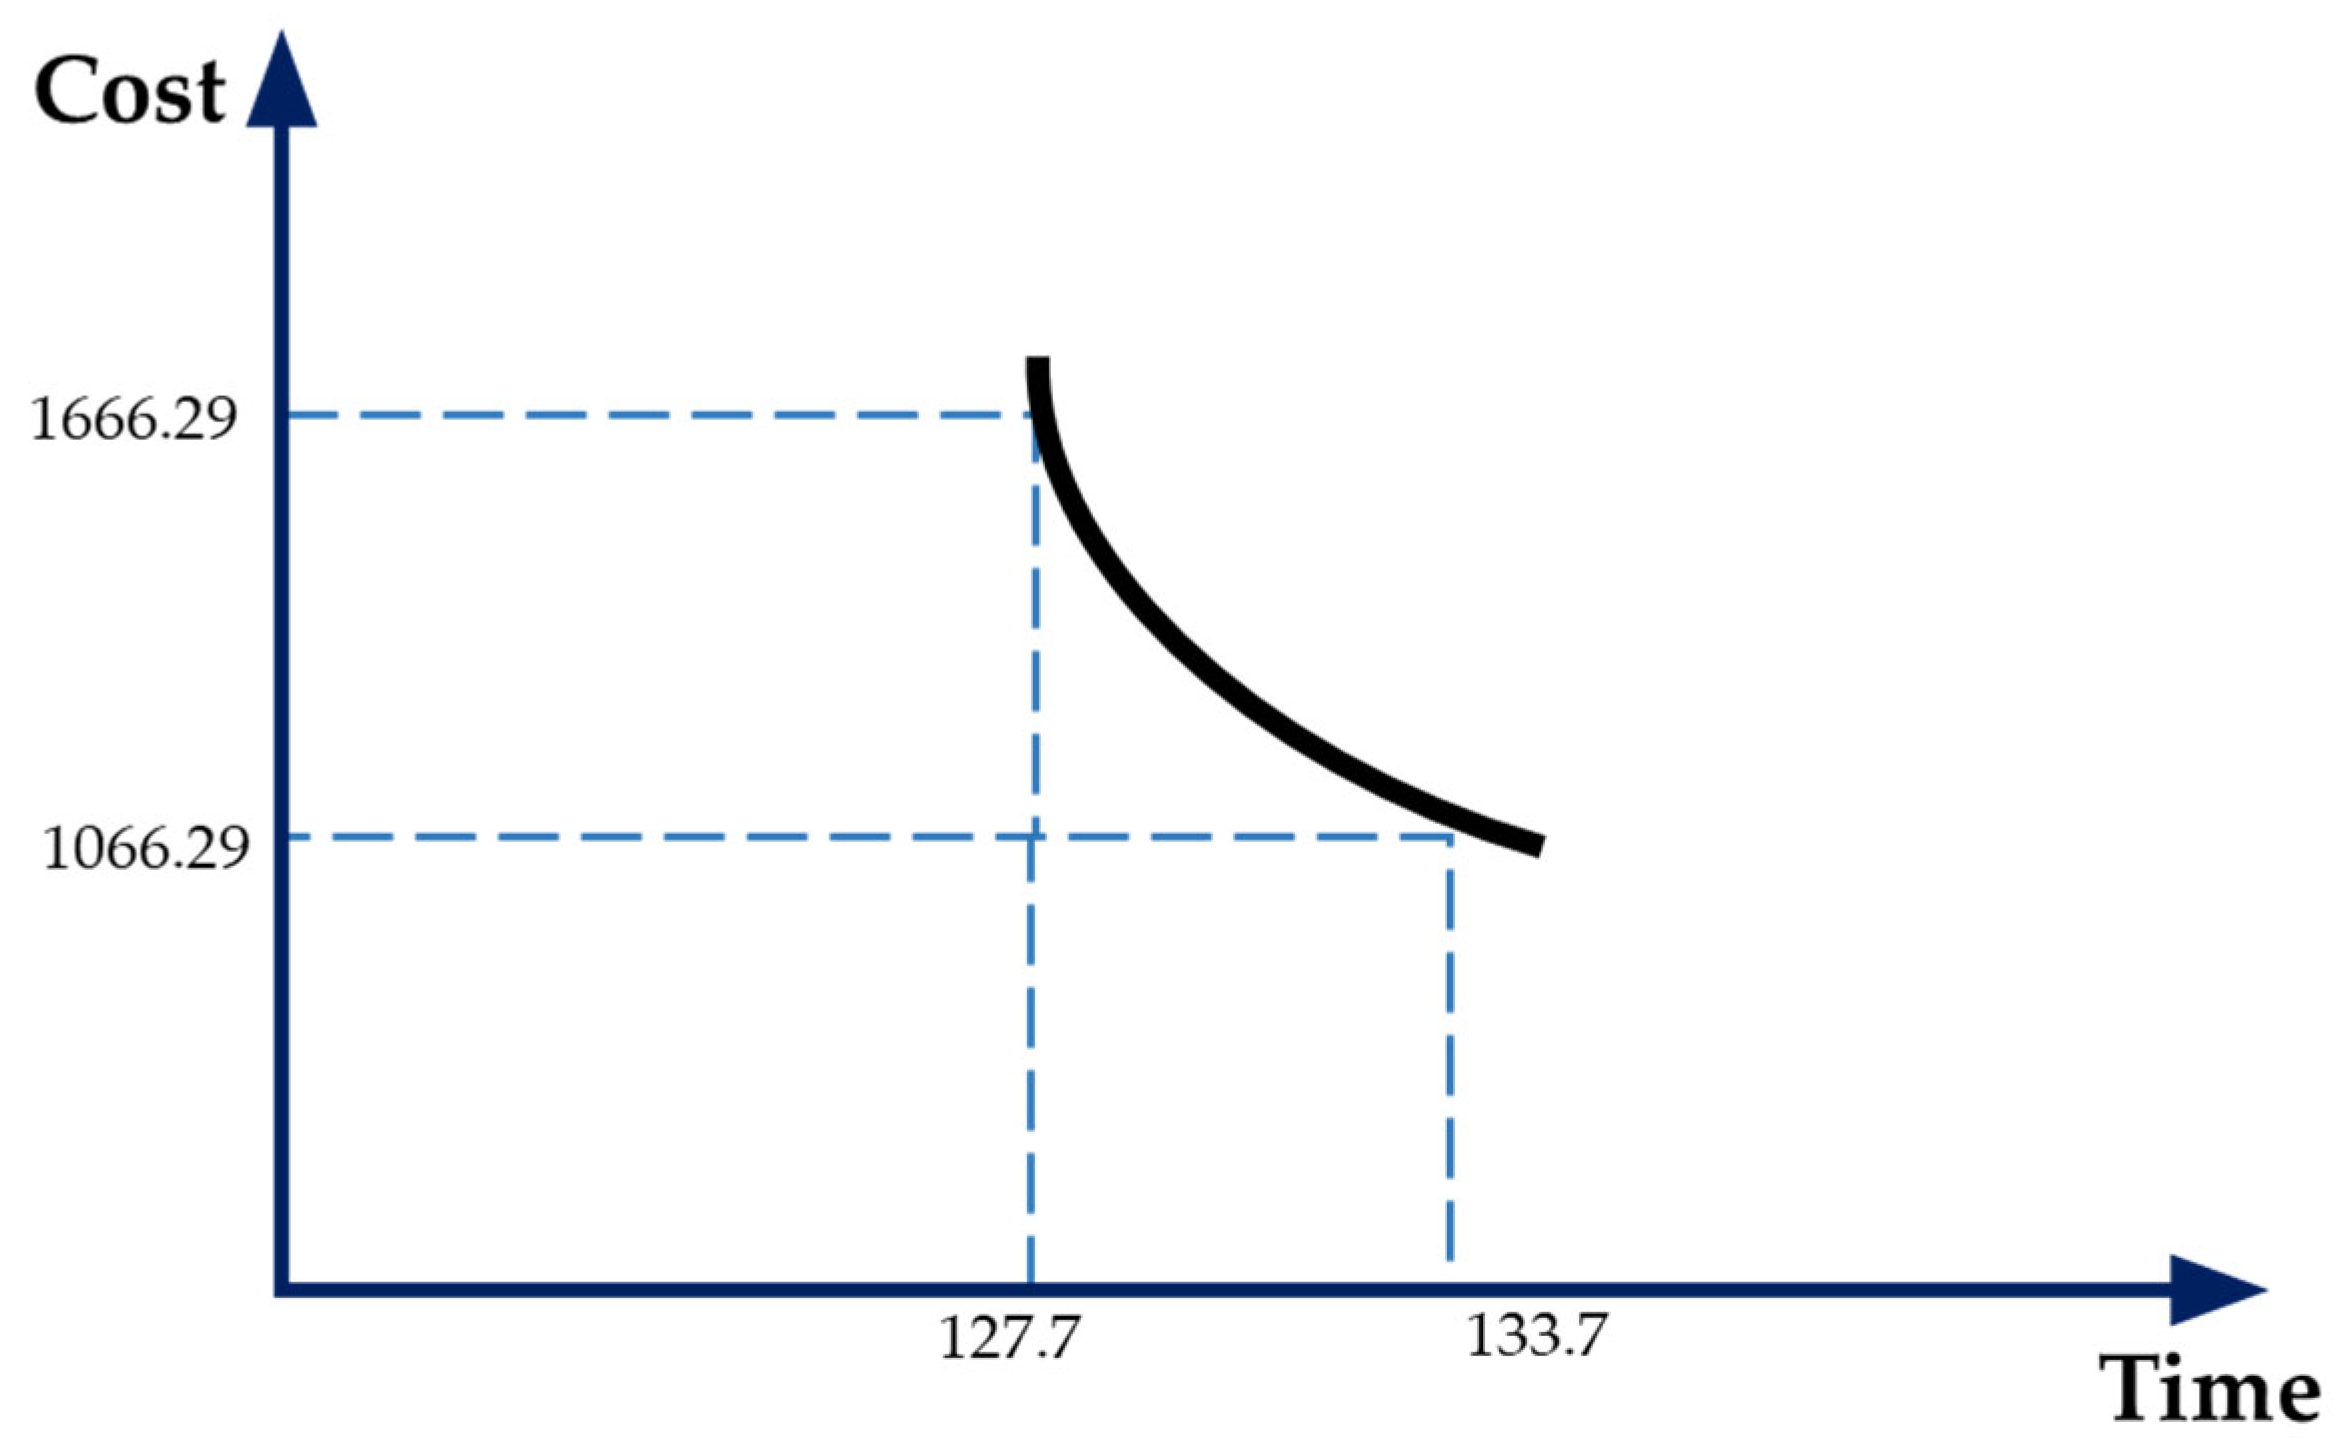
In the proposed approach, the trade-off between cost and time is considered if the project is behind schedule. The contractor is able to increase costs in order to decrease total completion time and a valid trade-off is applicable to this essence.
Figure 7 presents a trade-off between cost and time.
A similar trade-off between construction resources and time is considered if the project is behind schedule. The contractor is able to increase the number of resources in order to decrease the total completion time, and a valid trade-off is applicable to this essence.
Figure 8 presents a trade-off between resources and time.
Also, another trade-off is available to the contractor, which is a trade-off between resources and it is applicable in a situation where time is constant and the number of resources or their quality is altered. Redundancy allocation is another tool available for the contractor and is applicable in the resource constraint situation. The contractor is able to assign overtime shifts to manpower for a certain task that needs to be completed in time to help deliver the project in desired time. Altering manpower shifts in the scheduling period, changing the required resource allocation plan in the task processing time, and maximum resource available plan are other alternatives applicable to resource constraint problems.
3.8. Cost Calculation
In the proposed approach, purchasing cost and warranty cost of construction resources used in the project’s tasks are considered and they are calculated as follows:
where
indicates the purchasing cost of construction resource
from supplier
with warranty policy
,
indicates the amount of construction resource
from supplier
with warranty policy
, and
indicates the warranty cost of construction resource
from supplier
with warranty policy
. Warranty cost is calculated as follows:
where
indicates the expected cost of each modification during the life cycle [
46]. There is uncertainty about warranty coverage period
and it is assumed that
where a has a density function with cumulative distribution calculated as follows:
where
is the parameter of the exponential distribution.
is the intensity function of project failure calculated as follows:
where
and
are the cumulative distribution function and density function, respectively.
Manpower costs are calculated as follows:
where
indicates the number of manpower type
,
indicates the number of working hours for manpower type
, and
indicates the cost of each manpower type
supplied from supplier
working each day.
Total cost is calculated as follows:
3.9. DFMEA Formation
FMEA can be used to identify failures and their effects on systems and projects in order to reduce failure probability. In this method, failure information is converted to quantitative risk. There are two classes of FMEA, which are design FMEA and Process FMEA. In the proposed approach, DFMEA is implemented to identify design failures and take into account project failure related to the incompetency of design to enhance project configuration. Factors in FMEA are described as follows:
Components/sector/activity: project tasks are considered.
Failure modes: failure modes of the project tasks are considered.
Possible failure effects: Based on the client’s understanding, the failure effects are expressed.
Cause of failure: potential causes of failure modes.
Severity (S): indicates the significance of each potential failure effect.
Occurrence (O): indicates the probability of each potential failure cause.
Detection (D): indicates the probability of potential failure detection.
RPN: instead of calculating the risk potential number by multiplying severity, occurrence, and detection, the AHP method is used to allocate weight to severity, occurrence, and detection [
45]. Further on, the TOPSIS method is used to examine the priority ranking of fault modes/causes. The reason behind this approach is that calculating RPN in the traditional way by multiplying three factors with the same importance is not precise enough to prioritise fault causes. For example, RPN value 90 can be equal to 9 × 5 × 2 and 2 × 5 × 9, where the first fault mode has a severity ranking of 9 and should be concerned critical despite its detection ranking of 2 [
44].
Result: including the accomplished task and recalculating the criteria.
In order to identify potential failures in fulfilling project goals, client’s requirements and market feedback are used and after identifying the most significant potential failure by integrated AHP-TOPSIS, fault tree analysis is used to indicate different failure modes based on WBS. To identify failure causes, minimal paths and their hierarchical diagrams are used. Then for different failure modes and effects, DFMEA is implemented, and the most critical failure mode is identified using the integrated AHP-TOPSIS method. Corrective actions are considered for the most critical failure mode and a new project configuration is created. The probability of accomplishing tasks in desired time and total cost is calculated and if either of them is not acceptable to the decision-maker, DFMEA must be formed and the process must take place again. If they are both acceptable, the final project configuration is obtained.
3.10. The Analytical Hierarchy Processes (AHP)
The AHP method begins with the decision that has to be made and decomposes the decision into a hierarchical structure of criteria for evaluation. Then it exceeds the structure to evaluate alternatives as well. This method is performed by two-by-two combinations of the elements of each level by respecting the elements of the higher level. The steps in the AHP method are as follows [
45]:
A matrix has to be created to perform the pairwise comparison of criteria. Each criterion is compared to others according to its importance. In order to obtain values from pairwise comparison, the linguistic conversion scale of Saaty [
48] is used, which is shown in
Table 2.
The normalisation of the above-mentioned matrix is done in this step by using the following equation:
To calculate the weight of each criterion, the normalised matrix and the following equation are used:
Therefore, the proposed approach implements the AHP method to calculate the weights of different criteria.
3.11. The Technique for Order Preference by Similarity to Ideal Solution (TOPSIS)
The main idea behind the TOPSIS method is to form a positive ideal solution (PIS) and negative ideal solution (NIS) of the evaluated decision and then calculate the Euclidean distance to these solutions in order to rank alternatives. The PIS is the virtual best value where attributes are at their best value and NIS is the virtual worst value where attributes are at their worst value. The distances between each alternative and these solutions are then compared to prioritise alternatives. The fault mode represented by the worst alternative has a high priority level and should be eliminated. The steps in the TOPSIS method are as follows [
44]:
4. Model Implementation: A Case Study
To test the viability of the proposed model, a case study of a building construction project is carried out. Building construction projects bring significant value to stakeholders when they are compatible with client requirements and the tasks are performed in the desired time, costs, and quality. Therefore, time-efficient improvement of these projects when they are not in line with client needs is important and this can be done by the identification of challenges and the elimination of critical causes related to building construction project implementation. In the WBS presented in
Section 3, there are different tasks and in this case study, the focus is on the ‘Delicate work’ section with its tasks. Clients are familiar with the WBS of building construction projects and they have reported their requirements regarding ‘Delicate work’ and also market feedback related to this area are received. Therefore, different potential failures in fulfilling project goals regarding ‘Delicate work’ are identified (step1) and they are listed below:
Tile (natural stone or ceramic) breaking when performing flooring task
Doors or windows that do not match properly to their frame due to imprecise measuring
Low painting quality due to uneven surfaces on walls
Low plastering quality due to insufficient amount of time performed for each layer of plaster to cover the intersection of roof and walls
Noisy kitchen cabinet doors due to not sturdy enough connection to the frame
Kitchen appliances not fitting to cabinet spaces due to cabinet design
In order to identify the most critical possible failure, an integrated AHP-TOPSIS is used (step 2) based on the criteria mentioned in
Section 3.2. Determination of criteria can be carried out according to
Table 3. By implementing the AHP method, the weight of each criterion is obtained and listed in
Table 4.
The weight of criteria calculated by the AHP method is implemented in the TOPSIS method in order to rank potential failures based on these criteria and the results are gathered in
Table 5 and
Table 6.
Based on
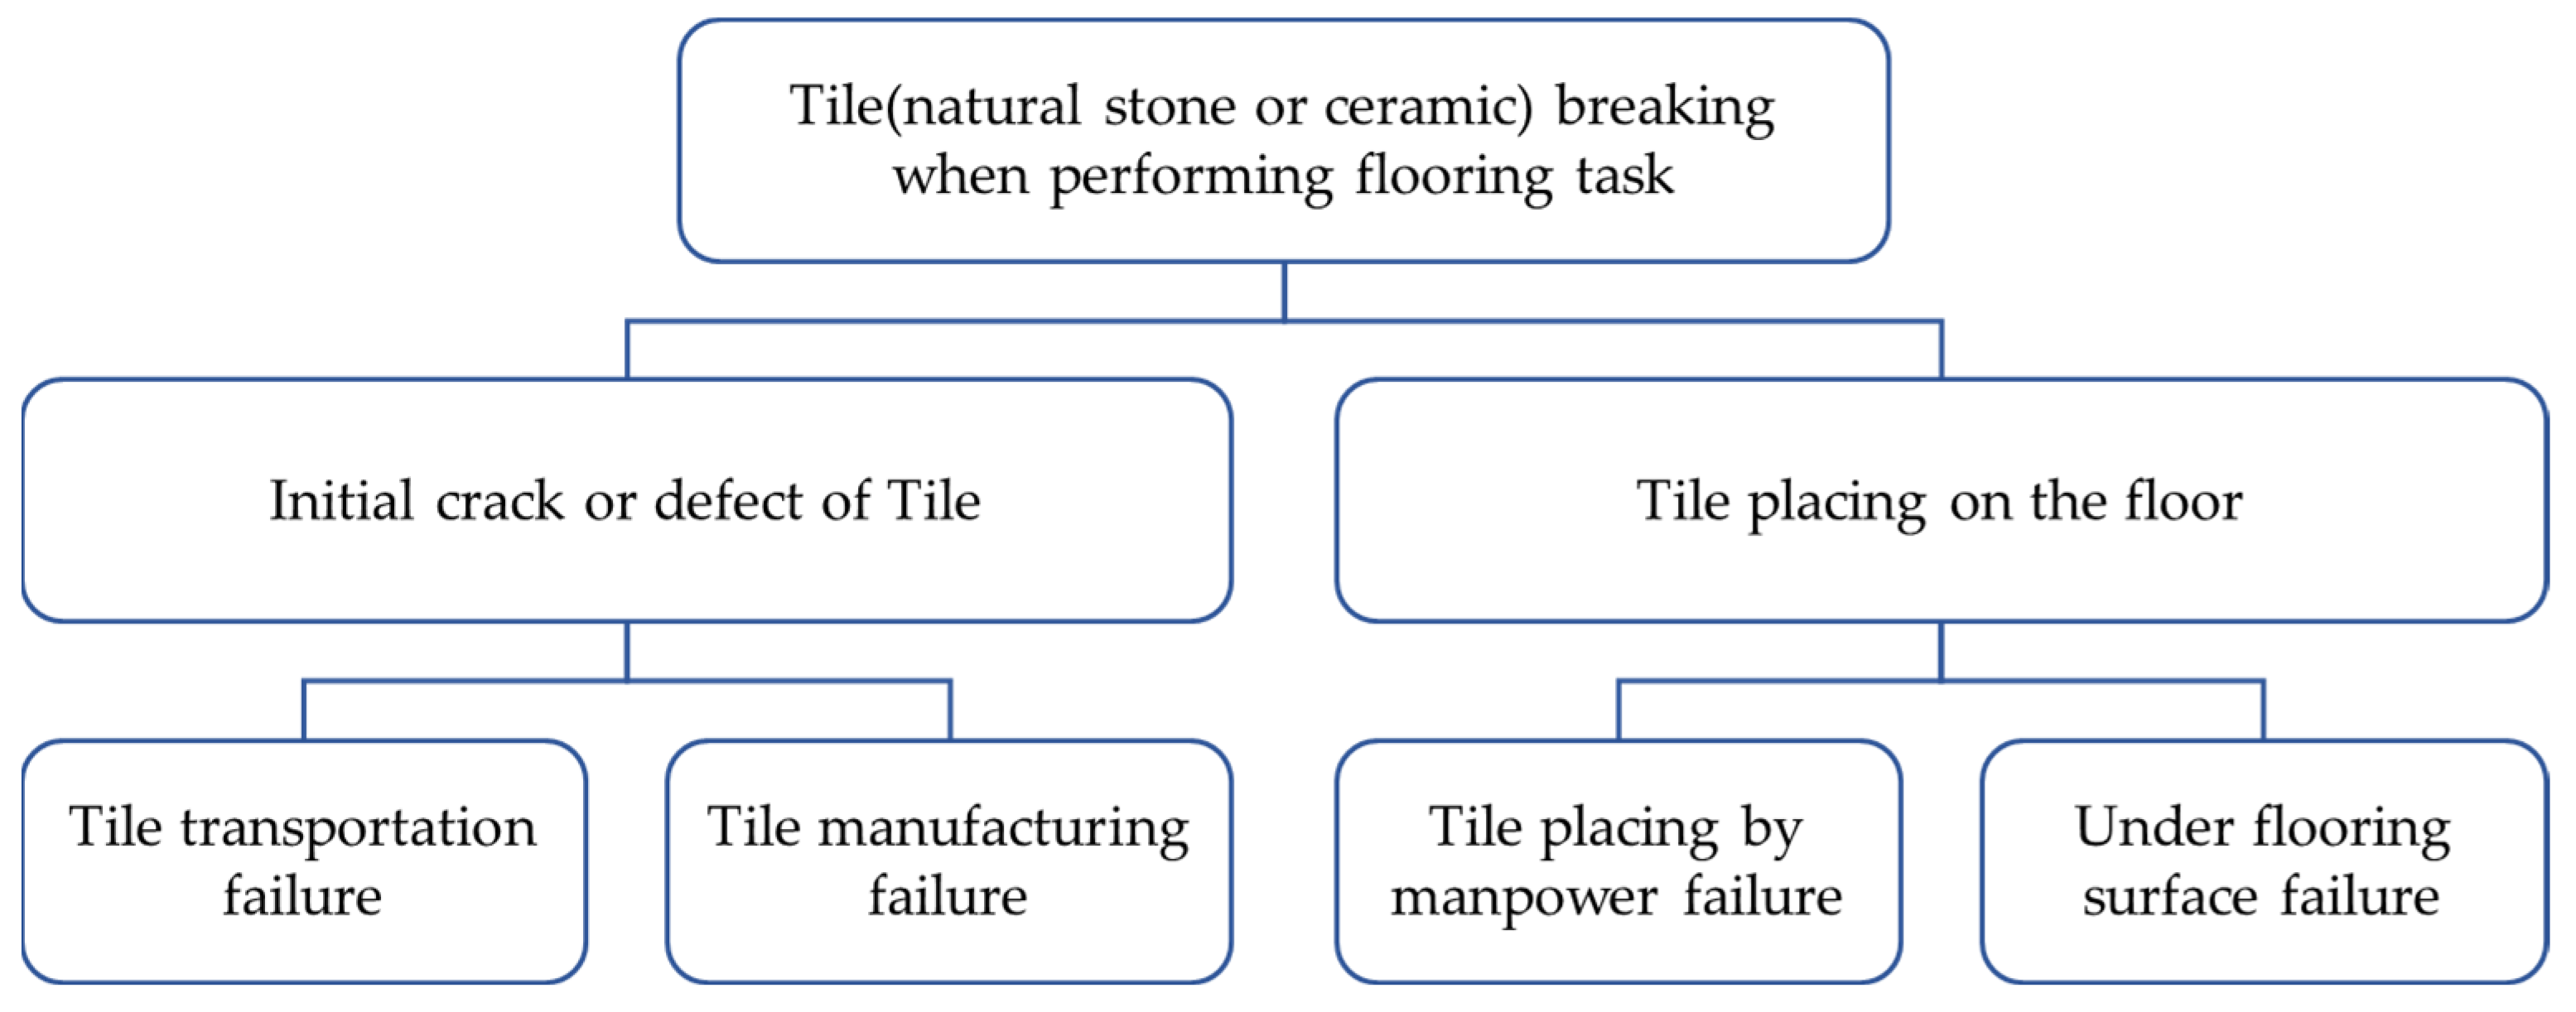
Table 6, the evaluation index regarding ‘Tile (natural stone or ceramic) breaking when performing flooring task’ is the highest among the rest and therefore, this potential failure is the most critical one and should be dealt with as a higher priority. For this failure, a fault tree is constructed (step 3), which is shown in
Figure 9. It represents two potential failure effects being ‘Initial crack or defect of Tile’ and ‘Tile Placing on the floor’. The minimal paths of the fault tree show ‘Tile transportation failure’ and ‘Tile manufacturing failure’ as failure modes for ‘Initial crack or defect of Tile’ failure effect, ‘Tile placing by Manpower failure’, and ‘Under flooring surface failure’ as failure modes for ‘Tile placing on the floor’ failure effect (step 4).
For each minimal path presented in
Figure 9, DFMEA is formed (step 5), and Effect severity, Occurrence probability, and Detection difficulty of failure modes are calculated. The determination of these criteria can be seen in
Table 7. Based on these criteria, an integrated AHP-TOPSIS is implemented to identify the most critical failure mode (step 6). The computational results are presented in
Table 8,
Table 9 and
Table 10.
Based on
Table 10, ‘Tile transportation failure’ has the highest evaluation index and therefore is the most critical failure mode. According to matrix
that indicates by what construction resources each task is performed, in the row related to the ‘Tile transportation’ task, the required tiles are supplied by two of the suppliers, where the array of the matrix is equal to 1. Thus, the relevant minimal path is mapped to the ‘Tile transportation’. An initial project configuration is considered (step 7) which is shown in
Figure 10.
Figure 10 shows a flooring task in the project configuration with two suppliers, and each supplier presents two policies. The two suppliers’ data are given in
Table 11 as follows.
The contractor has its own team of manpower, and manpower data required for flooring is presented in
Table 12 as follows.
For the first iteration, based on the initial project configuration shown in
Figure 10 and data presented in
Table 11, supplier 1 with policy 1 is randomly selected in order to calculate the total cost and probability of accomplishing the flooring task in desired time (step 8). Total cost is calculated by equations in
Section 3.8 as follows:
The total cost is acceptable to the decision-maker and the probability of accomplishing the flooring task in desired time must be computed.
Suppose the client has requested to have the flooring task done in 16 days (each day has a working shift of 8 h). In order to have the flooring task done in the desired time, the following sub-tasks must take place according to their precedence:
The sub-task of receiving Tiles from the supplier, which is the first sub-task.
The sub-task of Bringing Tiles to the desired location and the sub-task of evening under the flooring surface can be done in parallel form as they do not interrupt each other.
After the above-mentioned sub-tasks are completed, the sub-task of cutting Tiles and placing them on the floor can be performed. So, the series form is applicable.
After placing the Tiles completely, the sub-task of seam fastening the Tiles can be performed. Therefore, the series form is applicable.
The above-mentioned sub-tasks can be done if Tiles are delivered and manpower is present to operate. Supplier 1 with policy 1 provides the requested Tiles in 14 working days, so each day delayed in delivery of Tiles will add to the total project time. The total amount of time required for each sub-task of flooring task to be completed is available in
Table 13 as follows.
Based on data presented in
Table 13 and
Figure 11, the average time of flooring task is equal to 133.7 h and the variance of average time is equal to 4.33.
The probability of accomplishing the flooring task in desired time (128 working hours) is calculated as follows:
According to the above equation, it is not possible to accomplish the flooring task in the desired time requested by the client. Therefore, the initial project configuration should be improved and corrective actions (step 9) should be taken into account for the most critical failure mode being ‘Transportation Tile failure’ based on FMEA formed earlier. Different corrective actions are available as follows:
Changing the project configuration.
Remaining with supplier one but changing the policy.
Changing supplier 1 with supplier 2.
Redundancy allocation in terms of performing overtime for sub-tasks that require manpower.
Redundancy allocation in terms of hiring more manpower for sub-tasks that require manpower.
For example, Redundancy allocation in terms of overtime is taken into account. The contractor should trade-off between cost and time. Using manpower in overtime for a sub-task will cost more than normal time, and the sub-task will be completed sooner. Suppose the following data for overtime are presented in
Table 14 as follows:
This redundancy allocation does not affect the ranking of failure modes as effect severity, occurrence probability, and detection difficulty will not be changed for the most critical failure mode being ‘Transportation Tile failure’, but it will change the total cost computed. Suppose that for sub-task of cutting Tiles and placing them on the floor which takes more time than other sub-tasks, manpower is assigned to work in overtime to meet client’s desired time. If the manpower operates 6 h in overtime, total cost and probability of accomplishing the flooring task in desired time are computed as follows:
Therefore, the probability of accomplishing the flooring task in desired time is increased and is now more acceptable than before to decision-maker, but the increase in total cost should be compared to decision-maker’s expectations and the trade-off is displayed in
Figure 12. If the corrective action of remaining with supplier 1 but changing to policy 2 is considered, effect severity, occurrence probability, and detection difficulty will be changed for the most critical failure mode being ‘Transportation Tile failure’. Therefore, a new project configuration is generated (step 10) and the ranking of failure modes should be done again.
Table 15 and
Table 16 display the computational results. The total cost and probability of accomplishing the flooring task in desired time should be calculated as follows:
According to the results, ‘Transportation Tile failure’ is still the most critical failure mode with very little difference, and total cost and the probability of accomplishing the flooring task in desired time are increased. If both of them are acceptable to the decision-maker and there are not any updates available to the fault tree, the final project configuration, probability of accomplishing tasks in the desired time, and total cost are obtained. If there are any updates available to the fault tree, the fault tree should be updated (step 3) and the rest of the procedure takes place in the same way mentioned to this point. If either one of them or both of them are not acceptable to the decision-maker, then DFMEA must be formed again (step 5).
Based on the results, different corrective actions are available such as changing configuration, changing policy, changing supplier, and Redundancy allocation. These corrective actions improve the ranking of failure modes and increase the probability of accomplishing tasks at the desired time and affordable cost. The decision-maker is able to select reliable suppliers, policies, and corrective actions. In the proposed approach, the most critical potential failure is selected. Failure modes are scrutinised one by one based on priority to improve the probability of accomplishing tasks to reach different options for the decision-maker to choose between suppliers and policies.
5. Discussion
The proposed project configuration framework, which consists of a combination of failure analysis, MADM methods, and acceptance criteria, will effectively and accurately identify failure modes and prevent their occurrence. A small number of articles such as Jensen, Lidelöw, and Olofsson [
31] and Schönbeck, Löfsjögård, and Ansell [
27] have addressed construction project configuration regarding the role of configuration information in responding to project implementation problems and mass customisation concept application in the construction environment, respectively. However, these articles did not consider issues that lead to projects not meeting client’s requirements and did not investigate on causes of these issues to improve construction project configuration by considering various criteria in minimum time. Also, none of them has taken into account the application of quality management tools and risk assessment with regard to project management. Extracting the fault tree and failure modes from the WBS of the project is one of the remarkable points of this study that prevents negligence in performing tasks and causes close monitoring of all activities, which leads to improvement in project implementation in terms of costs and time favouring the client and contractor as stakeholders. In addition, although few studies, namely Piroozfar, Farr, Hvam, Robinson, and Shafiee [
30] and Schönbeck, Löfsjögård, and Ansell [
27], considered enhancing the overall quality of the project by utilising configuration information in construction project implementation and applying customisation and modularisation in the configuration platform, respectively, there is no study in construction project configuration that considers FTA approach, integrated AHP-TOPSIS, PERT technique, DFMEA approach, different configuration systems, and redundancy allocation simultaneously. By so doing, the possibility of detecting the most critical failure and preventing it from happening, as well as the likelihood of completing the project at the desired time and cost increase, and the stakeholders benefit from this significantly. Another advantage of this study is that the presented algorithm provides various options for the decision-maker to improve quality, total cost, and project configuration as it is possible to trade-off between cost and time. Also, by implementing the algorithm, all potential failures and their following failure modes are addressed thoroughly which indicates a complete risk assessment, and this is performed based on their ranking obtained by the integrated AHP-TOPSIS technique. This one-by-one evaluation of failures based on their priority leads to an excessive reduction in processing time in comparison to randomly selecting failures and constructing fault trees based on the WBS and taking corrective actions for failure modes. The evaluation process of failures based on the MADM methods results in finding and addressing critical failures sooner which results in faster improvement of the construction project implementation and more tangible and more significant time and cost reduction at the first iterations of the algorithm, which favours both the contractor and the client as stakeholders.
Since in this study, WBS is used to derive fault trees, and as a result, detect failures, the number of WBS levels and consequently the number of fault tree levels can affect solution time. In addition, as the complexity of WBS increases, the number of minimal paths may rise, which can raise process time. The client’s requirements in terms of desired time for each task and the entire project are key factors in the proposed approach. In better words, the risk-averseness of the client results in the complexity of the contractor’s project implementation. The less risk-averse the client tends to be, the contractor will have to increase costs and apply redundancy allocation or more expensive supplier policy to meet the client’s due dates. On the other hand, the more risk-taker the client tends to be, the contractor is able to push due dates and perform tasks with fewer manpower costs or reach agreements with suppliers having cheaper policies. Therefore, client’s risk-acceptance and risk-averseness impact contractor’s performance and the number of trade-offs required to implement the entire project. Thus, the proposed model can comprehensively evaluate a construction project from various aspects, namely project execution time, uncertainty in the time of completing tasks, applying customer feedback on the final project at reasonable time and cost, and considering different modes of performing tasks in relation to each other (series, parallel, and redundancy), which enables the delivery of the final project to a large extent in accordance with customer needs and this remarkably benefits the client and the contractor as stakeholders.
6. Conclusions
Project configuration is an important factor in project customisation. Clients desire the project to be completed with high quality and low cost for construction projects based on the intended schedule. To do so, systematic construction project configuration management can be applied. In this paper, an integrated FTA-DFMEA approach is proposed that implements integrated AHP-TOPSIS in order to improve project configuration. Client requirements and market feedback are taken into account to identify potential failures, and an integrated AHP-TOPSIS is used to rank these potential failures and select the most critical potential failure. Then, FTA which is extracted from the WBS of the construction project is used to indicate minimal paths, and an inverse search is done to determine relevant tasks and resources. FMEA is used to identify failure modes, effects, and causes in order to take corrective actions and improve project configuration. Also, suppliers with different policies, delivery lead times, warranty costs, and purchasing costs, as well as different configuration systems based on the hierarchical decomposition of tasks in series or parallel forms and redundancy allocation, are considered. The results showed the efficiency of the proposed model in maintaining the quality of projects while paying attention to the time and cost. The approach proposed in this paper benefits both the client and the contractor as stakeholders in a construction project by means of improving project configuration through risk assessment of tasks by FTA and FMEA as quality management tools and aiding the failure evaluation through AHP and TOPSIS as MADM techniques. The integration of these approaches aids the contractor to identify and evaluate all potential failures and their failure modes one by one based on their priority in order to take corrective actions and reduce the risk of failure occurrence which results in a more efficient construction project implementation and leads to meeting client’s requirements.
However, there exist some limitations to this study that should be considered when setting directions for future research. For instance, our model overlooked considering construction delay factors from the perspectives of different project stakeholders. In better words, this research only deals with the delays resulting from the actions of the contractor or its brokers. Hence, employer-caused delay factors can be investigated to cover the limitations of the designed model. Also, since in this study, AHP-TOPSIS is utilised to rank failures, the comparison of this approach with other MADM and ranking methods, as well as their strengths and weaknesses, can be considered for further studies. Additionally, further research can examine the application of the developed model for other real cases, especially construction projects under severe uncertainty, such as post-disaster construction projects.


