1. Introduction
The assembled concrete structure has been attractive and supportable from many governments as its advantages in terms of high industrialization, high product quality, and good environmental protection.
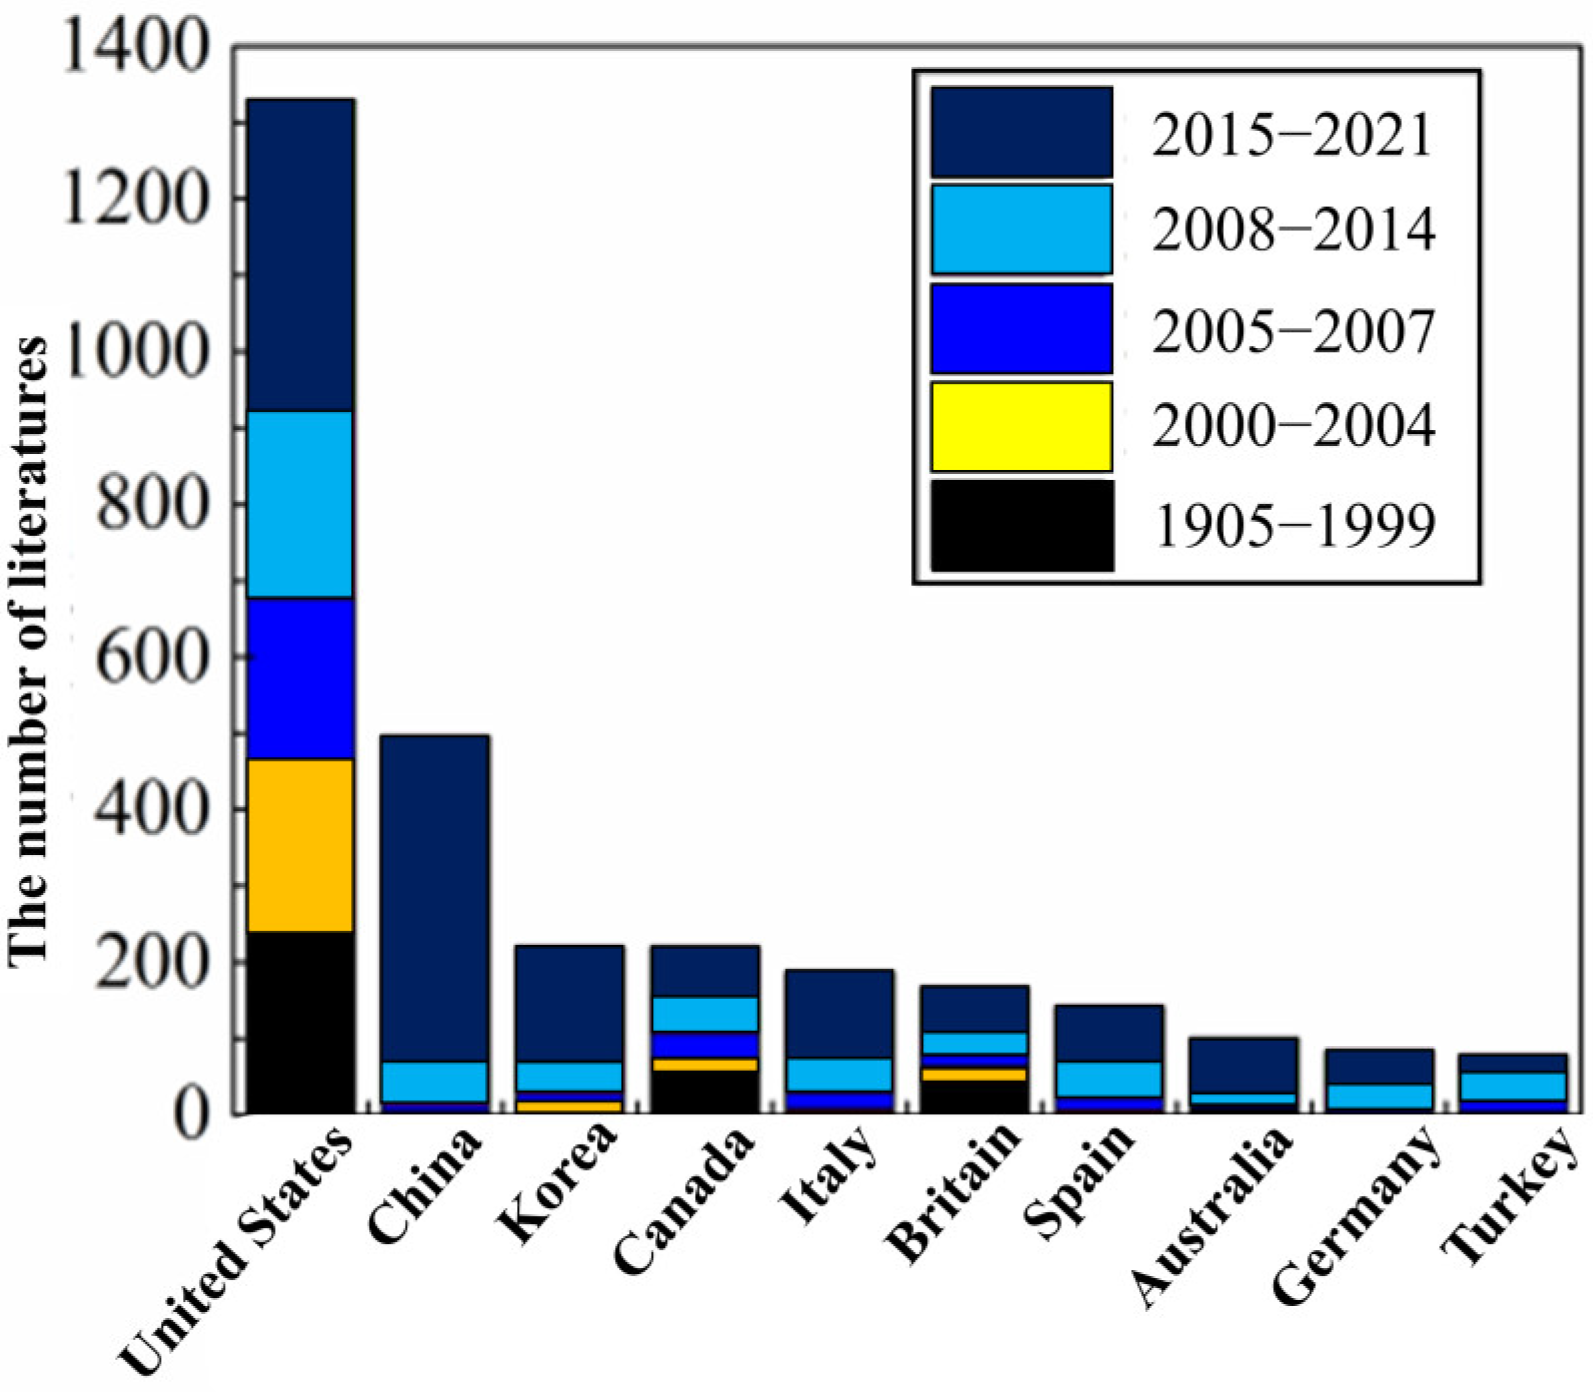
Figure 1 summarized the literature with precast concrete as a keyword in each country in recent years. Due to the increased quotations abruptly from 2015 to 2021, which reflected that the assembled concrete structure had become a popular research topic. Currently, there is more attention on the seismic performance of wall panels in the assembled concrete structure, and it has been highlighted the need to improve their thermal properties. For example, Cong [
1] focused on improving the fire resistance of wall panels to obtain better thermal insulation properties. Chikun [
2] tried to utilize lightweight concrete to prepare structural wall panels. Thus, it is inevitable to improve thermal performance and develop the precast wall panels as well as wall panel joints in further work.
There are two methods to enhance the thermal performance of the precast wall panel joints. Firstly, the wall panel joints are equipped with insulation layers (e.g., internal, external, and sandwich insulation). Secondly, the materials of the joints show excellent thermal performance. Ceramsite concrete has high specific strength, low apparent density, and good thermal insulation properties, to present significant advantages as a material for wall panel joints [
3]. Whereas sintered fly ash ceramsite concrete also has notable long-term durability and economic and environmental benefits [
4,
5]. Owing to the closed pore structures for sintered fly ash ceramsite, it would be potential to improve the long-term durability of ceramsite concrete results from the crystallization pressure generated by ice or sulfate attack. The ceramic particles would absorb water in the early stage of cement hydration and release during the cement hardening process, which can promote the degree of hydration and strengthen the bonding properties of the aggregate and cementitious materials. Thus, it provides excellent long-term durability for ceramsite concrete [
6,
7,
8,
9,
10]. Generally, ceramsite concrete could be utilized in energy-efficient wall panel joints. For instant, Ma and co-workers reported the applications of assembled composite panels [
11,
12], ceramsite concrete combined with a sandwich insulation layer exhibited good thermal and seismic performance, and met the requirements of multifunctional wall panels. The temperature distribution and heat flux density of the inner surface and outer surface of the wallboard are analyzed by numerical simulation, which proves that the wallboard has good thermal performance [
13]. However, the research on assembled ceramsite concrete sandwich composite wall panels still have not formed a system yet. And the joints of wall panels are the key to determining the integrity, safety, and reliability of assembled concrete structures. To optimize an appropriate structural form and prove the seismic performance of the joints is essential to develop such prefabricated assembled concrete structures.
The connection of vertical distributed steels is a crucial factor so to affecting their seismic performance [
14,
15,
16]. Several literature have confirmed the excellent integrity and seismic performance of precast shear walls via using sleeve connections [
17,
18,
19]. Khaled et al. [
14] compared the seismic performance tests of shear walls with different types of steel connections. The results proved that the best seismic performance of the specimens with grouted sleeve connections and shear connectors was achieved, while bolted connections were not a good choice. Qian Jieru et al. [
20] demonstrated the effect of different connection methods of vertical reinforcement on the seismic performance of precast shear wall specimens. The results showed that the energy dissipation capacity and the ultimate displacement angle of the specimens with sleeve connections were better than others. Therefore, it is feasible to use sleeve connections for vertical reinforcement in assembled wall panel joints.
On the other hand, some literature reported that utilizing various strength measurements such as concealed bracing, hidden columns, and steel trusses to ensure that energy-efficient wall panel joints possess good seismic performance. All these measurements could improve the lateral force resistance of wall panel joints [
21,
22,
23,
24]. The literature [
25] compared the effect of section steel hidden column and channel steel hidden column on the seismic performance of ceramsite concrete wall panels and found that the type of hidden column had a significant effect on the seismic performance of the wall panels. However, the wall panel and the main structure are connected by bolt, which is more suitable for assembled steel structures. The boundary members have a significant influence on the working performance of wall panel joints, and there are few studies on the effect of different types of hidden columns on ceramsite concrete sandwich wall panel joints.
Herein, we proposed a new type of composite sandwich wall panel joint and aimed to investigate and improve the seismic performance of the joints. Two types of ceramsite concrete sandwich L-shaped composite joints were designed in this study. Ceramsite concrete as the structural layer material and polystyrene panels as the sandwich insulation layer, which was combined into a sandwich web by tension bars. The test program was composed of the test group and the control group. Specimens of the test group are composed of sandwich webs and a rectangular hidden column. The specimen of the control group is designed as an L-shaped hidden column and uses the grouted sleeve connections to connect the vertical distribution steels. The failure character, the strain of reinforcement, hysteresis curve, skeleton curve, stiffness degradation, energy dissipation capacity, and ductility of the specimen are investigated through the quasi-static test. Subsequently, the seismic performance of different types of specimens is evaluated according to the results to optimize the ideal construction formation of the joints. Consequently, it provided theoretical support for the application of assembled ceramsite concrete sandwich composite wall panel system and provide directions for more research on assembled concrete structures.
2. Materials and Methods
Quasi-static test is the most commonly used method to evaluate the seismic performance of structural members. Therefore, this paper mainly evaluates the influence of different factors on the seismic performance of joints by quasi-static test. Moreover, the mechanical tests of the materials used in the joint specimens are carried out, including the compressive test of ceramsite concrete and the tensile test of steel bar and sleeve. Based on the properties of the material used in the test, this paper can more accurately discuss the seismic performance of the specimen.
2.1. Experimental Parameters and Plan
Two groups of specimens were proposed in this study. The test group investigated the seismic performance of ceramsite concrete sandwich composite joints. Three specimens, L−1, L−2, and L−3 (cast-in-place joints with the rectangular hidden column), were designed. The control group tried to figure out the influence of the connection method between the vertical reinforcement and the hidden column construction on the seismic performance of wall slab joints. Therefore, TL−1 was assembled by sleeve connections and the L-shaped hidden column. The two groups of specimens were subjected to the quasi-static test, and the seismic performance of the specimens was evaluated by analyzing the damage characteristics, including loading and deformation capacity, ductility, and energy dissipation capacity.
2.2. Test Specimen
Cast-in-place joints with the rectangular hidden column (L−1, L−2, and L−3): The load beam, the hidden column, sandwich webs, and the base beam were cast into the whole. The dimension of the sandwich webs is 582.5 mm (length) × 240 mm (width) × 1280 mm (height). The section of the hidden column is 240 mm × 240 mm.
Figure 2 and
Figure 3 are the schematic representation of the specimen size, arrangements of rebars, and connections in the specimens. Rebars of C8 (strength level is HRB400 and the diameter is 8 mm) are employed as distributed rebars with a spacing of 150 mm (C8@150), distributed in the structural layer on both sides of the web. The rebars of HPB300 strength level are used as tie bars in the sandwich webs. All longitudinal rebars of the webs were anchored to the base beam.
Assembled joint with L-shaped hidden column (TL−1): The load beam and the sandwich webs were cast together. The base beam was prefabricated separately. Then, the vertical distributed reinforcement in the webs and the rebars reserved on the base beam, which were connected by GTZB4-14-B semi-grouted sleeves. The L-shaped hidden column was employed between the webs of the specimen. The dimension of the sandwich webs is 240 mm (width) × 450 mm (length) × 1280 mm (height). Rebars of C8 are used as distributed rebars with a spacing of 150 mm (C8@150), distributed in the structural layer on both sides of the web. The rebars of HPB300 strength level were used as tie bars in the sandwich webs. The horizontally distributed rebars in the webs extend into the hidden column.
2.3. Material Properties
The HRB400 strength level was used for the distributed rebars with a diameter of 8 mm. The yield strength (f
y) and ultimate strength (f
u) were 464 MPa and 646 MPa, respectively. The tensile properties of the HRB400 strength level rebars with diameters of 12 mm, 14 mm, and 20 mm are listed in
Table 1. Three standard cubic specimens (size of 100 mm × 100 mm × 100 mm) of plain concrete and ceramsite concrete were reserved for compressive tests during the joint casting. The results of the compressive test are listed in
Table 2. Additionally, the properties of semi-grouted sleeves, ceramsite, and polyphenyl plates are shown in
Table 3,
Table 4 and
Table 5.
2.4. Loading Plan
The quasi-static test was carried out in the civil and architectural laboratory of Henan University. The loading device was mainly divided into 200 T range hydraulic jacks for vertical loading and 100 T range transverse jacks for transverse loading, and the connection method is shown in
Figure 4.
2.4.1. Vertical Loading
An axial force was utilized on top of the specimen to simulate the load from the superstructure by a vertical actuator. An L-shaped steel beam with sufficient stiffness was placed between the vertical actuator and the loading beam. The size of the steel beam was the same as that of the loading beam to simulate the uniform load applied by the superstructure to the joint. Moreover, a sliding roller was placed between the steel beam and the vertical actuator to reduce the error caused by the slip between the steel beam and the actuator. The magnitude of the force applied during preloading is 40% of the full load vertical force, and then the vertical pressure was increased to full load and maintained until the end of the test when the test officially started.
2.4.2. Horizontal Loading
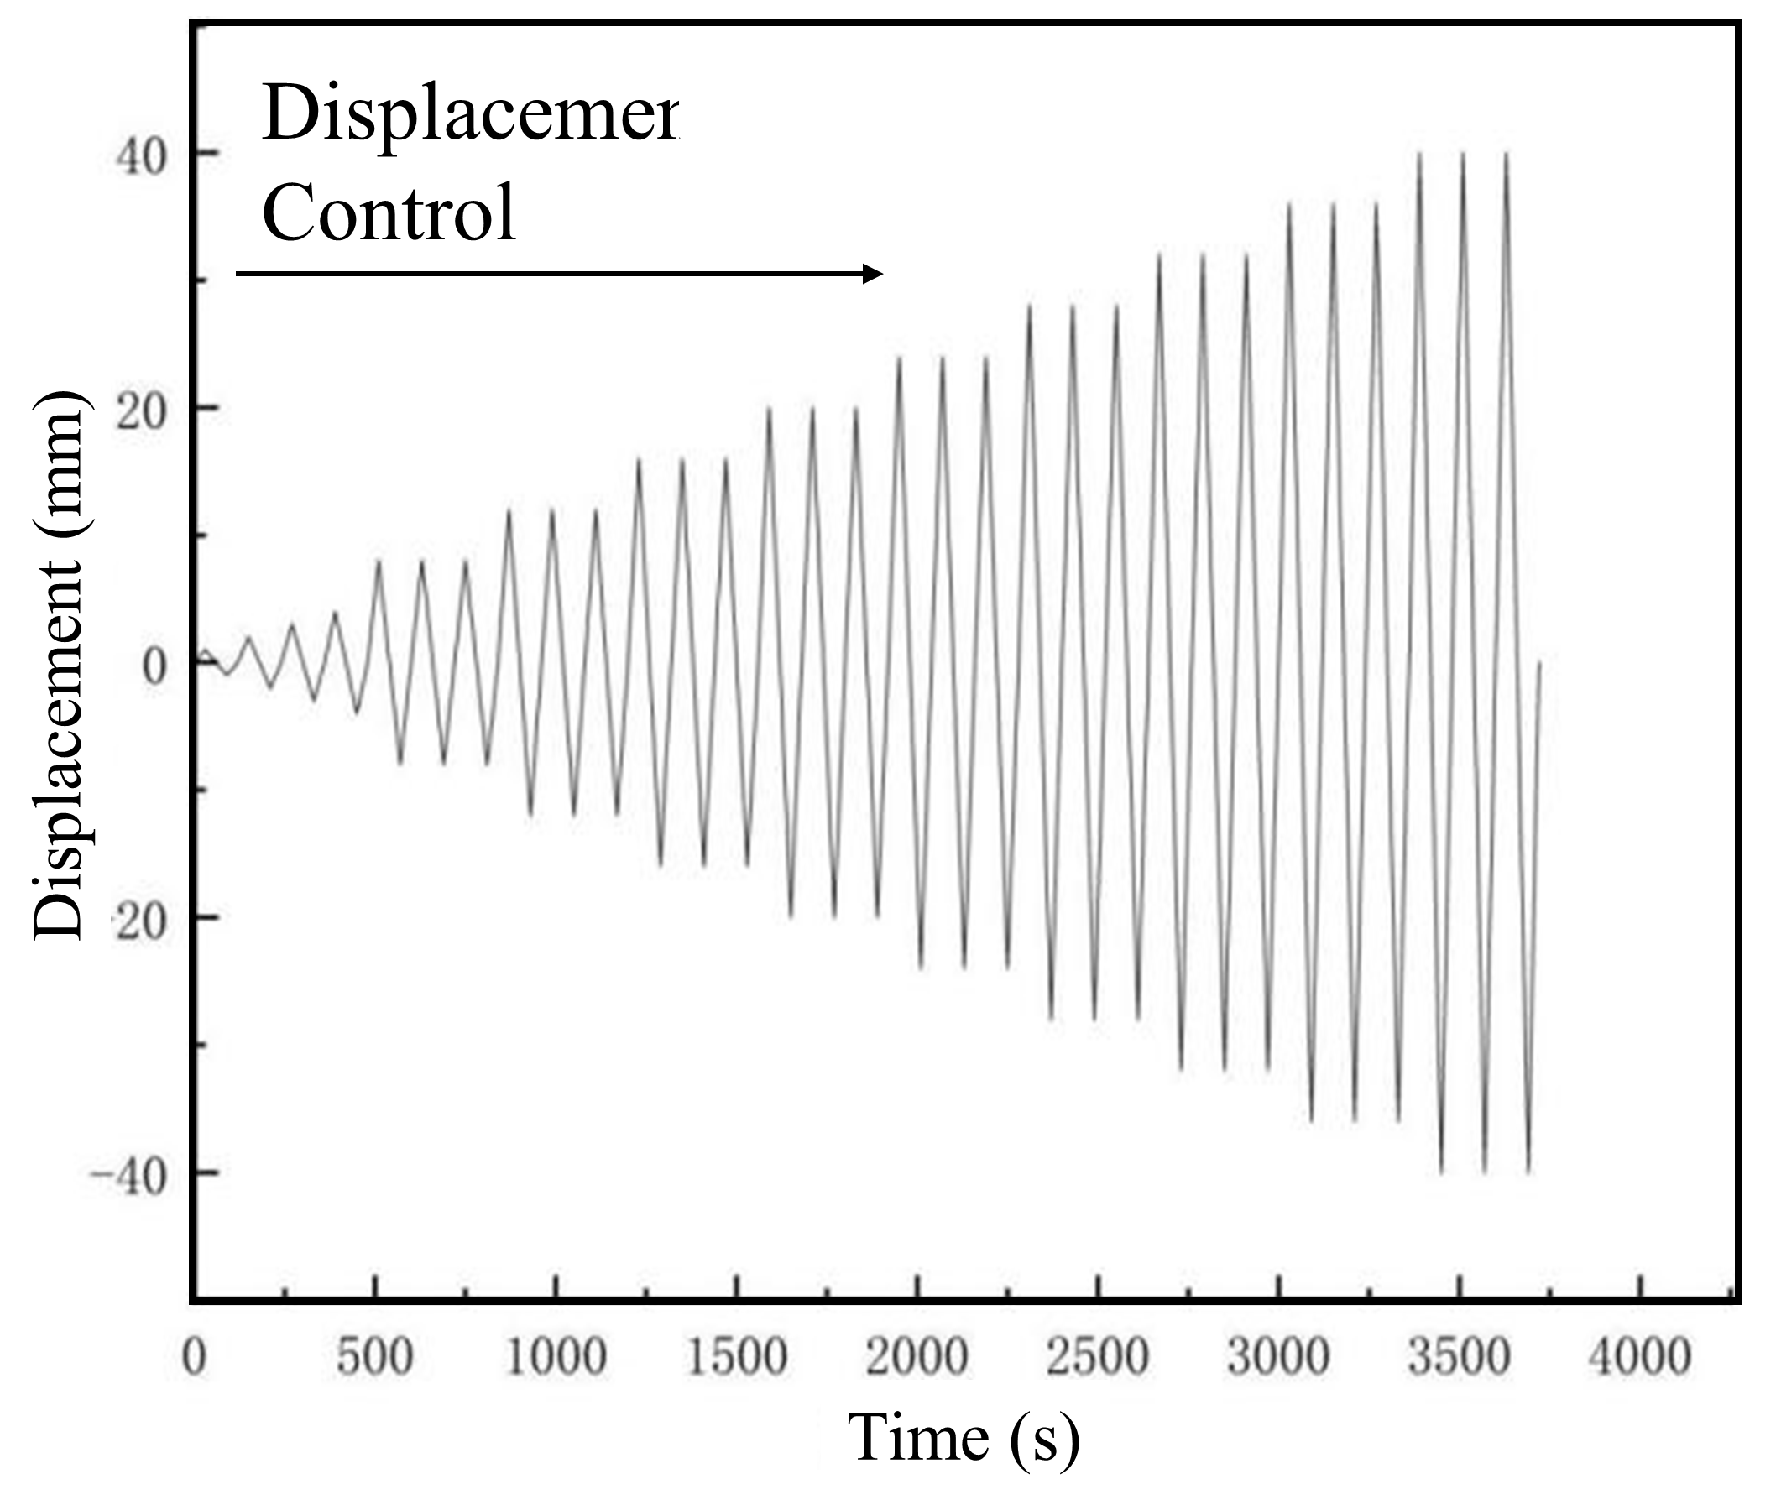
According to JGJ/T 101-2015, prior to the formal test, the specimen should be preloaded in the horizontal direction to reduce the error caused by inelastic deformation (preload did not allow damage to the specimens). The loading system of the test should be determined according to the specimen and the research purpose. The loading system should ensure that each loading level standards are consistent, and a reasonable loading spectrum should be selected according to the actual situation and test characteristics. The loading time of each load level input in this test was consistent with the unloading time around 30 s. The loading curve is shown in
Figure 5. When the bearing capacity of the specimen decreases to 85% of the peak load, the test stopped.
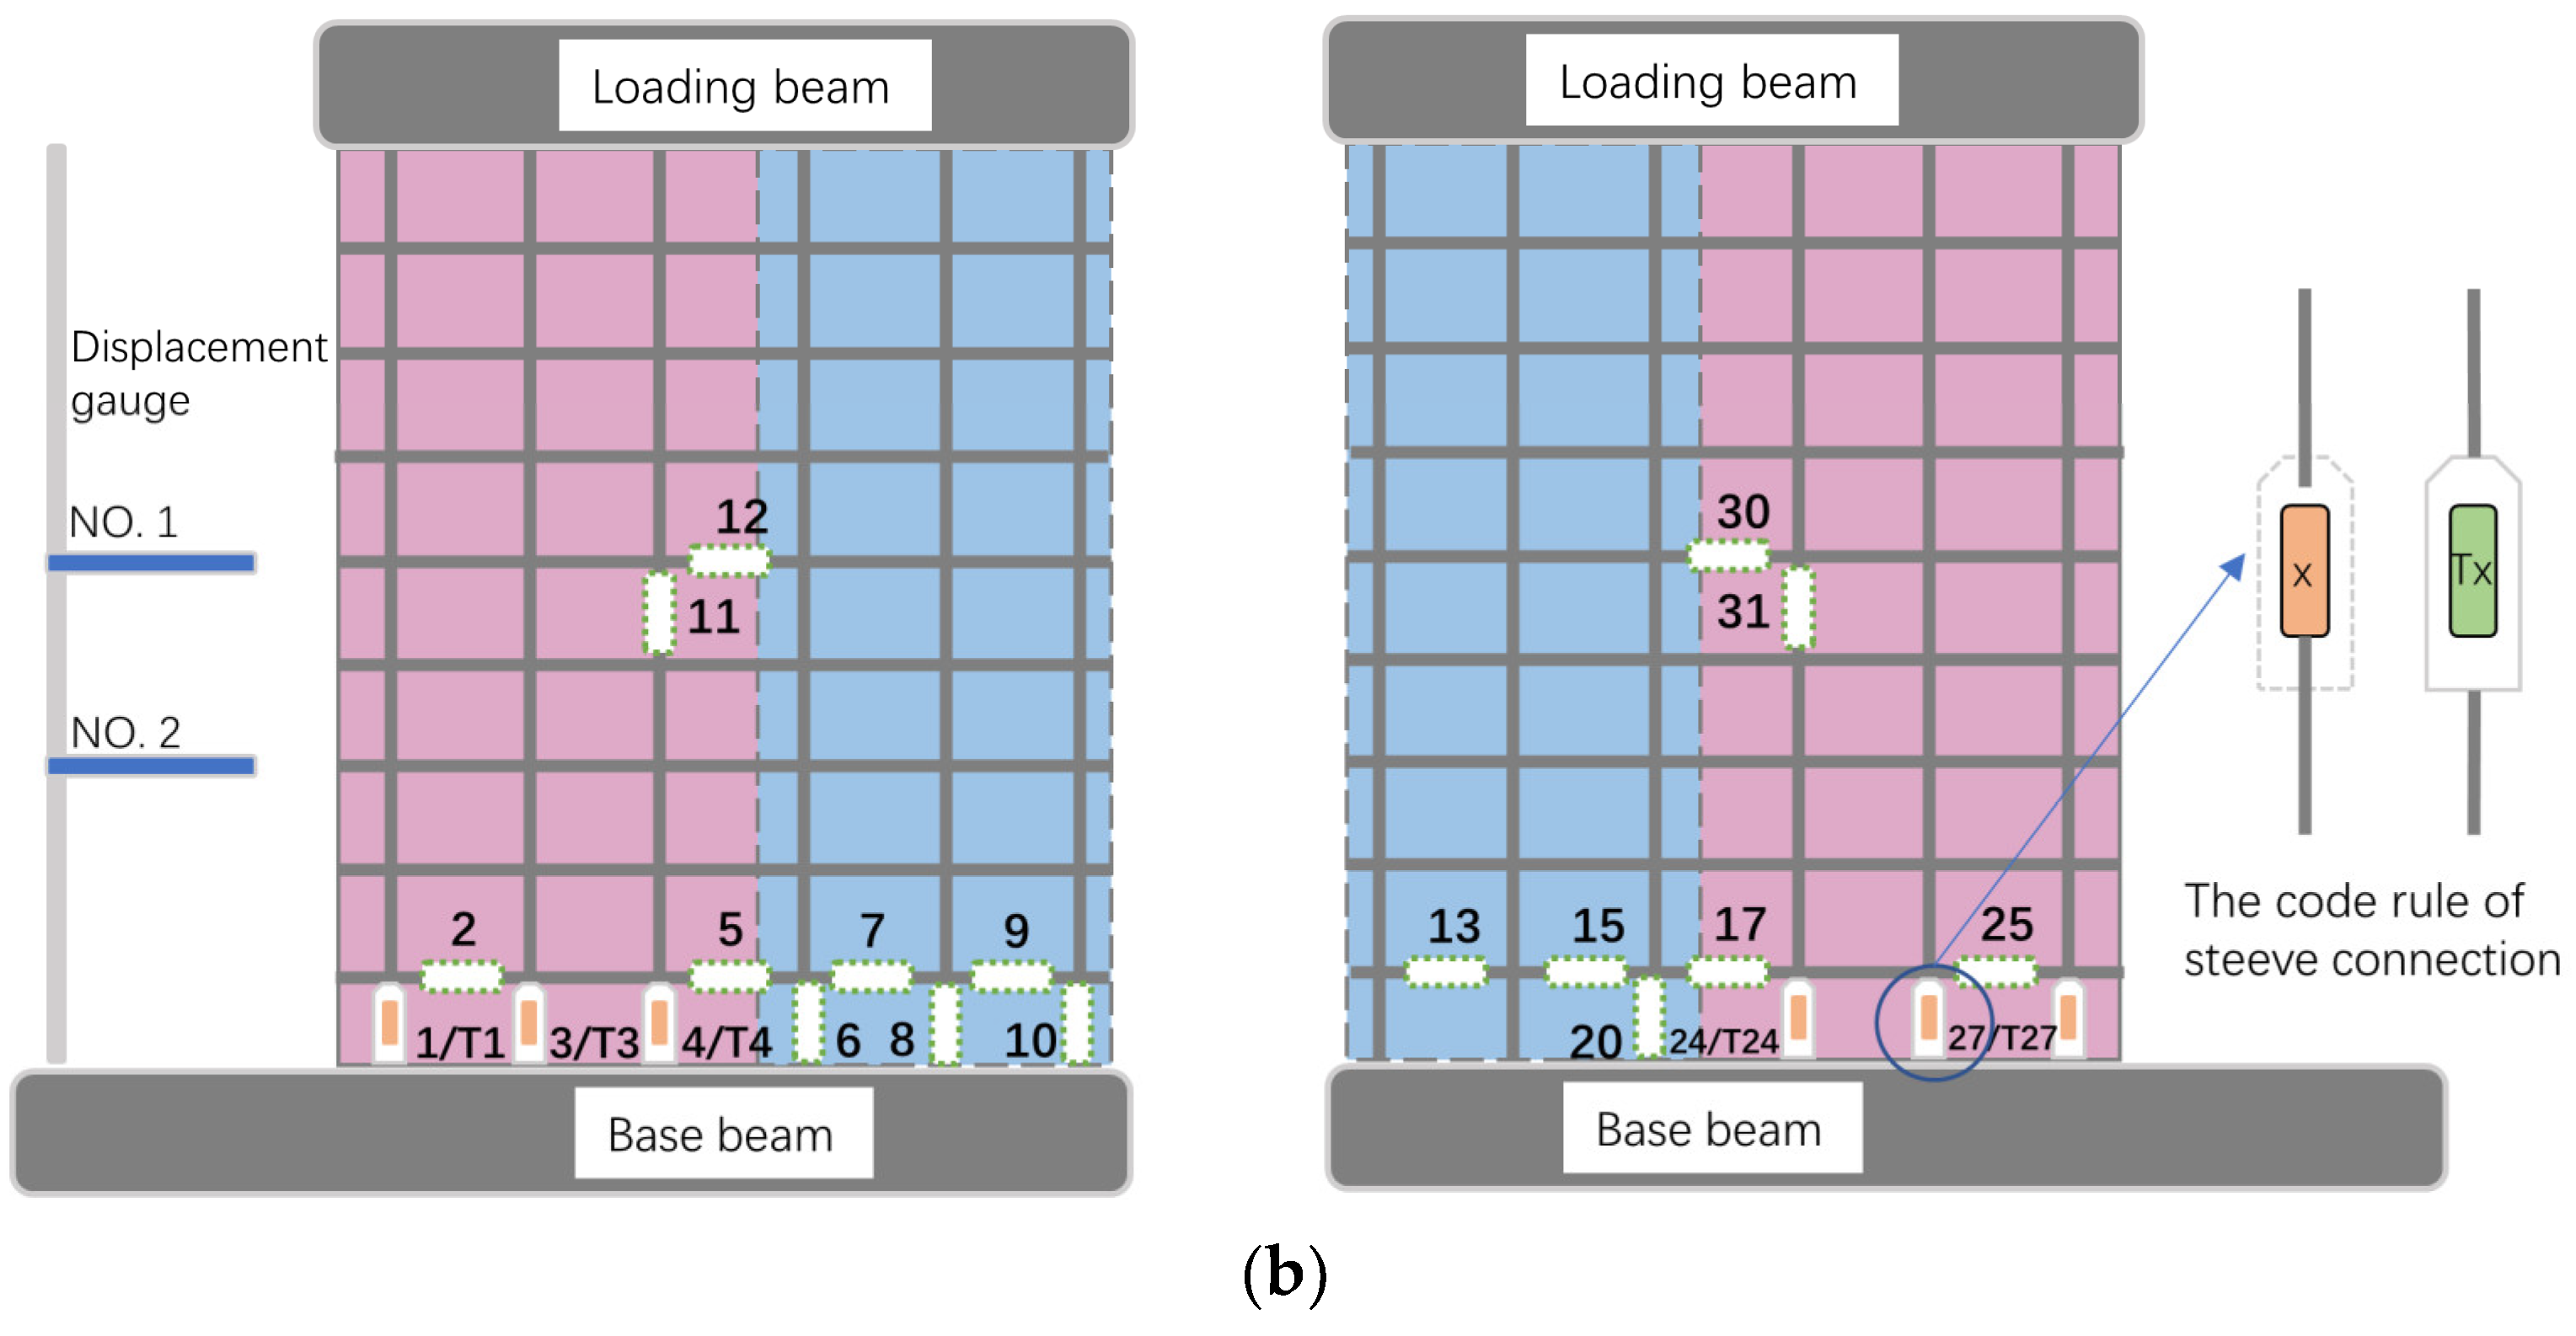
2.5. Measuring Instrument Arrangement
Two external displacement meters were set up. The height of the displacement meter was 1/3 of the height of the specimen and 1/2 of the height of the specimen, respectively, to confirm that the specimen keeps laterally during the loading process. Prior to the sleeve grouting, strain gauges (numbered x) were set on the surface of the vertical reinforcement. After the sleeve grouting, strain gauges (numbered T
x) were set on the surface of the sleeve to observe the strain of the sleeve and the reinforcement inside the sleeve after grouting. Consequently, the intelligent crack width gauge was used to record and measure the width of the crack. The layout details of all test instruments are shown in
Figure 6.
3. Results and Discussion
3.1. Failure Characteristics
The failure characteristics and crack distribution can reflect the influence of different design parameters on the failure mode of the wallboard. The failure process of the test group represented by L−1 is as follows: horizontal cracks firstly appeared in the middle of the web of specimen A, then cross-oblique cracks appeared and extended to the uncracked part. The length of oblique cracks was short but dense. Consequently, the concrete at the corner of the web was crushed, and the steel bar was buckled. The failure process of TL−1 was similar to that of L−1, but the final failure characteristics were slightly different. Horizontal cracks firstly appeared on the surface of A, and then cross cracks, while no oblique cracks through the wall surface were obtained, and the bottom of the specimen damage was not serious. Thus, the overall stiffness of TL−1 with an L-shaped hidden column is stronger, which significantly improved the lateral force resistance of the whole specimen. The strengthening effect of sleeves on vertical steel bars improved the restraint capacity of the wallboard and effectively suppressed the development of cracks.
Figure 7 shows the final crack distribution and concrete damage pattern. The damage phenomenon and the crack distribution indicate that L−1 and TL−1 are typical bending-shear failures. The bending-shear cracks are mainly distributed on the webs. The cracking characteristics on the hidden column are mainly bending cracks, and extending in a horizontal direction. For TL−1, the grouted interface at the bottom of the wall did not appear a large slip at the end of the experiment, mainly resulting from the effect of the reinforced hidden column. The cracks of specimen TL−1 are distributed more evenly, and the damage to the hidden column is not serious.
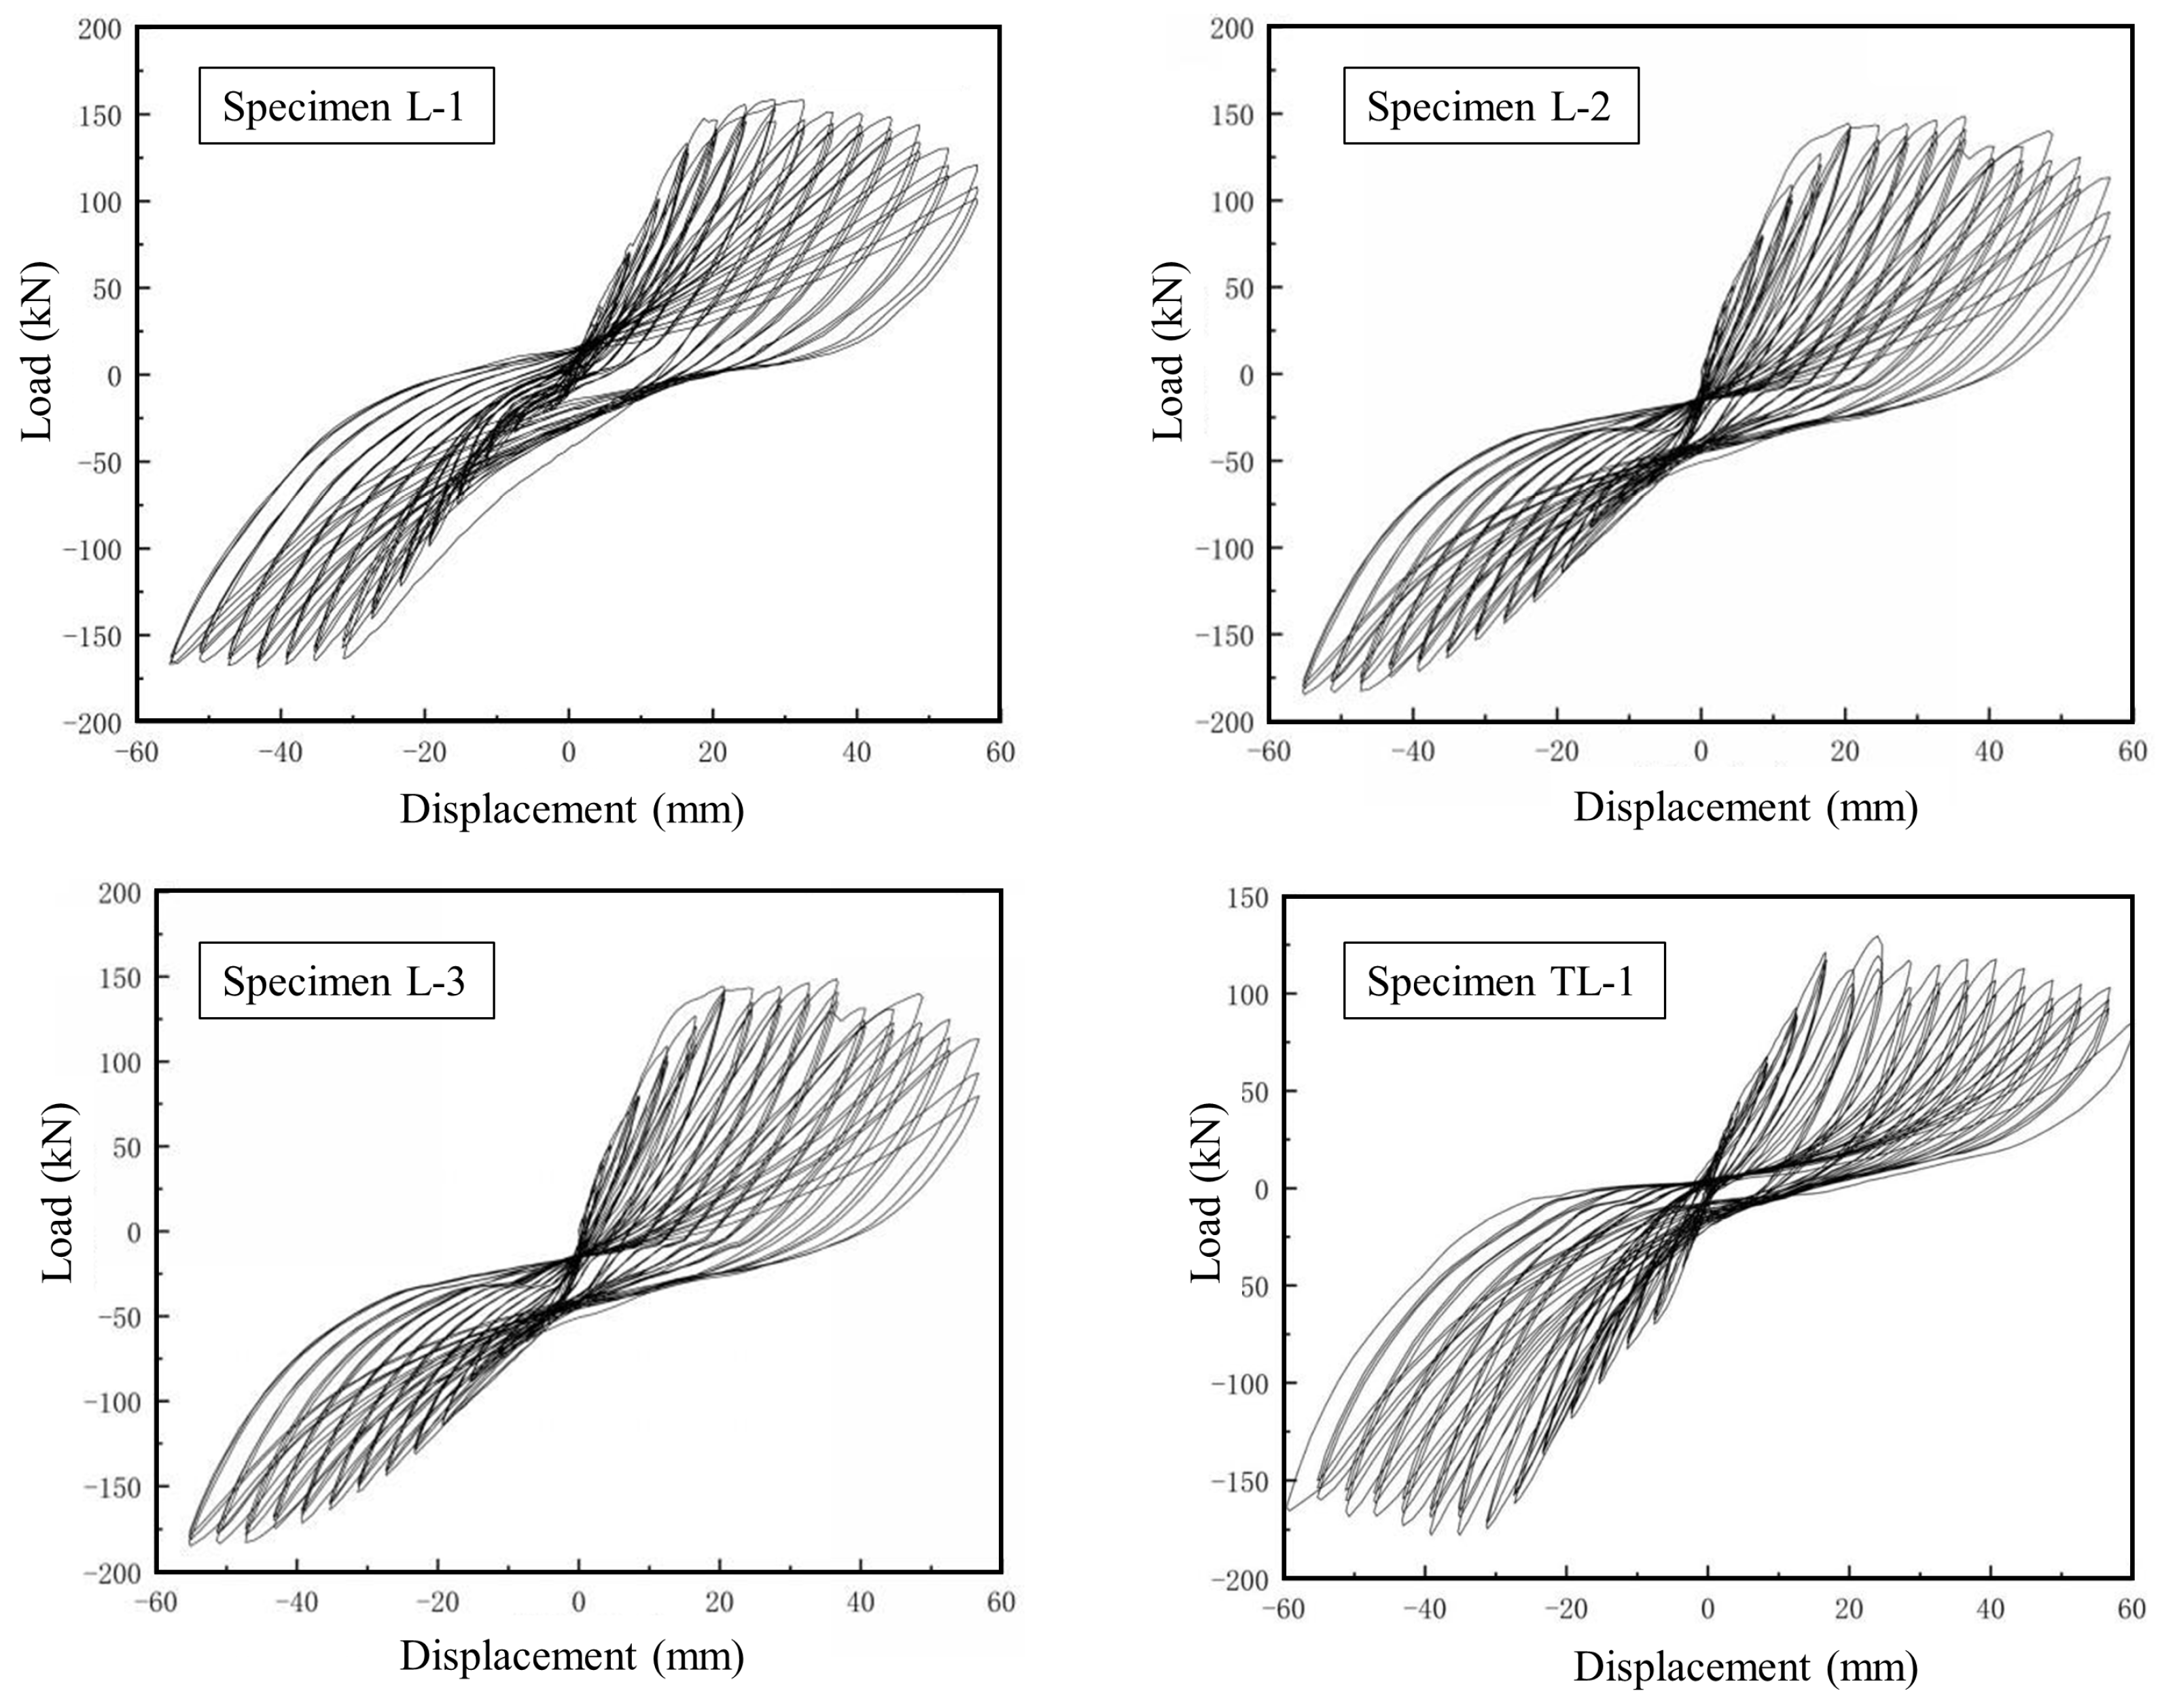
3.2. Hysteretic Curve
The hysteresis curve directly demonstrates the deformation characteristics, stiffness degradation, and energy dissipation of the wallboard under repeated loads [
26]. In
Figure 8, the hysteresis curves of the two groups of specimens were roughly consistent with the same failure development law. At the initial loading stage, the specimen was in the elastic stage, the approximately linear curve appeared, and the hysteresis loop area was small with continuous loadings. The specimen was altered from the elastic stage to the plastic stage. The hysteresis curve would bend to the displacement axis, and the development trend was inverse ‘S‘ shape, showing an obvious pinch phenomenon. The hysteresis loop area was increasing, and the residual deformation was accumulating. Finally, the bearing capacity of the specimens slightly decreased after reaching the peak, and there was no apparent mutation.
The specimens L−1, L−2, L−3 show no typical brittle failure, but the loading capacity is different under positive and negative loading directions due to the influence of the rectangular hidden column and L-shaped joint. This phenomenon is obvious in specimens L−2 and L−3. The specimen TL−1 is a precast panel joint with an L-shaped hidden column, which connected the base beam with semi-grouted sleeve connections, so the loading capacity is smaller than that of L−1, L−2, L−3. Because the wobble performance of TL−1 is much better, the ultimate displacement is larger than that of L−1, L−2, L−3.
Compared the hysteresis curves of the two groups of specimens, the two groups of specimens had different degrees of pinching. The kneading results were caused by the excessive stiffness change of the specimen under low cyclic loading. After forward unloading, the crack of ceramsite concrete could not be closed in time with reduced bending stiffness, mainly provided by the steel bar. In the later stage of reverse loading, it helped the crack of ceramsite concrete to close, and the stiffness of the specimen increased generally. The difference was that TL−1 has better energy dissipation performance as the strengthening of stiffness by L-shaped hidden columns. Therefore, the restoring force of the hysteresis curve under positive and reverse loads was similar, while the curves of the three specimens in the first group couldn’t show the familiar characteristics. Due to the limitation of test conditions, the influence of more factors on the seismic performance of joints can be explored by numerical simulation in the later stage, and the accuracy of the computer model can be verified by comparing the results of hysteresis curves.
3.3. Skeleton Curve
The skeleton curve is an outer envelope obtained by sequentially connecting the peak load points loaded at each stage of the tension or compression side on the hysteresis curve, reflecting the relationship between the force and deformation of the component at each stage [
27]. The skeleton curves of the two groups of specimens showed that the specimens matched with ductile structures [
28], and the trend of the curves with barely differences. The stress process could be summarized into three stages: the elastic stage, the strengthening stage, and the failure stage.
Combined with the results of feature points, the influence of the connection form of vertical steel bars and the structure of hidden columns on the working performance of wall panel joints could be quantified. As shown in
Table 6, the joint strengthening with the L-shaped hidden column enhances the crack load by 15.3% to 21.7%, and the yield, peak, and ultimate load of the specimen TL−1 are slightly lower than those of L−1/L−2/L−3. However, the specimen TL−1 shows a better deformation capacity. The deformations of the specimens L−1/L−2/L−3 in the direction of positive and negative loading have a large gap. This result is consistent with what the hysteresis curve shows. This phenomenon is caused by the sandwich structure of the webs. However, the specimen TL−2 with semi-grouted sleeve connections did not show such behavior, reflecting that the L-shaped hidden column could enhance the integrity of the precast joint to some degree. Generally speaking, the performance of TL−2 is better than that of L−1/L−2/L−3, which indicates that the type of hidden column and assembly methods are feasible and effective.
It can be seen from
Figure 9 and
Table 6 that the sleeve form and hidden column had less effects on the specimen’s bearing capacity prior to the displacement reaching 20 mm. After reaching 20 mm, the plastic deformation capacity of the specimen with an L-shaped hidden column was higher than that of the specimen with a rectangular hidden column under the same displacement, but the bearing capacity was reduced. In
Table 3,
Table 4,
Table 5,
Table 6,
Table 7 and
Table 8, the ultimate displacement of the specimen TL−1 was 8.7%, 11%, and 8.7%, which were higher than that of the three specimens of the test group. The peak load of specimen TL−1 was 1.4%, 0.3%, and 1.5% lower than that of the three specimens in the test group. Therefore, the connection between the anisotropic hidden column and the sleeve had a minimal reduction in the bearing capacity of the wallboard, but it efficiently improved deformability and presented better seismic performance.
3.4. Energy Dissipation Capacity
The energy dissipation capacity of the specimens is evaluated by an equivalent viscous coefficient.
Table 7 shows the equivalent viscous damping coefficients of the cracking load point, yield point, peak point, and limit point in the negative loading process measured by the test (the calculation formula is as follows 1, the diagram shown in
Figure 10). The equivalent viscosity coefficient of the specimen had the linear correlation with the energy dissipation performance of the specimen [
29,
30].
Comparing the two groups of specimens, it can be seen that the equivalent viscous damping coefficient of all specimens will increase with the load, which demonstrates that the energy dissipation capacity is constantly improving. The equivalent viscous damping coefficient of the test group L−1, L−2, and L−3 specimens kept increasing after the peak point, which led to the specimens still having a certain energy dissipation capacity after reaching the ultimate bearing capacity, and no brittle failure occurred. Moreover, the equivalent viscous damping coefficient of the TL−1 specimen was greater than that of the test group L−1, L−2, and L−3 specimens, indicating that the L-shaped hidden column is beneficial to improve the energy dissipation performance of the specimen, and the energy dissipation performance of the TL−1 specimen is better.
3.5. Ductility
Ductility is the deformation ability of the wallboard from the beginning of yield to the maximum bearing capacity or after reaching the maximum bearing capacity without pronounced decline. The yield displacement is calculated by the general yield bending moment method [
31]. The ultimate displacement was the corresponding displacement value when the maximum bearing capacity in the positive direction of the specimen decreases to 85%. The calculation of the ductility coefficient is shown in Formula 2, and the ductility coefficient is shown in
Table 8.
where:
△u-the ultimate displacement of the specimen at the time of damage.
△y-yield displacement at yielding.
It can be seen from
Table 8 that the ductility coefficient μ of all specimens under the positive loading direction is greater than 3, reflecting that the wall panel joints have good ductility. On the other hand, the ductility of the TL−1 specimen is greater than that of the rectangular concealed column specimen. The ductility coefficient of the TL−1 specimen is 2.1%, 3% and 2.1% higher than that of L−1, L−2, L−3 respectively, which indicates that the L-shaped hidden column is beneficial to improve the deformation capacity of joints. That is consistent with the analysis results of energy dissipation capacity.
3.6. Rigidity Degeneration
Stiffness degradation presents the decrease of stiffness with the increase of structural plasticity after the development of cracks in concrete structures and reflects the ability of concrete structures to absorb and dissipate energy under earthquake action [
31]. The stiffness algorithm of the specimen at different stages was shown in Formula 3. Through the above formula, the stiffness corresponding to each stage of each specimen could be calculated and made into a stiffness degradation curve, as shown in
Figure 11.
where: F
i-the peak point load in the positive direction during the loading of the i-th level.-F
i-the peak point load in the negative direction during the loading of the i-th level.
Xi-the displacement of the peak point in the positive direction during the i-th cycle.
−Xi-the displacement of the peak point in the second direction during the i-th cycle.
The stiffness degradation of the specimen represents the stability of the mechanical performance of the specimen. In
Figure 11, the stiffness of the two specimens decreased steadily with the accumulation of damage after cracking without a sudden drop, and the seismic performance was good. In the initial stage, the specimens of the rectangular hidden column have obvious stiffness degradation, and the stiffness reduction of the L-shaped hidden column is relatively small. After the cracking of ceramsite concrete, the horizontal connection part of the rectangular hidden column produces horizontal slip, which leads to a slower stiffness degradation rate than TL−1. In the later stage of the test, the changing trend and change rule of the two joints are similar.
3.7. Strain Analysis of Longitudinal Bar
The strain of the longitudinal reinforcement of the cast-in-place specimen at the key positions 1,4,24 and 27 with L−1 since the micro-strain after the yield of the steel bar was too large in
Figure 12. The steel bar strain was no longer increased. And the failure of L−1 started from the outermost web and developed inward. After the web lost most of its bearing capacity, the flange plate and the joint began to bear the force together, and the flange plate failure extended from the outermost to the inward. Finally, the joint kept working.
The strain of the vertical distributed steel at the strain gauges 1,4,8,24,27 and T1, T24, and T27 positions of TL−1 are shown in
Figure 13. By comparing the strain curves of the strain gauges T1 and 1, it is not difficult to find that the tensile strain at the sleeve is much smaller than the vertical steel bar spliced inside it. This shows that the sleeve can effectively connect the precast panel joint and the base beam, and help the vertical reinforcement bear part of the tensile force. Given the results of strain gauge records of No.1 and No.4, the tensile stress of the vertical steel bar located outside the web is larger than that of the vertical steel bar located in the center. However, the trend of the strain recorded by the two strain gauges is consistent. This result is consistent with the trend of specimen L−1. No.8 strain gauge is located in the interior of the concealed column, and its strain trend is consistent with No.1, reflecting that the horizontal distribution steel bars extending to the interior of the concealed column can make the integrity of the joint better. No.24 and No.27 strain gauges are located in the B−C sandwich web, which is perpendicular to the loading direction, so the change of strain is different from No.1 and No.4. The maximum value recorded by No.24 strain gauge is much larger than that of No.27, which may be due to the fact that No.24 strain gauge is close to the L-shaped hidden column and the stiffness of the hidden column is large. No.24 bears more tension.
Overall, the vertical reinforcement strain in the two specimens has similar rules. The yielding sequence of the vertical steel bars of L−1 and TL−1 specimens is from the outermost steel bar to the hidden column. Moreover, the web and flange longitudinal reinforcement of the two specimens has yielded prior to the vertical reinforcement in the hidden column reaching the yield strain. Although the vertical reinforcement of the TL−1 specimen is connected by a sleeve, where the reinforcements at T4 and T1 showed different strains resulted in the sleeve helping to bear part of the external load. On the other hand, the strain value of the steel bar in the sleeve has a better performance compared with that of the specimen L−1, which also showed from the side that the L-shaped hidden column strengthens the stiffness of the core area of the joint, which increases the load distributed by the outer vertical steel bar, so the strain also increases accordingly. Because the strain gauge is fragile, prone to failure, the latter can establish a computer model to verify the results.
4. Conclusions
In this study, firstly, the specimen design and material test of two groups of joint specimens were carried out. Finally, through the low cyclic loading test, the failure mode, hysteresis curve, skeleton curve, stiffness degradation, ductility, energy dissipation capacity, and steel stress and strain of different specimens under low cyclic loading are obtained. By analyzing the experimental data, the main conclusions are as follows:
The failure process of the two groups of specimens remains the same, while the degree of damage is different. The specimen firstly appears horizontal cracks in the A plane, followed by the formation of the X-shaped cross-crack, until the end of the wall appears plastic hinge and component damage. The TL−1 specimen with sleeve connection and special-shaped hidden column has less cracking on the BC wall, and the corner hinge is not obvious, while the integrity of the ordinary rectangular hidden column specimen is better, and there is a lot of cracking on the four walls.
Both specimens showed good seismic performance. According to the hysteresis curve, it could be seen that both groups of specimens have a ductile failure, and the stiffness degradation was stable under low-cycle reciprocating cyclic loading. And under large displacement, the energy dissipation capacity of the specimen provided an excellent performance.
The ultimate bearing capacity of the three specimens with rectangular hidden columns was higher, and the equivalent viscosity coefficient still increased in the limit state, that is, the energy dissipation performance was improved, and the toughness of the specimens was good. The ultimate displacement of the specimen with sleeve connection and special-shaped hidden column is larger, and the equivalent viscosity coefficient of each stage of the specimen is greater than that of the rectangular hidden column specimen, that is, the energy dissipation performance is better.
Sleeve connection would reduce the integrity of the specimen, and the bearing capacity at a small discount, but could significantly improve the toughness of components. Moreover, the ductility of the wall was significantly improved by increasing the area of the hidden column and enhancing the lateral stiffness of the wall. Therefore, it was more rational to design L-type ceramsite concrete sandwich composite joints by sleeve connection and special-shaped hidden column.
The control group specimen presented a better match in stiffness, bearing capacity, ductility, and energy dissipation. The test results can provide technical support for the application of the insulated sandwich wall panel joints with ceramsite concrete layer, and lay a foundation for the design of other sandwich panel joints.
However, there are still many factors that are not considered in the design of the joints. Future research could continue to validate the outcomes based on numerical simulation method and establishing the relationship between material microstructure and macroscopic seismic performance of the joints. And the thermal performance of the joint can be tested to further verify its energy-saving effect.


