1. Introduction
In 2020, the Chinese government announced that it would increase its national autonomous contribution and adopt stronger policies and measures, with CO
2 emissions estimated to peak by 2030 and a commitment to carbon neutrality by 2060 [
1]. The building sector consumes 40% of global energy and is one of the principal industries responsible for generating direct and indirect carbon emissions [
2].
Public buildings are an important tool for improving local socioeconomic conditions and promoting regional development, especially for developing countries, where their construction plays a crucial role in economic development and job growth [
3]. According to some research, the negative impact of buildings on the environment during construction has been underestimated [
4,
5], and buildings of different sizes vary significantly in the type of construction machinery and energy structure used in their construction; for instance, public buildings generate higher fossil energy consumption and carbon emissions than residential buildings, rendering them better potential targets for energy savings and carbon reductions [
6]. In the process of controlling carbon emissions in the building sector and achieving energy saving and emission reduction goals, the greenhouse gas emissions generated during the construction process should not be neglected; thus, it is especially important to propose an energy consumption and carbon emission calculation method applicable to the characteristics of large public buildings. The purpose of the study of energy consumption and carbon-emission-influencing factors is to identify and comprehensively analyze potential influencing factors based on their specific characteristics in the construction process. The calculation process and the calculation results provide the basis for the analysis of the impact factor study, while the impact factor analysis is a further examination of energy consumption and carbon emission generation. For large public buildings, relevant departments often focus their planning on the land use rate, with relatively regressive planning awareness and insufficient attention to the energy consumption and carbon emissions generated by buildings during their life cycle [
7]. The differentiated characteristics of energy consumption and carbon emission intensity of large public buildings and their influencing factors should also serve as important reference factors for the development of low-carbon construction paths and strategies for these types of building. Therefore, given the premise of a low-carbon target, further excavation of the calculation process of energy consumption and carbon emission in the construction stage of large public buildings, as well as research on the influencing factors of energy consumption and carbon emission, can provide a scientific basis for achieving the lowest energy consumption and carbon emissions while also formulating a targeted low-carbon development route; such a route would be vital in the rigid demand of energy savings and emission reductions [
8].
For the calculation of energy consumption and carbon emissions during the construction phase of a building, three main methods are commonly used: The actual measurement method, the input–output method, and the emission factor method. The real measurement method refers to the calculation of carbon emissions through the actual measurement of the greenhouse gases produced [
9]. The input–output method is a more macroscopic method in which the input and output data are used to build a model to express energy consumption in the measurement of building carbon emissions [
10]. The most commonly used method is the emission factor method, which is a method used to calculate total emissions based on the statistical average of the number of gases emitted per unit of production under normal techno-economic and management level conditions, as based on the assumptions of IPCC (Intergovernmental Panel on Climate Change) [
11]. Based on the different material consumptions of different buildings, and the basic data published by the Korean government, Kim used the input–output method to conduct a study of building energy consumption and carbon emissions, focusing on the share of different types of steel and the proportion of carbon emissions [
12]. Barbara Rossi et al. used the carbon emission factor method to calculate the carbon emissions of different regions and types of buildings in three European regions and concluded that the carbon emissions in the use phase of European buildings are generally high [
13]. Moon et al. used the carbon emission factor method to estimate the carbon emissions of buildings in the design phase with actual cases, and the error was less than 8% compared to the actual emissions, demonstrating good accuracy [
14]. Compared to other methods, this method is more widely used, has a solid theoretical foundation, and is an internationally recognized and common method for carbon footprint assessment. As such, this paper selects the emission factor method to measure energy consumption and carbon emissions in the construction phase of large public buildings. There are many factors affecting energy consumption and carbon dioxide emission during the construction of buildings, such as the area of the building, various carbon emission factors during the construction phase, etc., which need to be considered separately. In response to this situation, energy consumption and carbon emissions per unit of building area are used as evaluation indexes, and the units are kgce/m
2 and kgCO
2/m
2; these visually reflect the degree of energy consumption and carbon emissions of large public buildings and can be compared to other types of buildings horizontally.
Regarding the influencing factors of energy consumption and carbon emissions, Jonathan N conducted a low-carbon assessment of three factors: Infrastructure construction resources, building operations, and transportation modes, and finally arrived at the primary and secondary order of each influencing factor [
15]. Winkelman S et al., observed that factors such as building design, transportation infrastructure construction, and land-use practices can have a profound impact on urban carbon emissions [
16]. Guggemos used two 4400 m
2 five-story buildings in the Midwest United States as a research object and explored implied energy and implied carbon using the whole life cycle analysis method [
17]. In China, research in this area started late and borrowed more from foreign research reports, and only a few cases were examined and analyzed for energy consumption and carbon emissions during the construction phase. Zhang Peng implemented a detailed planning of material savings and material resource utilization for green construction and refined management, which not only improved construction speed but also produced considerable economic benefits [
18]. Du Zhuoqun et al. identified multiple influencing factors related to carbon emissions from operating public buildings by measuring carbon emissions during their operation, and then explored the relationship between each influencing factor and carbon emissions [
19]. The most comprehensive analyses are still found in theoretical research, and there are fewer data related to the actual construction process [
20].
In most of the available studies, the STIRPAT model has shown multiple applications and developments in the fields of energy and environment [
21,
22]. In light of this, Ehrlich and Holdren [
23] first proposed the IPAT model, which decomposes environmental impacts into population size, affluence, and technological factors. Later, Dietz and Rosa [
24] studied the basis of the IPAT model and proposed the STIRPAT model, which is an improvement on the IPAT model. In addition to considering the environmental impacts of changes in factors such as population, wealth, and technology, this improved model also allows for the addition, modification, or decomposition of relevant impact factors depending on the subject of study. Given the above advantages of the STIRPAT model, it is appropriate enough to support this study.
Based on the study of energy consumption and carbon emission calculations in relation to influencing factors in the construction phase of large public buildings, this paper first determines the calculation boundary of the engineering construction phase, and then proposes an energy consumption and carbon emission calculation method applicable to the construction of large public buildings using the theoretical basis of the emission factor method. In the calculation process, construction data, such as the volume of each work component and the consumption of machinery and equipment shifts, were used to obtain the energy consumption and carbon dioxide emissions generated during the construction and building process [
25]. According to the calculation process, the final energy consumption and carbon emission calculation results are analyzed using the improved STIRPAT model, and the effect of each influencing factor on energy consumption and carbon emission is derived. Following this, relevant suggestions are proposed to facilitate energy saving and reduce carbon dioxide emissions in the construction process, and these seek to provide a reference for the low-carbon construction of large public buildings and provide theoretical support for reducing carbon emission in the construction industry.
2. Research Methods
In China, large public buildings are often office buildings, transportation buildings, scientific, educational, cultural and health buildings, commercial buildings, and stadiums with a floor area of more than 20,000 square meters. Compared to general public buildings and residential buildings, large public buildings have the following characteristics:
- (1)
Large scale and volume. The construction process requires more materials, machinery, and equipment than other buildings. Therefore, more attention should be paid to the selection of construction equipment, fuel loss, and other factors in the construction process.
- (2)
High construction management difficulty. There are more cross-construction problems in the construction of large public building projects, and the management of their construction process is more important as it directly affects the completion qualities of green construction.
- (3)
Complex structure. Large public buildings usually adopt relatively new architectural shapes, often with complex curved shapes, large spans of steel structures, and other characteristics. This is achieved using assembled structures and other ways to reduce the construction of required floor space and reduce pollution, and it has become an important focus of green construction.
- (4)
The construction period is long, generally lasting more than two years; this length of time has a larger environmental impact.
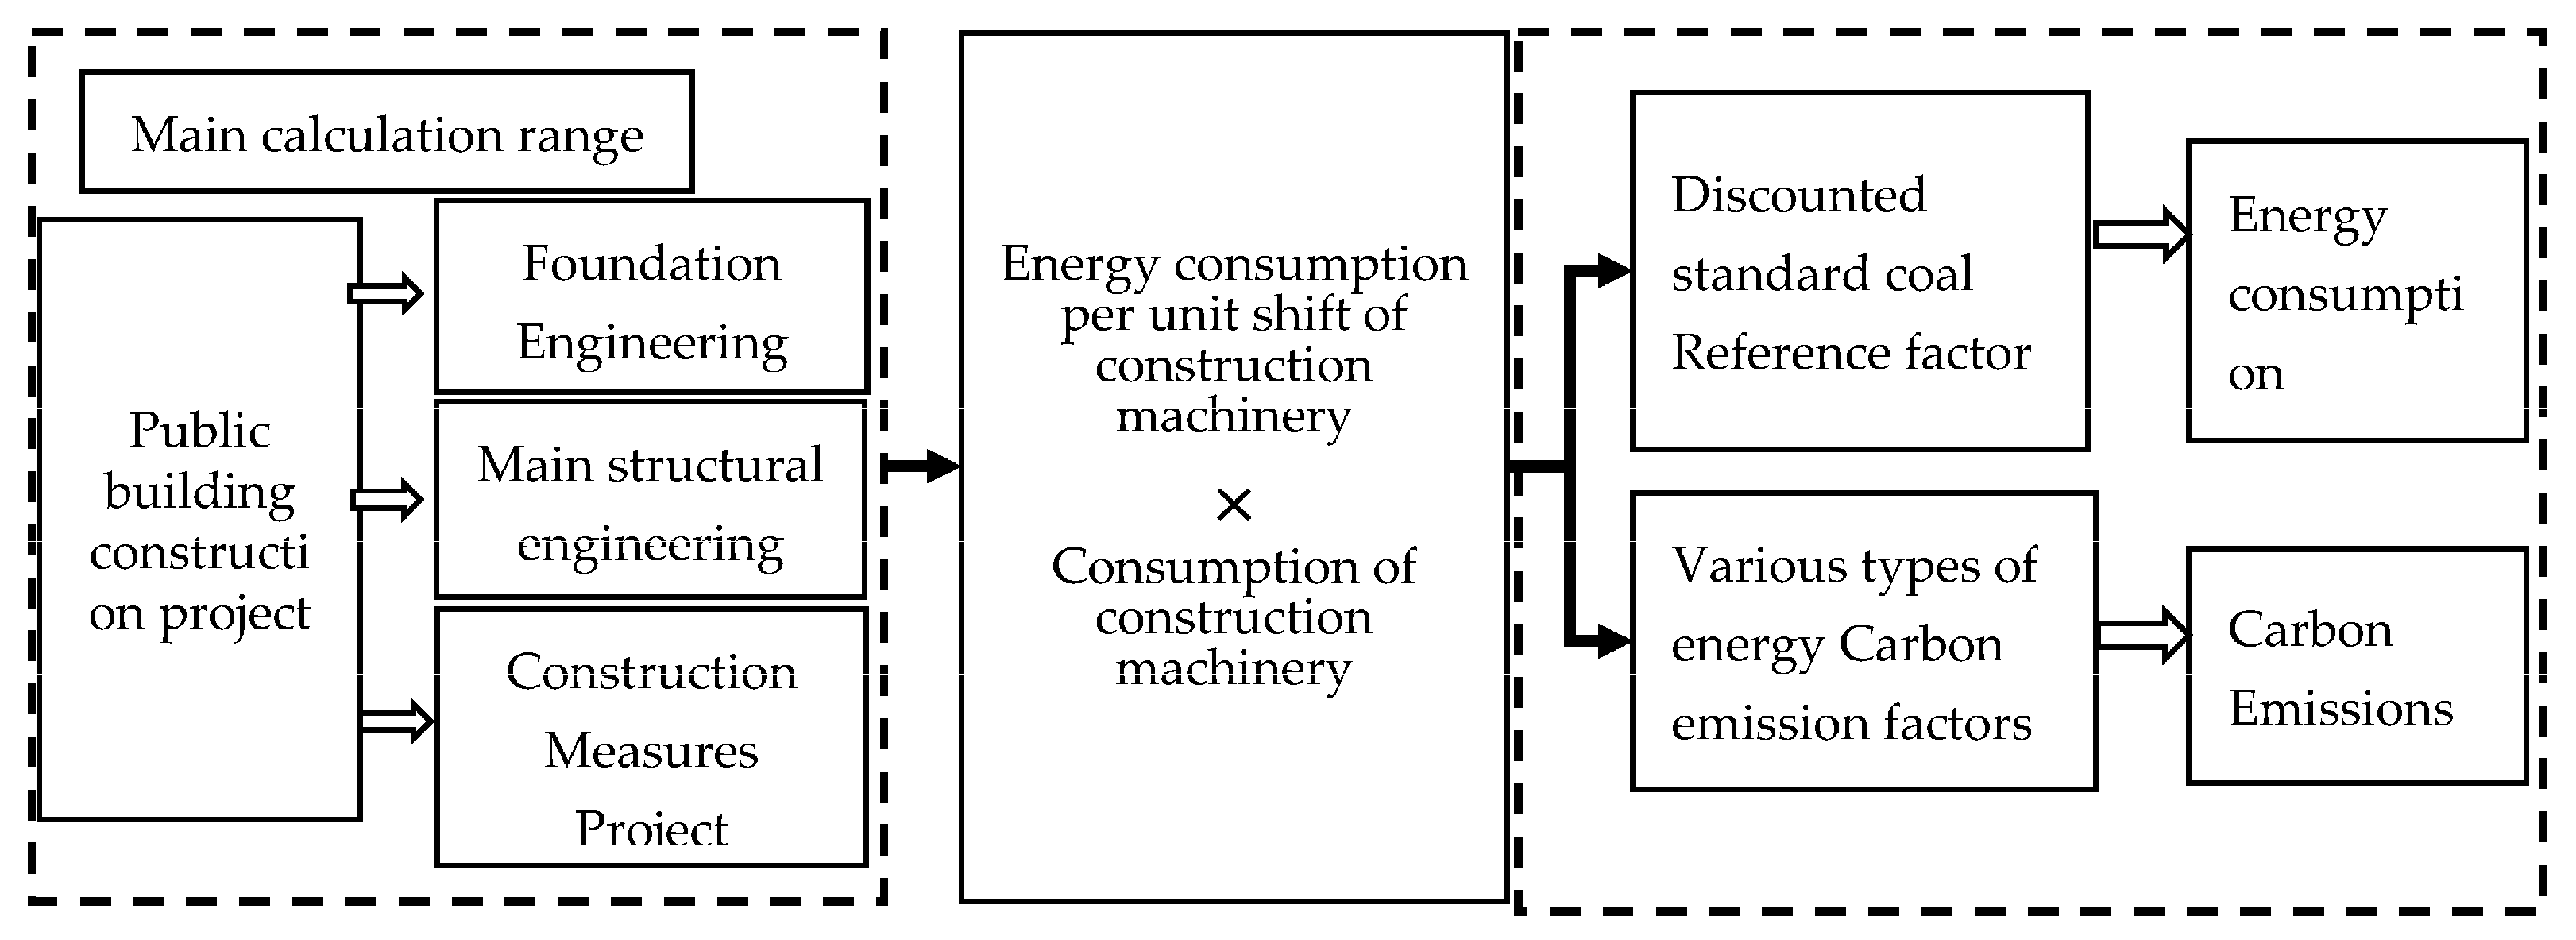
The construction of large public buildings is a process that uses several types of construction machinery and consumes a large amount of electricity and liquid fuels such as diesel and gasoline. To establish carbon emissions during the construction phase, the total energy consumption and carbon dioxide emissions are calculated by multiplying the shift consumption and shift energy use of various types of construction machinery by their respective reference coefficients of standard coal and carbon emission factors. Accordingly, the calculation of total carbon emission in the construction stage requires the following four conditions: (1) Shift consumption of various types of construction machinery; (2) various types of energy usage of construction machinery shifts; (3) carbon emission factors of various types of energy; and (4) reference coefficients of discounted standard coal of various types of energy. The calculation framework is shown in
Figure 1.
2.1. Determination of Calculation Boundary
The calculation of carbon emissions in the construction phase mainly includes the carbon emissions generated by construction machinery during the construction of the main structure components, as well as vertical transportation and other measurable items. For the construction of temporary facilities used in the construction phase and the carbon emissions generated by on-site construction, personnel present during the construction process are not accounted for [
26].
2.2. Calculation Method
2.2.1. Calculation Basis
In this paper, the main basis for obtaining carbon emission factors and construction machinery shift energy usage is the “Construction Carbon Emission Calculation Standard”, while construction machinery shift consumption is based on quotas given in the “Consumption Quotas for Housing Construction and Decoration Projects”; the corresponding construction machinery usage is obtained from the original project volume [
27].
2.2.2. Energy Consumption Calculation Method
The amount of energy consumption per unit area is calculated according to Equation (1):
where
E is the energy consumption per unit area in the construction building stage (kgce/m
2);
is the
i-th construction machinery shift consumption using
j energy in the construction stage;
is the unit shift energy consumption of machinery
i (kWh/shift or kg/shift);
is the reference coefficient of discounted standard coal for the
j-th type of energy (kgce/kg or kgce/kW-h), checked from the China Energy Statistical Yearbook [
28]; and
A is the floor area (m
2).
2.2.3. Carbon Emissions Calculation Method
As the power source of construction machinery includes electricity and fossil fuel energy sources, such as gasoline and diesel, and the carbon emission factor used in such fossil fuel energy sources is calculated from the heat generated by the fuel during combustion, the carbon dioxide emissions generated by the operation of construction machinery using fossil energy can be expressed as:
where
is the carbon dioxide emissions (kgCO
2) from construction machinery using fossil energy in the construction phase;
is the shift consumption of the ith construction machinery using energy j in the construction phase;
is the energy consumption per unit shift (kg/shift) of machine
;
is the average low level heat generation of energy (kJ/kg), checked from China Energy Statistical Yearbook [
28]; and
is the carbon emission factor of energy
(tCO
2/TJ), which is checked from the Standard for Calculating Carbon Emissions from Buildings.
The CO
2 emissions from the operation of construction machinery using electricity can be expressed as:
where
is the CO
2 emission from construction machinery using electricity during the construction phase (kgCO
2);
is the shift consumption of the ith construction machinery using electricity during the construction phase;
is the unit shift energy consumption of machinery
(kWh/shift); and
is the carbon emission factor of electricity (kgCO
2/kWh). This paper adopts the regional grid emission factor, and the data source is based on the basic data in the China Energy Statistics Yearbook.
The CO
2 emissions per unit area can be expressed as:
where
is the carbon emission per unit area in the construction stage (kgCO
2/m
2) and
A is the floor area (m
2).
2.3. Determination of Carbon Emission Factors
The construction stages of each sub-project are divided into diesel, gasoline, coal, and electricity according to the type of resources consumed. Based on the “Standard for Calculating Carbon Emissions from Construction”, several of the fossil fuels used in this paper and their carbon emission factors are shown in
Table 1. Taking earthwork and steelwork as examples, the relevant construction machinery, corresponding specifications, and their energy consumption are shown in
Table 2. According to the China Energy Statistical Yearbook, several types of fossil fuel energy and electricity discount standard coal factors are shown in
Table 3.
This paper adopts a regional grid emission factor, i.e., the greenhouse gas emissions generated by one degree of electricity production in the region, as calculated using the total carbon emissions generated by thermal power generation in the regional grid that is then divided by the total power generation (including clean energy generation). The data source is based on the basic data in the China Energy Statistical Yearbook, and the calculated carbon emission factor for electricity in the construction year in the region where the engineering case of this paper is located is 0.7094 kgCO2/kWh.
2.4. Influencing Factors Analysis Method
The “IPAT” model, first proposed by the famous American demographer Ehrlich et al. in 1971, measures the relationship between environmental impact (Impact) and population (Population), affluence (Affluence), and technological factors (Technology). It can be expressed as follows:
Ehrlich considered that population size (
P), affluence (
A), and technology level (
T) were the main factors determining the environmental impact status (
I). However, this model assumes that the impact on the environment and the impact factors change in the same proportion; however, there are differences in the impact of each impact factor on the environment, and there are certain limitations to this approach. The Stirpat model can quantitatively analyze the impact of various factors on environmental changes in the urbanization process, and a typical Stirpat model is shown as follows:
where
I is the environmental pressure;
P is the demographic factor;
A is the economic development level factor;
T is the technological factor;
a is the coefficient of the model;
b,
c, and
d are the influence indices of the corresponding drivers, respectively; and
e denotes the error term coefficient, i.e., the changes produced by the environment are the result of the combined effects of the above three factors.
Research on building carbon emissions is divided into two levels: Micro and macro. The macro-level of building carbon emissions refers to the carbon emissions in the building sector at the national, regional, provincial, and municipal scales, mostly using years as the unit of time measurement. The micro-level, however, focuses on the study of carbon emissions of single buildings. Current research on the influencing factors of building carbon emissions mainly focuses on macro-level factors such as population, per capita income level, and urbanization, and only some scholars have conducted research on the measurement or influencing factors of micro-level carbon emissions in the construction industry [
29,
30,
31], especially in relation to the decomposition of influencing factors of carbon emissions.
Based on existing research on macro-level influence factors, this paper analyzes and summarizes the influencing factors from a micro-perspective, taking energy consumption and carbon emissions in the construction stage of single large public buildings as the research object.
The STIRPAT model allows for an appropriate decomposition of the influencing factors and also allows for the estimation of the coefficients as parameters. Depending on the needs and purposes of the study, the model is partially improved in this paper by the following approaches:
- (1)
The population factor is expressed as the year-end resident population of the prefecture-level city where the terminal building is located. In order to achieve the goal of “energy saving and emission reduction”, government departments have also introduced a large number of measures and have continued to increase investment in the annual government budget. Such an approach also reduces carbon emissions to a certain extent, so this paper decomposes the economic development level factor into local GDP and local financial expenditure on energy savings and environmental protections.
- (2)
We decompose the technical factors into construction machinery shift consumption, type and performance specifications of construction machinery, and energy type. Performance specification is expressed by unit shift energy consumption, and energy type is expressed by the carbon emission factor and the reference coefficient of discounted standard coal.
According to the indicators needed by the model to find the corresponding data, population data, and economic development level data, the relevant data from the region’s urban statistical yearbook are shown in
Table 4.
Thus, the STIRPAT model can be improved and extended into a model when analyzing the impact of various factors on carbon emissions and energy consumption during the construction process:
where
Cout denotes carbon emissions;
Cspent denotes the amount of energy consumed;
b1,
b2 is the parameter to be estimated;
P indicates the year-end resident population of the area;
I is gross regional product;
T is the unit shift energy consumption;
M indicates local finance for energy saving and environmental protection spending;
Q indicates construction machinery shift consumption;
W denotes the carbon emission factor; and
indicates the reference coefficient of discounted standard coal.
4. Analysis of Energy Consumption and Carbon Emission Influencing Factors
First, a multiple regression analysis of regional energy consumption was conducted, and the results are shown in
Table 7.
The analysis of the results of the F-test shows that the significant
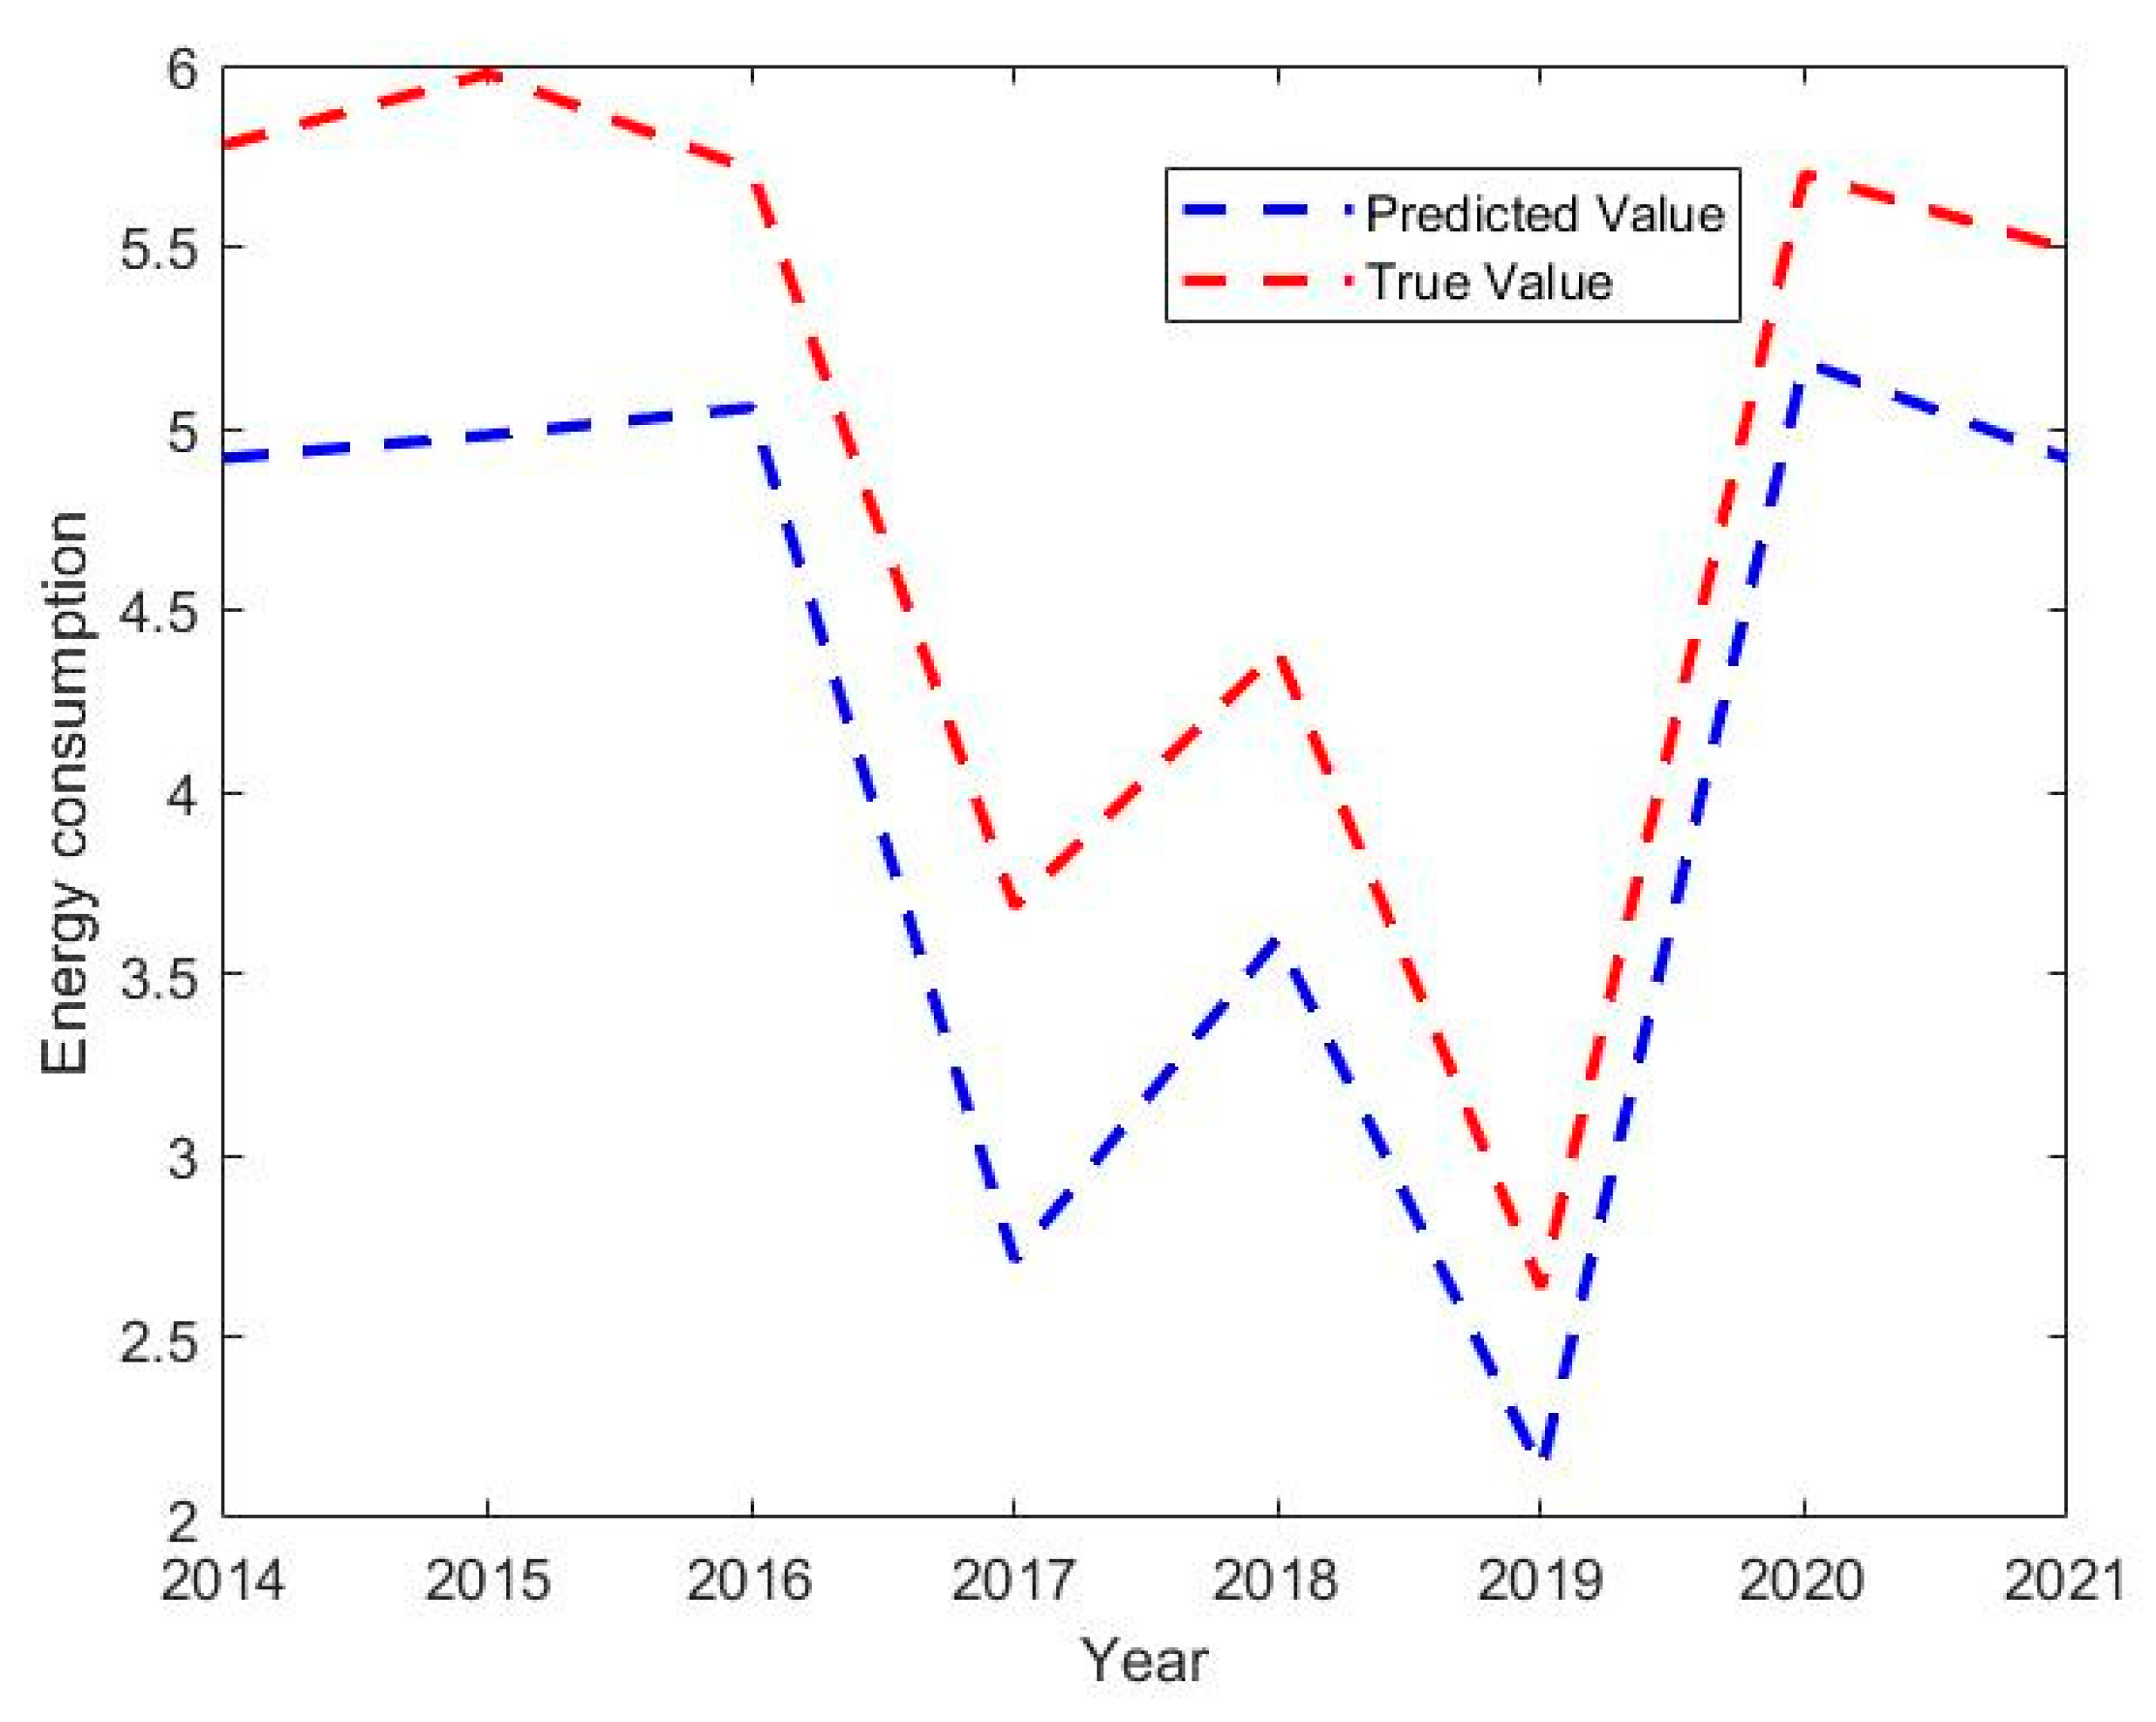
p-value is 0.001 ***, which rejects the original hypothesis that the regression coefficient is zero. Therefore, the model essentially meets the requirements. Multicollinearity refers to the existence of a linear relationship between the independent variables in the regression analysis equation, as the linear relationship between the independent variables will interfere with the relationship between the independent variables and the dependent variable, thus leading to errors in the regression analysis results. This will have a greater impact on the results. For the performance of variable covariance, the VIFs are all less than 10, so the model has no issues related to multicollinearity, making it well constructed. The fitted regression coefficient of the model was 0.974, indicating a good model fit. The model prediction results are shown in
Figure 5.
The equation of the model is: y = 0.152 + 0.89 × Population + 1.221 × Regional GDP + 0.613 × Construction machinery performance specifications + 1.014 × Construction machinery shift consumption −0.07 × Energy saving and environmental protection input + 3.043 × Energy Type.
A multiple regression analysis of regional carbon emissions was conducted and the results are shown in
Table 8.
The analysis of the results of the F-test denotes that the significant
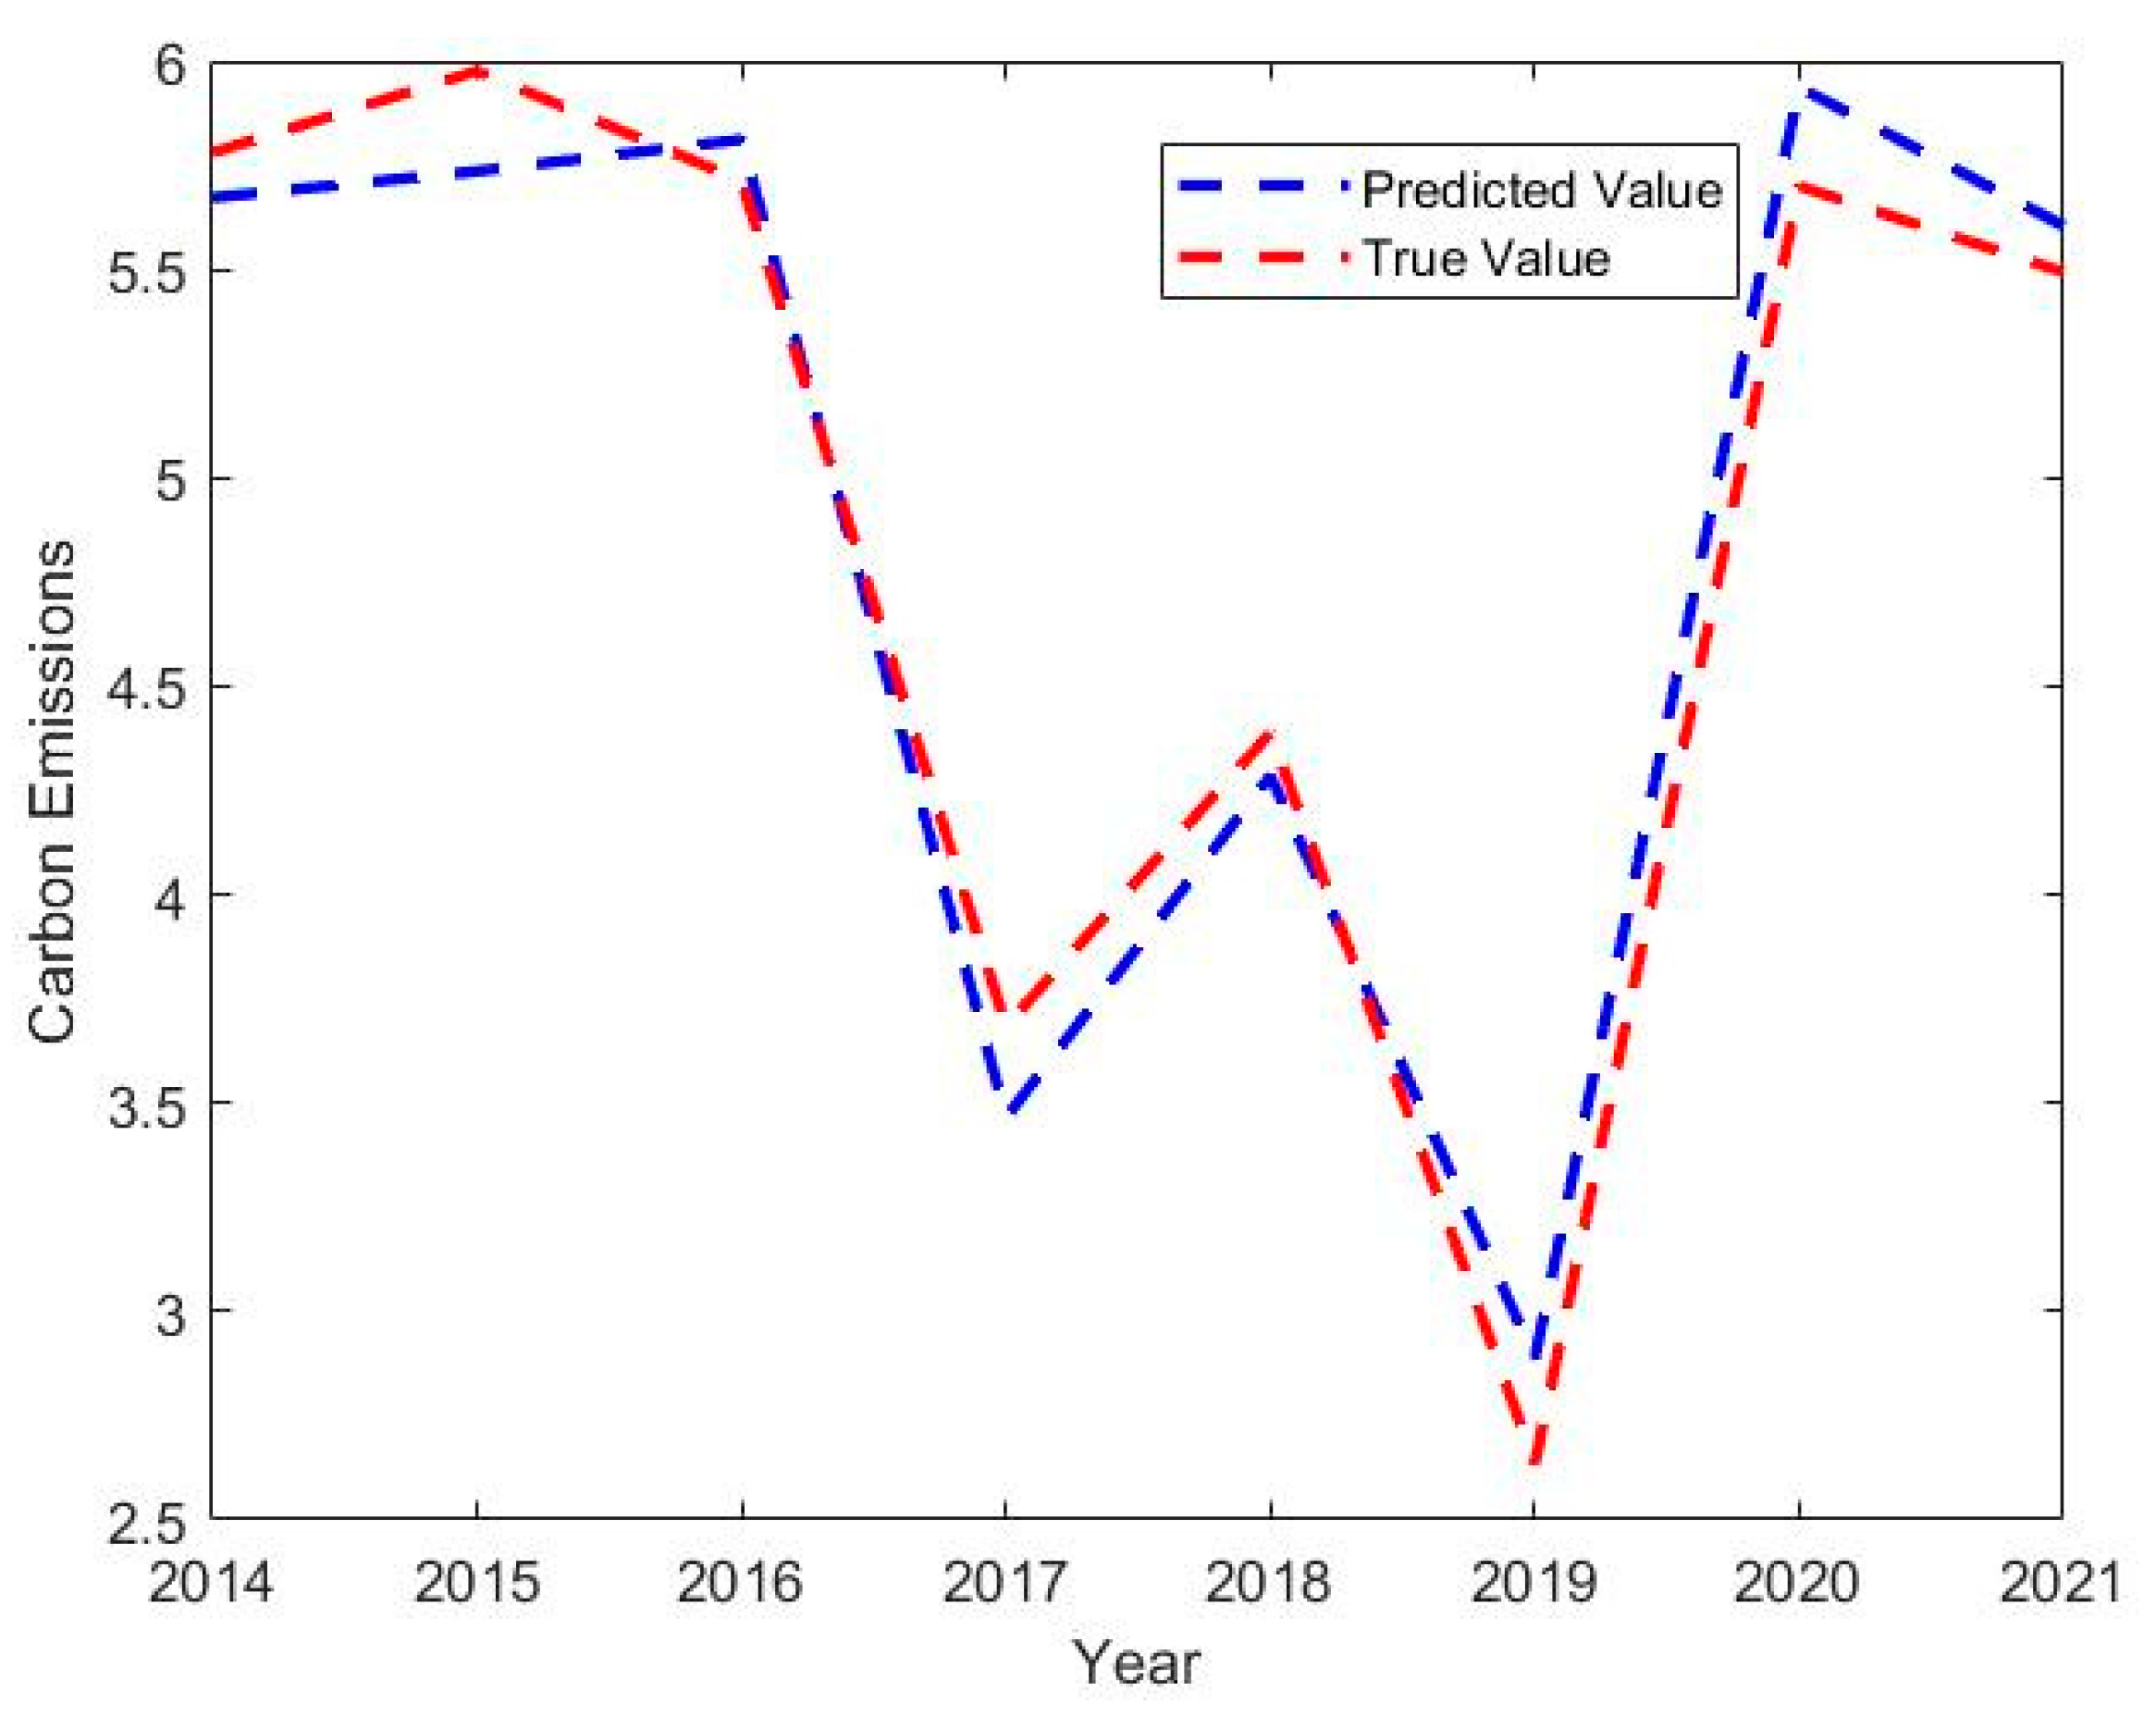
p-value is 0.001 ***, which refutes the original hypothesis that the regression coefficient is zero. Therefore, the model meets the requirements. For the performance of variable co-linearity, the VIF is less than 10, so the model has no problems related to multiple co-linearity, making it well constructed. The model prediction results are shown in
Figure 6.
The equation of the model is: y = −0.328 + 1.923 × Population + 2.638 × Regional GDP + 1.324 × Construction machinery performance specifications + 1.014 × Construction machinery shift consumption − 0.07 × Energy saving and environmental protection input + 4.627 × Energy Type.
Based on the modified STIRPAT theoretical model, this paper selects a new terminal building as the research object using construction machinery shift data as well as macro-data, such as the population and economy of the city where the terminal building is located, to empirically analyze the population size, gross regional product, energy saving and environmental protection investment, construction machinery shift consumption, construction machinery performance specifications, and energy type as the drivers of energy consumption and carbon emissions. The coefficients in the model formula indicate the rates of contribution to energy consumption and carbon emissions, and the positive and negative coefficients indicate whether they play a positive or negative role, while their absolute value size indicates how significant the effect is; the larger the role, the more significant it is.
5. Discussions and Conclusions
In this study, for energy consumption and carbon emission, the degree of influence of each factor is roughly the same, showing a strong correlation between energy consumption and carbon emissions, and this result is similar to previous research in various fields. For instance, Niu Shuwen [
32] et al. used a panel data model to analyze the relationship between energy consumption and carbon emissions for eight countries in the Asia-Pacific region over the period 1971–2005, and the results showed that there was a long-term equilibrium relationship between the two, which is particularly evident in developed countries. Chai, N. [
33] et al. analyzed the correlation between energy consumption and carbon emissions generated in China’s agricultural, industrial, construction, and transportation sectors by using statistical data from the China Energy Statistical Yearbook and found that the relationship between the growth rate of energy consumption and the growth rate of carbon emissions existed in two cases. One is that the growth rate of energy consumption is greater than that of carbon emissions. This indicates the low carbon emissions per unit of energy consumption, for example, in the process of natural gas consumption in industry, transportation and catering industry, or in the process of electricity consumption in the catering industry, and this trend is shown. The second is that the growth rate of energy consumption is smaller than that of carbon emissions. For example, the industry and construction industry show this trend in the process of consuming oil, indicating that these industries should reduce the use of this energy or adjust the energy structure. Combined with the basic national situation that China has a large number of total resources, but a small amount of per capita possession, so in the process of promoting energy conservation and emission reduction, reducing carbon emission by reducing energy consumption is not only scientific and reasonable, but also an inevitable choice.
Using the regression equation of the STIRPAT model, we derived the degree of influence of each indicator on carbon emissions. For energy consumption, the degree of influence, in descending order, is energy type, gross regional product, construction machinery shift consumption, population, construction machinery performance specifications, and energy conservation and environmental protection input. For carbon emissions, the degree of influence, in descending order, is energy type, regional GDP, population, construction machinery performance specifications, construction machinery shift consumption, and energy conservation and environmental protection input. Prioritizing and regulating these factors with a greater degree of influence will have a positive impact on the reduction in energy consumption and carbon emissions. Further analysis for each factor in this study:
- (1)
The impact of construction machinery shift consumption on energy consumption is large, and the impact on carbon emissions is relatively small. To reduce shift consumption, on the one hand, we should improve the utilization rate of machinery and equipment; on the other hand, we also need to ensure and codify the operating hours of construction machinery and equipment.
- (2)
With the development of society and the continuous growth of regional GDP, the local government’s requirements for the scale and function of buildings will also increase, and the corresponding requirements will be implemented in the construction process, resulting in greater total energy consumption and carbon emissions.
- (3)
The increase in population also leads to an increase in public demand and a higher demand for public buildings, which leads to higher energy consumption and carbon emissions. However, the influence of demographic factors on energy consumption and carbon emissions can also be reduced through corresponding measures, and studies have found that the higher a population’s education level, the more people tend to live an environmentally friendly lifestyle; using this approach, carbon emissions will gradually decrease as the proportion of the population with higher education increases [
34].
- (4)
The same category of construction machinery, its old and new models, different specifications for energy consumption and unit carbon emissions is more significant, in the construction process for the use of construction machinery, should be timely elimination of high energy consumption, low efficiency of the old equipment to improve the overall efficiency.
- (5)
As the government continues to invest in energy conservation and environmental protection, it has had a suppressive effect on energy consumption and carbon emissions. That said, the effect of this factor is the least significant among all indicators, because not all government investment in energy conservation and environmental protection is applied to the construction field, and there is a certain lag between the introduction of policies and related standards and their implementation in actual construction. However, government investment in this field is not only effective but also has much room for growth.
Similarly, studies on the influencing factors of energy consumption and carbon emissions in the building sector are conducted at many levels (individual building level, industry level, city level, and national level), and some of the current findings in this paper share several traits with these studies. For example, through a study on the contribution of influencing factors of residential buildings, Jiang [
35] et al. found that residential energy intensity, housing area per capita, and total number of households were the main factors influencing carbon emissions from residential buildings, with contribution rates of −39%, 77%, and 67%, respectively. Similarly, Lu Juchun [
36] et al. used the density estimation method to study the changing characteristics of CO
2 emissions in China’s construction industry, and added influencing factors such as construction scale, energy structure, energy intensity, and unit output value in the process of the study; their results showed that technological factors such as production process, energy structure and green building materials have the most significant impact on carbon emissions, and the influence of local GDP development is also more obvious. These studies show that the energy consumption and carbon emissions generated in the development of the construction industry are the result of a combination of demographic, economic, technological, and other factors, some of which are recognized as having the most significant impact effect. As such, these factors ought to be the primary focus for solving carbon emission problems.
In addition, there is valuable research in other industries. For example, Xu et al. [
37] analyzed the CO
2 emissions and reduction potential of China’s non-metallic mineral products industry using economic output, population size, energy structure, and energy intensity as the main driving factors. The results of the study indicated that the largest influencing factor was economic output, followed by population size and energy structure effects. Glaeser and Kahn [
38] investigated the effect of urban population growth on carbon emissions, and the results of the study showed that the per capita carbon emissions generated by new inhabitants of the city were higher than those of the established population.
From the findings in this paper, it is apparent that various factors have different degrees of influence on the energy consumption and carbon emissions generated in the construction of large public buildings. The basic goal of this study is to provide the best options for energy efficiency and carbon reductions to ensure the successful completion of China’s energy-saving and emission-reduction goals. In addition, this study found that, for construction managers, energy efficiency is easier to implement and easier to promote than carbon emission reduction. Likewise, Khan, S.A. [
39] et al. argue that various types of energy-reduction measures can help to minimize carbon emissions at all levels, while being cheaper to invest in and easier to incentivize government policies to promote.


