1. Introduction
With the rapid development of the economy and technology, the pace of urbanization continues to accelerate. There are more and more skyscrapers and dense building groups in the city, due to the shortage of land resources. This trend influences the regional outdoor wind environment and causes a series of wind environment problems, such as strong winds, endangering safety, and reducing pedestrians’ comfort [
1,
2,
3]. Reports about pedestrians being blown down or fatally injured by strong winds are very common nowadays. In some cases, windows are blown off, causing property damage or casualties. The improper outdoor wind environment may cause local whirlpools and dead corners of airflow, hindering the pollutant diffusion and leading to human health problems [
2,
3,
4,
5]. The wind environment problems caused by poor-designed building layouts may also increase the energy consumption. In the summer, the air conditioning load increases, due to poor air circulation, while heating energy consumption soars, due to the high air permeability of the envelope structure, in the winter [
6,
7,
8]. Therefore, for new buildings exceeding a certain height, the wind environment evaluation around the building is a must in many countries [
9]. According to the assessment standard for China’s green buildings, the pedestrian height’s wind speed limit around the building is five meters per second [
10]. Therefore, the research and evaluation of the wind environment around a building can help optimize the architectural design and regional planning, which is crucial for creating a safe, comfortable, and healthy outdoor building environment and significant for building energy savings.
Computational fluid dynamic (CFD) simulations and wind tunnel experiments are popular methods to study and evaluate the outdoor wind environment [
11,
12], and they are widely used in architectural design. As a simple and fast method, a CFD simulation can obtain abundant data at a low cost [
13,
14,
15,
16,
17]. However, it is greatly influenced by the turbulence models adopted and the user’s experience. The calculation results vary from person to person, with great uncertainty [
18]. Unlike the CFD method, the wind tunnel experiment is more reliable [
11,
18]. The advantages of this method include controllable airflow and boundary conditions, convenient measurement, stability in different climatic conditions, and reliable data output. Therefore, wind tunnel experiments are one of the most important and robust research methods in wind engineering [
19,
20,
21,
22,
23,
24,
25,
26]. For outdoor building environment measurements in a wind tunnel, it is important to simulate the real wind field in which the building is located. The atmospheric boundary layer (ABL), which is the layer at the bottom of the atmosphere, is greatly affected by the ground surface [
27]. In particular, unlike wind engineering, which is concerned with the characteristics of the ABLs, the study of outdoor building environments pays more attention to the wind speed outside of the building under the common conditions in different seasons and the impact on the building ventilation and energy consumption, rather than on extreme environments [
28]. Thus, this paper focuses on the wind speed created by the wind tunnel and will preliminarily discuss its applicability in the outdoor building environment research.
Spires and roughness elements are generally applied to the existing wind tunnel to create the gradient wind of the atmospheric boundary layer. When the terrain changes, the spires and roughness elements should be replaced or adjusted, correspondingly, to achieve the required airflow. Although the gradient wind formed by this wind tunnel is usable, the method is both time-consuming and labor-intensive. There are disadvantages, such as the large size, large footprint, as well as the higher cost of operation and maintenance [
29,
30]. The dimensions of the traditional low-speed wind tunnels, mentioned in the references [
31,
32,
33], are about 12–24 m in length, 2–4 m in width, and height. In order to make the wind tunnel test more convenient and to reduce the footprint, some scholars adopted different methods to create the atmospheric gradient wind. Lloyd proposed three ways to create gradient wind [
34]. Phillips used variable-spacing flat grids to simulate the wind speed profile and turbulence in the atmospheric boundary layer [
35], then Yang et al. compared the wind field characteristics created by the five flat grids in a short test section [
36]. In the design of the wind erosion wind tunnel, Pietersma and Fan used a honeycomb and screen, and Wu used a rod grid, and a roughness element method to construct the gradient wind [
37,
38,
39] Hlevca et al. and Pires et al. used rectangular grids, spires combined with blankets and screens, to create an atmospheric boundary layer in a small-scale wind tunnel, and further explored the atmospheric boundary layer construction method of a shorter-test segment wind tunnel, than in the previous study [
40,
41].In this paper, unequally-spaced grids will be used to create the gradient wind of the atmospheric boundary layer. Compared with the theoretical values, the accuracy of this new compact wind tunnel is verified. With the application in an actual super high-rise building, the accessibility of this wind tunnel, applied to the study of the outdoor wind environment, is demonstrated.
2. Gradient Wind Model
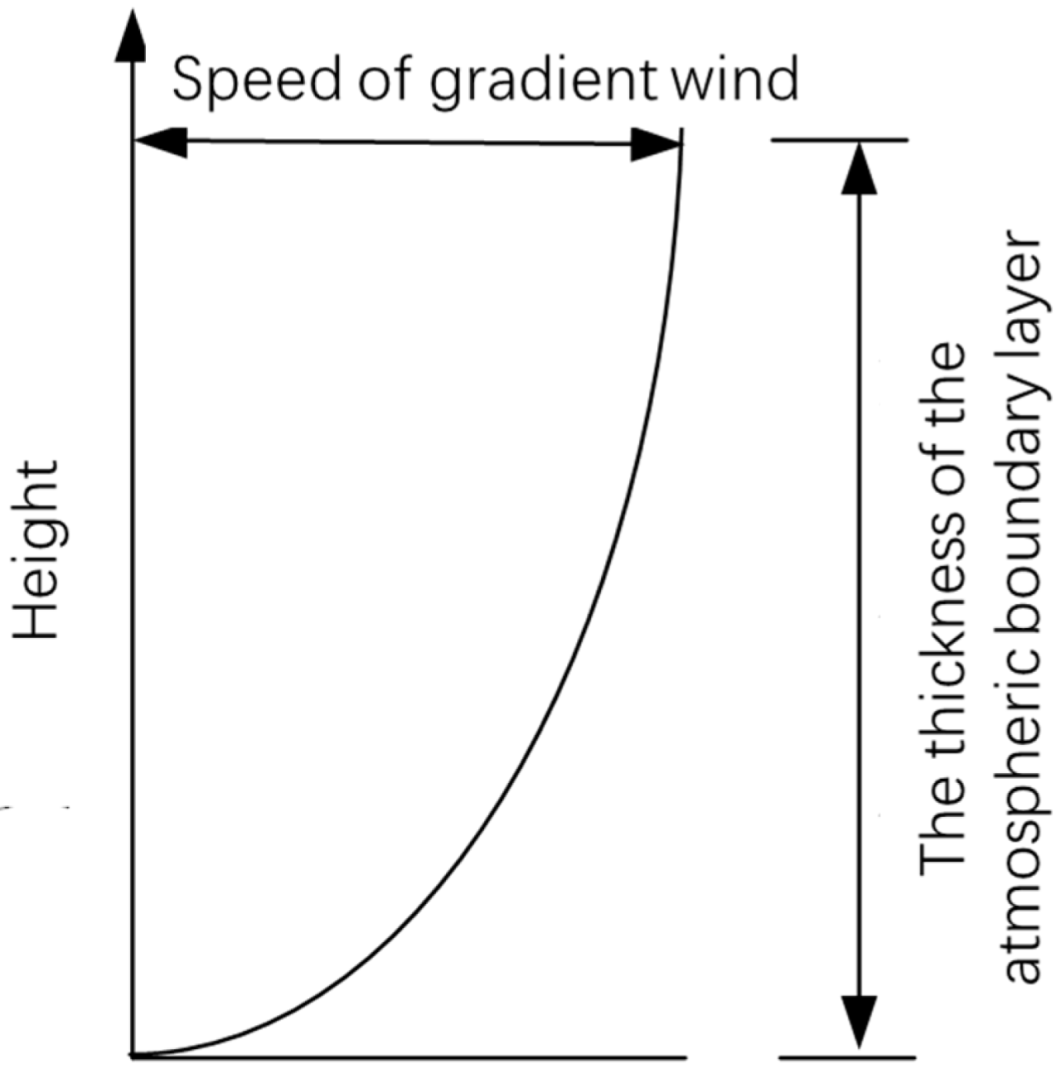
The creation of the atmospheric boundary layer is the basis of the wind tunnel experiment, and it must be ensured that the atmospheric boundary layer is similar to that of the actual landforms, which is the key issue of the wind tunnel platform. The wind speed in the atmospheric boundary layer is a function of the height. According to the current national standard for the wind tunnel tests of buildings and structures in China [
42], an exponential law is used to characterize the relationship between the wind speed and the altitude in the boundary layer, as shown in
Figure 1. The formula is as follows,
: the average wind speed at height z, m/s.
: the average wind speed at the height of 10 m, m/s.
: the vertical height from the ground, m.
: the wind speed profile index has different values according to the ground roughness category.
: the gradient wind height, m.
: the height of the starting profile, m.
According to the different surface roughness, landforms are clarified into four types, which are open space (A), town (B), urban (C), and high-rise building area (D). These four landforms’ corresponding wind speed profile indexes are 0.12, 0.15, 0.22, and 0.30, respectively, with a boundary layer thickness of 300 m, 350 m, 450 m, and 550 m.
3. Wind Tunnel Platform
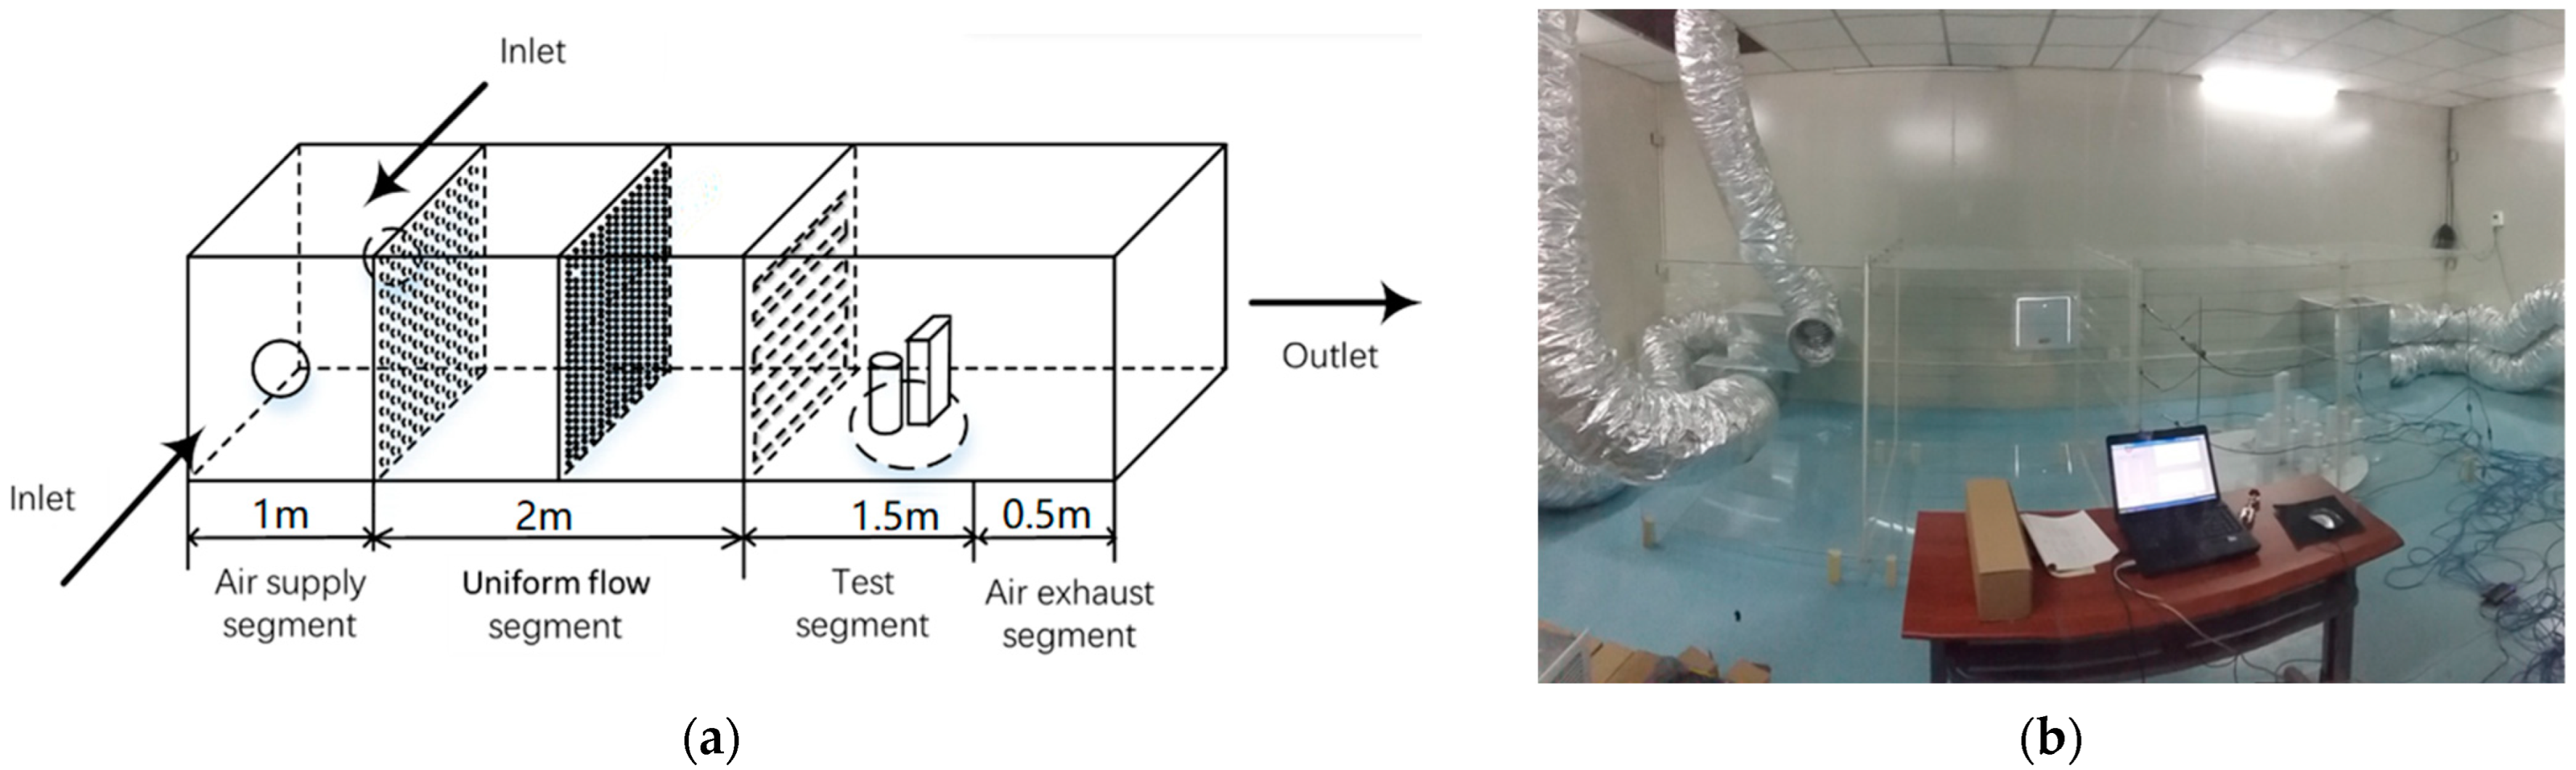
The compact wind tunnel platform was located at the building environment laboratory of Beijing Union University. The wind tunnel was made of plexiglass, with a dimension of 5 m (L) × 1.2 m (W) × 1.2 m (H), which was much smaller than the regular wind tunnel used for the building-wind-load measurement. It consisted of four parts along the airflow direction: the air supply segment, uniform flow segment, test segment, and air exhaust segment, as shown in
Figure 2.
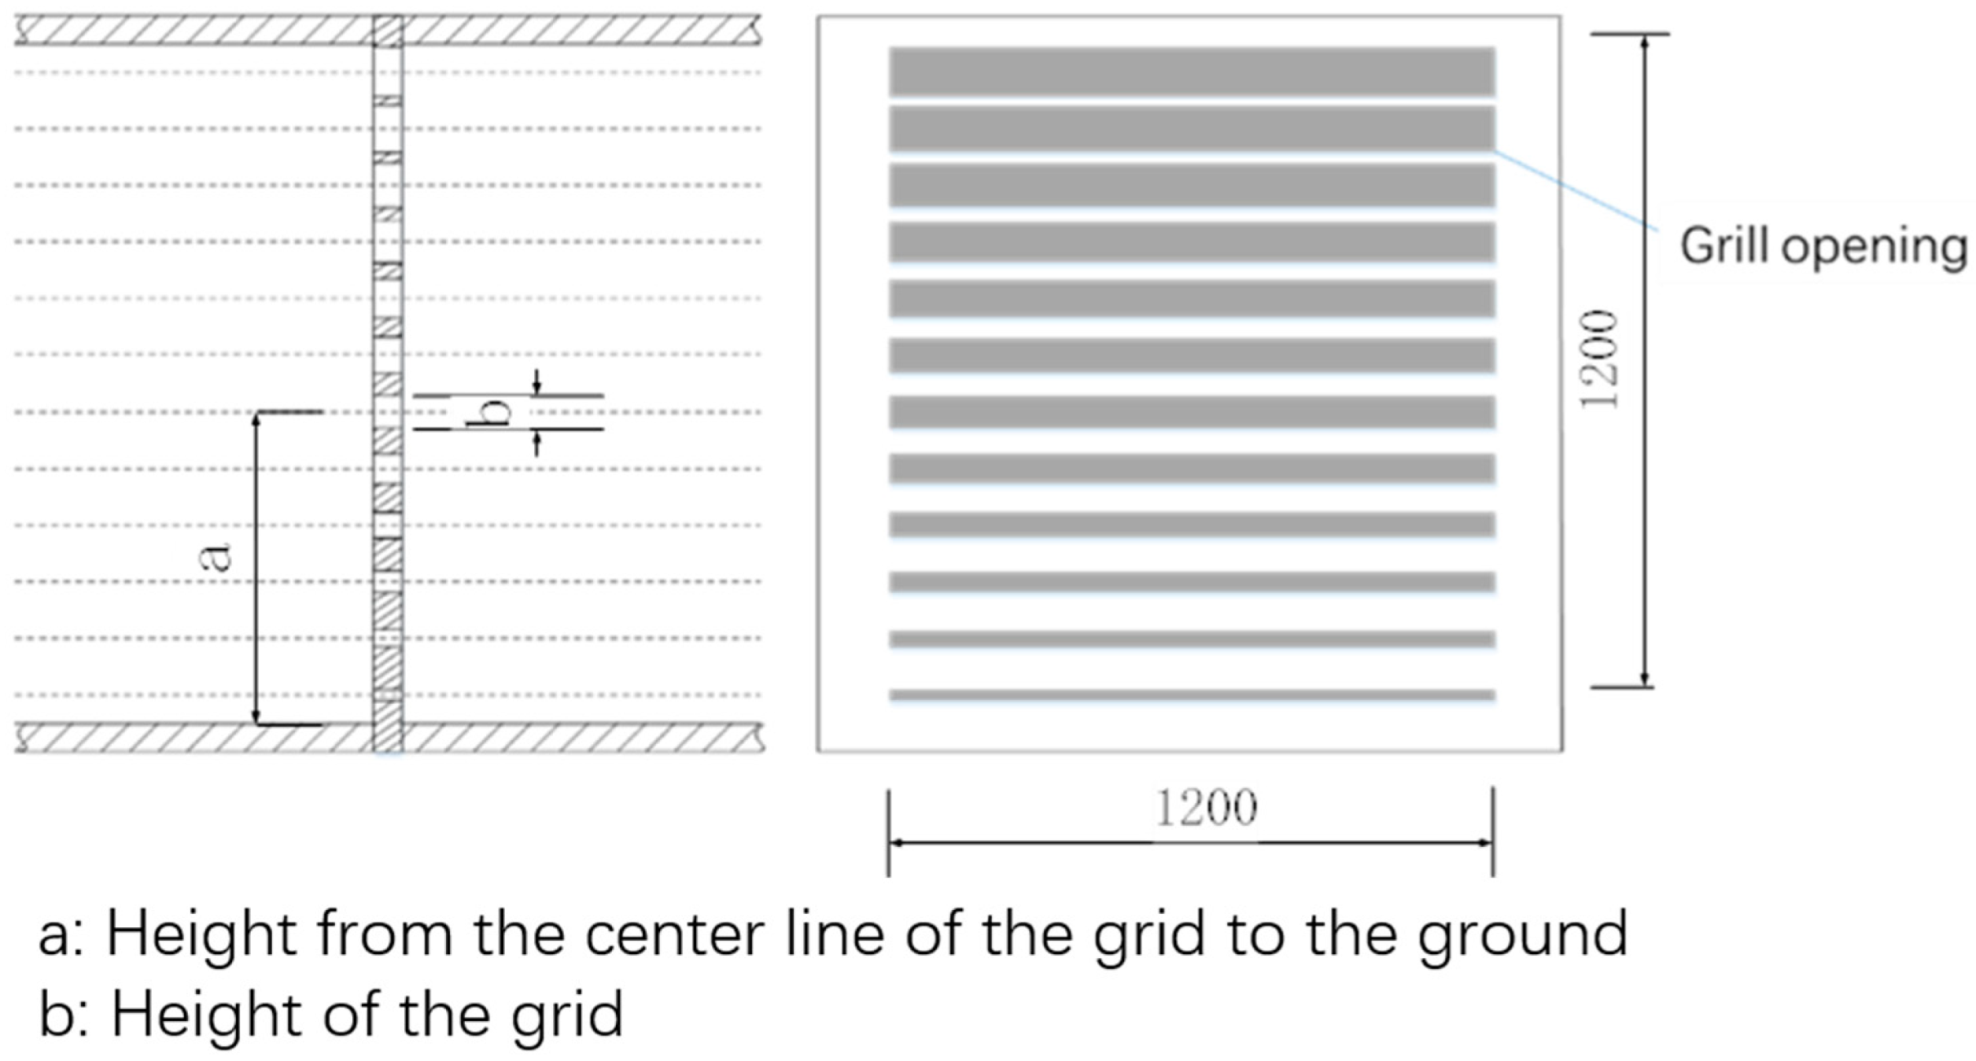
In the air supply segment, two symmetrical inlets with a diameter of 300 mm were set in the middle position of the left and right sides, to access the air supplied by the fan to the wind tunnel. Applying this air supply method, the air supply segment functioned as a plenum chamber, which can reduce the influence of the momentum of the incoming flow on the uniformity. In order to improve the uniformity of the airflow, a uniform flow segment was set behind the air supply segment. The length of this part was 2 m and consisted of two plates. Holes with a diameter of 30 mm were evenly distributed on the first plate, and holes with a diameter of 10 mm for the second one. The distance between the two plates was 1 m. The plate with larger holes was placed in front, 0.5 m away from the center of the air supply outlet. In order to create the gradient wind of the atmospheric boundary layer, a grid plate with unequal spacing was set, which was 2.5 m away from the inlet, as shown in
Figure 3. Based on Bernoulli’s equation and the equation for the local resistance of fluid flowing through the grid plate, the unequal spacing of the grid plate for four typical landforms could be calculated, respectively, to achieve the corresponding gradient wind. The different heights between the centerline and bottom plate a and the widths of each grill opening b, in
Figure 3, are listed in
Table 1. The test segment was behind the grid plate, where the building model is placed, and the outdoor wind environment was measured. At the end of the wind, the tunnel platform was the air exhaust segment, where the air was discharged.
4. Performance Evaluation and Discussion
4.1. Measuring Method
A SWEMA 03 universal digital hot wire anemometer was used to measure the wind speed. The minimum response wind speed of the instrument was 0.03 m/s, the accuracy was ±3%, the response time was less than 0.2 s, and the sampling frequency was 100 Hz. Multiple anemometers were used in the measurement. The anemometers were connected to the computer through a USB hub, to form a multipoint wind-speed data acquisition system. The wind speed was measured and recorded every 2 s, and the measurement lasted for 3 min. Finally, the arithmetic mean value of the collected wind speed was calculated as the wind speed of the measuring point.
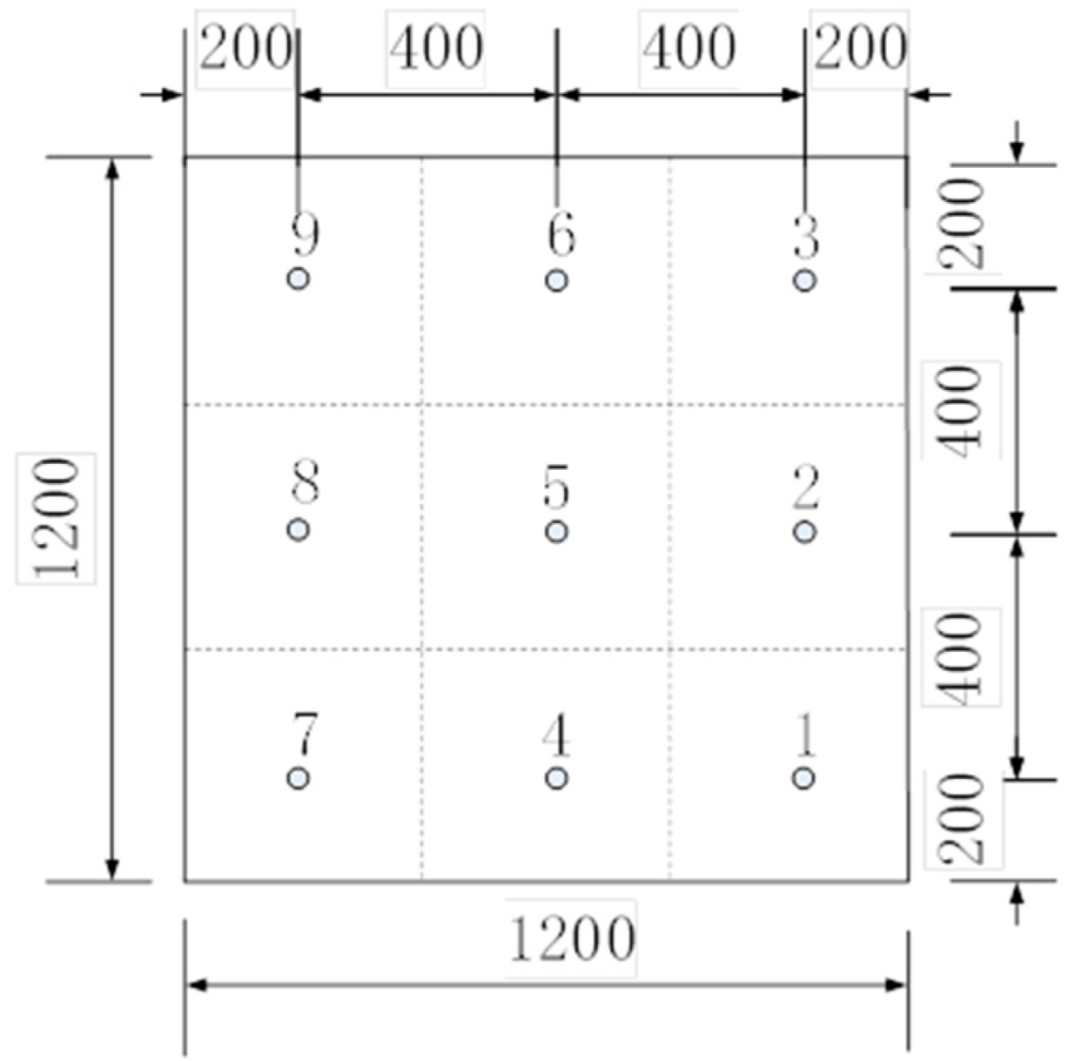
4.2. Uniformity of the Wind Speed before the Grid Plate
Two cases with different air supply volumes, 5000 m
3/h (case 1, the corresponding frequency of the air supply fan is 50 Hz) and 3680 m
3/h (case 2, the corresponding frequency of the air supply fan is 35 Hz), were conducted, respectively. Four sections of 2 m, 2.5 m, 3 m, and 4 m away from the air supply inlet, were selected to evaluate the wind tunnel’s uniformity of the wind speed before the grid plate. Nine measurement points were arranged regularly in each section, and there was a certain distance between the instrument and the wall, to minimize the measurement errors, as shown in
Figure 4.
Figure 5 and
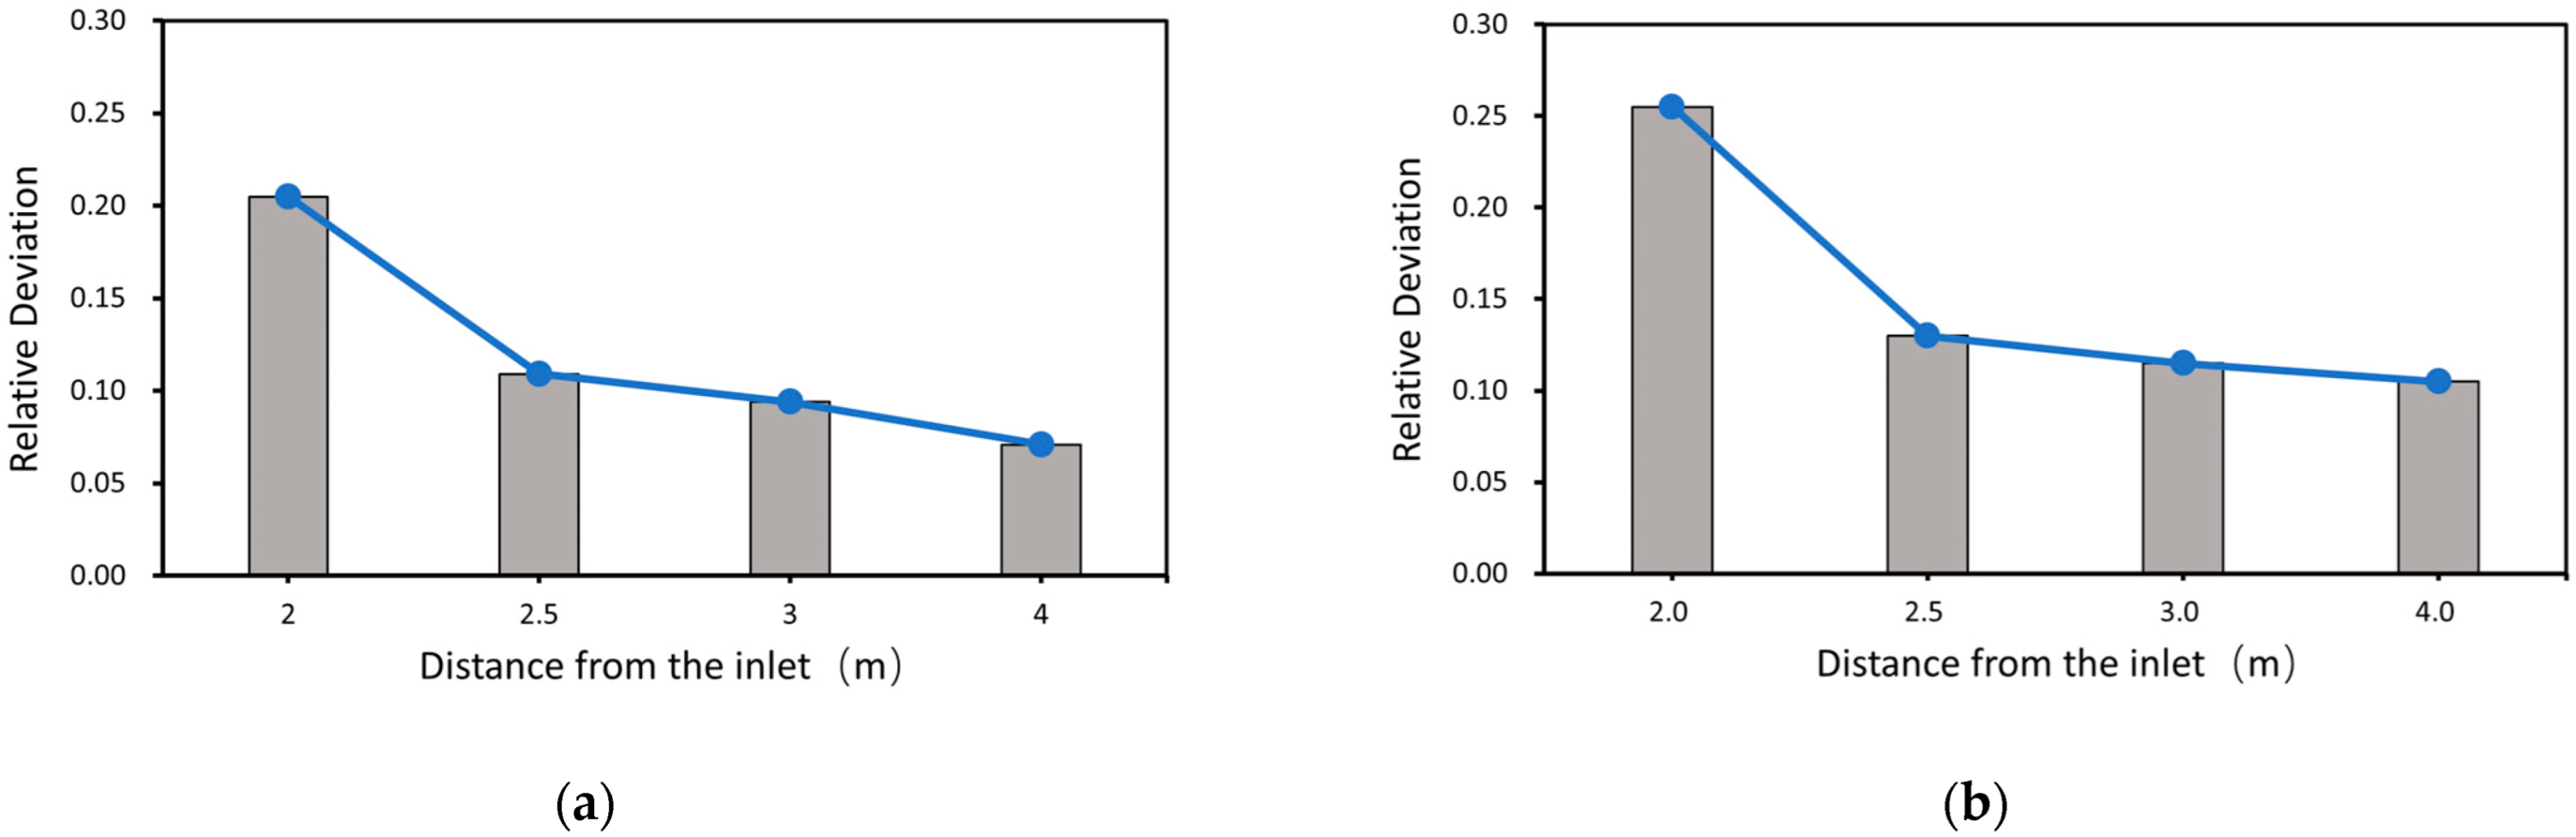
Figure 6 present the measured wind speed values of each point on the different sections in the two cases. The relative deviation of the wind speed on different sections was calculated and shown in
Figure 7.
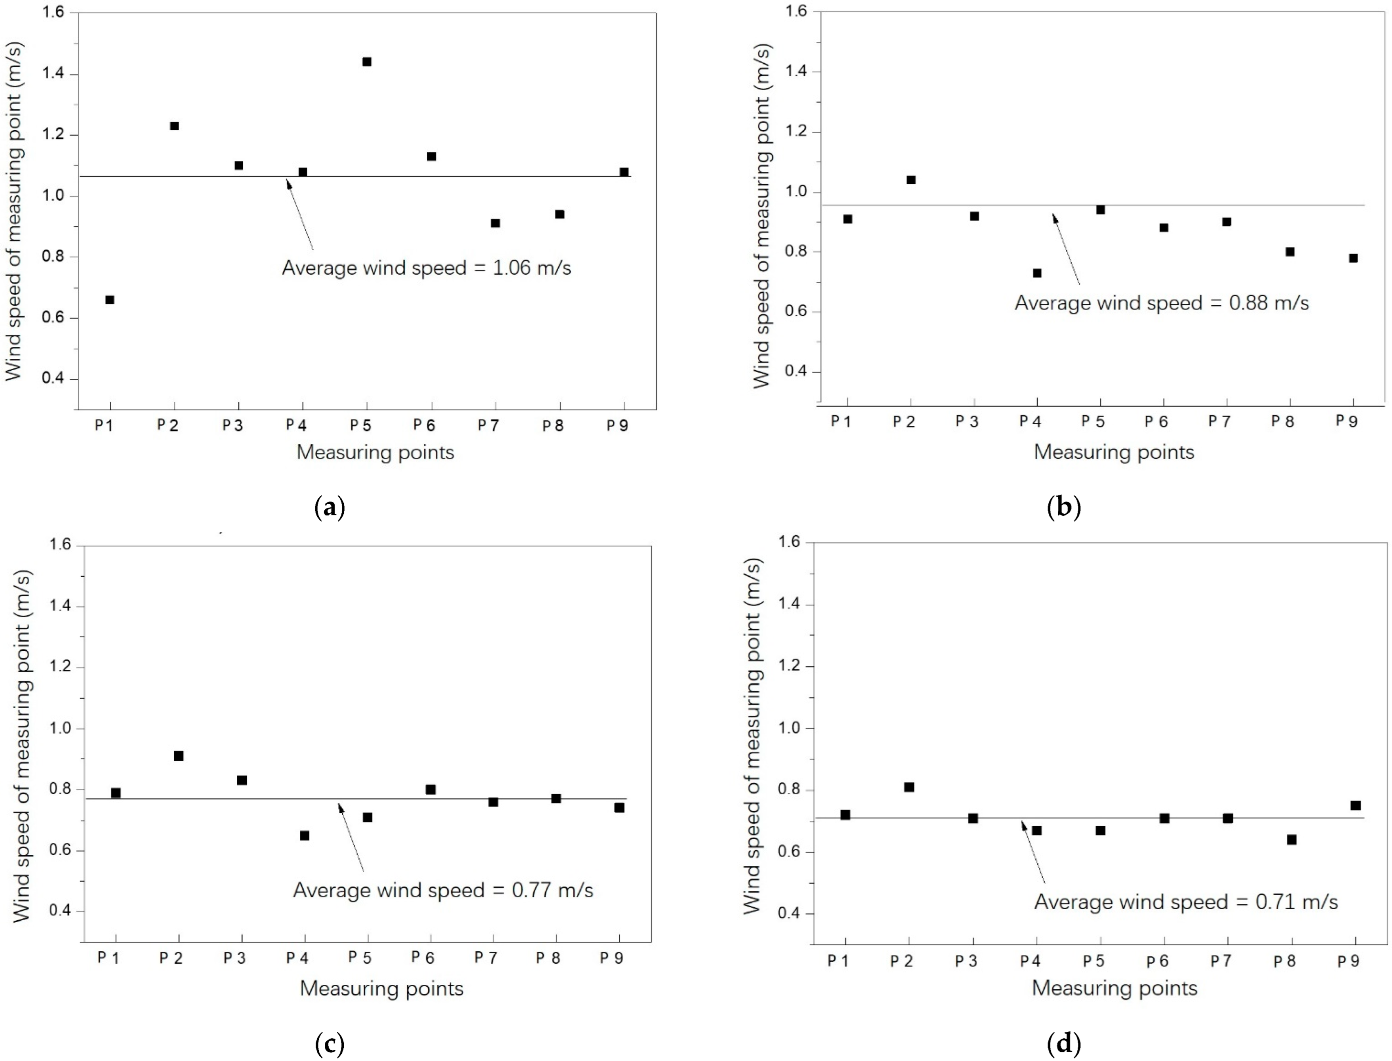
As shown in
Figure 5 and
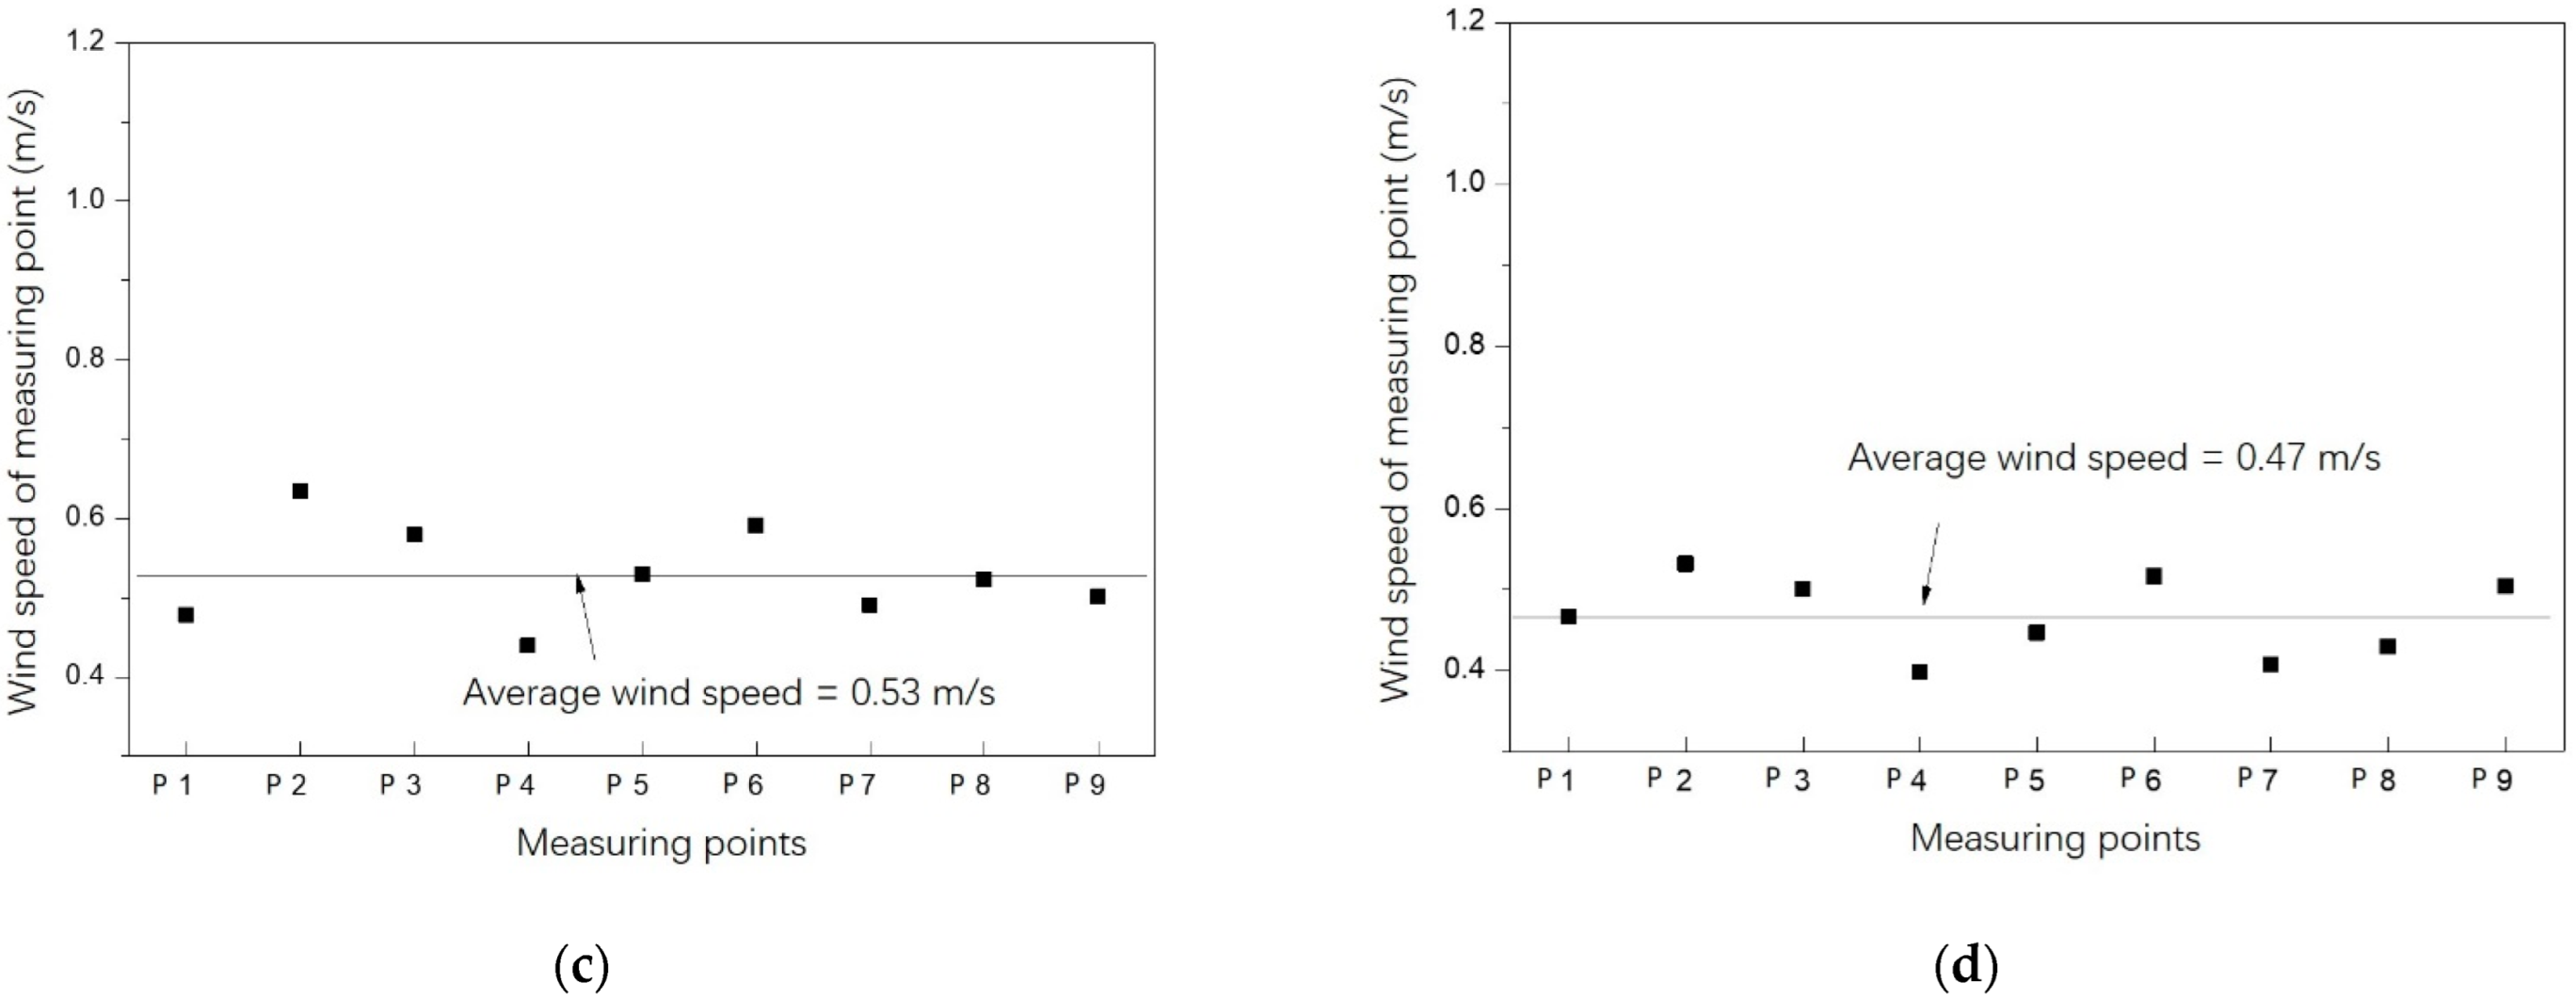
Figure 7a, in case 1, the average wind speed of the measurement points on the section 2 m away from the air supply inlet was 1.06 m/s, and the maximum wind speed was 1.13 m/s. The minimum wind speed was 0.66 m/s, the standard deviation was 0.22 m/s, the relative deviation was 20.5%, and the COV value was 0.208. On the section 2.5 m from the air supply inlet, the average wind speed was 0.8 m/s, the maximum wind speed was 0.94 m/s, the minimum wind speed was 0.73 m/s, the standard deviation was 0.09 m/s, the relative deviation was 10.9%, and the COV value is 0.091. On the section 3 m away from the inlet, the average wind speed was 0.77 m/s, the maximum wind speed was 0.91 m/s, the minimum wind speed was 0.71 m/s, the standard deviation was 0.07 m/s, the relative deviation was 9.4%, and the COV value is 0.112. On the section 4 m away from the air inlet, the average wind speed decreased to 0.71 m/s, the maximum wind speed was 0.81 m/s, the minimum wind speed was 0.64 m/s, the standard deviation was 0.05 m/s, the relative deviation was 7.1%, and the COV value was 0.070. The comparison between the results of the different sections shows that the optimal distance was 4 m from the air supply inlet, where the standard, relative, and COV deviations were both the minimum. This implied the best uniformity of the wind speed. It also indicated that the uniformity of the wind speed is positively related to the distance from section to inlet. The same conclusion could also be drawn from the test results of case 2, as shown in
Figure 6 and
Figure 7b.
Figure 5 and
Figure 6 also indicate that, due to the wall resistance and the wind tunnel sealing, the average wind speed of the cross-section decreased with the distance. Considering the characteristics of self-preservation of the wind field, the building model should be placed closer to the grid plate during the measurement, so that the wind speed of the wind tunnel matches the actual outdoor wind.
Comparing
Figure 5 with
Figure 6 and
Figure 6a with
Figure 7b, it could be found that when the air supply volume increases, the relative deviation decreases or the uniformity of the wind speed improves.
4.3. Vertical Distribution of the Wind Speed behind the Grid Plate
As shown in Equation (1) and
Figure 1, the gradient wind speed in the atmospheric boundary layer varied with the altitude. The purpose of this wind tunnel was to create a gradient wind field close to the theoretical curve. Therefore, whether the vertical distribution of the velocity behind the grid plate forms a gradient wind, is important; it is also a key index to evaluate the reliability of the wind tunnel.
According to the similarity criterion, the reference wind speed at the height of 10 m above the ground at the atmospheric boundary can be calculated, as shown in Equation (2) [
43].
: the wind speed at height , m/s.
: the reference wind speed, m/s.
: the reference height, m.
: the average wind speed power index.
For case 1, the average wind speed of the uniform flow segment was 1.06 m/s, which was taken as the reference wind speed of the mainstream at the atmospheric boundary; thus was 0.266 m/s, according to Equation (2).
For ease of comparison, the average wind speed of the different heights was converted into a wind speed ratio, as shown in Equation (3).
: wind speed ratio at point j.
: the average wind speed at point j, m/s.
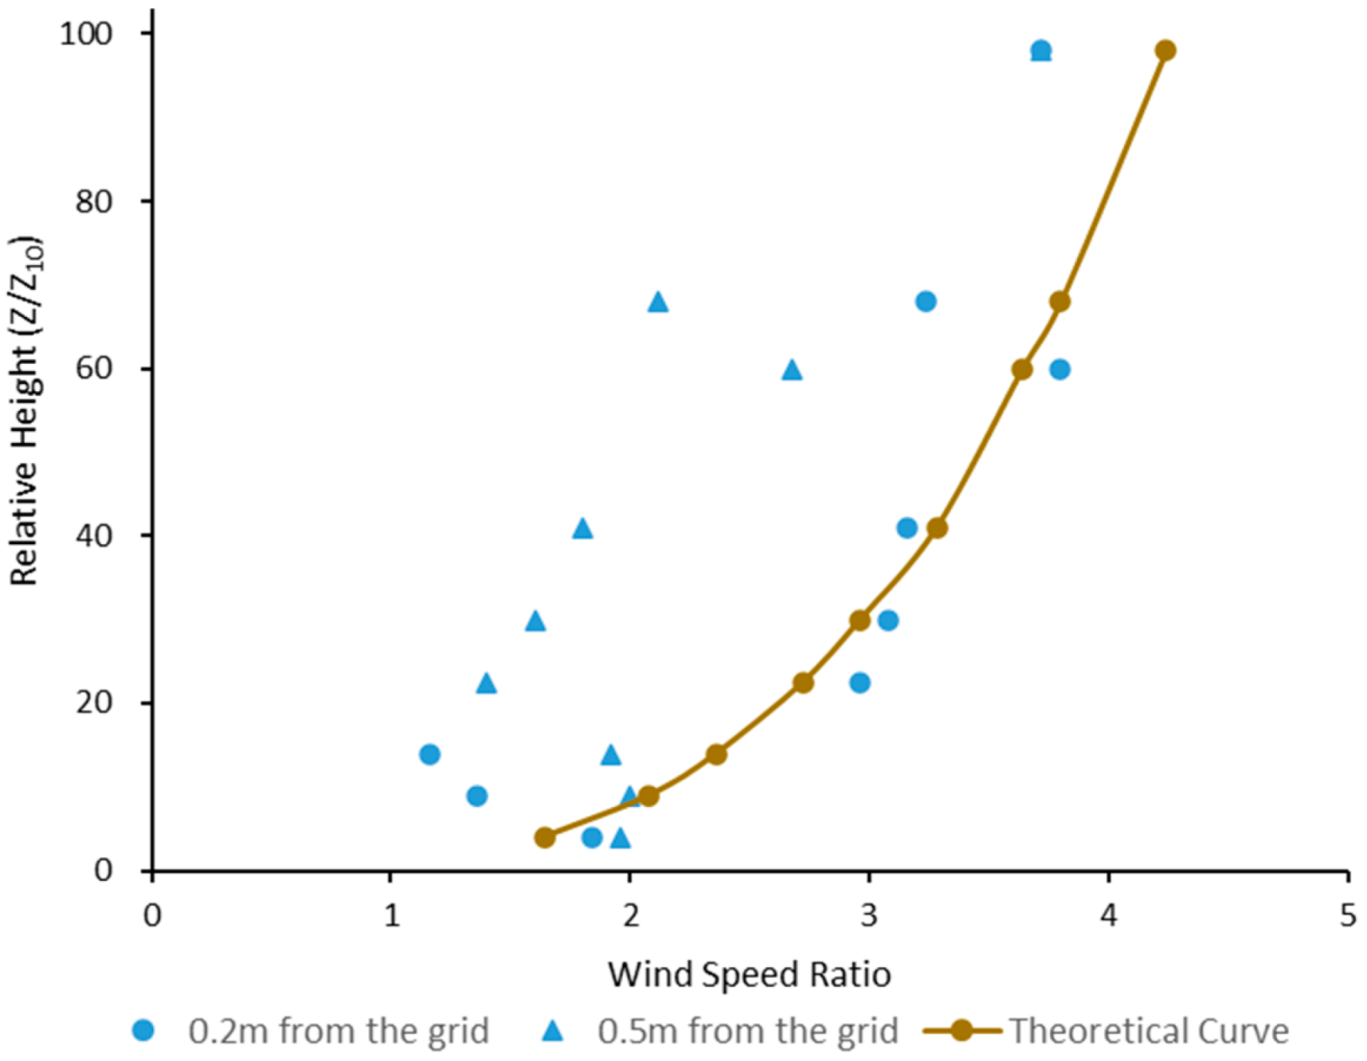
According to Equation (3), the theoretical and measured wind speed ratios of the different heights can be calculated, respectively. The wind speed ratios of the two cases on the sections at the distance of 0.2 m and 0.5 m away from the grid plate are presented in
Figure 8.
In
Figure 8, for both cases, the wind speed ratio on the section of the distance of 0.2 m away from the grid plate is close to the trend of the theoretical target curve, which indicates that this wind tunnel can successfully form the gradient wind. The data of the measurement points with the vertical height ratio of 4 (the lowest measurement point) deviates farther from the target curve than the other points, which should be attributed to the short distance to the wall. By contrast, on the section 0.5 m away from the grid plate, the deviation of the measured value from the theoretical target curve increases. The increase is caused by the gradual attenuation of the wind speed and the reduction of the gradient difference.
Meanwhile, a comparison between
Figure 8a,b shows that, as the air supply volume increases, the measurement value and the theoretical curve match better, which implies that the larger the supply air volume, the better the gradient wind can be obtained.
To investigate the wind tunnel’s wall boundary’s influence on the airflow, the wind speed near the wall was measured for case 1. The measuring points were arranged 0.1 m near the wall of the section. The wind speed of the section at 0.2 m and 0.5 m behind the grid plate, was measured, as shown in
Figure 9. Compared with
Figure 8, it can be seen that the wind speed near the wall at 0.2 m is also close to the theoretical curve. However, the wind speed of the different heights at 0.5 m, decreases significantly, and the deviation from the theoretical curve greatly increases, indicating that the wind speed gradient near the wall boundary cannot be consistent with the central mainstream. Therefore, when using this wind tunnel platform for testing, it is recommended that the building model be placed in the central mainstream area of the wind tunnel airflow.
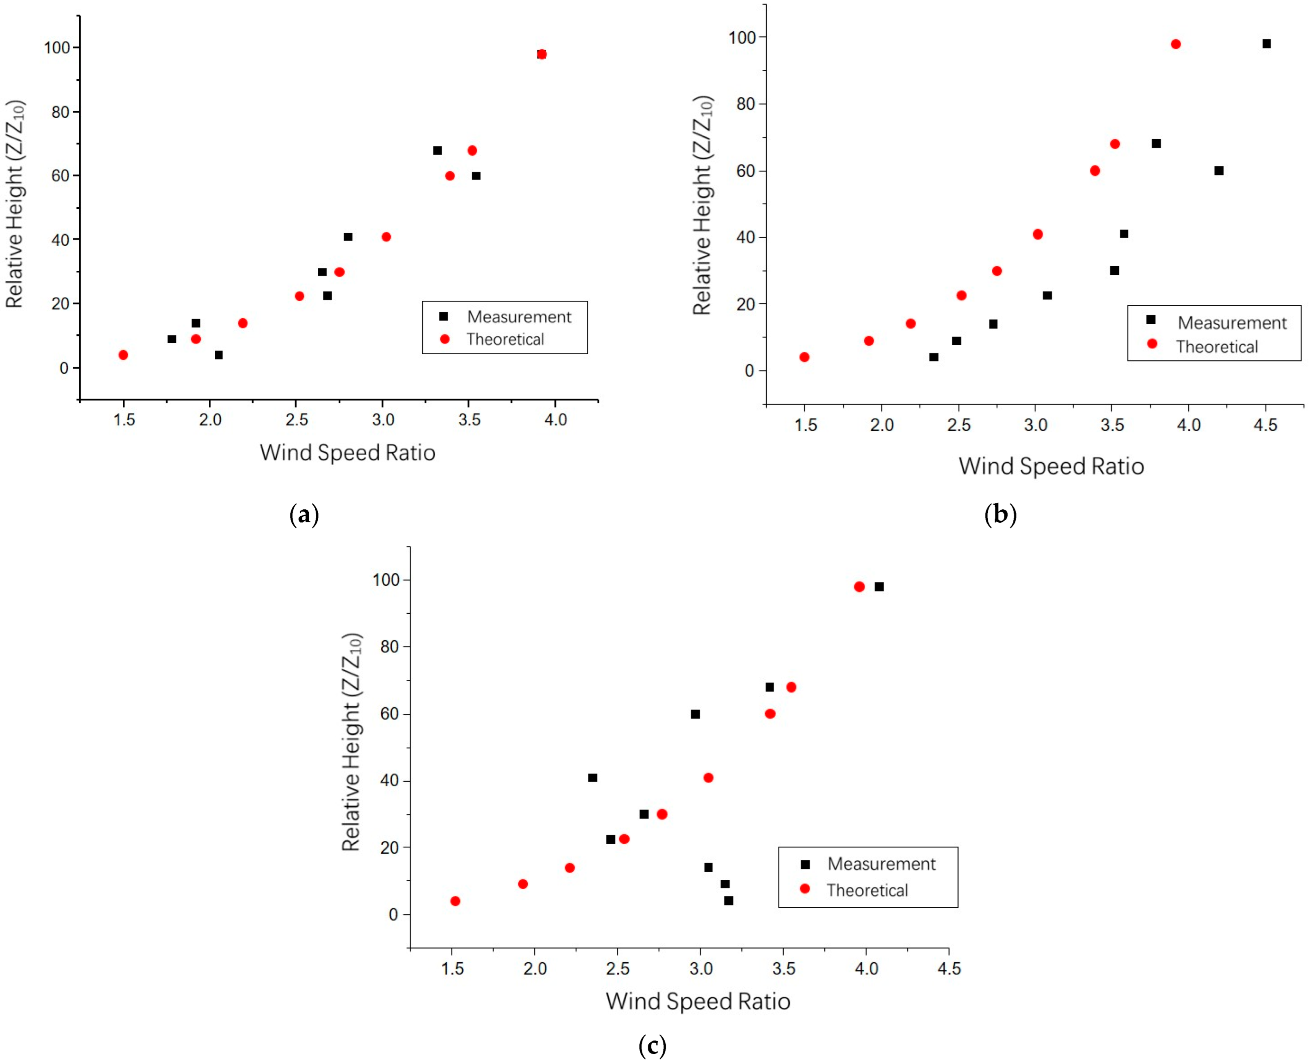
4.4. Retentivity of the Gradient Wind behind the Grid Plate
The distance the gradient wind behind the grid plate can maintain, is important, which will also determine where the building model should be placed in the practical application test. According to the above experimental data, taking the measurement data of the supply air volume of 5000 m
3/h as an example, the measurement value of the wind speed ratio on different sections from the grid plate, was compared with the theoretical value, which was calculated by Equation 2, as shown in
Figure 10.
In
Figure 10a, the measurement data of the section, which was 0.2 m away from the grid plate, was very close to the theoretical curve trend, indicating that it is accessible to create a gradient wind through different spacing grids. It can be seen from
Figure 10b,c that the deviation between the measurement data and the theoretical curve of section 0.5 m away from the grid plate, gradually increases, and the deviation from the grid plate is further increased at the 1.5 m section. This shows that the stability and approximation of the gradient wind field decrease, were negatively proportional to the distance from the grid plate, which may be caused by the gradual attenuation and mixing of the wind speed. It also indicates that for the measurement points with relatively small vertical heights, or the points near the ground surface, the deviation of the measurement data from the theoretical curve is greater than that of the above points, which should be related to the roughness of the actual ground, which is difficult to simulate, accurately. For case 1, the characteristics of the wind field on the section of the distance 0.2 m away from the grid plate is optimal, which can prove that the wind tunnel successfully creates the wind profile under this condition. In contrast, the results are not ideal for other conditions. Therefore, it indicates that this experimental platform can qualitatively assess the pedestrian wind environment and is more suitable for studying and evaluating the overall wind environment outside of the building.
5. Application
5.1. Test Building and Model
The building tested in this paper was the CITIC Tower, a super high-rise building with a height of 528 m, located in the core area of Beijing’s CBD, also known as ‘China Zun’, which is the tallest building in Beijing, surrounded by many skyscrapers. The numerous tall buildings in the CBD have significantly changed the regional wind environment, undermined the city’s ventilation and self-cleaning capabilities, and exacerbated the city’s air pollution and heat island effect under low wind speed conditions. Moreover, when the wind speed is high, there will be strong local winds around the buildings, affecting the comfort and safety of pedestrians.
In this paper, the wind tunnel platform mentioned above was used to conduct the experiments of the outdoor wind environment around ‘China Zun’ and the core area of the CBD to provide suggestions for the regional planning and architectural design. The architectural model was made of rigid materials with a scale of 1:1000, as shown in
Figure 11. The diameter of the test model was 1.1 m, and the height of the ‘China Zun’ model was 52.8 cm. The building model was placed in the central mainstream area of the test segment’s airflow, to minimize the wall boundary’s influence. The maximum windward area is 0.13 m
2 of the three test conditions, and the blockage rate is 9.02%. According to the research by Hunt, the maximum allowable blockage rate is 10% for the wind speed measurement, using this kind of wind tunnel [
44]. Considering the self-preservation of the wind field, the front point of the building model facing the incoming wind flow was 0.2 m away from the grid plate, which was 2.7 m away from the air supply inlets. Twenty test points were arranged in the horizontal direction to accurately obtain the wind speed distribution characteristics around the buildings and the changing trend in the boundary area of the air duct, as shown in
Figure 11. The height of all of the test points was 2 cm (corresponding to the actual height of 20 m).
5.2. Results and Analysis
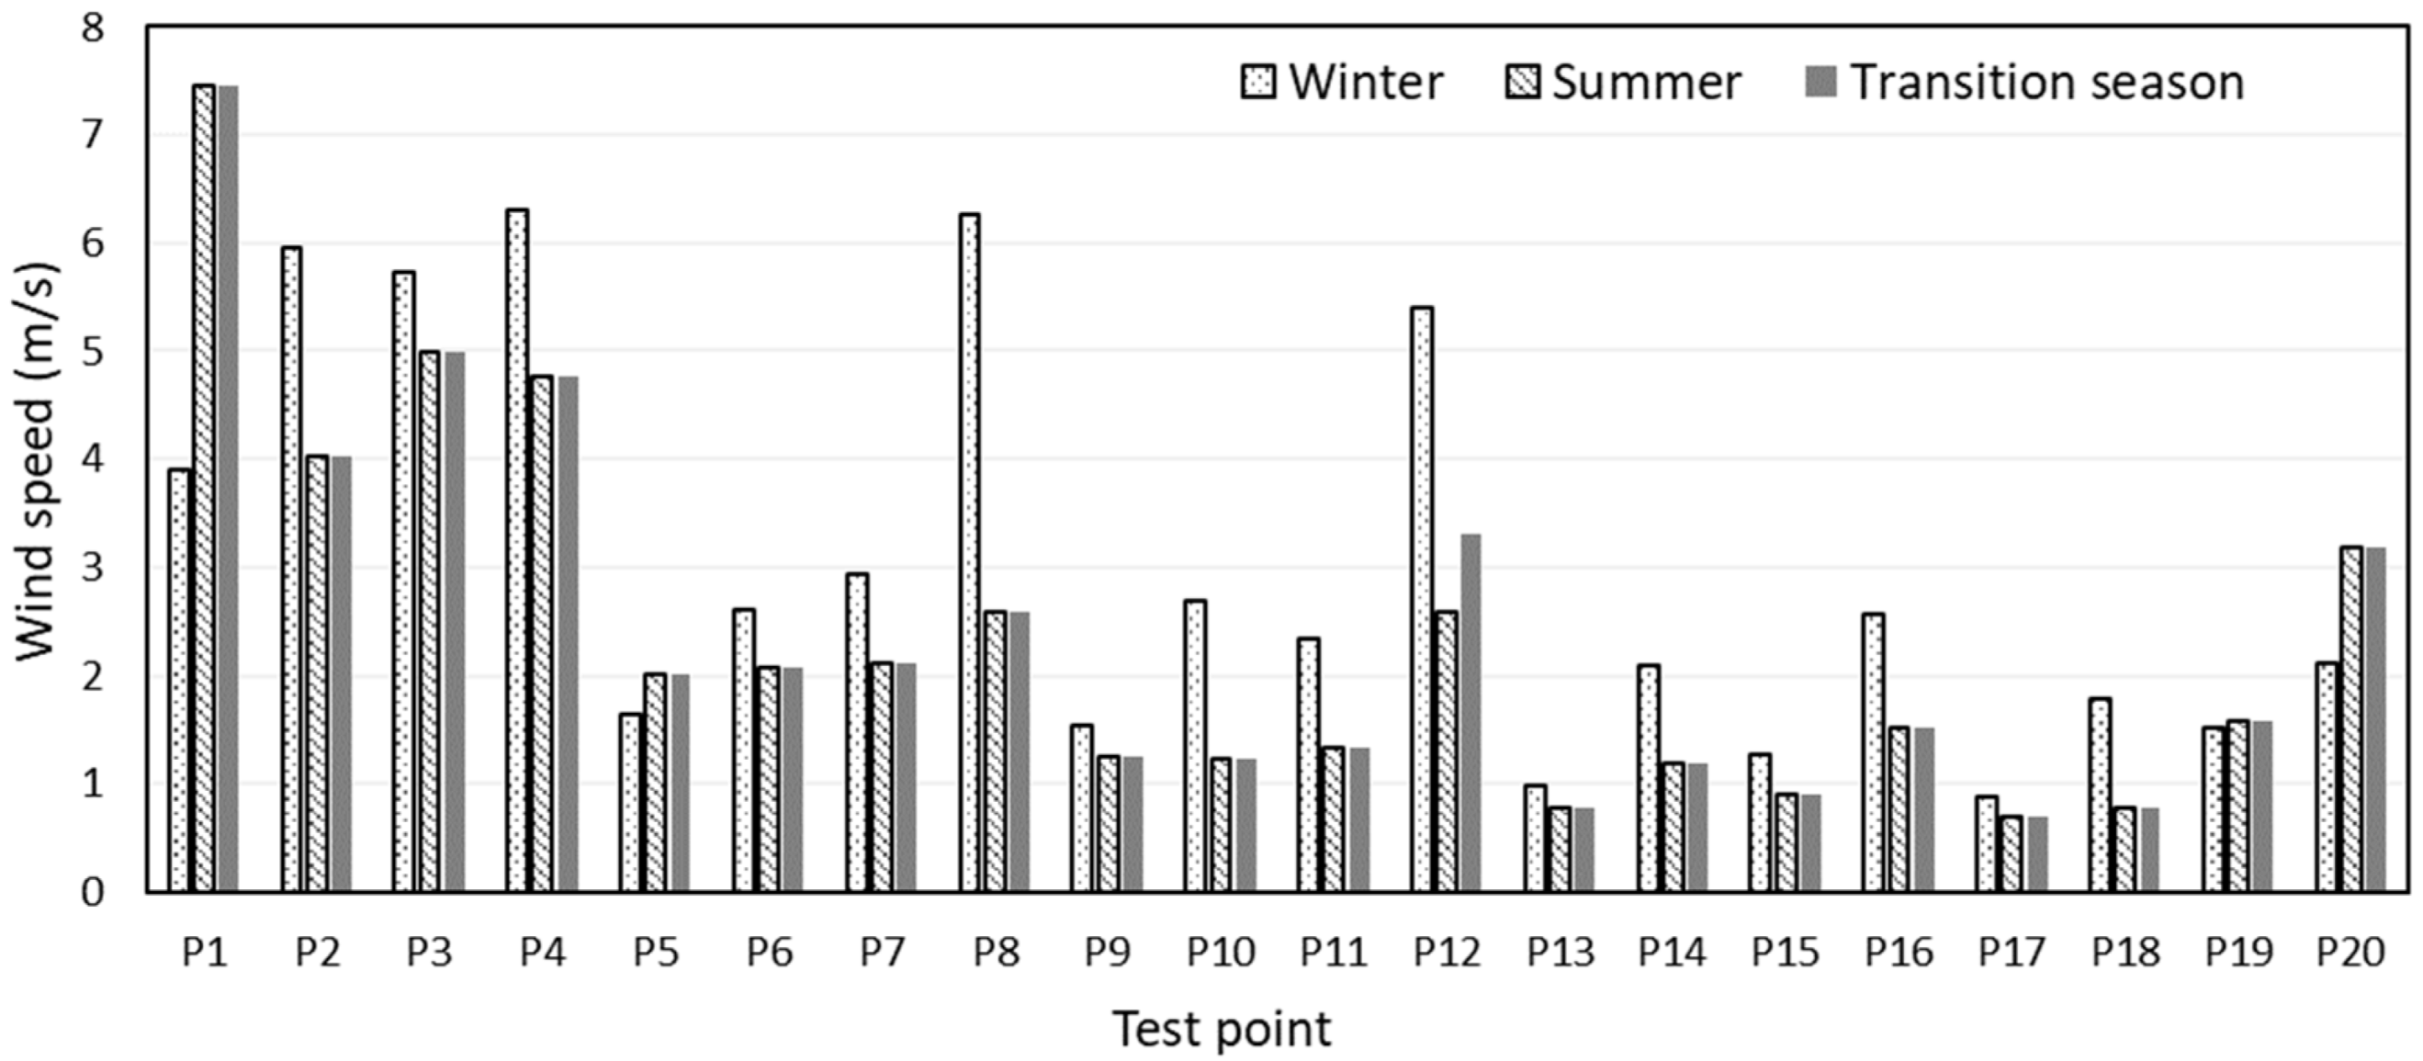
The outdoor wind environment around the buildings under the dominant wind direction and the average wind speed of the winter, summer, and transition seasons, was tested. The measuring method used was described above. According to the meteorological data of Beijing, the wind direction of the winter test condition is northwest, with a wind speed of 2.7 m/s. The summer test condition wind direction is southeast with a wind speed of 2.2 m/s, and the transition season’s wind direction is south with a wind speed of 2.5 m/s. The test results are shown in
Figure 12.
In the winter test condition, the average wind speed of the test points was 3.03 m/s, and the wind field was non-uniform. Compared with the outside airflow wind speed, the core area’s wind speed is significantly amplified, indicating that the super high-rise building hurts the urban wind environment.
In the summer and transitional season test conditions, the average wind speed of the test points was 2.66 m/s and 2.39 m/s, respectively. The wind fields were still non-uniform but had improved, compared to the winter. The reason is that the direction of the outside airflow was southeast and south. Therefore, there had no obvious channel effect, due to the lack of dense super high-rise buildings in these directions.
The test results are reasonable, indicating that this compact wind tunnel platform can be used to test, predict, and evaluate the outdoor wind environment around the building.
5.3. Comparison with the CFD Simulation
The measurement results are compared with a CFD simulation to validate the applicability of this compact wind tunnel in a building environment study. The CFD simulation of this paper was calculated using the PHOENICS software with a standard k-ε turbulence model. The data calculated by the CFD simulation method for the wind environment around the building has been validated for accuracy and has been used to verify the applicability of the volume particle tracking velocity (VPTV) measurement [
45,
46].
Considering that the purpose of the comparison was to validate the applicability of the compact wind tunnel platform, the inlet airflow boundary condition in the CFD calculation was determined according to the meteorological parameters in the design code, consistent with the wind tunnel test. Therefore, the overall measurement error of the wind tunnel platform can be verified during the data comparison.
The physical model of the CFD simulation was the CITIC Tower area, in the measurement of this paper. The orthogonal structured grids were used for the dispersion, and the total number of grids was about 0.3 million. The difference scheme was a power law scheme, and the SIMPLE algorithm was adopted while momentum equations were solved on non-uniform staggered grids [
47].
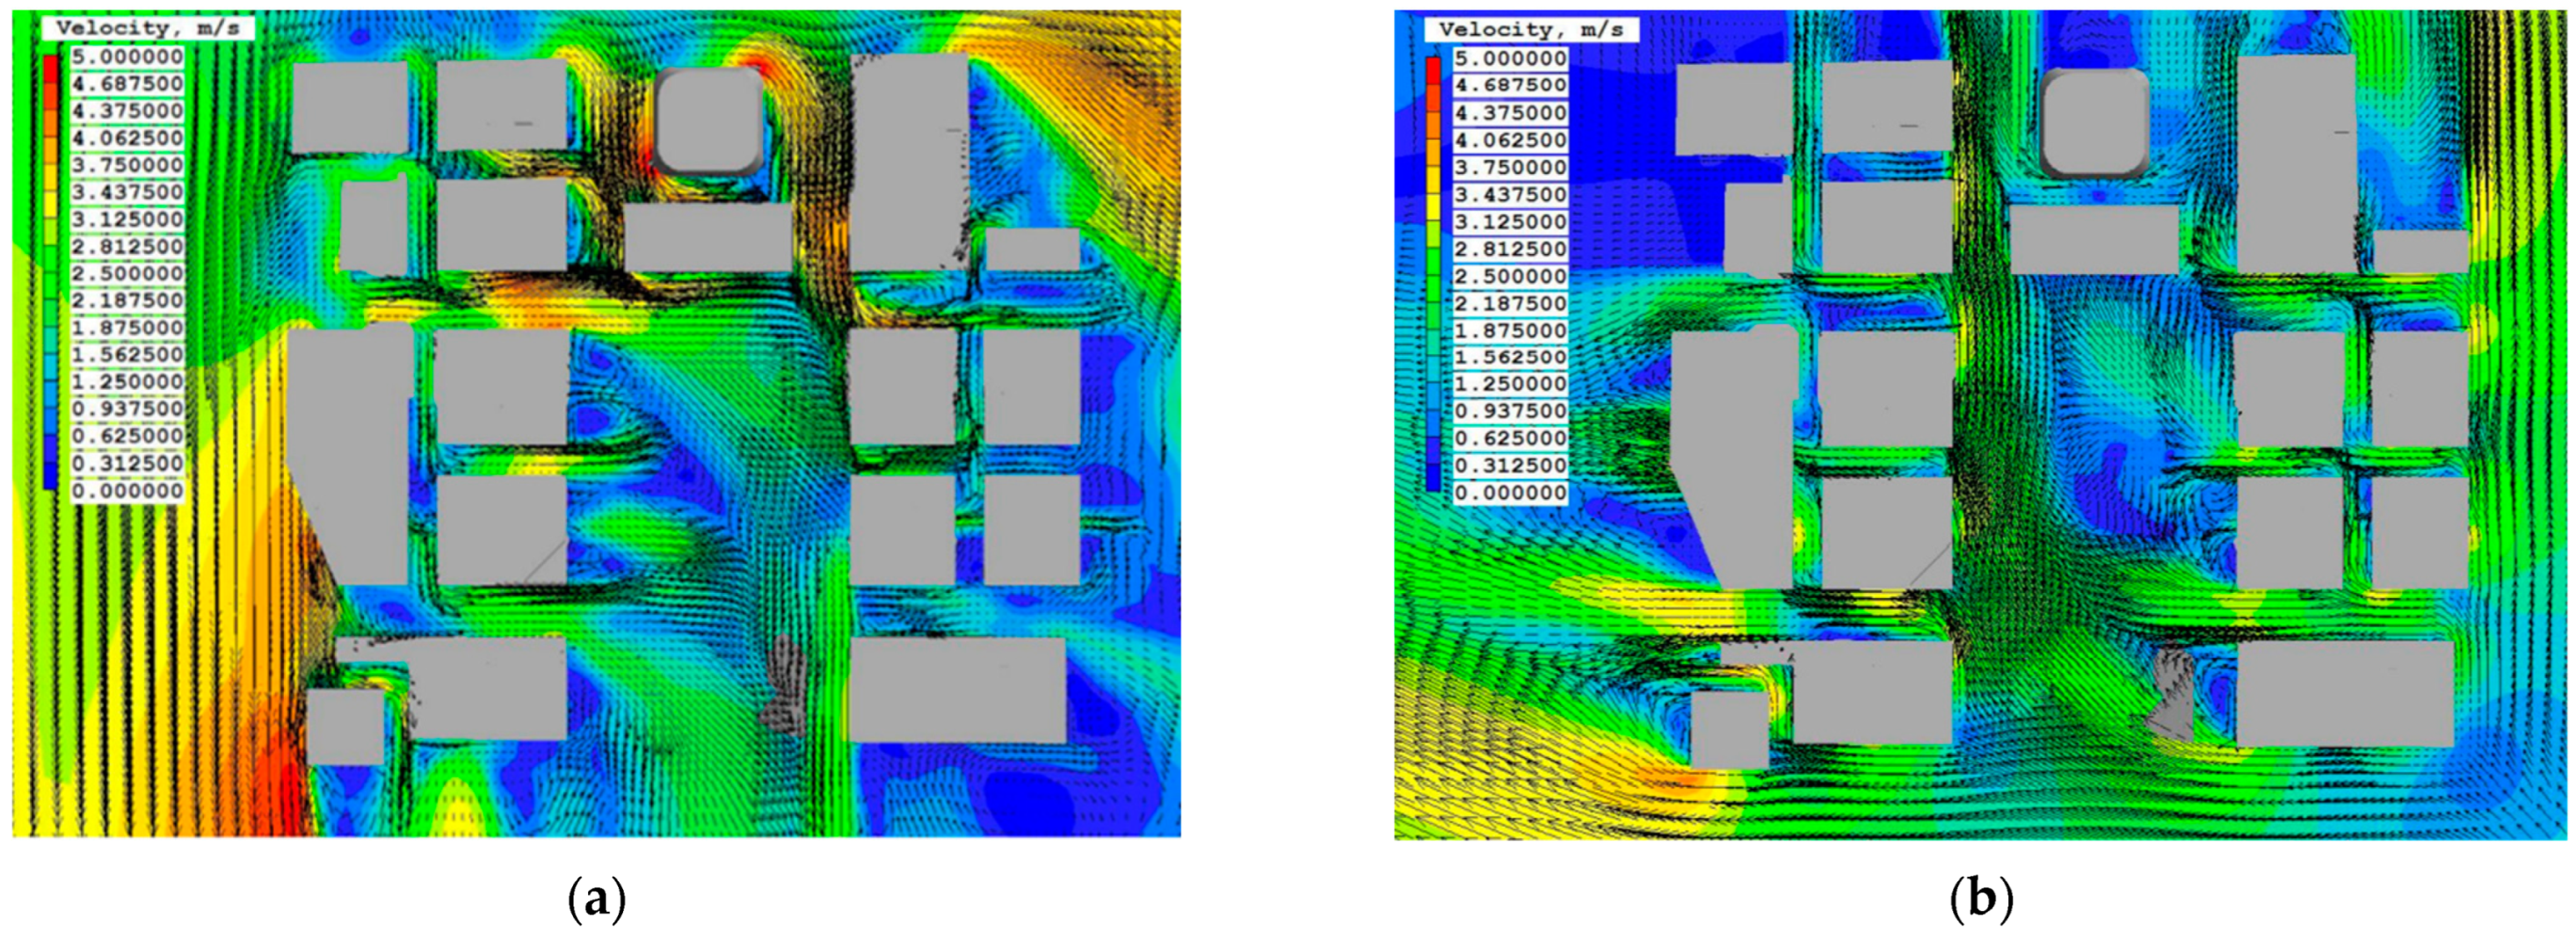
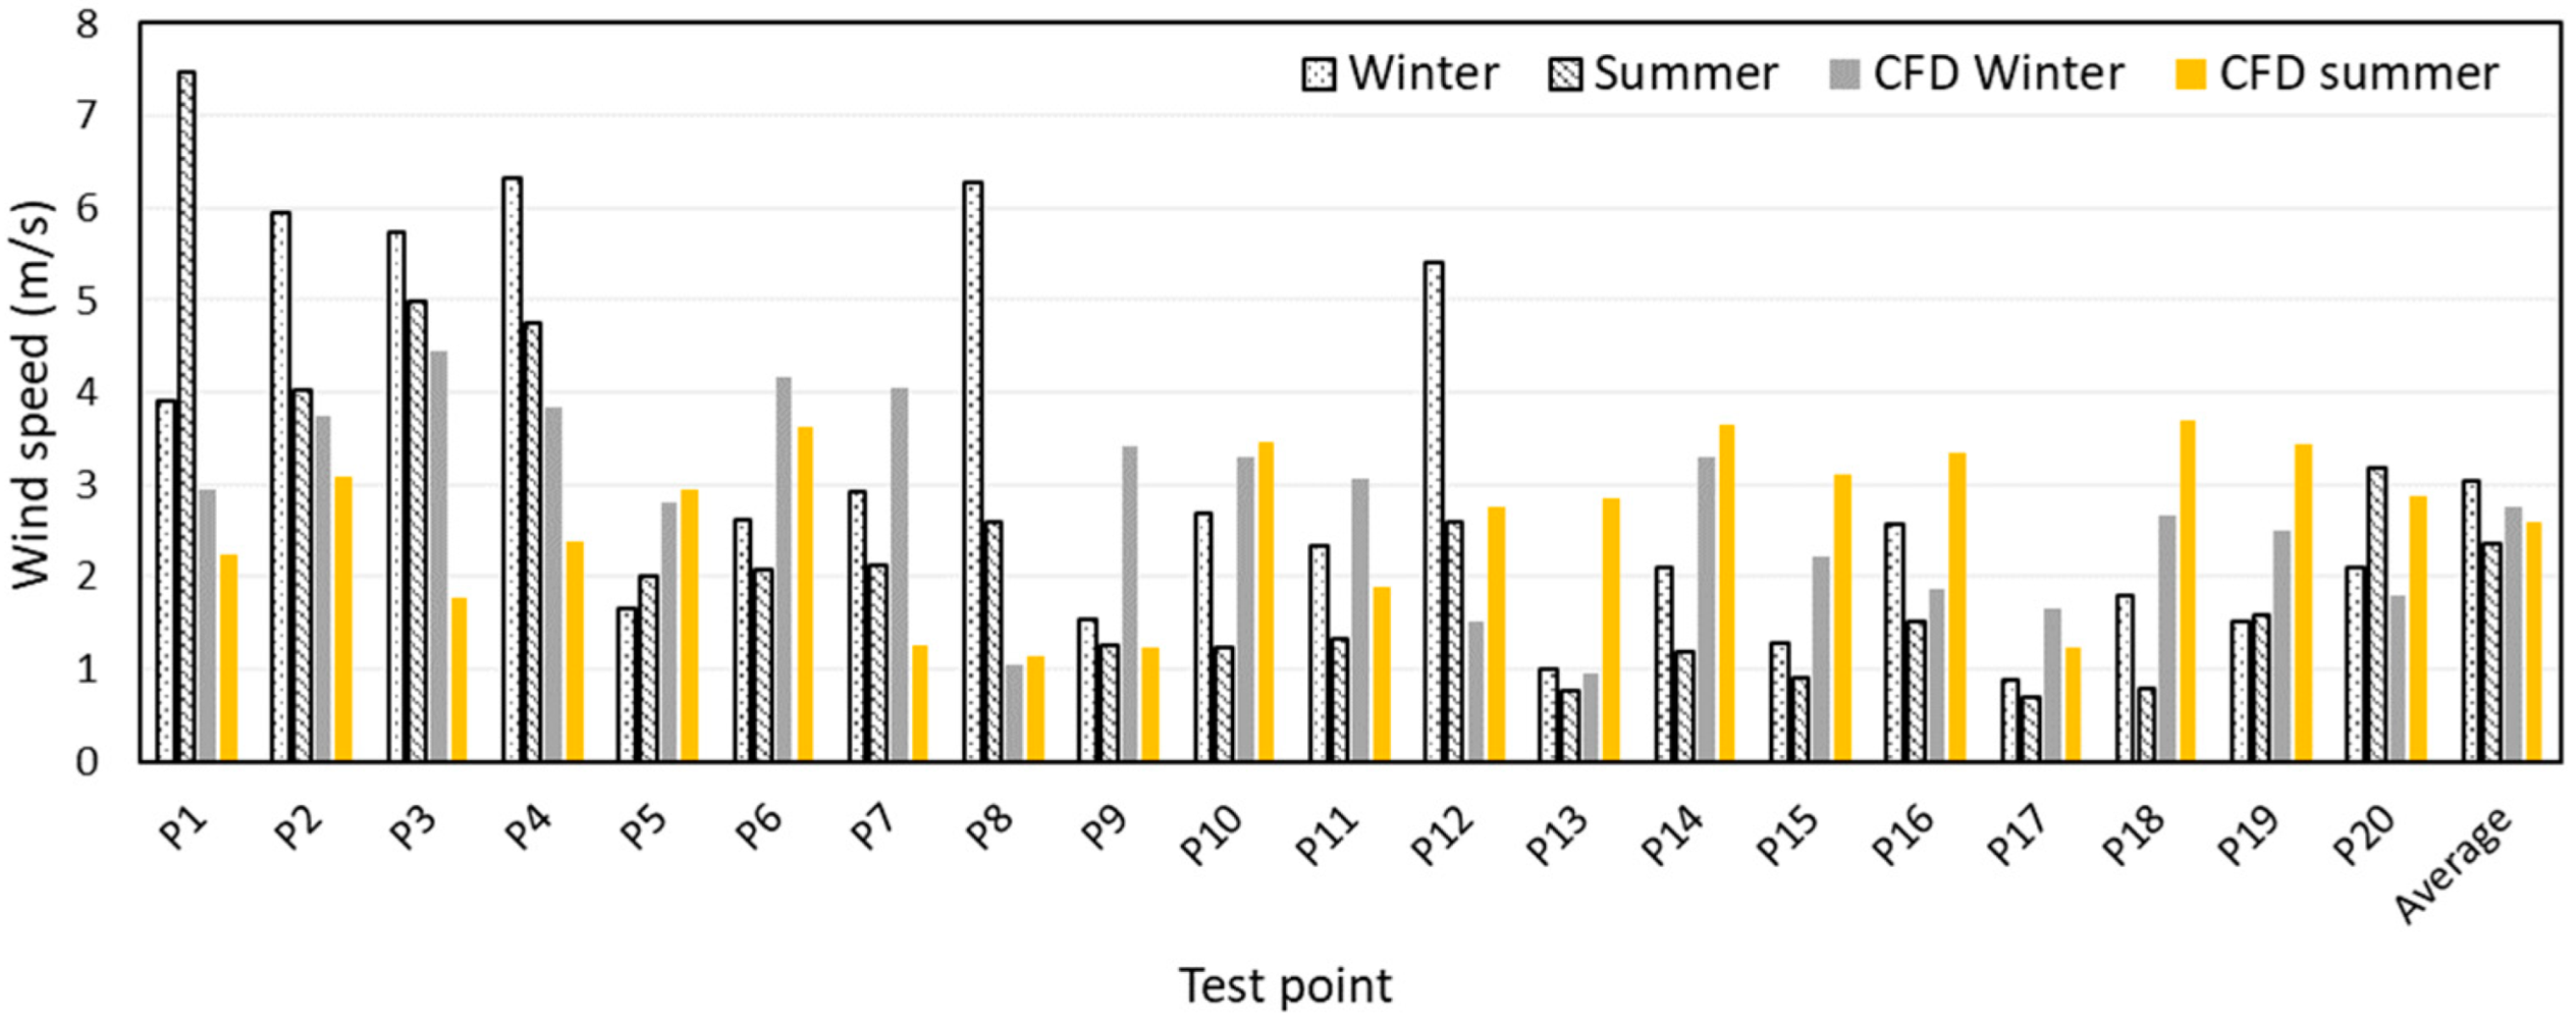
The air velocity distribution of the CFD calculation results for the winter and summer are shown in
Figure 13, respectively. The comparison results, at the same location as the wind tunnel measurement, are shown in
Figure 14 and
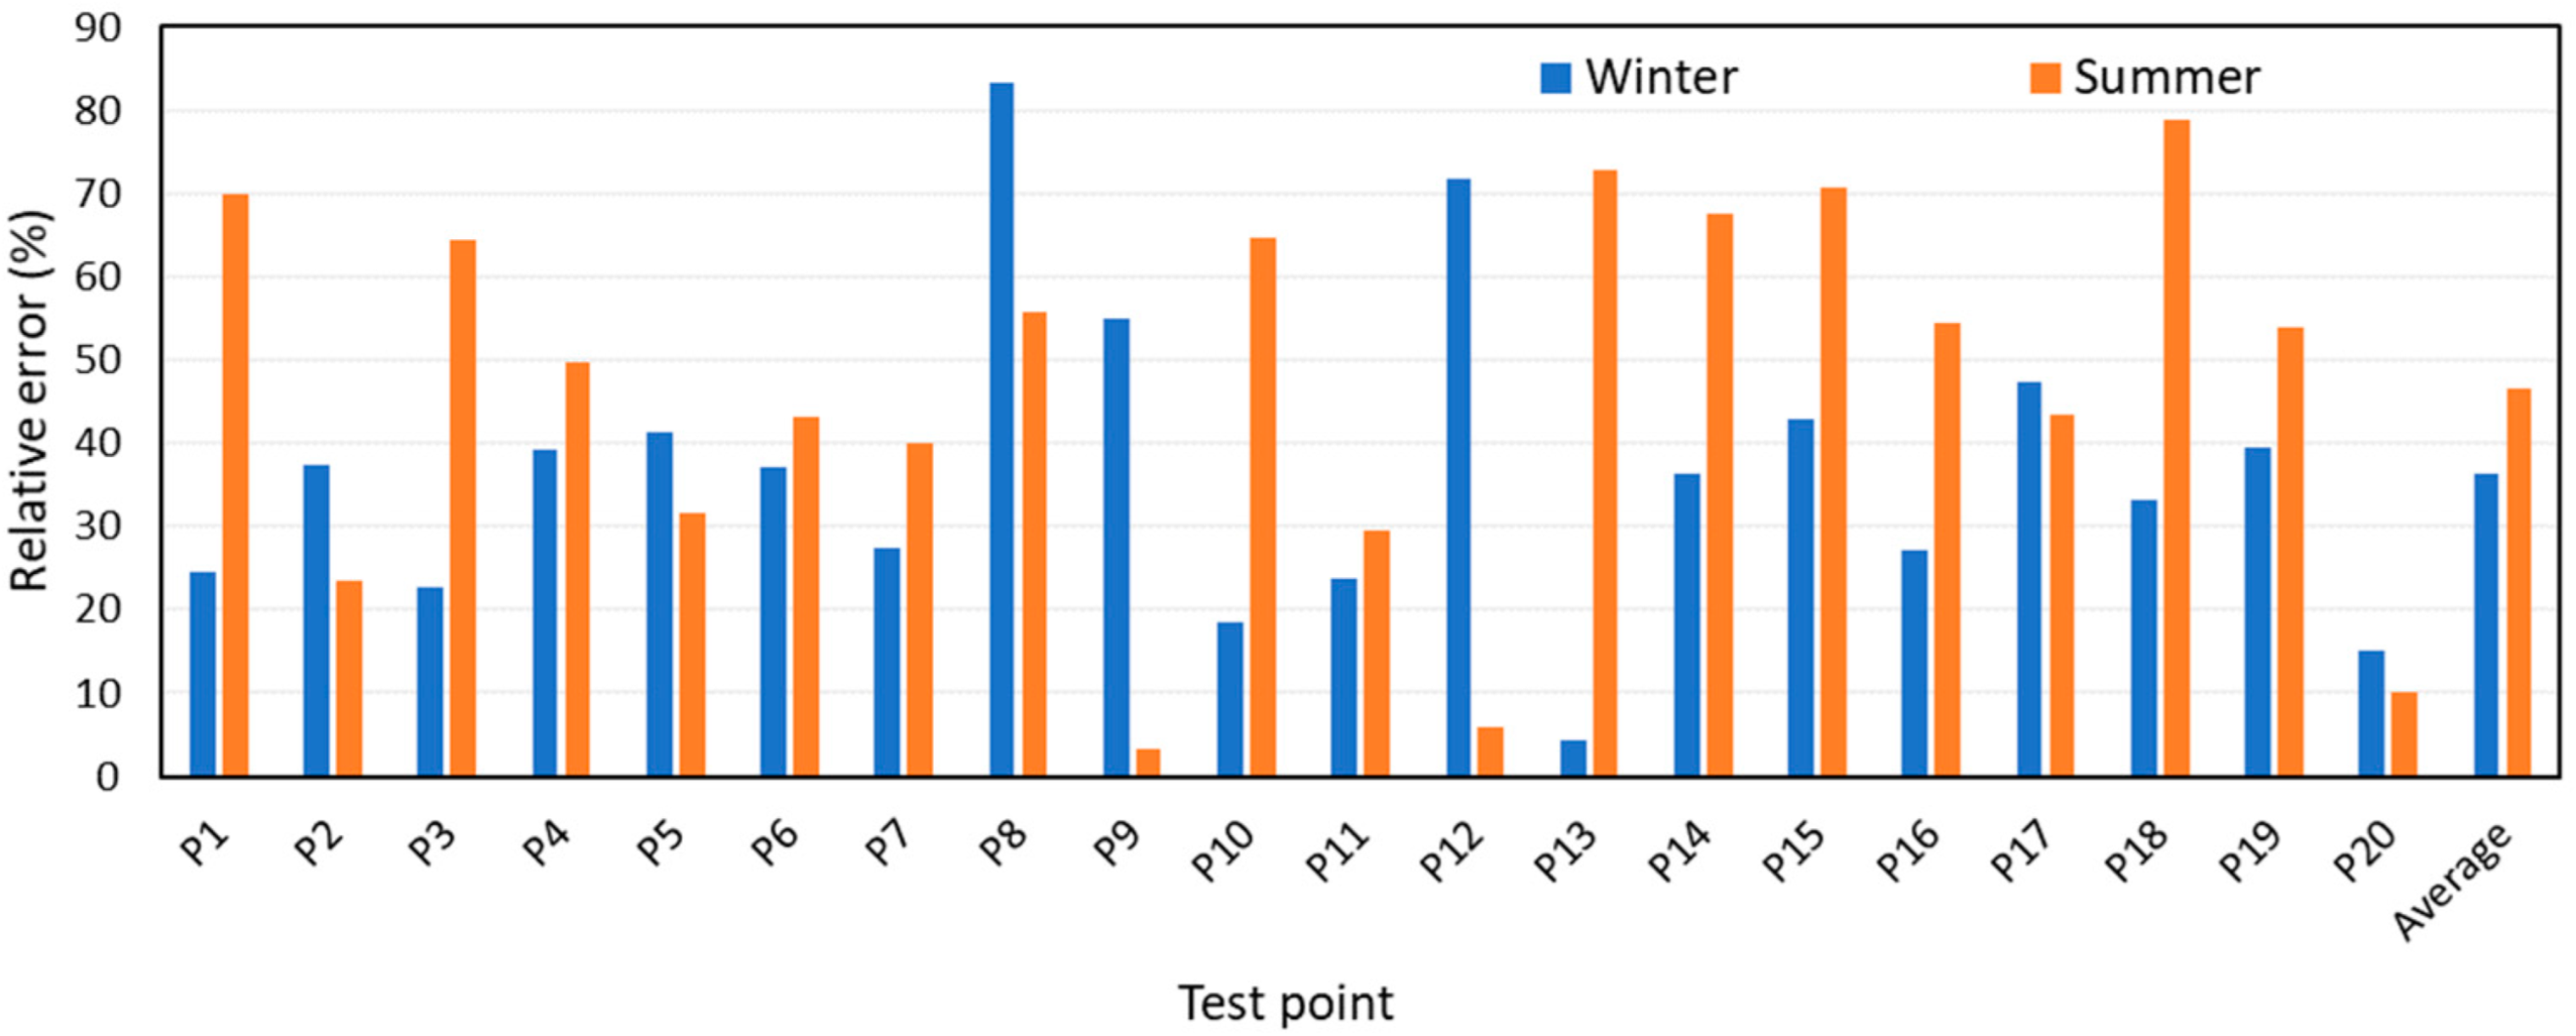
Figure 15. It can be seen that the average values of the measuring points in the winter and summer were close to the CFD calculation results; the wind tunnel measurement has a general rationality. Meanwhile, the relative errors of each measuring point were quite different. The maximum relative error in the winter was at P8, with an error of 83.36%. While the summer was at P18, with an error of 78.87%. The average relative error of each measuring point was 36.38% (winter) and 46.63% (summer), respectively. Combined with the wind tunnel inlet flow data in this paper, the inlet wind flow is relatively difficult with a high quality, which greatly impacts the building wind environment measurement.
Comparing the CFD simulation to the wind tunnel measurement, the applicability of this compact wind tunnel in the building environment study was validated. It indicates that the efficiency, effect, and cost of the compact wind tunnel and the CFD method are similar. Furthermore, the accuracy of the quality of the inlet flow needs to be improved.
6. Conclusions
Wind tunnel experiments are an important method in studies on the outdoor wind environment. In this paper, a compact wind tunnel platform was designed, based on the theoretical model of the atmospheric boundary layer. In addition, grids with unequal spacing were adopted and tested. The comparison with the theoretical formula proved that this method could achieve the gradient wind. The application in the CBD region of Beijing indicated that it could be used to predict and evaluate the outdoor wind environment around the building. By comparing with the CFD method, it can be seen that this compact wind tunnel is reliable and accessible for the measurement and research of outdoor building wind environments under low wind speeds.
Compared to a large-scale wind tunnel, the compact wind tunnel platform in this paper is more flexible and convenient, with a smaller land occupation, easier construction, operation, and lower cost for the outdoor building wind environment research, with a low-speed airflow field. In addition, the research of this paper indicates that this compact wind tunnel still has some shortcomings, such as non-uniformity of the wind speed, a lower accuracy of the gradient wind, and some important parameters of the ABL. More applications of this compact wind tunnel under different conditions will be conducted in the future, and thick plates with unequal spacing will be adopted and compared with the grids method, to achieve a better gradient wind.


