Article

Experimental Study on the Seismic Performance of Hollow Columns with Fiber Lightweight Aggregate Concrete

1
Department of Civil Engineering, Inner Mongolia University of Science and Technology, Baotou 014010, China
2
Inner Mongolia Nai Heng Engineering Technology Co., Ltd., Baotou 014010, China
3
Inner Mongolia Key Laboratory of Safety and Durability for Civil Engineering, Baotou 014010, China
4
Inner Mongolia Architectural Structure Disaster Prevention and Subject Technology Research Center, Baotou 014010, China
5
Inner Mongolia Vocational and Technical College of Architecture, Hohhot 010070, China
*
Authors to whom correspondence should be addressed.
Buildings 2022, 12(12), 2164; https://doi.org/10.3390/buildings12122164
Submission received: 3 November 2022 / Revised: 11 November 2022 / Accepted: 22 November 2022 / Published: 7 December 2022
(This article belongs to the Special Issue High-Performance Concrete Structures for Disaster Prevention)

Abstract

:
To study the seismic performance of hollow columns with fiber lightweight aggregate concrete, a quasi-static test on eight hollow columns with fiber lightweight aggregate concrete under lateral low-cycle reversed loading and axial force is presented in this article. The effects of the dosage of plastic-steel fibers (0, 3, 6 and 9 kg/m3, respectively), steel fibers (25, 50 and 75 kg/m3, respectively) and the axial compression ratio (0.4 and 0.6, respectively) on the seismic mechanical properties such as capacity under lateral load, stiffness, ductility and energy dissipation were investigated, and the main failure morphology and force mechanism of hollow columns with fiber lightweight aggregate concrete under lateral low-cycle reversed loading were revealed. The results showed that (1) the failure modes of hollow columns could be divided into shear failure, bending-shear failure and bending failure; (2) compared with the specimens without fiber, the increase in ductility coefficient of specimens with plastic-steel fiber was 2~33.7%, and that with steel fiber was 30.8~125.7%; the increase in cumulative energy dissipation of specimens with plastic-steel fiber was 5.3~43.7%, and that with steel fiber was 88.9~203.8%, thus indicating that the seismic performance of the specimens could be improved effectively via the incorporation of fibers. The formula of shear capacity under lateral load was proposed, and its calculation results were more reliable when compared with the actual project. A foundation for further research on the seismic performance of hollow columns with fiber lightweight aggregate concrete is provided.

Graphical Abstract

1. Introduction

High-rise and super high-rise buildings have become the trend for the development of modern buildings. However, concrete columns in high-rise buildings are more prone to shear failure, structural damage and even collapse in the case of an earthquake due to the large dead weight. How to reduce the degree of structural earthquake damage has become the focus of research in the earthquake engineering community. The more mature methods and ideas at this stage are listed as follows: (1) set up seismic isolation devices [1,2], turn the structure into planar movement and reduce the seismic inertia force of the structure; (2) set up energy-consuming components such as a buckling brace [3,4,5] and damper energy dissipation [6,7] to consume seismic energy, thus reducing the seismic energy borne by the structural component; (3) reduce the dead weight of the structure to decrease the input of seismic capacity: it is known from d’Alembert’s principle [8,9] that the seismic action of the building is positively related to its dead weight, and this among the effective ways to reduce the seismic damage of the structure via decreasing the dead weight of the structure. Therefore, the seismic performance of column is researched in this paper based on the third concept.
The lightweight aggregate concrete is featured with the advantages of light weight, earthquake resistance, heat insulation when compared with ordinary concrete. NIU [10] et al. found that the dead weight of the structure could be reduced effectively by the lightweight aggregate concrete when compared with the ordinary concrete. In addition to reducing the dead weight of the structure based on the material level, scholars [11,12] also further reduced the dead weight of the structure with hollow beams, and the research results showed that the hollow beams were featured with good flexural performance while the dead weight of the structure was reduced. However, the usage of lightweight aggregate concrete was limited due to poor ductility, and how to improve the ductility of lightweight aggregate concrete became the focus of the study. The authors of [13,14] found that the ductility of concrete with fibers was significantly improved and it had good mechanical properties. The authors of [15,16,17,18,19,20,21] add steel fiber into concrete beams, and the results show that the bridging effect of steel fibers can obviously slow down the development of cracks, and with the increase in steel fiber content, the failure mode of concrete beams can be changed from brittle failure to ductile failure, which significantly improves the mechanics of concrete beams. Tiberti et al. [22] found that adding steel fiber into concrete can prevent the concrete cover from peeling off at an early stage, increase the initial stiffness and energy dissipation of the column, and reliably reduce the damage of the column.
On this basis, the plastic-steel fiber lightweight aggregate concrete and steel fiber lightweight aggregate concrete are applied on the hollow column in the research, the qualitative and quantitative analysis on the seismic performance are developed with the variables of plastic-steel fiber dosage, steel fiber dosage and the axial compression ratio, and the indexes of failure morphology, hysteresis curve, skeleton curve, ductile energy dissipation capacity and stiffness degradation of each specimen, thus providing the foundation for the future research on seismic performance of a lightweight hollow column.

2. Specimen Design

Eight hollow columns with lightweight aggregate concrete at the shear span ratio of λ = M V h = 3.6 and the hollow rate of 10% are made in the test, including one no-fiber comparative specimen, three plastic-steel fiber specimens, three steel fiber specimens, one specimen with a variable axial compression ratio, and the specimen design, are detailed in Table 1.
The section size of the shaft is 250 mm × 250 mm, the height of the column is 900 mm, and the thickness of the protective layer is 25 mm. Two 16 mm HRB400 steel bars are set at each side of the longitudinal bar of shaft, A8@150 is taken for the stirrup, and the corresponding volume stirrup ratio is 0.67%. The loaded foundation size is 400 mm × 400 m × 1250 mm, 4C20 mm of longitudinal bars is set at the upper and lower place, respectively, A8@100 is taken for the stirrup, and the strength of the foundation concrete is C50. The dimensions and reinforcement of the specimen are shown in Figure 1.

2.1. Material Mechanical Test

The gravel-type shale ceramsite is taken for the lightweight aggregate in the test, the parameters are shown in Table 2, the material is shown in Figure 2, the physical and mechanical indicators of the remaining materials are shown in Table 3, Table 4 and Table 5, the fiber object is shown in Figure 3, and the mix proportion of lightweight aggregate concrete is shown in Table 6.

2.2. Test Loading Device

The electro-hydraulic servo programmable structural testing machine from civil engineering laboratory is used for the quasi-static test, and the loading device is shown in Figure 4. In the process of loading, the specimen is fixed to the ground with a high-strength screw, and the vertical load is implemented by a 200 t hydraulic jack. The lateral low-cycle reversed loading is applied by a 1000 kN MTS electro-hydraulic servo actuator, and the horizontal displacement is controlled by sensors. The arrangements of the strain gauges and the displacement meters for the specimens are uniform as shown in Figure 5.

2.3. Loading System

Displacement-controlled loading is adopted, the vertical loading is completed at one time, and the lateral low-cycle reversed loading is controlled by displacement throughout. The displacement is firstly controlled in multiples of 1 mm. When the yield displacement Δ (the yielding of the specimen is determined by the appearance of a clear inflection point in the load–displacement curve) is reached, the cyclic loading is controlled in multiples of Δ, such as 1Δ, 1.25Δ, 1.5Δ, 1.75Δ, 2.0Δ, 2.25Δ, 2.5Δ, 2.75Δ, 3.0Δ, 3.25Δ, 3.5Δ, 3.75Δ, and 4.0Δ, and each level of controlled displacement is cycled for three times. Each level is loaded continuously and evenly, and the speeds for loading and unloading at each time are consistent. During the loading process, the development of cracks in the column shaft is observed and drawn, the corresponding crack width is measured, and the data are photographed and recorded. This can be regarded as the failure of the specimen when the capacity under the lateral load of the specimen is dropped to 85% of the peak capacity under lateral load, and the test is stopped. The loading system is shown in Figure 6.

3. Failure Phenomenon

3.1. Failure Morphology

The failure morphology of the specimens can be seen in Figure 7.
The failure mode of the specimen can be divided into three categories according to the fracture geometry and failure type of the specimen (i.e., whether the failure of specimen is brittle or ductile) during the test process: (1) bending failure; (2) bending-shear failure; and (3) shear failure. S0.4-25, S0.4-50 and S0.4-75 have the bending failure in the test, P0.4-0, P0.4-3, SJ3 and P0.4-6 have the bending-shear failure, and P0.6-6 has the shear failure. The typical failure phenomena of the specimen at three kinds of failure modes are clarified, respectively, as follows combined with the measured data.
Bending failure: This occurs in the elastic stress stage at the initial stage of loading for the specimen, and there is no obvious fracture for the component. There is no residual deformation of the specimen when unloading to zero. The horizontal fracture appears at the bottom of the column specimen when loading is close to the yield displacement. Along with the increase in the loading, the width of the horizontal fracture at the bottom of the column is increased gradually and extended gradually along the direction of section height, and the horizontal fracture also appears gradually at other heights of the specimen. As shown in the measured strain data, it is the yielding stress stage for the longitudinal bar when the specimen is yielded, while the stirrup is not yielded. The fracture is expanded further along the section height when loading is increased gradually, the section height at the compressive zone is decreased gradually, and vertical fracture occurs at the concrete of pressure zone. The fracture morphology between the concrete at pressure zone and the ordinary lightweight aggregate concrete is different due to the existence of the short fiber, and multiple vertical fractures are formed to divide the concrete at pressure zone into several prisms. Finally, the concrete at the compressive zone is crushed and damaged, while the ordinary lightweight aggregate concrete do not have the sudden crushing phenomenon. The concrete at the pressure zone is not crushed completely, and certain ductile failure is shown. This is still in the yielding stress stage for the longitudinal bar at the stage, while it is in the elastic stress stage for the stirrup, and it is not yielded. The minor oblique fractures occurred in the specimen locally in the whole loading process, while the width is small with low development degree, and it cannot control the failure of the specimen.
Bending-shear failure: This occurs in the elastic stress stage for the specimen at the initial stage of the loading and there is no obvious fracture at the specimen. There is no residual deformation under low-cycle reversed loading. This is measured that the longitudinal bar and the stirrup are in the elastic stress stage with small strain. The inflection points occur at the skeleton curve of the specimen along with the increase in the loading, thus indicating that the specimen is in the yielding stress stage, and the corresponding displacement is the yielding displacement. At this time, the horizontal fracture begins to appear in the middle and lower position of the specimen, and it is expanded along the section height when loading is increased. Different from the bending failure, the horizontal expansion is stopped and turned to the diagonal crack of 45° when the loading continues to increase. Multiple cross-diagonal cracks are formed at the middle and lower part of the specimen when the loading continues to increase, and the diagonal crack cluster is formed. There is a major diagonal crack with comparatively adequate development, the largest width and length among the diagonal crack cluster. The major diagonal crack is expanded rapidly when the peak loading is surpassed, the concrete among the diagonal crack cluster is crushed and damaged. Meanwhile, the concrete at the pressure zone in the bottom of the column is crushed and damaged after being separated into multiple prisms. However, the prism is smaller and the crushing height of the concrete at the pressure zone is smaller when compared with those of the bending failure. There is sudden failure of the specimen, and there is ductile failure when compared with bending failure.
Shear failure: This occurs in the elastic stress stage for the specimen at the initial stage of the loading and there is no obvious fracture at the specimen. The cross-diagonal crack cluster of the specimen appears rapidly when the yield loading is reached, the major diagonal crack among the diagonal crack cluster is expanded rapidly, the width and length of the crack are larger than those of the bending-shear failure. The concrete between the diagonal crack is crushed and damaged rapidly, and the failure is declared for the specimen. The appearance and expansion of the crack and the crushing of the concrete are sudden in the whole loading process, and the significant brittle failure is displayed for the specimen failure. This occurs in the yielding stress stage rapidly and even in the strengthening stage for the stirrup under less cyclic displacement in the loading process of the specimen, while the strain of longitudinal bar remains small.

3.2. Factor Comparison

Axial compression ratio: The axial compression ratio of specimens P0.4-6 and P0.6-6 increases from 0.4 to 0.6, and the following can be obtained from the comparison on the failure patterns: (1) Compared with the crack of specimen 3, the width of the major diagonal crack for specimen 6 is increased significantly, and the number is increased, the width of vertical crack is increased significantly, and the crack distribution height of the specimen at the failure is increased from 400 mm for specimen 3 to 600 mm for specimen 6; (2) Compared with the ductile feature of specimen 3 displayed in the failure process, the crack is expanded rapidly and the capacity under lateral load is decreased rapidly after the peak loading is reached for specimen 6, thus indicating the significant brittle feature. It can be seen from the above phenomena that the bending failure weight of the specimen is decreased along with the increase in the axial compression ratio, while the shear failure weight is increased significantly with the manifestation of increased expansion of the vertical and the diagonal crack macroscopically, and the failure mode of the specimen is changed from the bending-shear failure to the typical shear failure.
Plastic-steel fiber dosage: The volume dosages of plastic-steel fibers for P0.4-0, P0.4-3, P0.4-6 and P0.4-9 are 0%,3%,6% and 9%, respectively. The following can be obtained from the comparison on the failure patterns of the components: (1) the crack distribution height of P0.4-6 and P0.4-9 is 400 mm and that of P0.4-0 and P0.4-3 is 500 mm, thus indicating that the crack expansion can be reduced effectively by the incorporation of fiber. (2) As shown in the comparison between P0.4-0 and P0.4-3, there is the significant major failure crack for P0.4-0, while there is no obvious controlling failure crack although the fiber dosage of P0.4-3 is small. There is a significant difference on the crack morphology for P0.4-6 and P0.4-9 along with the further increase in the fiber dosage. The maximum crack width is decreased obviously, the expansion length of crack is decreased, and the wide and long crack is changed as thin and short. Concrete spalling of P0.4-3, P0.4-6 and P0.4-9 is smaller in the loading process when compared with that of P0.4-0. The loud “bang” occurs suddenly for P0.4-0 when the specimen is damaged, and there is sudden failure. The specimens are damaged after the “crackling” fiber breaking sound occurs for P0.4-3, P0.4-6 and P0.4-9, and there is ductile failure. It can be seen from the above test phenomenon that the incorporation of the fiber cannot change the failure form of the specimen, while it can improve the brittleness of the concrete to a certain degree, which is caused by the better tensile and mechanical property of the plastic-steel fiber in the length direction. The plastic-steel fiber is incorporated into the concrete disorderly. When the main tensile stress at any internal part of the concrete reaches the tensile strength of the concrete, the internal stress of the concrete is redistributed due to the “bridging” effect of the fiber, thus reducing the main tensile stress at the concentration of the stress and improving the stress state of the concrete.
Steel fiber dosage: The volume contents of steel fibers for P0.4-0, S0.4-25, S0.4-50 and S0.4-75 are 0, 25, 50 and 75 kg/m3, respectively. The following can be obtained from the test phenomenon: (1) the crack distribution of the specimen is improved significantly along with the increase in the steel fiber dosage, and there is a major diagonal crack for specimen S0.4-25 with a larger crack width, obvious crushing of concrete at the bottom of the column, severe crushing and spalling of the concrete at surface. There is no obvious major diagonal crack for S0.4-50, and the overall width and length of the crack are decreased to a certain degree. No significant crack can be seen for S0.4-75, and the width, number, length and distribution height of the crack are reduced greatly, and the compression of concrete at the bottom of the column is not obvious. (2) The “hissing” sound on pulling out the steel fiber can be heard for the internal hollow column at the later stage of the loading—the sound of S0.4-25 is the loudest and crisp and that of S0.4-75 is the lowest and dull. It can be seen from the above test phenomenon that the existence of the steel fiber improves the stress state of the concrete effectively as a “bridge”, slows down the internal stress concentration of the concrete, improves the tensile strength of the concrete, delays the cracking of the concrete and crack expansion greatly, and enhances the energy dissipation capacity of the specimen. In conclusion, the failure mode of the specimen is changed by the incorporation of steel fiber, and the bending-shear failure mode of specimen P0.4-0 is improved to the bending failure mode of S0.4-25, S0.4-50 and S0.4-75.

4. Hysteretic Curve

4.1. Hysteretic Curve

The hysteretic curve can systematically reflect the capacity under lateral load and the ductile energy dissipation capacity of the specimen [23,24,25,26,27]; therefore, it is the foundation for the analysis and evaluation of the seismic performance of the structure or component. The differences on the hysteretic curves of hollow columns are compared and explained in the section, and the hysteretic curves of the specimens can be seen in Figure 8. As mentioned above, the failure mode of the test specimen can be divided into bending failure, bending-shear failure and shear failure, where S0.4-25, S0.4-50 and S0.4-75 are bending failure, P0.4-6, P0.4-0, P0.4-3 and P0.4-9 are bending-shear failure, and P0.6-6 is shear failure. The hysteretic curve for the specimen with bending failure is full. The capacity under the lateral load of the specimen is decreased slowly when the peak loading is surpassed, and the reloading curve after unloading is round, thus indicating that the specimen is featured with good ductile energy dissipation capacity. The hysteretic curve for the specimen with bending-shear failure is relatively full. The load can be sustained for the specimen after the peak loading is reached, while the degradation of the capacity under lateral load is quickly relatively, thus indicating that the specimen is featured with certain ductile energy dissipation capacity. The hysteretic curve for the specimen with shear failure is dried off. The areas surrounded by the hysteretic loop are reduced greatly. The capacity under the lateral load of the specimen is deteriorated rapidly after the peak loading is reached, and the specimen reaches failure quickly, thus indicating the poor ductile energy dissipation capacity of the specimen. The influences of each factor on the hysteretic curve are analyzed and discussed as follows.

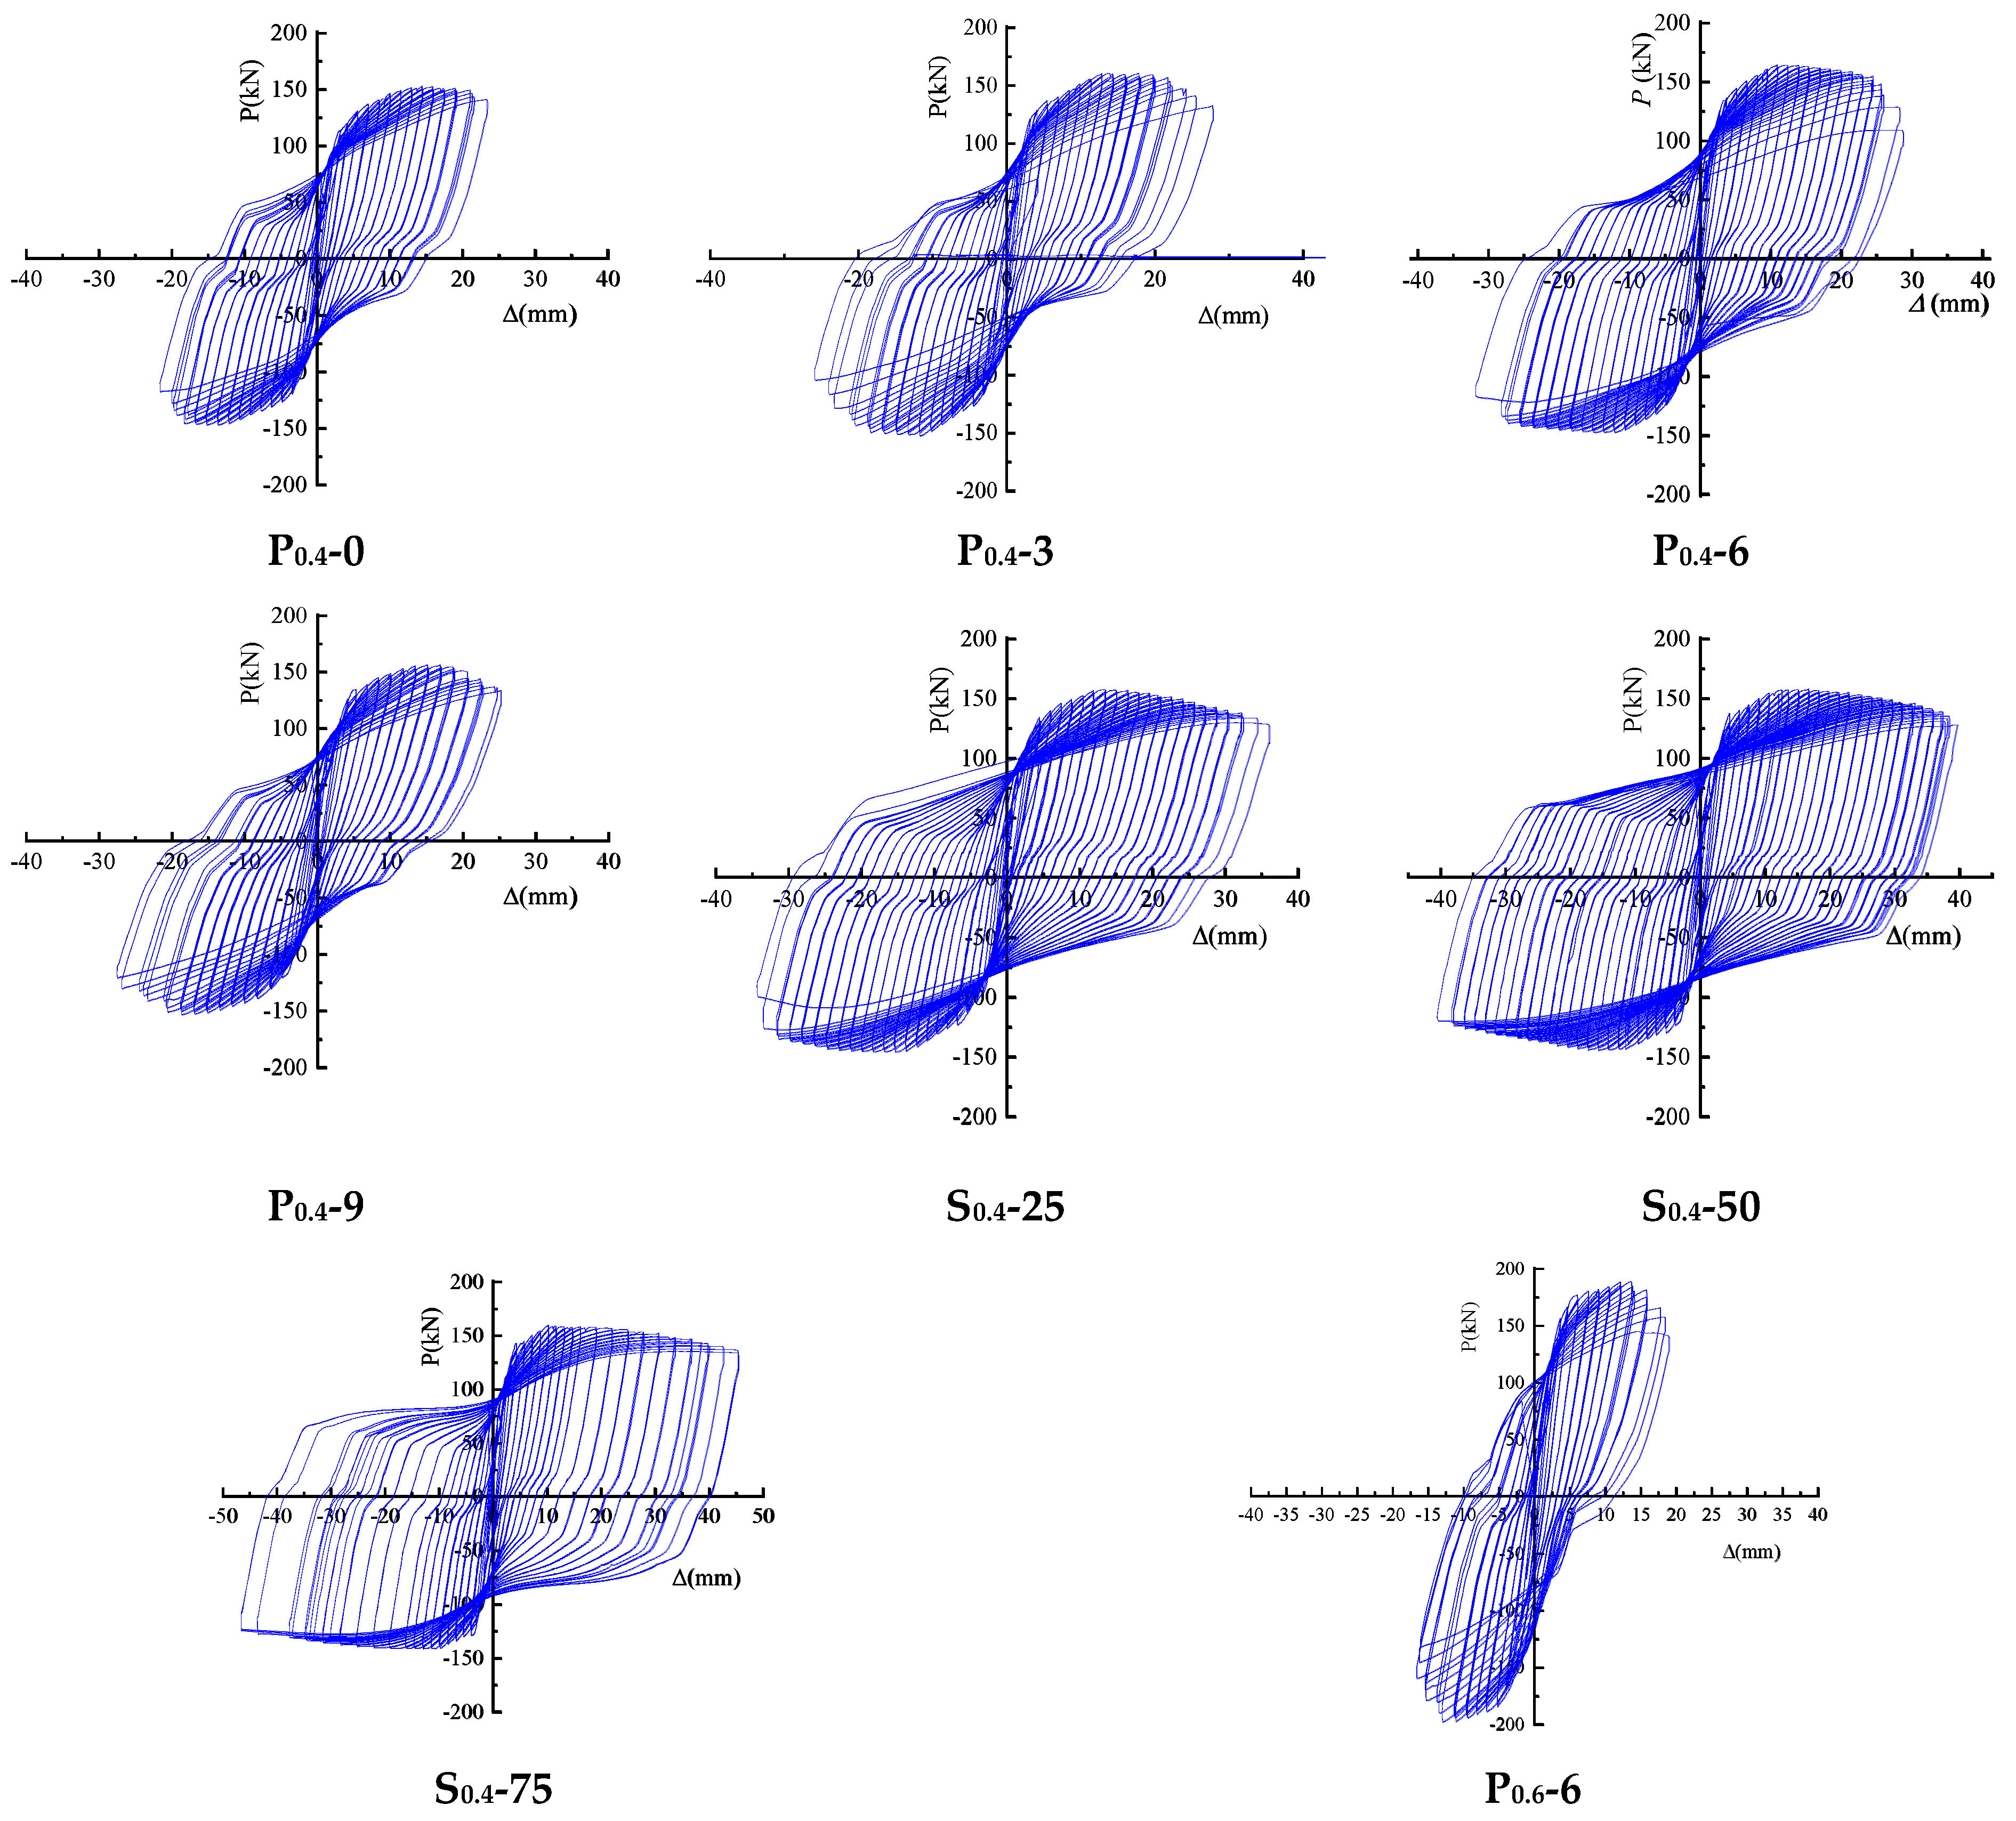
4.2. Parameter Comparison

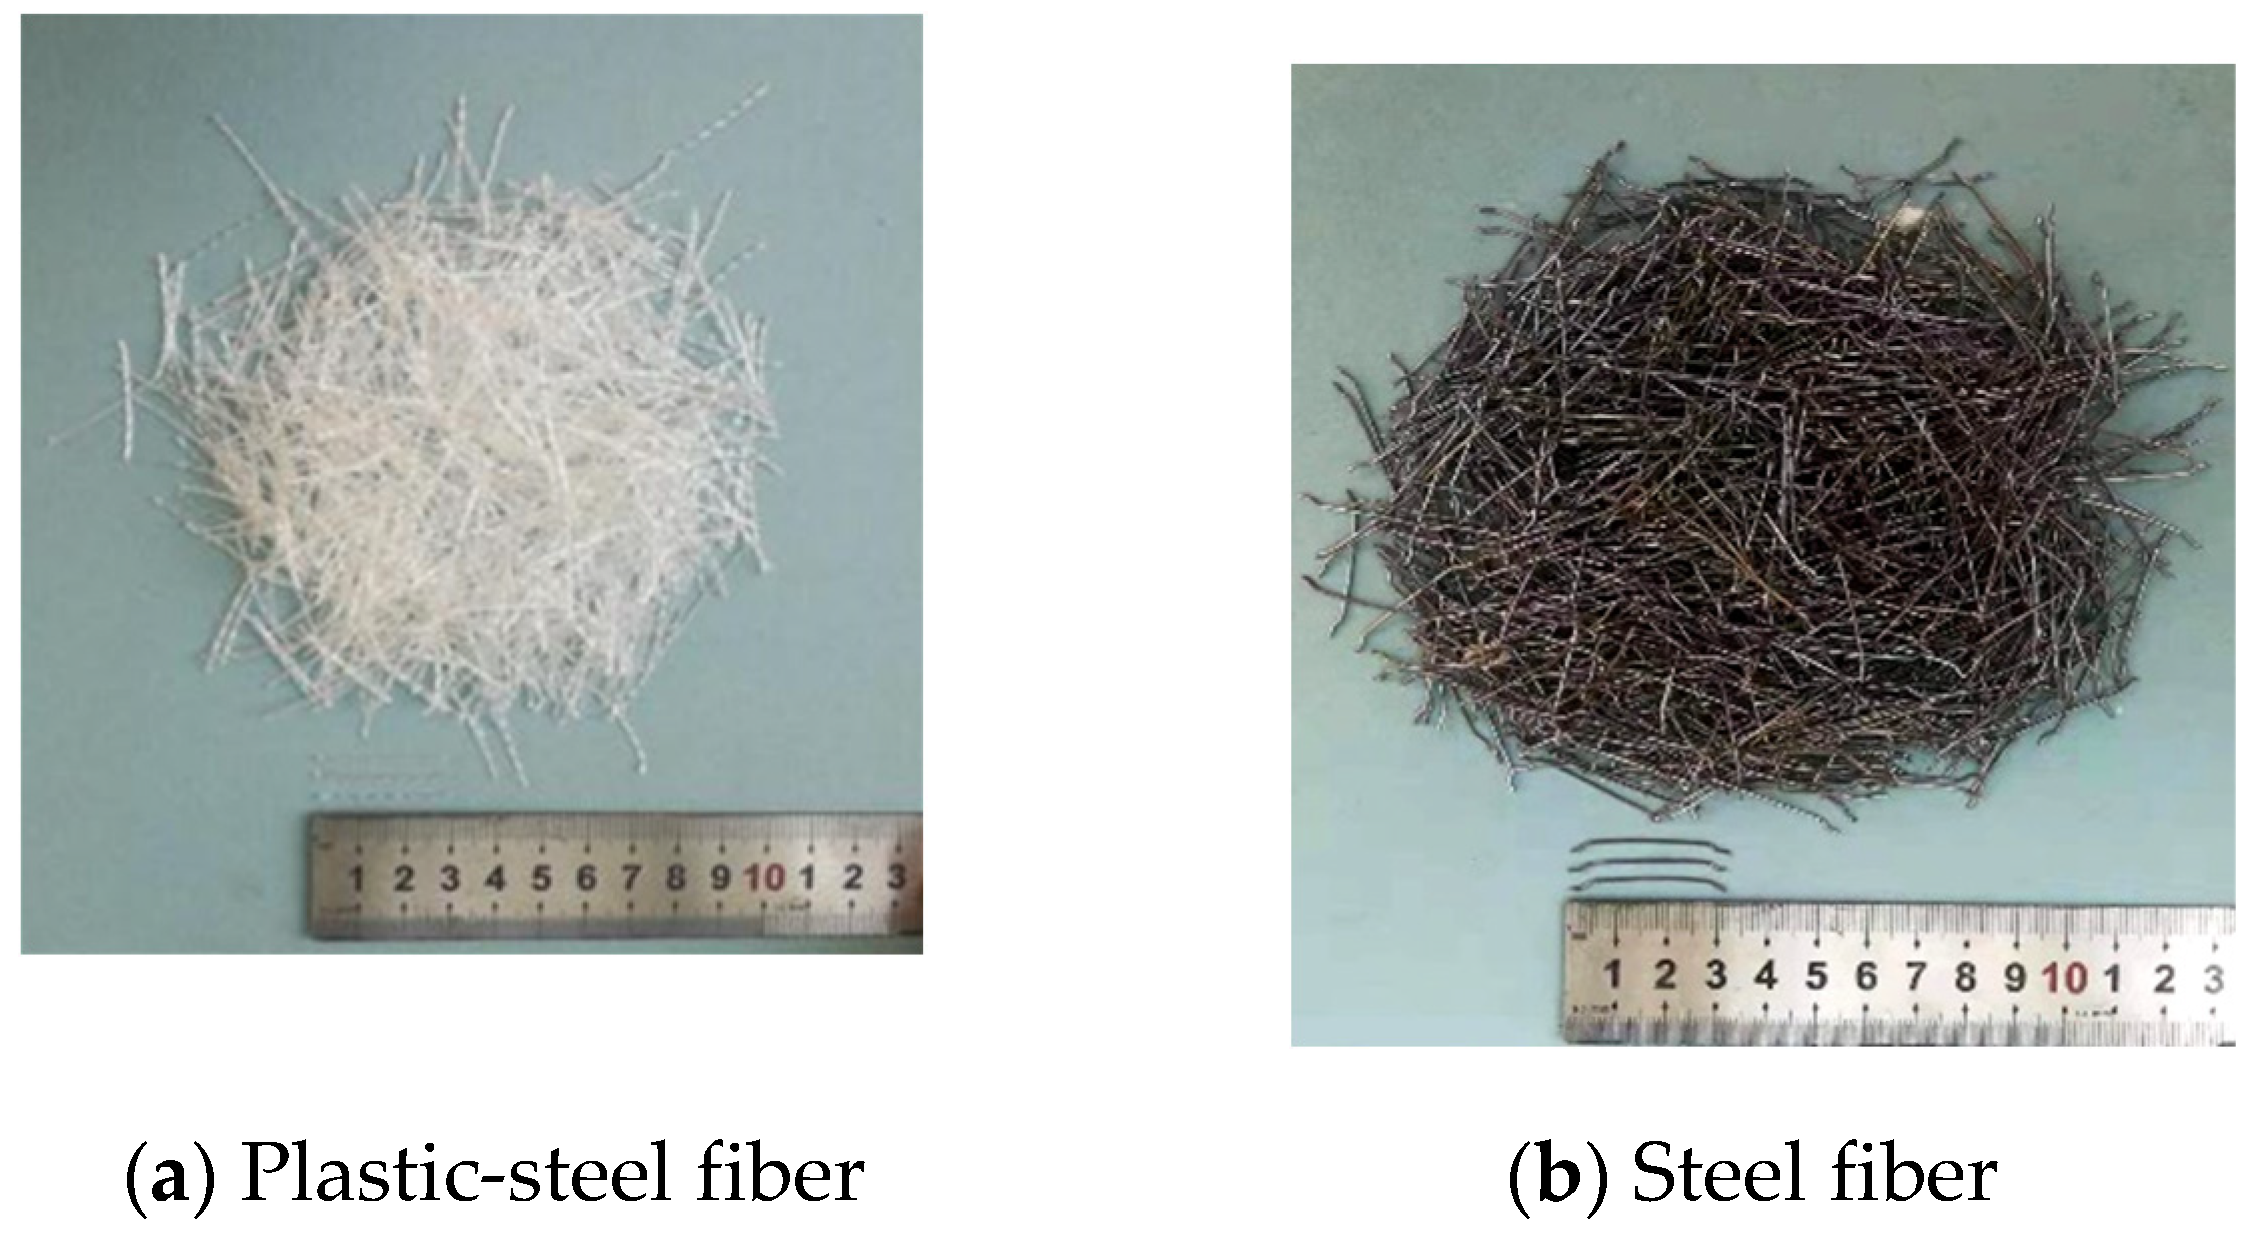
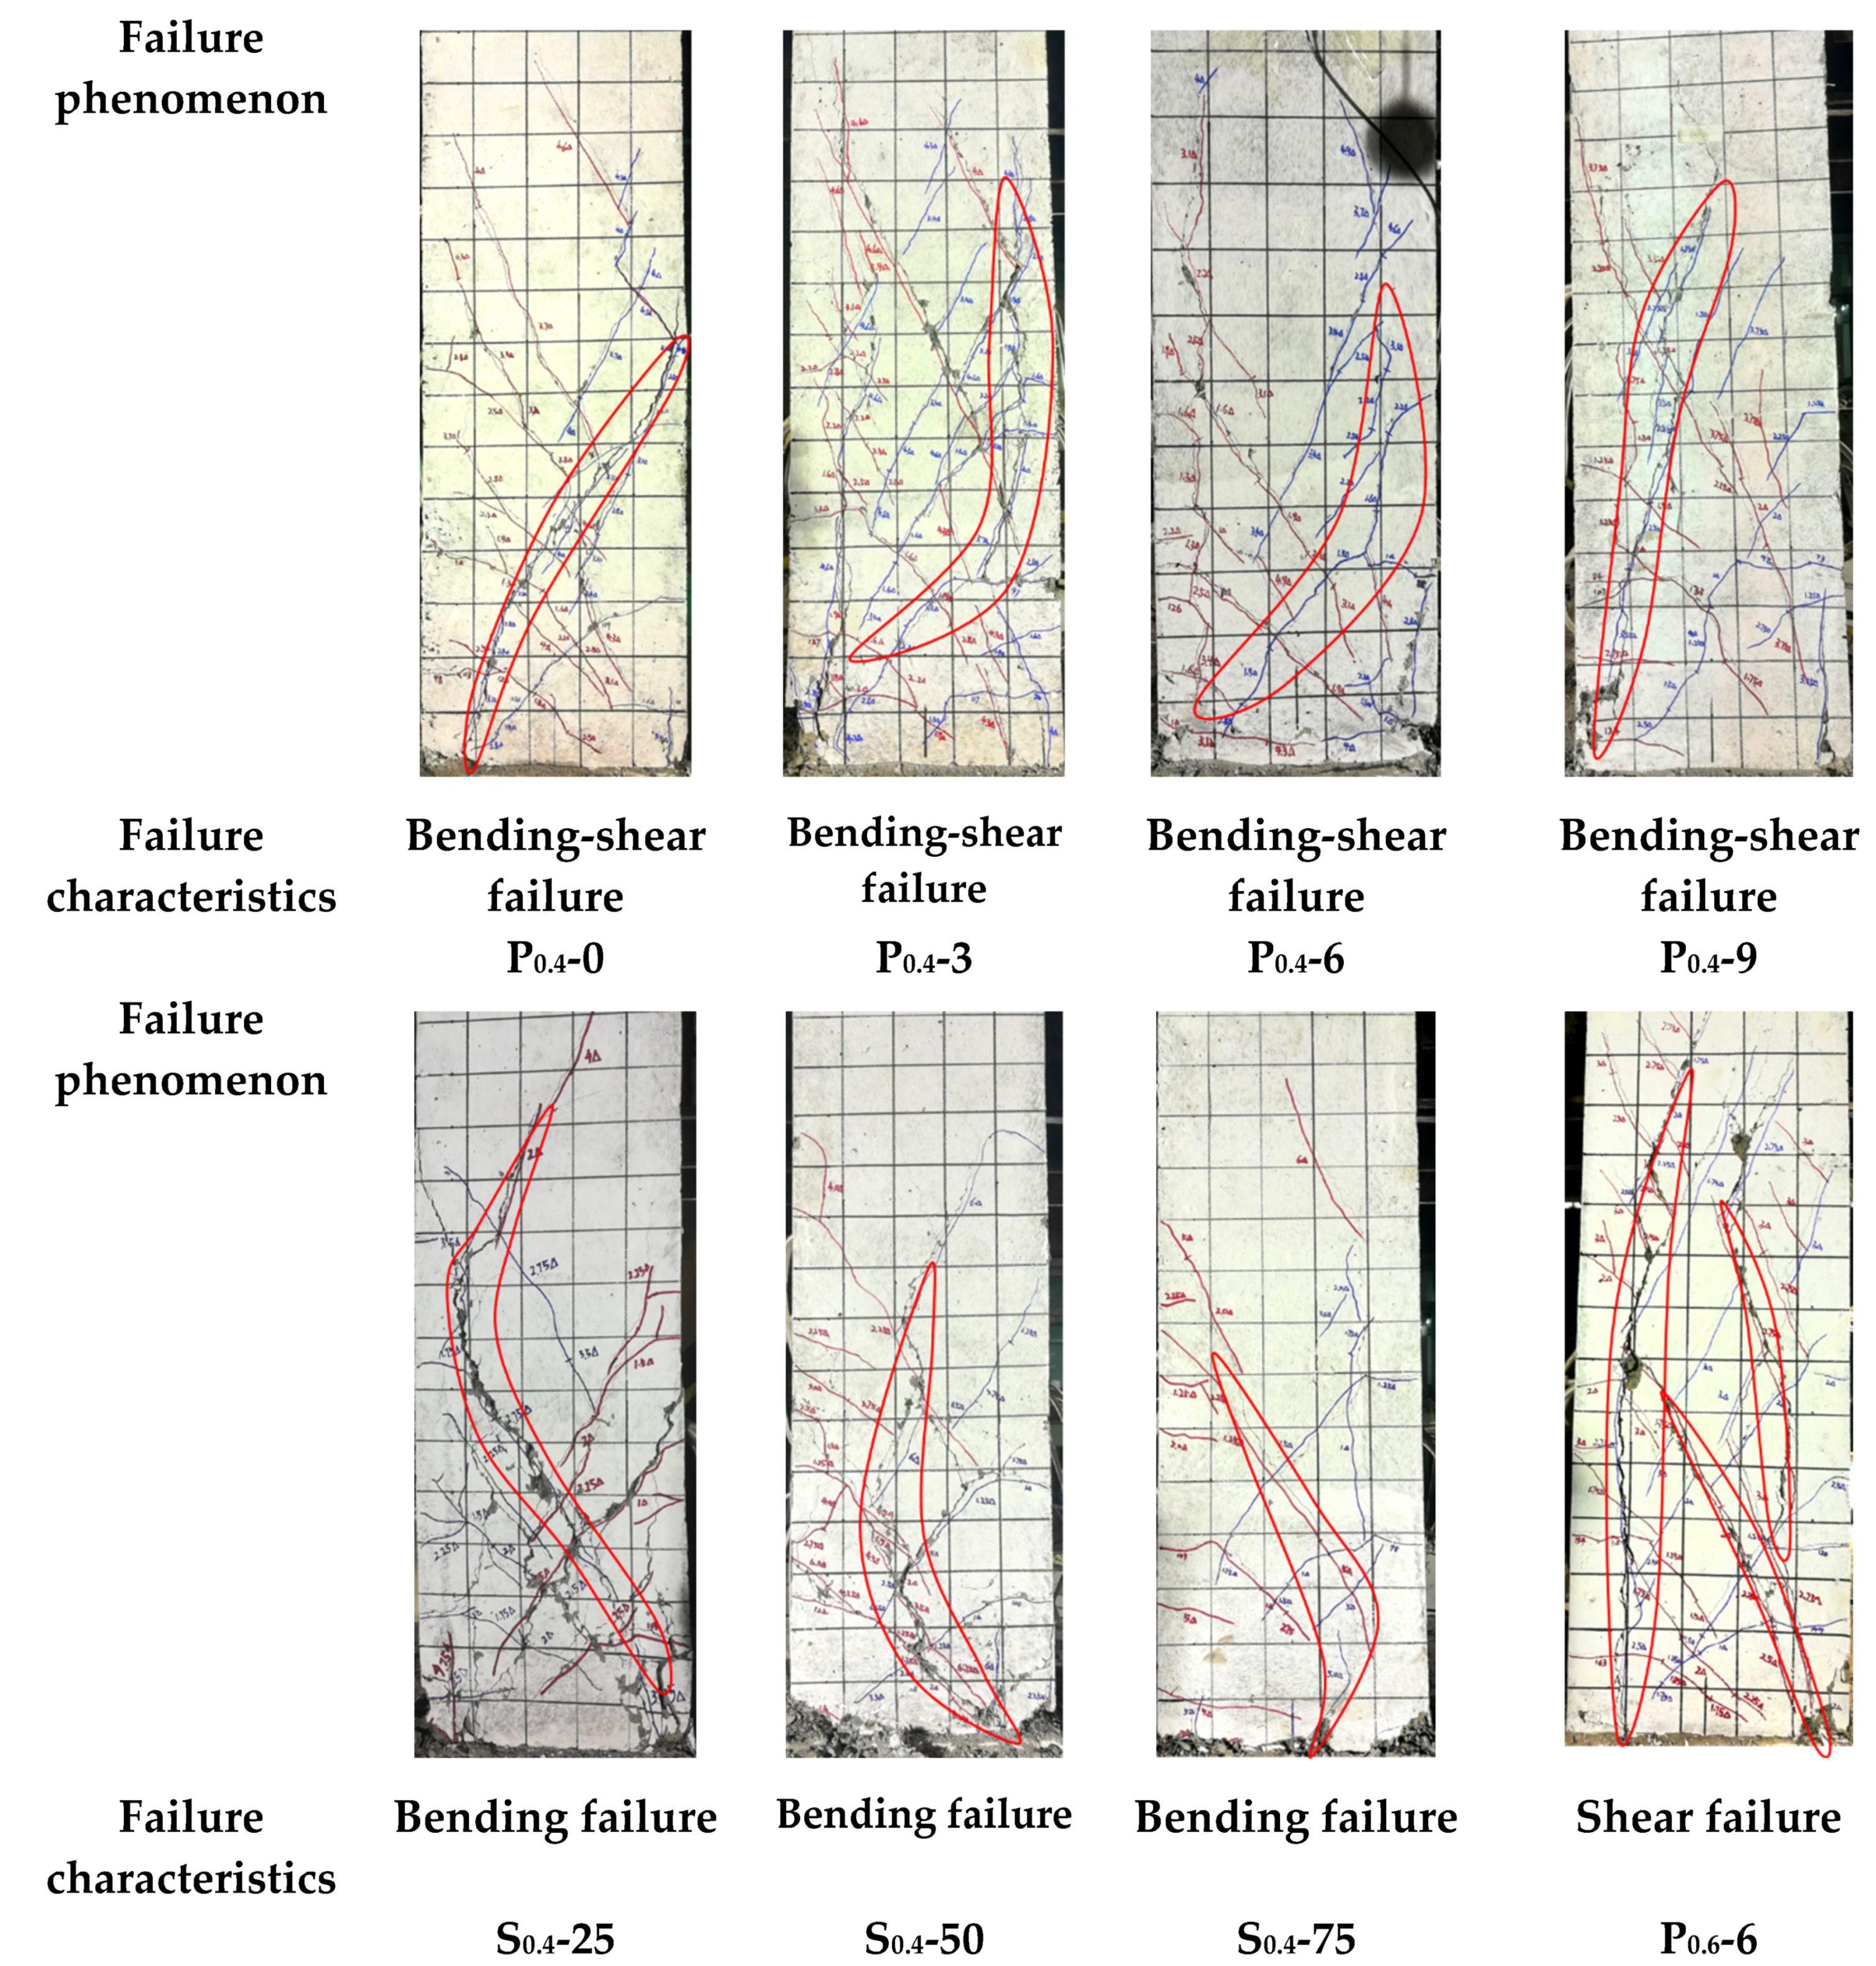
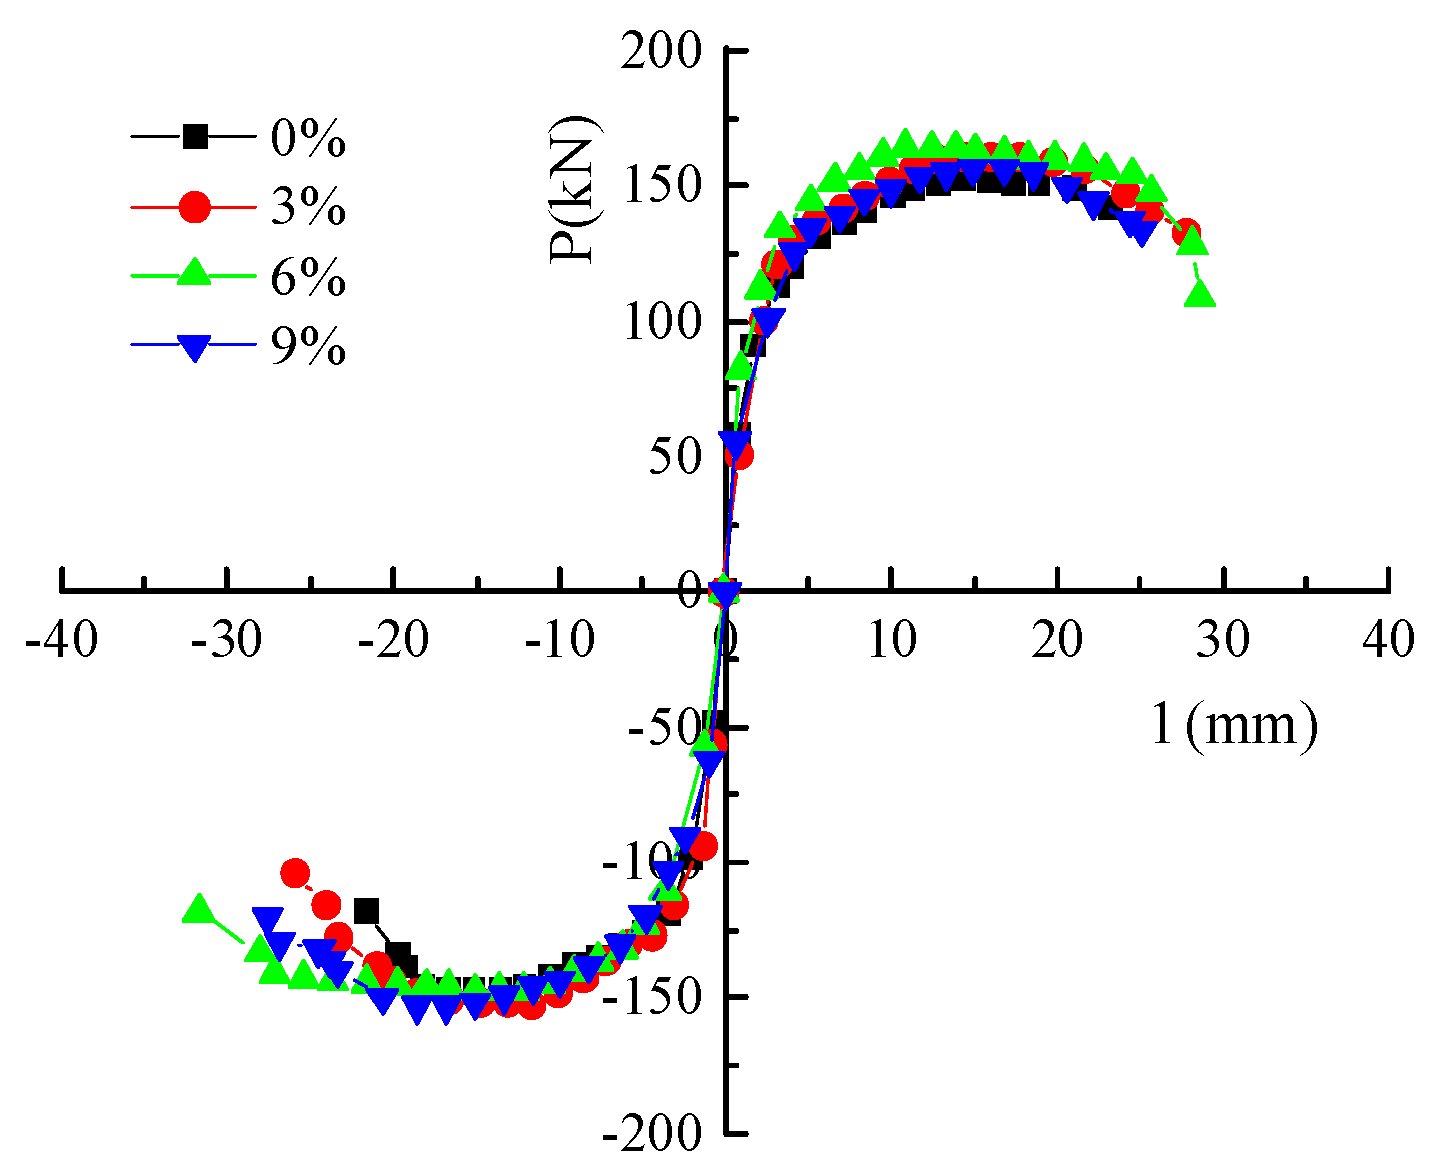
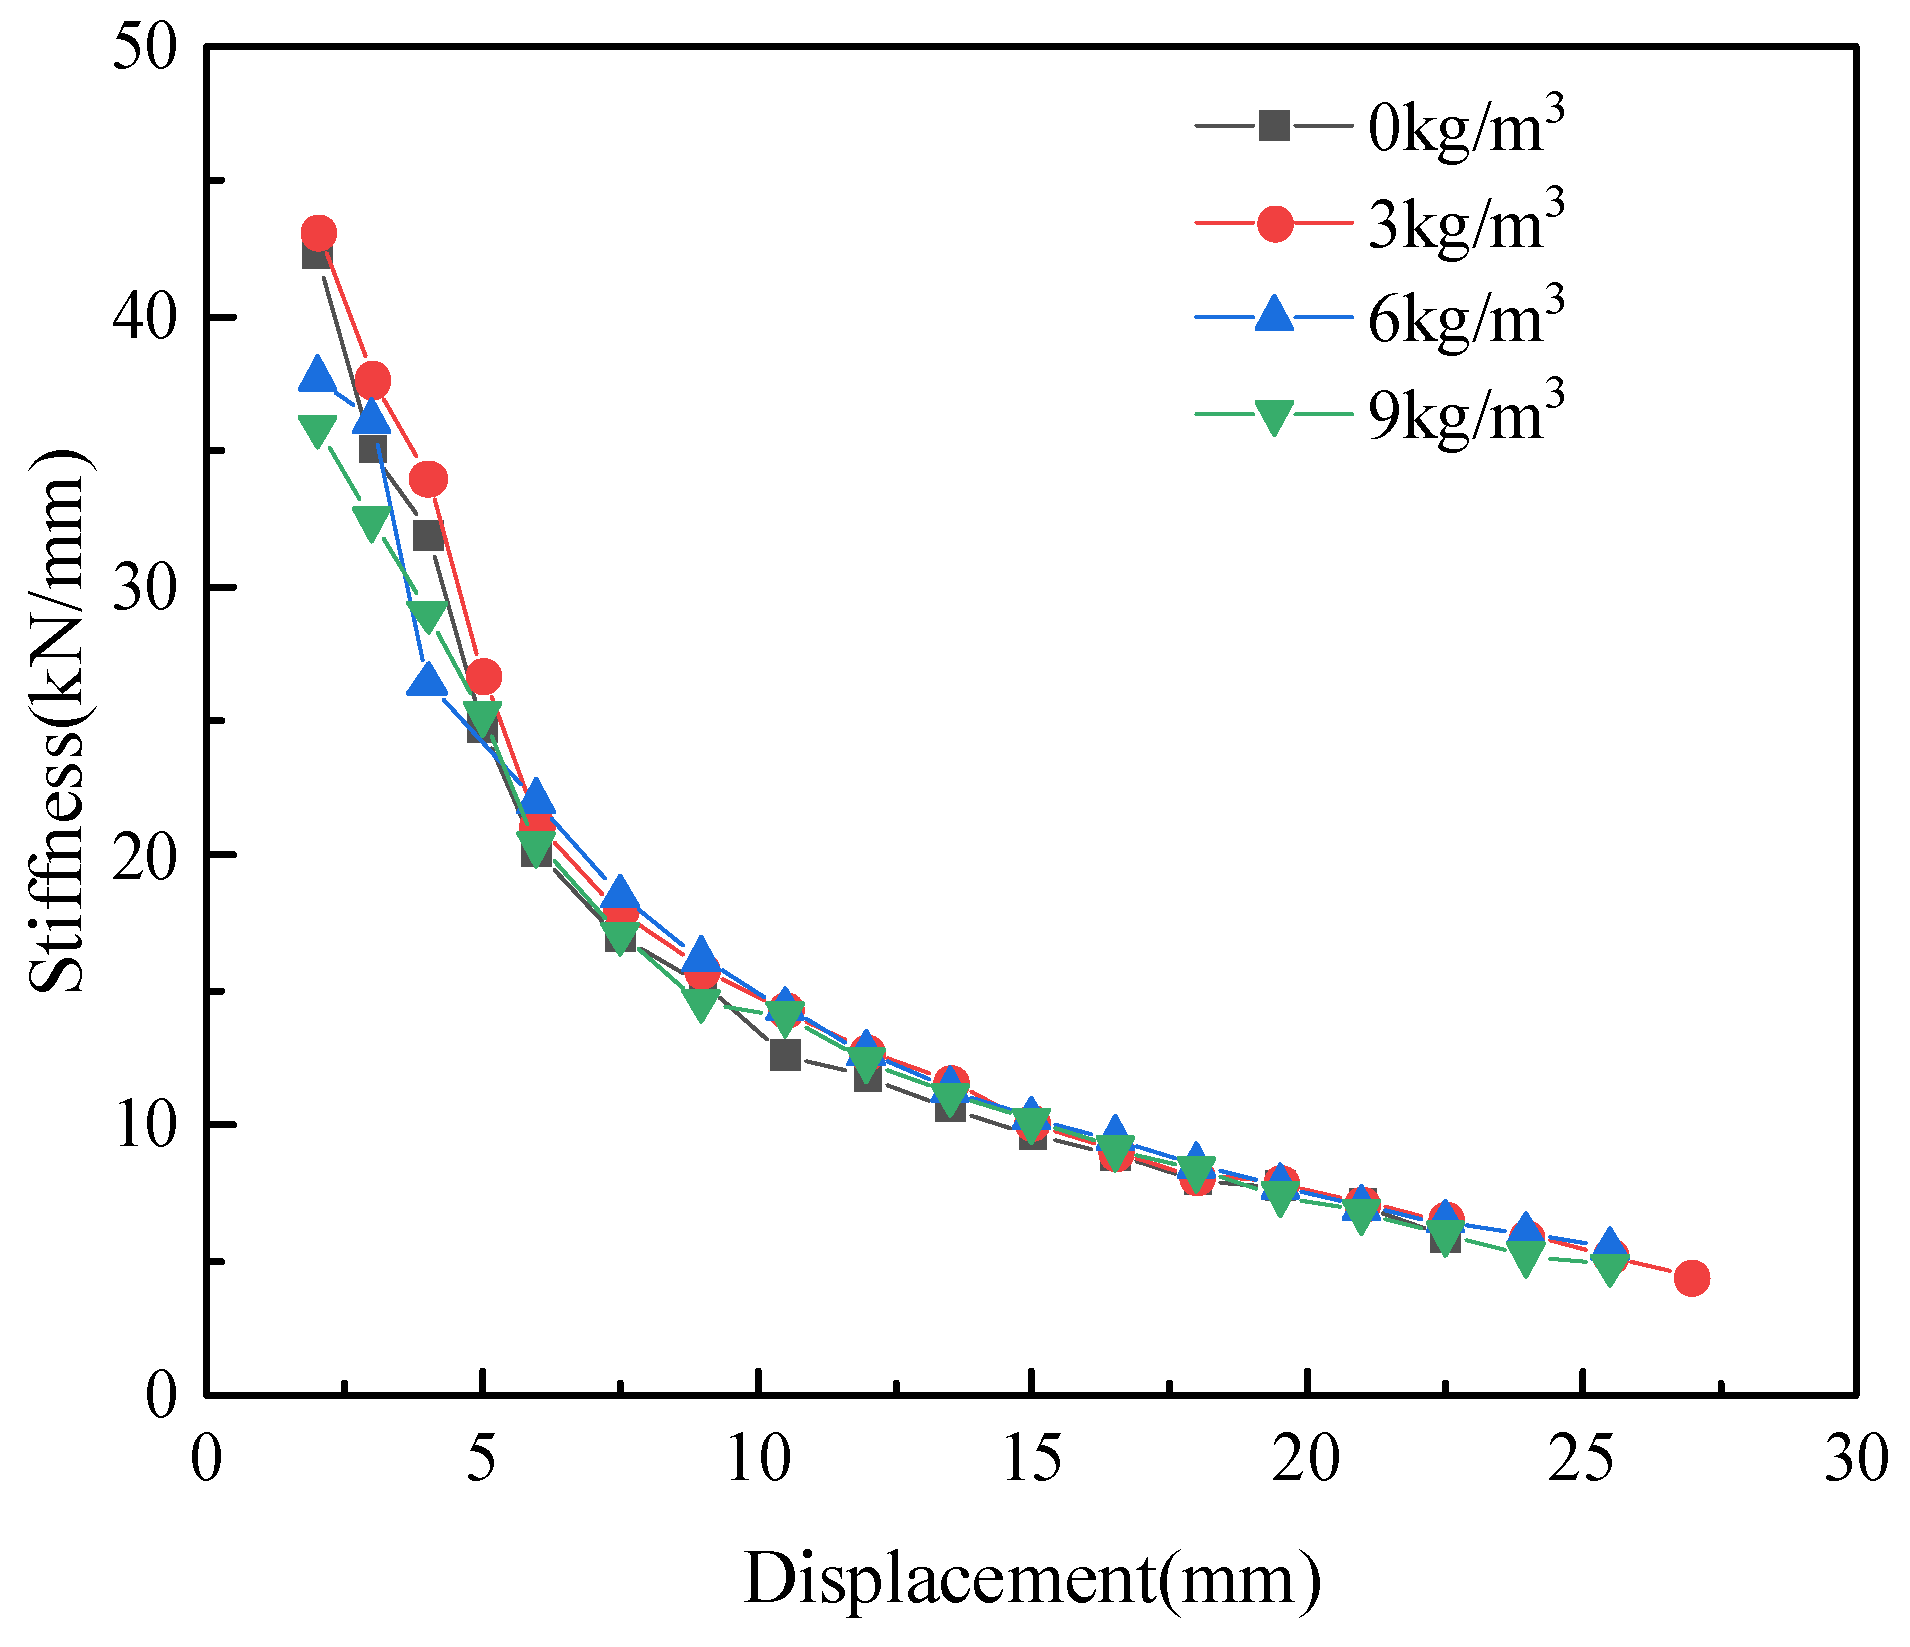
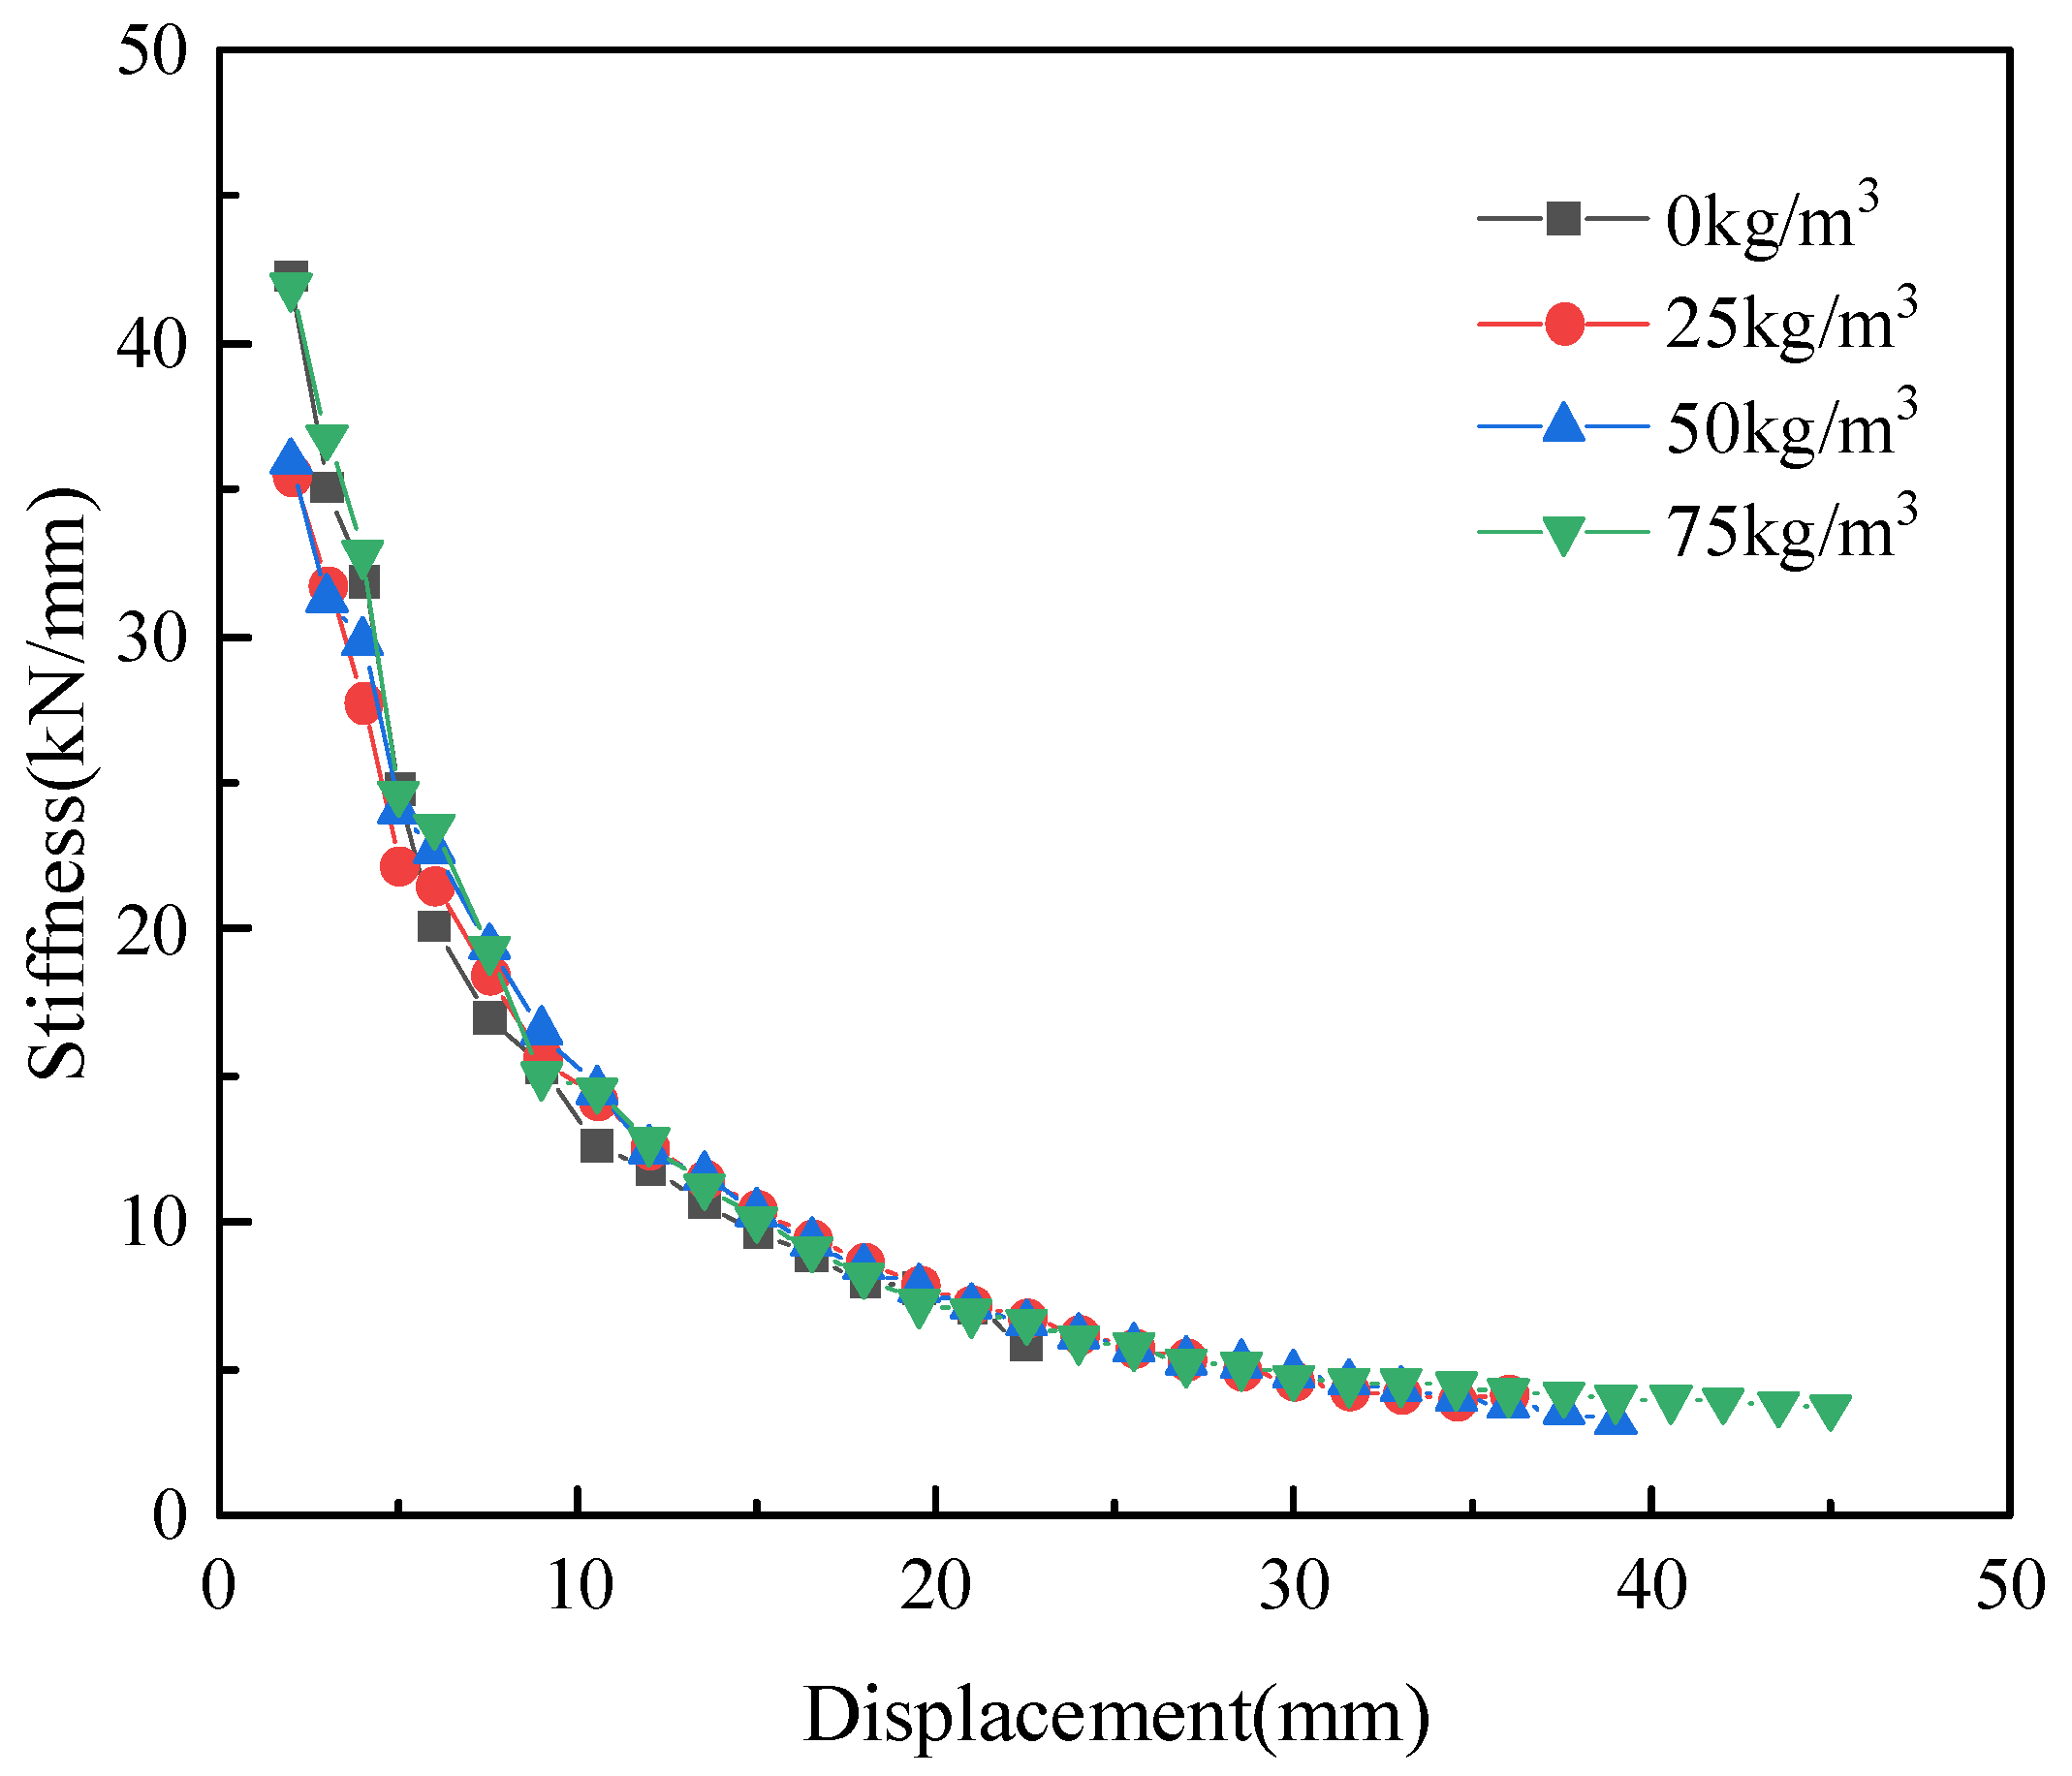
Fiber dosage: The plastic-steel fiber and steel fiber are included for the fiber, and the dosages of plastic-steel fiber for P0.4-0, P0.4-3, P0.4-6 and P0.4-9 are 0, 3, 6 and 9 kg/m3, respectively, and those of steel fiber for S0.4-25, S0.4-50 and S0.4-75 are 25, 50 and 75 kg/m3, respectively.
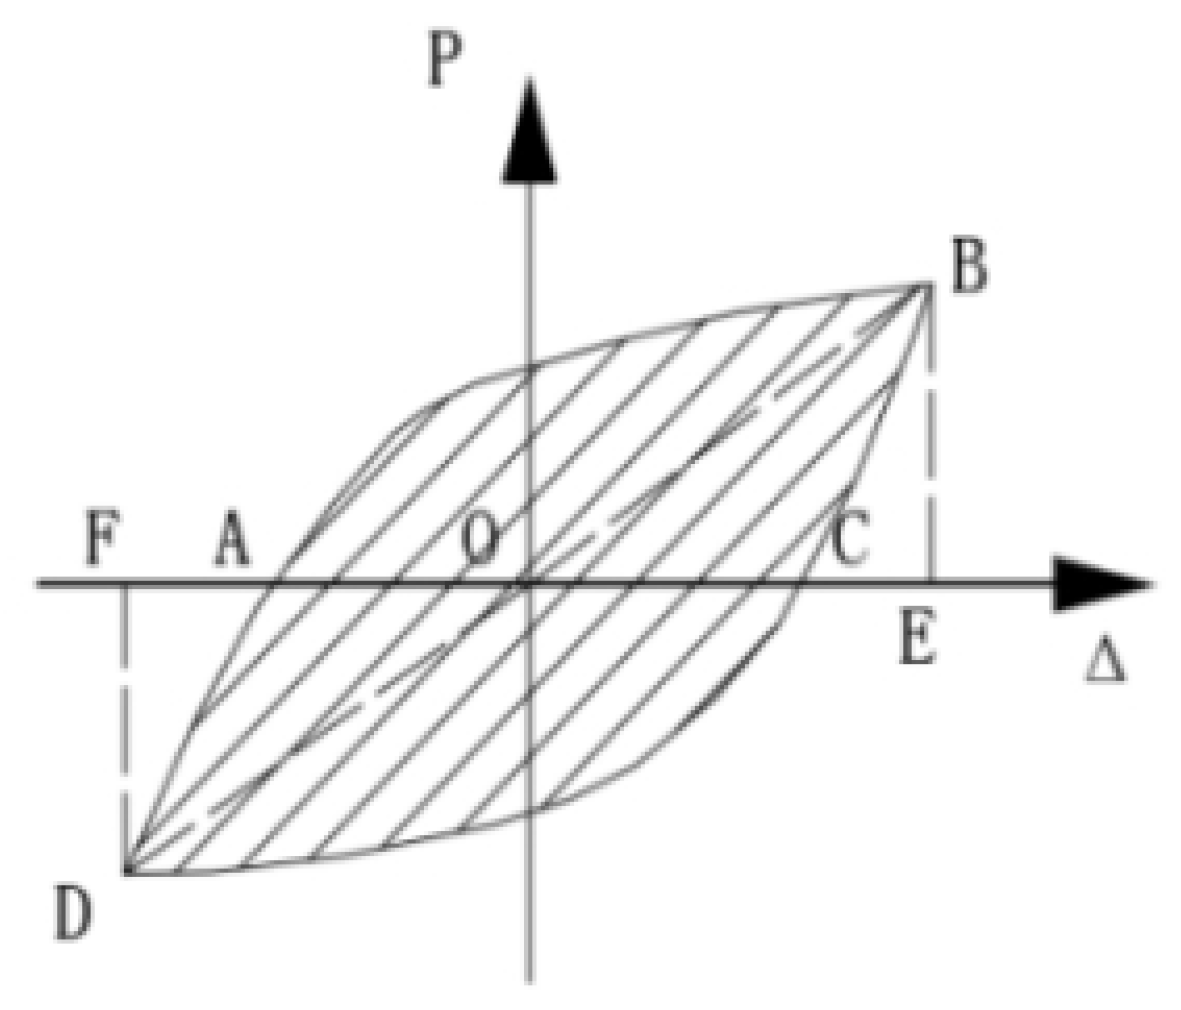
It can be seen from the comparison on the hysteretic curves of P0.4-0, P0.4-3, P0.4-6 and P0.4-9 that the comparison between P0.4-0 and P0.4-6 shows that the hysteretic curve of the specimen with plastic steel fiber is fuller than that of the specimen without plastic-steel fiber. The hysteretic curve of the specimen without plastic-steel fiber shows a standard shuttle-shaped structure without the obvious pinching effect, and the hysteretic curve is not full enough. The hysteretic curve of the specimen mixed with plastic-steel fiber is obviously full, and the energy consumption is obviously increased due to the bridging effect of the fiber. At the same time, it can be seen that the addition of fiber can improve the lateral bearing capacity of the specimen to a certain extent. The horizontal deformation ability of the hysteretic curve of the specimen with fiber is larger than that of the specimen with fiber.
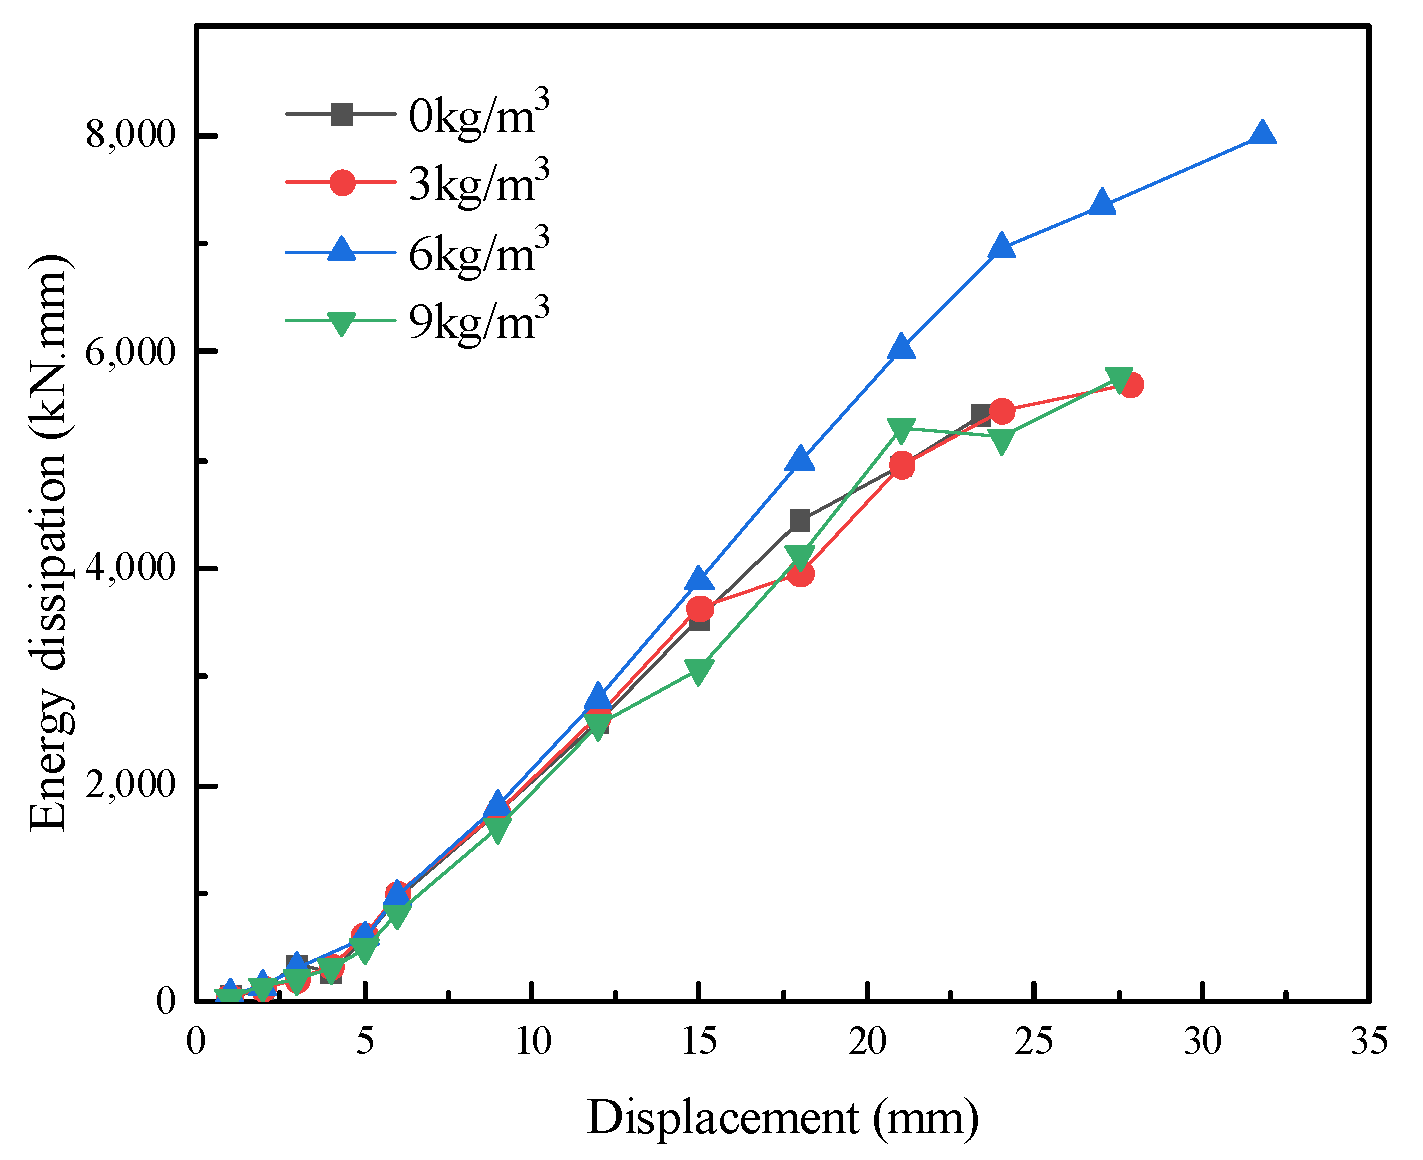
The hysteretic curves of the specimens are fuller and fuller, and the area of the hysteresis loop is larger and larger when the plastic-steel fiber dosage is increased from 0 to 6 kg/m3, thus indicating that the energy dissipation ability of the specimen is improved. However, the hysteretic curves are dried off significantly and the area of the hysteresis loop is decreased obviously when the fiber dosage is increased from 6 to 9 kg/m3, thus indicating the existence of an optimal dosage of plastic-steel fibers. This can be explained as follows: the plastic-steel fiber among the cracks can serve as the bridge to reduce the internal stress concentration of concrete, improve the tensile strength of the concrete, delay the damage accumulation of the concrete when the incorporation amount is small, and further the mechanical performance of the concrete is improved, and the ductile energy dissipation capacity of the specimen is enhanced. However, when the optimal dosage of plastic-steel fiber is surpassed, the plastic-steel fiber cannot be distributed in the cement base evenly when the dosage is higher for the size of the plastic-steel fiber is larger and the pouring and mixing quality of the concrete are poor. The holes and non-compactness and other congenital defects occur in the concrete, the mechanical performance of the concrete is influenced further, and the energy dissipation capacity is reduced. Therefore, 6 kg/m3 of plastic-steel fiber dosage is suggested in this paper.
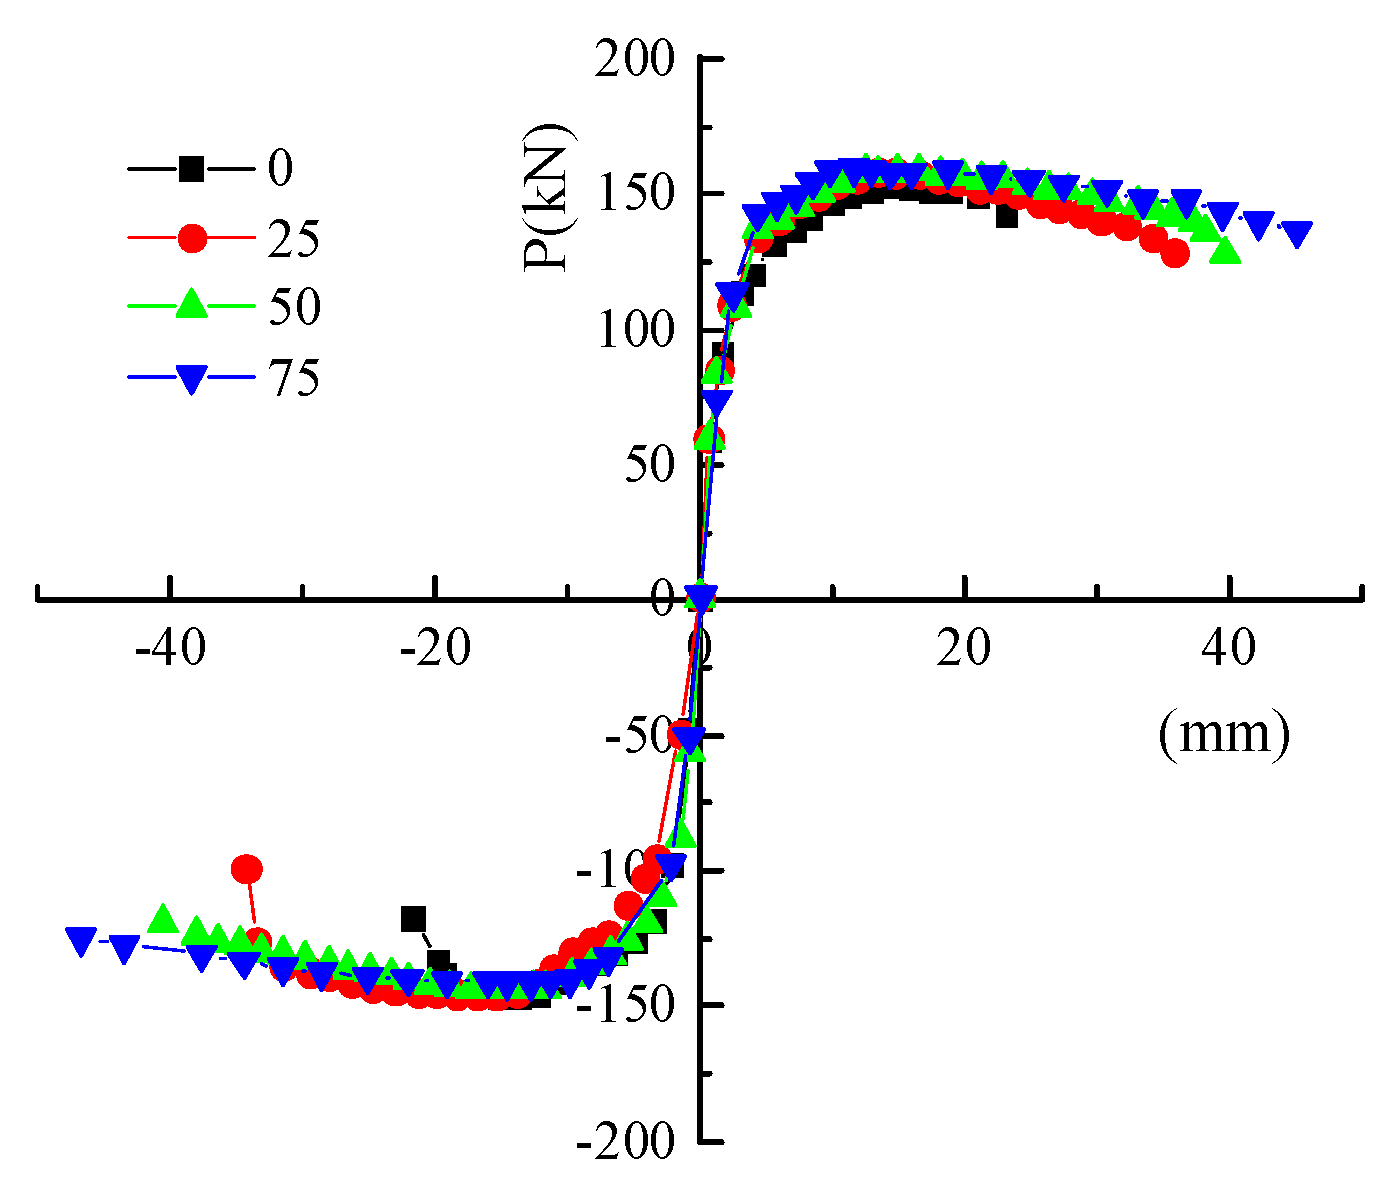
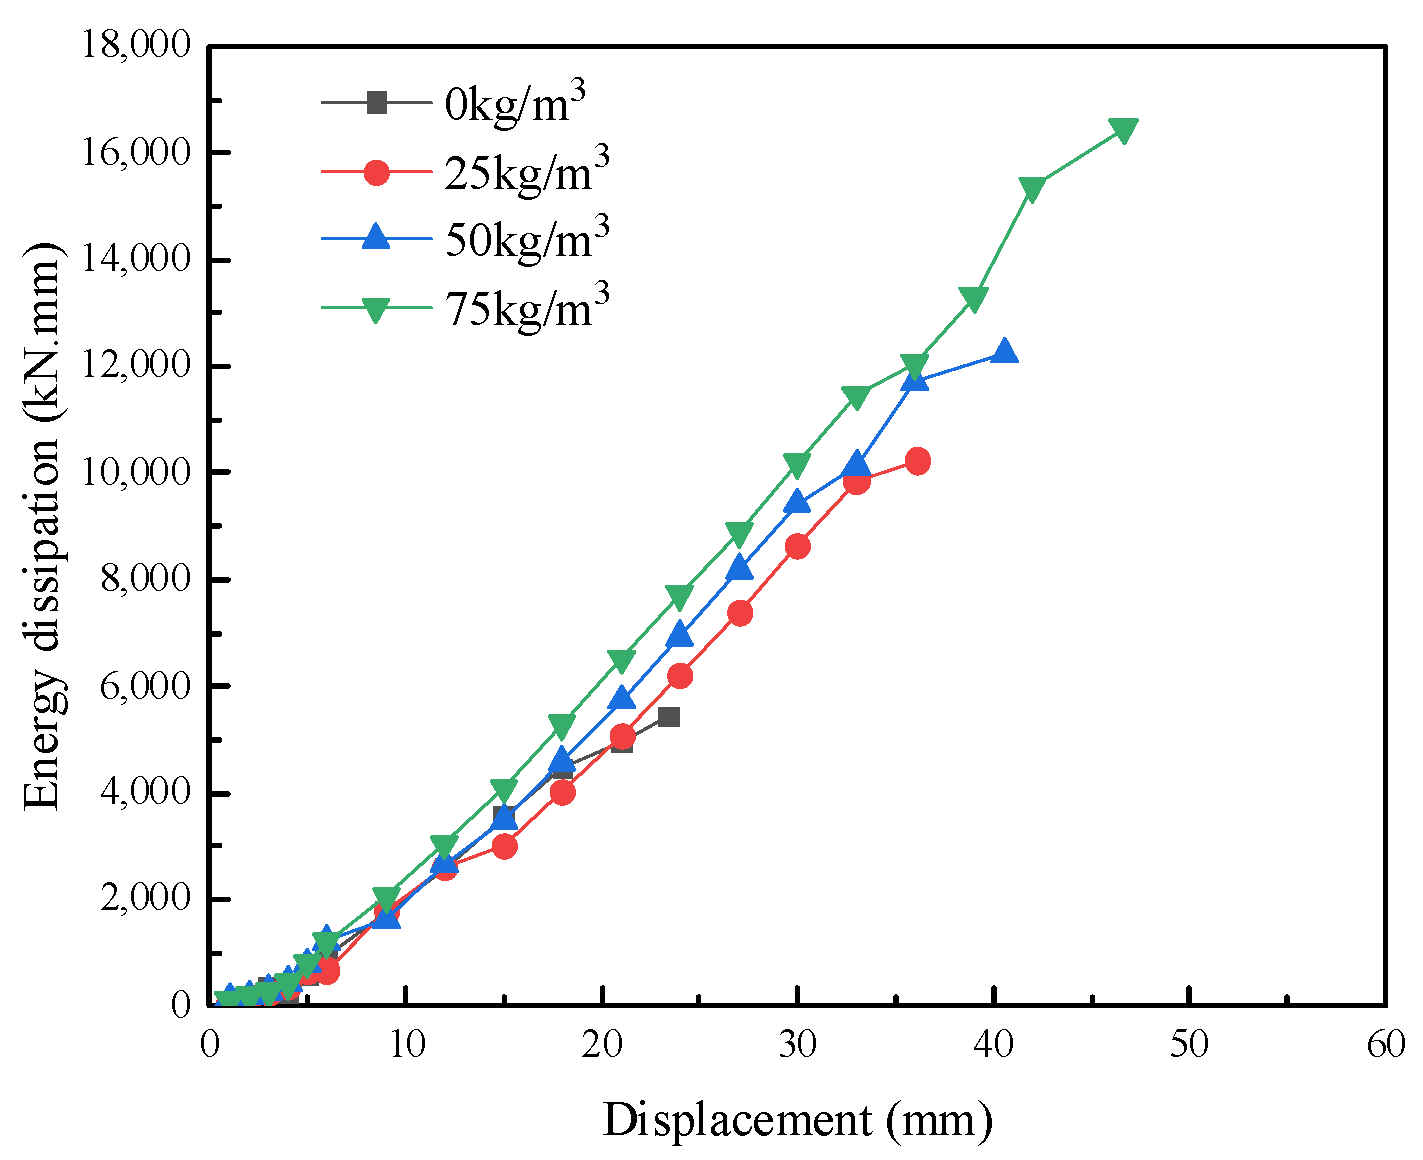
It can be seen from the comparison on the hysteretic curves of P0.4-0, S0.4-25, S0.4-50 and S0.4-75 that the fullness of the hysteretic curve is improved significantly, the area of the hysteresis loop is increased greatly when the steel fiber dosage is increased from 0 to 25 kg/m3, thus indicating that the mechanical performance of the concrete is improved effectively from the incorporation of the steel fiber, and the energy dissipation capacity of the specimen is enhanced; the fullness of the hysteretic curve is improved and the area of the hysteresis loop is increased to a certain degree when the steel fiber dosage is increased from 25 to 50 kg/m3. However, the increased fullness of the hysteretic curve of S0.4-50 when compared with that of S0.4-25 is reduced slightly more than that of S0.4-25 when compared with that of P0.4-0. The fullness of the hysteretic curve is further improved, the area of the hysteresis loop is increased further when the steel fiber dosage is increased from 50 to 75 kg/m3, the pinching effect of the hysteretic curve of S0.4-75 is more obvious when compared with that of S0.4-50, while the increased fullness of the hysteresis loop is greater. In conclusion, it is suggested to take 50 kg/m3 of the steel fiber dosage with consideration to efficiency.
The following can be obtained from the comparison of plastic-steel fiber for P0.4-3, P0.4-6, and P0.4-9 and steel fiber for S0.4-25, S0.4-50, and S0.4-75: (1) the incorporation of the steel fiber can better improve the mechanical performance of the concrete and the role of the bridge is more obvious when compared with that of the plastic-steel fiber; (2) the failure mode of the specimen can be changed from the incorporation of the steel fiber. The bending-shear failure mode is still suitable for the plastic-steel fiber of P0.4-3, P0.4-6, and P0.4-9, while the bending failure mode is still suitable for the steel fiber of S0.4-25, S0.4-50, and S0.4-75, thus indicating that steel fibers can better improve the ductility energy dissipation capacity of the specimen, while the corresponding cost of the specimen is also higher.
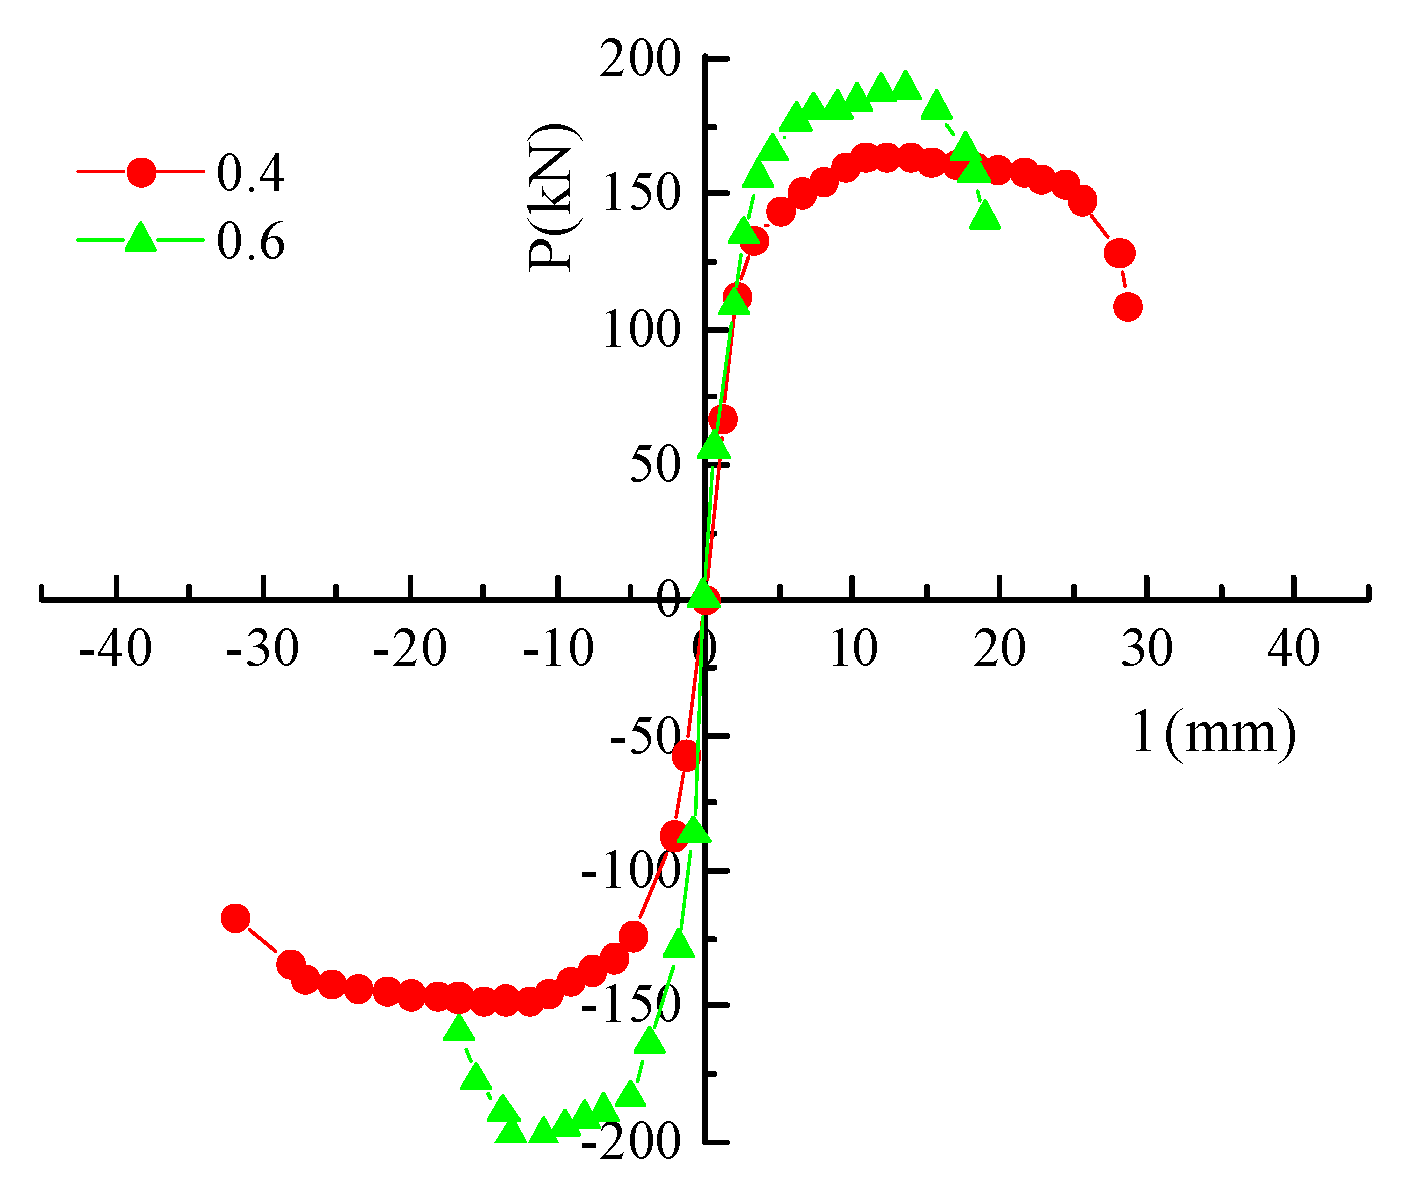
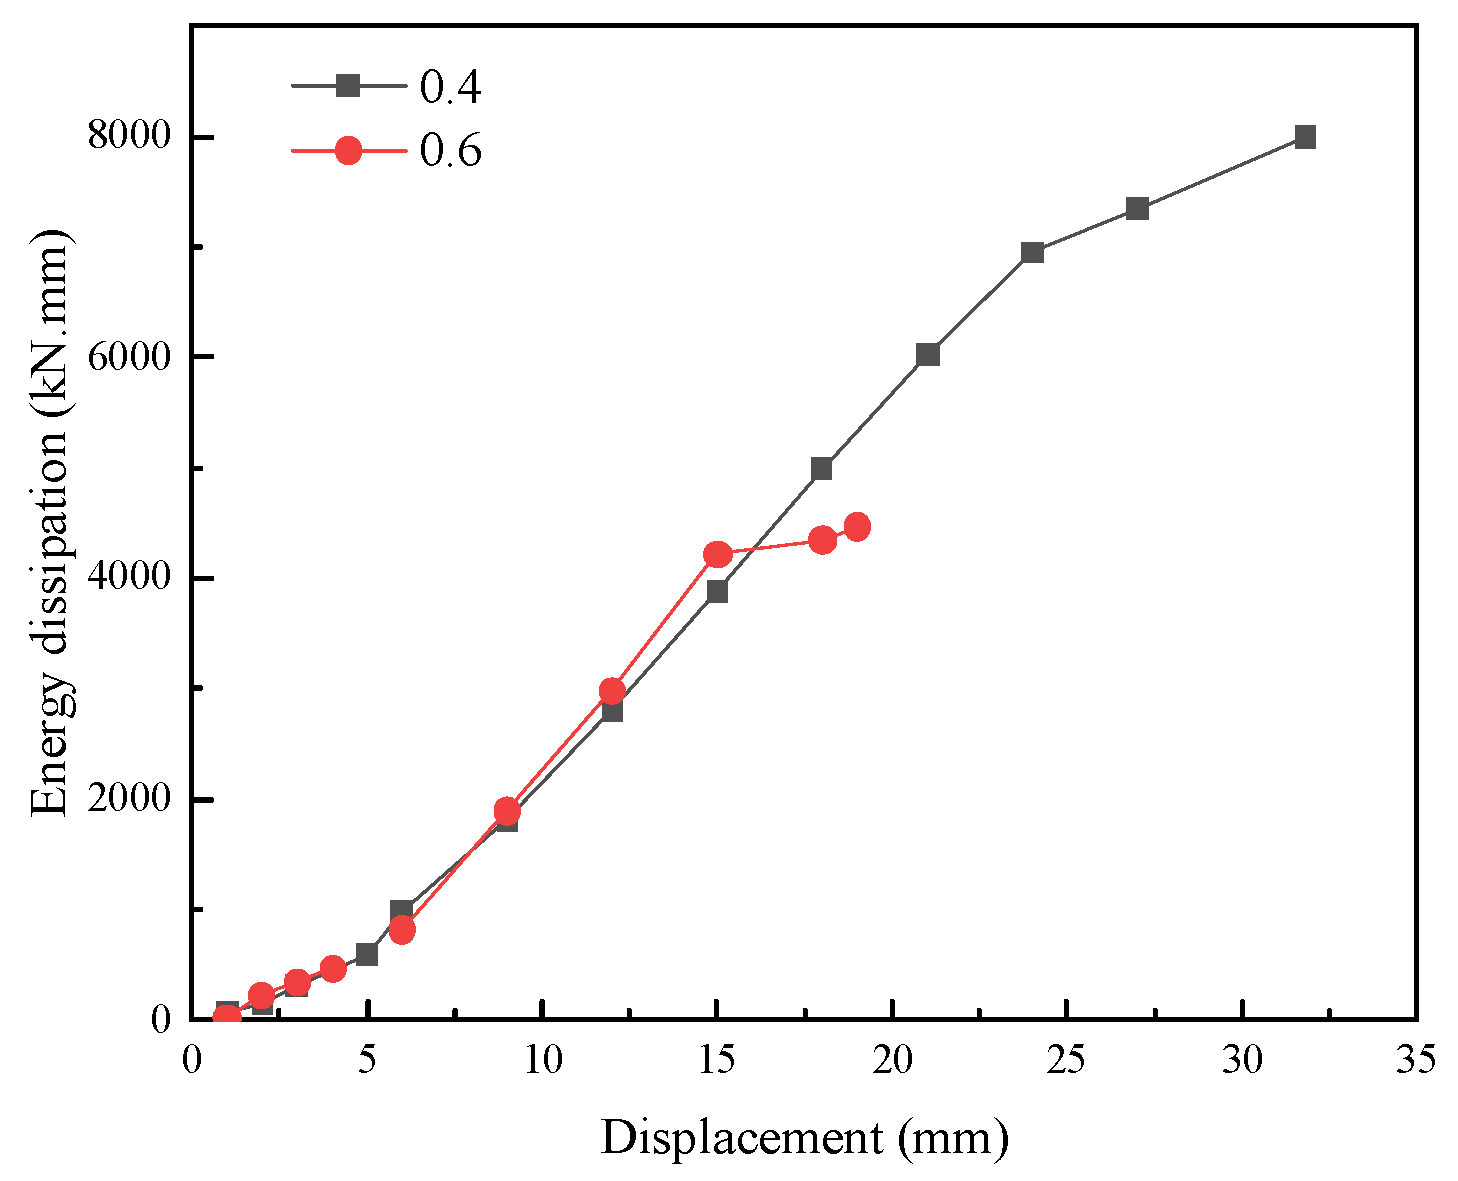
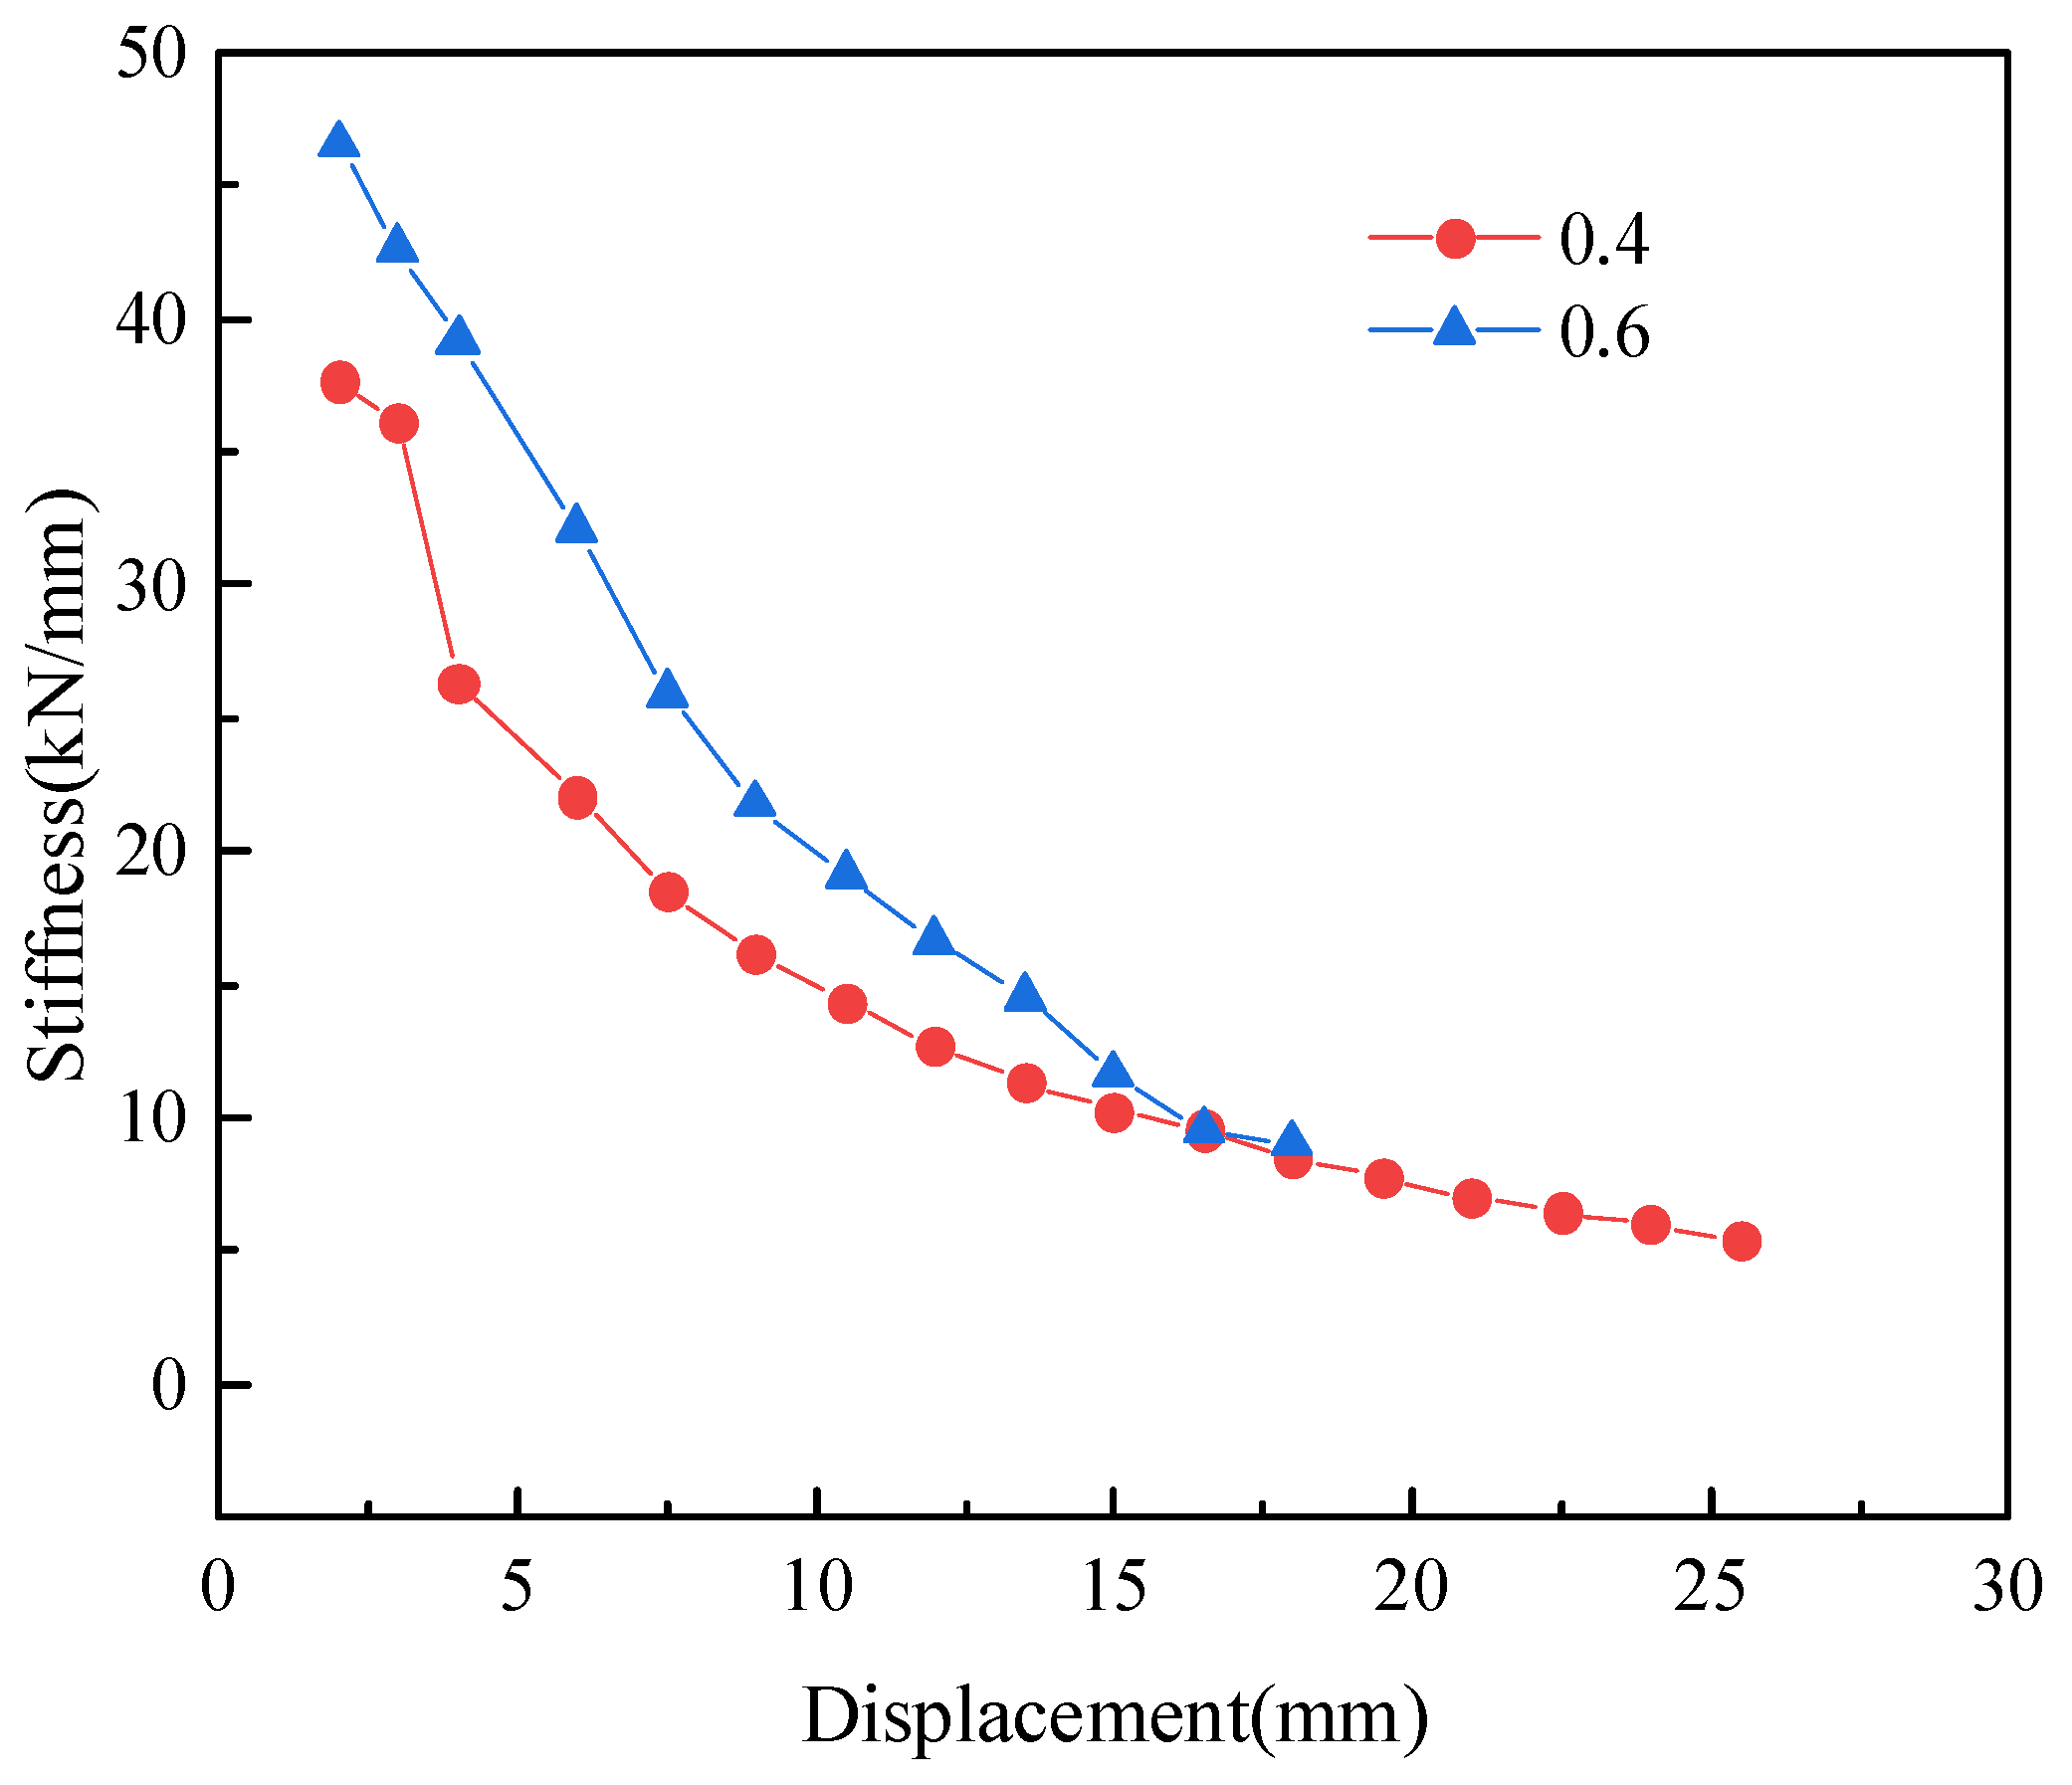
The axial compression ratio: The axial compression ratios of P0.4-6 and P0.6-6 are 0.4 and 0.6, respectively. It can be seen from the comparison on the hysteretic curves that the fullness of the hysteretic curve is reduced greatly, the area of the hysteresis loop is decreased greatly when the axial compression ratio of the specimen is increased from 0.4 to 0.6, and the hysteretic curve of P0.6-6 is dried off. The degradation speed of the capacity under the lateral load of the specimen is rapid after the peak loading is reached, and the specimen is declared as a failure after several low-cycle reversed loading, thus indicating the ductile energy dissipation capacity is reduced greatly. This can be concluded as follows: (1) when the axial compression of the specimen is relatively large, the first principal stress at any part of the cross-section of the specimen is larger, resulting in the faster accumulation of internal damage of the concrete, reaching critical failure stress faster, thus failure of the concrete; (2) when the axial compression of the specimen is relatively large, the axial second-order effect of the specimen with a larger axial compression ratio is larger under low-cycle reversed loading when the same displacement is implemented, thus increasing the additional second-order bending moment at any cross-section, adding to the stress of the concrete, and accelerating the damage and failure of the concrete.

5. Capacity under Lateral Load and Deformation

The envelope curve of the first peak point of the hysteretic curve under different loading effects of the specimen is the skeleton curve of the specimen [28,29,30,31,32,33], and a comparison of the skeleton curves of each specimen is shown in Figure 9, Figure 10 and Figure 11.
Yield displacement and yield load are determined according to the energy equivalent method. Loading is stopped when loading is decreased below 85% of the peak loading, and the displacement and loading at this time shall be regarded as the ultimate displacement and ultimate load as shown in Table 7 specifically.
The following can be obtained from Figure 8, Figure 9 and Figure 10 and Table 7: (1) the ductility coefficients of hollow columns are all greater than 4, and the seismic requirements on the ductility coefficients of anti-lateral force components can be met basically, thus indicating that hollow columns can be used in the practical engineering. (2) The ductility coefficient of plastic-steel fiber of P0.4-0 is 4.51. The displacement ductility coefficient is increased from 5.01 to 6.03 when the fiber dosage is added from 3 to 6 kg/m3, and the ductility coefficient can fully meet the seismic requirements, thus indicating that the ductility of hollow columns can be improved effectively with appropriate plastic-steel fiber dosage. However, the ductility coefficient is decreased from 6.03 to 4.60 when the fiber dosage is added from 6 to 9 kg/m3, and it is close to the ductility coefficient of the specimen without the fiber. This is caused by the large size of the plastic-steel fiber. This is not conducive to the mixing construction of the concrete when the incorporation is large due to the large size of plastic-steel fiber, the holes and non-compactness and other congenital defects occur in the internal concrete, and the ductility of the specimen is reduced. (3) The ductility coefficient of the specimen is increased from 5.9 to 10.18 when the steel fiber dosage is added from 25 to 75 kg/m3, and the ductility of the specimen is improved significantly. (4) The improvement effect of the steel fiber on the ductility coefficient of the specimen is more significant than that of the plastic-steel fiber, while it is featured with a higher unit price and lower price-performance ratio; therefore, it is suggested to use the plastic-steel fiber dosage of 6 kg/m3 for the seismic requirement can be met. (5) As shown in the comparison between P0.4-6 and P0.6-6, the ductility coefficient of the specimen is reduced from 6.03 to 4.18, by 30.7%, when the axial compression ratio of the specimen is increased from 0.4 to 0.6, while the reduction degree is 7.3% for P0.6-6 when compared with P0.4-0, thus indicating that the seismic performance can be improved from the incorporation of the fiber when the axial compression ratio of the component is increased, and the ductility coefficient of the specimen with a high axial compression ratio is close to that with a low dosage and a low axial compression ratio. (6) The incorporation of the plastic-steel fiber and steel fiber has little influence on the peak load, while the increase in the axial compression ratio can improve the peak load significantly by 15.4%.

6. Ductile Energy Dissipation

The cumulative energy dissipation [34] E is used to characterize the energy dissipation capacity of each specimen in this paper. In Formula (1), the physical meanings of S Δ ABC and S Δ CDA are shown in Figure 12. The curves of the cumulative energy dissipation E of each specimen changing with the displacement are shown in Figure 12, Figure 13, Figure 14 and Figure 15.
E = S Δ ABC + S Δ CDA
As shown in the comparison on the cumulative energy dissipation of each specimen, the following can be obtained according to Figure 11, Figure 12 and Figure 13: (1) the yield displacement of each specimen in Table 7 is close to 5 mm; therefore, it is in the elastic stress stage basically for the specimen when the loaded displacement is less than 5 mm, the hysteresis loop is almost a straight line and the cumulative energy dissipation is small, and the cumulative energy dissipation curves of each specimen are overlapping almost as shown in Figure 12, Figure 13 and Figure 14. (2) Different energy dissipation capacities are shown for each specimen after the loaded displacement is more than 5 mm, and the cumulative energy dissipation curves of each specimen are rising straightly. However, the slope of cumulative energy dissipation curve in the late loading period is decreased significantly, thus indicating the obvious reduction in the energy dissipation capacity of the specimen, which is consistent with the cracking and crushing of the concrete in the hollow column at the late loading period and the loss of the energy dissipation capacity. (3) As shown in the comparison on the specimens with different dosage of plastic-steel fiber, the following can be obtained: ① the ultimate energy dissipation capacities of P0.4-3, P0.4-6 and P0.4-9 are improved by 5.3%, 43.7% and 6.4%, respectively, when compared with that of P0.4-0, thus indicating that 6 kg/m3 is the optimal dosage of plastic-steel fiber, which is consistent with the conclusions on the hysteretic curve and skeleton curve; ② the energy dissipation capacities of P0.4-0, P0.4-3 and P0.4-9 are the same basically under the same displacement, while that of P0.4-6 is improved significantly; (4) as shown in the comparison on the specimens with different dosages of steel fiber, the following can be obtained: ① The ultimate energy dissipation capacities of P0.4-0, S0.4-25, S0.4-50, and S0.4-75 are improved significantly by 88.9%, 125.8%, and 203.8%, respectively, when compared with that of SJ1, thus indicating that 75 kg/m3 is the optimal dosage of steel fiber, which is consistent with the conclusions on the skeleton curve; ② the energy dissipation of S0.4-75 is improved significantly, that of S0.4-50 is improved to a certain degree, and that of S0.4-25 is almost the same when compared with that of P0.4-0 under the same displacement; (5) as shown in the comparison between P0.4-6 and P0.6-6, we know that the high axial compression ratio can restrict the development of the crack to a certain extent at the early stage of the loading for the hollow column with a high axial compression ratio; therefore, the energy dissipation capacity is improved to some extent. However, the damage of the concrete is accumulated rapidly due to the second-order effect and other reasons at the late stage of loading, and the ductile energy dissipation is lower than that of the specimen with a low axial compression ratio. The decrease in the ultimate energy dissipation capacity of SJ8 reaches 42.6% when compared with that of P0.4-6; (5) as shown in the comparison between the plastic-steel fiber specimen and the steel fiber specimen, the energy dissipation capacity of steel fiber specimen is better, which is consistent with the conclusions on the hysteretic curve and skeleton curve.

7. Stiffness Degradation

Formula (2) is taken for the calculation of secant stiffness according to the literature [35].
K i = + P i + P i + Δ i + Δ i
In the formula, K i is the average secant stiffness of cycle i , p i is the peak load of cycle i , and Δ i is the peak displacement of cycle i .
As shown in the comparison on the stiffness of each specimen, the following can be obtained according to Figure 16, Figure 17 and Figure 18: (1) three stages are included basically for the stiffness degradation of each specimen: the stiffness degradation is linear with a larger slope when the loaded displacement is less than 5 mm. The stiffness degradation is in curve when the loaded displacement is larger than certain specific value, and the slope of tangent line of the curve is decreased significantly. The stiffness degradation is linear when the loaded displacement is larger than the specific value, and the slope of the straight line is reduced further. (2) As shown in the comparison on the plastic-steel fiber specimen, the incorporation of the plastic-steel fiber can make the degradation of the stiffness of the specimen more complete. The stiffness of P0.4-3, P0.4-6 and P0.4-9 at the failure is reduced by 24.8%, 39.4%, and 18.0%, respectively, when compared with that of the specimen P0.4-0, thus indicating that the existence of plastic-steel fiber can make the stiffness degradation of the specimen more complete, and the rules on the decreased stiffness of P0.4-3, P0.4-6 and P0.4-9 at the failure are consistent with those of the deformation and energy dissipation capacity of the specimen. (3) Similar to the specimen with plastic-steel fiber, the stiffness of steel fiber specimens S0.4-25, S0.4-50, and S0.4-75 at the failure is reduced by 29.7%, 45.7%, and 36.7%, respectively, when compared with that of P0.4-0. However, it is different from the plastic-steel fiber in that the stiffness degradation of the steel fiber specimen at the failure is more obvious. (4) As shown in the comparison on the specimens with different axial compression ratios, the stiffness degradation speed of the specimen P0.6-6 with a high axial compression ratio is faster, and the degradation curve is linear basically, which is different from three stages of stiffness degradation for other specimens.

8. Calculation of Shear Capacity

Compared with the solid column, the shear capacity of the hollow column is reduced by the weakened hollow section. Therefore, it is crucial to calculate the shear capacity of the hollow column. The calculation formula of shear capacity of solid column has been prescribed in the Design Code for Concrete structure of China [36]. Concerning the hollow component, the shear force is distributed in the web basically and the bending moment is mainly borne by the flange wall. Therefore, it can be said that only the concrete with the web makes a contribution to the shear capacity of the hollow column with a circular hollow section, the contribution of the flange wall is ignored, and other contributions remain unchanged. The effective shear area is proposed for the application of the hollow column, and that of the hollow section can be shown in Figure 19. The effective shear area proposed according to Figure 17 is A1 as shown in Formula (3).
ϕ = b 1 h 1 b h
A 1 = ( b b 1 ) h 0 = b h 0 b 1 h 0
In the formula, Ø is the hollow rate, h1 is the height of the hollow section, b1 is the width of the hollow section, h is the height of column section, b is the width of the column, and h0 is the effective height.
The following can be obtained from the combination of Formulas (3) and (4):
A 1 = b b h h 1 ϕ h 0 = 1 h h 1 ϕ b h 0
k = 1 h h 1 ϕ
The concrete of the flange of the hollow column with a circular hollow section is reduced, and the effective shear area is reduced; therefore, the reduction coefficient Ki is introduced in the formula of the shear capacity of the hollow column. From the test data of this paper, the reduction coefficient K1 of the specimen mixed with plastic-steel fiber is 0.975.
The formula of the modified circular hollow column is shown in Formula (7):
V P l a s t i c   s t e e l   f i b e r = 1.706 k λ + 1 f t b h 0 + f y v A S V S h 0 + 0.07 N
As shown in Table 8, the dimensions are the test results and formula calculation results. The standard deviation between the experimental value and the calculated value is 0.071, thus indicating that the calculated results are consistent with the experimental values and it can be used as a reference for practical engineering.

9. Conclusions

The quasi-static test of eight hollow columns with fiber lightweight aggregate concrete under lateral low-cycle reversed loading and axial force is designed and carried out in this paper, and the following conclusions could be obtained from the experimental study.
(a)
The failure mode of a concrete hollow column cannot be changed by the lightweight aggregate concrete with fiber. The failure of the specimen with plastic-steel fiber is changed from bending-shear failure to shear failure along with the increase in axial compression ratio.
(b)
The incorporation of the fiber has little effect on capacity under the lateral load of a hollow column, while it can improve the ductile energy dissipation capacity significantly. The ductile energy dissipation is increased by 44% for the plastic-steel fiber (6 kg/m3), and that for the steel fiber (75 kg/m3) is 204%, thus delaying the stiffness degradation of the specimen effectively. The increase in the axial compression ratio can improve the capacity under the lateral load of a hollow column and increase the stiffness degradation rate, while reducing the ductile energy dissipation of a hollow column greatly. Adding more than 6 kg/m3 of plastic-steel fibers does not improve the energy dissipation capacity nor ductility.
(c)
Compared with the no-fiber specimens, the increase in ductility for the specimen with plastic-steel fiber is 11~33.7% and that with steel fiber is 30.8~125.7%; the increase in cumulative energy dissipation for the specimen with plastic-steel fiber is 5.3~43.7%, and that with steel fiber is 88.9~203.8%, thus indicating that the incorporation of fiber can improve the seismic performance of specimen effectively.
(d)
The shear formula for a hollow column with fiber-reinforced lightweight aggregate concrete is proposed, and the calculation results are smaller than the experimental values, thus it is reliable in practical engineering applications.

Author Contributions

Conceptualization, J.W. and J.-G.N.; methodology, Y.X.; software, J.W.; validation, J.W., Z.-H.X. and J.-G.N..; formal analysis, Z.-H.X.; investigation, J.W.; resources, Y.X.; data curation, Z.-H.X.; writing—original draft preparation, J.W.; writing—review and editing, Y.X.; visualization, J.-G.N.; supervision, Z.-H.X.; project administration, J.-G.N.; funding acquisition, J.-G.N. All authors have read and agreed to the published version of the manuscript.

Funding

This research was funded by the National Natural Science Foundation of China (No. 51968058), Natural Science Foundation of Inner Mongolia Autonomous Region of China (No. 2021MS05012), Inner Mongolia Autonomous Region Youth Science and Technology Talent Support Program (No. NJYT-18-A06), and Foundation of Institute of Architectural Science, Inner Mongolia University of Science and Technology (No. JYSJJ-2021M16).

Conflicts of Interest

The authors declare no conflict of interest.

References

  1. Yingxiong, W.; Jing, H.; Shuzhi, L. Design and application status of seismic isolation constitution of building. J. China Civ. Eng. J. 2018, 51, 62–73+94. [Google Scholar]
  2. Saiful Islam, A.B.M.; Mohammed, J.; Mohd, Z.J. Seismic isolation in buildings to be a practical reality: Behavior of structure and installation technique. J. Eng. Technol. Res. 2011, 3, 99–117. [Google Scholar]
  3. Junxian, Z.; Bin, W.; Jinping, O. A novel type of angle steel buckling-restrained brace: Cyclic behavior and failure mechanism. Earthq. Eng. Struct. Dyn. 2011, 40, 1083–1102. [Google Scholar]
  4. Shen, J.; Seker, O.; Akbas, B.; Seker, P. Seismic performance of concentrically braced frames with and without brace buckling. Eng. Struct. 2017, 141, 461–481. [Google Scholar] [CrossRef]
  5. Seyed Saman, K.D.; Armin, M.; Seyed Sasan, K.D. Application of VD-LRBP system for bridges in seismic zones. In Active and Passive Smart Structures and Integrated Systems XVI. SPIE 2022, 12043, 44–52. [Google Scholar] [CrossRef]
  6. Wang, C.L.; Chen, Q.; Zeng, B.; Meng, S.P. A novel brace with partial buckling restraint: An experimental and numerical investigation. Eng. Struct. 2017, 150, 190–202. [Google Scholar] [CrossRef]
  7. Xu, L.H.; Xie, X.S.; Li, Z.X. Development and experimental study of a self-centering variable damping energy dissipation brace. Eng. Struct. 2018, 160, 270–280. [Google Scholar] [CrossRef]
  8. Chen, L.; Xu, F.; Min, Y.; Wang, M.H.; Hu, W. Transient energy dissipation of resistances and its effect on power system damping. Int. J. Electr. Power Energy Syst. 2017, 91, 201–208. [Google Scholar] [CrossRef]
  9. Izadi, M.; Sanyal, A.K.; Barany, E.; Viswanathan, S.P. Rigid Body Motion Estimation based on the Lagrange-d’Alembert Principle. In Proceedings of the 2015 54th IEEE Conference on Decision and Control (CDC), Osaka, Japan, 15–18 December 2015; pp. 3699–3704. [Google Scholar]
  10. Bhatt, M.; Sukumar, S.; Sanyal, A.K. Discrete-Time Rigid Body Pose Estimation Based on Lagrange-d’Alembert Principle. J. Nonlinear Sci. 2022, 32, 86. [Google Scholar] [CrossRef]
  11. Hassanpour, M.; Shafigh, P.; Bin, M.H. Lightweight aggregate concrete fiber reinforcement-A review. Constr. Build. Mater. 2013, 37, 452–461. [Google Scholar] [CrossRef]
  12. Aksoylu, C.; Ozkilic, Y.O.; Madenci, E. Compressive Behavior of Pultruded GFRP Boxes with Concentric Openings Strengthened by Different Composite Wrappings. Polymers 2022, 14, 4095. [Google Scholar] [CrossRef] [PubMed]
  13. Ozkilic, Y.O.; Aksoylu, C.; Yazman, S. Behavior of CFRP-strengthened RC beams with circular web openings in shear zones: Numerical study. Structures 2022, 41, 1369–1389. [Google Scholar] [CrossRef]
  14. João, A.; Marcos, V.A. Mechanical properties of polymer-modified lightweight aggregate concrete. Cem. Concr. Res. 2002, 32, 329–334. [Google Scholar]
  15. Mo, K.H.; Ling, T.C.; Alengaram, U.J.; Yap, S.P.; Yuen, C.W. Overview of supplementary cementitious materials usage in lightweight aggregate concrete. Constr. Build. Mater. 2017, 139, 403–418. [Google Scholar] [CrossRef]
  16. Ceyhun, A.; Yasin, O.Ö.; Marijana, H.N. Investigation on Improvement in Shear Performance of Reinforced-Concrete Beams Produced with Recycled Steel Wires from Waste Tires. Sustainability 2022, 14, 13360. [Google Scholar]
  17. Karalar, M.; Ozkilic, Y.O.; Deifalla, A.F. Improvement in Bending Performance of Reinforced Concrete Beams Produced with Waste Lathe Scraps. Sustainability 2022, 14, 12660. [Google Scholar] [CrossRef]
  18. Ozkilic, Y.O.; Aksoylu, C.; Arslan, M.H. Numerical evaluation of effects of shear span, stirrup spacing and angle of stirrup on reinforced concrete beam behaviour. Struct. Eng. Mech. 2021, 79, 309–326. [Google Scholar]
  19. Ozkilic, Y.O.; Aksoylu, C.; Arslan, M.H. Experimental and numerical investigations of steel fiber reinforced concrete dapped-end purlins. J. Build. Eng. 2021, 36, 102119. [Google Scholar] [CrossRef]
  20. Zarrinpour, M.R.; Chao, S.H. Shear Strength Enhancement Mechanisms of Steel Fiber-Reinforced Concrete Slender Beams. ACI Struct. J. 2017, 114, 729–742. [Google Scholar] [CrossRef]
  21. Tarawneh, A.; Almasabha, G.; Alawadi, R.; Tarawneh, M. Innovative and reliable model for shear strength of steel fibers reinforced concrete beams. Structures 2021, 32, 1015–1025. [Google Scholar] [CrossRef]
  22. Germano, F.; Tiberti, G.; Plizzari, G. Experimental behavior of SFRC columns under uniaxial and biaxial cyclic loads. Compos. Part B Eng. 2016, 85, 76–92. [Google Scholar] [CrossRef]
  23. Aksoylu, C.; Yazman, S.; Ozkilic, Y.O.; Gemi, L. Experimental analysis of reinforced concrete shear deficient beams with circular web openings strengthened by CFRP composite. Compos. Struct. 2020, 249, 112561. [Google Scholar] [CrossRef]
  24. Hernandez-Montes, E.; Carbonell-Marquez, J.F.; Gil-Martin, L.M. The energy-balanced hysteretic curve for dynamic loading. Eng. Struct. 2021, 229, 111600. [Google Scholar] [CrossRef]
  25. Pasha, A.Y.; Khoshghalb, A.; Khalili, N. Hysteretic Model for the Evolution of Water Retention Curve with Void Ratio. J. Eng. Mech. 2017, 143, 103536. [Google Scholar] [CrossRef]
  26. Xu, S.; Chen, Z.H.; Wang, X.D.; Mazzolani, F.M. Hysteretic out-of-plane behavior of the Temcor joint. Thin-Walled Struct. 2015, 94, 585–592. [Google Scholar] [CrossRef]
  27. Zhang, X.Y.; Zhou, Y.H.; Zhou, J. Experimental observation of a crossing in the force-displacement hysteretic curve of a melt processed YBaCuO bulk superconductor. Phys. C Supercond. 2008, 468, 369–373. [Google Scholar] [CrossRef]
  28. Huihui, Y.; Qingxiong, W.; Baochun, C.; Huixiong, C. Calculation method of load-displacement skeleton curve for uniform sectional CFST lattice column with flat lacing tube. Eng. Mech. 2016, 33, 206–216. [Google Scholar]
  29. Song, Z.K.; Yu, F.; Zhang, N.N.; Fang, Y. A model for predicting load-displacement hysteretic behavior of PVC-CFRP confined concrete column-ring beam interior joints under low cyclic loading. Compos. Struct. 2021, 265. [Google Scholar] [CrossRef]
  30. Ying, M.; Qin, Z.; Jinxin, G. Skeleton curves of restoring force model of reinforced concrete columns failed in flexure-shear. J. Build. Struct. 2012, 33, 116–125. [Google Scholar]
  31. Hui, M.; Jianyang, X.; Xicheng, Z.; Daming, L. Seismic performance of steel-reinforced recycled concrete columns under low cyclic loads. Constr. Build. Mater. 2013, 48, 229–237. [Google Scholar]
  32. Symans, M.D.; Charney, F.A.; Whittaker, A.S. Energy dissipation systems for seismic applications: Current practice and recent developments. J. Struct. Eng. 2008, 134, 3–21. [Google Scholar] [CrossRef] [Green Version]
  33. Erberik, A.; Sucuoglu, H. Seismic energy dissipation in deteriorating systems through low-cycle fatigue. Earthq. Eng. Struct. Dyn. 2003, 33, 49–67. [Google Scholar] [CrossRef]
  34. Bilondi, M.R.S.; Yazdani, H.; Khatibinia, M. Seismic energy dissipation-based optimum design of tuned mass dampers. Struct. Multidiscip. Optim. 2018, 22, 2517–2531. [Google Scholar] [CrossRef]
  35. Yu, H.; Zuozhou, Z.; Xiaogang, H.; Xiaodong, J.; Jiaru, Q. Study on Seismic behavior of reinforced concrete frame-Core Tube structure. Eng. Mech. 2014, 31, 59–64+72. (In Chinese) [Google Scholar]
  36. GB 50010—2002[S]; Design Code for Concrete Structure of China. Construction Industry Press: Beijing, China, 2002.
Figure 1. Column reinforcement and section reinforcement diagram.
Buildings 12 02164 g001
Figure 2. Gravel-type shale ceramsite.
Buildings 12 02164 g002
Figure 3. Fiber object.
Buildings 12 02164 g003
Figure 4. Test loading device.
Buildings 12 02164 g004
Figure 5. The layout of strain gauge and displacement meter.
Buildings 12 02164 g005
Figure 6. Loading history.
Buildings 12 02164 g006
Figure 7. Failure mode of specimens.
Buildings 12 02164 g007
Figure 8. Hysteretic curves of hollow column specimens with fiber lightweight aggregate concrete.
Buildings 12 02164 g008
Figure 9. Skeleton curves of plastic-steel fiber specimen.
Buildings 12 02164 g009
Figure 10. Skeleton curves of steel fiber specimen.
Buildings 12 02164 g010
Figure 11. Skeleton curves of specimens with different axial compression ratios.
Buildings 12 02164 g011
Figure 12. The meaning of each parameter of cumulative energy consumption.
Buildings 12 02164 g012
Figure 13. Comparison of cumulative energy consumption of plastic-steel fiber specimens.
Buildings 12 02164 g013
Figure 14. Comparison of cumulative energy consumption of steel fiber specimens.
Buildings 12 02164 g014
Figure 15. Comparison of cumulative energy consumption of specimens with different axial compression ratios.
Buildings 12 02164 g015
Figure 16. Comparison of stiffness degradation of plastic-steel fiber specimens.
Buildings 12 02164 g016
Figure 17. Comparison of stiffness degradation of steel fiber specimens.
Buildings 12 02164 g017
Figure 18. Comparison of stiffness degradation of specimens with a different axial compression ratio.
Buildings 12 02164 g018
Figure 19. Schematic diagram of effective shear area.
Buildings 12 02164 g019
Table 1. Specimen design.
Specimen No.Axial Compression RatioPlastic-Steel Fiber Dosage Kg/m3Steel Fiber Dosage Kg/m3
P0.4-00.400
P0.4-30.430
P0.4-60.460
P0.4-90.490
S0.4-250.4025
S0.4-500.4050
S0.4-750.4075
P0.6-60.660
Note: S stands for steel fiber and P stands for plastic-steel fiber, such as P0.4-0, which represents that the hollow column with plastic-steel fiber lightweight aggregate concrete is taken with the axial compression ratio of 0.4 and plastic-steel fiber dosage of 0 Kg, and S0.4-25, which represents that the hollow column with steel fiber lightweight aggregate concrete is taken with the axial compression ratio of 0.4 and steel fiber dosage of 25 Kg.
Table 2. Physical and mechanical indexes of crushed shale ceramsite.
Grain ShapeD/mmP/MPaρ1/(kg/m3)ρ2/(kg/m3)ω/%
Stone shape5~206.314577925.3
Note: D is the grain diameter; P is the compressive strength of concrete cylinder; ρ1 is the apparent density; ρ2 is the bulk density; ω is the 1 h water absorption rate.
Table 3. Physical and mechanical indexes of plastic-steel fiber.
l(mm)d/(mm)Ρ/(g/cm3)f/(MPa)E/(MPa)Δ/(%)
300.80.95530988415
Note: l is the fiber length; d is the fiber diameter; ρ is the fiber density; f is the tensile strength; E is the modulus of elasticity; Δ is the elongation.
Table 4. Physical and mechanical indexes of steel fiber.
l (mm)d/(mm)Ρ/(g/cm3)f/(MPa)E/(MPa)
3017.8611002 × 105
Table 5. Physical and mechanical indexes of steel bars.
Steel Bar Typed/mmfy/MPafu/MPaEs/× 105 MPaΔ/%
HPB30084225282.0920
HRB4001615276462.0123
Table 6. Mix ratio of lightweight aggregate concrete.
WaterCementSandShale CeramiciteWater Reducer
1894735855867.09
Note: The mix ratio of concrete is shown in the table.
Table 7. Capacity under lateral load and displacement value of characteristic points of specimens.
No.Yield PointPeak Stress PointLimit PointDeformation
Py/kNΔy/mmPm/kNΔm/mmPu/kNΔu/mmμ = Δuy
P0.4-0126.94.97149.914.74129.822.394.51
P0.4-3134.85.10156.614.69132.825.575.01
P0.4-6142.94.97156.015.12118.329.976.03
P0.4-9135.75.66154.617.66127.325.984.60
S0.4-25140.05.93152.015.89132.635.025.9
S0.4-50137.64.64151.316.19127.838.128.22
S0.4-75143.04.51150.513.09130.845.9310.18
P0.6-6161.84.17193.313.40150.117.444.18
Table 8. Shear capacity of specimens.
Specimen No.fc (MPa)V+ (kN)V− (kN)V (kN)Modified FormulaV/Vcalculated
P0.4-030.96141.85−117.8129.83107.441.21
P0.4-332.14136.80−129.45133.13114.651.16
P0.4-632.16138.55−124.95131.75117.821.12
P0.4-931.30132.88−129.63131.26118.571.11
P0.6-632.16157.77−159.36158.57145.331.09
Publisher’s Note: MDPI stays neutral with regard to jurisdictional claims in published maps and institutional affiliations.

