Article

Flexural Behavior of Slabs with Different Anchorage Locations of Longitudinal Reinforcing Bars in a Composite Basement Wall Junction

1
Department of Architectural Engineering, Kyonggi University, Suwon 16227, Kyonggi-Do, Republic of Korea
2
School of Architecture, Sunchon National University, Suncheon 57922, Jeollanam-Do, Republic of Korea
3
Korea Disaster Prevention Safety Technology Co., Ltd., Gwangju 58309, Jeollanam-Do, Republic of Korea
*
Authors to whom correspondence should be addressed.
Buildings 2023, 13(7), 1775; https://doi.org/10.3390/buildings13071775
Submission received: 31 May 2023 / Revised: 30 June 2023 / Accepted: 10 July 2023 / Published: 12 July 2023
(This article belongs to the Special Issue High-Performance Concrete Structures for Disaster Prevention)

Abstract

:
Although the anchorage location of longitudinal reinforcing bars is a significant design element for flexural behavior, the conventional anchorage method of using longitudinal reinforcing bars has limited applications in new types of structures, such as composite structures. Therefore, this study examined the effect of the anchorage location of longitudinal reinforcing bars on the flexural behavior of slabs at the junctions of developed composite basement walls (SCBW) under monotonic loads at the top free end of the slab. The test results showed that the slab with longitudinal reinforcing bars anchored to the cast-in-place pile (CIP) in the composite basement wall exhibited ductile behavior accompanied by the yielding of the longitudinal reinforcing bars, a relatively wide area of vertical cracks propagating along the slab length, and a plastic plateau flow in the load–deflection relationships. In particular, the slab with longitudinal reinforcing bars anchored to the basement wall experienced severe crack concentration localized at the junction of the composite basement walls and concrete spalling in the basement walls, which resulted in no yielding of the longitudinal reinforcing bars and no cracks in the slab. Consequently, in a slab, it is recommended that longitudinal reinforcing bars be anchored into the CIP by penetrating the steel plate.

1. Introduction

The anchorage of longitudinal reinforcing bars is a significant design element for flexural behavior [1,2]. An insufficient anchorage length of the longitudinal reinforcing bars can cause not only a reduced flexural moment but also a decrease in ductility [3]. Hence, ACI 318-19 [4] and EC 2 [5] specify the anchorage length of longitudinal reinforcing bars along the length of the flexural member or details of the 90° hook of the longitudinal reinforcing bars arranged in an axial member section. Robuschi et al. [6] reported that an adequate anchorage length of longitudinal reinforcing bars in reinforced concrete beams enables the development of 100% of their tensile stress, leading to ductile flexural behavior. Monney et al. [3] emphasized that a 90° hook is ideal for anchoring longitudinal reinforcing bars in members where sufficient anchorage length cannot be provided. However, although the 90° hook is the ideal method for anchoring longitudinal reinforcing bars, the location of the anchorage within a connection, such as at a beam-column or slab-column/wall junction, can be significantly affected by the flexural behavior [7]. Singhal et al. [7] emphasized that longitudinal reinforcing bars in flexural members must be anchored using a 90° hook that passes the centerline of the cross-section in columns or walls to obtain sufficient ductile behavior in the flexural members. Zhu et al. [8] emphasized that the slab-wall junction must be carefully designed, considering the low shear strength that results from the narrow wall section anchored by the longitudinal reinforcing bars of flexural members. Chalot et al. [9] demonstrated that an additional X-shaped FRP bar in a slab-wall junction can improve the joint’s ductility and energy dissipation capacity under cyclic loading. Wang et al. [10] reported that a new type of shear reinforcement at the anchorage location of the longitudinal reinforcing bars of a slab contributes to the ductile behavior of the slab. Liu et al. [11] confirmed that the conventional anchorage method is also suitable for obtaining sufficient flexural strength, ductility, and energy dissipation capacities of thick slab-wall joints in a new large-span slab-wall structure.
Stress transfer from concrete to a reinforcing bar through bonding is one of the most crucial parameters in the numerical analysis of RC structures [12,13,14]. The relative displacement between the concrete and the reinforcing bar, referred to as a slip, can result from cracks in the concrete near the reinforcing bar and contact slip on the reinforcing bar’s surface. Much attention has been devoted to the need for a simplification method for this complex interaction on the surface around the reinforcing bar without compromising the accuracy of the analysis. De Maio et al. [12,13] introduced an embedded truss model with a bond–slip relation contained in the CEB-FIP Model Code [14] and the contact interface between the reinforcing bar and the concrete, considering ribbed bars with good bond conditions. Several specific slip parameters were applied to allow for bond slips in the longitudinal direction of the reinforcing bar, and the analysis results were in good agreement with the experimental results. Rimkus et al. [15] performed a finite element analysis of RC beams based on the smeared crack approach, considering bond slips between concrete and a reinforcing bar. Their study found that the bond stress–slip model, when used in conjunction with the crack model, tended to replicate the de-bonding action, resulting in an overestimation of the crack’s width. Therefore, it was concluded that the perfect bonded contact between the concrete and the reinforcing bar was suitable for the bonding model of ordinary ribbed reinforcing bars.
Although the anchorage method of using longitudinal reinforcing bars has a significant effect on the flexural behavior of the beams or slabs, there have been very few studies on this topic with regard to the flexural behavior of composite basement walls. In particular, the studies mentioned above have only focused on the flexural behavior of conventional wall-slab junctions with conventional anchorage details of the longitudinal reinforcing bars of the slab, resulting in their limited application for new types of structures, such as composite structures. Jeon [16] emphasized that it is not easy to anchor the longitudinal reinforcing bars of the slab to the cast-in-place pile (CIP) sections of composite basement walls because the CIP is cast before the basement walls are constructed. Therefore, the longitudinal reinforcing bars of the slab in the slab composite basement wall (SCBW) may be improperly arranged, resulting in an insufficient anchorage length and inadequate shear reinforcement [10,11]. Insufficient anchorage length and shear reinforcement can also result in low shear capacity, leading to diagonal tension or splitting failures at the wall-slab junction. Hence, considering this weakness of the wall-slab junction, it is necessary to evaluate the effect of the anchorage method of using longitudinal reinforcing bars in the slab on the flexural behavior of the slab in composite basement walls.
This study examined the flexural behavior of slabs with different anchorage locations of longitudinal reinforcing bars at the junctions of developed composite basement walls. To investigate the effect of the anchorage location of the longitudinal reinforcing bars on the flexural behavior of the slab, flexural tests and finite element analysis (FEA) were conducted on the specimens, considering the details of the slab-composite basement junction. Two slab-composite basement wall specimens were prepared and applied to the top free end of the slab. The flexural behavior of the slab was evaluated based on the test results of the failure mode, the load–deflection relationships, and the deflection ductility ratio. In particular, the stress and strain behaviors of the steel plate for fixing an SSC used to join the CIPs and basement walls were investigated using FEA. In addition, to verify the stress transfer efficiency of the longitudinal reinforcing bars in the slab, the yield location of and variations in the stress and strain as the load increased were examined.

2. Research Significance

The test and FEA results regarding the effect of the anchorage location of longitudinal reinforcing bars on the flexural behavior of slabs at the junction of composite basement walls are valuable data for flexural design. The stable flexural and ductile behaviors of the longitudinal reinforcing bars of the slab anchored in the CIP were examined by analyzing the test results, including the failure mode, load–deflection relationships, and the deflection ductility ratio, as well as the FEA results that investigated the stress and strain of the steel plate used to fix the SSC and the longitudinal reinforcing bars. Specifically, this study provides findings that verify the stress transfer efficiency of longitudinal reinforcing bars in slabs with different anchorage locations at the junctions of composite basement walls.

3. Experimental Details
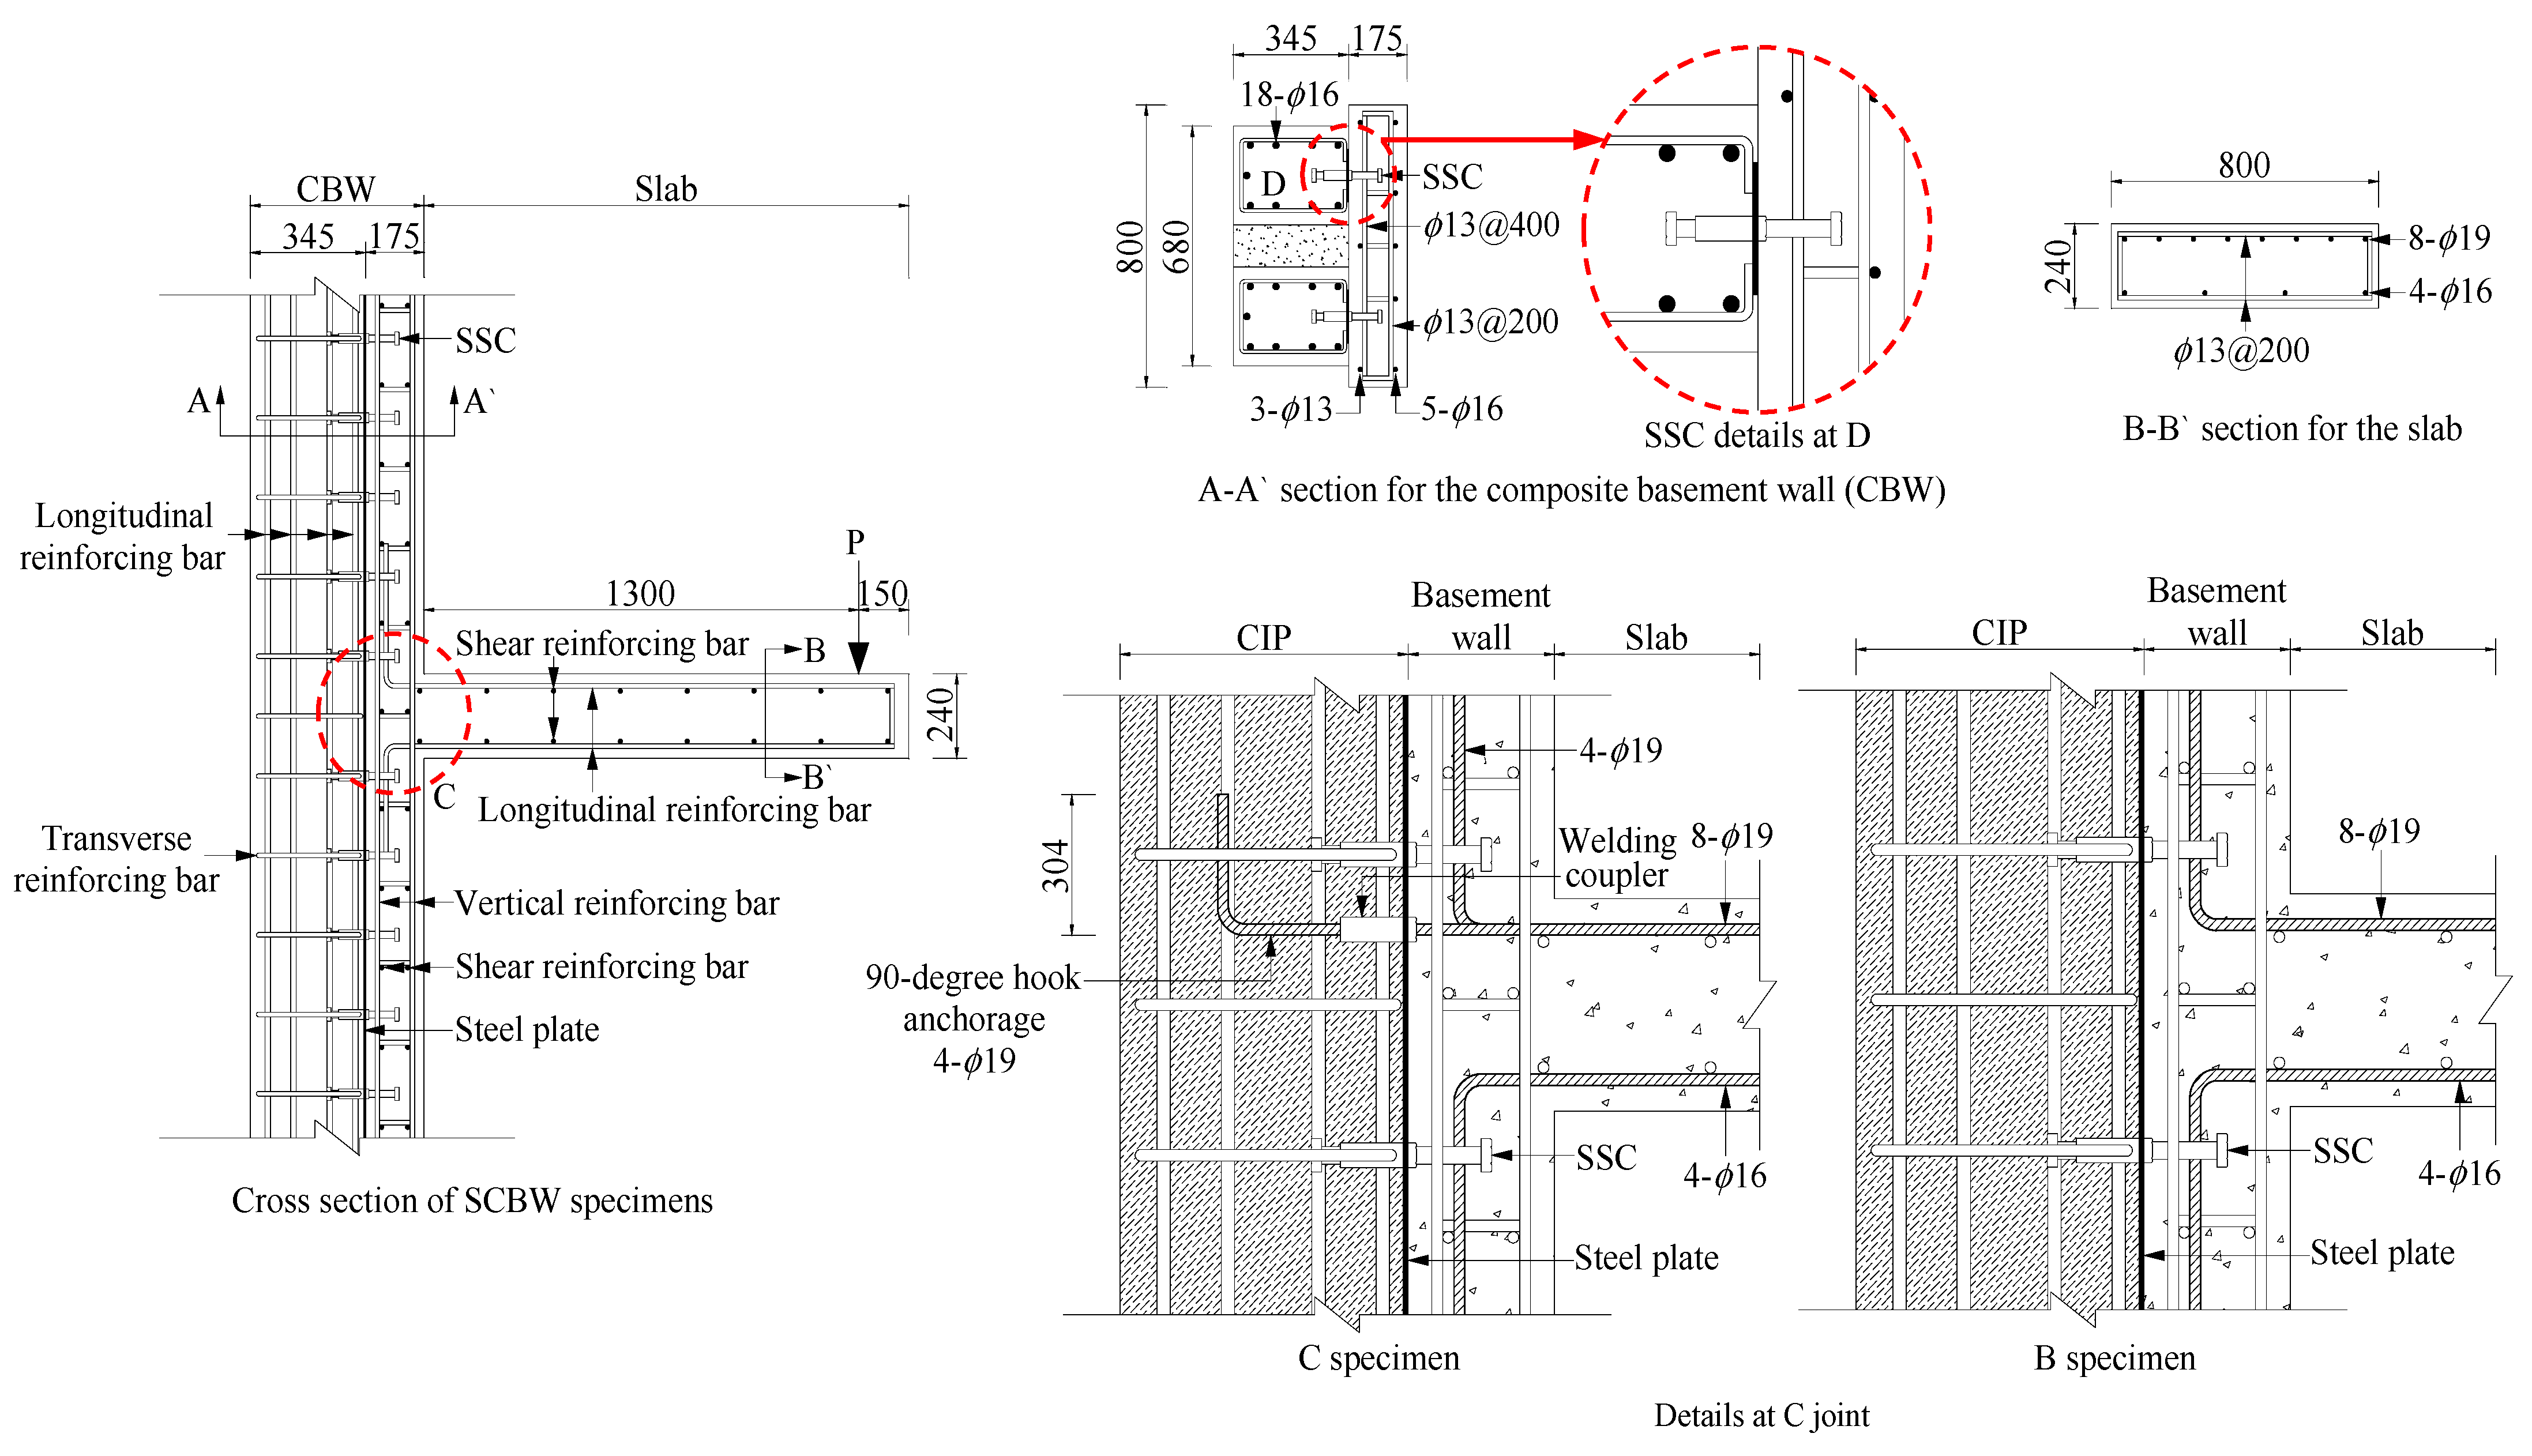
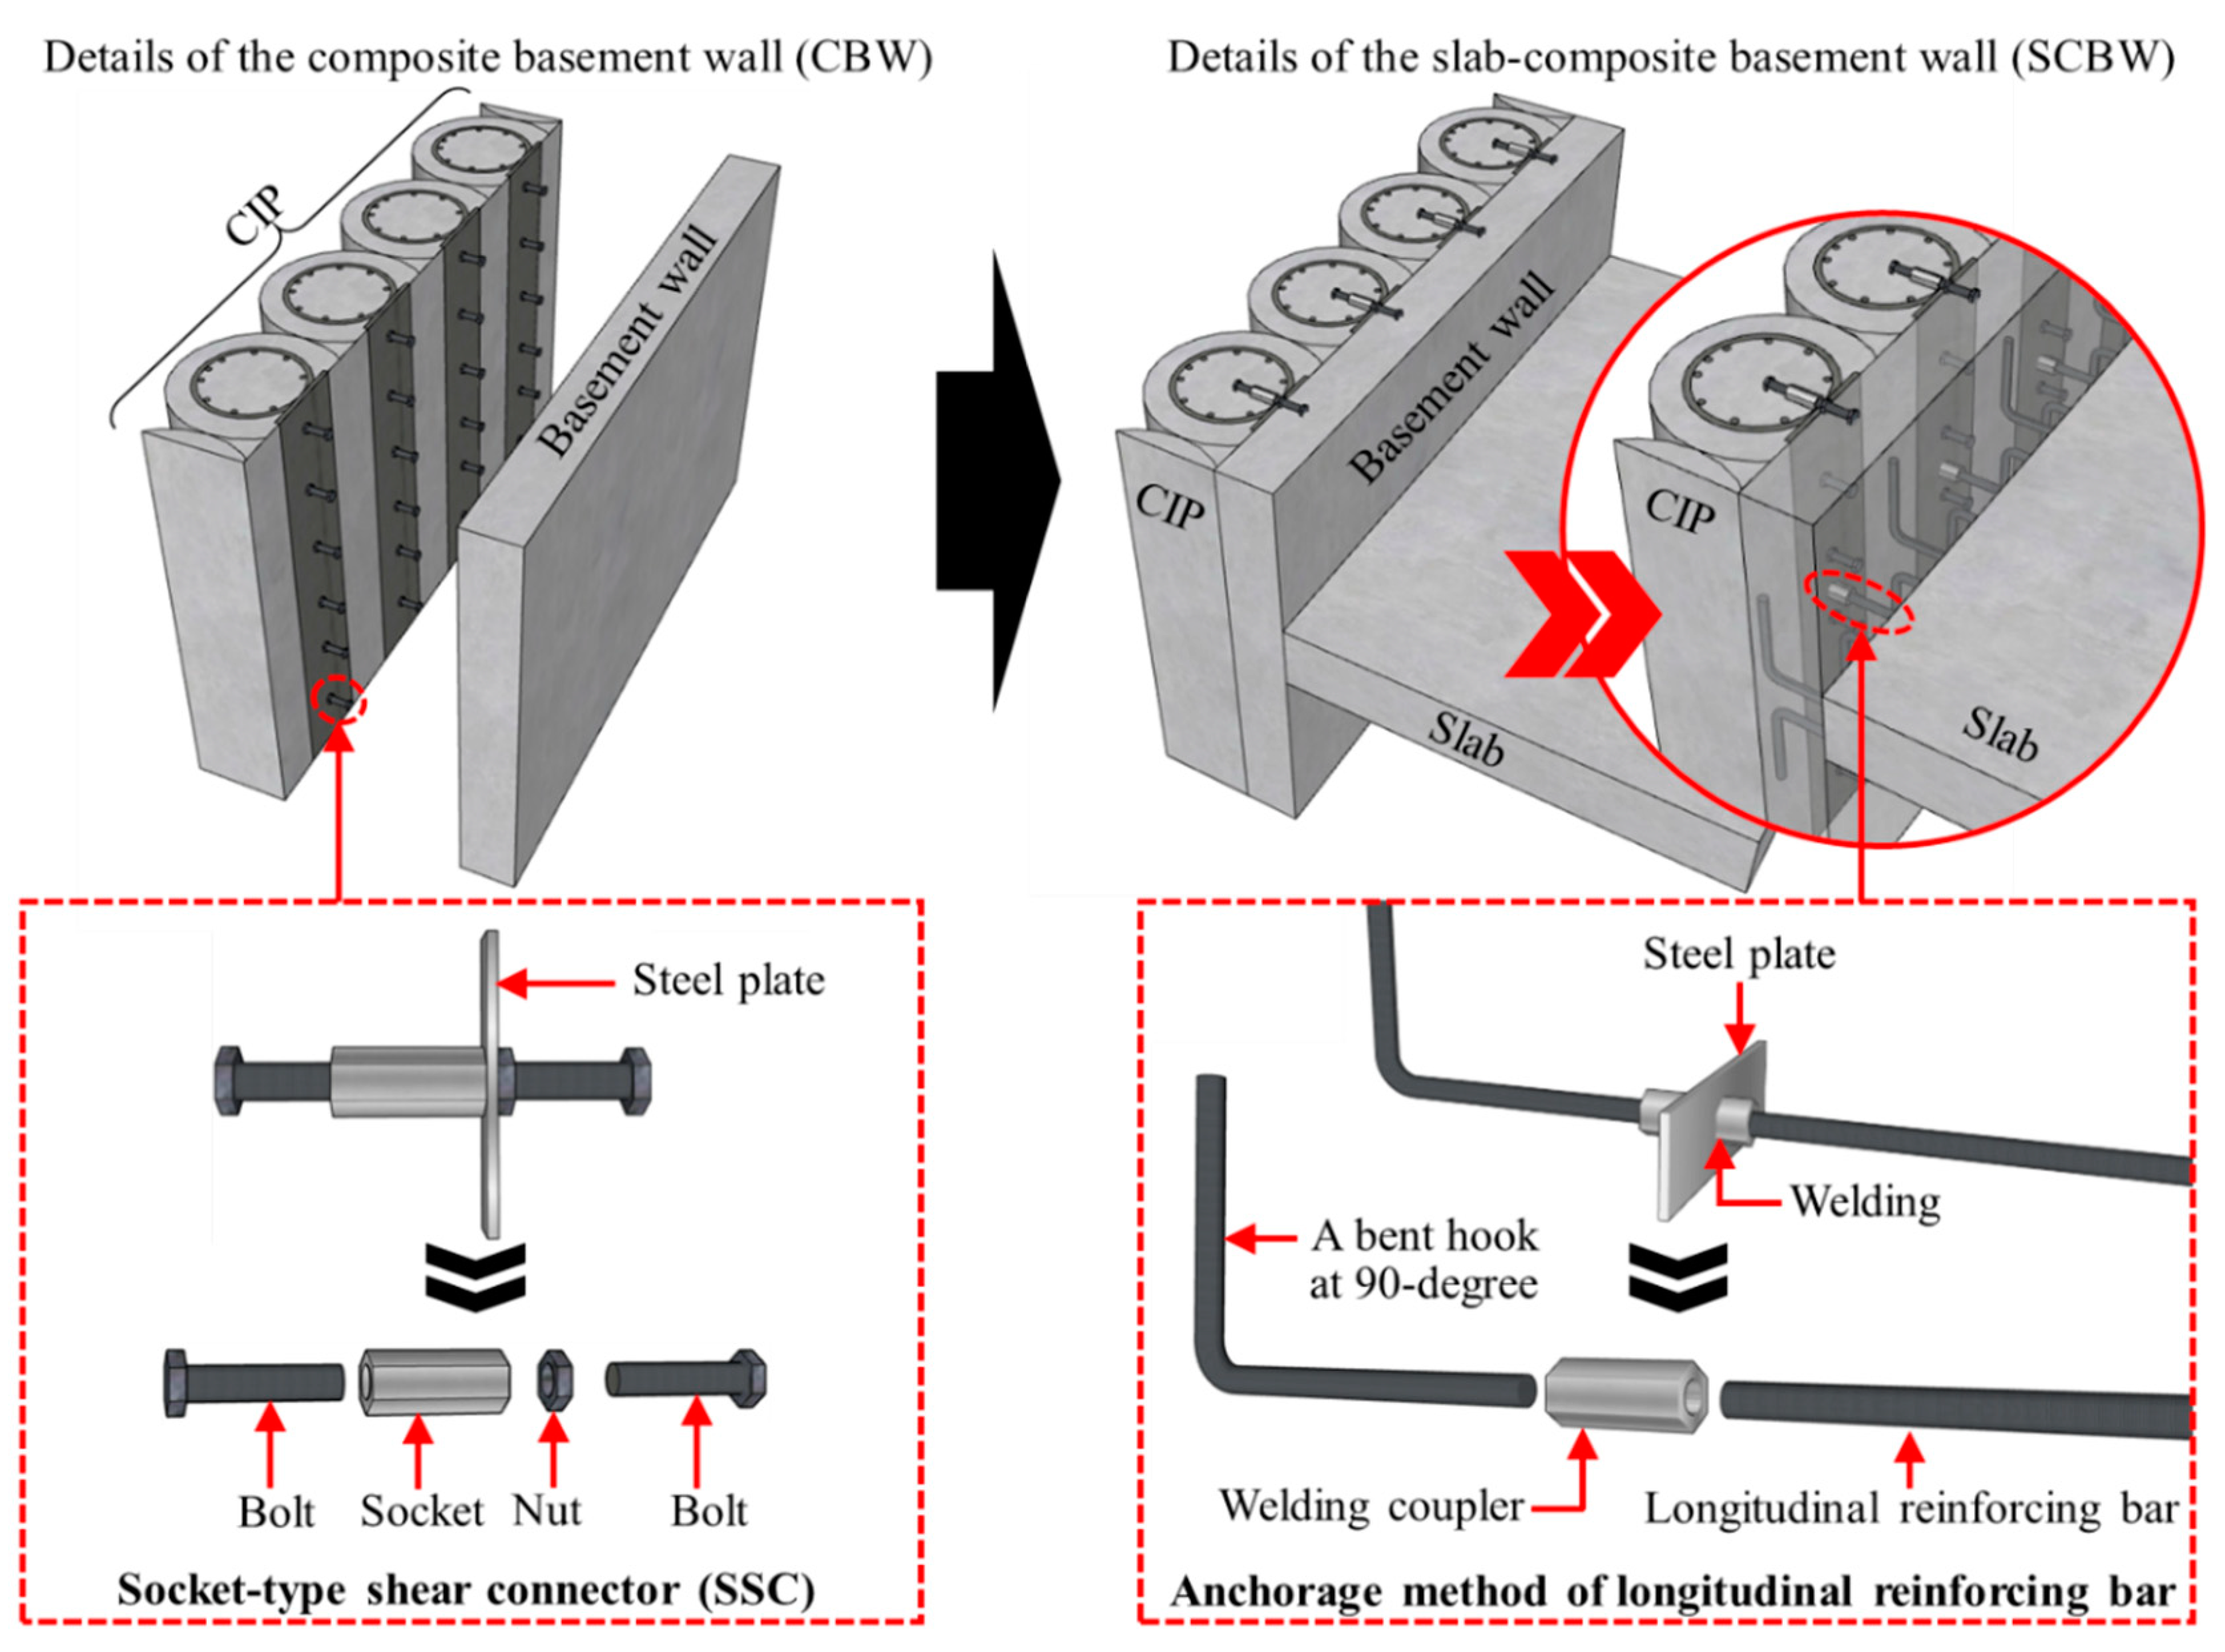
3.1. Test Specimens

A cast-in-place pile (CIP) is a temporary structural member constructed to form a retaining wall for excavation before the basement of a building is constructed. Therefore, the CIP is generally reinforced with H-beams or reinforcing bars to secure structural safety against the flexural moment and shear force caused by earth pressure. However, in this study, CIP and basement walls were synthesized and designed as a permanent structure to increase the effective basement area resulting from the decrease in the thickness of the cross-sectional basement wall. Figure 1 and Table 1 present the details of the slab composite basement wall (SCBW) specimens. Two SCBW specimens were prepared with different anchorage locations of longitudinal reinforcing bars arranged in the slab within the composite wall as the main parameters. In accordance with ACI 318-19 [4], longitudinal reinforcing bars of slabs with discontinuous ends must be anchored with 90° hooks across the center line of the slab-wall junction. In addition, to prevent the concrete splitting failure of the longitudinal reinforcing bars of slabs, the hook must be reinforced with stirrups at intervals of less than 3 d b , where d b is the diameter of the longitudinal reinforcing bar. However, stirrups were not placed on the hooks of the longitudinal reinforcing bars, to enable us to investigate the effect of the anchorage locations of the longitudinal reinforcing bars on the splitting failure resistance of concrete. The longitudinal reinforcing bars of the slab were anchored to the cast-in-place pile (Specimen C) or the basement wall (Specimen B) in the composite basement. To be anchored in the cast-in-place pile (CIP) for Specimen C, half of the longitudinal reinforcing bars penetrated a steel plate installed between the CIP and the basement wall and were then bent to a 90° hook inside the CIP; the remaining were bent to a 90° hook inside the basement wall (Figure 2). To anchor them to the basement wall of Specimen B, the longitudinal reinforcing bars were bent to a 90° hook inside the basement wall. As shown in Figure 2, in the SCBW specimens, the slab was designed in a conventional manner, whereas the composite basement wall was designed by compositing cast-in-place piles (CIPs) and reinforced concrete basement walls, which were connected using a socket-type shear connector (SSC) developed by Jeon [16].
The slab had a length equal to 1450 mm and a rectangular cross-section width B s l a b = 800 mm and thickness t s = 240 mm. Reinforcing bars with diameters of 19 and 16 mm were used as the longitudinal reinforcing bars of the slab, producing a longitudinal reinforcing bar ratio ( ρ s ) of 0.012. To prevent unpredictable shear failure in the slab, reinforcing bars with diameters of 13 mm were used as the shear reinforcement at 200 mm intervals, producing a shear reinforcing bar ratio of 0.005. The composite basement wall consisted of a CIP section with a cross-section width B C I P = 680 mm and a height D C I P = 345 mm and a basement wall section with a cross-section width B w a l l = 800 mm and a thickness t w = 175 mm. Longitudinal reinforcing bars with diameters of 16 mm were arranged in both the CIP and the basement walls. As shear reinforcing bars, the reinforcing bars with diameters of 13 mm were arranged transversely in the CIP section at 225 mm intervals. A steel plate was installed to fix the SSC used for compositing between the CIPs and the basement walls (Figure 2).

3.2. Material Properties
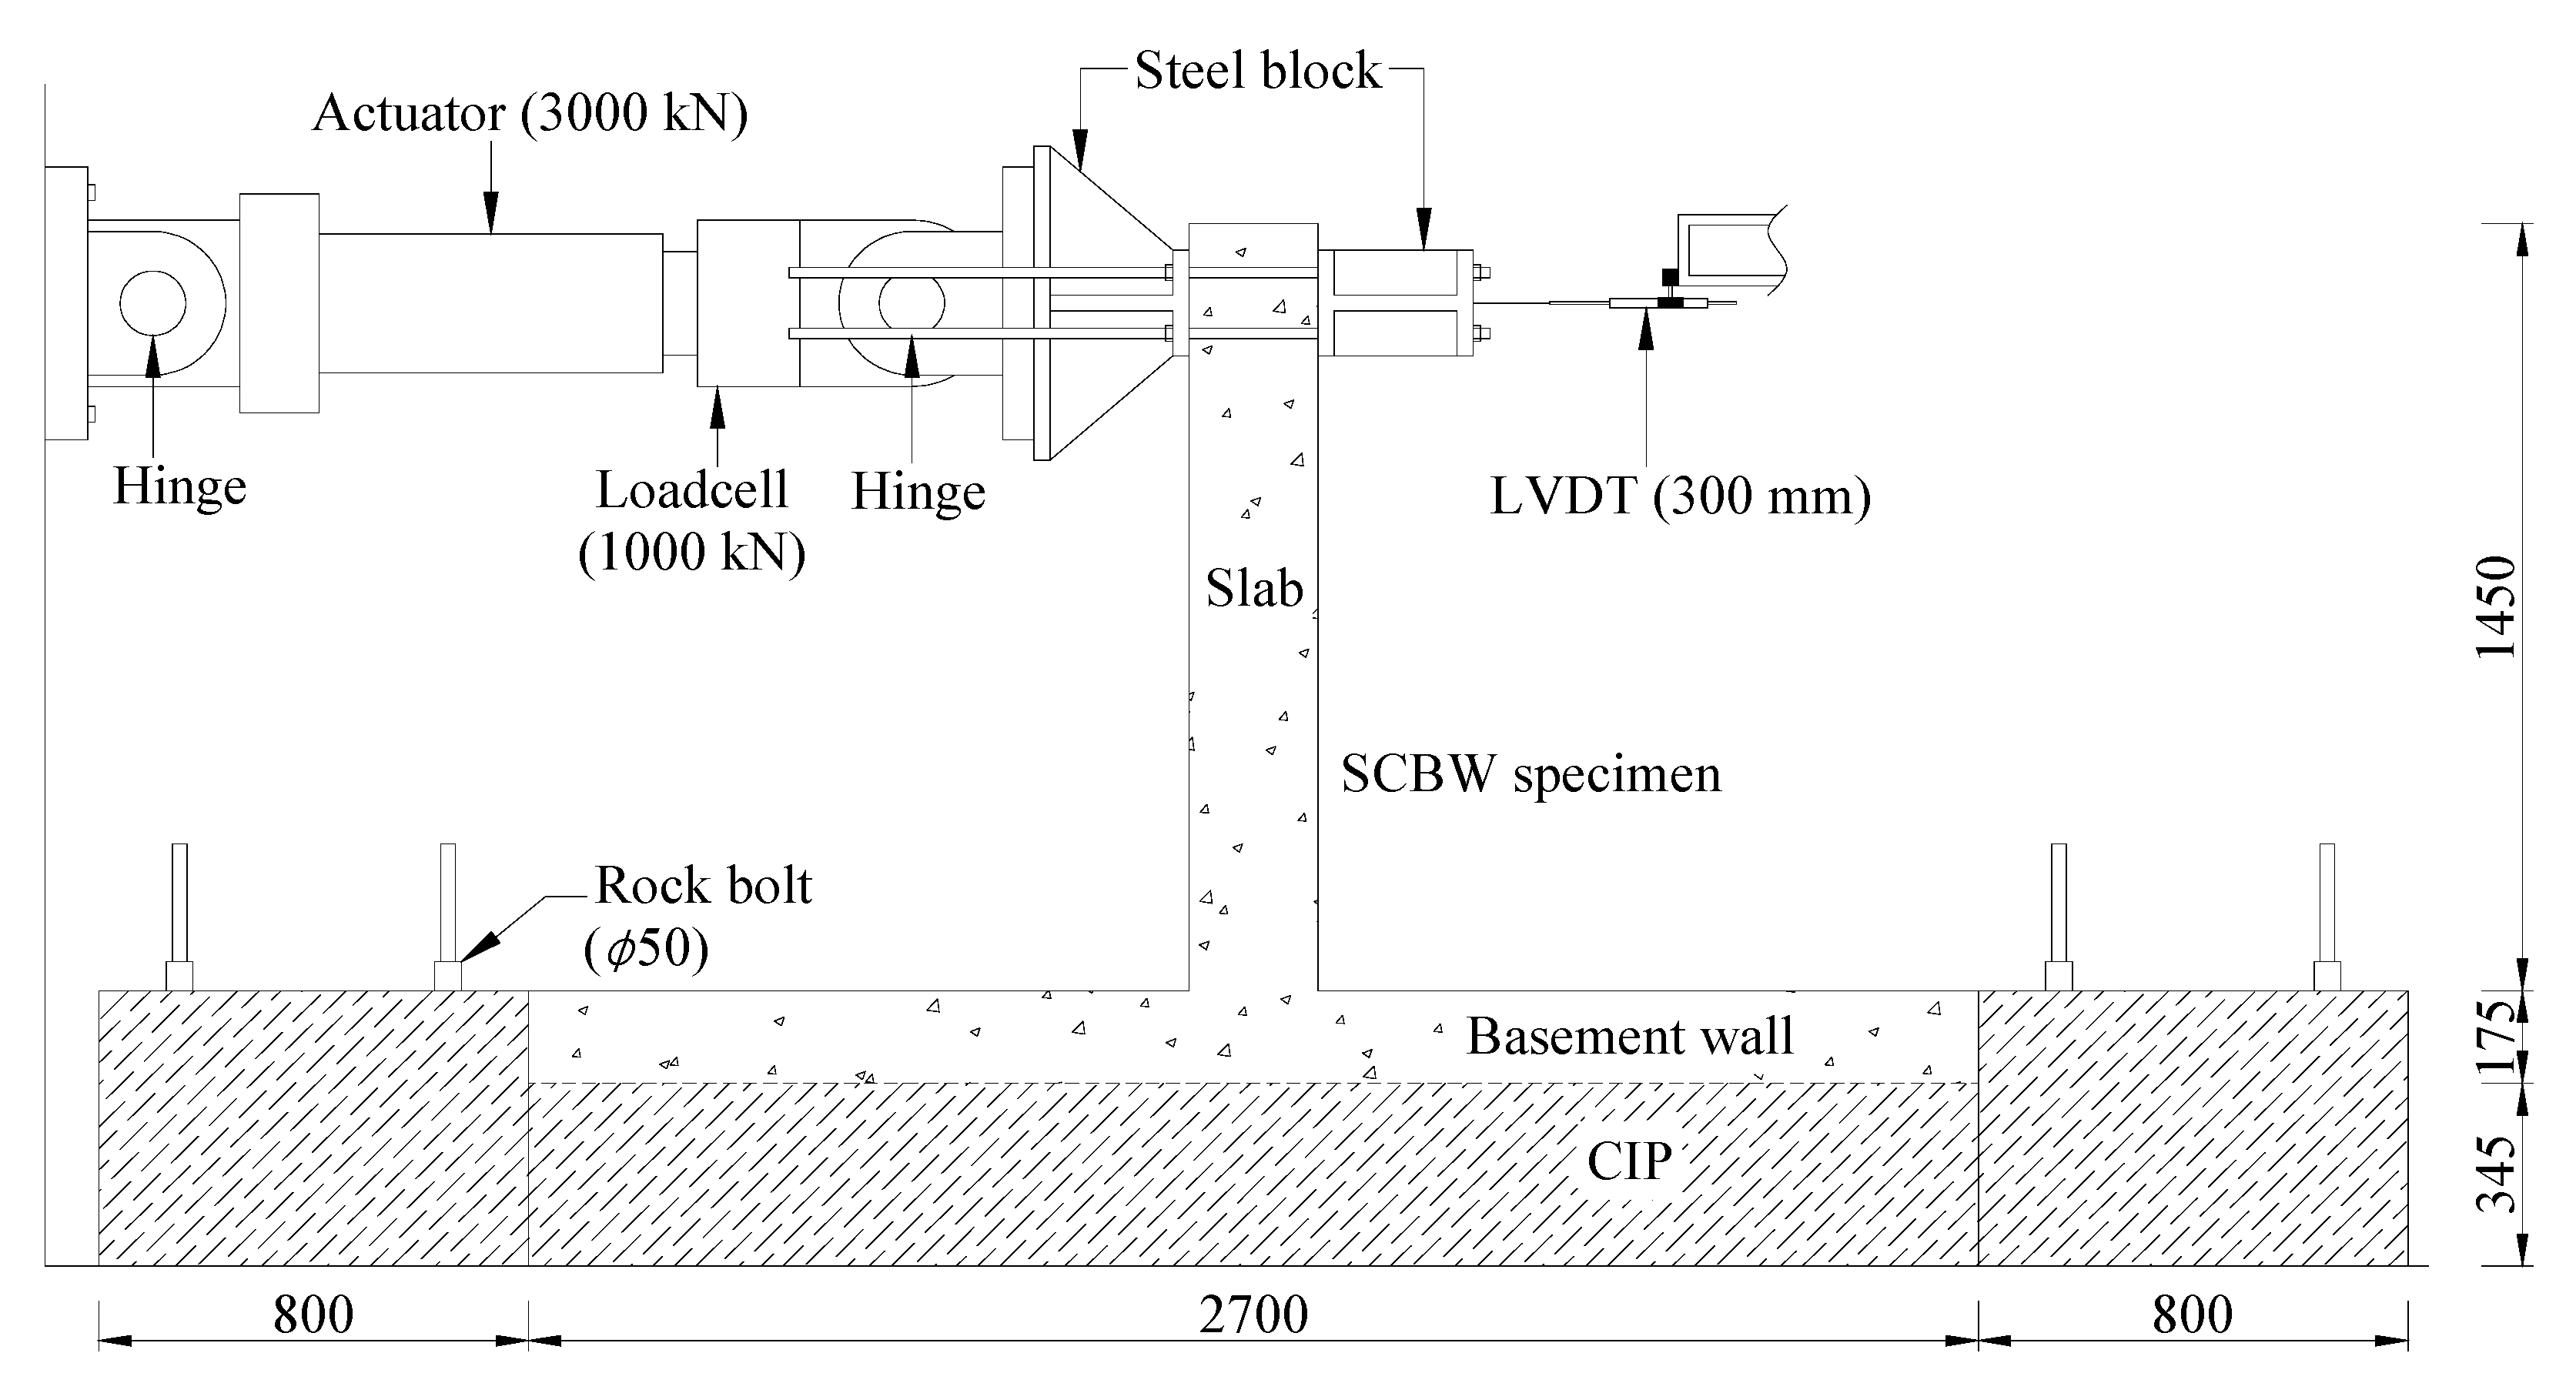
The designed compressive strength ( f c d ) values were 21 MPa for the CIP and 30 MPa for the basement wall and the slab. The measured compressive strength ( f c ) values were obtained according to ASTM C39 (2015); they were 20.79 MPa for the CIP and 32.16 MPa for the basement wall and the slab. Table 2 lists the mechanical properties of the reinforcing materials used in the SCBW specimens. The yielding strengths of the reinforcing bars with diameters of 13, 16, and 19 mm were greater than 400 MPa, and their elastic moduli were approximately 200,000 MPa. The yield strengths of the steel plate and SSC were 355 and 240 MPa, respectively.

3.3. Test Set-Up

Figure 3 shows the flexural test setup for the two SCBW specimens. In the SCBW specimens, the composite basement wall was fully fixed to the strong frame using the four rock bolts with a diameter of 50 mm. An actuator with a capacity of 3000 kN was used to apply top loading to the SCBW specimens. To reduce the effects of eccentric loads, a hinge assembly was installed on both sides of the actuator. A load cell with a capacity of 1000 kN was installed between the actuator and the hinge to record the variation in the load during the test. A linear variable displacement transducer was installed along the loading point to measure the deflection variation during the test.

4. Finite Element Analysis (FEA) Procedures
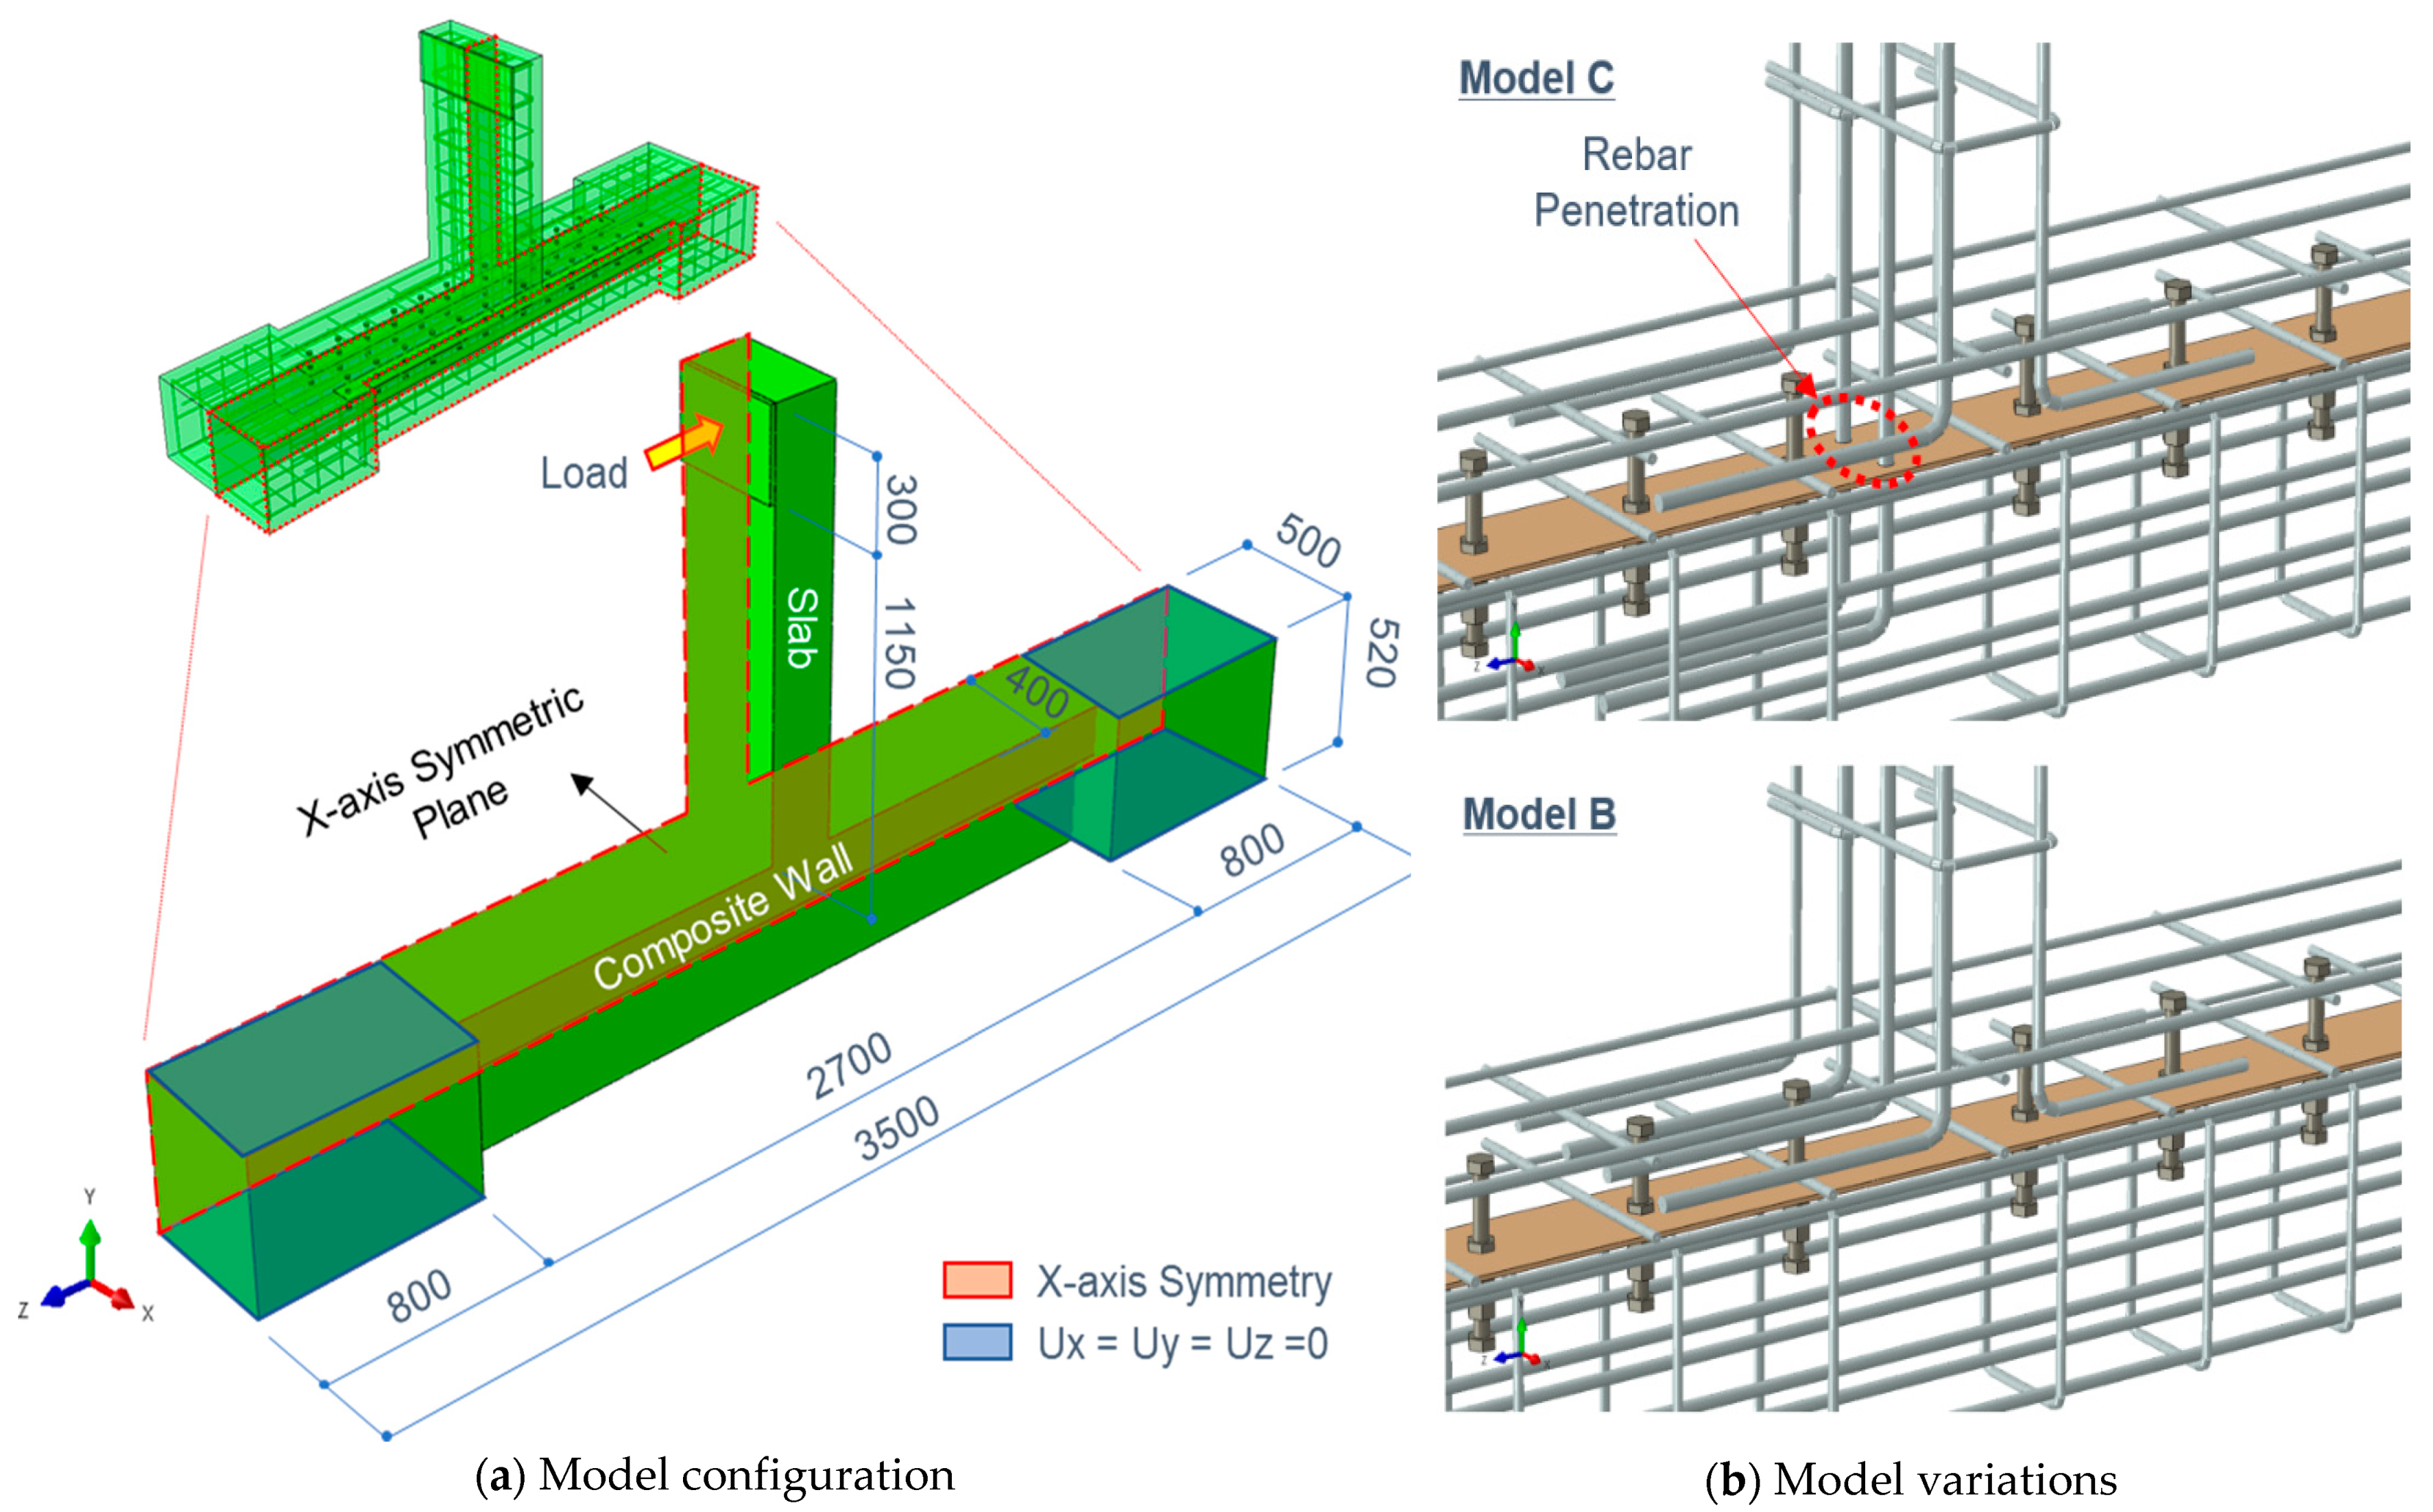
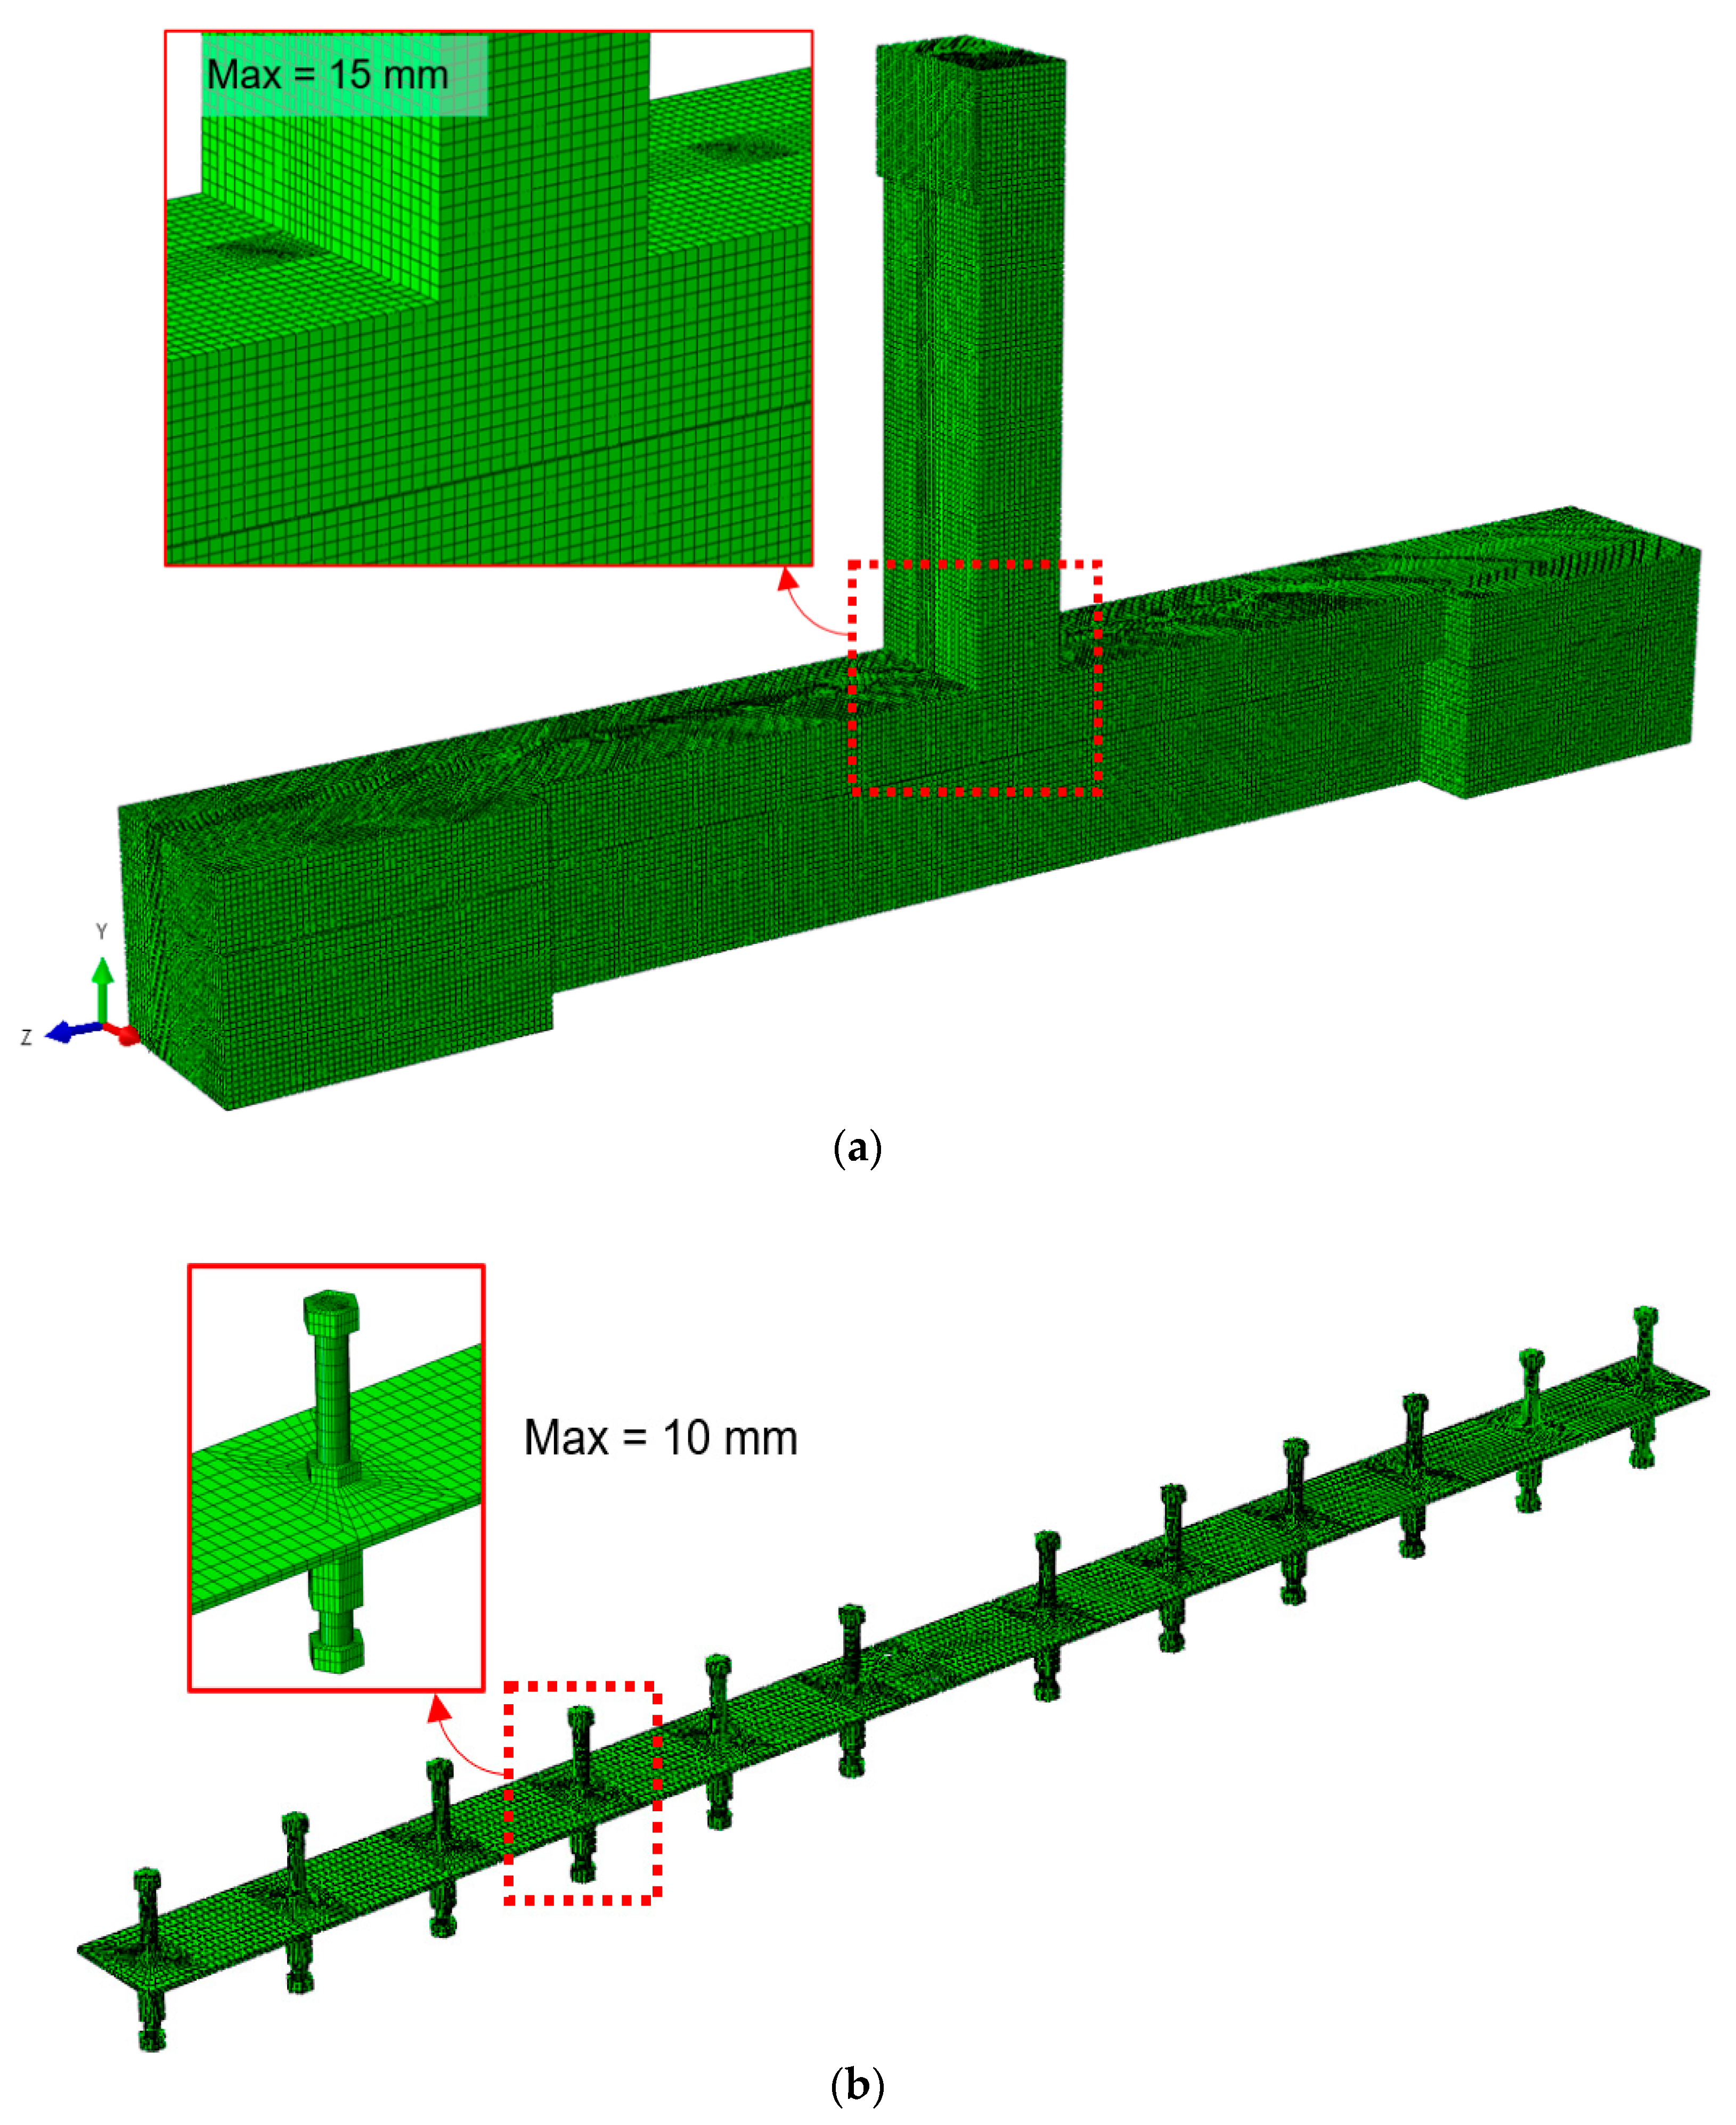
4.1. Modelling

The FEA procedures for the SCBW specimens using the ABAQUS program [17] and model variations are presented in Figure 4. The overall test configuration, specimens, boundary conditions, and loading were used to simulate the experimental tests. The models included all the structural components, including the CIP, basement wall, slab, steel plate, SSC, and reinforcing bars, that were used in the test specimens. Considering the symmetric nature of the shape and boundary conditions, only half of the specimens were modelled. Each model consisted of a half-width composite wall, and the slab was rotated by 90° such that the composite wall was positioned in the horizontal direction, while the slab was in the vertical direction. The displacements in all directions were restrained at both ends of the composite wall to reflect fixed support conditions. A displacement-based monotonic load was applied to the center of the loading plate located at the end of the slab. A symmetric boundary condition against the X direction was assigned by restraining the displacements in the Y and Z directions at the surface of the symmetry.
Two finite element models (Models C and B) were constructed corresponding to the testing program. Minor adjustments were made to Model C (Specimen C), whereas Model B (Specimen B) explicitly incorporated the structural components of Specimen B. In Specimen C, half of the longitudinal reinforcing bars in the slab were anchored to the CIP using a welding coupler, which was welded to a steel plate, with a 90° bent bar on the other side. Rather than introducing a welding coupler, longitudinal reinforcing bars with a 90° hook at the end were anchored to the CIP by simply penetrating the steel plate in the model.

4.2. Finite Elements and Types

The models employed a combination of solid (C3D8R) and truss elements (T3D2). The solid element is a three-dimensional brick element composed of eight nodes with six degrees of freedom (DOF) at each node; it was used for most of the models. The truss element used for the reinforcing bars was a one-dimensional beam element composed of two nodes, assuming only axial deformation. Owing to the accuracy and efficiency of the analysis, the finite element sizes were limited to 10–15 mm for the solid elements (Figure 5) and 20 mm for the truss element, based on the FEA results [18]. In particular, the overall mesh size was automatically granted within the limited size and with a minimum mesh size of about 3 mm using ABAQUS’s meshing option.

4.3. Interactions and Constraints

Because the model is composed of various structural components, contact surfaces are inevitably formed between them. Contact surfaces are expected in concrete-reinforcing bars, concrete–steel plates, concrete-SSCs, and steel plate-SSCs. For simplicity, the SSCs were considered fully tied to the steel plate, and there was no relative displacement between them at the connecting faces. The reinforcing bars were assumed to be placed within the concrete under perfect bonding conditions by adopting the embedding constraint option in ABAQUS [17]. Both tangential and normal behaviors at the contact surfaces between the concrete and steel plate with SSCs need to be considered. For the tangential behavior, a penalty method using Coulomb friction was adopted, where two contacting surfaces can carry shear (frictional) stress up to a certain limit without relative motion and start to slide when the shear stress reaches the limit. In other words, when the shear stress reaches the limit, the surfaces begin to slip. The limit is closely related to the friction coefficient. In this study, a friction coefficient of 0.15 was assigned based on a trial-and-error approach. For the normal behavior, the hard contact mode was selected to minimize penetration on contact and to allow for contact between surfaces followed by separation.

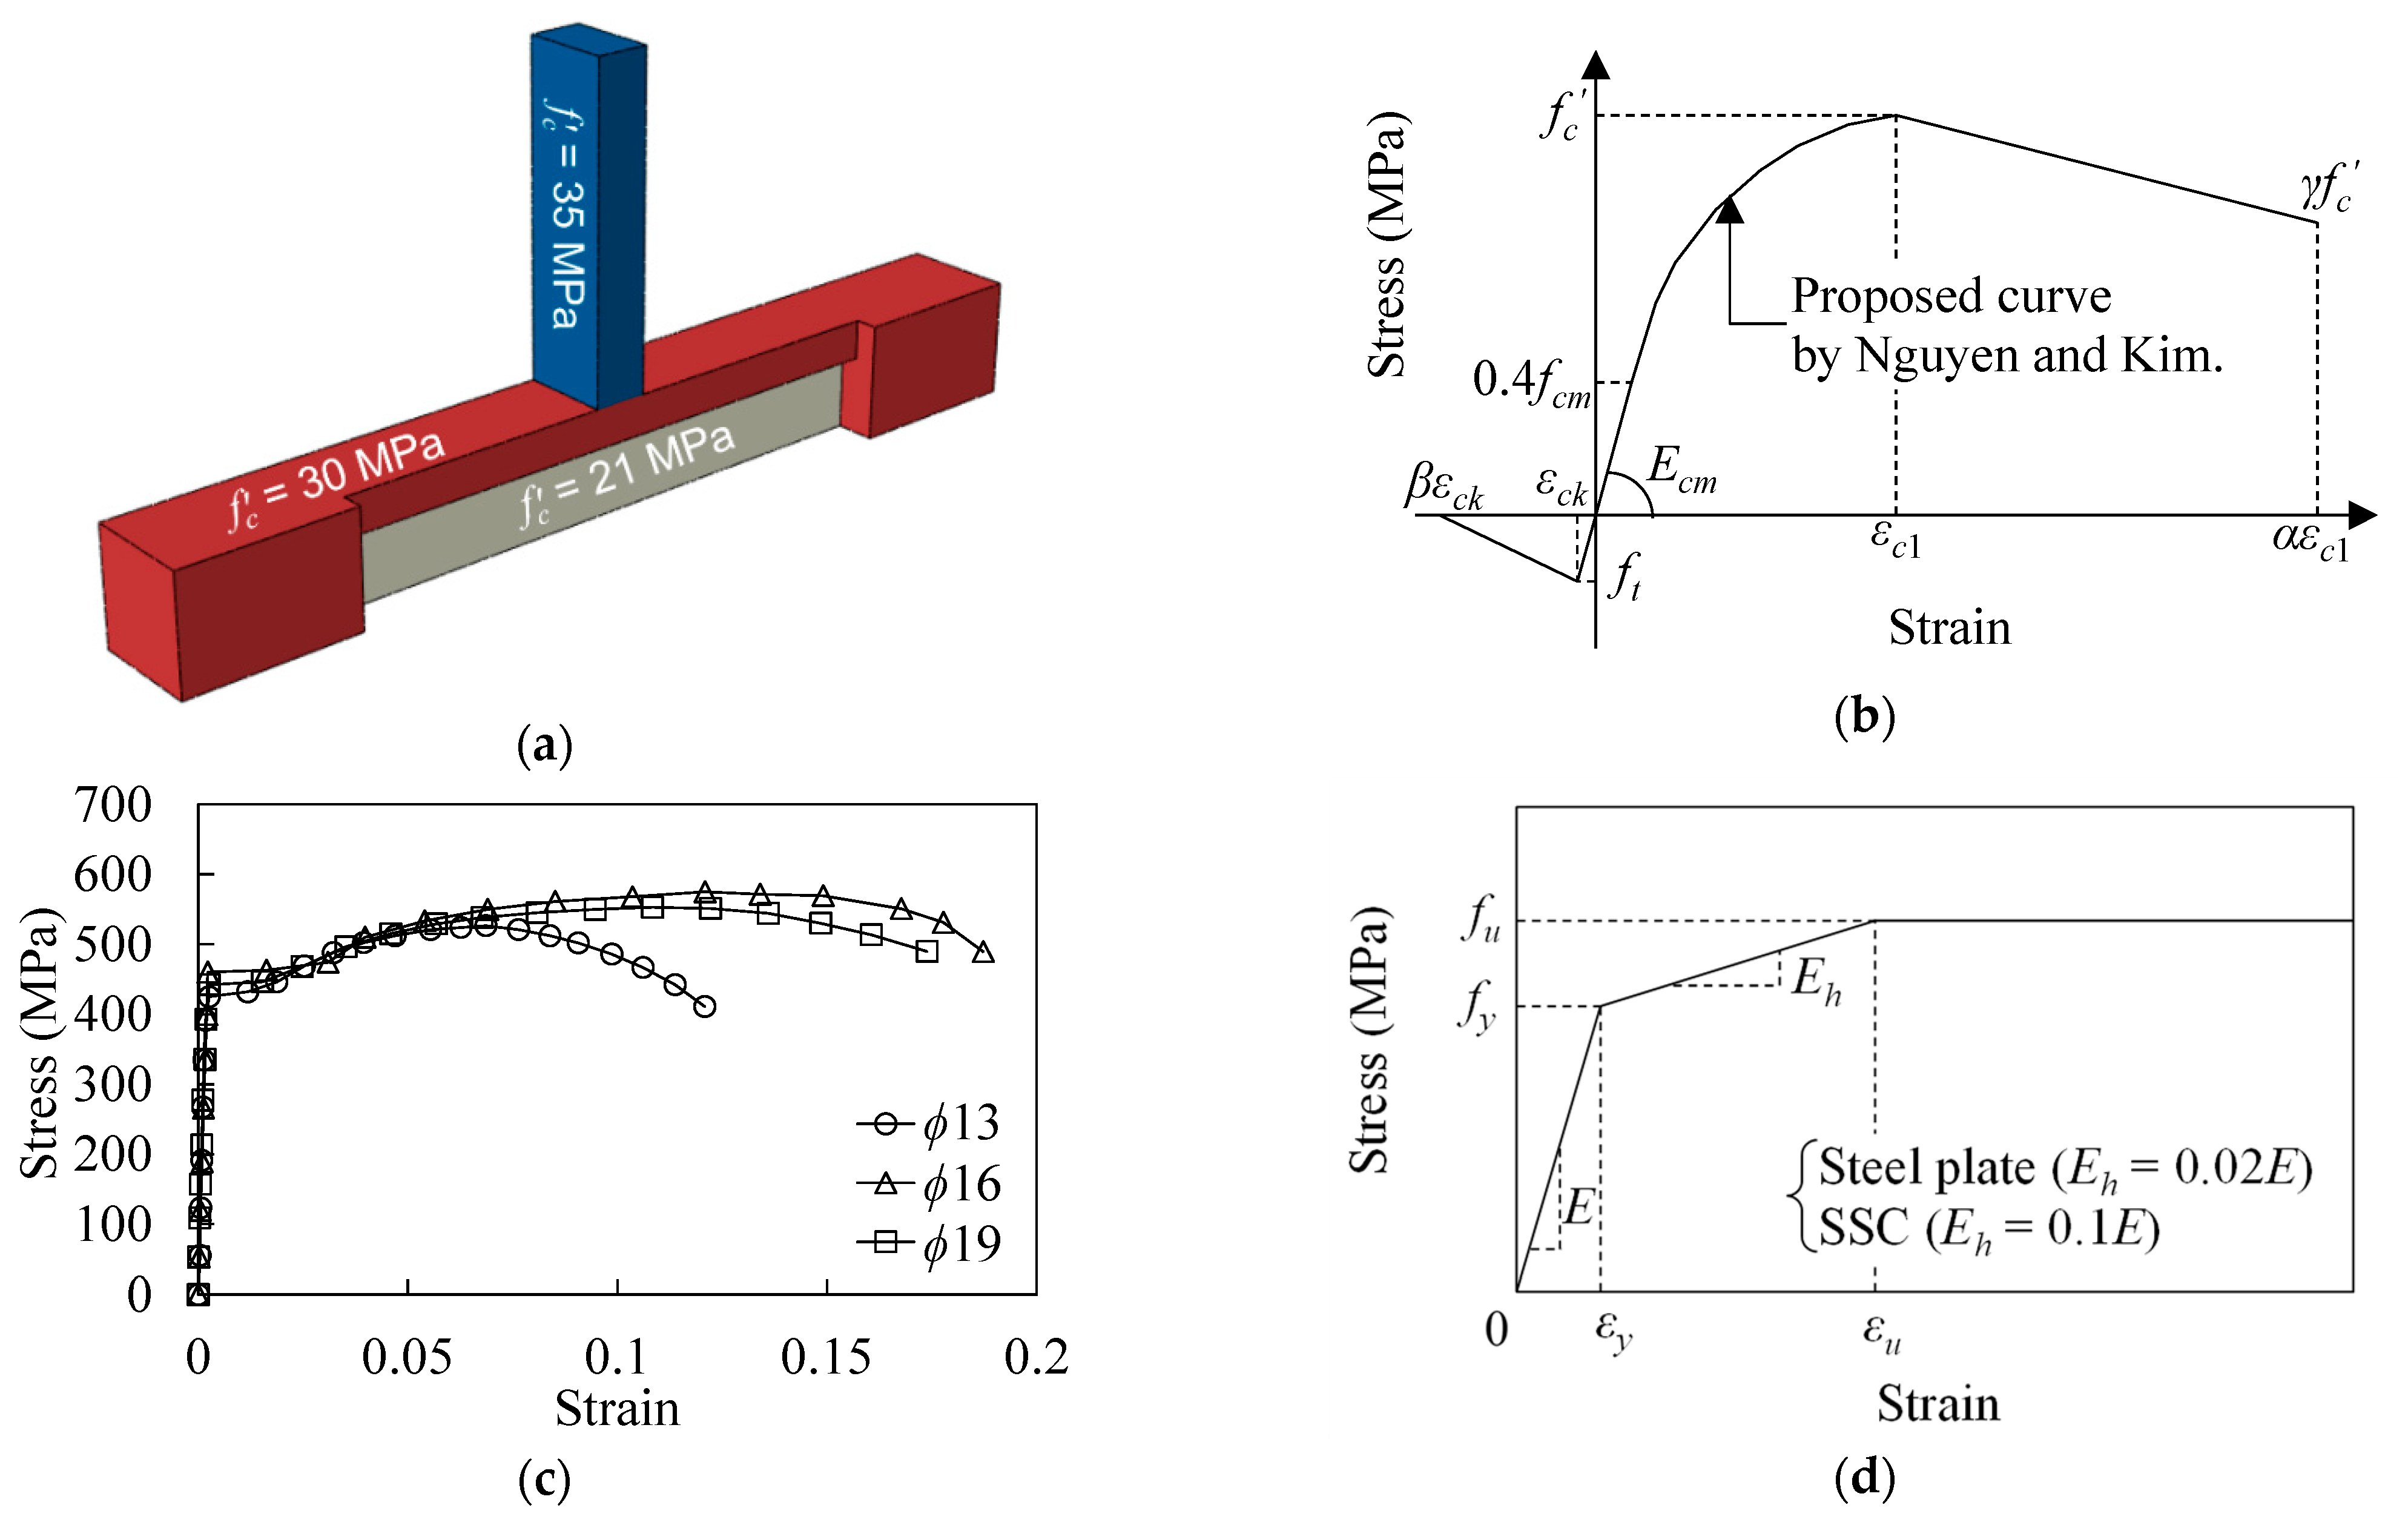
4.4. Material Models

The concrete, reinforcing bar, and steel models used in the analysis are shown in Figure 6. Three concrete strengths ( f c = 21, 30, and 35 MPa) are required for the models. A concrete strength of 21 MPa was used between the CIPs without reinforcing bars, whereas the others were used for the remaining models with reinforcing bars. A concrete damaged plasticity (CDP) model was used to assess the nonlinear behavior of the concrete. The CDP model is a constitutive model based on a combination of plasticity and damage mechanics theories. For a concrete strength of 21 MPa, the compressive stress–strain relationship in Equation (1) given in EC 2 [5] without considering the confinement effect can be expressed as follows:
σ c = ( k η η 2 1 + ( k 2 ) η ) f c
where η is the compressive strain ratio in the concrete (= ε c / ε c 1 ), ε c 1 is the compressive strain in the concrete at the peak stress (= 0.7 ( f c ) 0.31 0.0028 ), and k is the factor (= 1.05 E × | ε c 1 | / f c ). The corresponding tensile stress and strain were set as 10% of the concrete strength and 0.001, respectively. Based on research conducted by Nguyen and Kim [18] (Figure 6b), the concrete confinement effects were partially incorporated for a concrete strength of 21 MPa and above with reinforcing bars. For the partial confinement effect, the coefficients α and γ were chosen to be 7.0 and 0.85, respectively. The coefficients α and γ represent the partial confinement effect in the compressive stress–strain relationship introduced by Ellobody et al. [19]. The α value can be a number between 1.0 and 11.0 depending on the degree of confinement. An α value of 1.0 represents an unconfined condition and 11.0 represents a fully confined condition. The γ value can vary from 1.0 for no degradation to 0.5 for a 50% decrease in the peak stress. Therefore, concretes with high α and γ values exhibit more ductile behavior in the descending branch in the compressive stress–strain relationship. In addition, the tensile stress–strain relationship used in Equation (2) is as follows:
σ t = f t ε c k ε t   for   ε t ε c k
σ t = ( f t β ε c k ε c k ) ε t   for   ε t > ε c k
where f t is the tensile strength, and ε c k is the tensile strain at f t . The f t value was assumed to be 10% of f c , and β was set to 50 for the purposes of analytical stabilization. The material properties of the reinforcing bars obtained from the test results are as shown in Figure 6c. Figure 6d shows the trilinear stress–strain relationship used for the constitutive models of the steel, as per Xu et al. [20]. Depending on the type of steel, the mechanical properties considered in this study are summarized in Table 3.

5. Results and Discussion of the Test and FEA Results

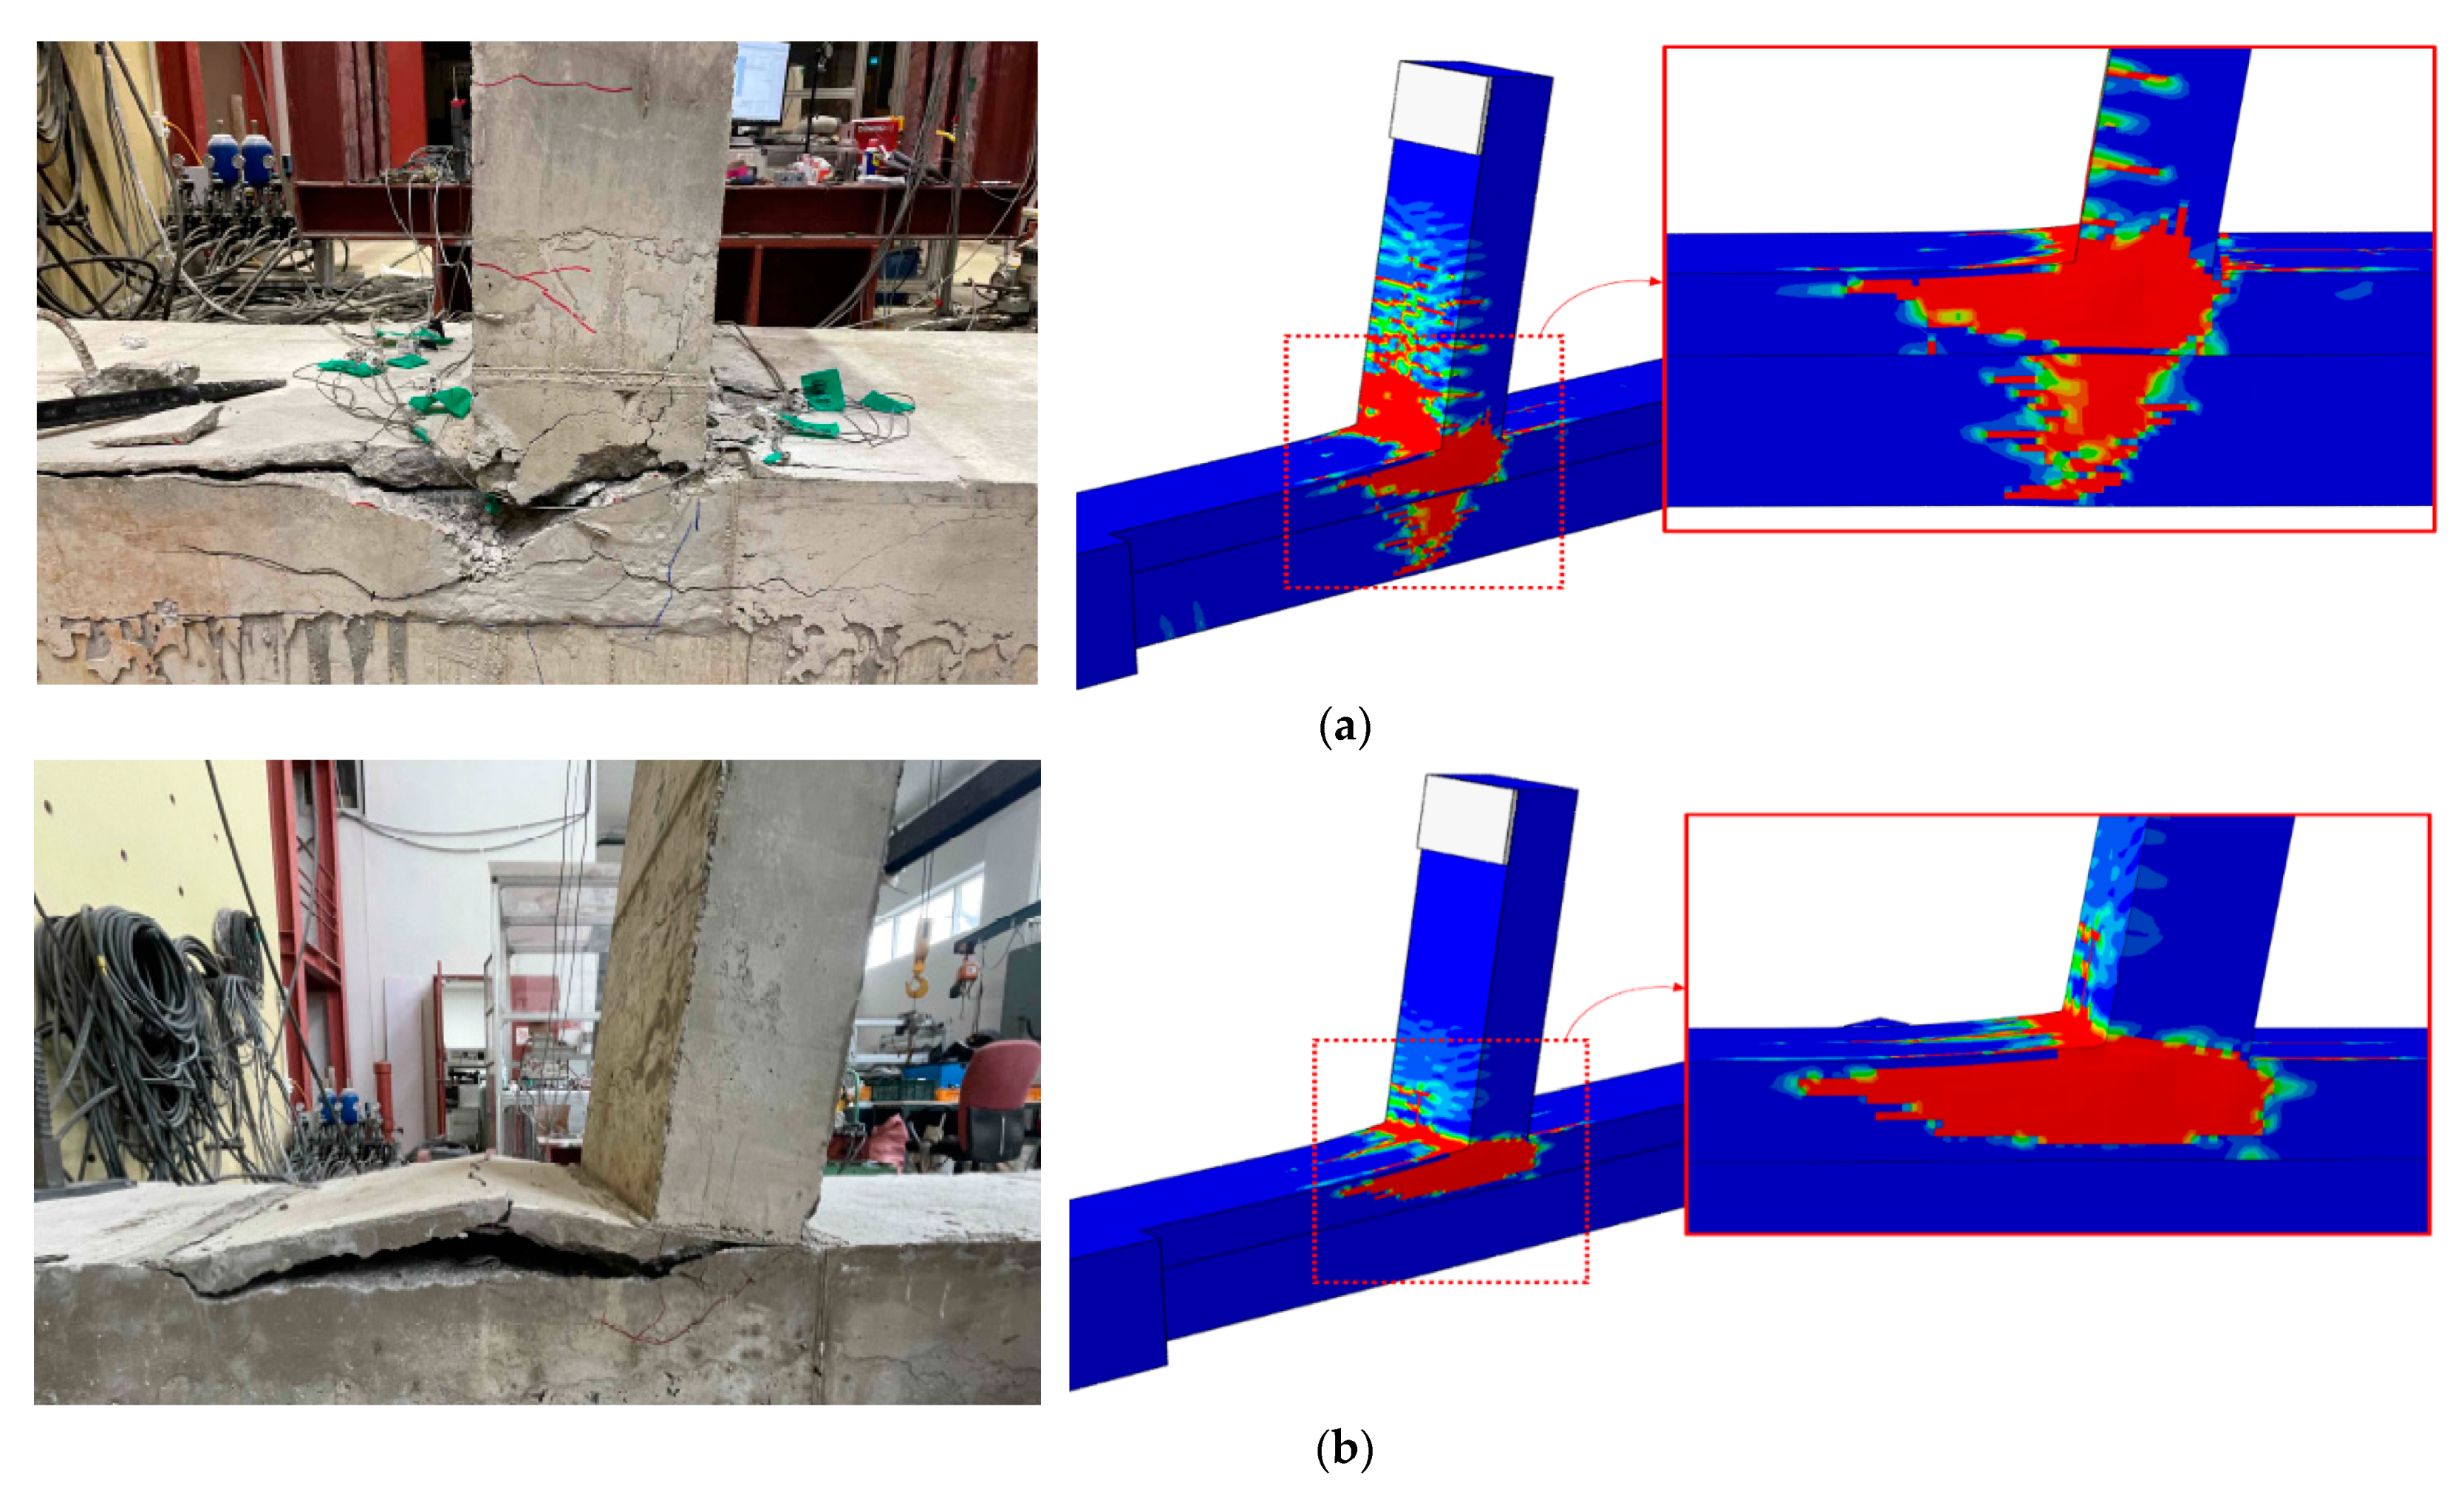
5.1. Crack Propagation and Failure Mode

Figure 7 shows the failure modes of the SCBW specimens obtained from the flexural tests and FEA. In the SCBW specimens with the longitudinal reinforcing bars of the slab anchored in the CIP (Specimen C), the initial flexural cracks occurred in the maximum-moment region near the composite basement wall junction. Flexural cracks appeared in the slabs as the load increased. After the yielding of the longitudinal reinforcing bars in the slab, some cracks propagated in both the CIP and the basement wall sections. After reaching the peak load, the cracks in the composite basement wall junction intensified. Finally, the concrete crushing failure occurred in the compression zone, resulting in the termination of the flexural test. As shown in Figure 7a, anchoring the longitudinal reinforcing bars by penetrating the steel plate into the CIP was effective in distributing the cracks along the length of the slab or at the junction with the basement wall. These trends were completely different from those observed in the SCBW specimens with the longitudinal reinforcing bars of the slab anchored on the basement wall (Specimen B). In Specimen B, the initial flexural cracks occurred in the maximum-moment region near the composite basement wall junction. As the load increased, some cracks propagated only in the basement wall section, and no cracks occurred in the slab. Subsequently, the cracks that occurred in the basement wall section intensified, and, after the peak load was applied, concrete spalling of the splitting cracks occurred in the basement wall section, resulting in the termination of the flexural test. This is because the shear strength of the concrete cover where the longitudinal reinforcing bars were anchored was not sufficient to resist the shear force introduced by the tension force of the slab in flexure, resulting in splitting failure before the longitudinal reinforcing bars were yielded. As shown in Figure 7b, it can be concluded that anchoring the longitudinal reinforcing bars into the basement wall was unfavorable for distributing cracks along the slab’s length. In particular, splitting cracks near the anchorage location of the longitudinal reinforcing bars must be controlled to minimize the development of intensified cracks in the composite basement wall junction.

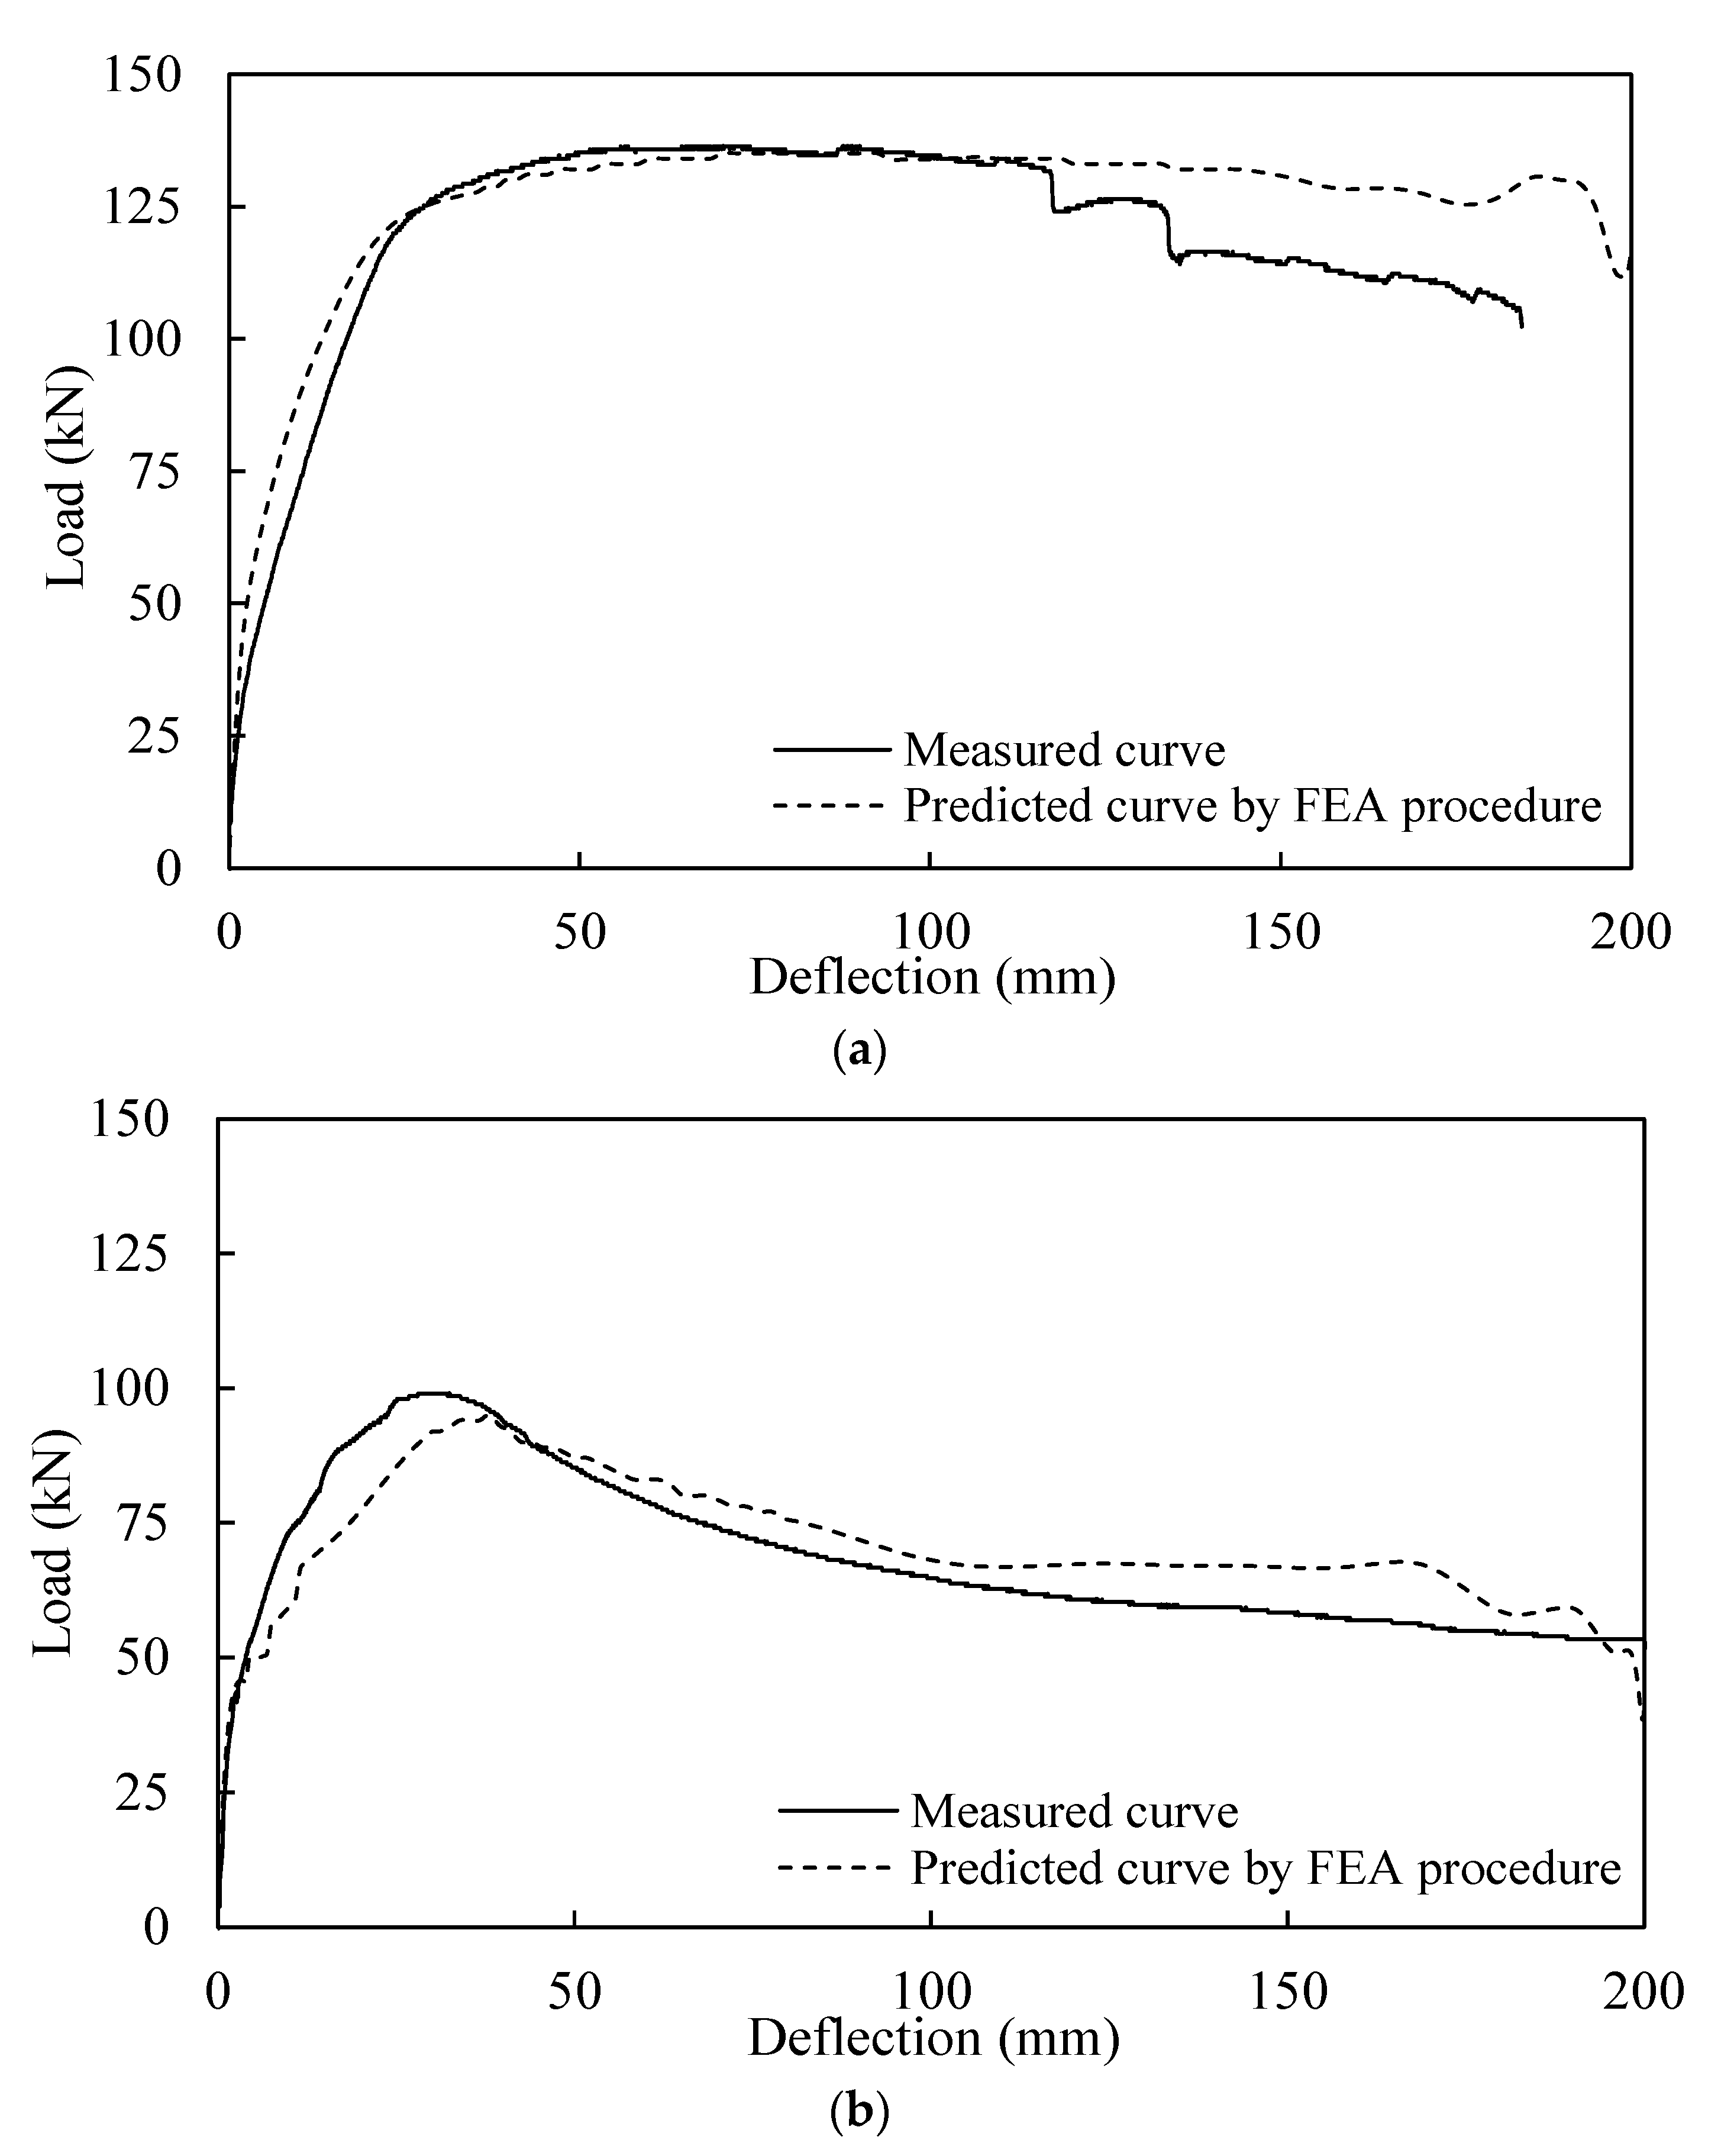
5.2. Load–Deflection Relationship

Figure 8 shows the load–deflection relationship of the SCBW specimens obtained from the flexural test and FEA. In the SCBW specimens with the longitudinal reinforcing bars of the slab anchored in the CIP (Specimen C), the load–deflection relationship was similar to that observed in conventional reinforced concrete one-way slabs governed by flexure. The load–deflection relationship can be described according to four stages: the initial crack, the yielding of the longitudinal reinforcing bar, the peak load, and the plastic plateau flow after the peak load. However, these trends were completely different from those observed in the SCBW specimens with the longitudinal reinforcing bars of the slab anchored on the basement wall (Specimen B). The load–deflection relationship of Specimen B can be described according to three stages: the initial crack, the peak load, and the rapid load reduction after the peak load. As a result, Specimen B showed brittle flexural behavior with a sudden decrease in the load after the peak load because the longitudinal reinforcing bars of the slab did not yield. As shown Figure 9, in general, diagonal tension and compression stress are generated at the slab-wall junction as the result of stress [21]. In addition, in the anchored position at 90°, the shear force introduced by the tension force of the slab must be resisted by the concrete cover surrounding the anchored longitudinal reinforcing bars. The resistance of the shear force at this position is maintained until the longitudinal reinforcing bars reach the yield point, contributing to the ductile behavior of the slab. However, as shown in the experiments and FEA, in Specimen B, the shear force resisted in the concrete cover where the longitudinal reinforcing bars were anchored was lower than that introduced by the tension force of the slab; thus, the concrete cover was split before the yield of the longitudinal reinforcing bars was reached. As a result, Specimen B showed a rapid drop in the applied load due to the splitting failure. The most significant difference in the load–deflection relationship between Specimens C and B was the ductile behavior after the peak load, which was dependent on whether the longitudinal reinforcing bars yielded.

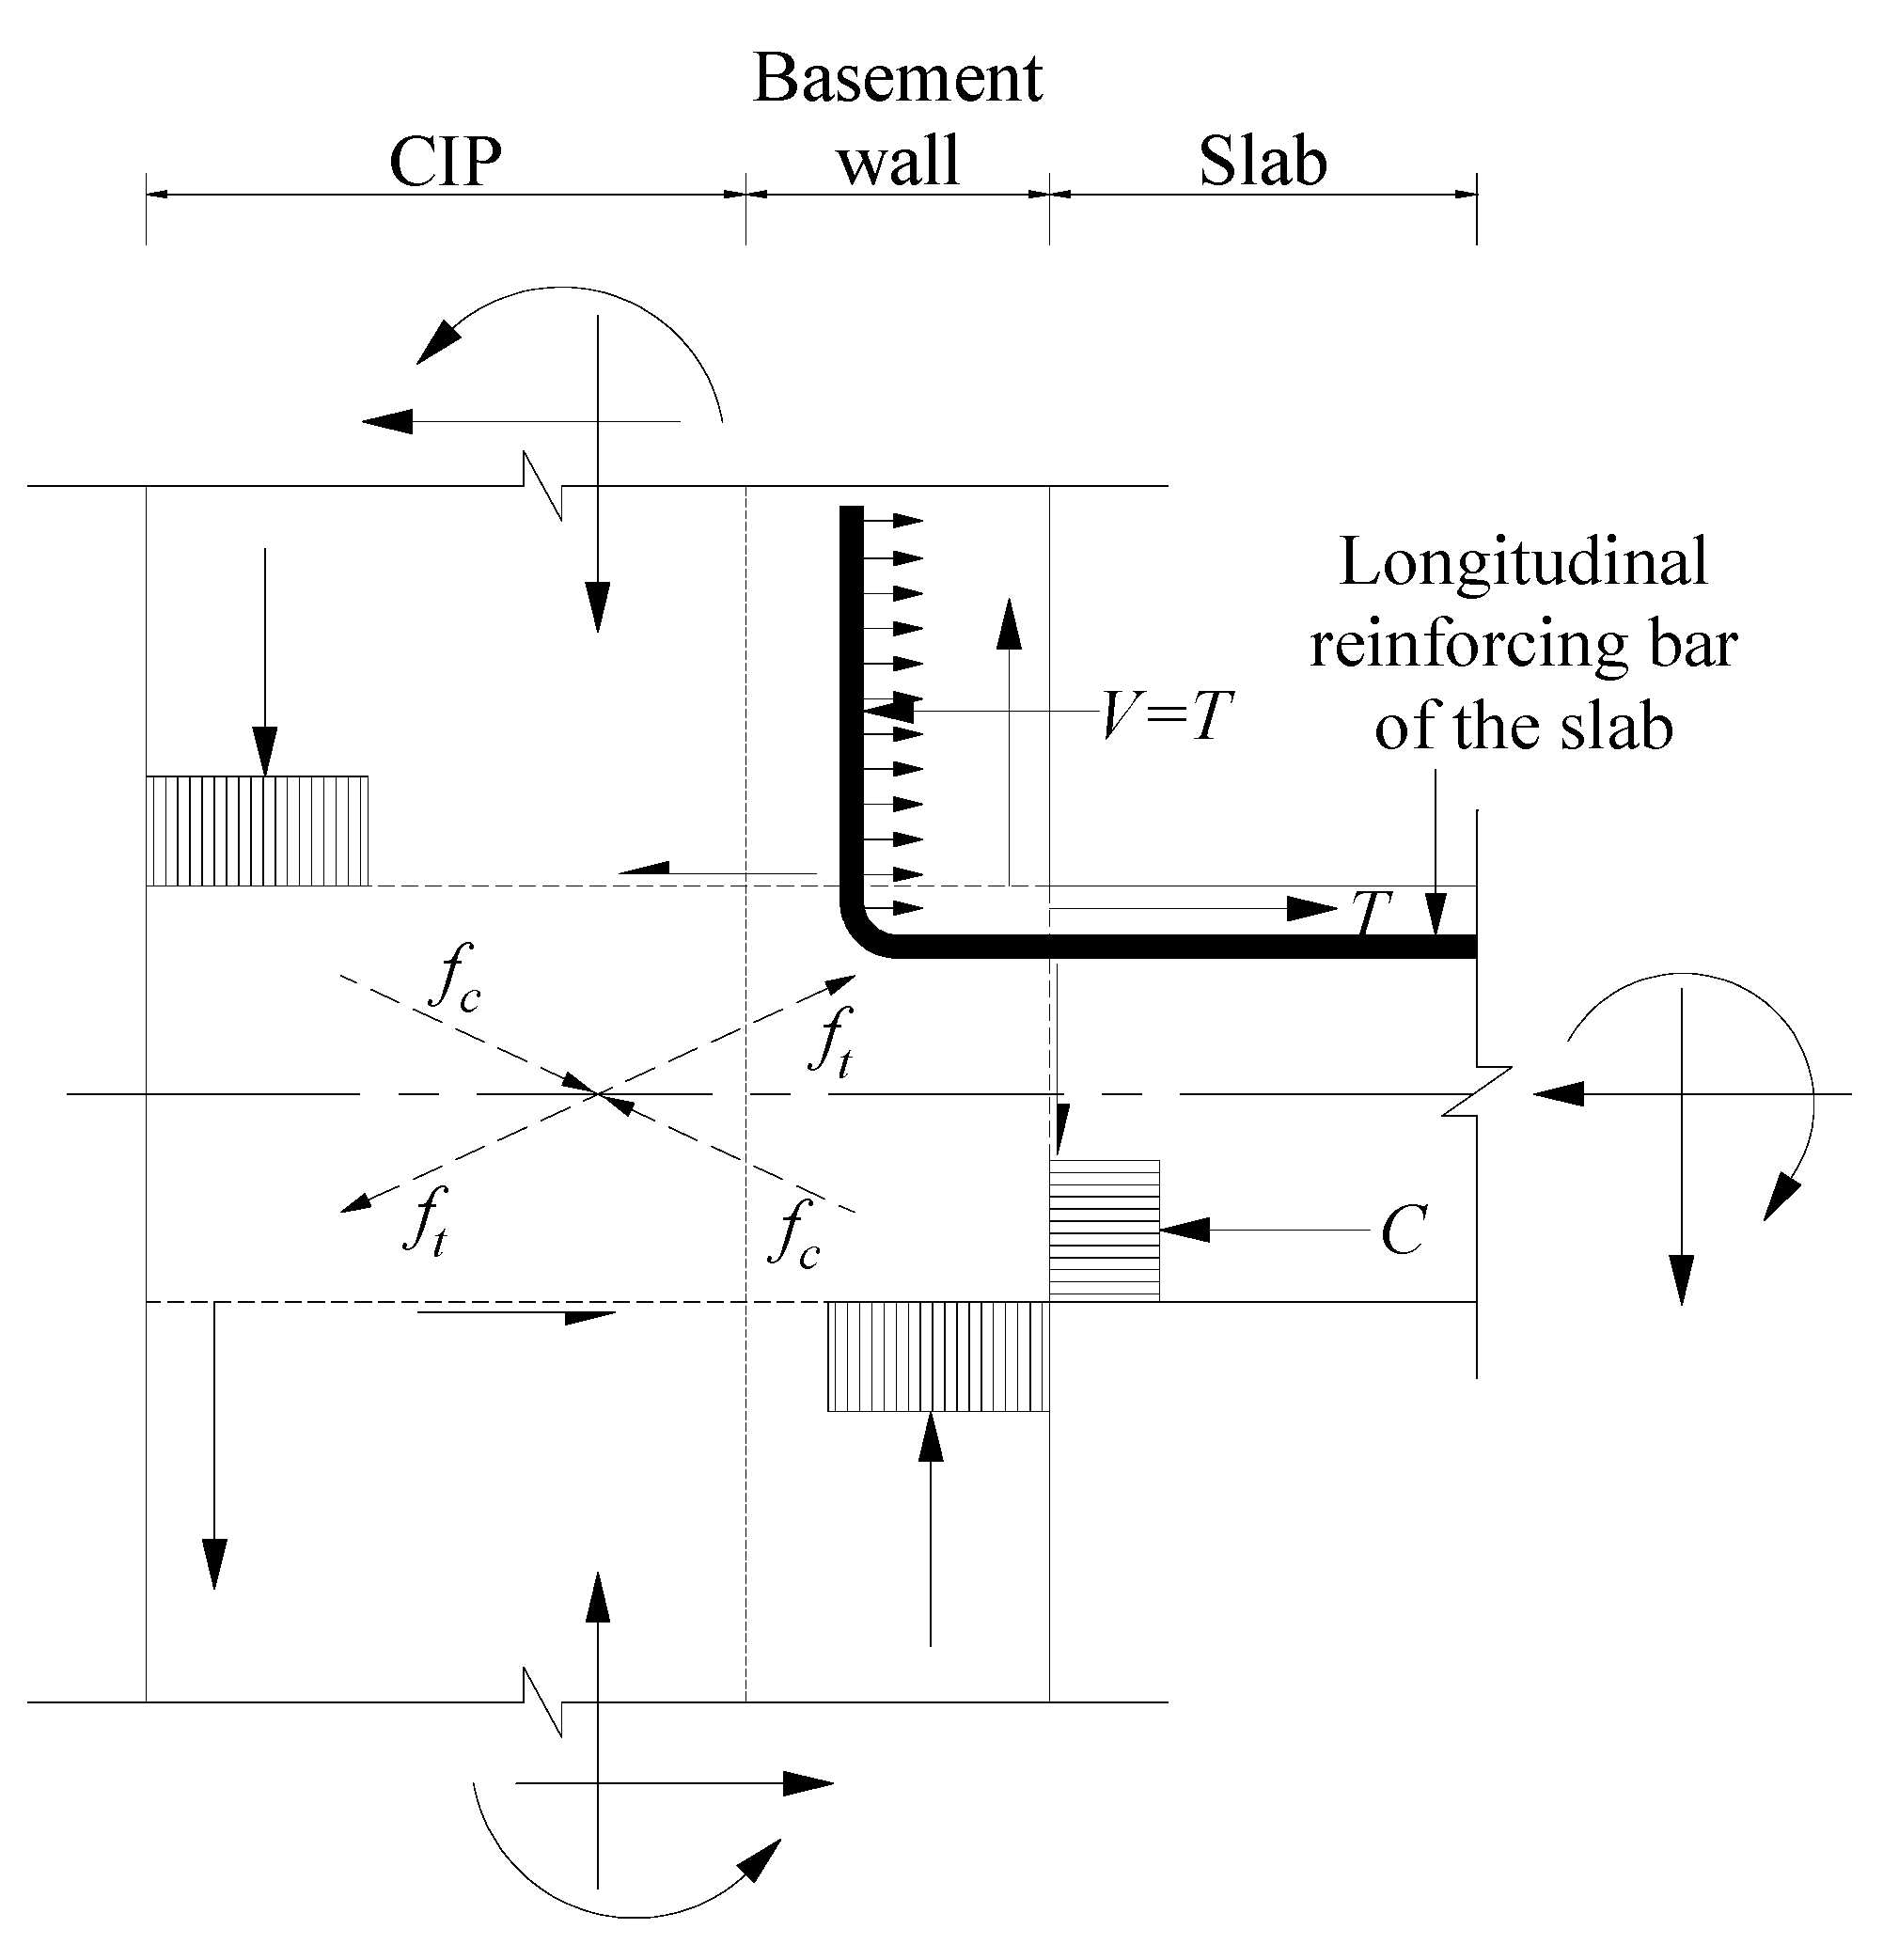
5.3. Flexural Moment

Based on the equivalent stress block specified in ACI 318-19 [4], the nominal flexural moment ( M n ) of the slab can be calculated using the following equation, without considering the longitudinal compressive reinforcing bars:
ϕ M n ( A C I ) = ϕ A s f y ( d a 2 )
where ϕ is the strength reduction factor (=0.9), M n ( A C I ) is the nominal flexural moment calculated by ACI 318-19, A s is the number of longitudinal tensile reinforcing bars, a is the equivalent stress block [= A s f y / ( 0.85 f c B s l a b ) ], and d is the effective depth of the longitudinal tensile reinforcing bars. Using Equation (2), the ϕ M n ( A C I ) values of the SCBW specimens were calculated to be 150.6 kN·m. As summarized in Table 4, this value was similar to the experimental value obtained for the SCBW specimen with the longitudinal reinforcing bars of the slab anchored in the CIP (Specimen C), whereas it was 1.17 times higher than that obtained for the SCBW specimen with the longitudinal reinforcing bars of the slab anchored in the basement wall (Specimen B). This implies that, although half of the longitudinal reinforcing bars were anchored to the CIP by penetrating the steel plate, an M n value similar to that of M n ( A C I ) was observed in the slab, resulting from the development of the yield stress of the longitudinal reinforcing bars in the slab. Therefore, Equation (2) specified in ACI 318-19 [4] can be used to estimate the SCBW specimen with the longitudinal reinforcing bars of the slab anchored in the CIP by penetrating the steel plate. It was also confirmed that anchoring the longitudinal reinforcing bars to the basement wall was not sufficient to induce the longitudinal reinforcing bars to yield. Meanwhile, the M n values of Specimens C and B obtained from the FEA were 175.5 kN·m and 123.5 kN·m, respectively, which were similar to the experimental values, irrespective of the anchorage location of the longitudinal reinforcing bars. As a result, based on the FEA procedure, the M n value of the SCBW specimen can be effectively predicted with high accuracy, and it is expected that it can be used for a wide range of parametric studies.

5.4. Deflection Ductility Ratio

The deflection ductility ratios ( μ Δ ) of the SCBW specimens were calculated using the equation proposed by Park and Paulay [21]:
μ Δ = Δ n / Δ y
where Δ n and Δ y denote the deflections at the peak load and yielding of the longitudinal reinforcing bars in the slab, respectively. Note that Equation (3), used to obtain the μ Δ value, is applicable only to the SCBW specimen with the longitudinal reinforcing bars anchored in the CIP (Specimen C) because the longitudinal reinforcing bars in the slab of the SCBW specimen, which are anchored in the basement wall (Specimen B), did not yield until the test was terminated. Table 5 compares between experiments and predicted values obtained from the FEA and from the model of Yang et al. [18,22]. The μ Δ value of Specimen C was 2.14, which is similar to the values obtained from the FEA and the model of Yang et al. [18,22]. This implies that anchoring the longitudinal reinforcing bars by penetrating the steel plate into the CIP was an effective means of achieving ductile behavior in the slab.

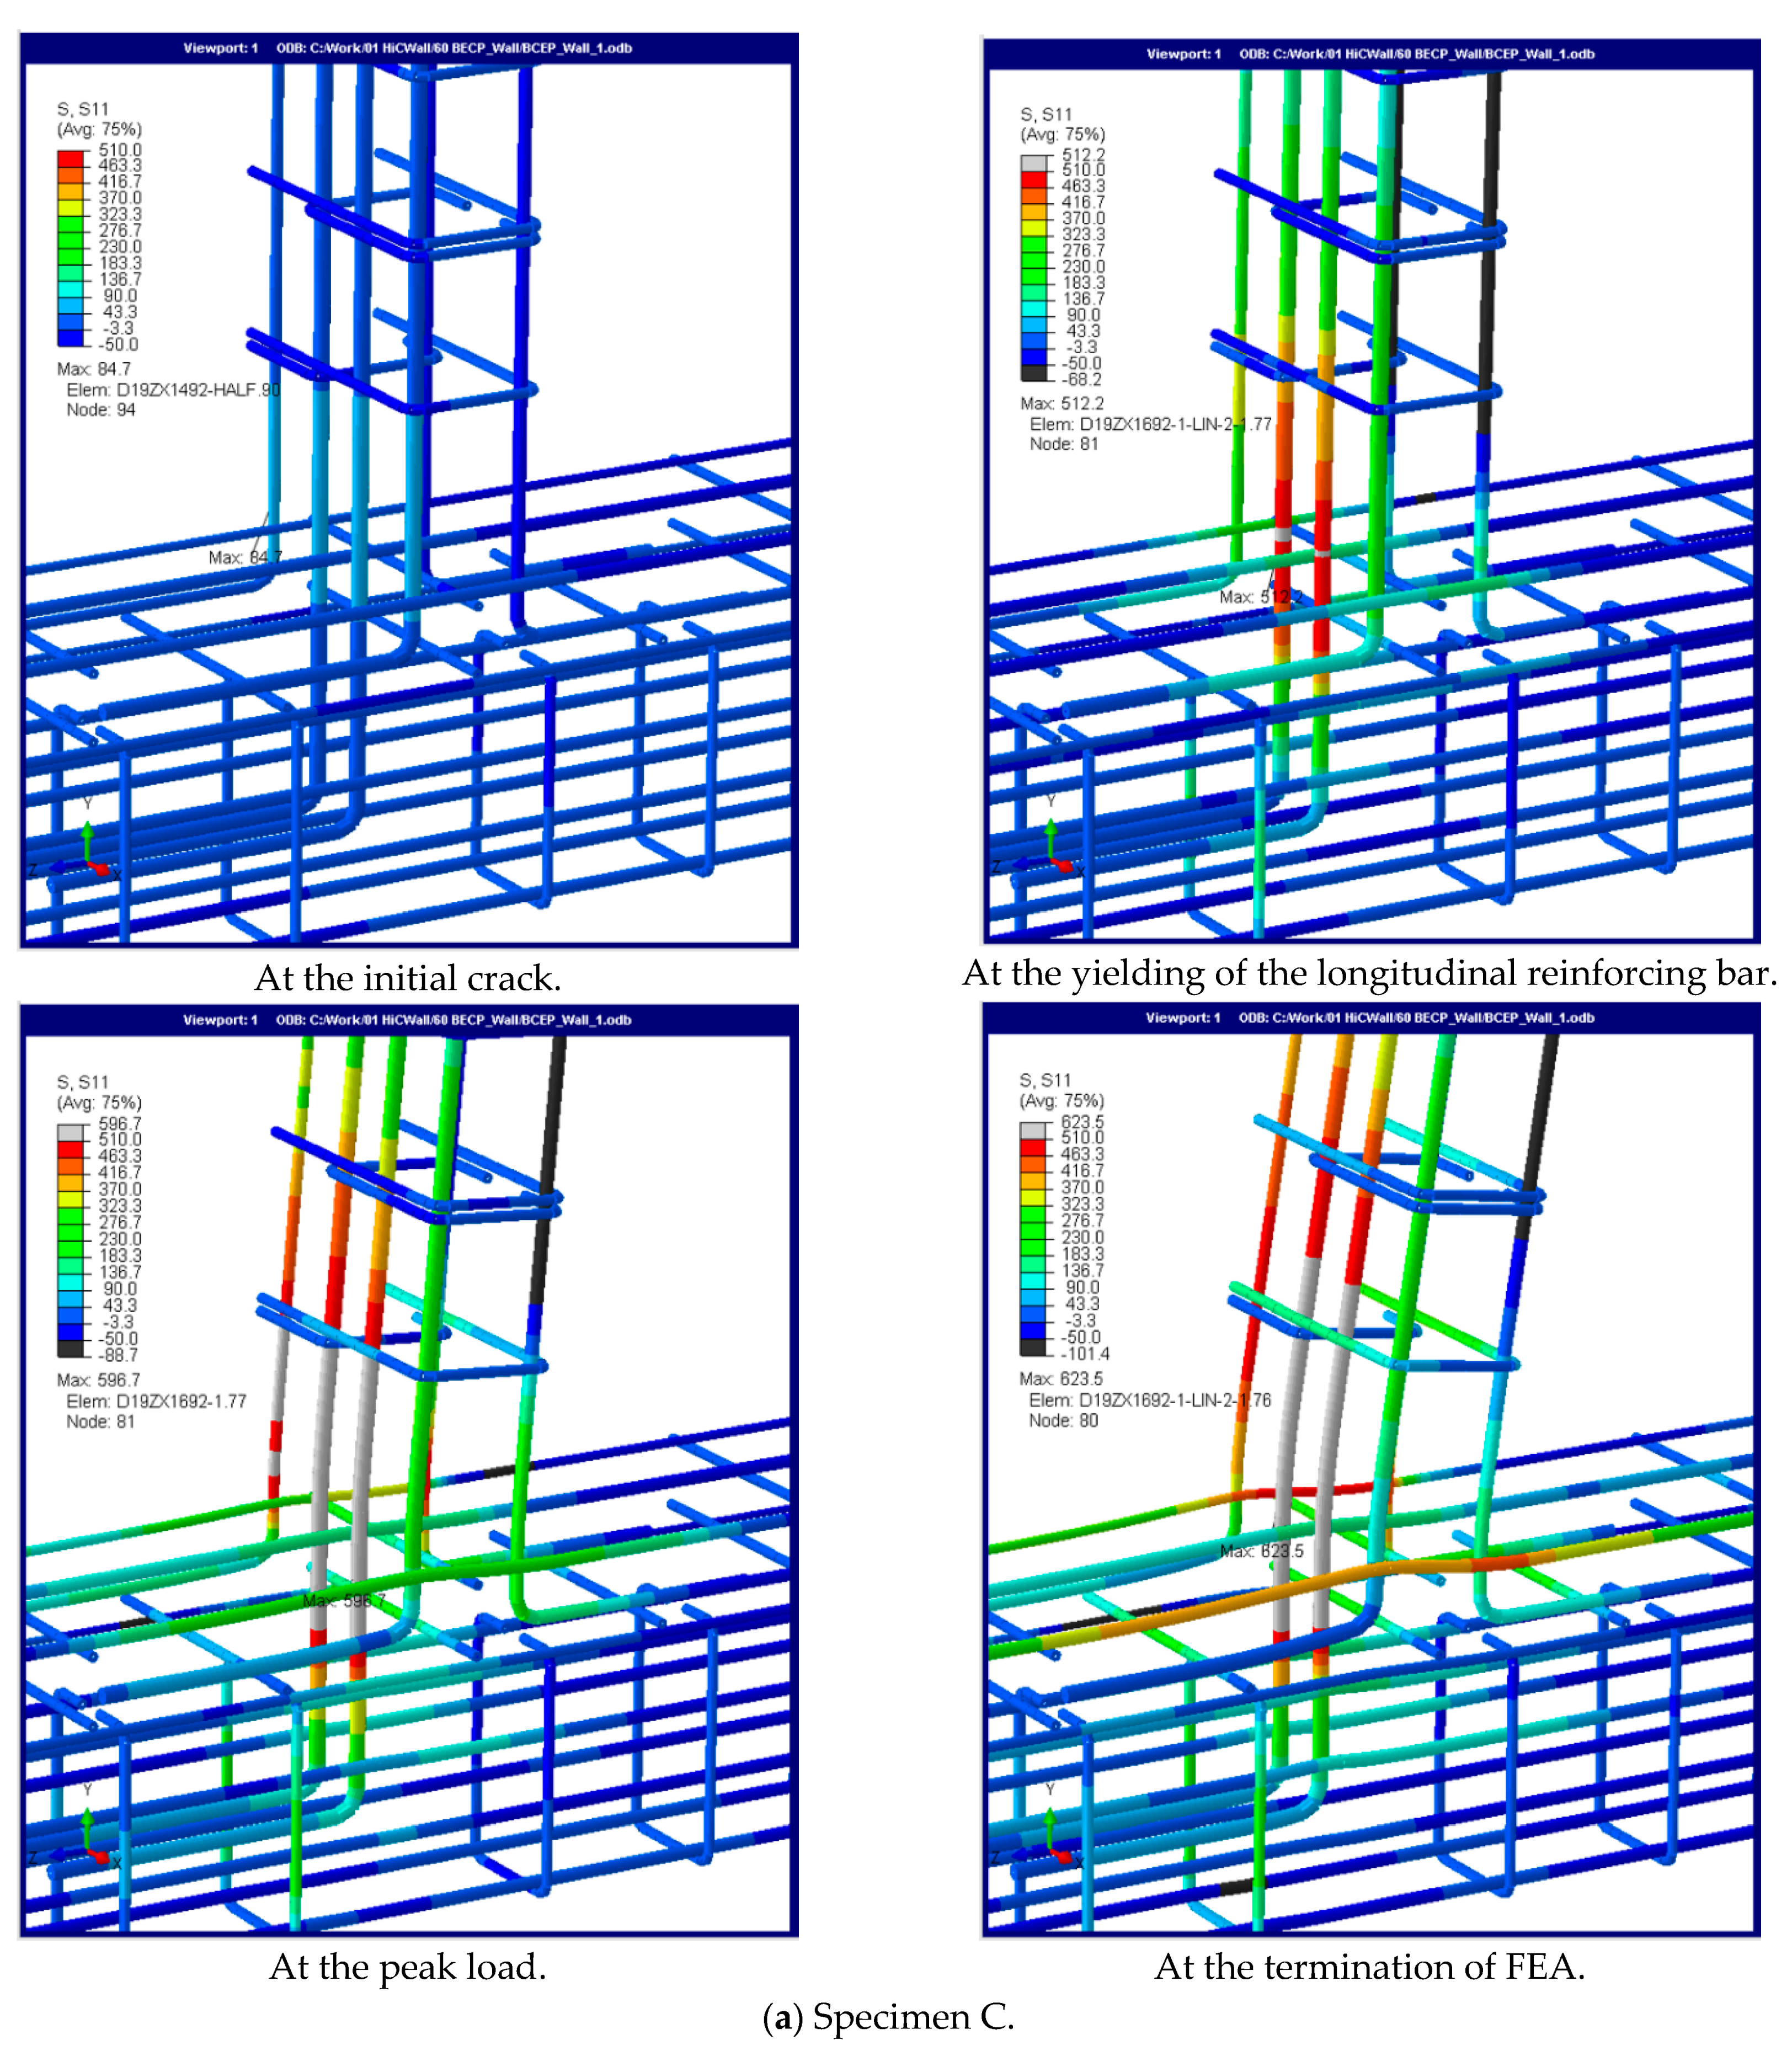
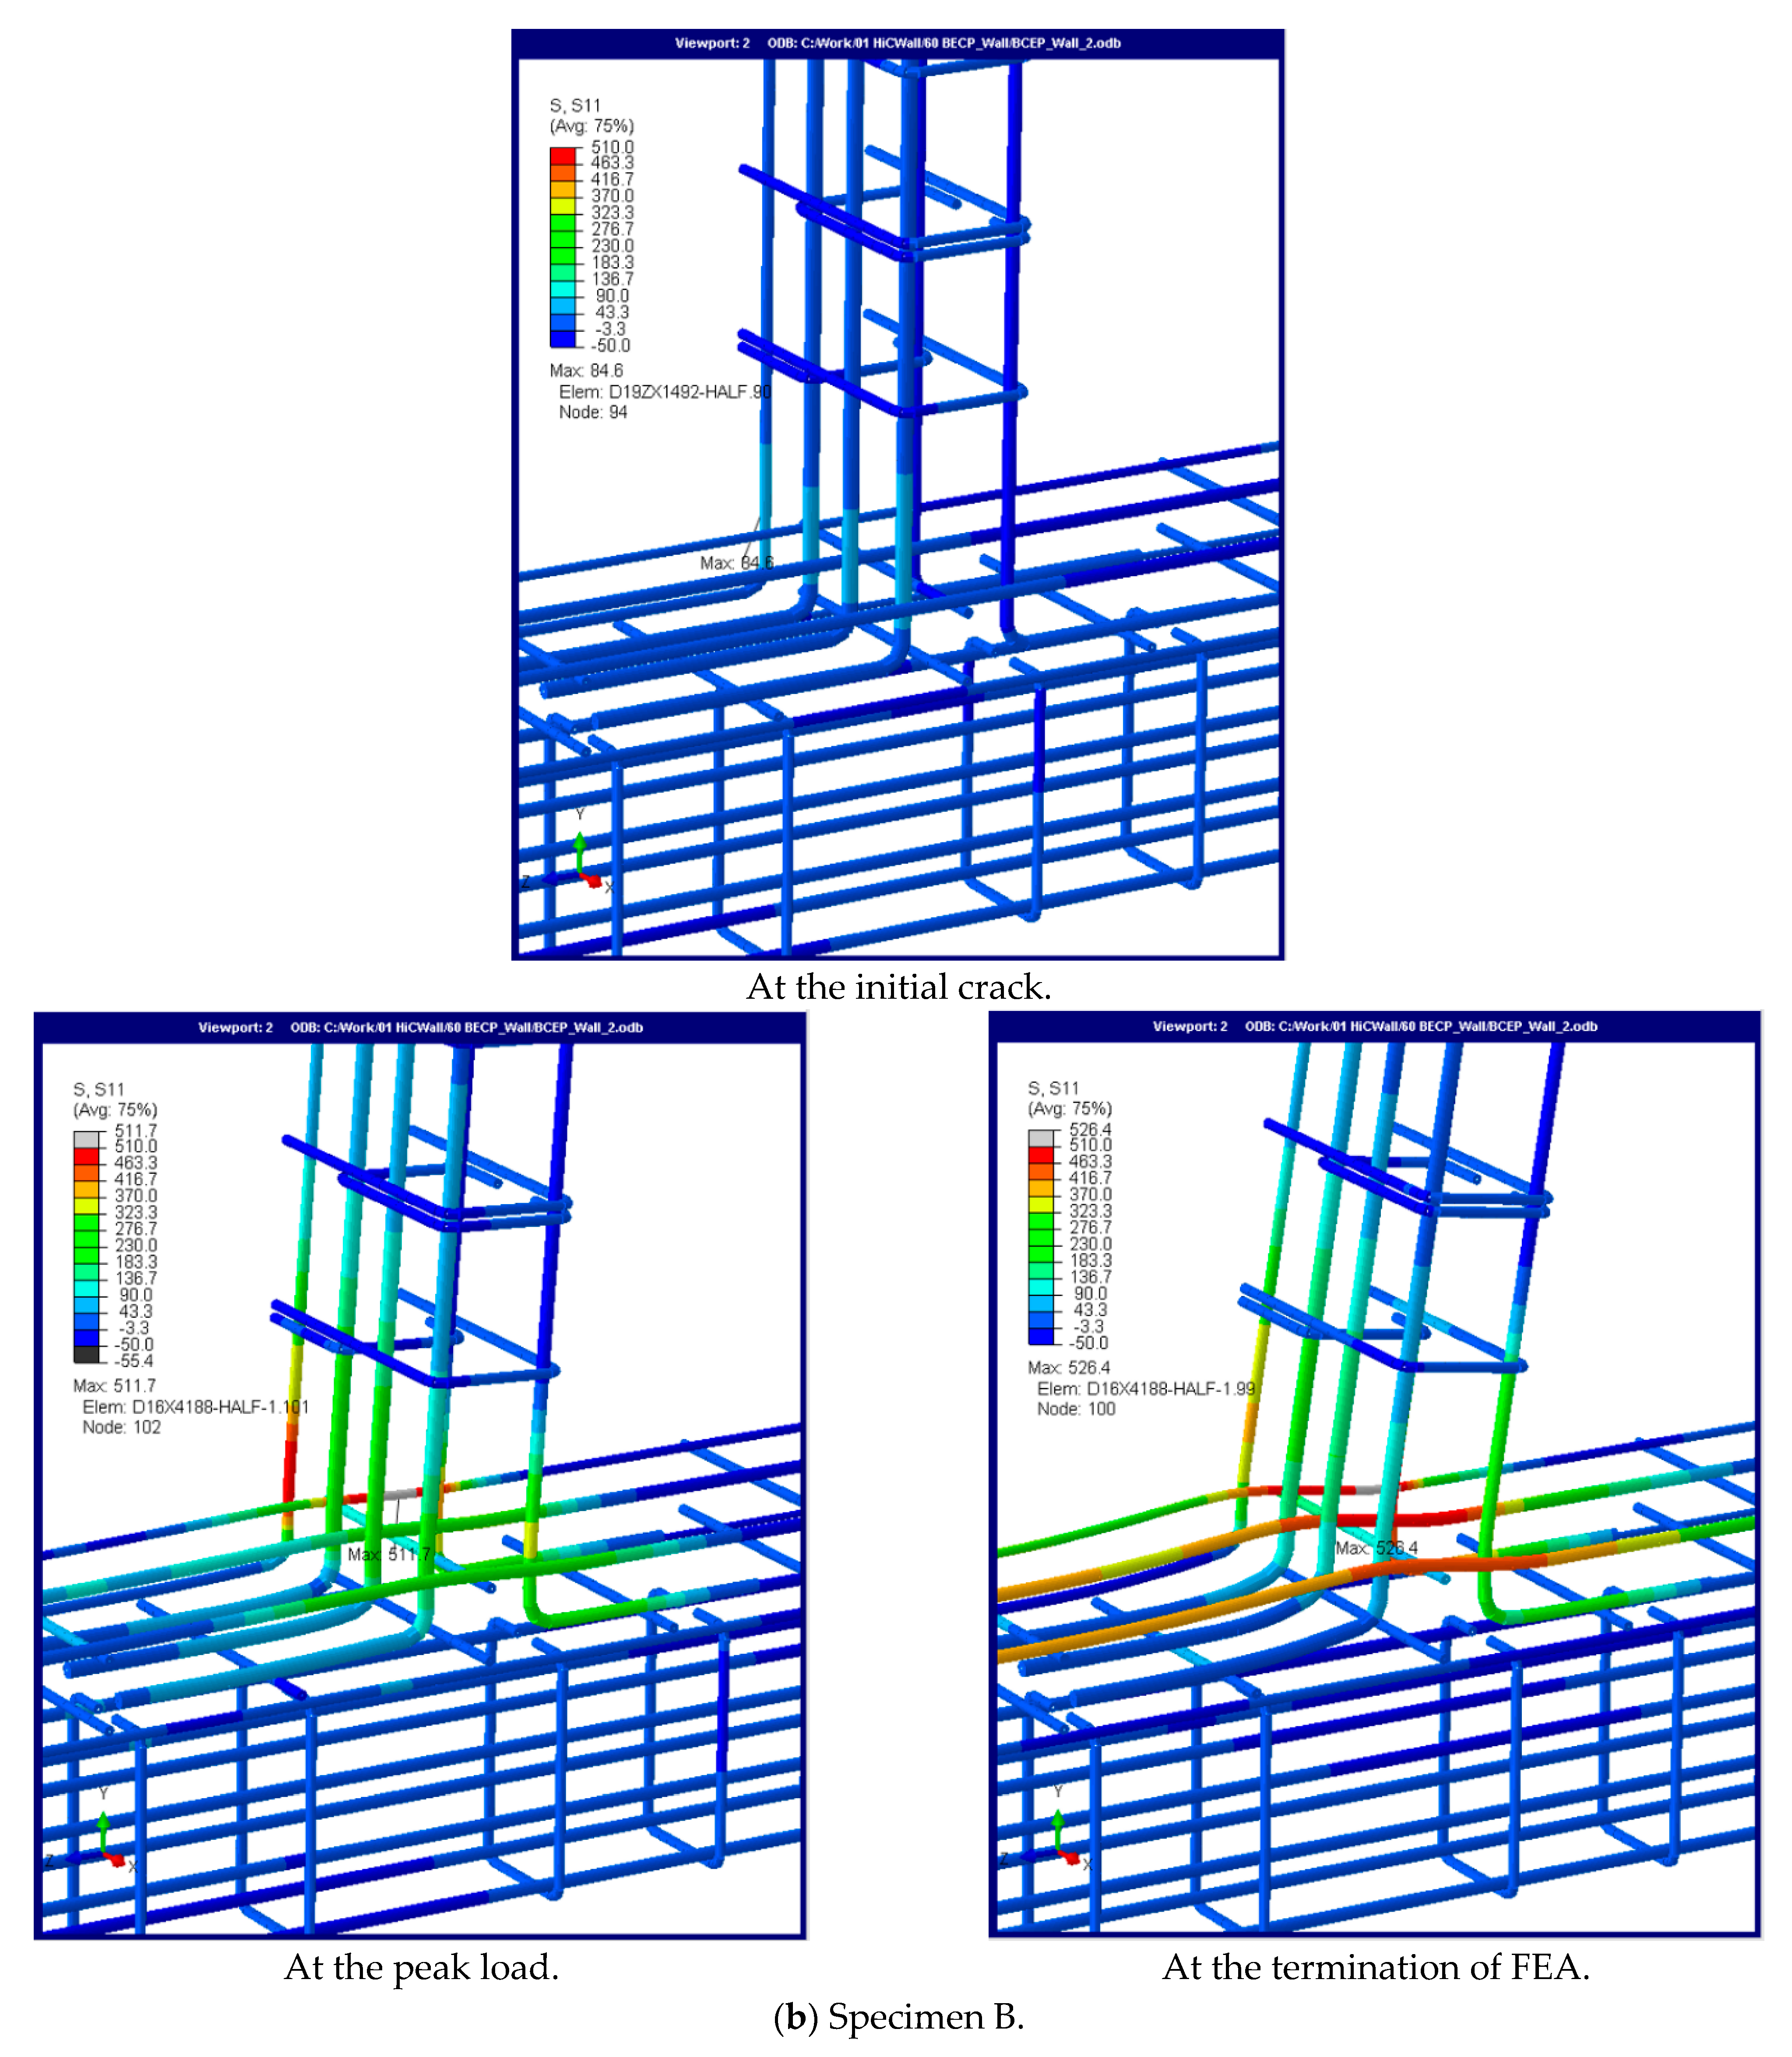
5.5. Stress and Strain of the Longitudinal Reinforcing Bars in the Slab

Figure 10 and Table 6 show the maximum stress and strain of the longitudinal reinforcing bars in the slab according to each stage described in the section on the load–deflection relationship. Note that this section was analyzed based only on the FEA results. In the SCBW specimens with the longitudinal reinforcing bars of the slab anchored in the CIP (Specimen C), at the point of the initial crack, the maximum stress and strain of the longitudinal reinforcing bars in the slab occurred near the composite basement wall junction, with values of 84.7 MPa and 0.00042, respectively, which were 83% lower than those obtained from the yielding of the longitudinal reinforcing bars. The yielding location of the longitudinal reinforcing bar was near the composite basement wall junction. At the peak load, the maximum stress and strain values of the longitudinal reinforcing bars in the slab occurred in the potential plastic hinge near the composite basement wall junction and were 596.7 MPa and 0.042, respectively: 1.17 and 21 times higher, respectively, than those obtained from the yielding of the longitudinal reinforcing bars. After the peak load, the longitudinal reinforcing bars of the slab experienced a stress exceeding 400 MPa in the region between the composite basement wall and 0.2 L along the slab. Notably, this region was similar to the predicted value (271 mm) of the equivalent plastic hinge length ( L p = 0.08 a s + 0.022 d b f y ) proposed by Priestley and Park [21]. This implies that anchoring the longitudinal reinforcing bars by penetrating the steel plate into the CIP is sufficient to develop the yield stress of the longitudinal reinforcing bars in the slab, resulting in ductile behavior. However, as with the analysis of the load–deflection relationship, these trends were completely different from those observed in the SCBW specimens with the longitudinal reinforcing bars of the slab anchored to the basement wall (Specimen B). In Specimen B, at the point of the initial crack, the maximum stress and strain values of the longitudinal reinforcing bars in the slab occurred near the composite basement wall junction and were 84.6 MPa and 0.0041, respectively, which were similar to the values observed in Specimen C. At the peak load, the maximum stress of the longitudinal reinforcing bars in the slab occurred near the composite basement wall junction, with a value of 462 MPa. This value was approximately 10% lower than that obtained from the yielding of the longitudinal reinforcing bars, indicating that the stress of the longitudinal reinforcing bars in the slab did not contribute significantly to the ductile flexural behavior. Instead, the longitudinal reinforcing bars of the basement wall near the composite basement wall junction were obtained. After the peak load, the stress and strain values of the longitudinal reinforcing bars in the slab remained within a range similar to that obtained at the peak load, and the number of yielded longitudinal reinforcing bars in the basement wall increased. Consequently, transverse reinforcement must be provided for the longitudinal reinforcing bars of the basement wall near the composite basement wall junction to prevent buckling and concrete spalling caused by splitting cracks.

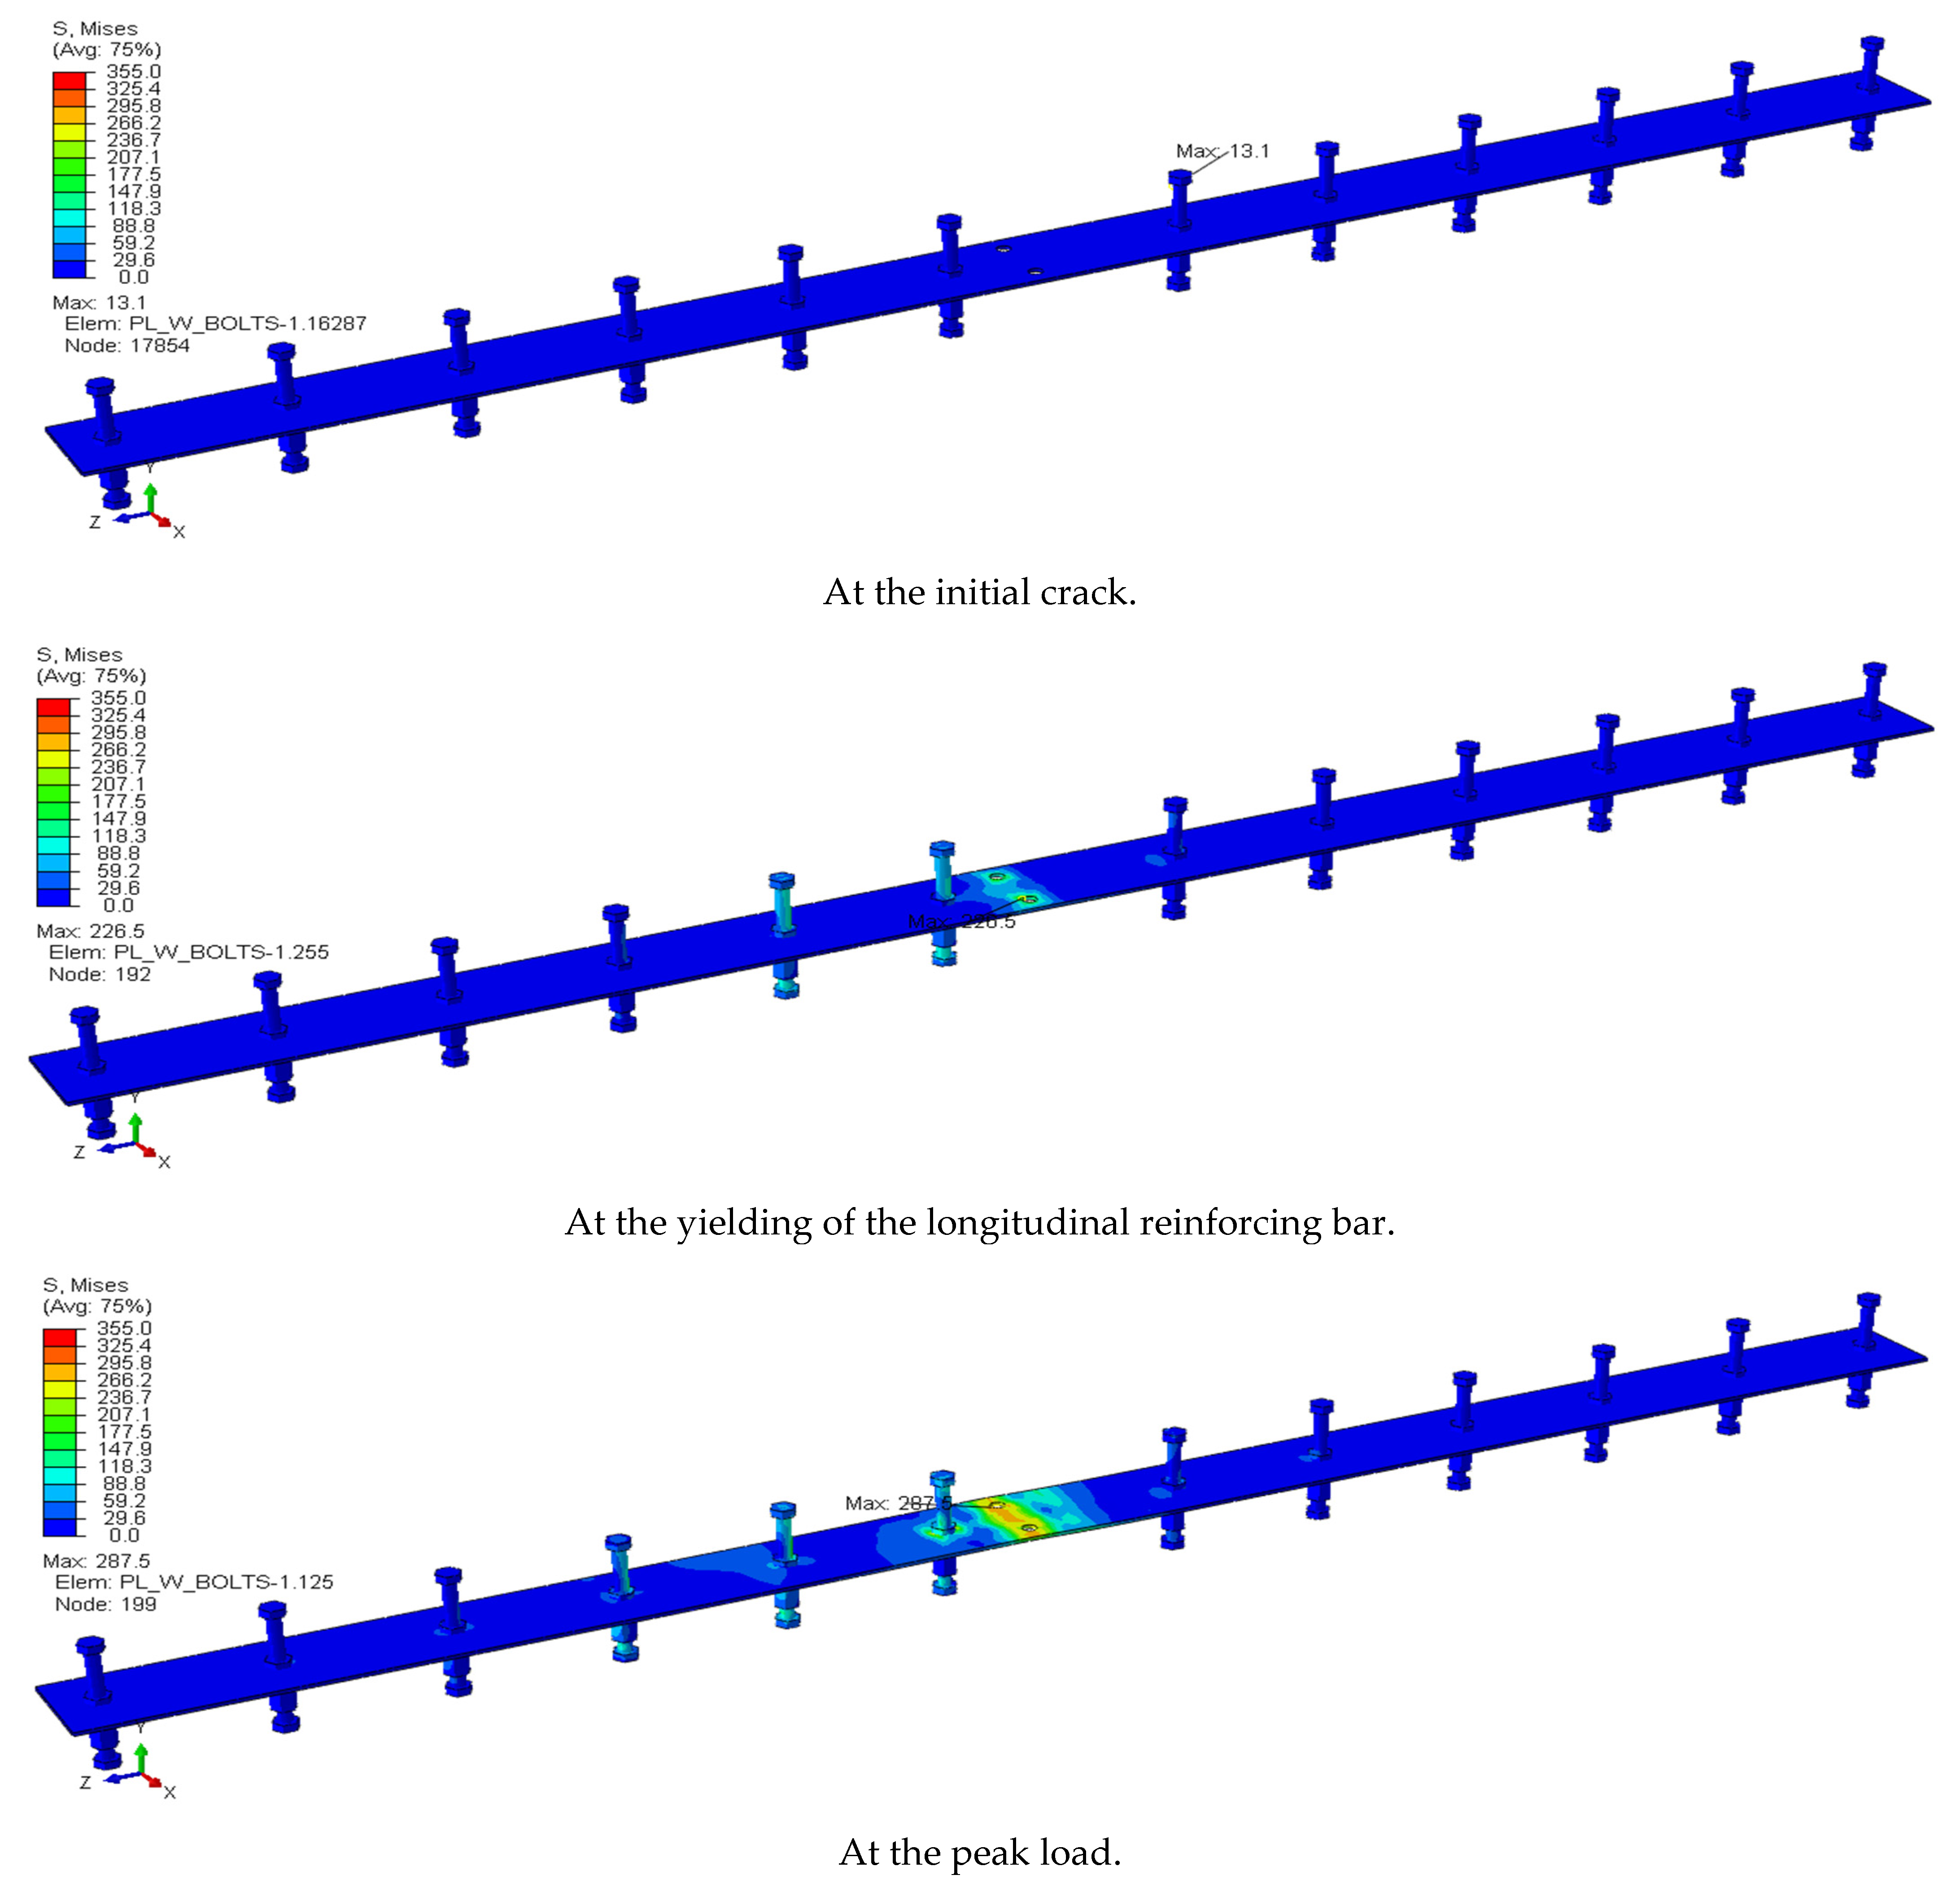
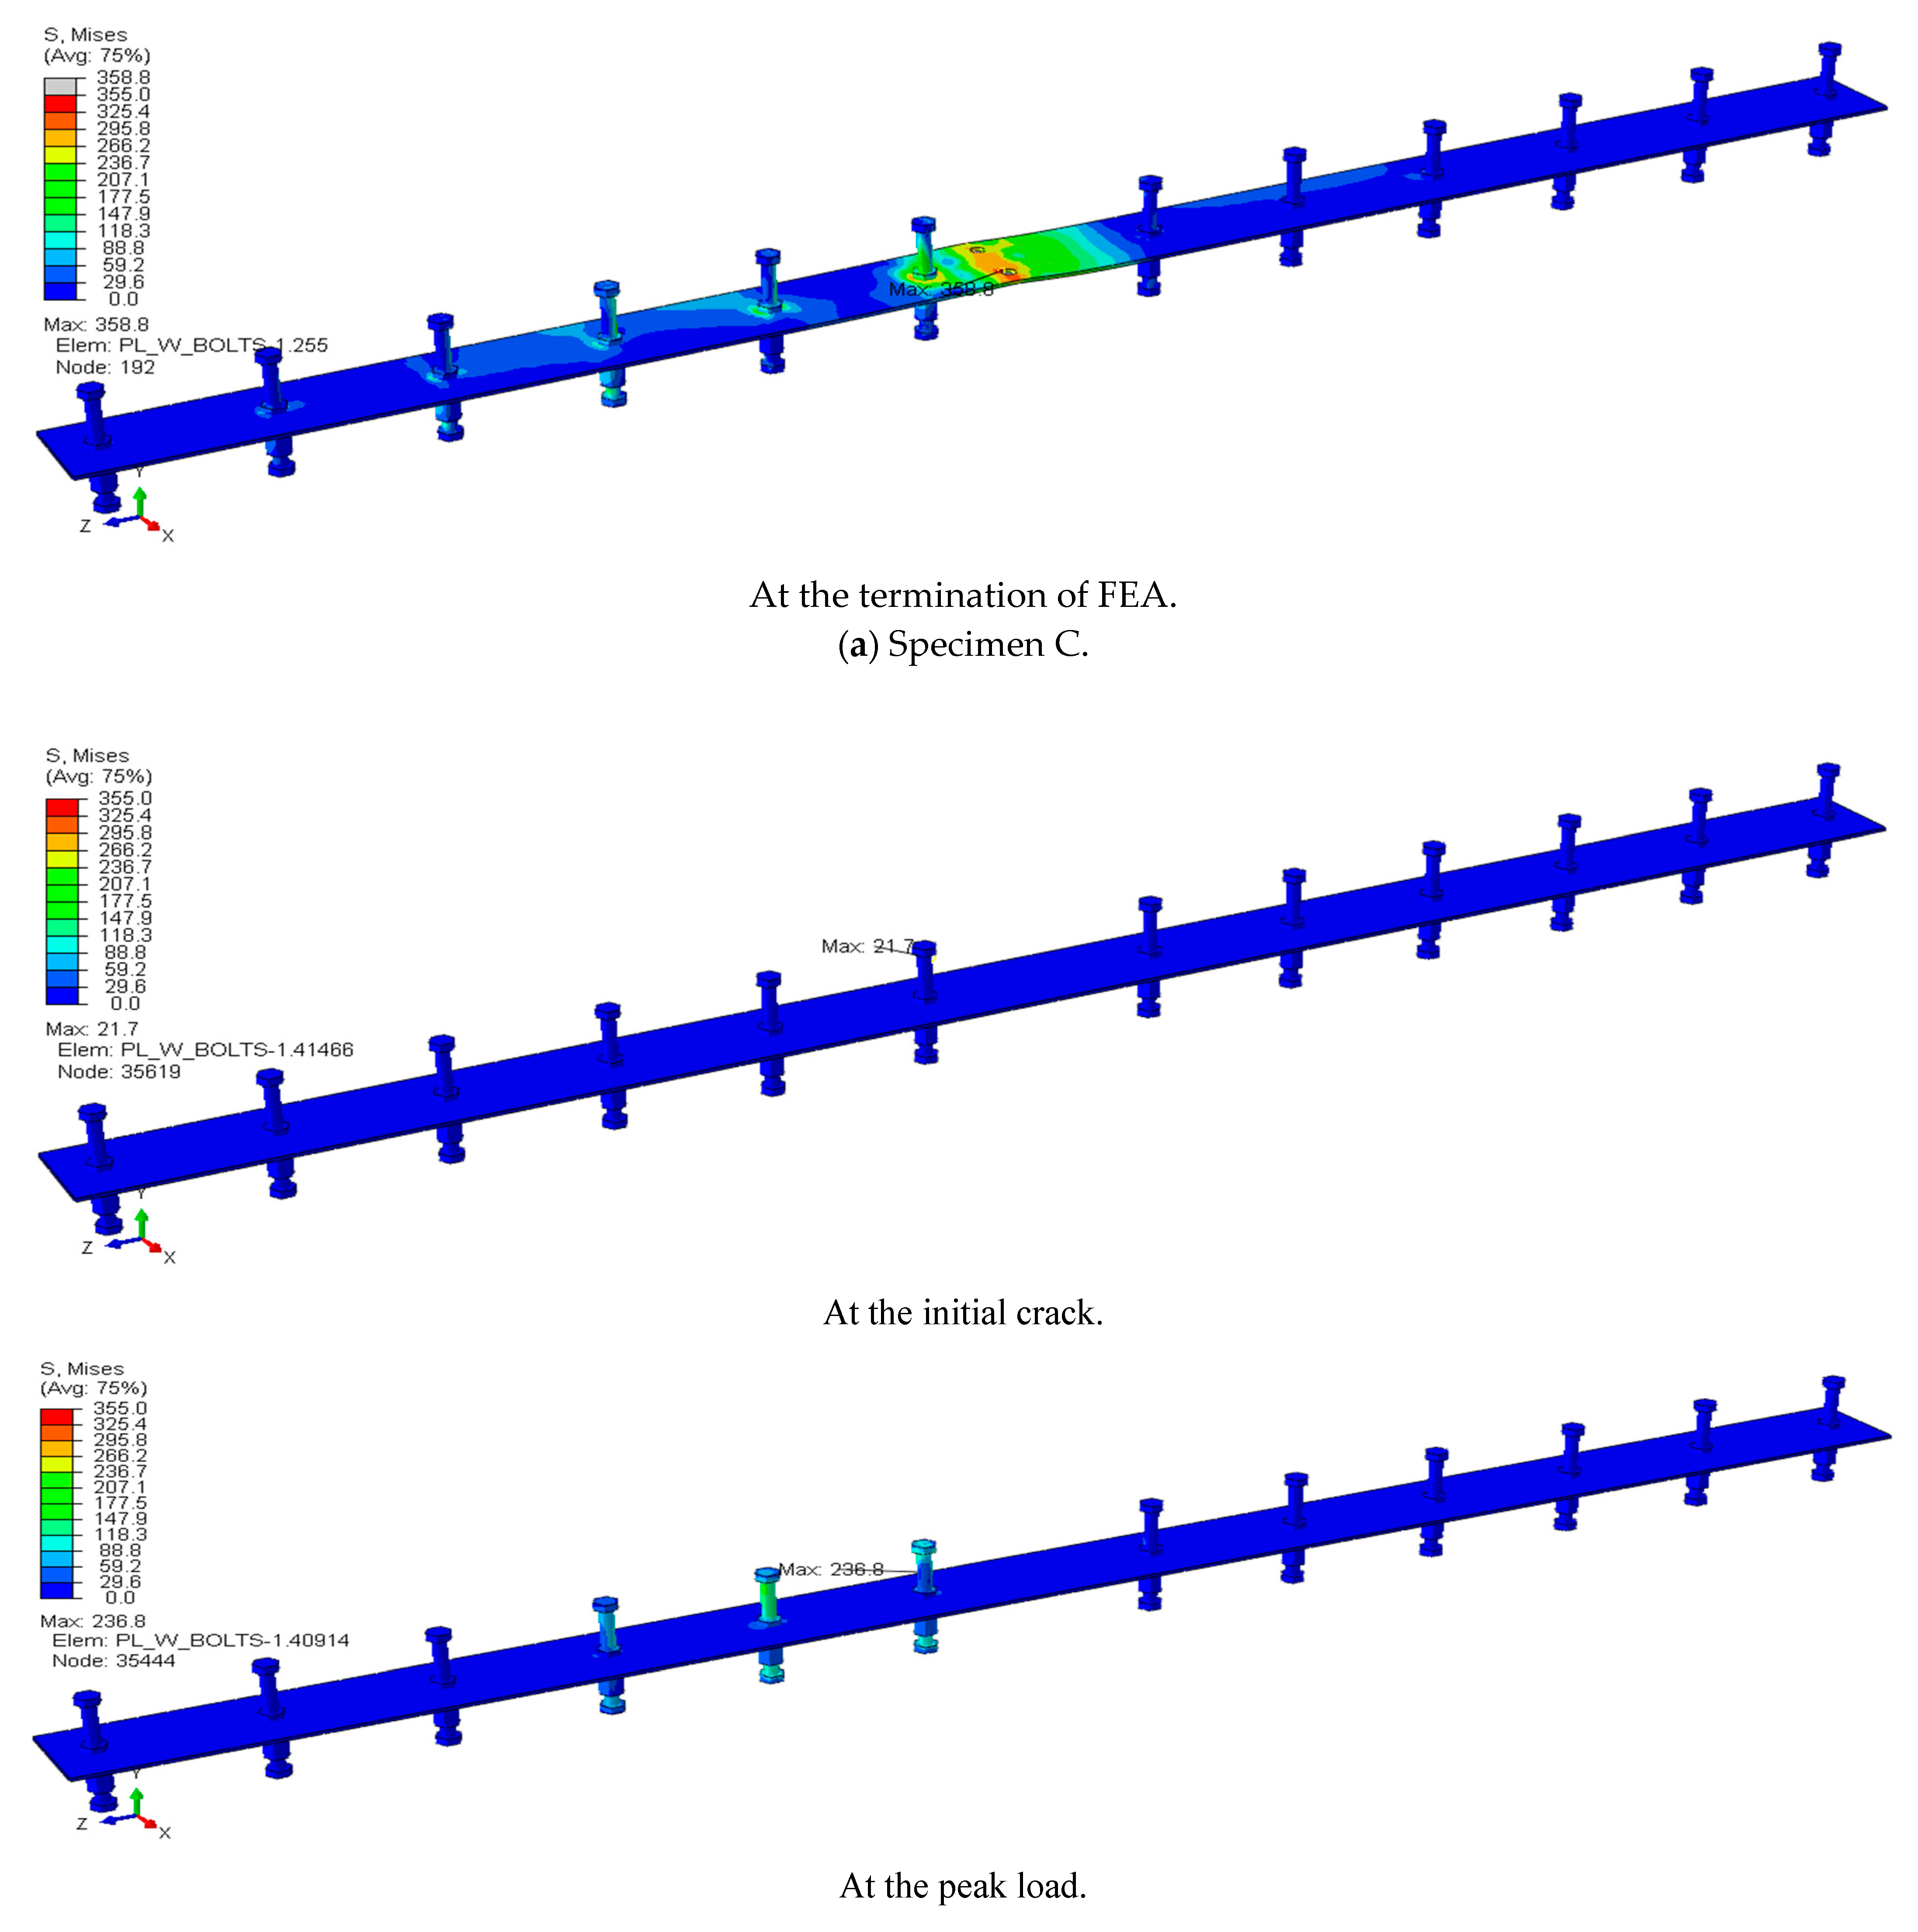
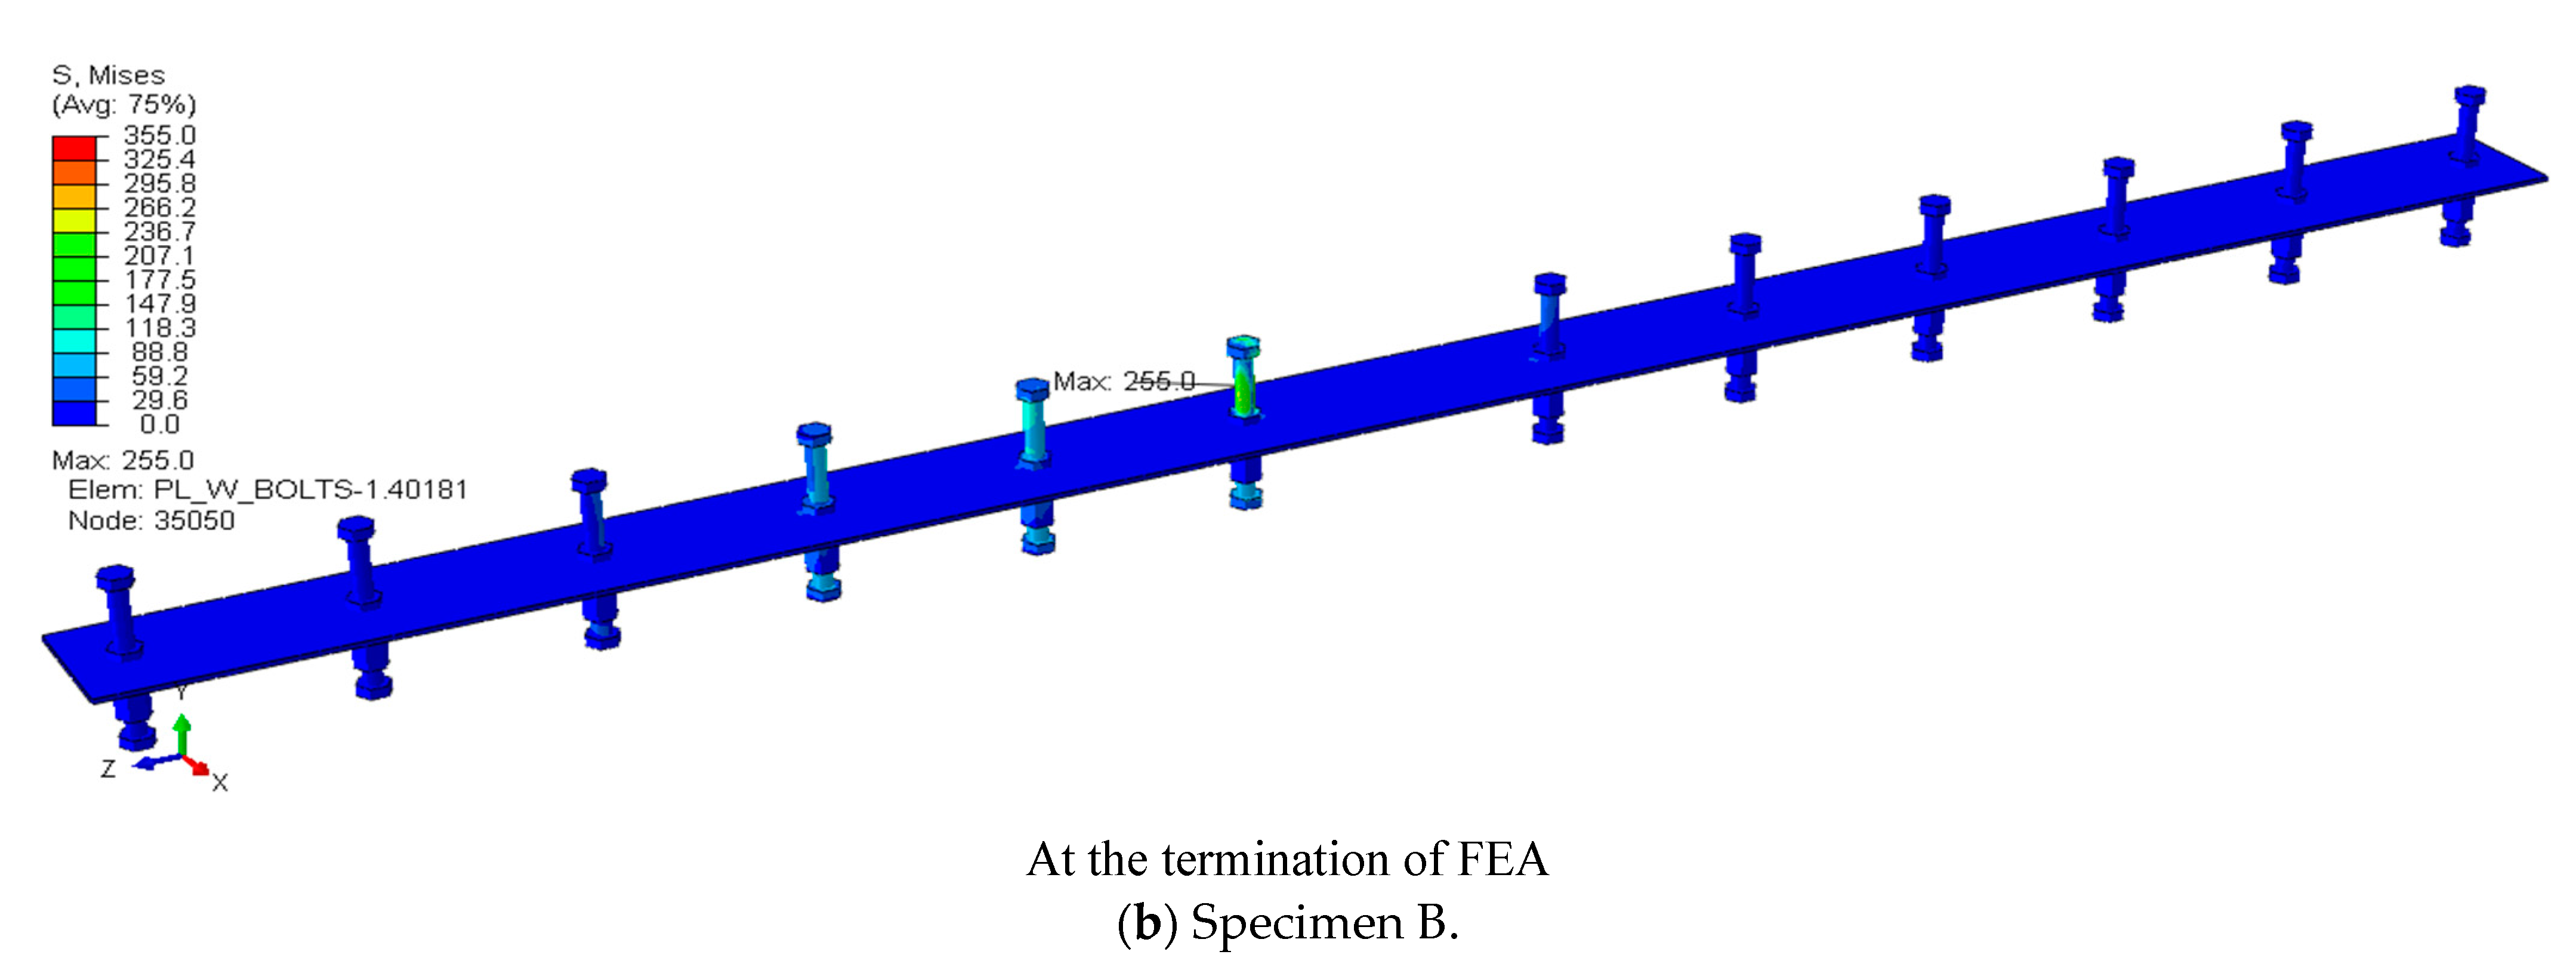
5.6. Stress of the Steel Plate and Socket-Type Shear Connector (SSC)

Figure 11 and Table 6 present the von Mises stress of the steel plate and SSC based on the FEA results according to each stage described in the section on the load–deflection relationship. In the SCBW specimens with the longitudinal reinforcing bars of the slab anchored in the CIP (Specimen C), the maximum stress in the steel plate and SSC occurred near the location penetrated by the longitudinal reinforcing bars of the slab. The stresses in the steel plate and SSC increased gradually and were 226.5 MPa and 153.2 MPa, respectively, at the point of yielding of the longitudinal reinforcing bar. Specifically, the stress in the steel plate reached the yield point after the peak load, whereas the SSC remained in an elastic state until the FEA was terminated. This implies that the steel plate located near the area penetrated by the longitudinal reinforcing bars of the slab played a crucial role in anchoring the longitudinal reinforcing bars of the slab. However, these trends were completely different from those observed in the SCBW specimens with the longitudinal reinforcing bars of the slab anchored on the basement wall (Specimen B). In Specimen B, at the initial crack, the maximum stresses in the steel plate and SSC occurred near the anchorage location of the longitudinal reinforcing bars of the slab in the basement wall section. After the initial crack, only the stress in the SSC installed in the basement wall section increased gradually. At the peak load, it reached 236.8 MPa, which is similar to the yielding strength of the SSC. However, the stress in the SSC and the steel plate installed in the CIP section remained in an elastic state until the FEA was terminated. This implies that the tensile stress in the longitudinal reinforcing bars of the slab was not transferred to the CIP at the composite basement wall junction.

6. Conclusions

To investigate the effect of the anchorage location of longitudinal reinforcing bars on the flexural behavior of slabs at the junction of composite basement walls, flexural tests and FEA of SCBW specimens were conducted. The following conclusions were drawn:
  • The SCBW specimens with the longitudinal reinforcing bars of the slab anchored in a CIP tended to exhibit conventional flexural behavior and failure modes in slabs governed by flexure, accompanied by the yielding of the longitudinal reinforcing bars. After the longitudinal reinforcing bars of the slab yielded, plastic plateau flow occurred in the load–deflection relationship.
  • The SCBW specimens with the longitudinal reinforcing bars of the slab anchored in the basement wall tended to show brittle slab behavior after the peak load due to splitting cracks occurring only in the basement wall section, with no cracks in the slab.
  • The flexural moment of the slab in the SCBW specimens with the longitudinal reinforcing bars anchored in the CIP was similar to the values predicted from ACI 318-19 and the FEA procedure, because the longitudinal reinforcing bars of the slab yielded.
  • The deflection ductility ratio ( μ Δ ) of the slab in the SCBW specimens with the longitudinal reinforcing bars of the slab anchored in the CIP was 2.14, which is similar to those obtained from the FEA and the model of Yang et al. [22]. Therefore, anchoring the longitudinal reinforcing bars by penetrating the steel plate into the CIP was an effective means of achieving ductile behavior in the slab.
  • After the peak load, the stress of the longitudinal reinforcing bars of the slab in the SCBW specimens with the longitudinal reinforcing bars anchored in the CIP exceeded 400 MPa in the region between the composite basement wall and 0.2 L along the slab.
  • In the slabs in the SCBW specimens with the longitudinal reinforcing bars anchored in the CIP, as the load increased, the stresses in the steel plate and socket-type shear connector gradually increased. In particular, the stress in the steel plate reached the yield point after the peak load, whereas the SSC remained in an elastic state until the FEA was terminated.
  • In the SCBW specimens with the longitudinal reinforcing bars of the slab anchored in the basement wall, the stresses in the longitudinal reinforcing bars of the slab, steel plate, and SSC installed in the CIP section remained in an elastic state even after the peak load. This is because the concrete splitting failure occurred along the anchored longitudinal reinforcing bars of the slab before the longitudinal reinforcing bars yielded.
  • Based on the flexural test and FEA results, it was determined that anchoring the longitudinal reinforcing bars by penetrating the steel plate into the CIP was effective in developing the ductile behavior of the slab. However, anchoring the longitudinal reinforcing bars to the basement wall was not effective in developing the ductile behavior of the slab, owing to the occurrence of concrete spalling and splitting cracks at the basement wall junction. Therefore, it is necessary to provide shear reinforcement to the basement wall junction to control concrete splitting failure, according to ACI 318-19 specifications.

Author Contributions

Conceptualization and writing—review and editing, S.K.; methodology, writing—original draft, formal analysis, and testing, J.-H.M. and J.-K.H.; data collection, critical review, formal analysis, and testing, K.-H.Y.; data collection, formal analysis, and testing, S.-M.K. and J.-I.S. All authors have read and agreed to the published version of the manuscript.

Funding

This work was supported by a Korea Agency for Infrastructure Technology Advancement (KAIA) grant, funded by the Ministry of Land, Infrastructure and Transport (Grant RS-2021-KA161331).

Data Availability Statement

The data presented in this study are available on request from the corresponding author.

Conflicts of Interest

The authors declare no conflict of interest.

References

  1. Hamad, R.J.; Haddad, R.H.; Johari, M.M. New anchorage system of bars to improve the mechanical performance of post-heated FRP-reinforced concrete beams. Constr. Build. Mater. 2019, 229, 117090. [Google Scholar] [CrossRef]
  2. Piątek, B.; Siwowski, T. Experimental study on flexural behaviour of reinforced concrete beams strengthened with passive and active CFRP strips using a novel anchorage system. Arch. Civ. Mech. Eng. 2022, 22, 45. [Google Scholar] [CrossRef]
  3. Monney, F.; Yu, Q.; Ruiz, M.F.; Muttoni, A. Anchorage of shear reinforcement in beams and slabs. Eng. Struct. 2022, 265, 114340. [Google Scholar] [CrossRef]
  4. ACI Committee 318; Building Code Requirements for Structural Concrete (ACI 318-19) and Commentary. American Concrete Institute: Farmington Hills, MI, USA, 2019.
  5. EN 1992-1-1; Eurocode 2: Design of Concrete Structures–Part 1-1: General Rules and Rules for Buildings. British Standards Institution: London, UK, 2004.
  6. Robuschi, S.; Lundgren, K.; Fernandez, I.; Flansbjer, M. Anchorage of naturally corroded, plain reinforcement bars in flexural members. Mater. Struct. 2020, 53, 38. [Google Scholar] [CrossRef]
  7. Singhal, S.; Chourasia, A.; Kajale, Y. Cyclic behaviour of precast reinforced concrete beam-columns connected with headed bars. J. Build. Eng. 2021, 42, 103078. [Google Scholar] [CrossRef]
  8. Zhu, Y.; Wu, J.; Xie, L. Experimental investigation on hysteretic performance and deformation patterns of single-side yielding precast concrete beam–column connection with energy dissipation bars. Eng. Struct. 2021, 245, 112841. [Google Scholar] [CrossRef]
  9. Chalot, A.; Roy, N.; Michel, L.; Ferrier, E. Mechanical behavior of a full-scale RC wall-slab connection reinforced with frp under cyclic loading. Eng. Struct. 2021, 239, 112146. [Google Scholar] [CrossRef]
  10. Wang, H.; Qian, H.; Guo, H.; Wang, D.; Liu, K.; Nian, F. Seismic performance of precast shear wall–slab joint with and without outer longitudinal reinforcement. Struct. Des. Tall Spéc. Build. 2021, 30, e1845. [Google Scholar] [CrossRef]
  11. Liu, R.-R.; Ding, R.; Zhou, M.; Wang, A.-Z.; Hu, L.-Y.; Fan, J.-S. Experimental and theoretical study on seismic behavior of slab-wall joints in a new large-span slab-shear wall structural system. Structures 2023, 49, 1112–1129. [Google Scholar] [CrossRef]
  12. De Maio, U.; Gaetano, D.; Greco, F.; Lonetti, P.; Pranno, A. The damage effect on the dynamic characteristics of FRP-strengthened reinforced concrete structures. Compos. Struct. 2023, 309, 116731. [Google Scholar] [CrossRef]
  13. De Maio, U.; Gaetano, D.; Greco, F.; Lonetti, P.; Blasi, P.N.; Pranno, A. The Reinforcing Effect of Nano-Modified Epoxy Resin on the Failure Behavior of FRP-Plated RC Structures. Buildings 2023, 13, 1139. [Google Scholar] [CrossRef]
  14. New Model Code Fib Special Activity Group; Taerwe, L.; Matthys, S. Fib Model Code for Concrete Structures 2010; Ernst & Sohn: Berlim, Germany, 2013. [Google Scholar]
  15. Rimkus, A.; Cervenka, V.; Gribniak, V.; Cervenka, J. Uncertainty of the smeared crack model applied to RC beams. Eng. Fract. Mech. 2020, 233, 107088. [Google Scholar] [CrossRef]
  16. Jeon, J.C. The Study Report of a New Type of Basement Composite Wall Commercialization Technology That Permanently structure Retaining CIP and IPP Piles with New High-Performance CSB Shear Connectors; Korea Agency for Infrastructure Technology Advancement: Seoul, Republic of Korea, 2021. [Google Scholar]
  17. ABAQUS. ABAQUS/CAE Users’ Guide, Version 6.24; Dassault Systems Simulia: Johnston, RI, USA, 2023. [Google Scholar]
  18. Nguyen, H.T.; Kim, S.E. Finite element modeling of push-out tests for large stud shear connectors. J. Constr. Steel Res. 2009, 65, 1909–1920. [Google Scholar] [CrossRef]
  19. Ellobody, E.; Young, B.; Lam, D. Behaviour of normal and high strength concrete-filled compact steel tube circular stub columns. J. Constr. Steel Res. 2006, 62, 706–715. [Google Scholar] [CrossRef]
  20. Xu, J.; Wang, Z.; Wang, P.; Pan, J.; Li, B. Numerical investigations on large size stiffened angle connections with different bolt patterns. J. Constr. Steel Res. 2021, 182, 106670. [Google Scholar] [CrossRef]
  21. Park, R.; Paulay, T. Reinforced Concrete Structures; Wiley Interscience Publication: Hoboken, NJ, USA, 1975. [Google Scholar]
  22. Yang, K.-H.; Mun, J.-H.; Im, C.-R. Longitudinal Reinforcement Ratios for Lightweight Concrete Beams. ACI Struct. J. 2021, 118, 33–45. [Google Scholar] [CrossRef]
Figure 1. Details of the SCBW specimens (unit: mm).
Buildings 13 01775 g001
Figure 2. Details of the slab composite basement wall junction.
Buildings 13 01775 g002
Figure 3. Test setup of the SCBW specimens (unit: mm).
Buildings 13 01775 g003
Figure 4. FEA procedures of the SCBW specimens using an ABAQUS program.
Buildings 13 01775 g004
Figure 5. Set-up of finite element meshes. (a) Concrete. (b) Steel plate and SSCs.
Buildings 13 01775 g005
Figure 6. Constitutive model of the concrete and reinforcing bars employed in FEA. (a) Concrete strength. (b) Concrete. (c) Reinforcing bar (test results). (d) Steel materials.
Buildings 13 01775 g006
Figure 7. Failure modes of the SCBW specimens. (a) Specimen C. (b) Specimen B.
Buildings 13 01775 g007
Figure 8. Load–deflection relationship of the SCBW specimens. (a) Specimen C. (b) Specimen B.
Buildings 13 01775 g008
Figure 9. Actions at the exterior slab composite basement wall junction caused by stress resultants.
Buildings 13 01775 g009
Figure 10. Maximum stress and strain of the longitudinal reinforcing bars in the slab.
Buildings 13 01775 g010aBuildings 13 01775 g010b
Figure 11. Von Mises stress of steel plate and SSC.
Buildings 13 01775 g011aBuildings 13 01775 g011bBuildings 13 01775 g011c
Table 1. Details of the SCBW specimens.
Speci-menMain ParameterIn the SlabIn the CIPIn the Basement Wall
Anchorage Location of the Longitudinal Reinforcing Bar of the SlabLongitudinal Reinforcing BarShear Reinforcing BarLongitudinal Reinforcing MaterialTransverse Reinforcing BarVertical Reinforcing BarHorizontal Reinforcing Bar
Diame-ter (mm) ρ s Diame-ter (mm) ρ v
CA 90° hook inside the CIP19 and 160.012130.005Steel plate (150 × 6) and 18- ϕ 16 ϕ 13 @ 2255- ϕ 16 and 3- ϕ 13 ϕ 13 @ 200 and ϕ 13 @ 400
Buildings 13 01775 i001
BA 90° hook inside the basement wall
Buildings 13 01775 i002
[Note ρ s = longitudinal reinforcing bar ratio, ρ v = shear reinforcing bar ratio.]
Table 2. Mechanical properties of the reinforcing materials in the SCBW specimens.
TypeYield Strength (MPa)Tensile Strength (MPa)Elastic Modulus (MPa)
ϕ 13437579206,596
ϕ 16467635196,805
ϕ 19506646197,584
Steel plate355490200,000
SSC240400
Table 3. Mechanical properties of steel materials used in FEA.
TypeYield Strength
(MPa)
Tensile Strength
(MPa)
E h
(MPa)
Steel plate3554900.02 E
SSC2404000.1 E
[Note: E h = hardening modulus, E = elastic modulus.]
Table 4. Summary of experimental results.
SpecimenExperimental Values
P y
(kN)
P n
(kN)
Δ y
(mm)
Δ n
(mm)
μ Δ ( E X P . ) M n ( E X P . )
(kN·m)
C123.5136.426.155.92.14177.3
B-99.0-28.1-128.7
[Note: P y = load at the yielding of the longitudinal reinforcing bars of the slab, P n = peak load, Δ y = deflection at P y , Δ n = deflection at P n , μ Δ ( E X P . ) = deflection ductility ratio, M n ( E X P . ) = maximum flexural moment.]
Table 5. Summary of predicted results obtained by FEA, the model of Yang et al., and ACI 318-19.
SpecimenPredicted ValuesComparison
FEA ResultsYang et al. [22]
( = 0.62 [ ( ω s 0.7 ( 1 + ω s ) 3 ) ( 2300 ρ c ) 0.5 ( a s d ) 0.1 ] 1.2 )
ACI 318-19 [4] μ Δ ( E X P . )
/ μ Δ ( F E A )
μ Δ ( E X P . )
/ μ Δ ( Y a n g   e t   a l . )
M n ( E X P . )
/ M n ( F E A )
M n ( E X P . )
/ ϕ M n ( A C I )
Δ y
(mm)
Δ n
(mm)
μ Δ ( F E A ) M n ( F E A )
(kN·m)
μ Δ ( Y a n g   e t   a l . ) ϕ M n ( A C I )
(kN·m)
C28.665.52.29175.52.30150.60.940.931.011.18
B-38.1-123.5-150.6--1.040.85
[Note: μ Δ ( F E A ) = deflection ductility ratio calculated by the FEA procedure, M n ( F E A ) = nominal flexural moment calculated by the FEA procedure, μ Δ ( Y a n g   e t   a l . ) = deflection ductility ratio calculated by Yang et al. [22], ω s = longitudinal reinforcing bar index, ω s = compressive longitudinal reinforcing bar index, ρ c = unit weight of concrete, a s = shear span, d = depth of the longitudinal reinforcing bar, ϕ = strength reduction factor, M n ( A C I ) = nominal flexural moment calculated by ACI 318-19.]
Table 6. The maximum stress based on the FEA results according to each stage described in the section on the load–deflection relationship.
SpecimenTypeMaximum Stress (MPa)
At the Initial CrackAt the Yielding of the Longitudinal Reinforcing BarAt the Peak LoadAt the Termination of FEA
CLongitudinal reinforcing bars in the slab84.7512.2596.7623.5
Steel plate and SSC13.1226.5287.5358.8
BLongitudinal reinforcing bars in the slab84.6-462.0411.3
Steel plate and SSC21.7-236.8255.0
Disclaimer/Publisher’s Note: The statements, opinions and data contained in all publications are solely those of the individual author(s) and contributor(s) and not of MDPI and/or the editor(s). MDPI and/or the editor(s) disclaim responsibility for any injury to people or property resulting from any ideas, methods, instructions or products referred to in the content.

