Article

Dynamic Responses of Concrete-Face Rockfill Dam to Different Site Conditions under Near-Fault Earthquake Excitation

1
School of Water Conservancy, North China University of Water Resources and Electric Power, Zhengzhou 450046, China
2
Henan Key Laboratory of Water Resources Conservation and Intensive Utilization in the Yellow River Basin, Zhengzhou 450008, China
3
School of Civil Engineering, Beijing Jiaotong University, Beijing 100044, China
4
Henan Provincial Communications Planning & Design Institute Co., Ltd., Zhengzhou 451400, China
*
Author to whom correspondence should be addressed.
Buildings 2023, 13(10), 2410; https://doi.org/10.3390/buildings13102410
Submission received: 6 September 2023 / Revised: 18 September 2023 / Accepted: 20 September 2023 / Published: 22 September 2023
(This article belongs to the Special Issue High-Performance Concrete Structures for Disaster Prevention)

Abstract

:
The western region of China is rich in hydropower resources and characterized by unique geological conditions. For the construction or planned construction of high dams in this region, different types of cover layers are formed due to special geological structures, most of which are located in high seismic intensity zones. This study focuses on four different site conditions: hard ground, medium–hard ground, medium–soft ground, and weak ground. By simulating the dynamic response of concrete-face rockfill dams under near-fault earthquake excitation, the vertical settlement of the dam and the attenuation of seismic motion under different site conditions are analyzed. The research findings reveal a consistent trend where the vertical settlement of the dams progressively escalates with increasing dam height across all four site conditions. This settlement phenomenon is especially pronounced in weak ground conditions, posing a potential risk of failure. Furthermore, when subjected to near-fault pulse-type earthquake motions, the existence of weak soil layers significantly dampens the seismic forces experienced by the dam. This finding suggests that the weaker the geological conditions of the site, the more pronounced the attenuation effect of the seismic motion. Additionally, the overburden layers have a noticeable amplification effect on near-fault pulse-type earthquake motion. However, this amplification effect is not significant in weak ground, possibly due to the presence of weak soil layers restricting the propagation and amplification of seismic motion. In conclusion, these research findings have practical significance for the dynamic response of high dam construction in different site conditions in the western region of China. They provide a scientific basis for the design and construction of high dams and serve as a reference for the implementation of seismic mitigation measures and earthquake disaster prevention in engineering projects.

1. Introduction

Deep cover layers, in geological terms, denote the sedimentary deposits that have accumulated over an extensive geological timespan within valley floors. These valleys have undergone river incision, eroding the landscape to depths ranging from tens to hundreds of meters below the current riverbed elevation. Over the course of geological history, these deposits have steadily amassed, resulting in the formation of loosely compacted sediments. Specifically, the term “deep cover layers” typically pertains to loose Quaternary sediments with thicknesses exceeding 30 m within riverbeds. Their predominant characteristics include a loose structural composition, discontinuous lithological features, and often, obscure demarcations between different soil layers. Extensive drilling data have substantiated the widespread occurrence of such thick cover layers in nearly all river systems throughout the western region of China [1,2,3].
In the engineering sites of Western China, there is a common occurrence of high seismic intensity and deep cover layers. Earthquakes with magnitudes of 6.5–7.0 or above typically generate abundant long-period seismic waves, and thicker cover layers are more likely to induce long-period seismic motion [4]. In long-period seismic waves, the characteristics of near-fault pulse-type seismic waves are particularly distinct, containing large amplitude velocity pulses, which often lead to severe damage to nearby engineering structures [5]. For instance, the 6.4 magnitude earthquake in Taiwan in 2016 produced abundant near-fault pulse-type seismic waves, resulting in the extensive liquefaction of sandy soils and the tilting and even collapse of numerous buildings, as well as causing significant economic losses [6]. In the “Seismic Design Code for Hydraulic Structures” (SL203–97) [7], building sites are classified into four types (Type I, II, III, and IV) based on the thickness of the cover layer and the equivalent shear wave velocity (Vs), as shown in Table 1. The presence of cover layer site types complicates the study of the dynamic response of deep cover layers in the foundation and dam body under pulse-type ground motions. In order to guarantee the safety and robustness of high concrete-face rockfill dam projects built upon deep or exceptionally deep cover layers, it becomes imperative to thoroughly examine the dynamic response characteristics of these four site types when subjected to long-period ground motions.
Many scholars worldwide have conducted seismic theory research. For instance, Karalar M et al. investigated the non-linear seismic behavior of the Oroville earth fill (EF) dam under six different near-fault seismic motions, considering both reflective (fixed) and non-reflective (free-field and quiet) seismic boundary conditions [8]. Avuli M et al. emphasized the significance of structural design with regard to vertical displacements and shear strains in earth fill (EF) dams in the context of structural engineering problems [9]. Cavuslu M et al. demonstrated that seismic damage resulting from the epicenter distance of an earthquake is one of the most critical issues in earthquake engineering [10]. According to existing research, Chinese scholars have also conducted relevant research work. For example, Mei Wei et al. [11] simulated the infinite boundary of weak soil layers in dam foundations and investigated the dynamic response relationship of concrete-face rockfill dams under near-fault pulse-type ground motions with different peak values. They found that under the influence of weak cover layers and near-fault pulse-type ground motions, as the input seismic intensity increases, liquefaction of the dam body initiates from the dam toe and gradually spreads to the upstream dam slope, leading to the overall settlement of the dam.
Zhang Xuedong et al. [12] conducted shaking table tests to study the influence of input acceleration peak values and soil layer characteristics on the propagation characteristics of seismic motions in deep cover layers. They found that when the peak acceleration of the seismic motion remains constant, the amplification factor gradually increases with the increase in the shear stiffness of the soil.
Yang Zhengquan et al. [13] considered the structural characteristics of deep cover layers and established a layered foundation model with weak-fine sand to investigate the influence of cover layer structural characteristics on seismic response.
Yu Ting et al. [14] established a special thick cover layer with weak soil layers at a depth of 500 m and studied the propagation effects of seismic motions in the cover layer in terms of the cover layer thickness, input acceleration peak values, and thickness of weak soil layers. They concluded that the presence of weak soil layers in the cover layer leads to the secondary attenuation of the seismic motion due to the filtering and isolation effects.
Shen Hui et al. [15] analyzed the dynamic response of a 250-m-high rockfill dam on a cover layer foundation containing a dam foundation sand layer. The analysis results showed that the cover layer sand does not liquefy under the seismic excitation of artificial ground motion spectra, while liquefaction occurs in the dam foundation sand layer, and the affected area is extensive.
The concrete-face rockfill dam (CFRD) exhibits superior seismic performance and deformation control in dynamic response compared to traditional dam types. However, analyzing its dynamic response requires a comprehensive consideration of the characteristics of both the concrete-face panels and the rockfill structure, as well as the foundation conditions. In engineering practice, to ensure the safe and stable operation of the CFRD, appropriate seismic design and reinforcement measures should be selected based on specific circumstances.
Existing research has primarily focused on single-site conditions and has not comprehensively explored the dynamic response patterns of different-height concrete-face rockfill dams under each site condition. Therefore, this study selects already constructed CFRDs as the research subjects and specifically investigates the dynamic responses of different-height CFRDs with deep cover layers under near-fault pulse-type seismic motions in various site conditions. The novelty of this study lies in employing finite element analysis to assign material properties for deep cover layers to four different site conditions: hard, medium–hard, medium–soft, and soft. By inputting near-fault pulse-type seismic motions, this study analyzes the acceleration response, displacement response, residual deformation, and other outcomes of CFRDs under different deep cover layer site conditions. Further details of the research are elaborated in the subsequent sections.

2. Computational Model and Parameters
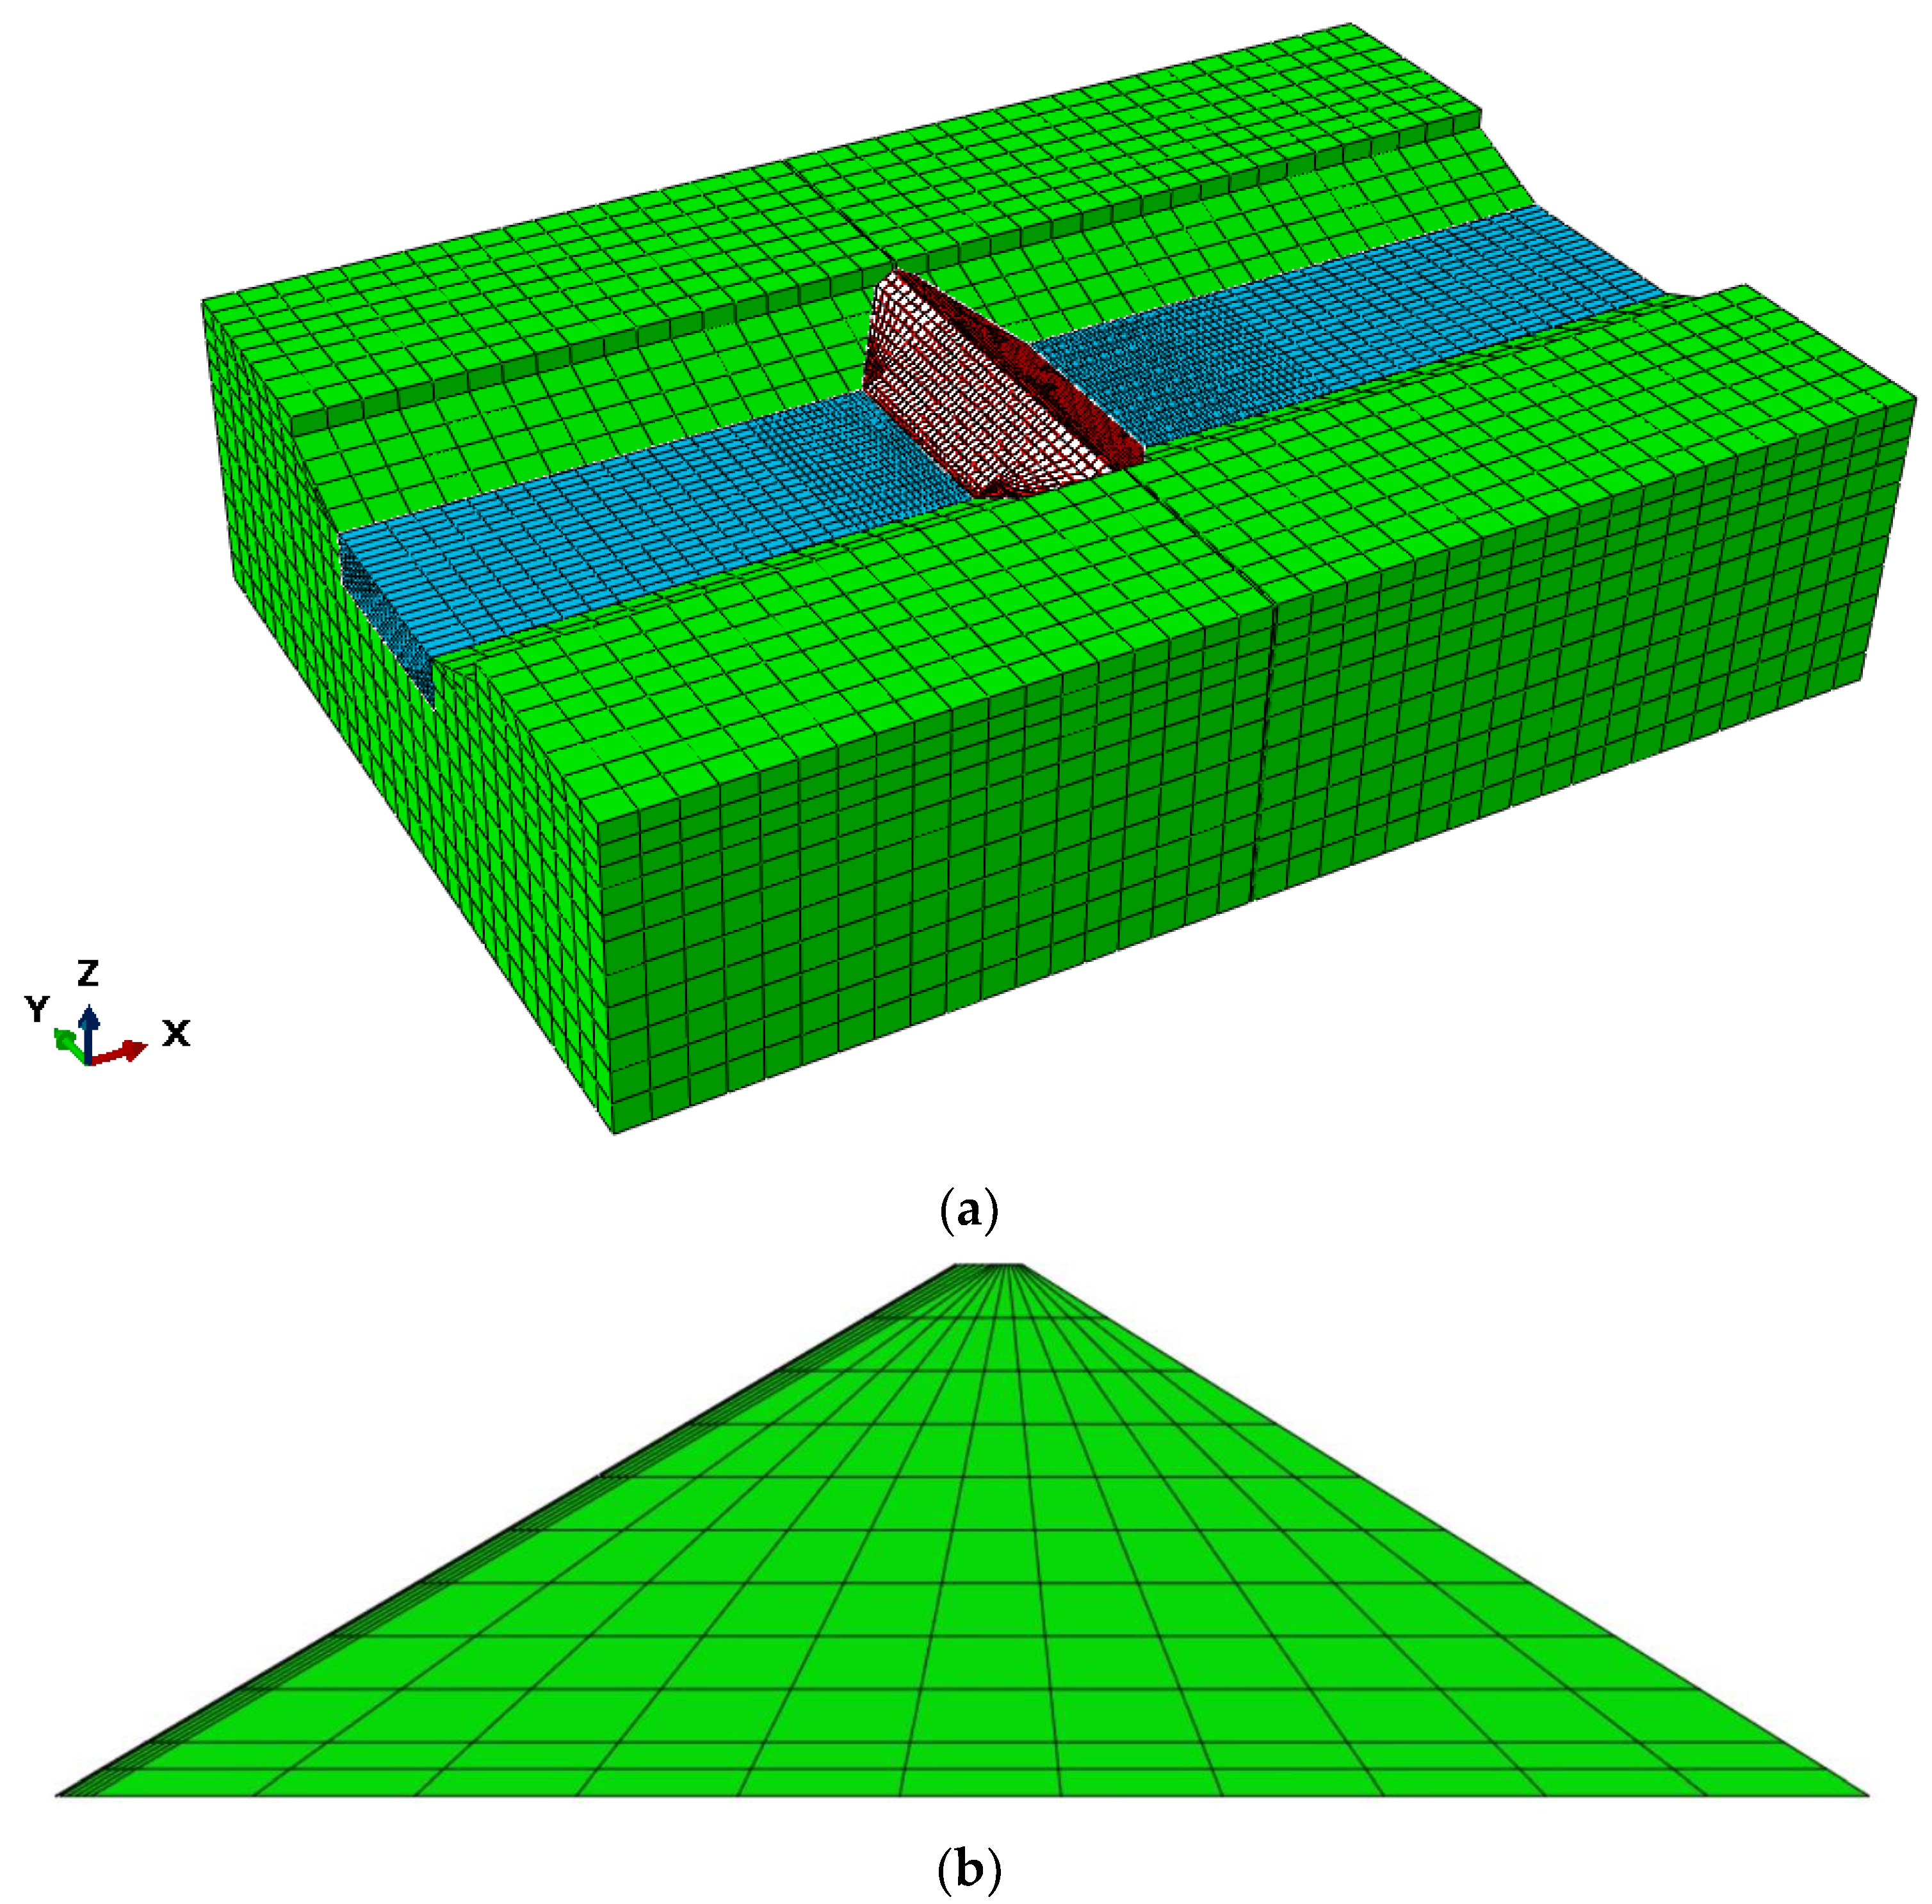
2.1. Model Overview

According to the relevant information about the Altash Water Conservancy Project in Xinjiang, the designed water-retaining structure is a concrete-face rockfill dam. We built models using ABAQUS Finite Element Analysis Software (ABAQUS2018 version): The dam’s height is 100 m, and in the subsequent analysis of dam vertical settlement, dam models of 200 m and 300 m were also considered, and the upstream and downstream slope ratios are 1:1.7 and 1:1.6, respectively. The dam crest’s width is 12 m. The normal water level is maintained at a height of H-10 m, where H represents the dam’s height. The panel thickness is h = 0.3 + 0.0035 H [16].
The sedimentary cover layer had a depth of 100 m. The length of the model in the horizontal direction was selected to be sufficiently long, considering the computational capacity of the computer, to minimize errors introduced by truncation boundaries [17]. For this study, the length was set at 25 times the thickness of the cover layer. The width and depth of the model were approximately twice the length of the dam in the same direction, and the dam was placed on an elastic foundation. The influence of the elastic assumption on the results was negligible. The three-dimensional finite element model and mesh of the 100-m-high dam are shown in Figure 1 (a total of 38,700 elements and 46,493 nodes and different colors represent different instances of components).

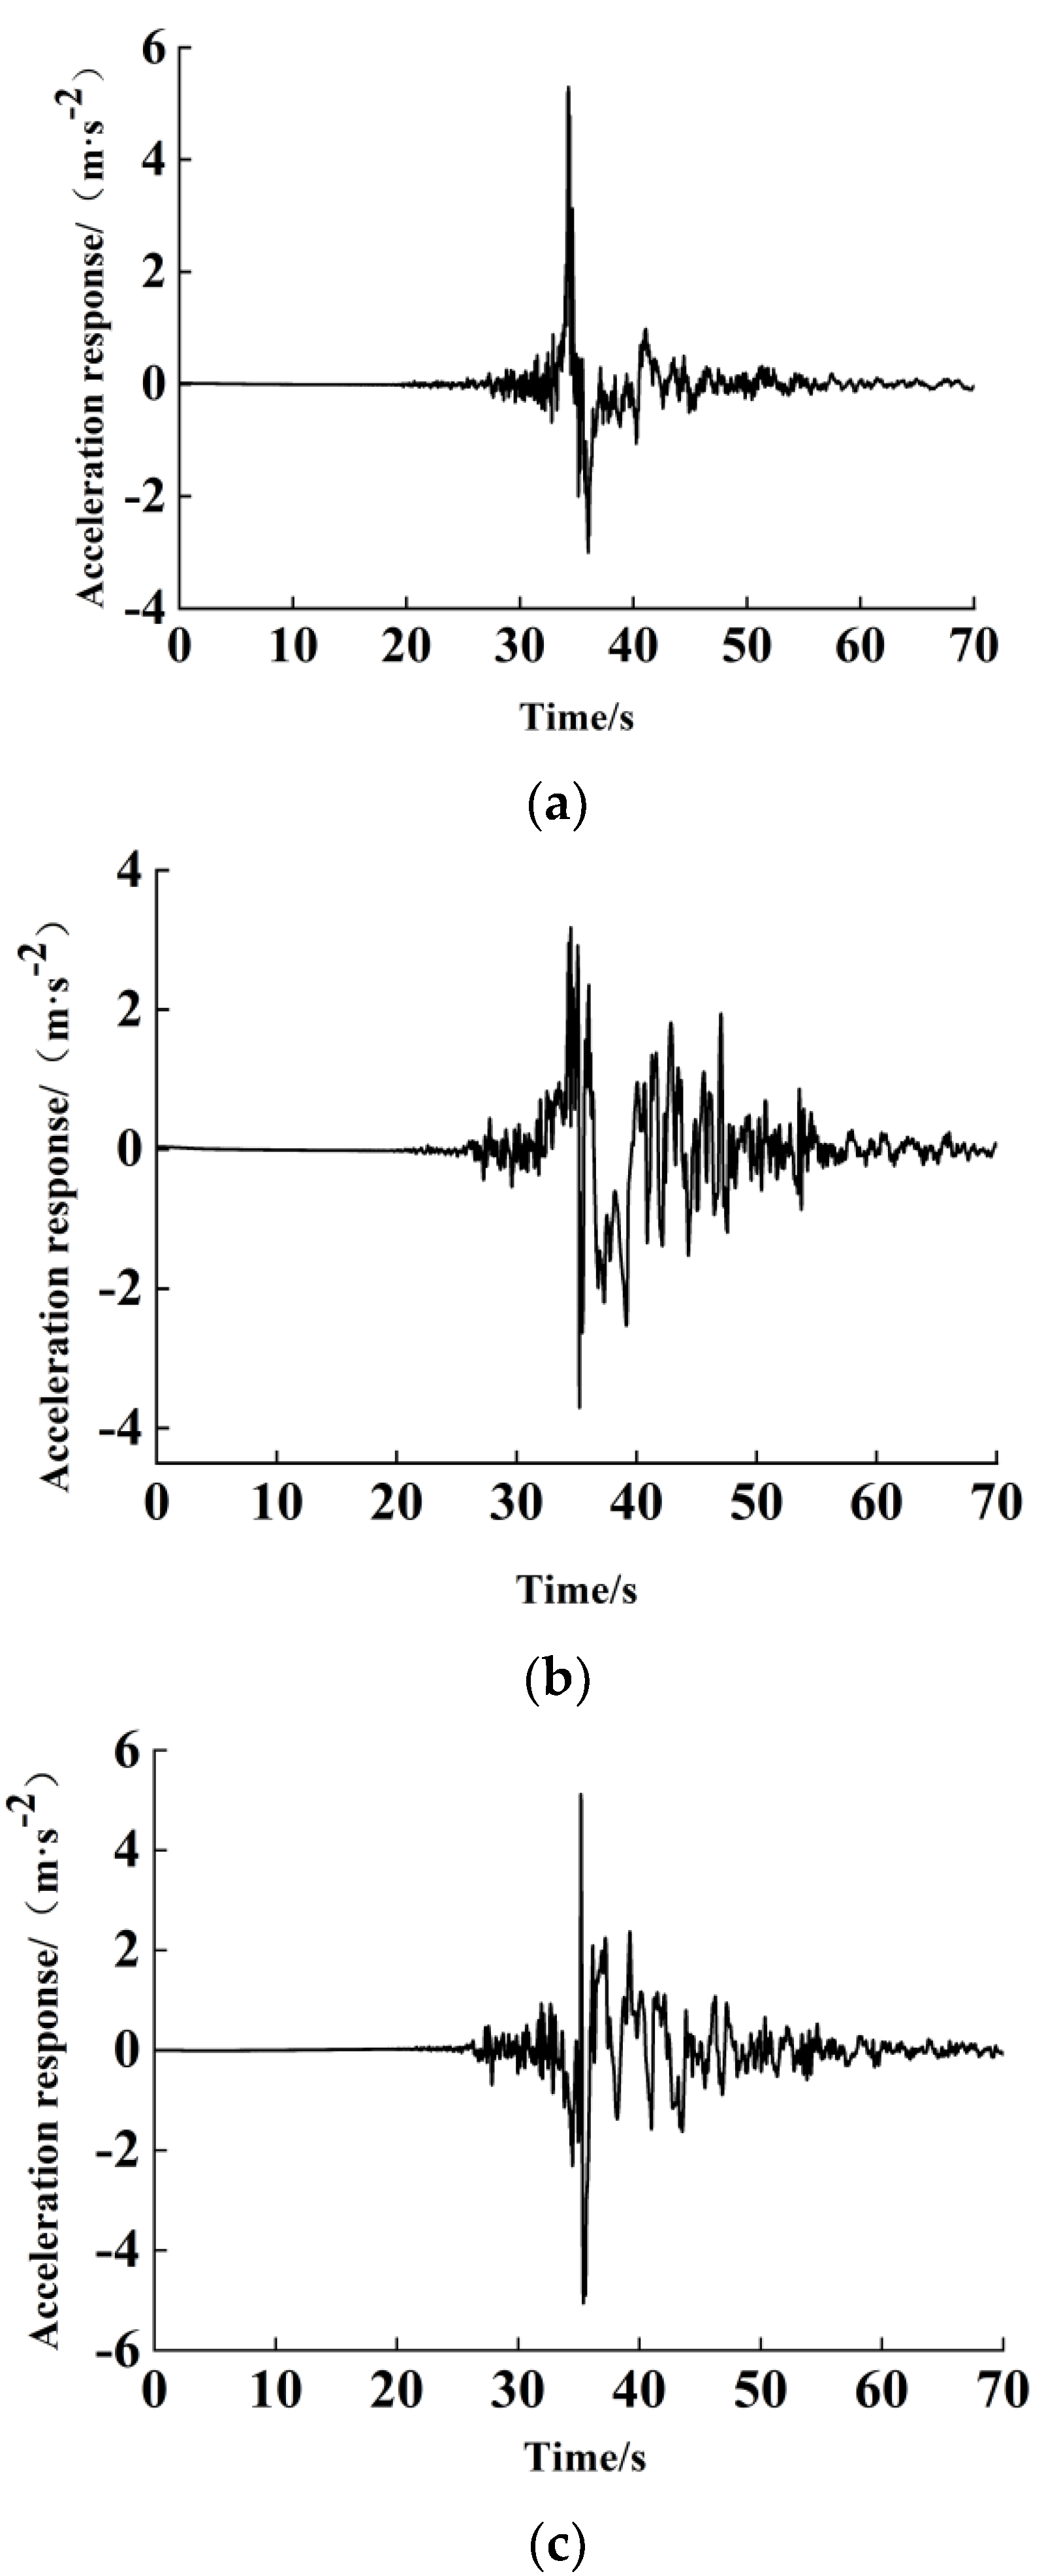
2.2. Seismic Motion Input

A substantial volume of statistical data pertaining to long-period ground motions has been amassed since their initial discovery. Long-period ground motions encompass earthquake motions distinguished by pronounced pulse-like accelerations and extended characteristic periods. Notably, near-fault pulse-type ground motions exhibit comparatively brief durations, elevated peak accelerations, and conspicuous pulse-like attributes [18]. In this study, a representative near-fault pulse-type ground motion (TCU068) from the PEER Ground Motion Database [19] (Pacific Earthquake Engineering Research Center) for the Chi-Chi earthquake in Taiwan was selected. A time duration of 35 s, ranging from 25 s to 60 s, was used for dynamic calculations. The peak accelerations in the along-river and vertical directions were both set at 5.12 m/s², while the peak acceleration in the dam axis direction was set at 3.18 m/s². The vertical peak acceleration is commonly accepted in the seismic engineering community to be 2/3 (approximately 0.667) of the along-river peak acceleration. The corresponding acceleration time histories for the three directions are shown in Figure 2.

2.3. Static Analysis Method

The static analysis adopted the Duncan–Chang E-B model [20]. Based on Biot’s consolidation theory, it simulated the construction of the concrete-face rockfill dam, upstream water storage, and settlement of the cover layer. It also provided the initial stress field required for dynamic analysis.
The tangent elastic modulus E t is given via the following equation:
E t = K P a ( σ 3 P a ) n [ 1 ( R f ( 1 sin φ ) 2 c cos φ + 2 σ 3 sin φ ( σ 1 σ 3 ) ] 2
In the equation, the following parameters are defined: k ,   n ,   φ ,   c ,   a n d   R f are the internal friction angle, represents the cohesive strength of the material, and is the failure ratio, which ranges from 0.75 to 1.0. These five parameters can be determined through triaxial tests.
According to the “Seismic Design Code for Hydraulic Structures”, the site conditions were classified into four types. Based on existing research and corresponding to hard ground soil [21], medium–hard ground soil [22], medium–soft ground soil [23], and weak ground soil [24], the Duncan–Chang E-B parameters for these four types were collected. These parameters were used in static analyses for the hard cover layer, medium–hard cover layer, medium–soft cover layer, and weak cover layer, respectively. The parameters for the concrete-face rockfill dam and the cover layer are compiled from indoor large triaxial test results, as shown in Table 2, and the panel parameters are presented in Table 3.

2.4. Dynamic Analysis Method

The dynamic analysis adopted an equivalent linear model, specifically the Hardin model [25], which can be expressed as follows:
τ = γ 1 G max + γ τ max
Equivalent shear modulus:
G = τ γ = 1 1 G max + γ τ max = G max 1 + γ γ r
Equivalent damping ratio:
λ = λ max ( 1 G G max ) λ
In the equation: τ —Dynamic shear stress; γ —Dynamic shear strain; γ r —Reference shear strain; τ m a x —Shear strength; λ m a x —Maximum damping ratio; G m a x —Maximum shear modulus, as determined via the following equation:
G max = K P a ( σ 0 P a ) n
In the equation, the variables represent the following measures: K —The dynamic properties constant of the rockfill material, which changes according to factors such as void ratio and shear strain; P a —Atmospheric pressure; σ 0 —Average effective stress; n —Experimental parameter, which varies with the consolidation ratio of the rockfill material.
The dynamic parameters of the concrete-face rockfill dam and the cover layer were summarized from the results of previous studies via large-scale triaxial tests, as shown in Table 4.

2.5. Residual Deformation Calculation Method

For the calculation of residual deformation, Shen Zhujiang’s residual shear deformation model [26] was employed. This model was sequentially applied to the models after the four dynamic analyses to calculate the permanent deformation.
Δ ε v r = c 1 γ d c 2 exp ( c 3 S 1 2 ) Δ N 1 + N
Δ γ r = c 4 γ d c 5 S 1 2 Δ N 1 + N
In the equation, the variables represent the following measures: ε v r —Residual volumetric strain; γ r —Residual shear strain; S l —Shear stress level; γ d —Dynamic shear strain; N —Vibration cycles within the time period; N —Number of vibrations. c 1 to c 5 are model input parameters determined through experiments.
The transformation formula for the incremental residual strain in a Cartesian coordinate [27] system is as follows:
Δ ε p = Δ ε x Δ ε y Δ ε z Δ ε x y Δ ε y z Δ ε z x = 1 3 Δ ε v p 1 1 1 0 0 0 + Δ γ p q σ x p σ y p σ z p 2 τ x y 2 τ y z 2 τ z x
In the equation, Δ ε p represents the incremental residual strain in a Cartesian coordinate system, τ o c t represents the octahedral shear stress, p = 1 3 ( σ 1 + σ 2 + σ 3 ) represents the average principal stress, and q = 1 2 [ ( σ 1 σ 3 ) 2 + ( σ 2 σ 3 ) 2 + ( σ 3 σ 1 ) 2 ] 1 2 represents the generalized shear stress.
By implementing a stiffness transformation matrix across the model volume, it became possible to derive equivalent nodal forces at each node within the model. The mathematical expression is detailed as follows:
Δ F = V B T D Δ ε p d V
In the equation, B represents the strain transformation matrix, and D represents the stiffness matrix.
After obtaining the equivalent nodal forces, they were utilized as initial stresses [28] for conducting a static analysis of the dam body. The resulting displacements from this analysis represented the cumulative permanent deformations caused by seismic motion.

3. Analysis of Simulation Results Based on ABAQUS

Firstly, this paper employs eight-node linear hexahedral reduced-integration elements (C3D8) as the element type for modeling the cover layer, dam body, and panels. Secondly, the Duncan–Zhang E-B constitutive model is selected for the deep cover layer of the concrete-face rockfill dam as part of the static finite element analysis method, while a non-linear elastic constitutive model is chosen for the analysis. Regarding the interaction and contact surface modeling between the concrete panels and the cushioning rockfill material, the Goodman contact element is utilized for simulation. Finally, considering the complex stress–strain relationships between the deep cover layers and the rockfill body under long-period seismic loads, an equivalent viscoelastic dynamic constitutive model is applied to complete the dynamic finite element analysis of the model.

3.1. Static Calculation Results

ABAQUS [29,30] is powerful engineering simulation finite element software capable of performing precise simulation and analysis from relatively simple linear analyses to many complex non-linear problems. The constitutive models used in this study are not inherently available in ABAQUS, so they require secondary development. The models are implemented through programming in the Fortran computer language and then integrated into the software for finite element simulation and analysis.
Based on the results of finite element static calculations, we have observed a consistent trend among the four site types, ranging from hard to weak. To facilitate a comparative analysis, we are presenting contour maps of maximum principal stresses and displacement cloud maps for both hard soil and weak soil properties. Figure 3 and Figure 4 depict the contour maps of maximum principal stresses for these two cases. Upon the completion of upstream water storage, it is evident in Figure 3, which represents the hard soil and thick cover layer scenario, that the stress distribution within the dam body is relatively uniform. Most regions exhibit lower stress levels, indicating a lower likelihood of shear failure. The cover layer demonstrates good load-bearing capacity. Conversely, in the case of weak soil and a thick cover layer, as depicted in Figure 4, the stress distribution within the dam body is irregular. Significant principal stresses are concentrated at the bottom and toe of the dam body, leading to stress concentration at these areas. This non-uniform stress distribution results in uneven settlement and shear deformation.
Figure 5 and Figure 6 show the displacement cloud maps of the maximum cross-sectional along-river displacements for the dam body with a thick cover layer in the hard and weak soil conditions, respectively. The downstream direction is considered positive for displacements [31]. Figure 5 depicts the displacement distribution of the dam body in the hard soil condition. Under the influence of self-weight and the static water pressure from upstream water storage, the maximum cross-sectional along-river displacements exhibit a symmetric distribution along the dam axis, with deformation primarily occurring toward the middle section. Figure 6 illustrates the displacements of the dam body in the weak soil condition. Due to the influence of upstream water pressure, the horizontal displacements concentrate at the dam toe, distributed along the dam axis, with deformation mainly concentrated in the middle section. The deformations on both sides toward the middle section are significantly larger than those in the hard soil condition, being approximately 16 times greater.
Figure 7 shows the settlement change in different soil properties at the same dam height and the settlement change in the same soil quality with the increase in dam height.
Figure 7 is a three-dimensional visualization of dam settlement, which specifically illustrates two aspects: ① the variation in the settlement of dams at the same height under different soil conditions, and ② the change in settlement as the dam height increases (from 100–200 m and 200–300 m) under the same soil conditions. The following conclusions can be drawn: ① For all three dam heights, the settlement gradually increases from hard soil conditions to soft soil conditions, with the smallest settlement occurring in hard soil conditions and the largest occurring in soft soil conditions. ② Under constant soil conditions, as the dam height increases, the settlement also increases, and this increase is particularly noticeable under soft soil conditions.

3.2. Dynamic and Residual Deformation Calculation Results

For the model, three-component seismic motions were inputted, and the acceleration amplitudes of the cover layer were outputted. The response spectra of the acceleration under the effect of near-fault seismic motions for the four types of thick cover layers were plotted using seismic analysis software [32]. Table 5 summarizes the calculation results of the maximum acceleration values at the dam crest obtained from the inputted near-fault seismic waves (considering the dam crest to be the location of the acceleration response). The values represent the peak accelerations and correspond to the amplification factor for the respective accelerations. Starting from the elevation of 0 m at the bottom of the cover layer, the acceleration response spectra were taken at elevations of 0 m (rock input), 50 m (mid-section position), and 100 m (dam foundation level), as shown in Figure 8.
Based on Table 5 and Figure 8, the following conclusions can be drawn: under the influence of the thick cover layer, the effect of the site soil on the panel dam decreases gradually from hard soil to weak soil under long-period seismic motion. In fact, in the case of weak soil conditions, there is a noticeable weakening effect on long-period seismic motion [33]. This is reflected in the decreasing values of the acceleration response spectra at the dam crest. One possible reason for this effect could be the low dynamic shear modulus of weak soil layers.
Furthermore, as the elevation along the cover layer increases, the amplification factor of the acceleration becomes larger [34]. Additionally, at the same elevation, the acceleration response spectra values decrease in the following order: hard soil, medium–hard soil, medium–soft soil, and weak soil. This observation further supports the notion that weak soil weakens long-period seismic motion.
Taking a 100-m-high dam as an example, Figure 9 provides clear evidence of the gradual reduction in residual deformation as the ground transitions from hard to weak conditions. This trend is apparent in both the downstream and vertical displacements of the dam.
In practical engineering, it is common for deep overburden layers to induce residual deformations in the hard ground. We calculated the permanent vertical settlement of dams with heights of 100, 200 and 300 m. As shown in Figure 10, the vertical permanent deformation is observed at the maximum cross-section of the dam body at three different heights. The permanent settlement for a 100-m-high dam is 1.35 m, accounting for 1.35% of the dam height. For a 200-m-high dam, the permanent settlement is 1.1 m, which is 0.5% of the dam height. The 300-m-high dam experiences a permanent settlement of 2.1 m, accounting for 0.7% of the dam height. And the relationship between the distribution of results and the dam structure is not very clear. Upon observing Figure 11 as a whole, the seismic subsidence in the 200-m-high dam is the most suitable and reasonable among the three models. The largest seismic subsidence occurs in the 300-m-high dam, suggesting that more effective seismic reinforcement measures should be taken for dams of this height in engineering projects.
These analytical results provide a quantitative assessment of the permanent vertical settlement and seismic deformation for different dam heights [35]. Based on the findings of permanent settlement and seismic deformation, they serve as references for the design and construction of high dams, guiding the implementation of appropriate seismic reinforcement measures for dams of different heights to ensure the safety and reliability of the engineering project.

4. Conclusions

Based on the finite element simulation calculations, this paper summarizes the static and dynamic responses of the dam body on different types of thick cover layers to long-period seismic motion. By analyzing the maximum principal stresses, horizontal displacements, peak acceleration responses at the dam crest, acceleration spectra values at different elevations in the cover layer, and characteristics and distribution of residual deformation in the dam body, the following conclusions are drawn:
(1)
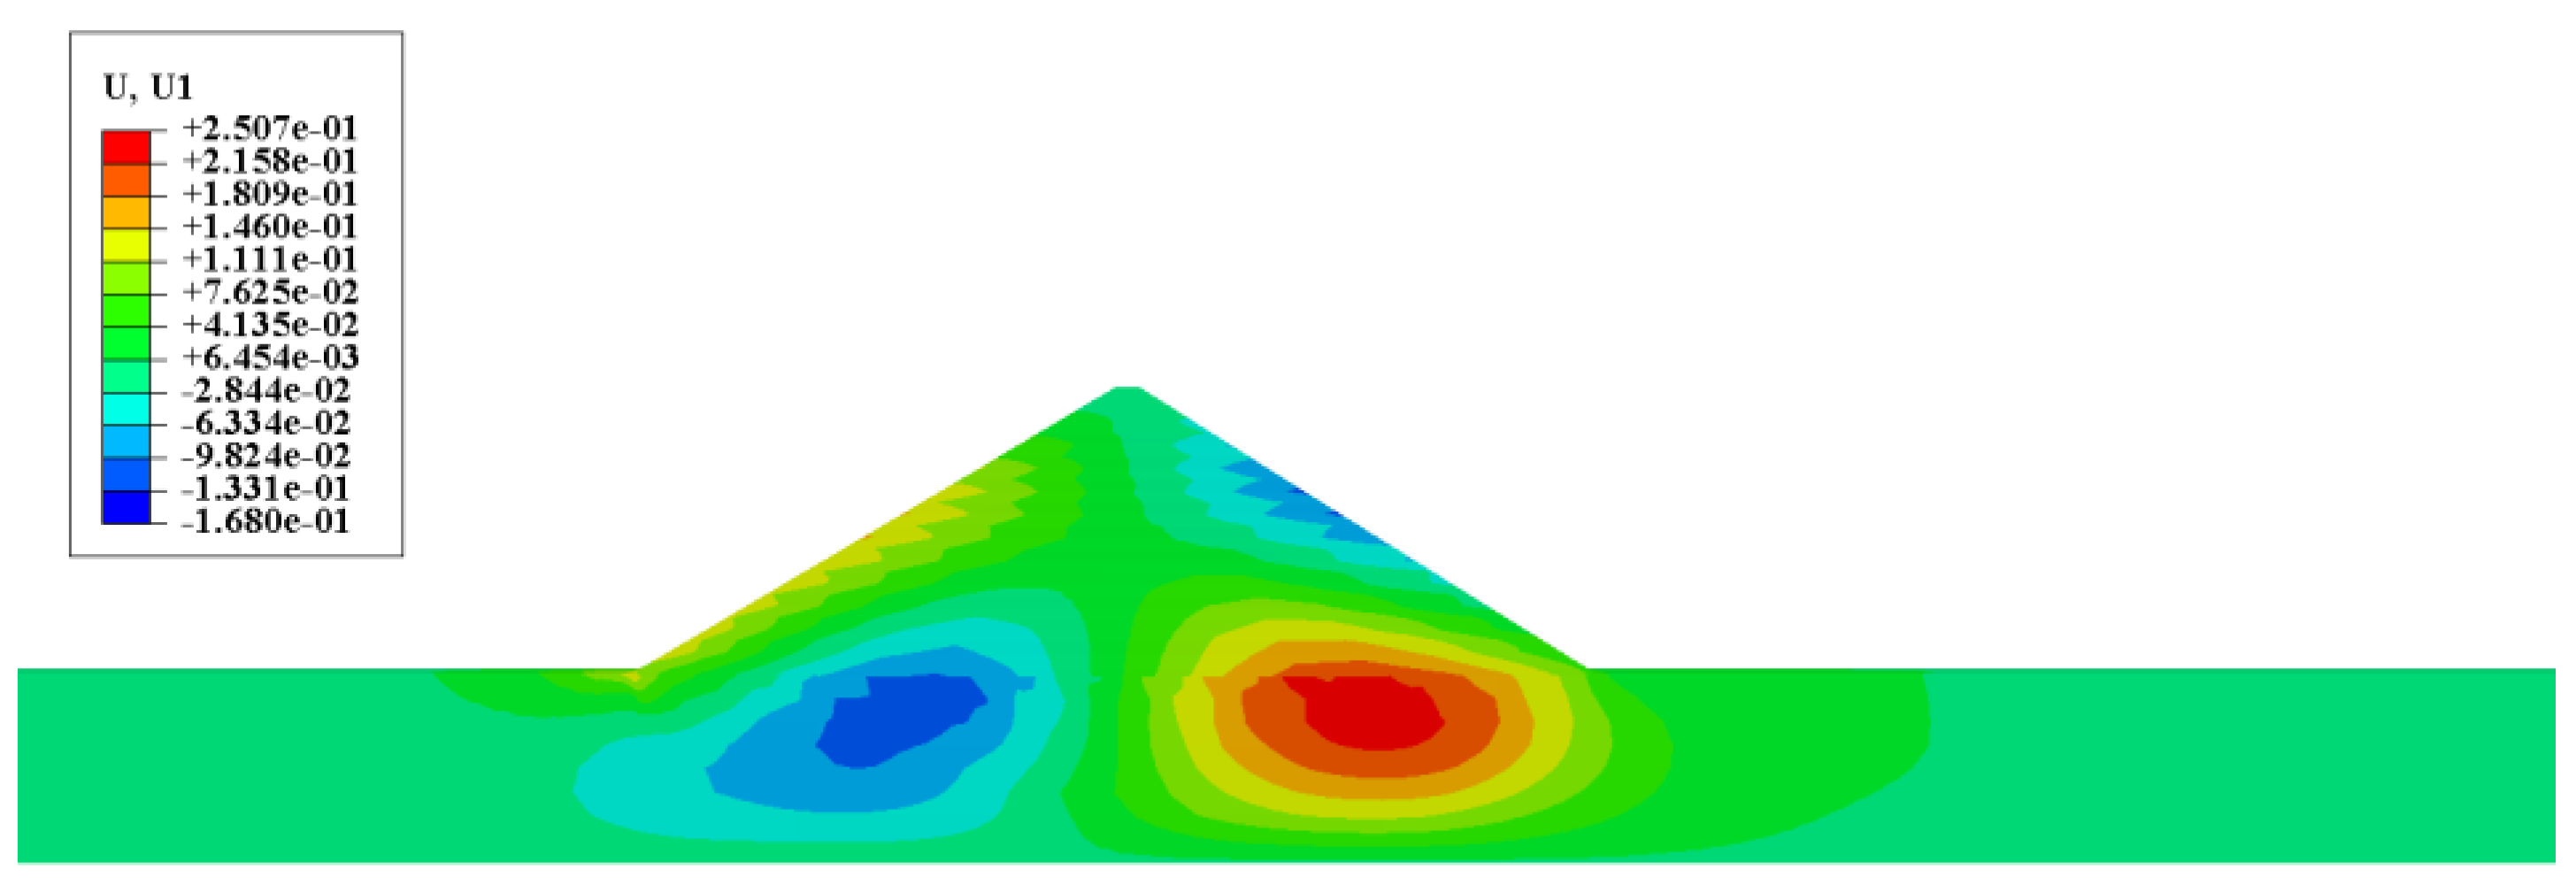
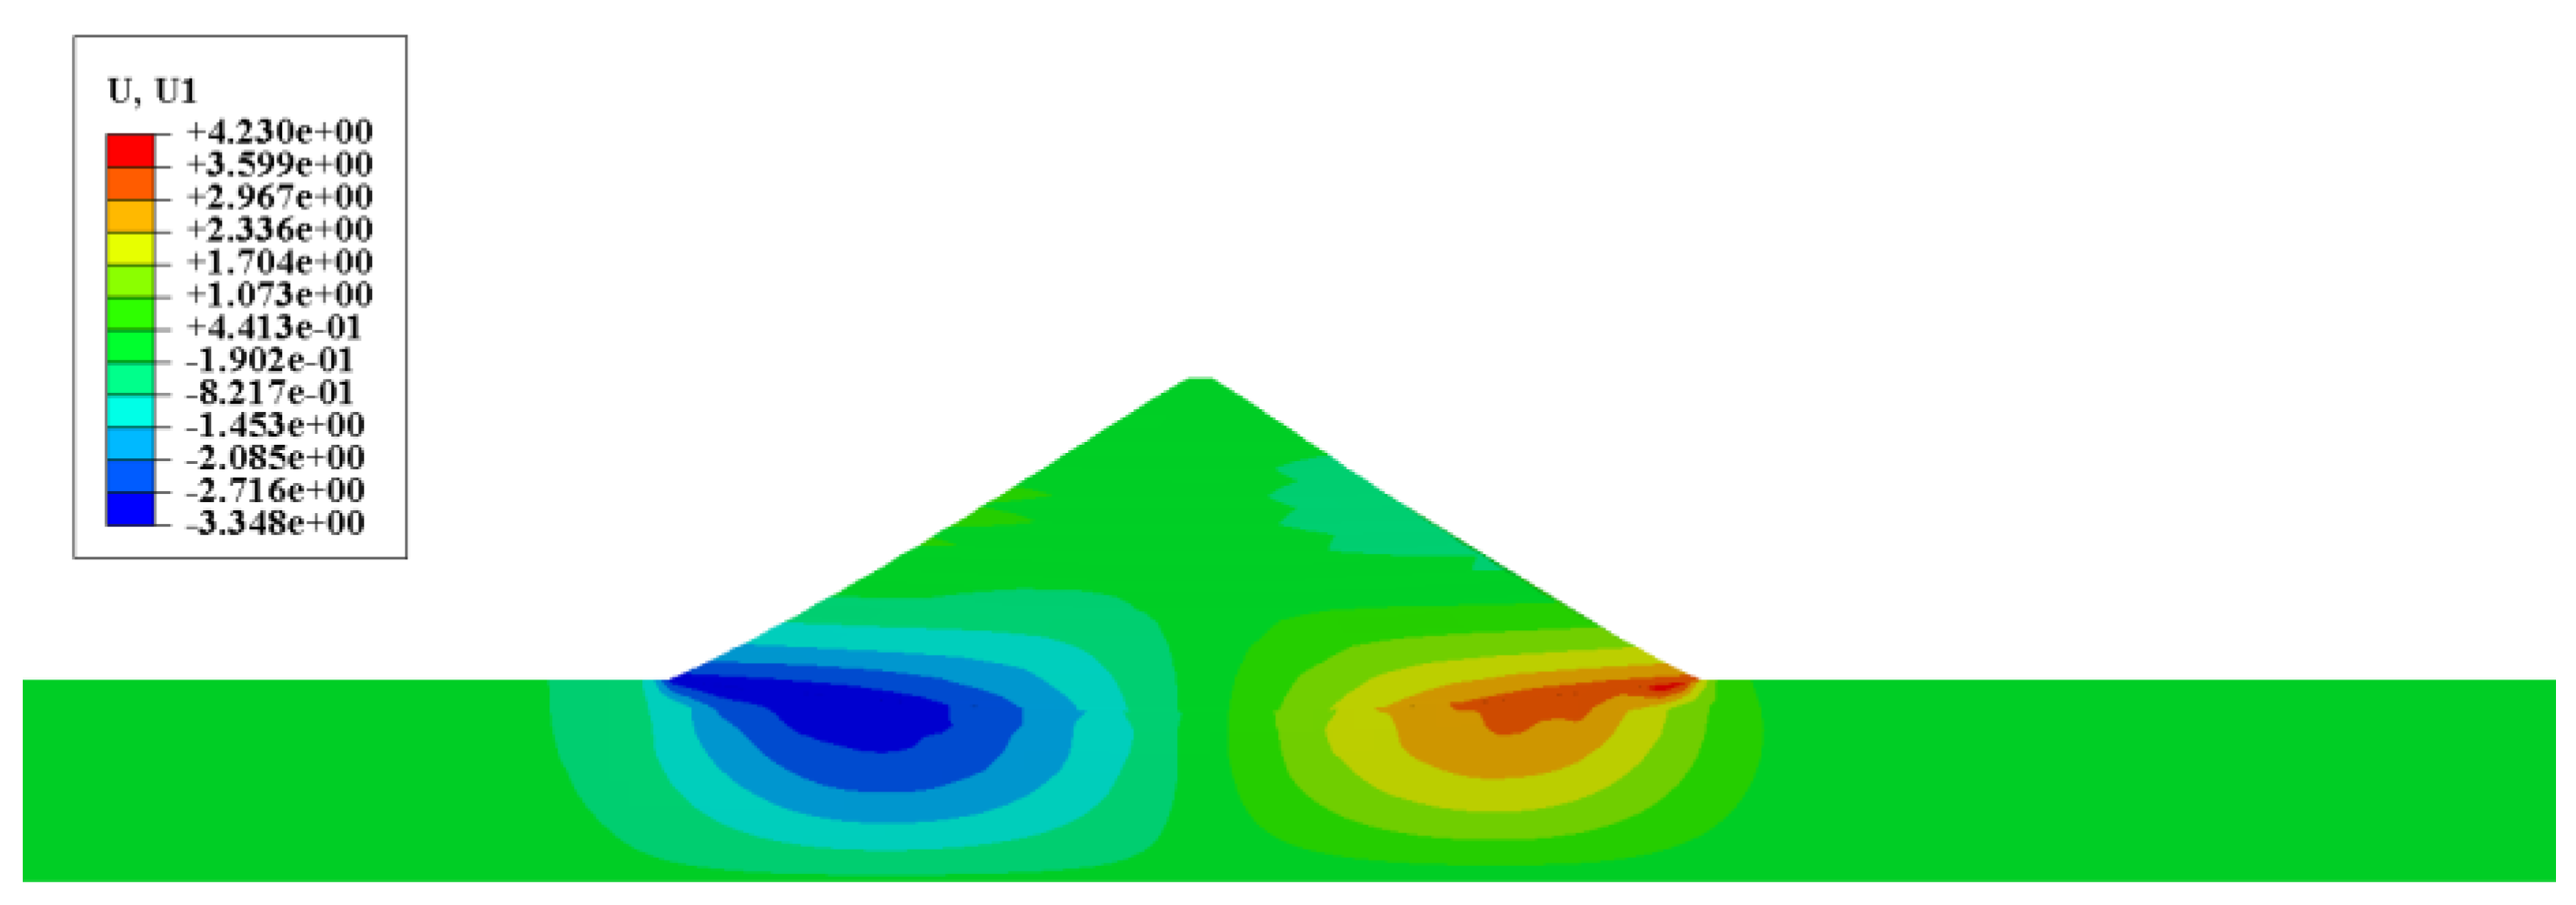
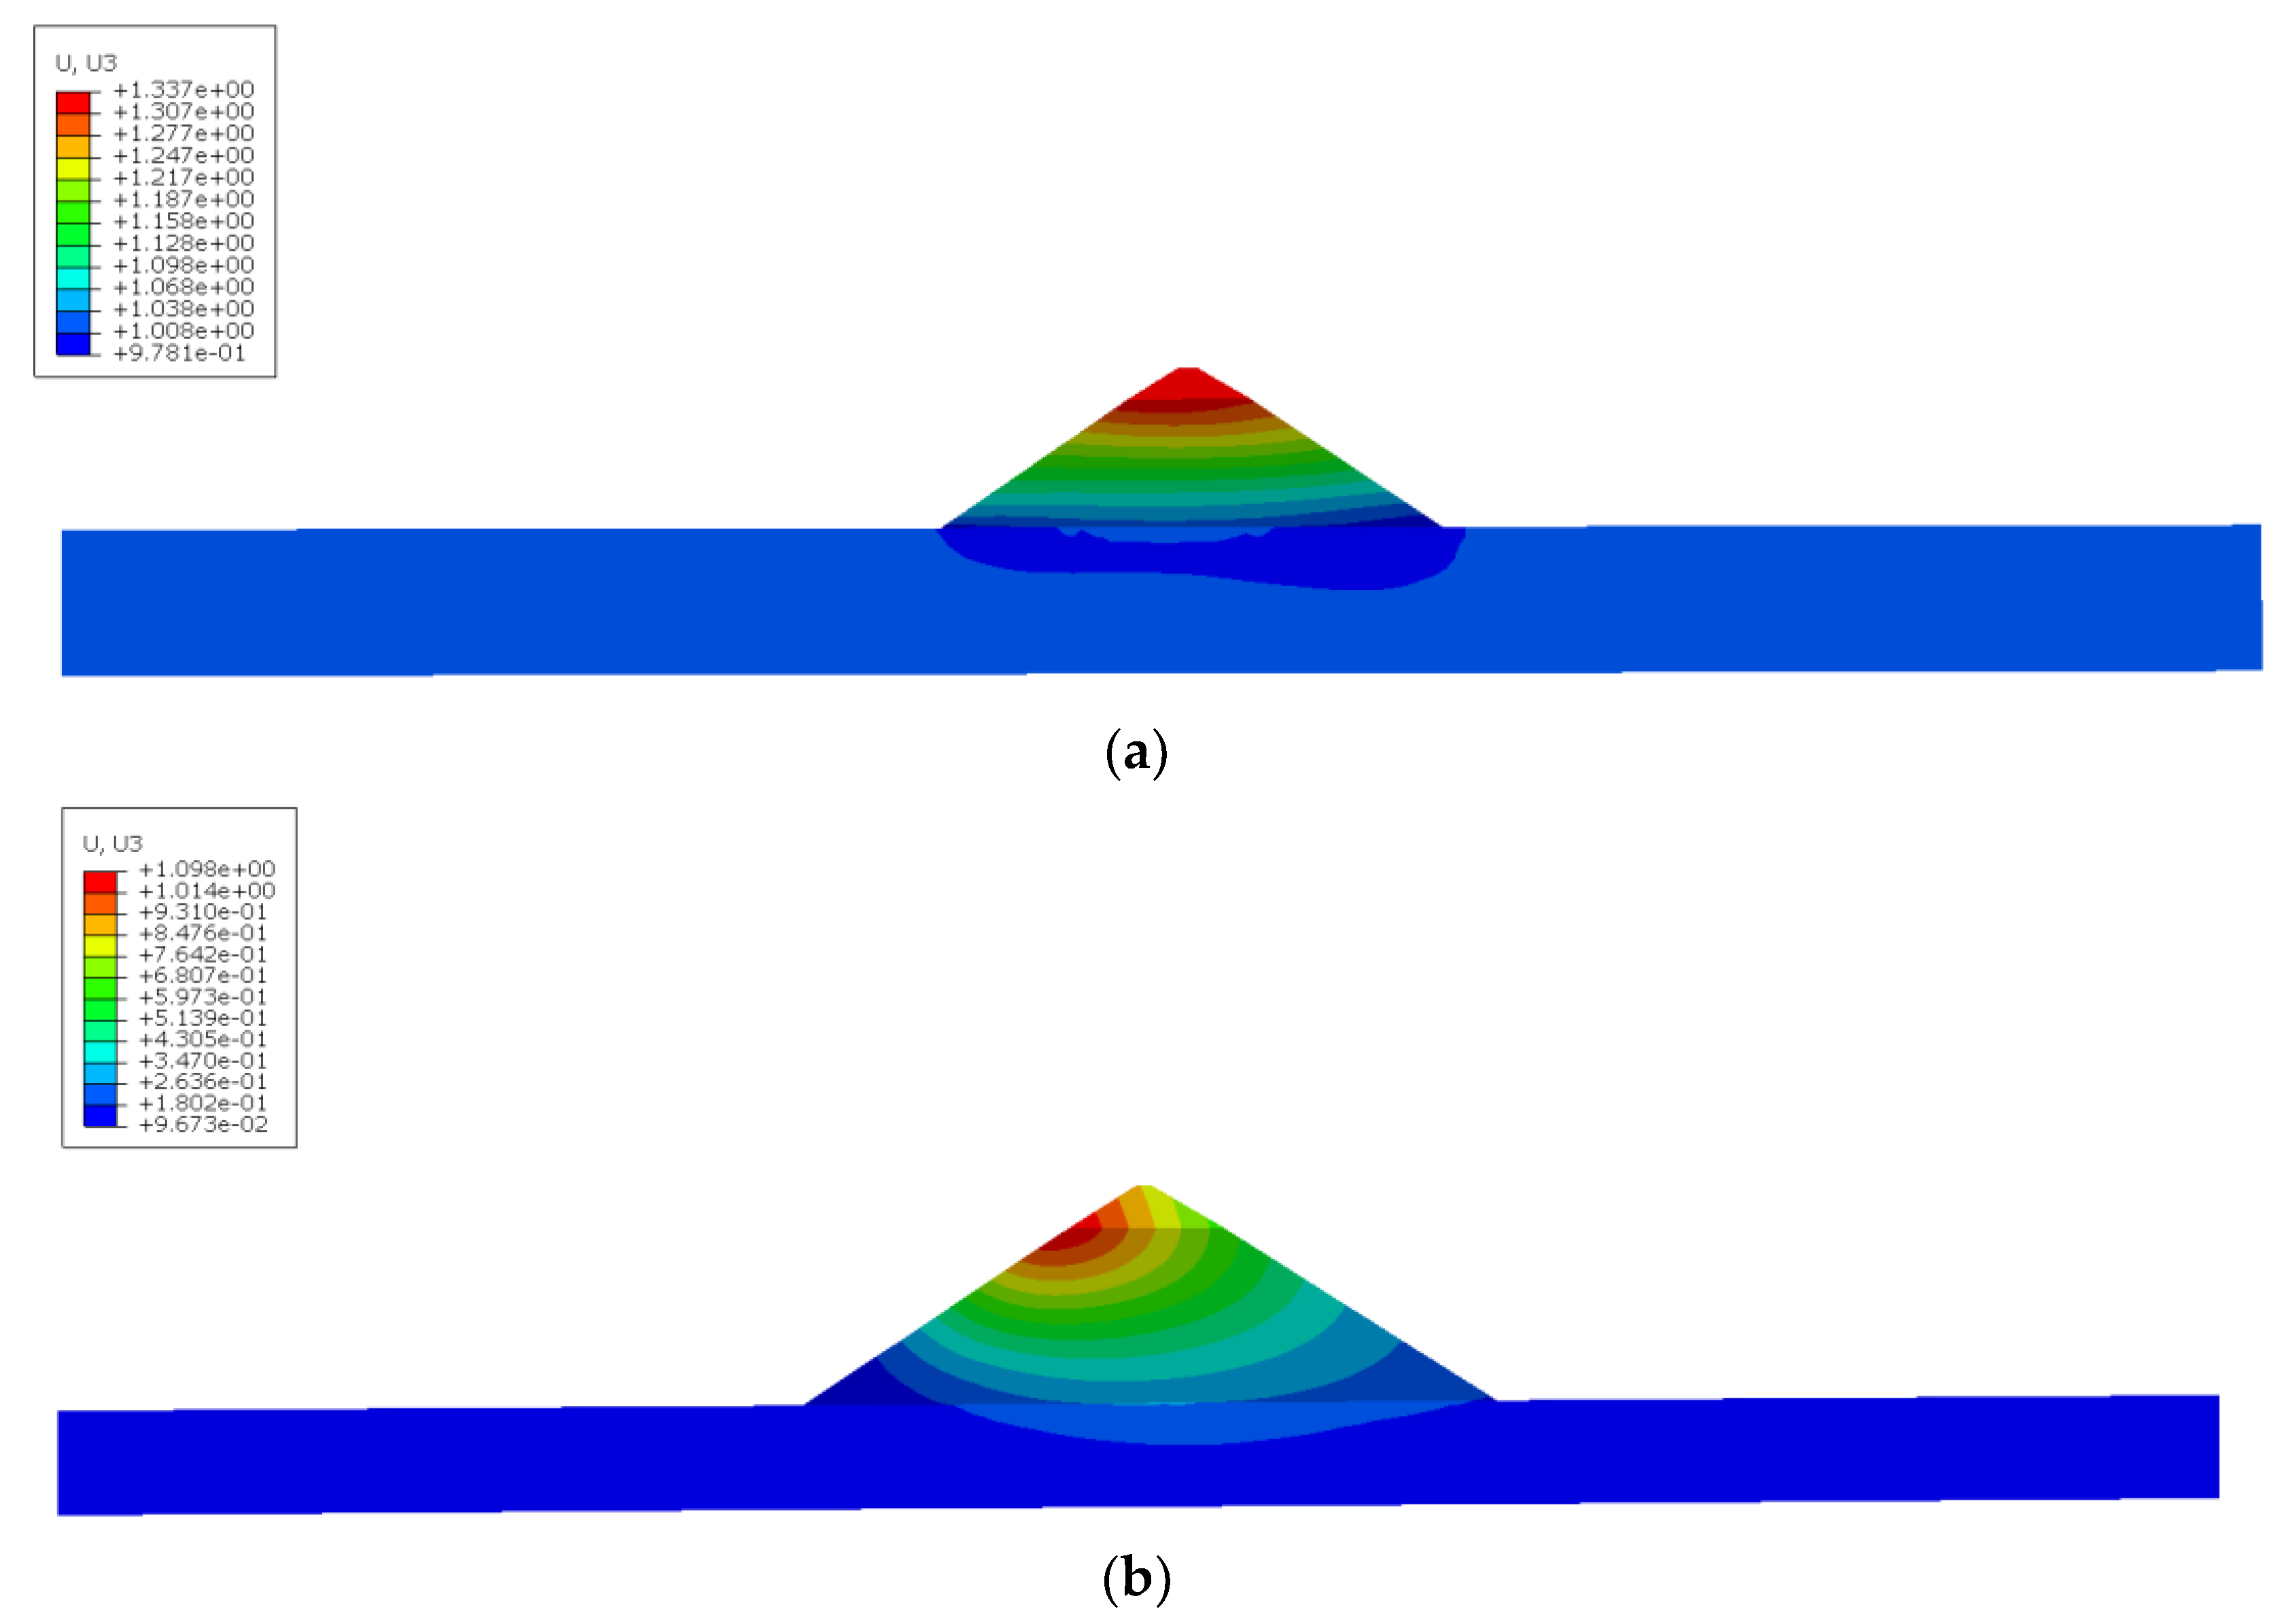
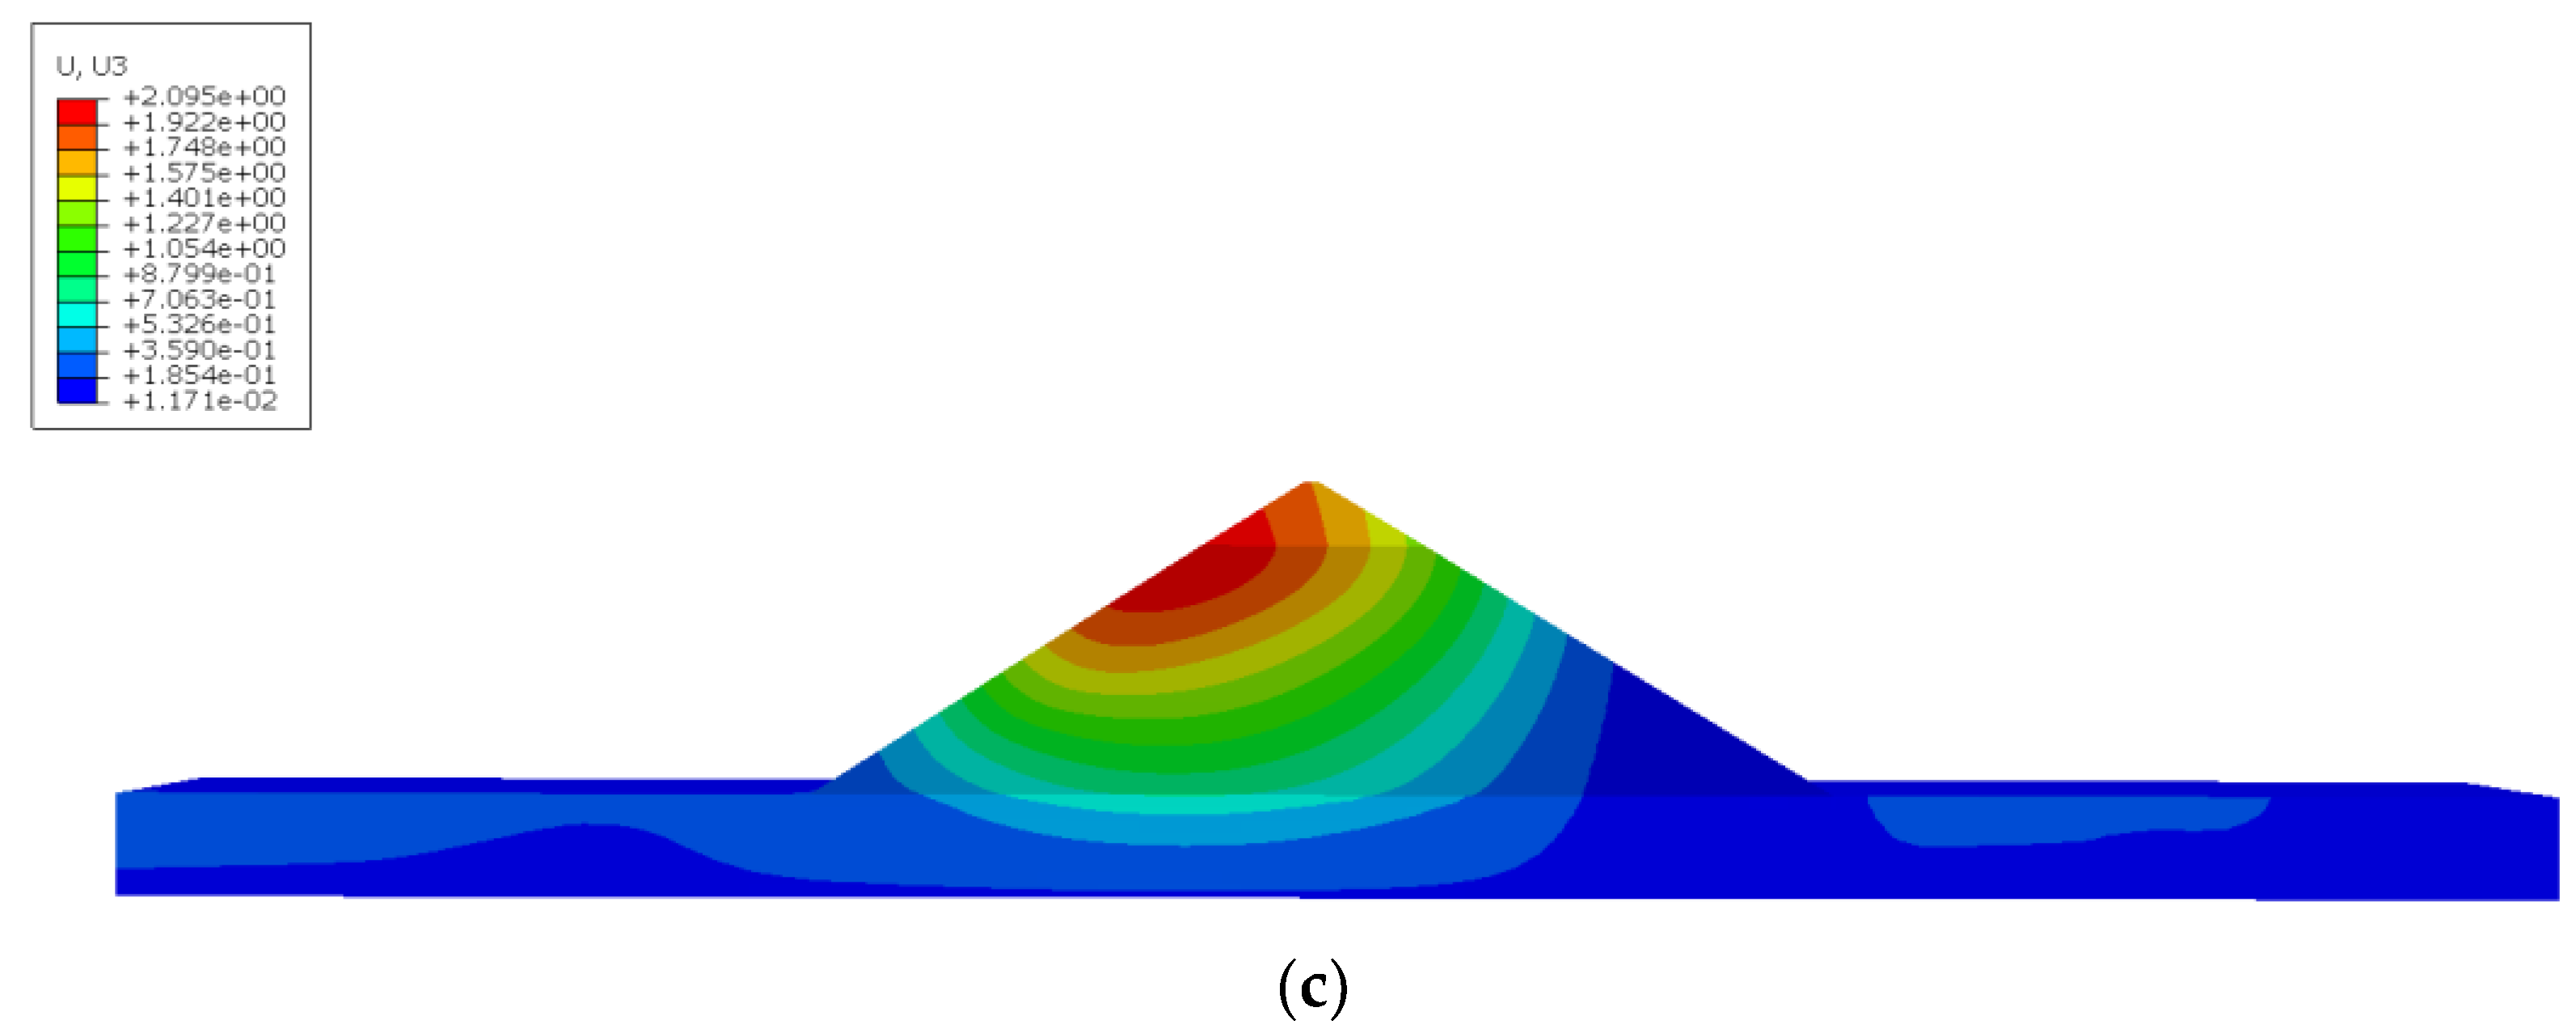
During the static analysis of dam filling, a gradual decrease in deformation resistance is observed in the cover layer as it transitions from hard ground to weak ground among the four types. This process results in an uneven stress distribution within the dam body, with the principal stresses gradually concentrating toward the bottom and base of the dam. Additionally, the displacement cloud map along the downstream direction indicates that in the case of weak ground with deep cover layers, the horizontal displacement of the dam body primarily concentrates at the connection between the dam base and the cover layer, gradually shifting toward the middle region, with larger displacement values compared to hard ground conditions. Therefore, reinforcement measures should be considered for the base and the connection points with the cover layer during dam construction.
(2)
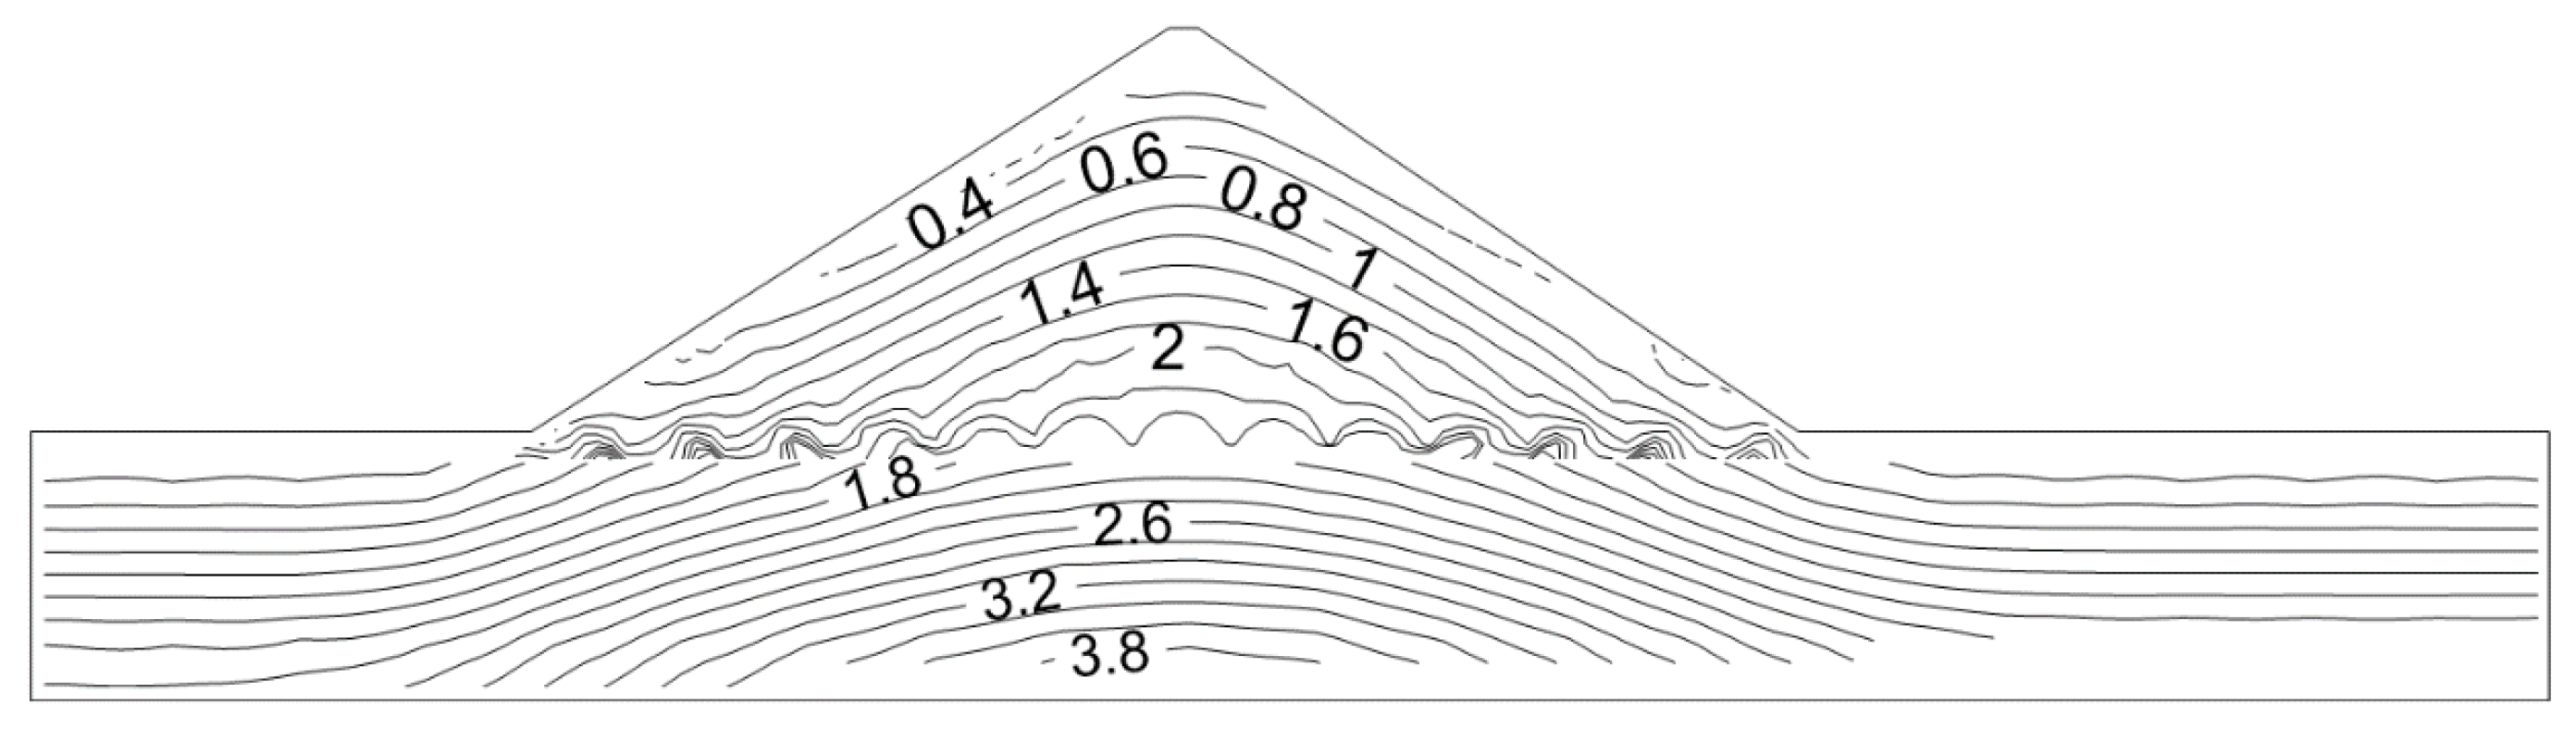
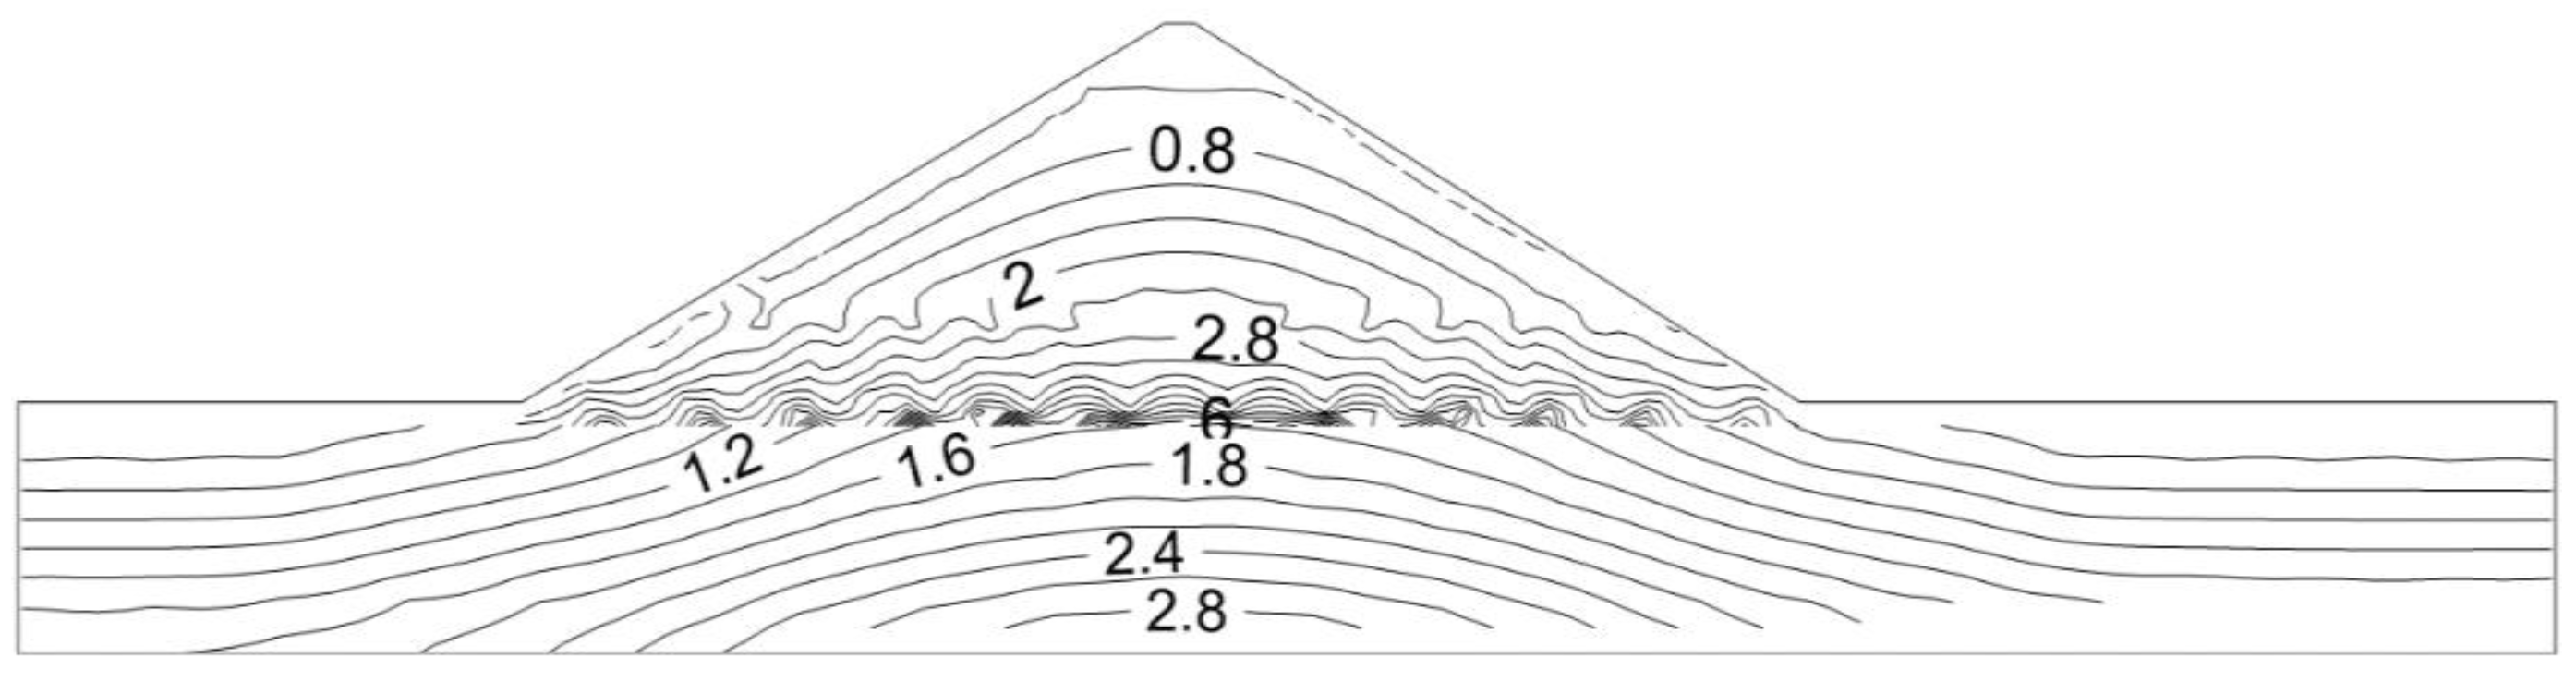
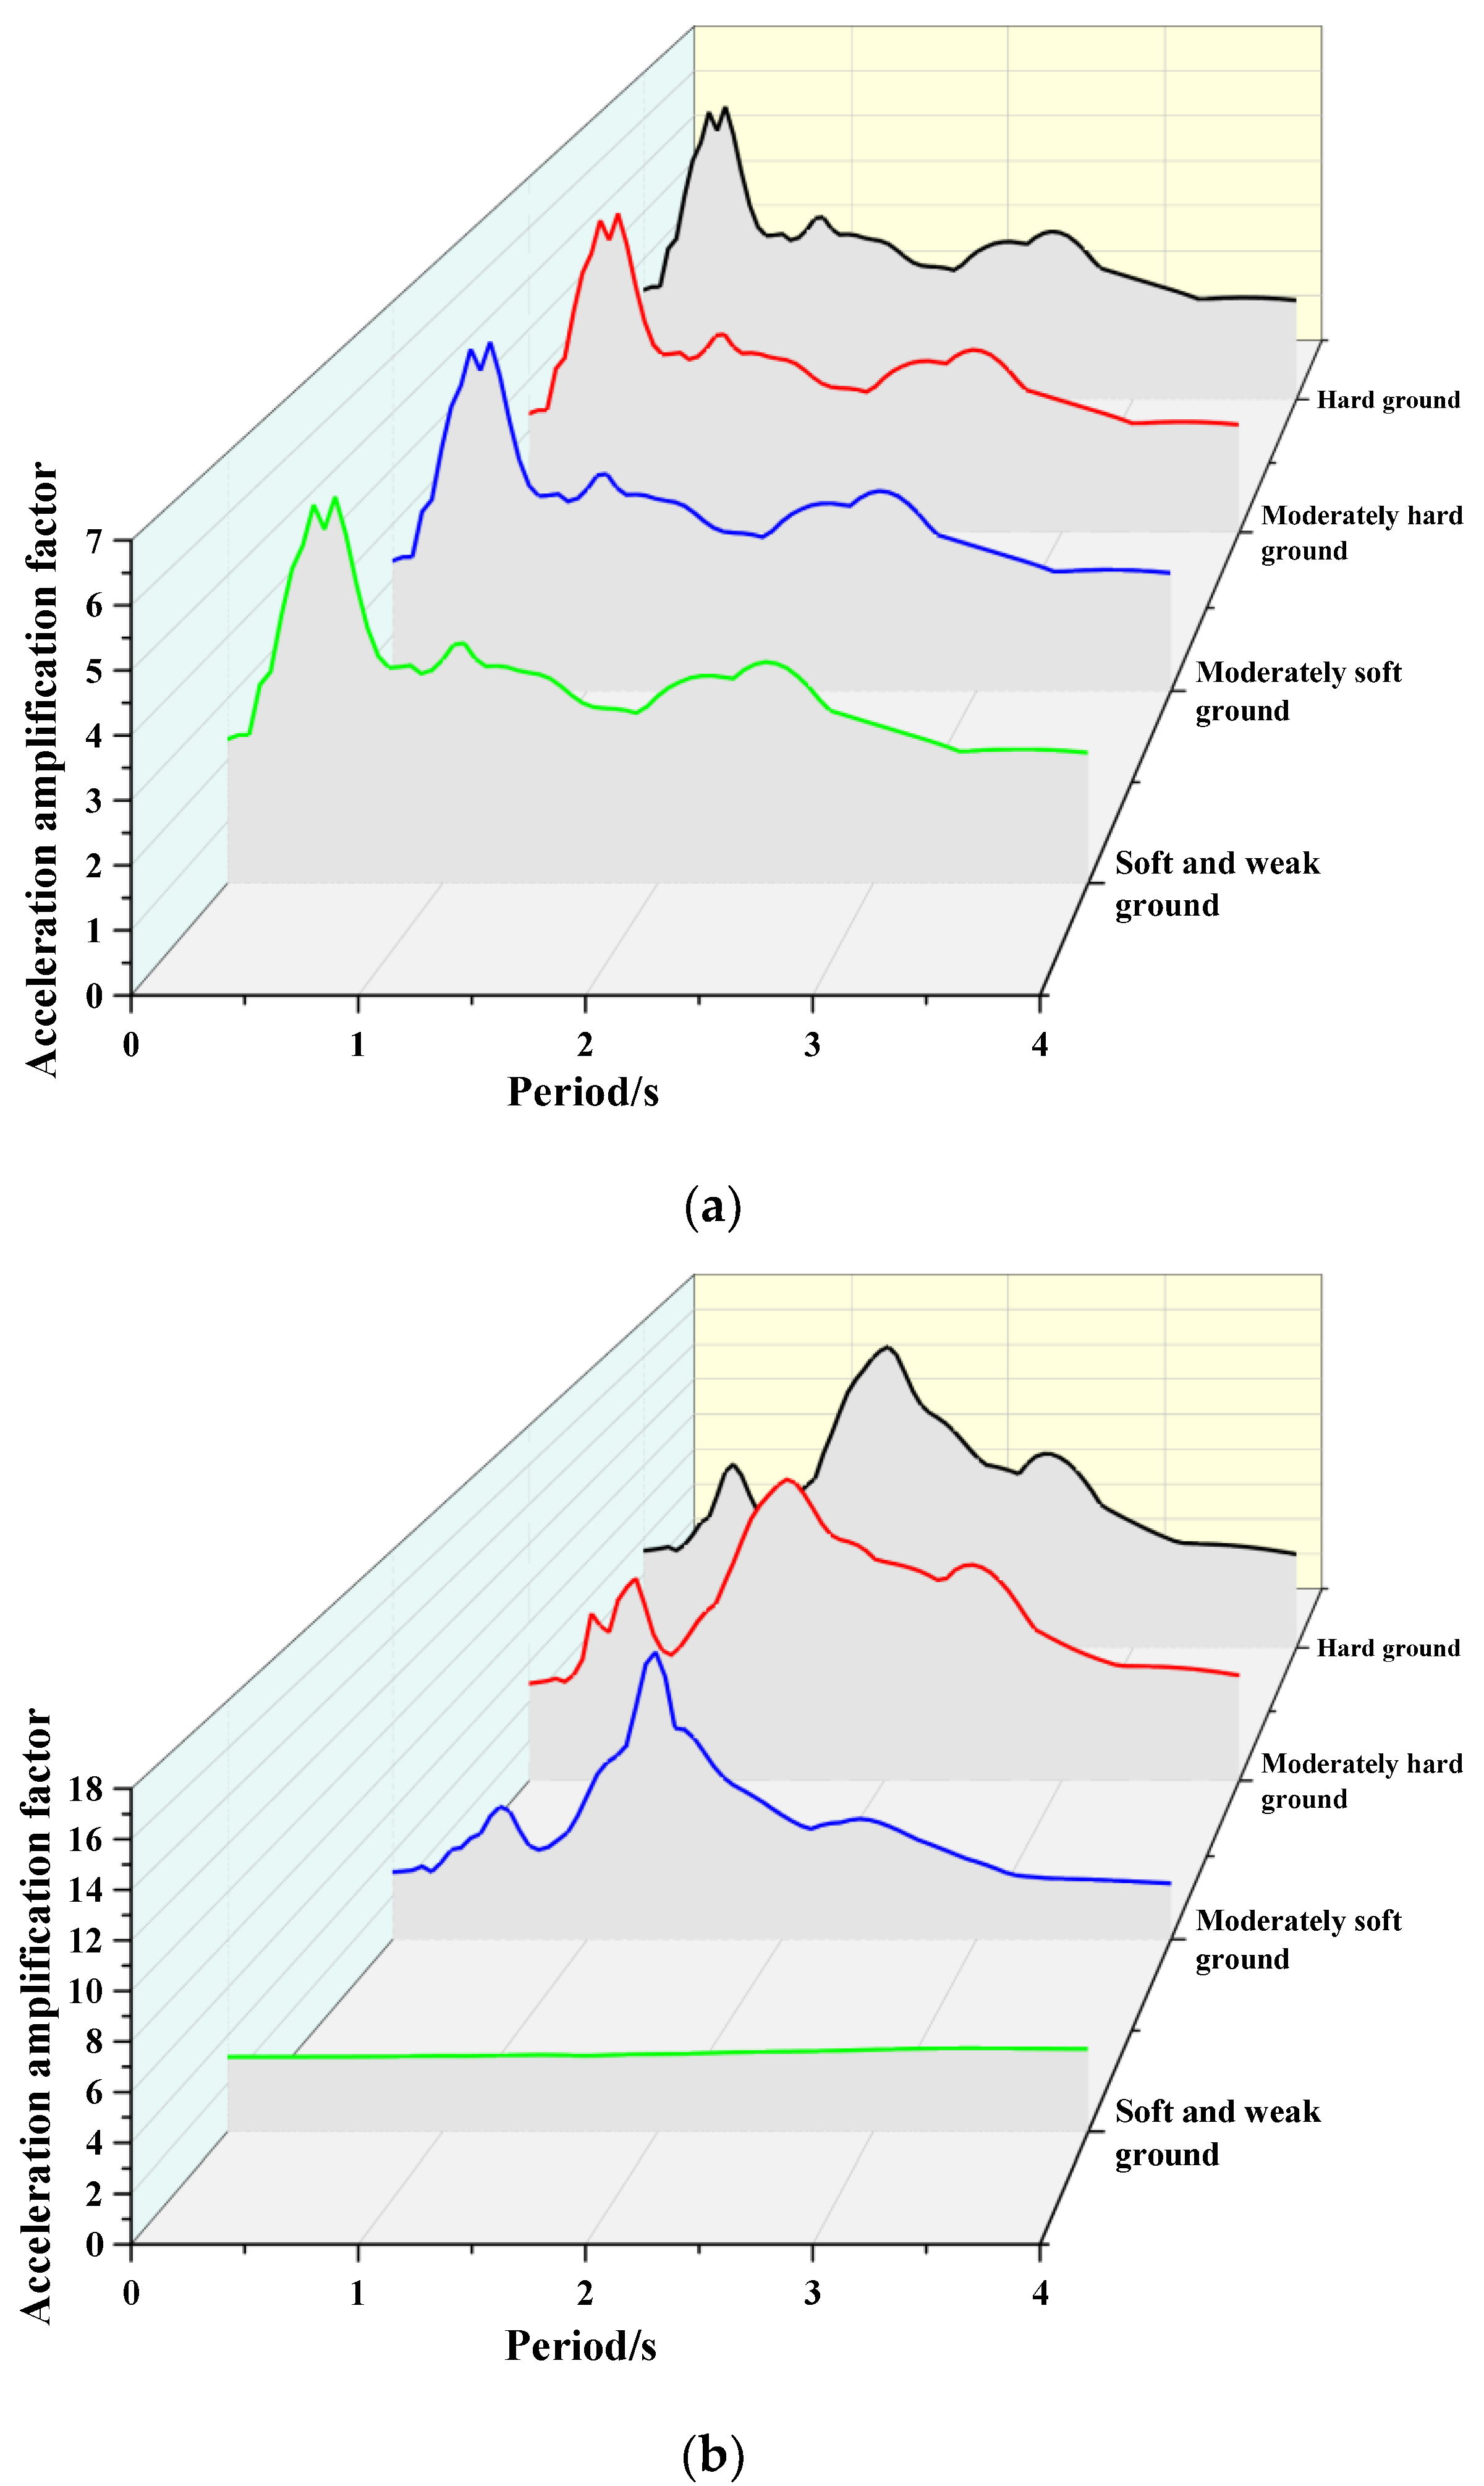
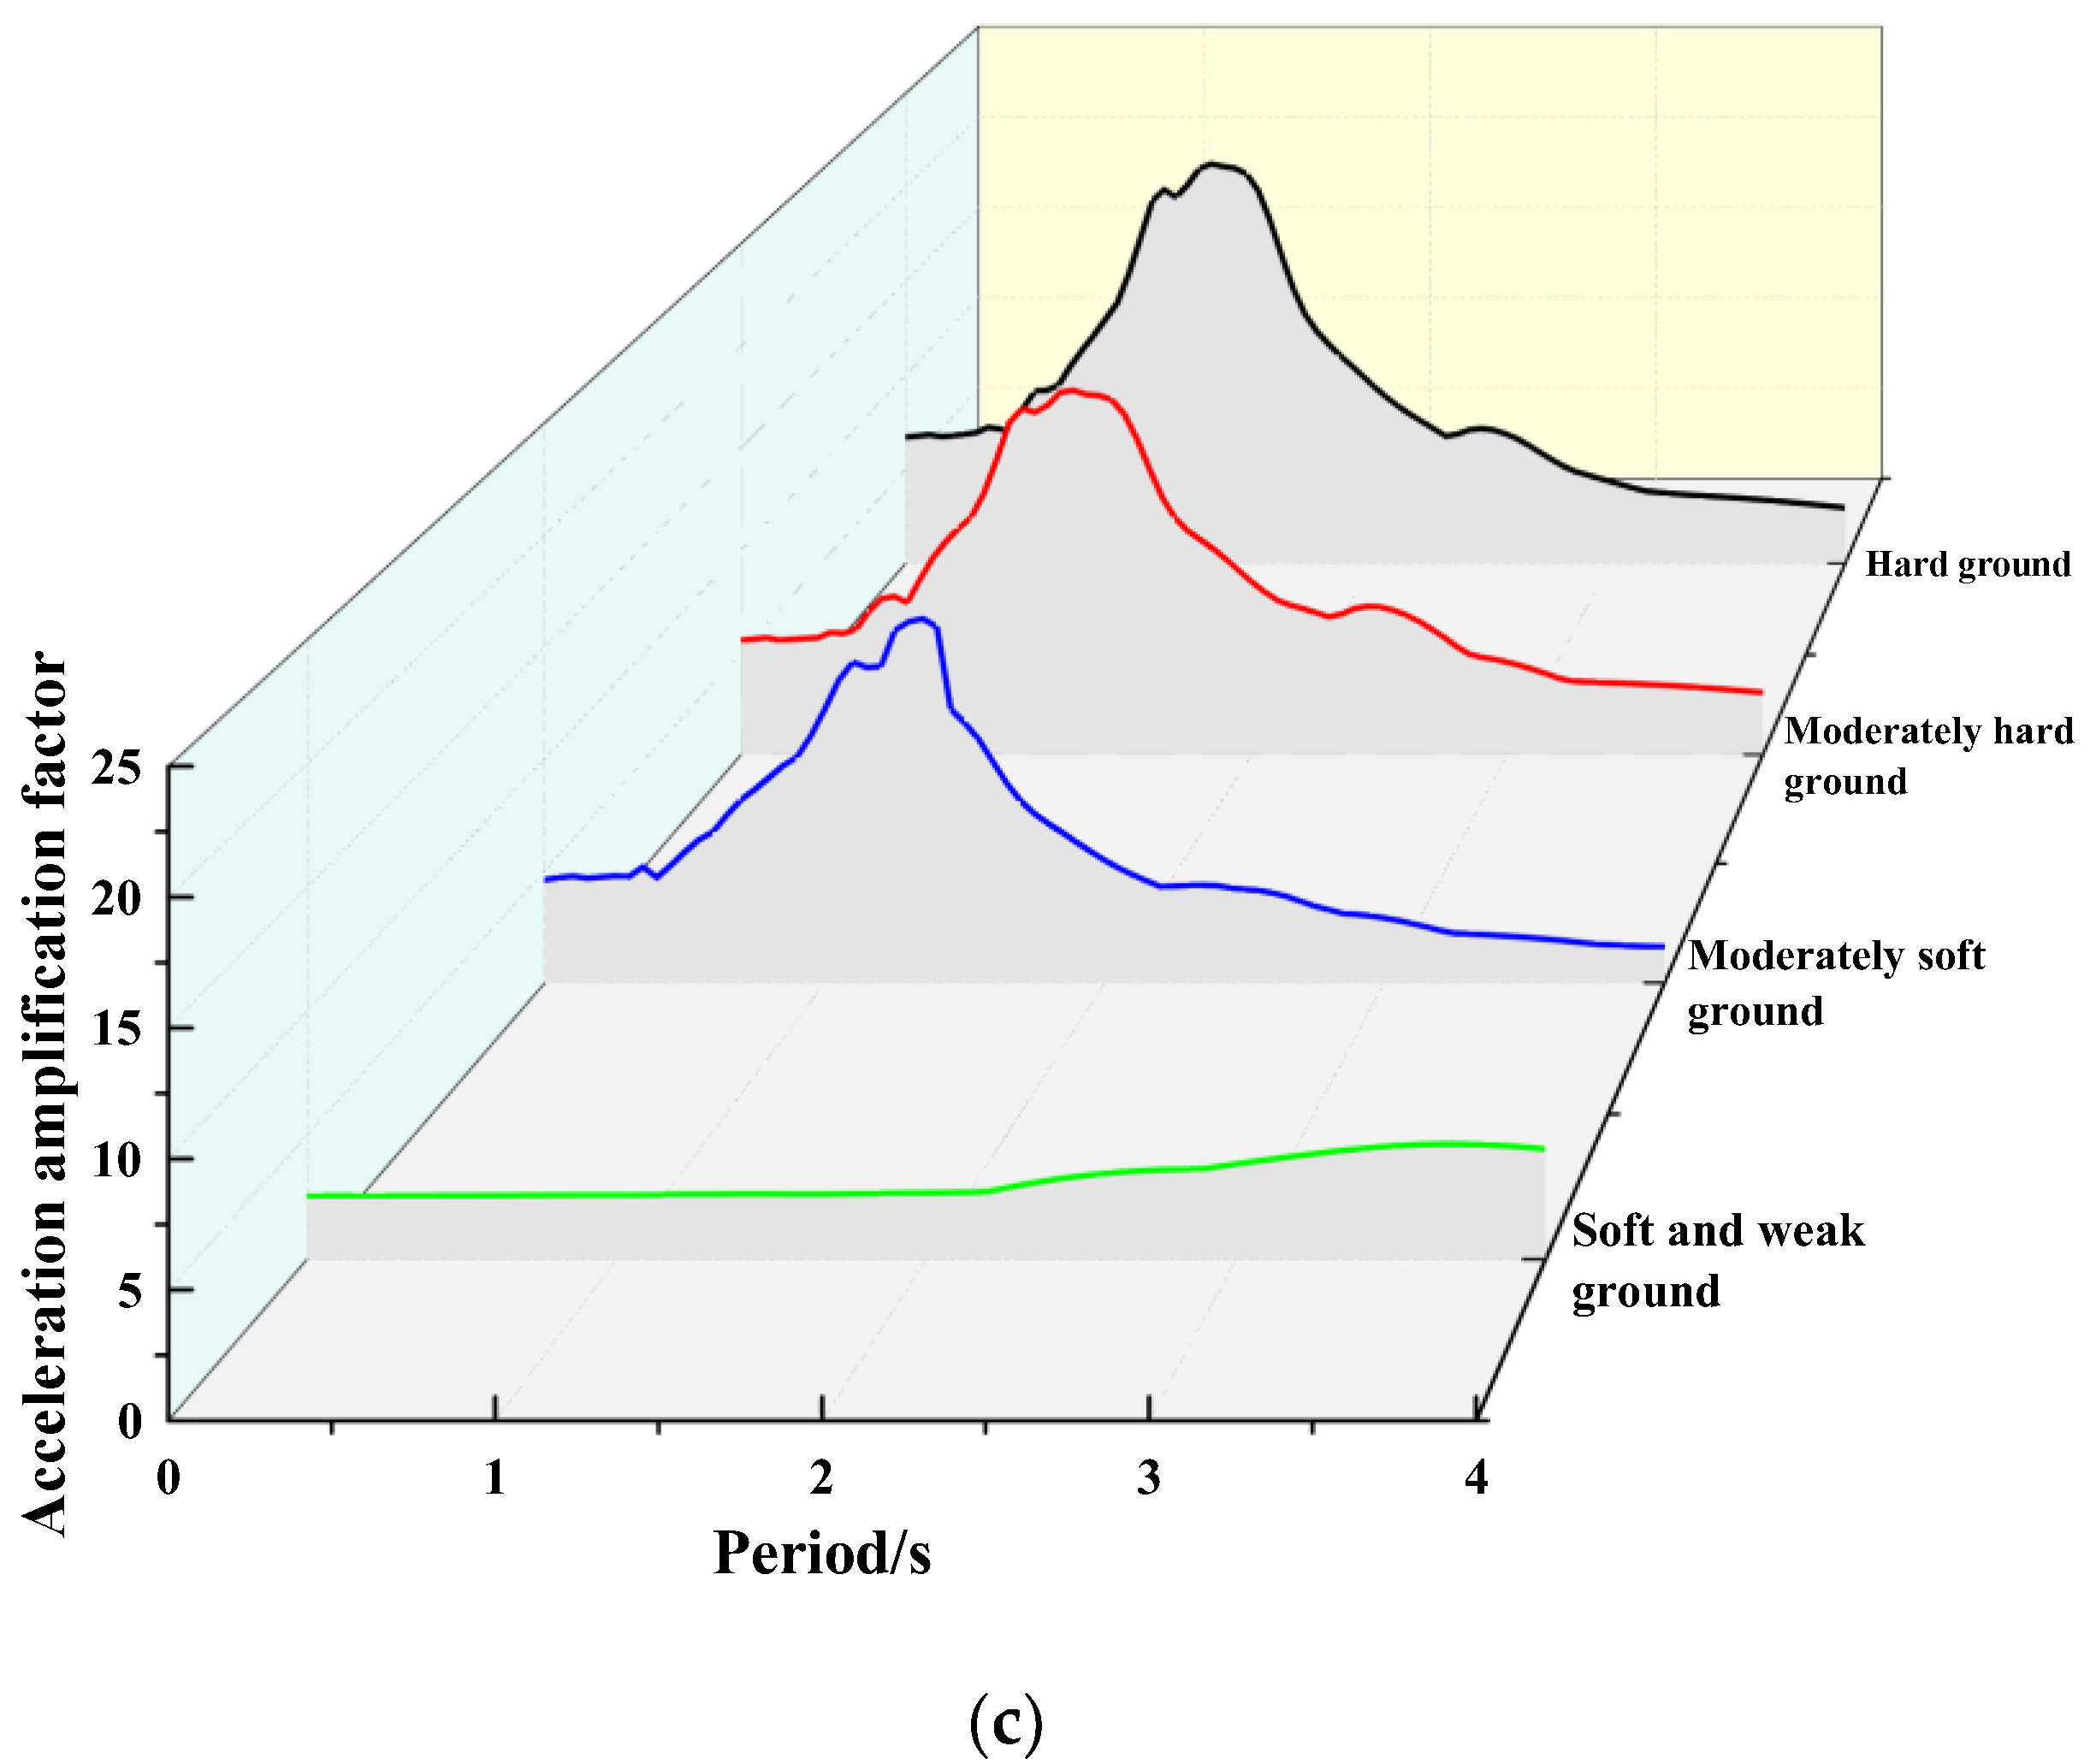
After subjecting the dam body to near-fault pulse-type seismic motion, a noticeable trend of decreasing peak acceleration is observed at the dam crest as the cover layer transitions from hard soil to weak soil. This shift indicates that the presence of weak soil significantly reduces the impact of the input pulse-type seismic motion, and the reduction effect becomes more pronounced in softer soil conditions. Therefore, building a dam on cover layers containing weak soil may be a viable option.
(3)
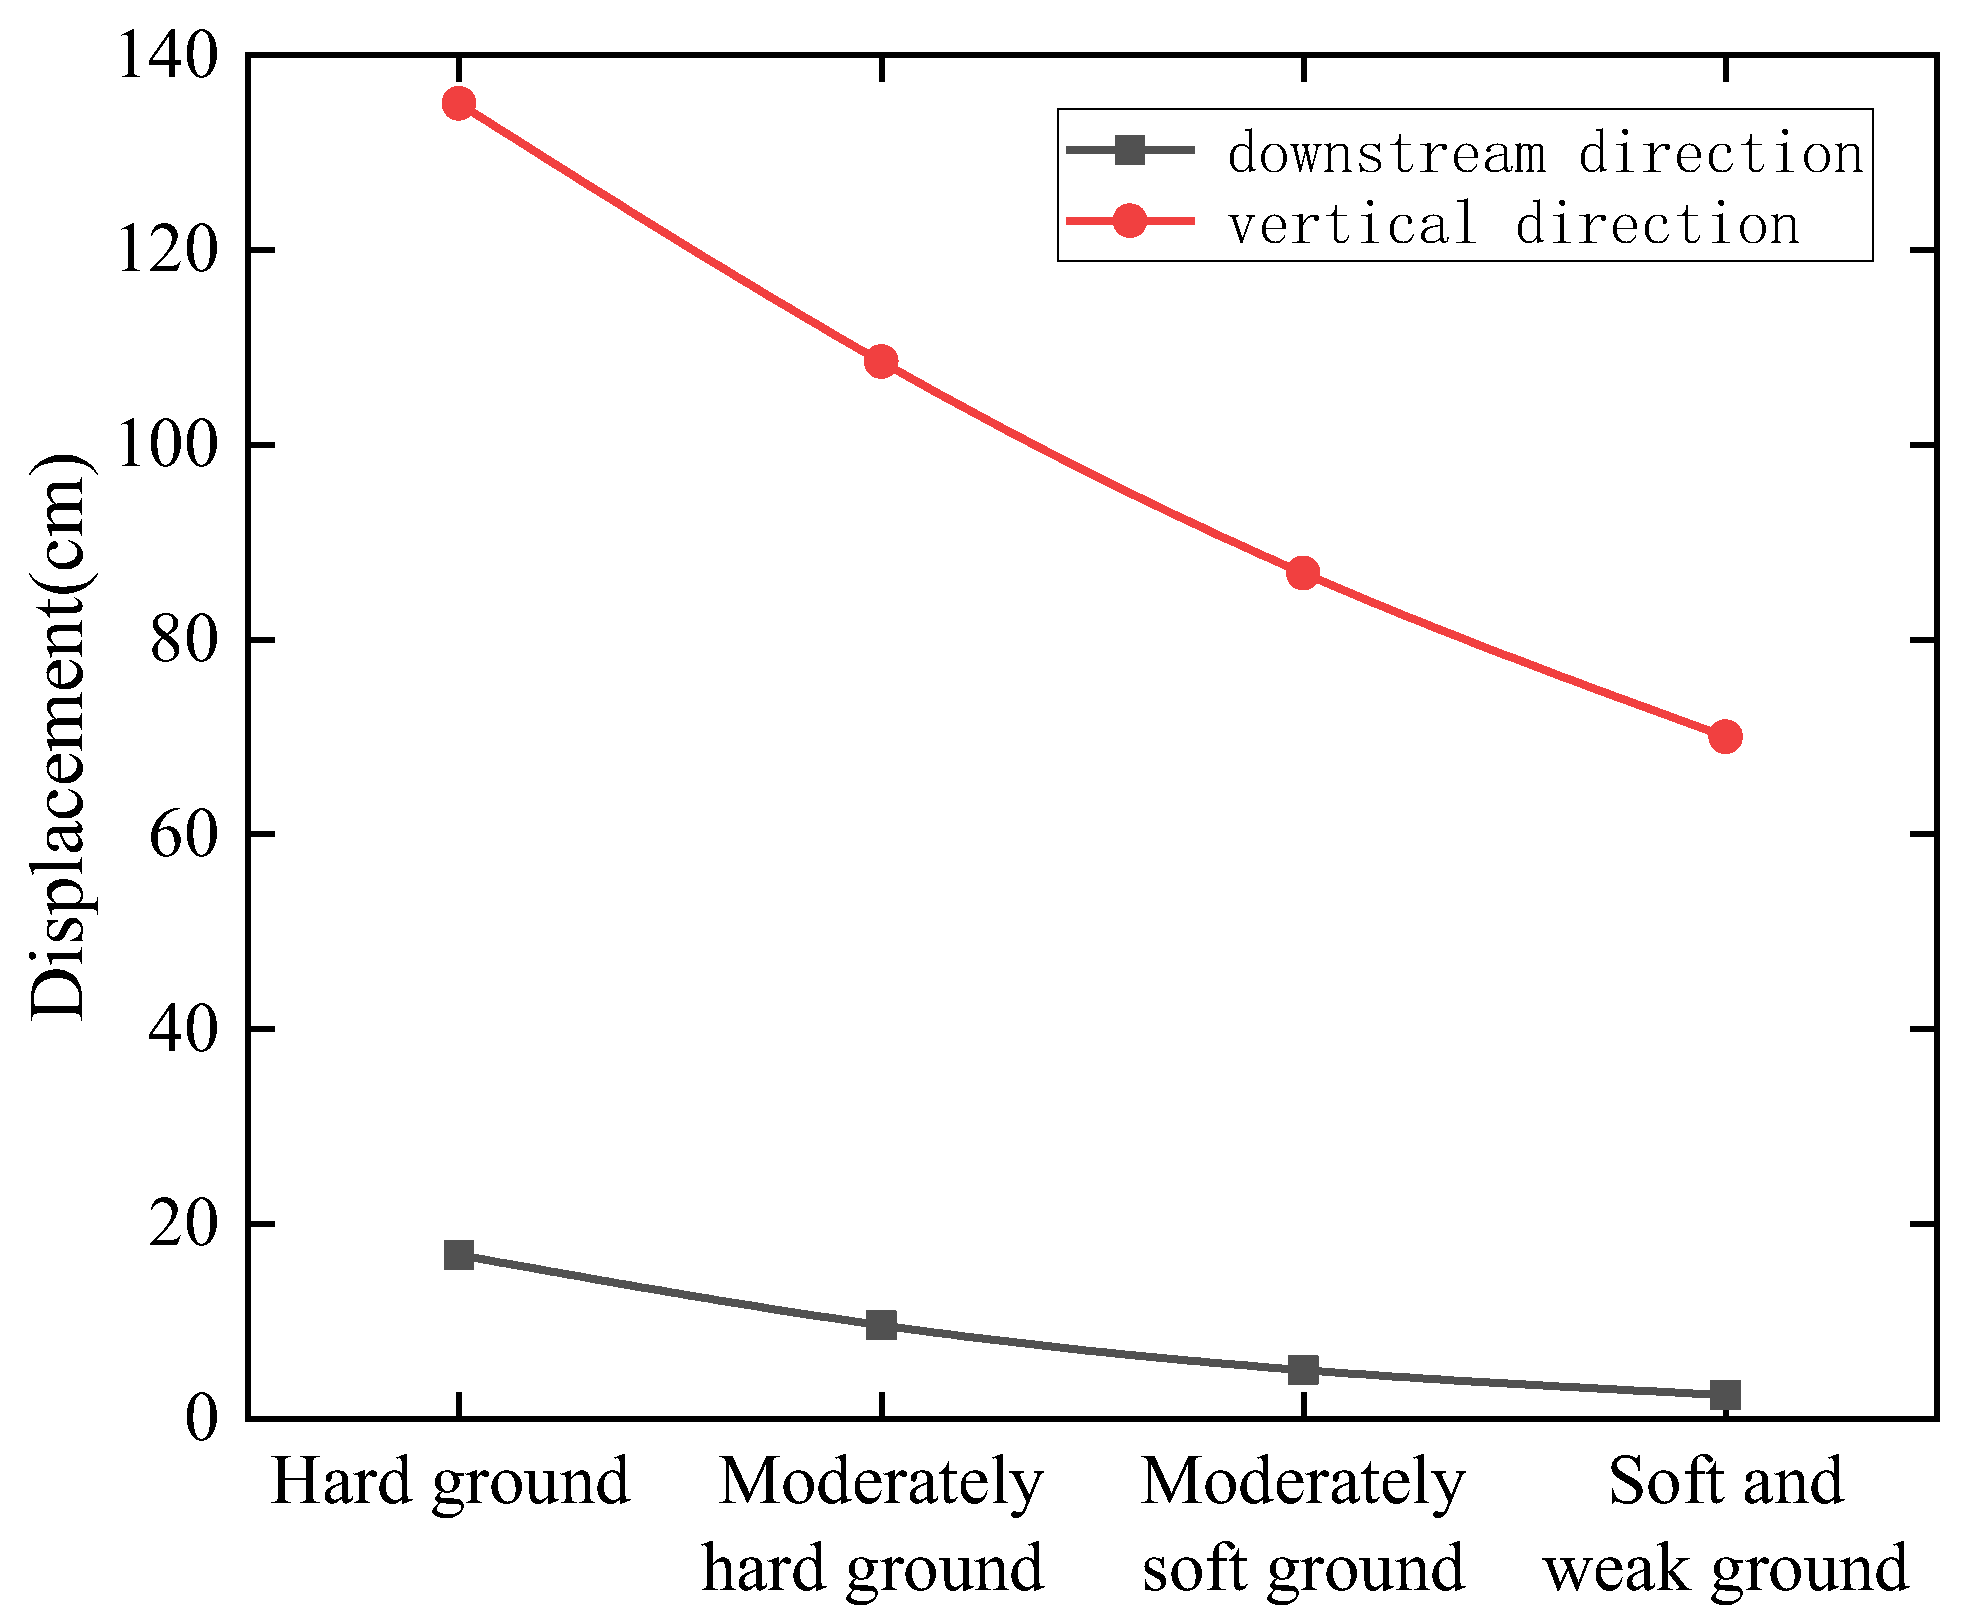
At the same elevation, the residual deformation of hard soil, medium–hard soil, medium–soft soil, and weak soil gradually decreases, following a pattern similar to the maximum values of acceleration response. This observation further supports the weakening effect of weak soil on long-period earthquake excitations, resulting in minimal residual deformation. Therefore, constructing a dam on cover layers with weak soil has practical significance and leads to good seismic performance.
(4)
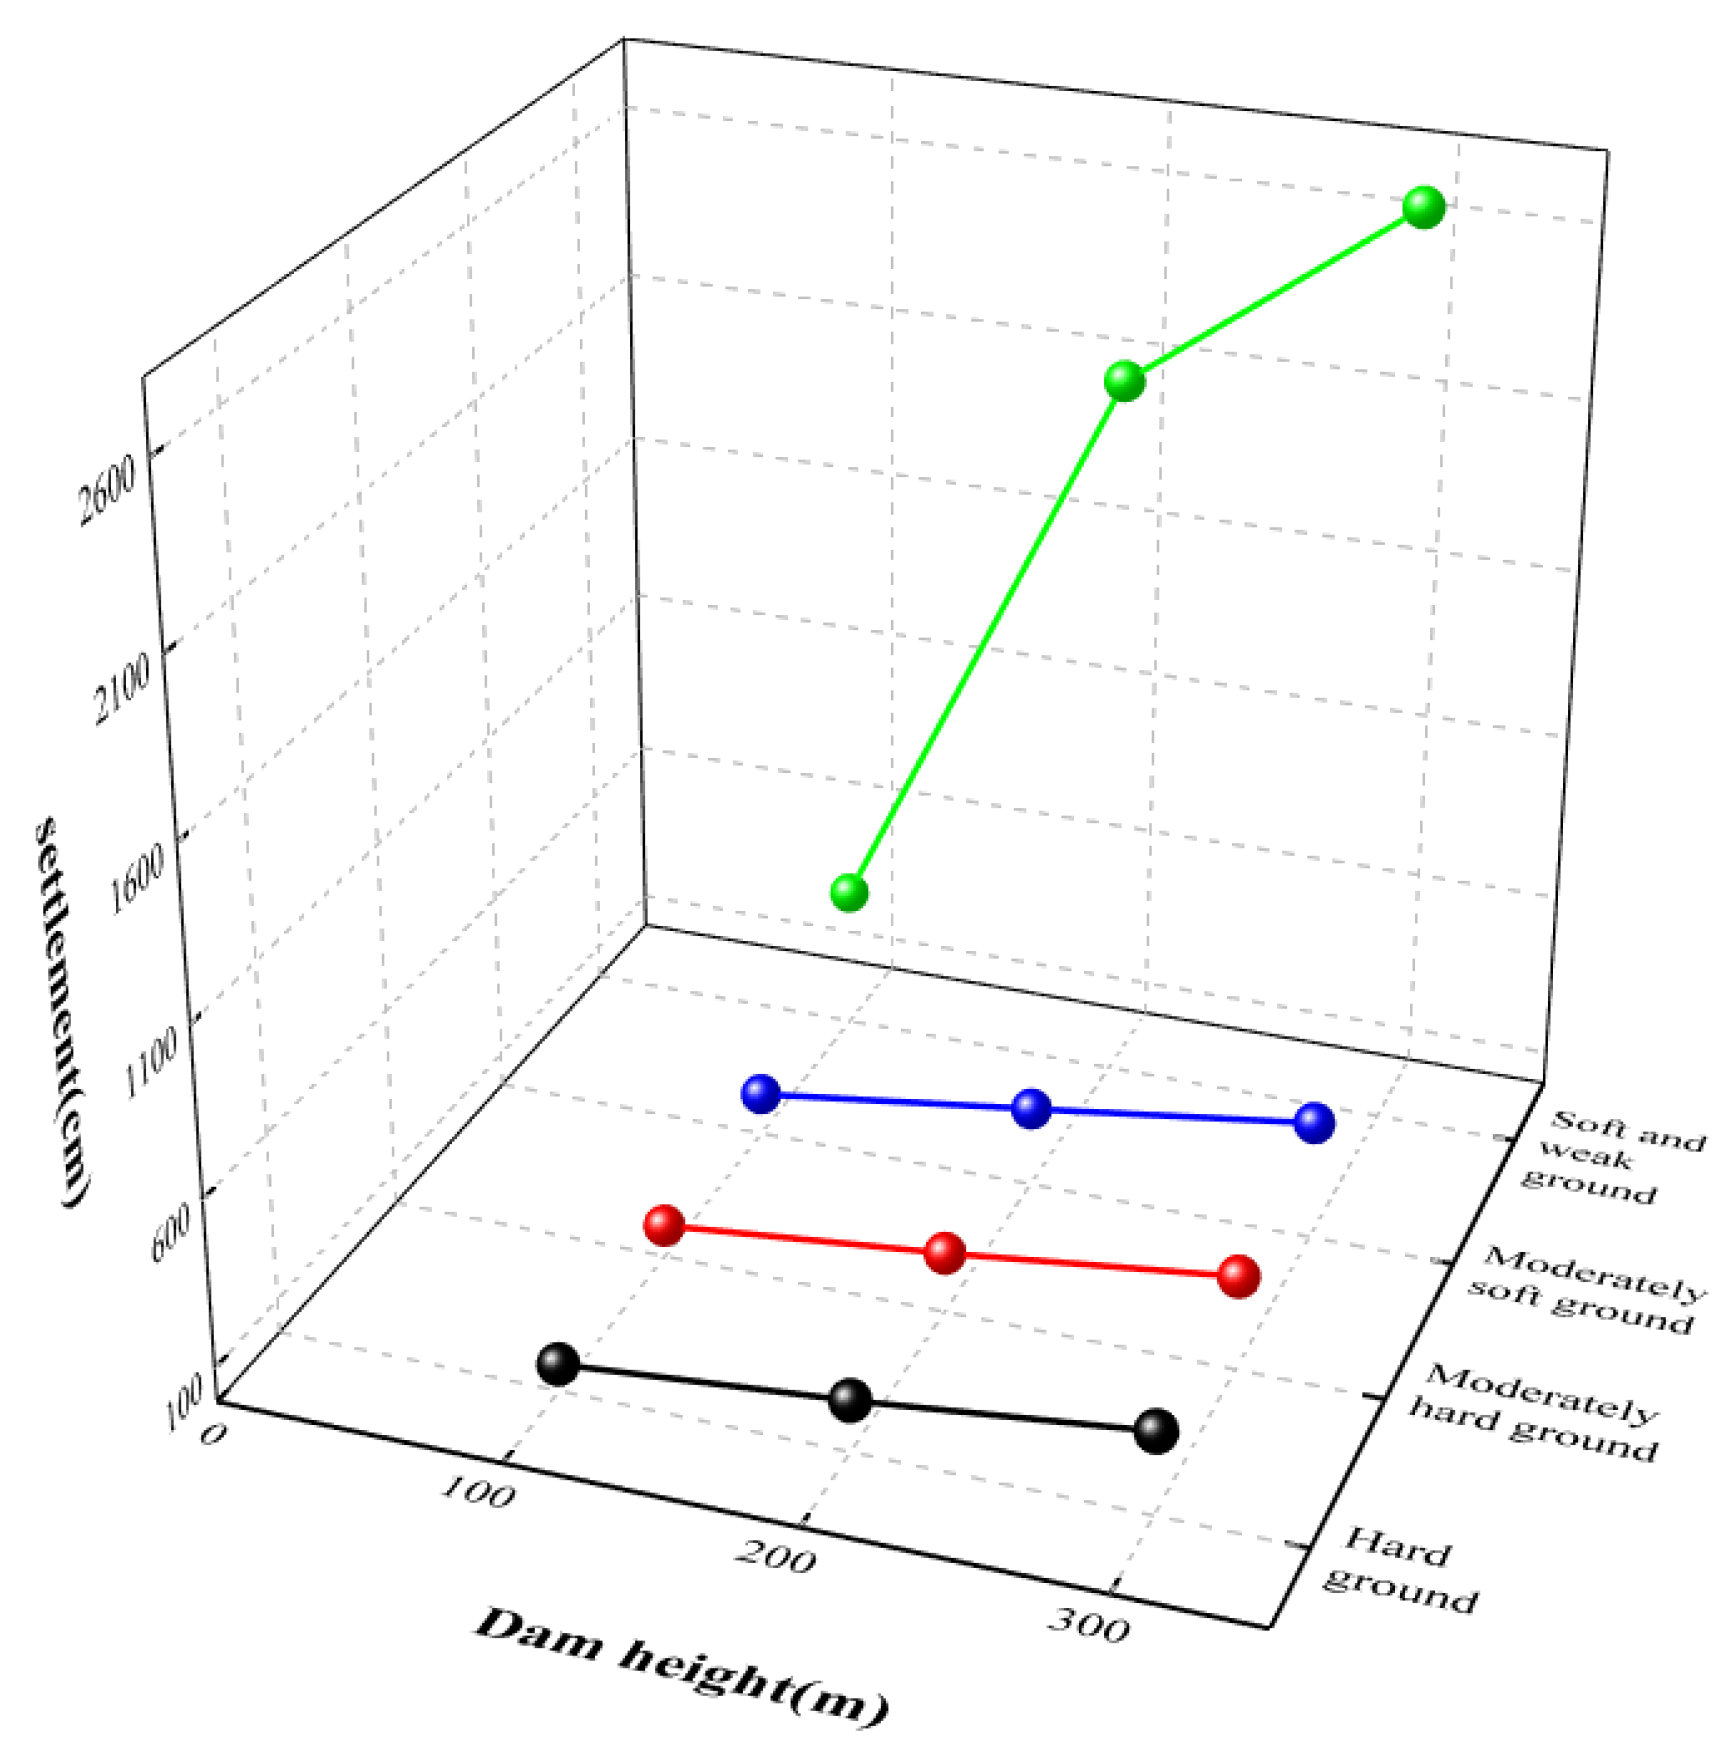
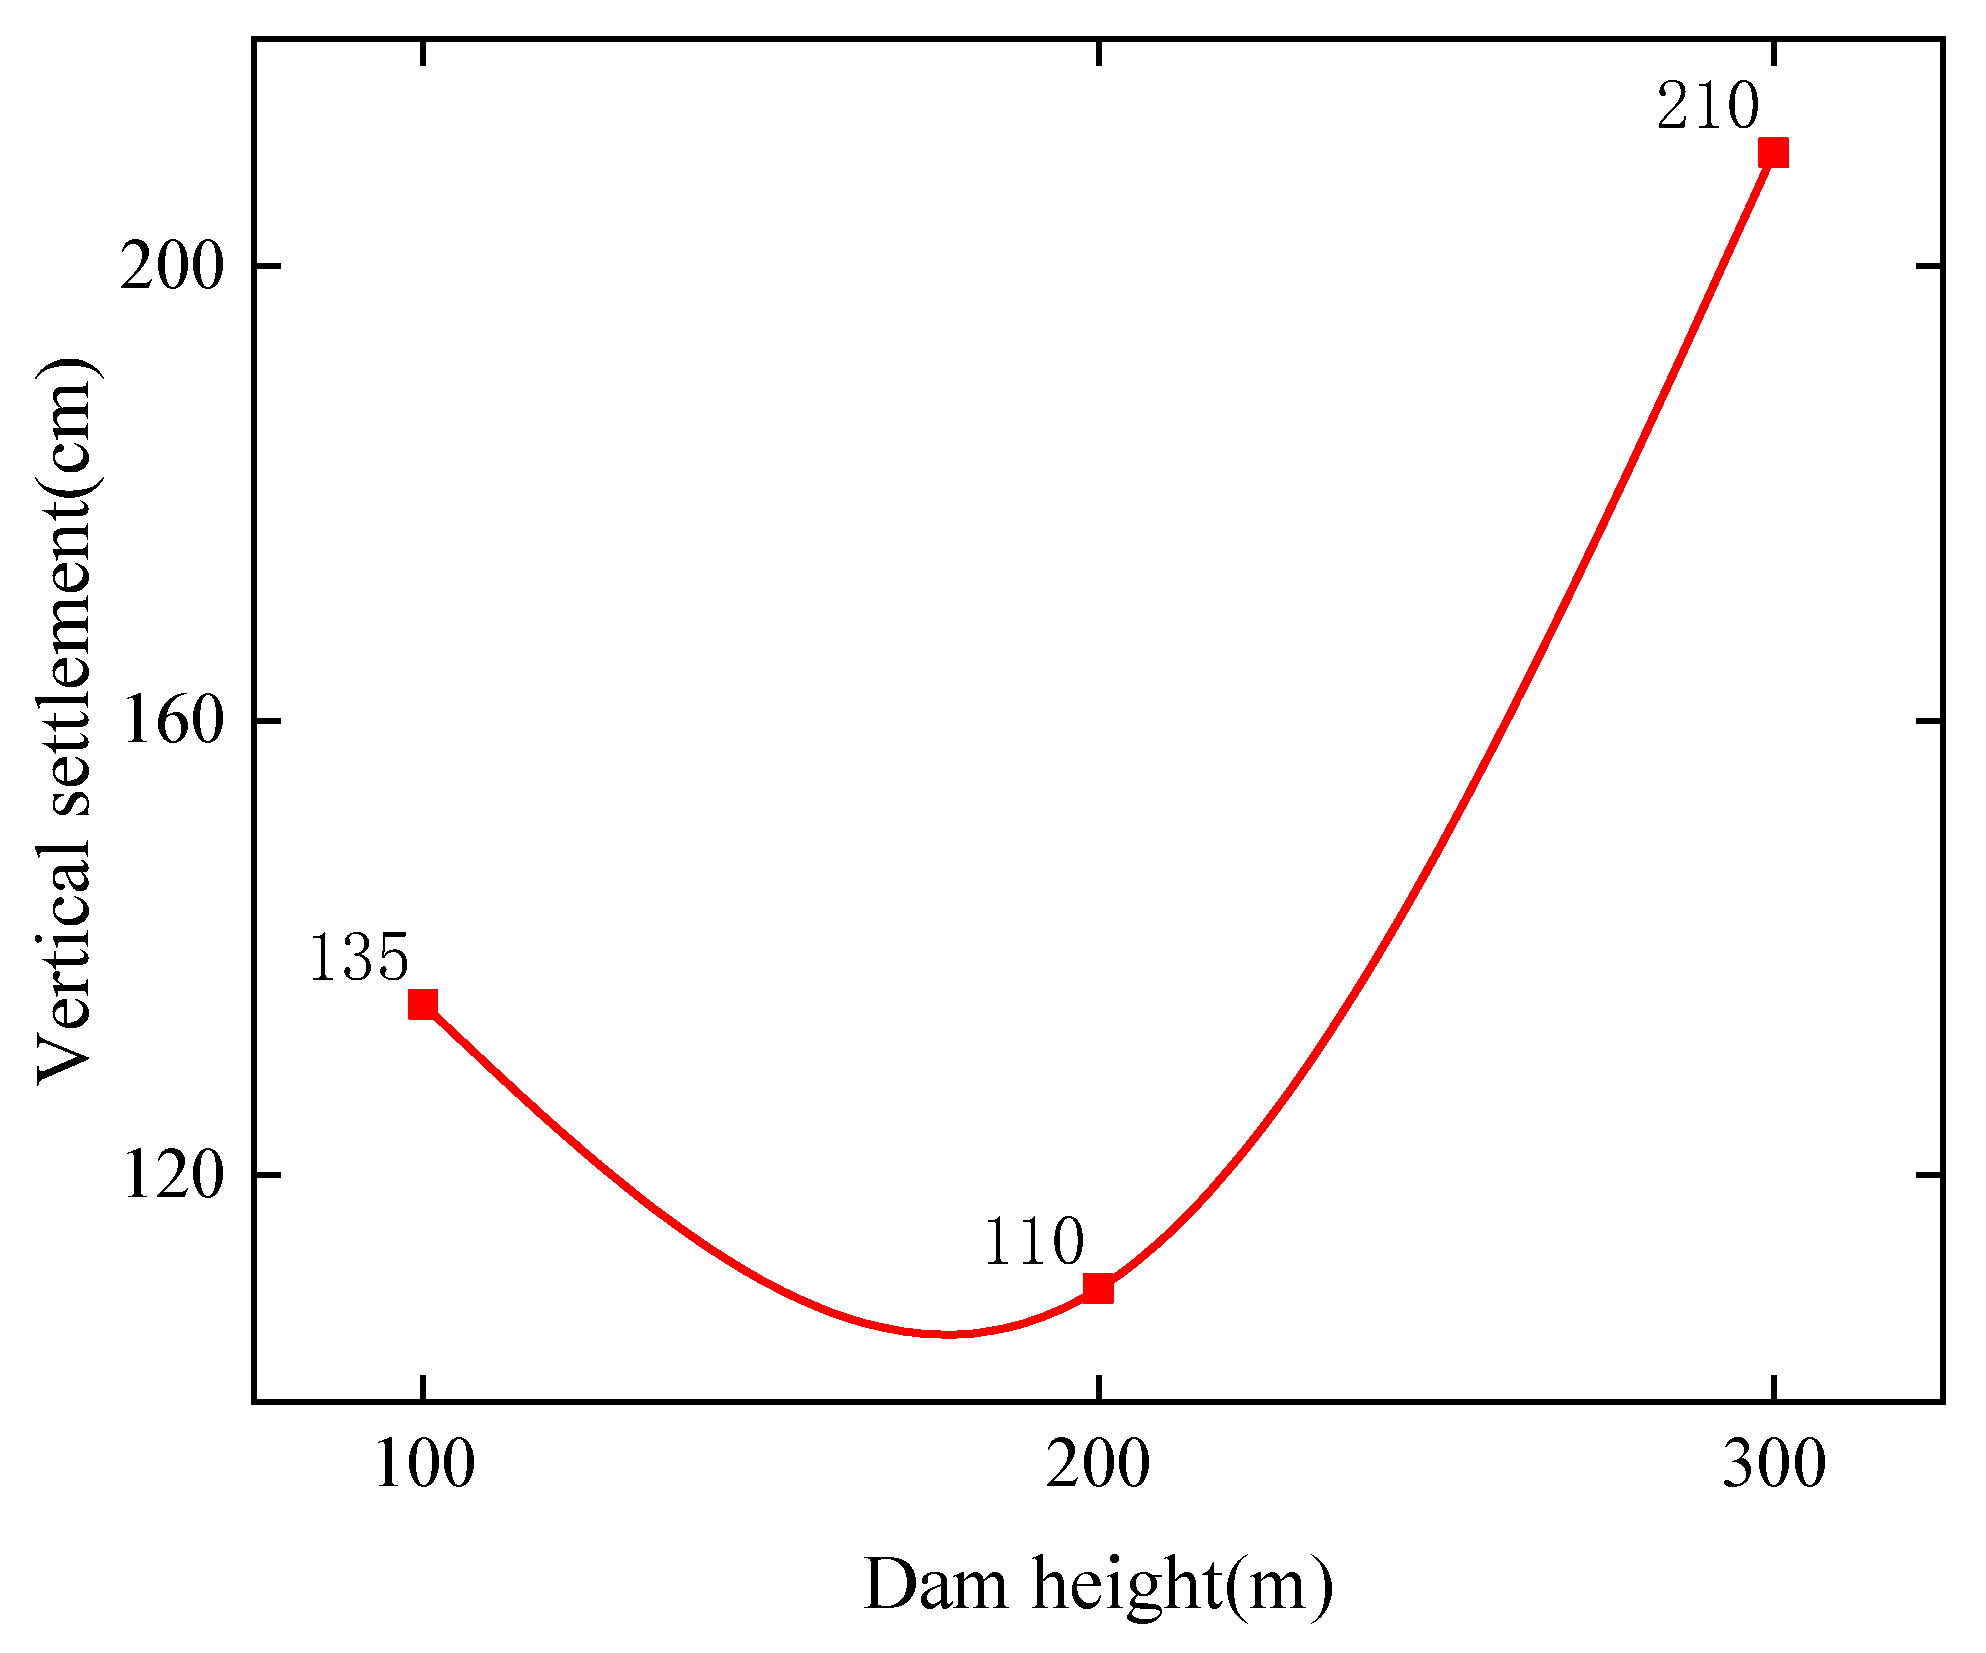
When considering the vertical settlement of the dam body in four different types of site soils, especially on weak soil, the dam body settlement significantly increases with dam height. At a dam height of 100 m, the settlement reaches 4.234 m, and at dam heights of 200 and 300 m, the settlement amounts to 21.19 and 27.09 m, respectively, indicating substantial damage. Therefore, constructing dams on weak soil or cover layers containing weak interlayers, especially for dams exceeding 200 m in height, requires further research and verification to ensure seismic safety.

Author Contributions

Methodology, C.Z. and X.L.; Resources, M.Z.; Writing—original draft, C.Z. and N.Z.; Writing—review & editing, M.Z., C.Z. and X.L.; Visualization, C.Z. All authors have read and agreed to the published version of the manuscript.

Funding

This research was funded by National Natural Science Foundation of China, grant number 52009045.

Data Availability Statement

Not application.

Conflicts of Interest

The authors declare no conflict of interest.

References

  1. Shi, J. Deep cover layer of Dadu River and its engineering geological problems. Sichuan Water Power 1986, 3, 10–15+2–91. [Google Scholar]
  2. Luo, S. Understanding deep cover layer geological problems. Water Power 1995, 4, 21–24+58. [Google Scholar]
  3. Xu, Q.; Chen, W.; Zhang, Z. New understanding of the formation mechanism of deep cover layers in the southwest region of China. Adv. Earth Sci. 2008, 5, 448–456. [Google Scholar]
  4. Hu, Y. Earthquake Engineering, 2nd ed.; Earthquake Press: Beijing, China, 2006. [Google Scholar]
  5. Shu, T.; Li, Q.; Wang, T.; Jiang, L.; Guo, Z.; Lei, M.; Liu, D. Study on the shock-absorbing effect of a new staggered story isolated structure under the long-period earthquake motion. Front. Earth Sci. 2023, 10, 1025231. [Google Scholar] [CrossRef]
  6. Tsai, C.C.; Hsu, S.Y.; Wang, K.L.; Yang, H.C.; Chang, W.K.; Chen, C.H.; Hwang, Y.W. Geotechnical re-connaissance of the 2016 ML6.6 Meinong Earthquake in Taiwan. J. Earthq. Eng. 2018, 22, 1710–1736. [Google Scholar] [CrossRef]
  7. Ministry of Water Resources of the People’s Republic of China. SL203-97 Seismic Design Specification for Hydraulic Structures; China Electric Power Press: Beijing, China, 2001. [Google Scholar]
  8. Karalar, M.; Cavuslu, M. Determination of 3D near fault seismic behaviour of Oroville earth fill dam using burger material model and free field-quiet boundary conditions. Math. Comput. Model. Dyn. Syst. 2022, 28, 55–77. [Google Scholar] [CrossRef]
  9. Avuli, M.; Karalar, M. Three dimensional seismic deformation-shear strain-swelling performance of America-California Oroville Earth-Fill Dam. Geomech. Eng. 2021, 24, 443–456. [Google Scholar]
  10. Karalar, M.; Cavusli, M. Seismic effects of epicenter distance of earthquake on 3D damage performance of CG dams. Earthq. Struct. 2020, 18, 201–213. [Google Scholar]
  11. Mei, W.; Gu, S.; Lei, H.; Wu, Q.; Huo, Y.; Du, W. Dynamic response analysis of rock-fill dams under near-fault pulse seismic motion. J. Wuhan Univ. 2020, 53, 853–860. [Google Scholar]
  12. Zhang, X.; Wei, Y.; Zhang, Z.; Liang, J. Centrifuge modeling study on seismic wave propagation characteristics in deep cover layers. J. China Inst. Water Resour. Hydropower Res. 2017, 15, 272–277. [Google Scholar]
  13. Yang, Z.; Liu, X.; Zhao, J.; Tian, Z.; Yang, Y. Research on seismic response analysis of sites considering the structural characteristics of deep cover layers. J. Hydroelectr. Eng. 2015, 34, 175–182. [Google Scholar]
  14. Yu, T.; Shao, L. Study on dynamic characteristics of dam foundation with weak soil layer in deep thick bedrock cover. Rock Soil Mech. 2020, 41, 267–277. [Google Scholar]
  15. Shen, H.; Chi, S.; Jia, Y.; Li, H. Seismic analysis of 250 m-grade rock-fill dams on cover layer foundation. J. Hohai Univ. 2007, 3, 271–275. [Google Scholar]
  16. Kong, X.; Lou, S.; Zou, D.; Jia, G.; Han, G. Equivalent dynamic shear modulus and equivalent damping ratio of dam fill materials. J. Hydraul. Eng. 2001, 8, 20–25. [Google Scholar]
  17. Nikora, V.I. Fractal structures of river plan forms. Water Resour. Res. 1991, 27, 1327–1333. [Google Scholar] [CrossRef]
  18. Li, X.; Wang, W.; Wu, D.; Xu, X.; Li, Z.; Li, Y. Characteristic analysis and determination method of long-period seismic motion. J. Vib. Eng. 2014, 27, 685–692. [Google Scholar]
  19. Peer Strong Motion Database. Available online: https://ngawest2.berkeley.edu/site (accessed on 1 September 2022).
  20. Duncan, J.M.; Chang, C.Y. Nonlinear Analysis of Stress and Strain in Soils. J. Soil Mech. Found. Div. ASCE 1970, 96, 1629–1653. [Google Scholar] [CrossRef]
  21. Xie, D. Study on the origin and engineering effects of deep cover layers at the Altash Hydropower Station on the Yarkant River in Xinjiang. Chengdu University of Technology, 2013. Available online: https://kns.cnki.net/KCMS/detail/detail.aspx?dbname=CMFD201402&filename=1013288344.nh (accessed on 5 September 2023).
  22. Ji, Q. Engineering characteristics and utilization of deep cover layers in Zecheng Xian Water and Hydropower Station, Shanxi Province. Sci. Technol. Inf. Dev. Econ. 2010, 20, 184–186. [Google Scholar]
  23. Xiao, M.; Cui, J.; Li, Y.D.; Nguyen, V.Q. Nonlinear Seismic Response Based on Different Site Types: Soft Soil and Rock Strata. Adv. Civil Eng. 2022, 2022, 5370369. [Google Scholar] [CrossRef]
  24. Vasileios, T.; Gerold, R.; Christian, P. An Integrated PRE Methodology for Capturing the Reaction Performance of Single- and Multi-site Type Catalysts Using Bench-Scale Polymerization Experiments. Macromol. React. Eng. 2020, 14, 2000028. [Google Scholar]
  25. Gu, G.; Shen, C.; Cen, W. Seismic Engineering of Rockfill Dams; China Water and Power Press: Beijing, China, 2009. [Google Scholar]
  26. Shen, Z.; Xu, G. Dynamic deformation characteristics of rockfill materials. J. Hydraul. Eng. 1996, 2, 143–150. [Google Scholar]
  27. Zhang, Y.; Zhu, C.; Wang, J. Cumulative Effect of Rock Mass Fracture in Stepped Rock Slopes Considering Residual Deformation. Water Resour. Sci. Econ. 2022, 28, 35–40. [Google Scholar]
  28. Liu, B.; Hu, J. Research Progress on Post-Earthquake Residual Displacement of Structures. World Earthq. Eng. 2020, 36, 131–140. [Google Scholar]
  29. Application of ABAQUS in Geotechnical Engineering (Hydroelectric Edition). Rock Soil Mech. 2010, 31, 552.
  30. Gu, G.; Zhang, Z. Three-Dimensional Nonlinear Finite Element Dynamic Analysis of Reinforced Concrete Face Rockfill Dams. J. Hydroelectr. Eng. 1988, 1, 26–45. [Google Scholar]
  31. Chao, G.; Junxiao, H. Dynamic Response of Wooden Columns in Traditional Timber Structures Under Horizontal Earthquake. Int. J. Struct. Stab. Dyn. 2021, 21, 2150134. [Google Scholar]
  32. Gopal, R.N.; Babu, K.N.; Damian, S.; Krakowiak, K.J. Discrete Lattice Modeling of Wave Propagation in Materials with Heterogeneous Microstructures. J. Eng. Mech. 2021, 147, 04021075. [Google Scholar]
  33. Jagajyoti, P.; Sanjukta, C.; Samit, R. A novel servomechanism based proportional–integral controller with Kalman filter estimator for seismic response control of structures using magneto-rheological dampers. Struct. Control. Health Monit. 2021, 28, e2807. [Google Scholar]
  34. Wei, X.; Liu, J.-C.; Bi, S. Uncertainty quantification and propagation of crowd behaviour effects on pedestrian-induced vibrations of footbridges. Mech. Syst. Signal Process. 2022, 167, 108557. [Google Scholar] [CrossRef]
  35. Li, X.; Tan, P.; Wang, Y.; Zhang, Y.; Li, X.; He, Q.; Zhou, F. Shaking Table Test and Numerical Simulation on a Mega-Sub Isolation System Under Near-Fault Ground Motions with Velocity Pulses. Int. J. Struct. Stab. Dyn. 2022, 22, 2250026. [Google Scholar] [CrossRef]
Figure 1. Model diagram: (a) the overall model and mesh of the 100-m-high dam; (b) cross-sectional diagram of the dam.
Buildings 13 02410 g001
Figure 2. Acceleration time-history curve of TCU068 near-fault pulse ground motion: (a) X—downstream direction; (b) Y—dam axis direction; (c) Z—vertical direction.
Buildings 13 02410 g002
Figure 3. Maximum principal stress in hard soil site (MPa).
Buildings 13 02410 g003
Figure 4. Maximum principal stress in weak soil site (MPa).
Buildings 13 02410 g004
Figure 5. Displacement along the river direction in hard ground soil/(m).
Buildings 13 02410 g005
Figure 6. Displacement along the river direction in weak ground soil/(m).
Buildings 13 02410 g006
Figure 7. Three-dimensional visualization of dam settlement.
Buildings 13 02410 g007
Figure 8. Acceleration response spectrum of the cover layer: (a) elevation of 0 m (bedrock input location); (b) elevation of 50 m (middle of the cover layer); (c) elevation of 100 m (free surface).
Buildings 13 02410 g008aBuildings 13 02410 g008b
Figure 9. Residual deformation displacement nephogram.
Buildings 13 02410 g009
Figure 10. Cloud maps of permanent vertical settlement deformation: (a) cloud map of permanent vertical settlement deformation for 100 m dam; (b) cloud map of permanent vertical settlement deformation for 200 m dam; (c) cloud map of permanent vertical settlement deformation for 300 m dam.
Buildings 13 02410 g010aBuildings 13 02410 g010b
Figure 11. Residual vertical deformation for dams with heights of 100, 200, and 300 m in hard soil conditions.
Buildings 13 02410 g011
Table 1. Site classification scheme of seismic code.
Venue TypeSoil Shear Wave Velocity Range (m/s)Representative Rock and Soil Names
I—hard field soilVs > 500Stable rock, dense gravel soil
II—medium–hard court soil500 ≥ Vs > 250Medium-dense, slightly dense gravel, coarse-medium sand, hard clay
III—medium–soft ground250 ≥ Vs > 140Slightly dense gravel, coarse medium sand, soft clay
IV—weak site soilVs ≤ 140Silt and silty soils, loose sand, artificial soils
Table 2. Duncan–Chang E-B parameters.
Material K n R f c φ φ K b m K u r Density / g · c m 3
Rock pile area17500.550.85052.999500.2535002.3
Cushion area18000.50.8054.310.39500.3536002.3
Transition zone11530.380.75057.6311.410850.1224002.08
Hard cover layer13800.530.874052.586900.5227602.21
Medium–hard cover layer11700.430.75049.97.49440.27425102.05
Medium–soft cover layer10310.360.910053.59.18100.1615642.06
Weak cover layer2650.340.841335.73770.115301.68
Table 3. Concrete panel material parameters.
Parameter ρ d / k g · m 3 E/GPa μ
Index2.5300.167
Table 4. Equivalent linear parameters.
Materialk
(Shear Modulus Coefficient)
n
(Shear Modulus Index)
v
(Poisson’s Ratio)
Rock pile area3784.40.4160.3
Cushion area3051.70.5050.3
Transition zone3183.60.5090.3
Hard covering24000.460.33
Medium–hard cover20450.470.44
Medium–soft cover38950.460.45
Weak cover8950.5370.32
Table 5. Dam top response acceleration and post-earthquake residual deformation.
Types of Cover LayerAcceleration ResponseResidual Deformation
Downstream DirectionDam Axis DirectionVertical DirectionDownstream Direction/cmVertical Direction/cm
a m a x / m · s 2 β a m a x / m · s 2 β a m a x / m · s 2 β
Hard soil20.13.934.81.515.41.5816.8135
Medium–hard soil17.13.343.91.234.341.279.6108.5
Medium–soft soil8.891.742.740.723.851.13586.8
Weak soil4.280.841.530.483.10.912.4270
Disclaimer/Publisher’s Note: The statements, opinions and data contained in all publications are solely those of the individual author(s) and contributor(s) and not of MDPI and/or the editor(s). MDPI and/or the editor(s) disclaim responsibility for any injury to people or property resulting from any ideas, methods, instructions or products referred to in the content.

