5.1. Post-Buckling Similarity Simulation of Axial Compression Based on First-Order EMI
The geometric and material parameters of the longitudinal ring rectangular stiffened cylinder (LRRSC) and the longitudinal ring T-type stiffened cylinder (LRTSC) are listed in
Table 7. The ends of the skin of the stiffened cylinders are constrained, and the geometric scale factors are equal to 10.
In the finite element analysis, based on the first-order eigenvalue buckling mode and introduction of the imperfection factor ξ, imperfect structure models were obtained by introducing imperfections into the perfect structural models and updating the node coordinates.
For stiffened cylinders with different aspect ratios (L/R = 1.26, 2.51, and 3.77), boundary conditions (SS3 and C3) and stiffened cross-sections (rectangular and T-type), similitude simulations for axial compression post-buckling with four imperfection factors (0.05, 0.1, 0.3, and 0.5) were performed based on the first-order EMI.
The partial similarities for axial compression post-buckling of LRRSC with the C3 boundary condition are similar to those of structures with the SS3 boundary condition. Only partial similarities are given for axial compression post-buckling of structures with L/R = 2.51 and the SS3 boundary condition.
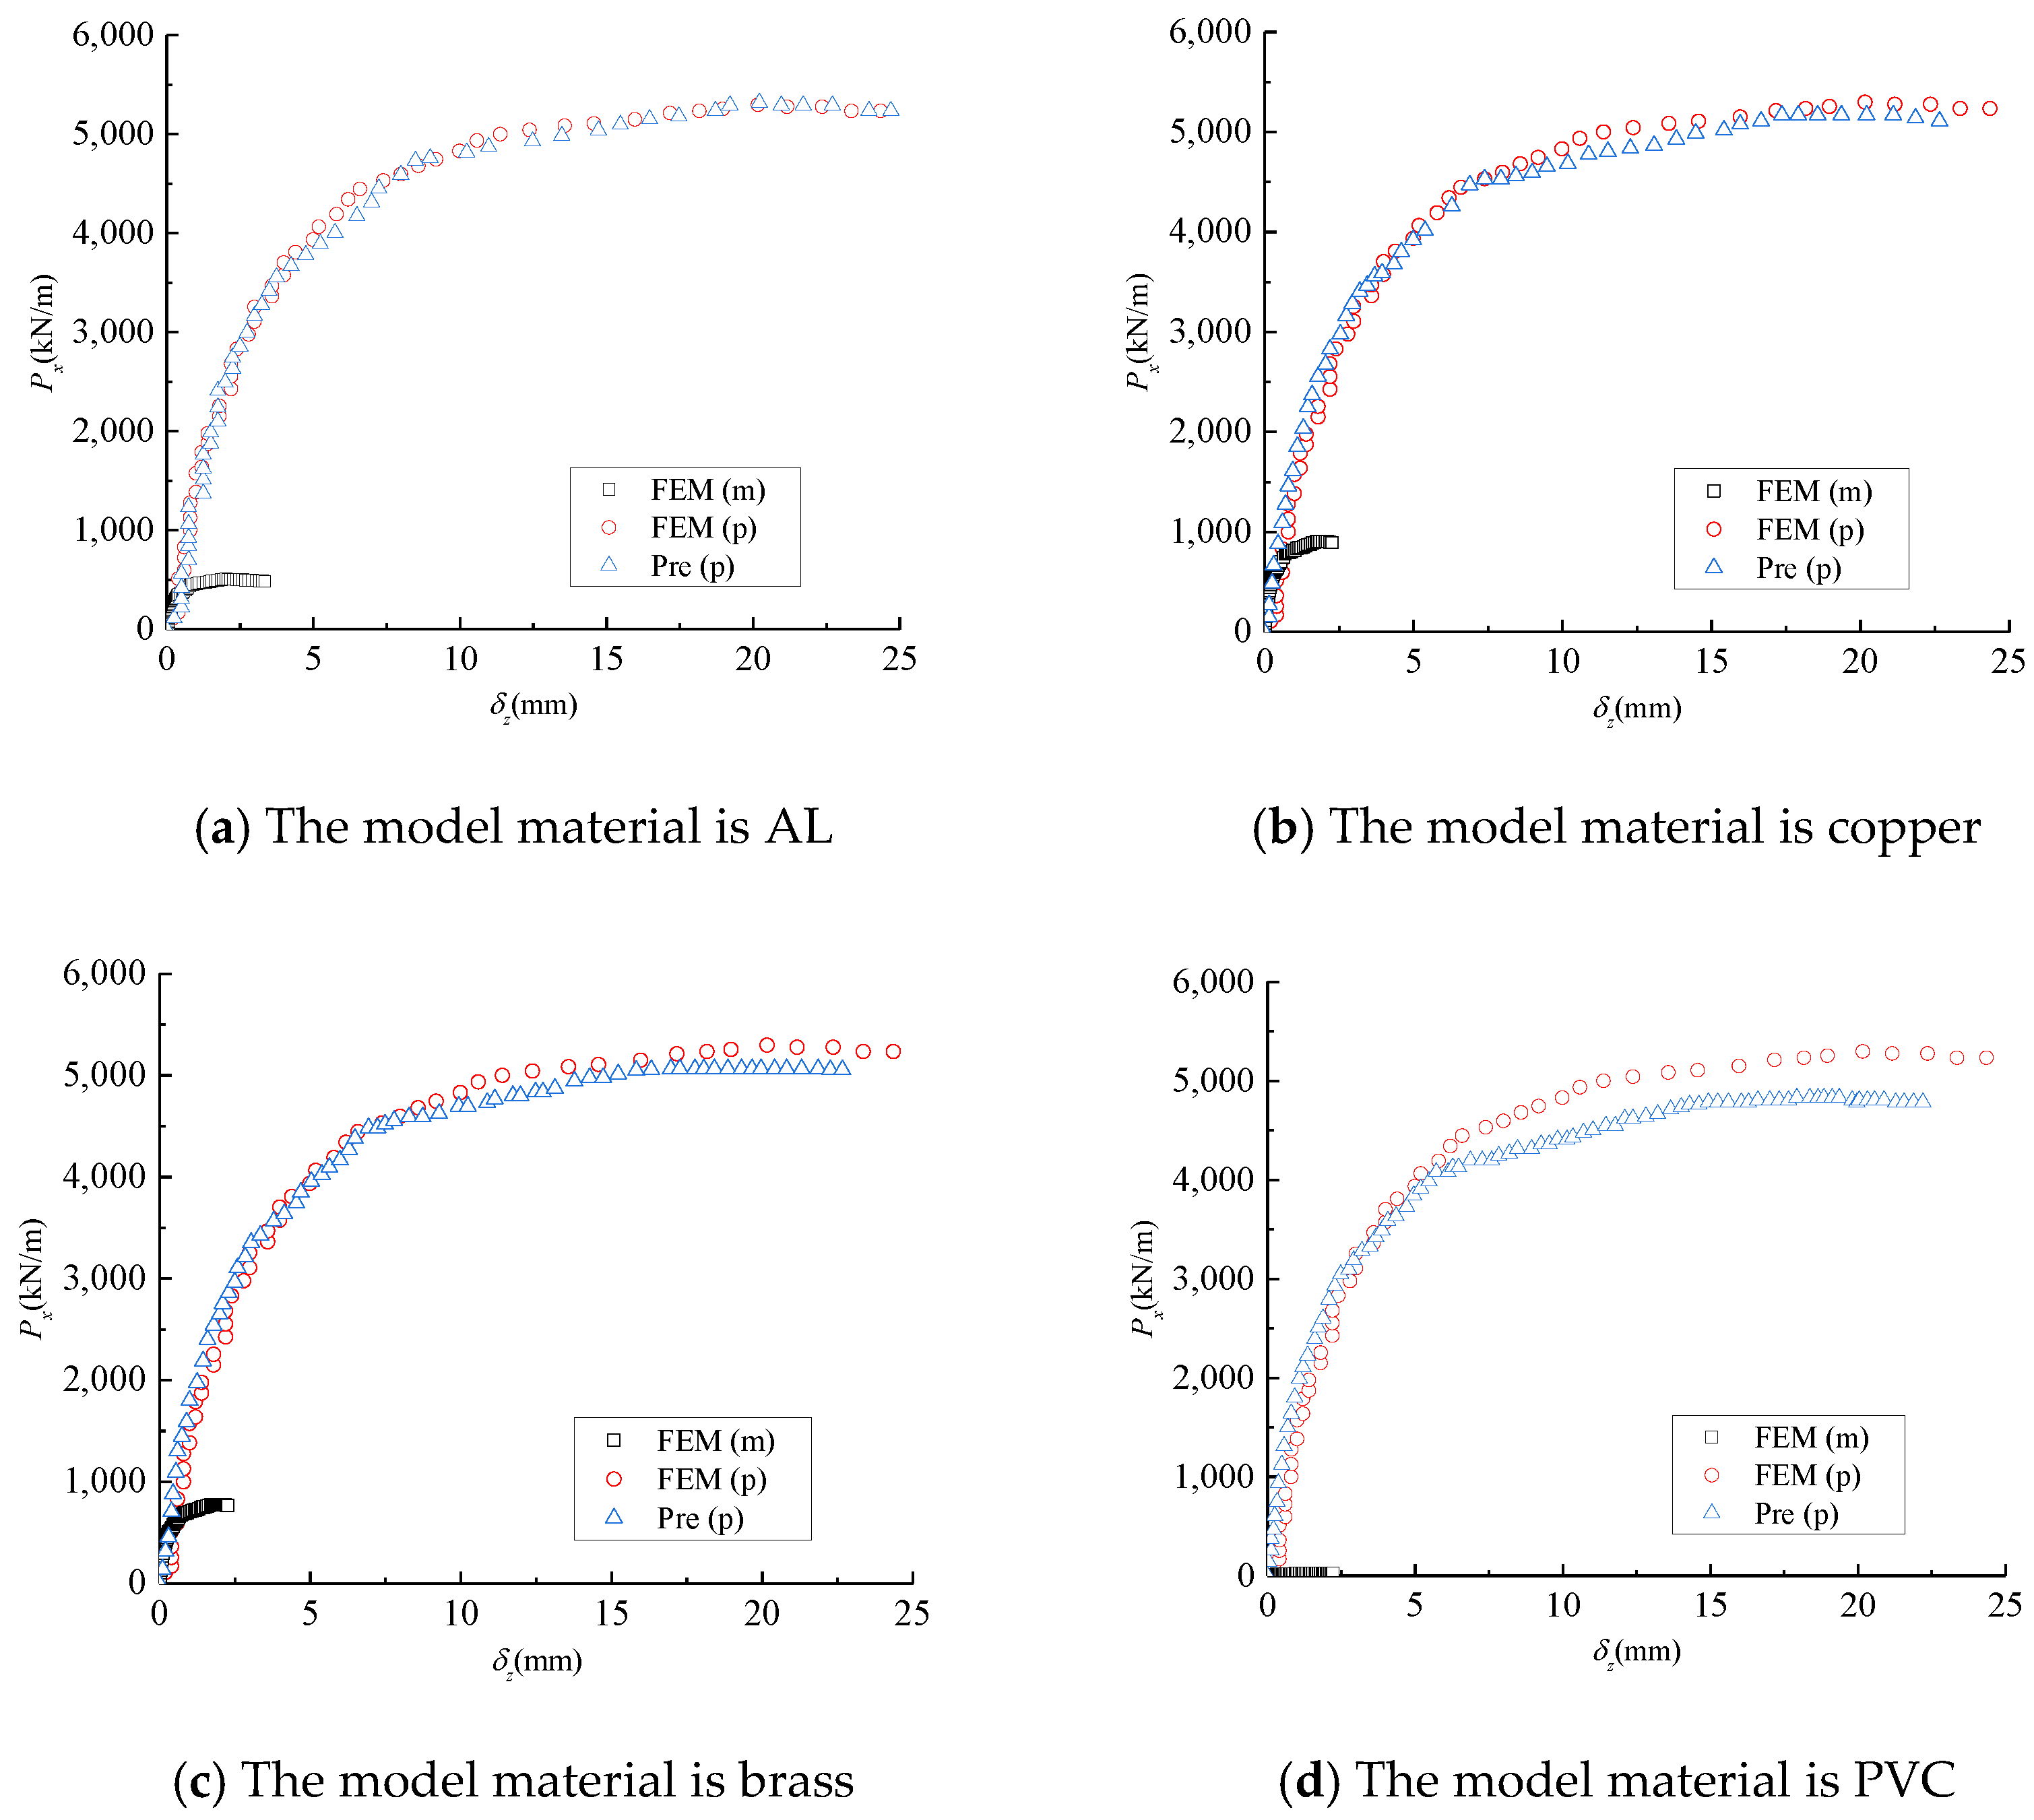
If the material of the model is AL,
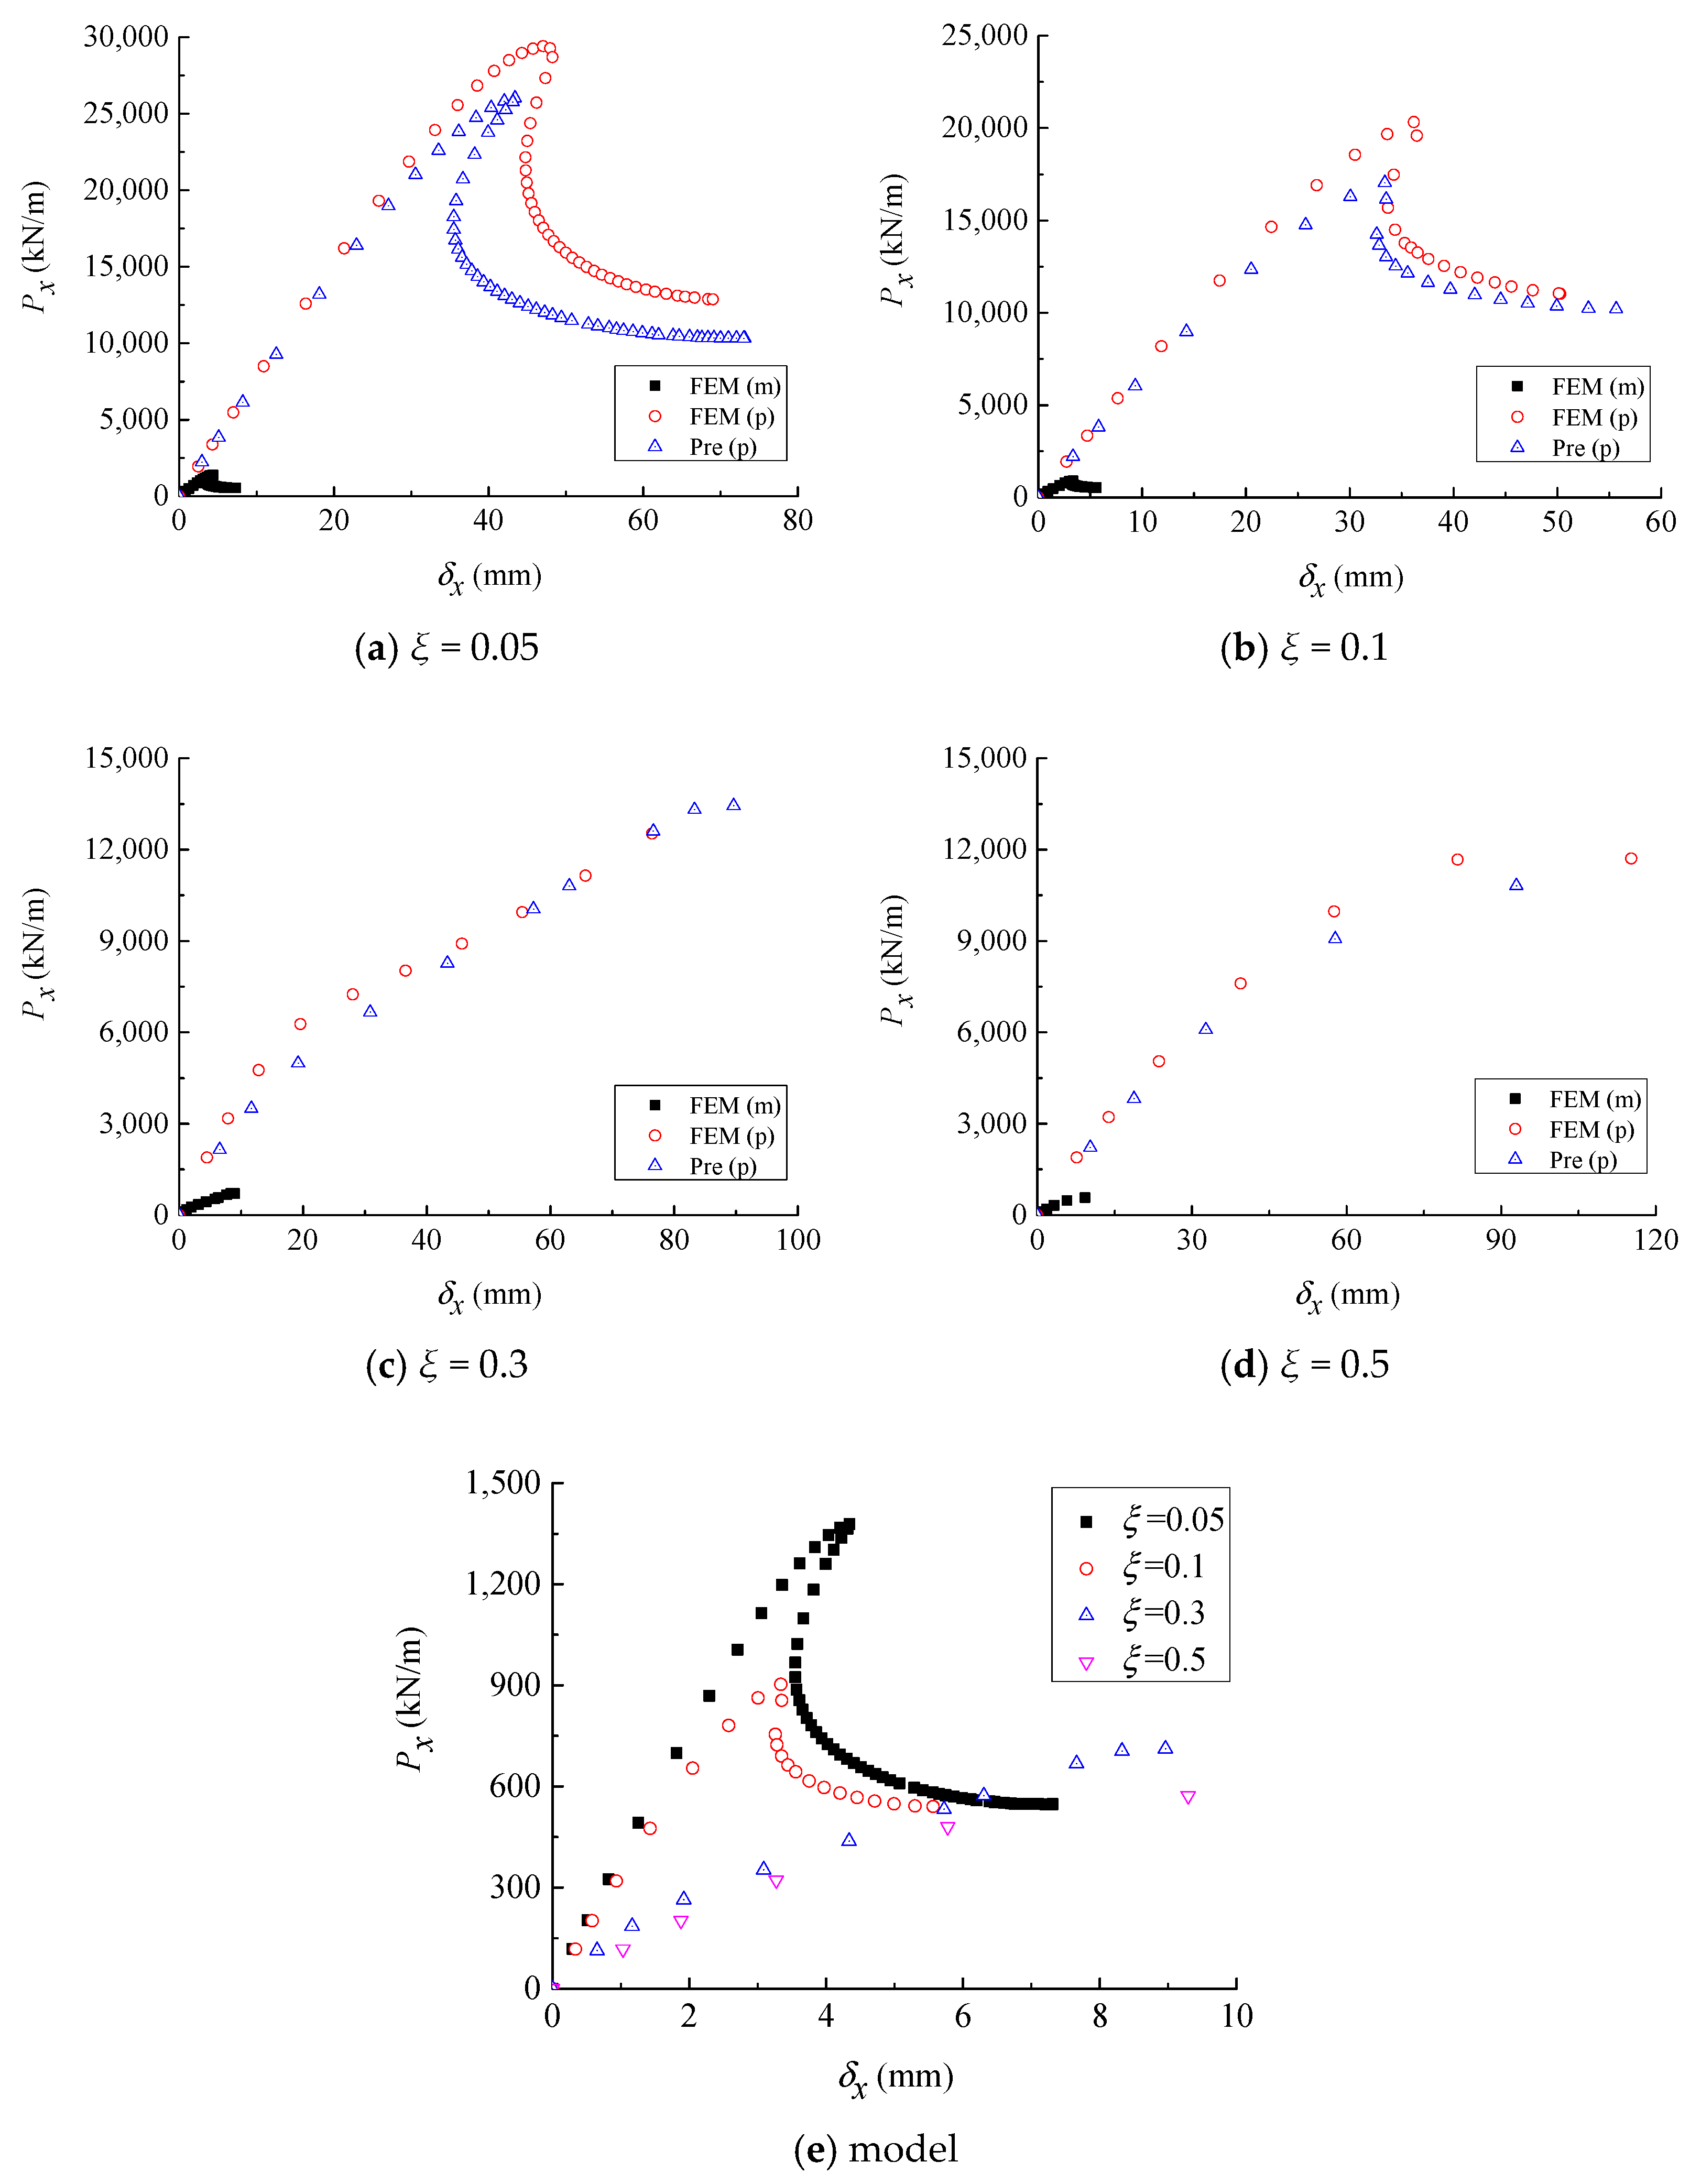
Figure 4 shows the results of partial similarity and the equilibrium paths of the models for axial compression post-buckling of rectangular stiffened cylinders with
L/
R = 2.51, the SS3 boundary condition and four different geometric imperfections (
ξ = 0.05, 0.1, 0.3, and 0.5). As shown in
Figure 4a–d, the equilibrium paths of the models can primarily predict the results of its prototype using the scaling law Equation (25) and the deformation scaling factor. As observed from
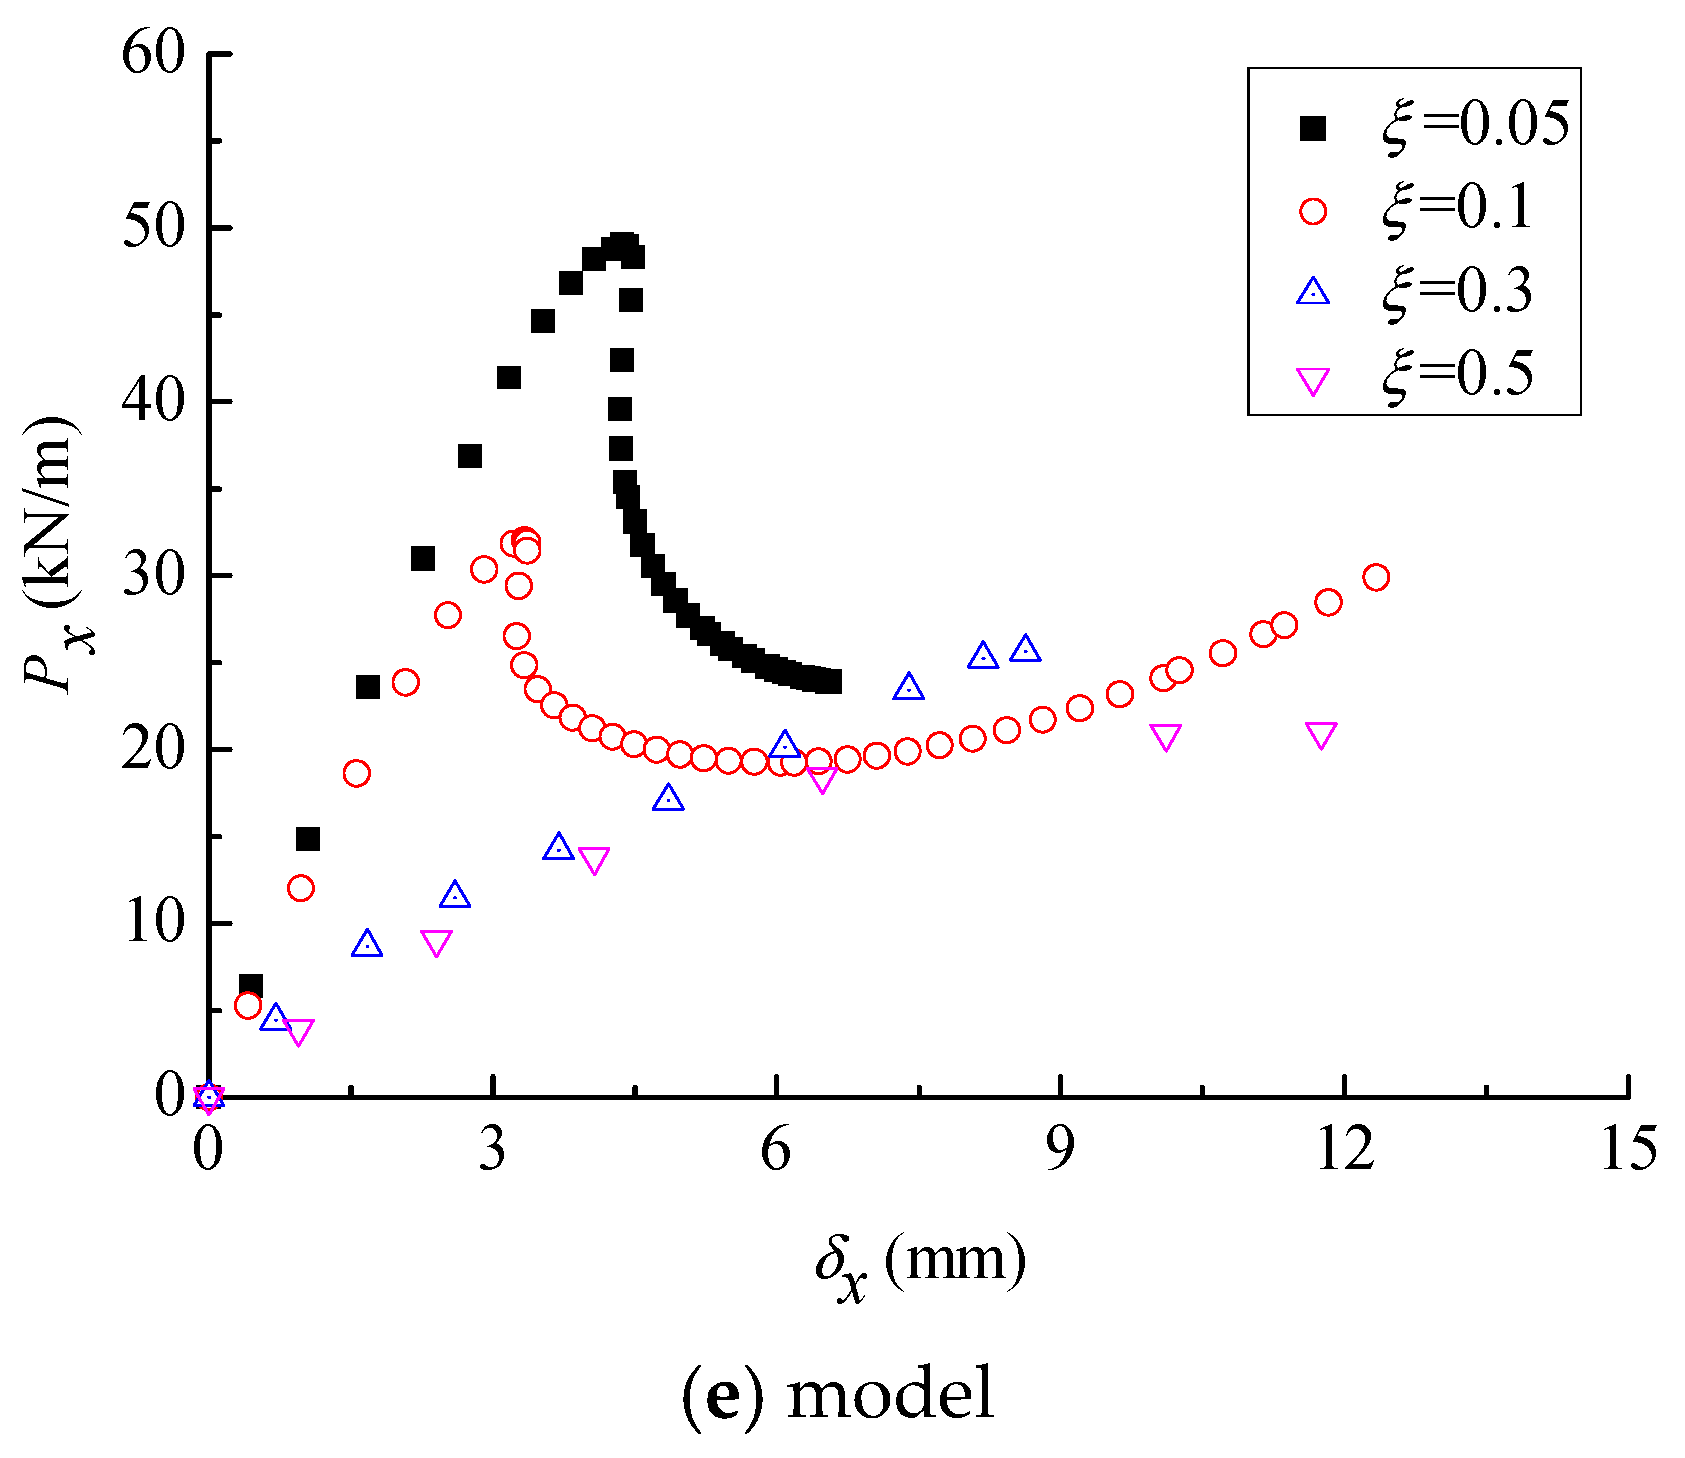
Figure 4e, the slope of the linear phase curve gradually decreases as the imperfection factor increases in the initial stage of loading. When
ξ = 0.05 and 0.1, the type of structural buckling belongs to limit-point instability. When the imperfect factor is small, the limit point of the equilibrium path extends far to a tip, and the buckling limit load gradually decreases as the imperfection factor increases. When
ξ > 0.1, the axial compression buckling bearing capacity of structures shows the characteristic of monotonously stable increase. For
ξ = 0.5, the deviation between the predicted displacement and the finite element result is large at the end of the post-buckling equilibrium path, because large deformation is produced by a slight change of the load at the end of the equilibrium path. The buckling mode shape (3,5) of the model with
ξ = 0.05 at the limit point of the equilibrium path is shown in
Figure 5 and is the same as the shape at the corresponding point of the prototypical equilibrium path. When
ξ = 0.05 and 0.1, the discrepancies between the predicted axial compression limit loads
Pxlim_p_pre and the axial compression limit loads of the prototype
Pxlim_p are −0.92% and −0.83%, respectively.
When the material of the model is brass,
Figure 6 demonstrates the results of partial similarity and the equilibrium paths of the models for axial compression post-buckling of rectangular stiffened cylinders with
L/
R = 2.51, the SS3 boundary condition, and four different geometric imperfections. As demonstrated by
Figure 6a–d, the equilibrium paths of the models can satisfactorily predict the results of its prototype using the scaling law Equation (18) and the deformation scaling factor. It can be noted from
Figure 6e that the change rule for the equilibrium paths of the model is similar to that in
Figure 4e. The buckling mode shape (3,5) of the model with ξ = 0.05 at the limit point of the equilibrium path is given in
Figure 7, which is the same as the shape at the corresponding point of the prototypical equilibrium path. When
ξ = 0.05 and 0.1, the discrepancies between
Pxlim_p_pre and
Pxlim_p are −4.44% and −3.71%, respectively.
When the material of the model is PVC,
Figure 8 shows the results of partial similarity and the equilibrium paths of the models for axial compression post-buckling of rectangular stiffened cylinders with
L/
R = 2.51, the SS3 boundary condition, and four different geometric imperfections. As shown in
Figure 8a–d, the equilibrium paths of the models can reasonably predict the results of its prototype using the scaling law Equation (18) and the deformation scaling factor. It can be observed from
Figure 8e that the change rule of the model equilibrium paths is similar to those of
Figure 4e and
Figure 6e. The buckling mode shape (3,5) of the model with
ξ = 0.05 at the limit point of the equilibrium path is shown in
Figure 9, which is the same as the shape at the corresponding point of the prototypical equilibrium path. When
ξ = 0.05 and 0.1, the discrepancies between
Pxlim_p_pre and
Pxlim_p are −8.65% and −6.76%, respectively.
When the material of the model is AL,
Figure 10 shows the results of partial similarity and the equilibrium paths of the models for axial compression post-buckling of T-type stiffened cylinders with the SS3 boundary condition and four different geometric imperfections (
ξ = 0.05, 0.1, 0.3, and 0.5). As shown in
Figure 10a–d, the equilibrium paths of the models can predict the results of its prototype using the scaling law Equation (25) and the deformation scaling factor. At the limit points of the equilibrium paths, the buckling mode shapes of the models are both (1,3), and only the case of
ξ = 0.05 is given, as shown in
Figure 11.
Figure 10e depicts the equilibrium paths of the models. At the initial stage of loading, the slope of the linear phase curve gradually decreases as the imperfect factor increases. When
ξ = 0.05 and 0.1, the type of structural buckling is snap-through buckling. A longer post-buckling path of partial models cannot be given because the capability for post-buckling analysis in ANSYS finite element software is not strong. When the imperfection factor is small, the limit loads of the structures under axial compression gradually decrease with the increasing imperfection factor. When
ξ > 0.1, no extreme point appears in the equilibrium paths, and the load-carrying capacity of the structures under axial compression gradually decreases as the imperfection factor increases in the post-buckling stage. When
ξ = 0.05, the discrepancy between
Pxlim_p_pre and
Pxlim_p is −8.21%. When
ξ = 0.1, the discrepancy between
Pxlim_p_pre and
Pxlim_p is −13.03%, and the discrepancy is −5.93% for the lower critical load.
When the material of the model is brass,
Figure 12 presents the results of partial similarity and the equilibrium paths of the models for axial compression post-buckling of T-type stiffened cylinders with the SS3 boundary condition and four different geometric imperfections. As shown in
Figure 12a–d, the equilibrium paths of the models can predict the results of its prototype using the scaling law Equation (18) and the deformation scaling factor. It can be noted from
Figure 12e that the change rule of the equilibrium paths of the models is similar to that of
Figure 10e. The buckling mode shapes of the models are (1,3) at the limit point of the equilibrium path, and only the case of
ξ = 0.05 is given, as shown in
Figure 13. When
ξ = 0.05 and 0.1, the discrepancies between
Pxlim_p_pre and
Pxlim_p are −11.54% and −16.1%, respectively.
When the material of the model is PVC,
Figure 14 shows the results of partial similarity and the equilibrium paths of the models for axial compression post-buckling of T-type stiffened cylinders with the SS3 boundary condition and four different geometric imperfections. As shown in
Figure 14a–d, the equilibrium paths of the models can predict the results of its prototype using the scaling law Equation (18) and the deformation scaling factor. As observed from
Figure 14e, the change rule of equilibrium paths of the models is similar to those of
Figure 10e and
Figure 12e. The buckling mode shapes of the models are (1,3) at the limit point of the equilibrium path, and only the case of ξ = 0.05 is given, as shown in
Figure 15. When
ξ = 0.05 and 0.1, the discrepancies between
Pxlim_p_pre and
Pxlim_p are −14.77% and −19.36%, respectively.
The cases of post-buckling of longitudinal ring T-type stiffened cylinders with the C3 boundary condition are similar to those of the SS3 boundary condition, and the corresponding results are not given.
5.2. Post-Buckling Similarity Simulation of Axial Compression Based on IDDI
The parameters of the longitudinal rectangular stiffened cylinder (LRSC) are listed as follows: R = 1.016 m, L = 1.397 m, t = 1.96596 × 10-³ m, hs = 4.75488 × 10-³ m, ts = 16.7894 × 10-³ m, Ns = 80, E = 68.95 GPa, μ = 0.3, L/R = 1.375, and R/teff = 268.9545. The boundary condition is SS3, and geometric scale factors are 10. For the geometric imperfection of a given function form, the node coordinates of the finite element model are updated based on static analysis, and the imperfections are introduced into the perfect finite element model. The similarity simulation for post-buckling of LRSC under axial compression was analyzed by ANSYS and MATLAB software based on the IDDI.
Using the ideal disturbance symmetric displacement imperfection given by Simitses [
48], post-buckling similarity simulation of imperfect structures with different imperfection amplitudes under axial compression was performed, and the correctness and universality of the scaling laws for the axial compression post-buckling proposed in this paper are further verified.
The functional expression of ideal perturbation symmetric displacement imperfection is written as shown [
48]:
where
is the imperfection amplitude factor. The four cases of imperfection are
ξ = 0.1, 0.3, 0.5, and 1, respectively.
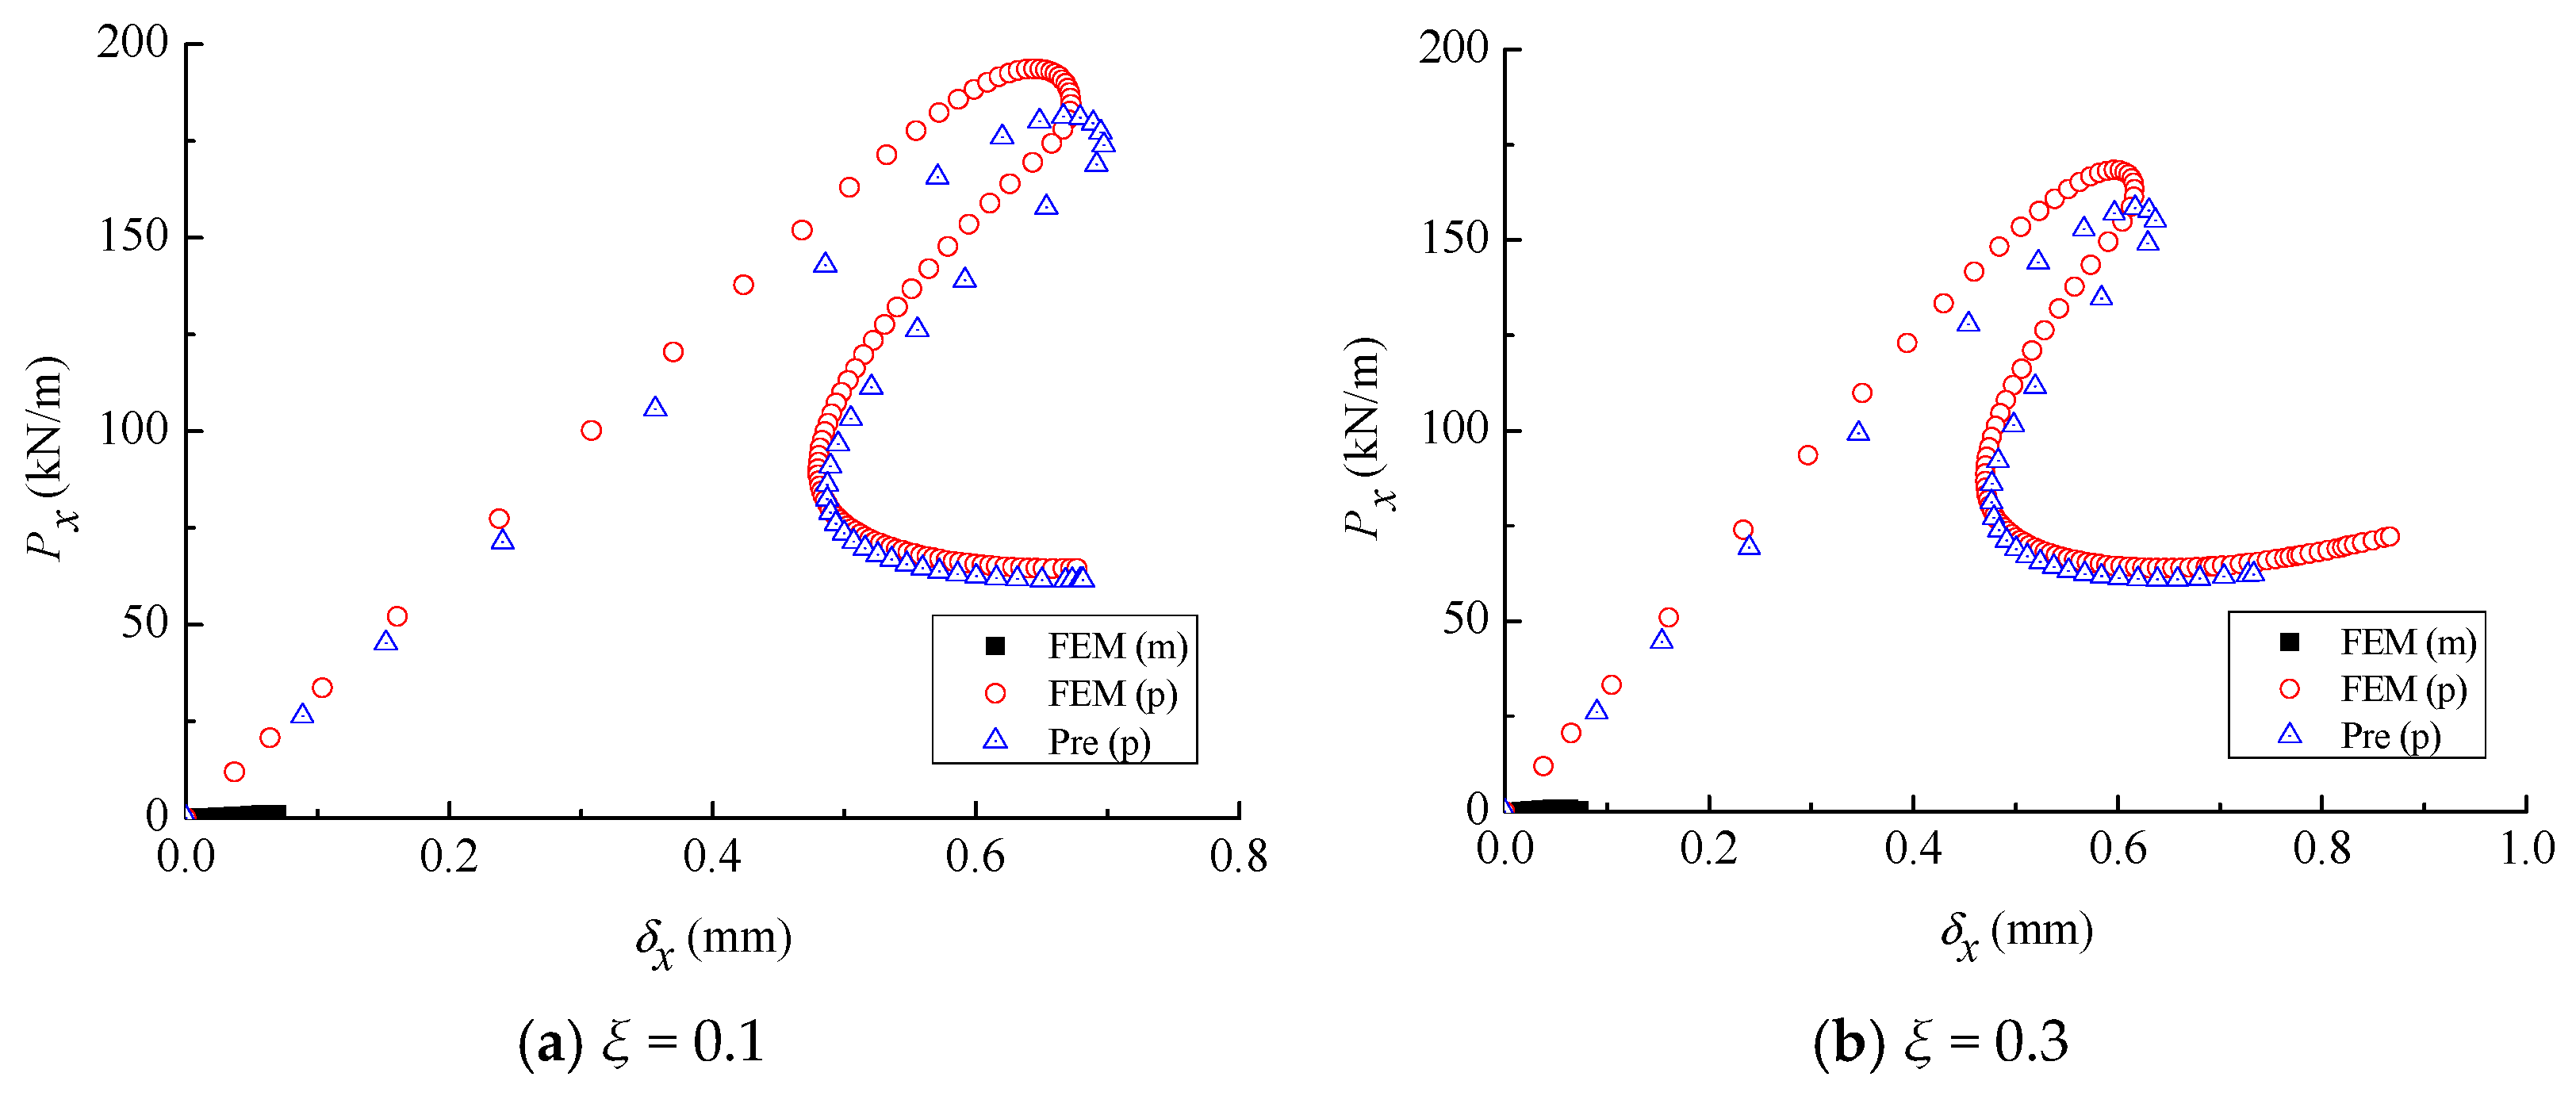
When the material of the model is brass,
Figure 16 shows the results of the partial similarity for axial compression post-buckling of LRSC with the SS3 boundary condition and four different geometric imperfections. As shown in
Figure 16a–d, the equilibrium paths of the models can well predict the results of its prototype using the scaling law Equation (18) and the deformation scaling factor. For the stiffness scaling factor
in Equation (18), its specific value is 626.473.
Figure 17 shows the buckling mode shapes at the upper and lower critical points of the equilibrium path of the model when
ξ = 0.1. When
ξ = 0.1, 0.3, 0.5, and 1, the discrepancies between the predicted upper and lower critical loads and the corresponding results of the prototypes are −3.09% and −2.43%, −2.90% and −2.45%, −2.80% and −2.46%, −2.70% and −2.50%, respectively. The first upper critical loads are considered as
Pxlim.
When the material of the model is PVC,
Figure 18 presents the results of partial similarity for axial compression post-buckling of LRSC with the SS3 boundary condition and four different geometric imperfections. As shown by
Figure 18a–d, the equilibrium paths of the models can well predict the results of its prototype using the scaling law Equation (18) and the deformation scaling factor. The stiffness scaling factor
in Equation (18) has a specific value of 16,693.207.
Figure 19 demonstrates the buckling mode shapes at the upper and lower critical points of the equilibrium path of the model when
ξ = 0.1. When
ξ = 0.1, 0.3, 0.5, and 1, the discrepancies between the predicted upper and lower critical loads and the corresponding results of the prototypes are −6.37% and −4.61%, −5.92% and −4.63%, −5.74% and −4.66%, −5.42% and −4.74%, respectively.
5.3. Post-Buckling Similarity Simulation of Axial Compression Based on the DI
Parameters for the prototype of the LRRSC is shown in
Table 8 [
25]. Geometric scaling factors equal 10. The axial displacement constraint only is released at the upper boundary of the structure, and the fixed support is adopted at the lower boundary. The DI expressed by Equation (22,23) was introduced into the stiffened cylinders, and the center the DI is located at half the height of the structure.
Taking the diameter of the DI equals to 0.060 m, with two imperfection amplitudes equal to 0.1 t and 0.3 t, respectively; the AR method was used to investigate the partial similitude of axial compression post-buckling of longitudinal-ring stiffened cylinders for the distorted scale models made of four materials.
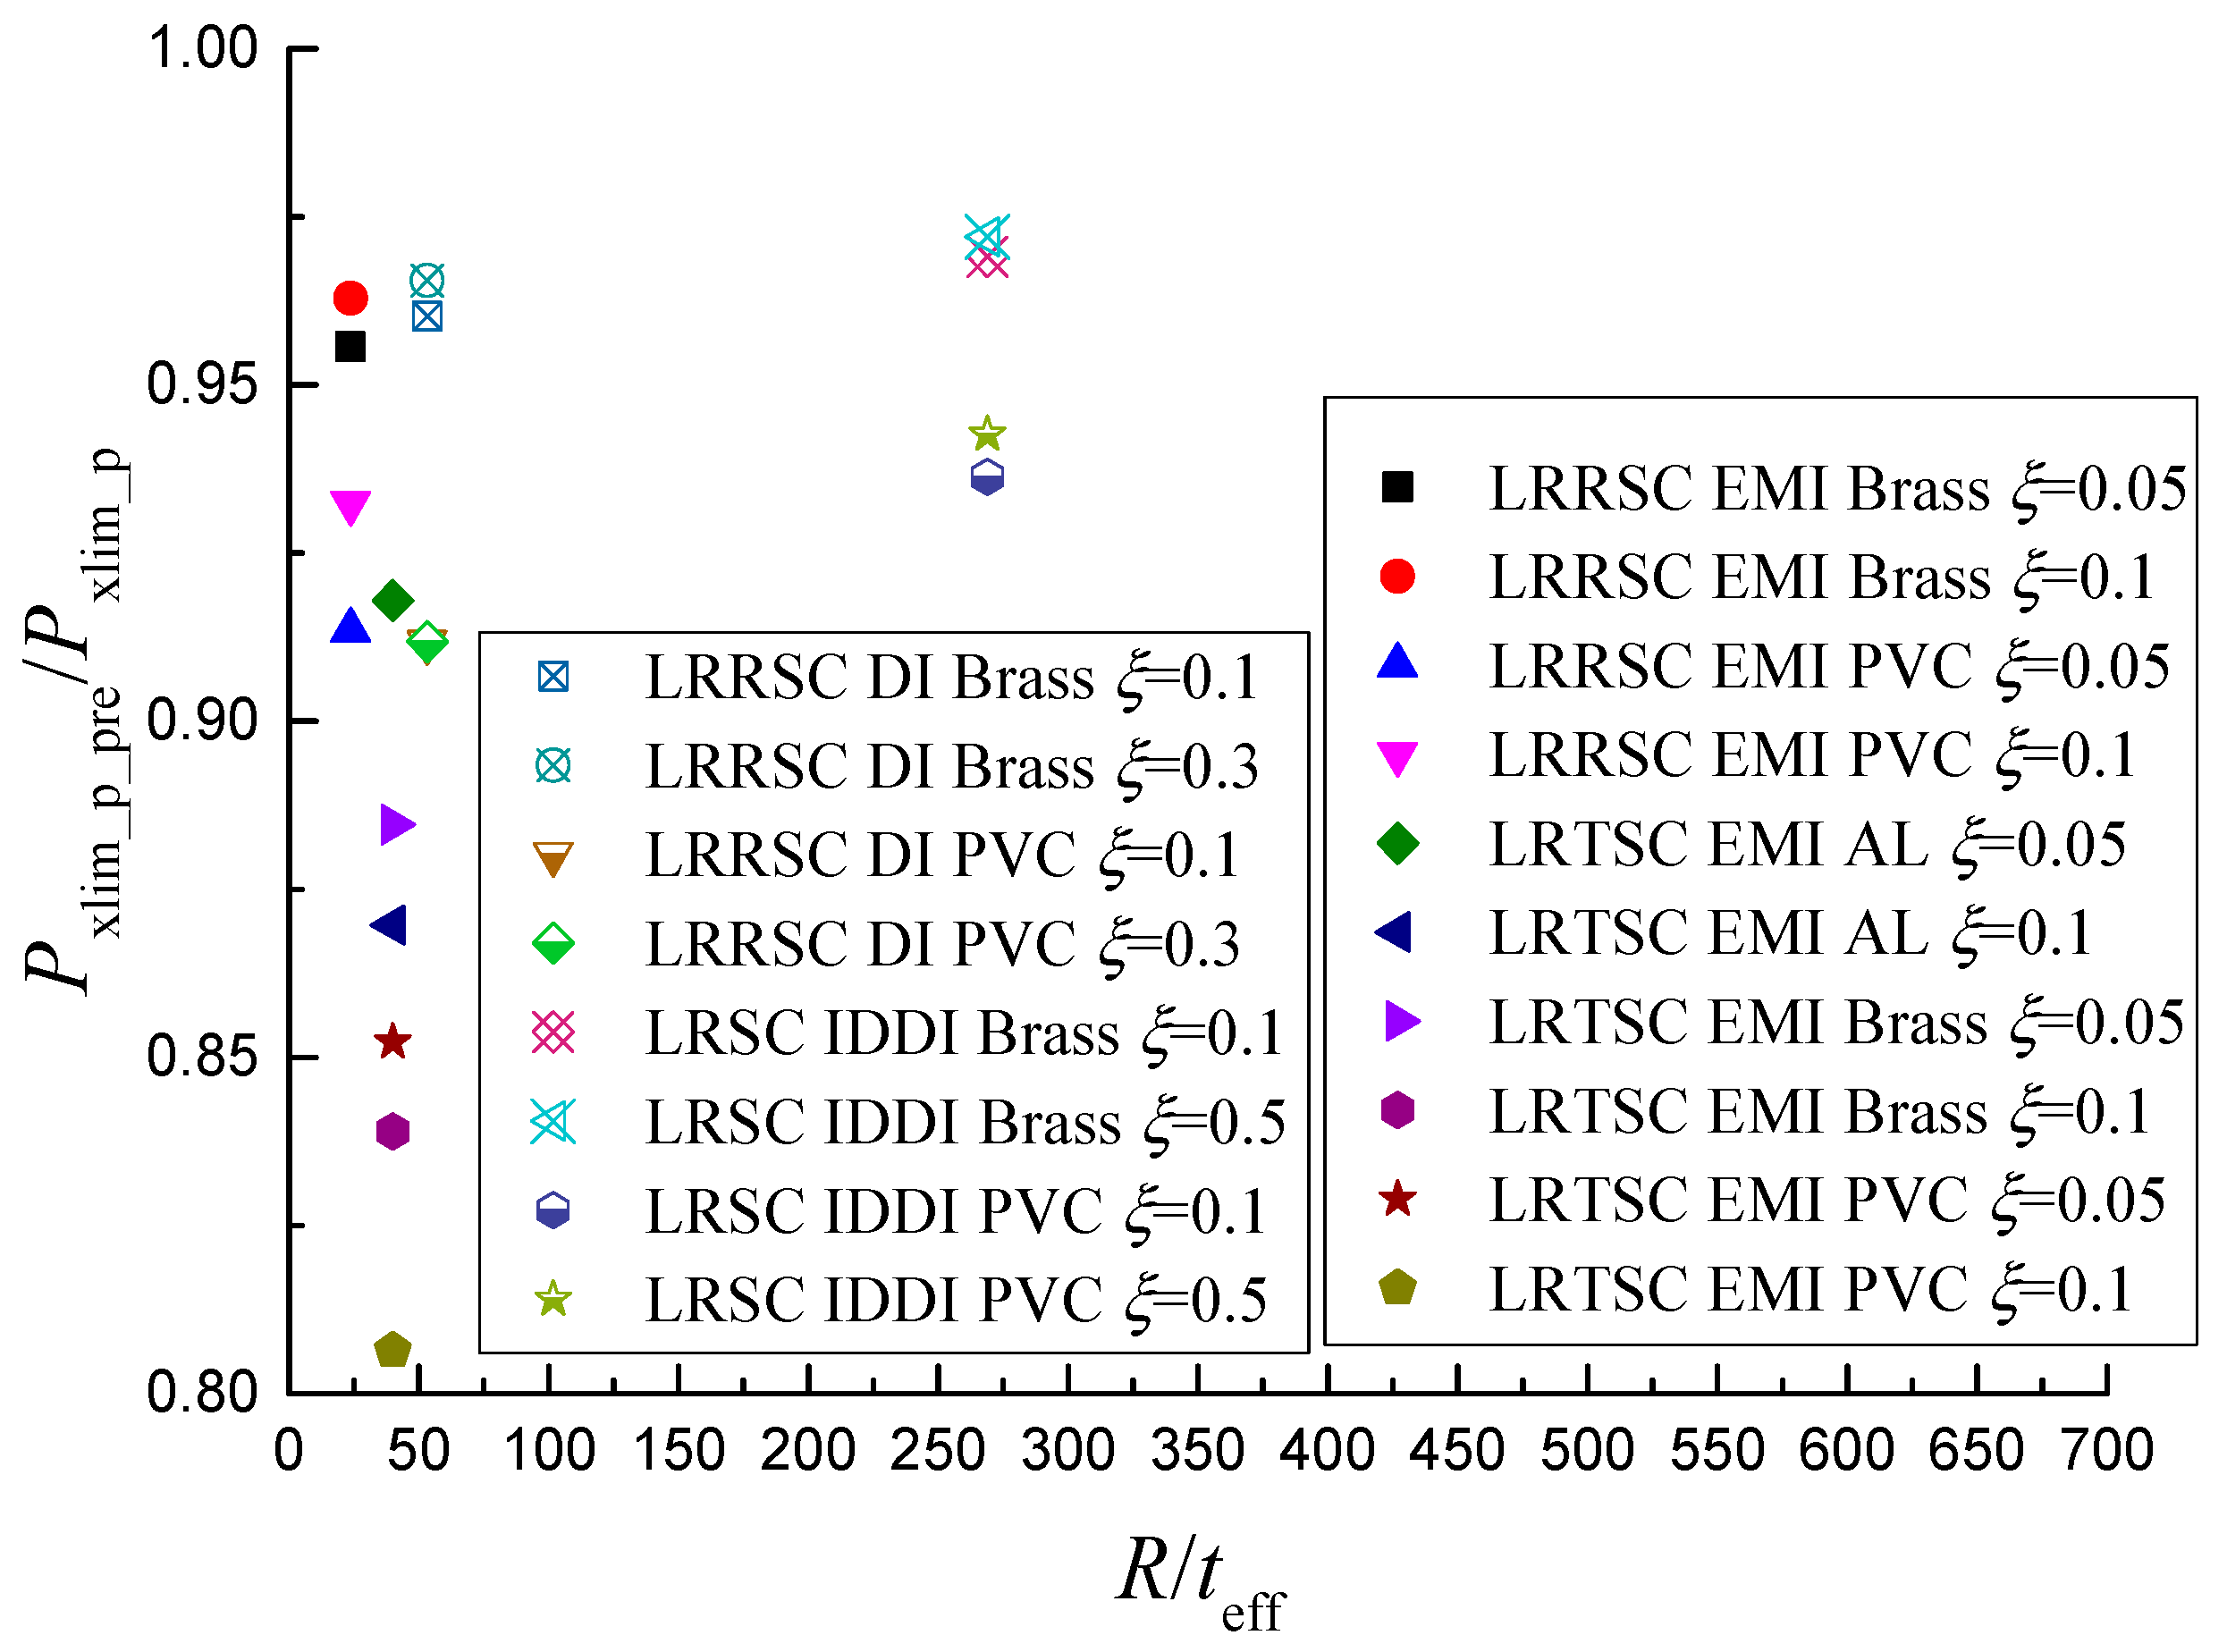
It can be shown from
Table 9 that, for the scaled models made of AL with two different imperfection amplitudes, the absolute relative error between the predicted prototypical buckling load by scaled models based on scaling law Equation (18) and the result of the prototype is within 2.00%. With the increase for deviation of Poisson’s ratio between scaled models and the prototype, the relative error for buckling loads between the predicted prototype and the prototype is increased. When the scaled model material is PVC, the relative error between
Pxlim_p_pre and
Pxlim_p achieves −8.83%. The corresponding results can also be seen in the literature [
25].
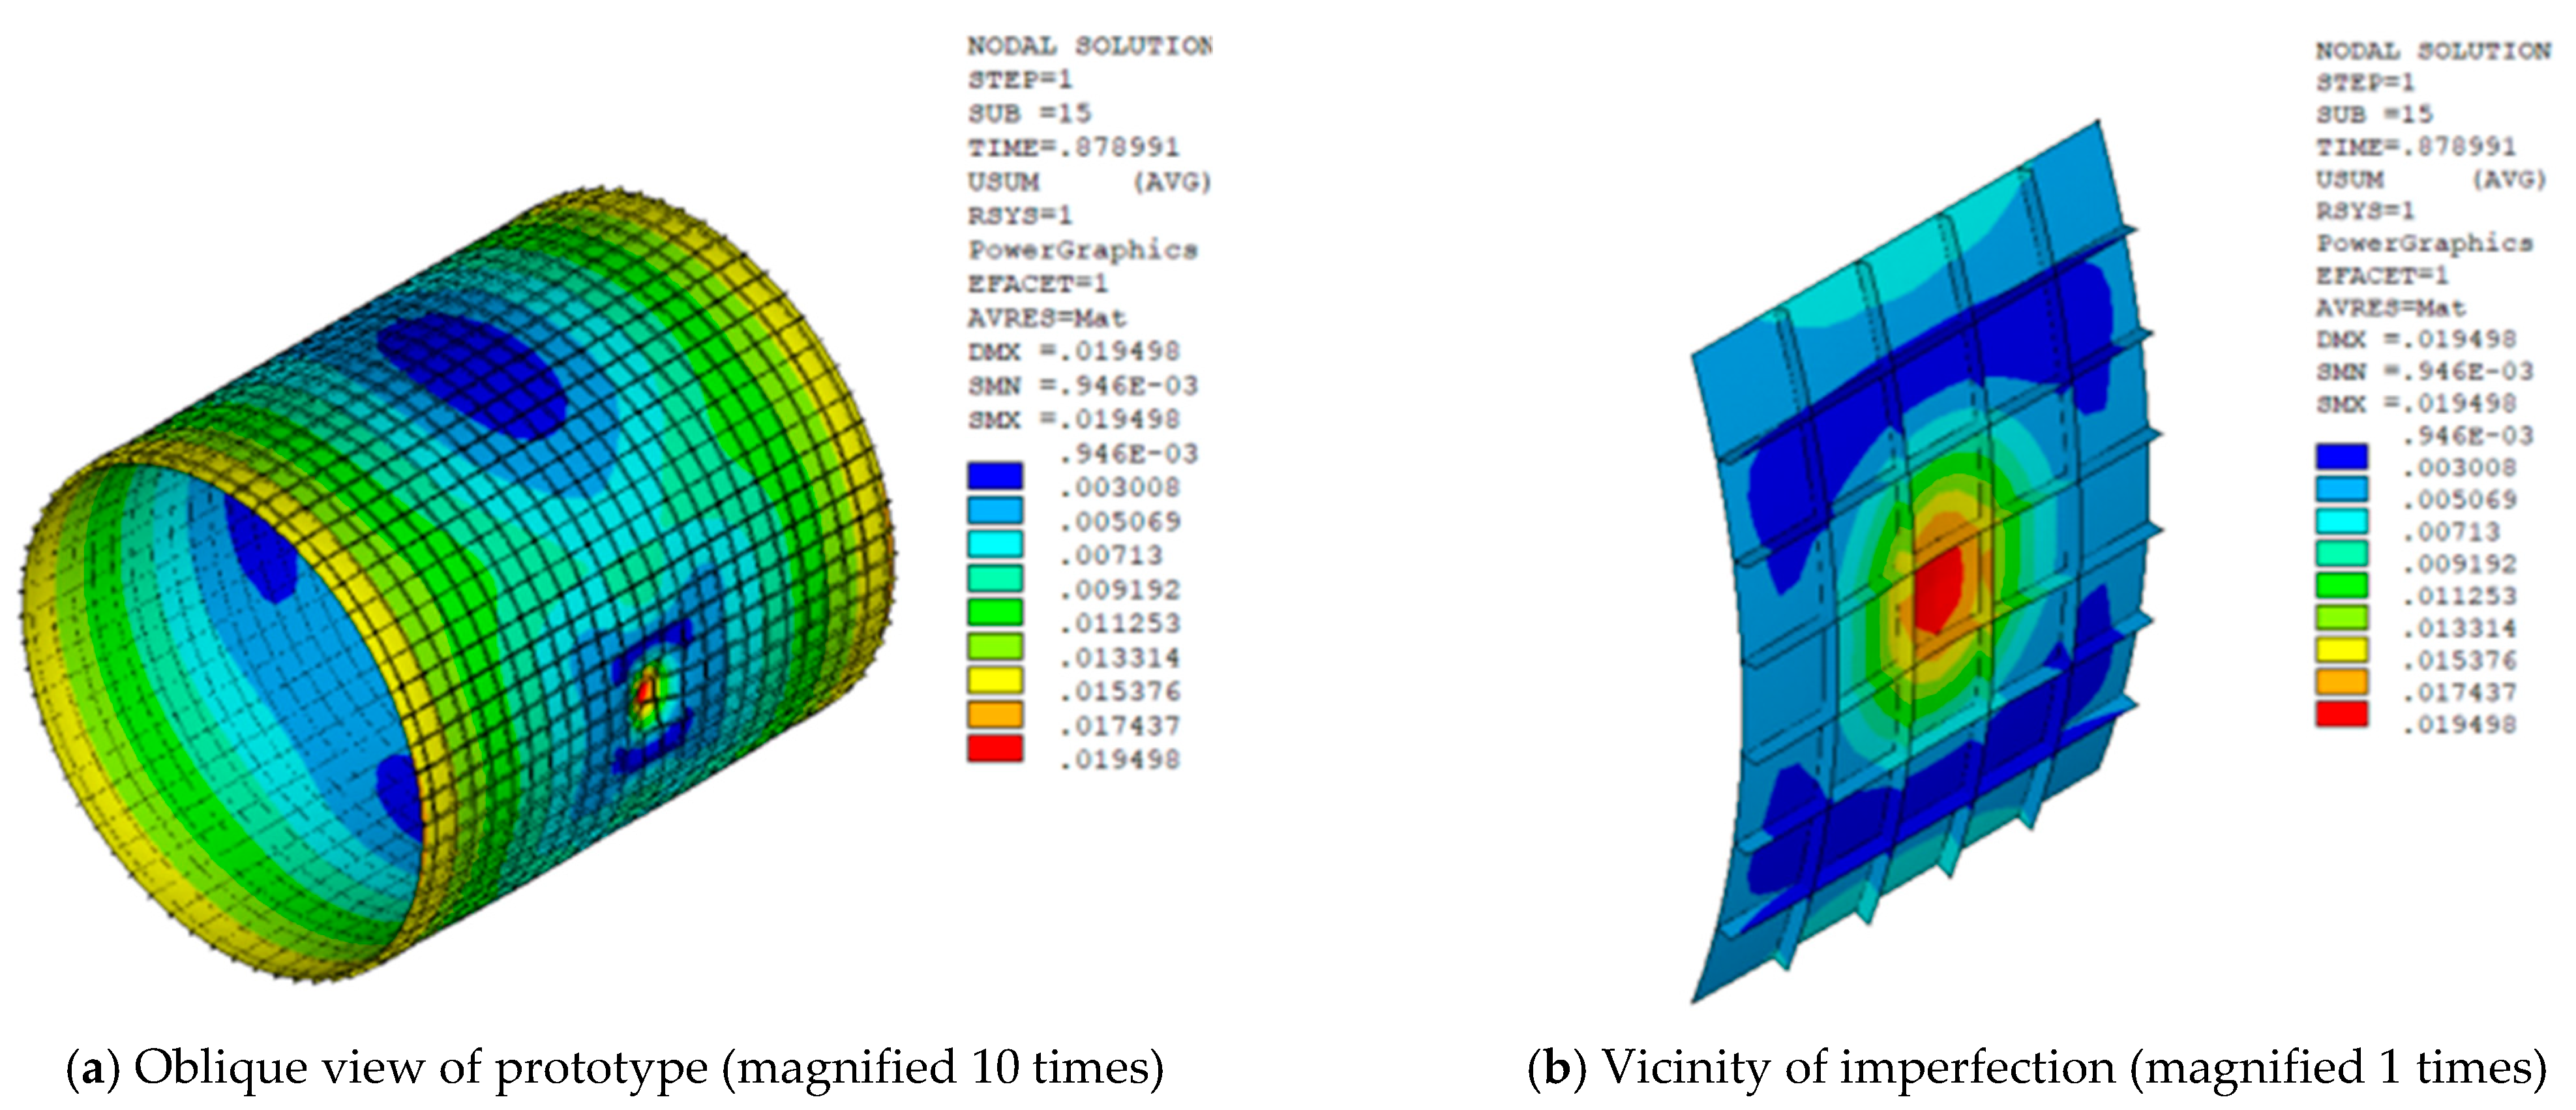
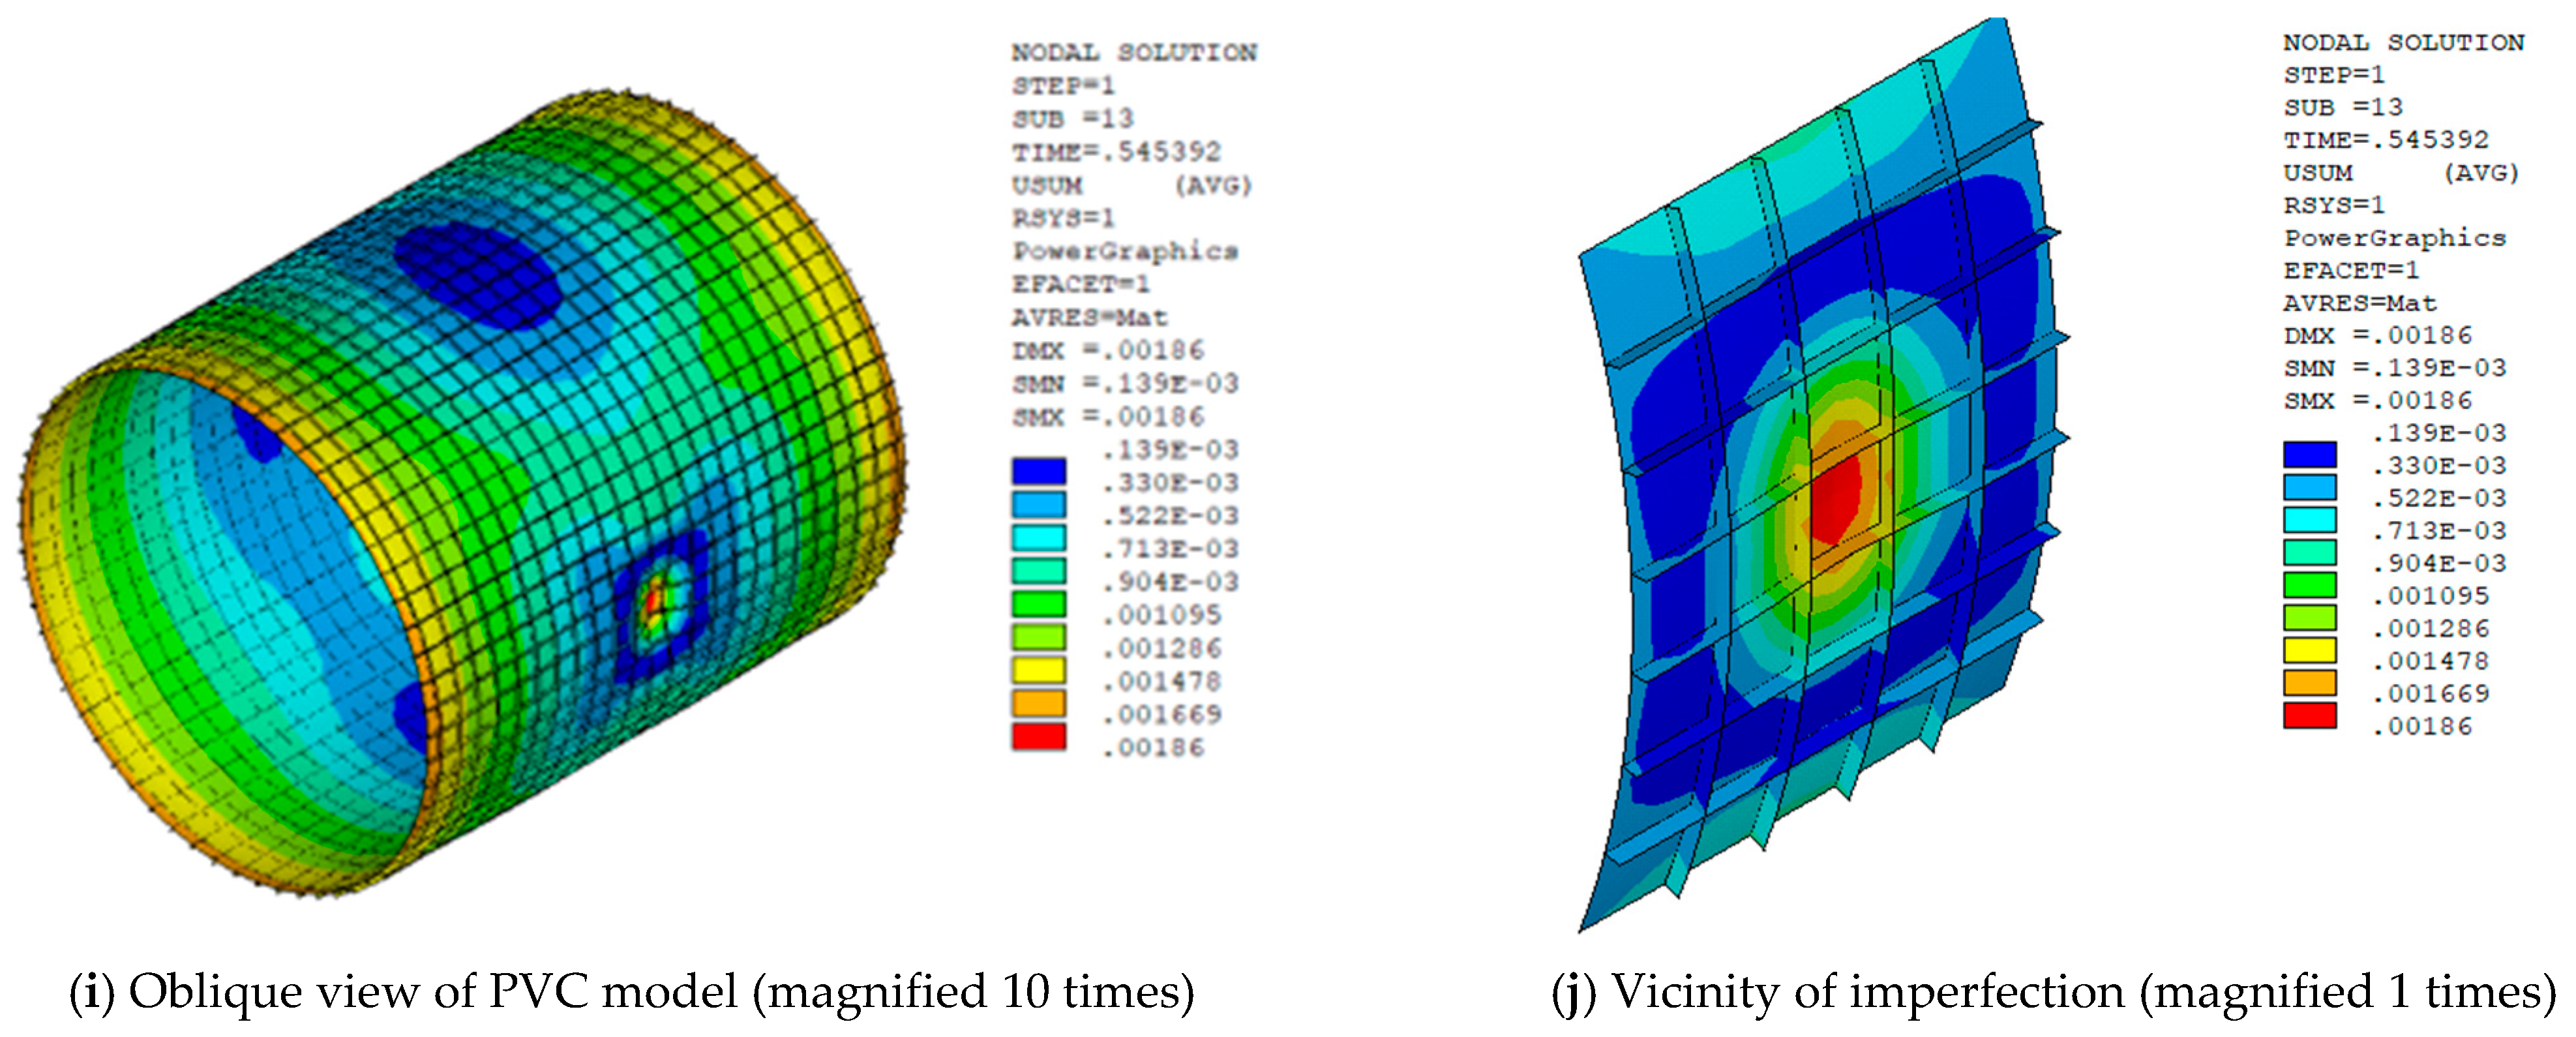
Figure 20 presents the load-displacement curves of four partial similitude scale models, the prototype and the corresponding prediction prototypes when the DI diameter is 0.060 m and the imperfection amplitude equals 0.3
t.
Figure 21 shows the diagram of displacement vector at the points corresponding to the critical buckling loads of the prototype and four scale models made with distortion materials when the amplitude of imperfection equals 0.3
t. It can be found that, when the material of the scaled model is Al, the load-displacement curve of the predicted prototype can well agree with the result of the prototype; the error between
Pxlim_p_pre and
Pxlim_p is −0.01%; the buckling modes of scaled models and the prototype at the buckling points are identical. With the increase for deviation of Poisson’s ratio between the distorted scale model and the prototype, the deviation of load-displacement curves between the predicted prototype and the prototype is gradually increased. When the material of scale models is copper, brass and PVC, the errors between
Pxlim_p_pre and
Pxlim_p are −2.60%, −3.45%, and −8.82%, respectively. The buckling mode shapes for scale models made of three different materials are consistent with the result of the prototype.


