
Physics-Based Shear-Strength Degradation Model of Stud Connector with the Fatigue Cumulative Damage


Abstract
:1. Introduction
2. Experimental Data Collection
- (1)
- the static strength, P(0), of the stud connector specimen was obtained by the static pushout test;
- (2)
- the loading ratio (=Pmax/P(0)), a random variable, was used to determine the maximum value of the fatigue load Pmax;
- (3)
- the fatigue life (N) of the stud connector specimen under a certain loading level was got by the fatigue test;
- (4)
- the intact stud connector was loaded to different cycles n (such as 1 × 10⁴, 5 × 10⁴, 10 × 104 and 25 × 104) under the same loading level that corresponds to the fatigue life N, in which, n/N was defined as the cycle ratios. Upon completing the loading process, there will be pre-fatigued damage existing in the stud connector, which was called a pre-fatigued specimen.
- (5)
- finally, the static pushout test was performed to obtain the residual strength of the pre-fatigued stud connectors.
3. Traditional Strength Degradation Models
4. Physics-Based Shear-Strength Degradation Model
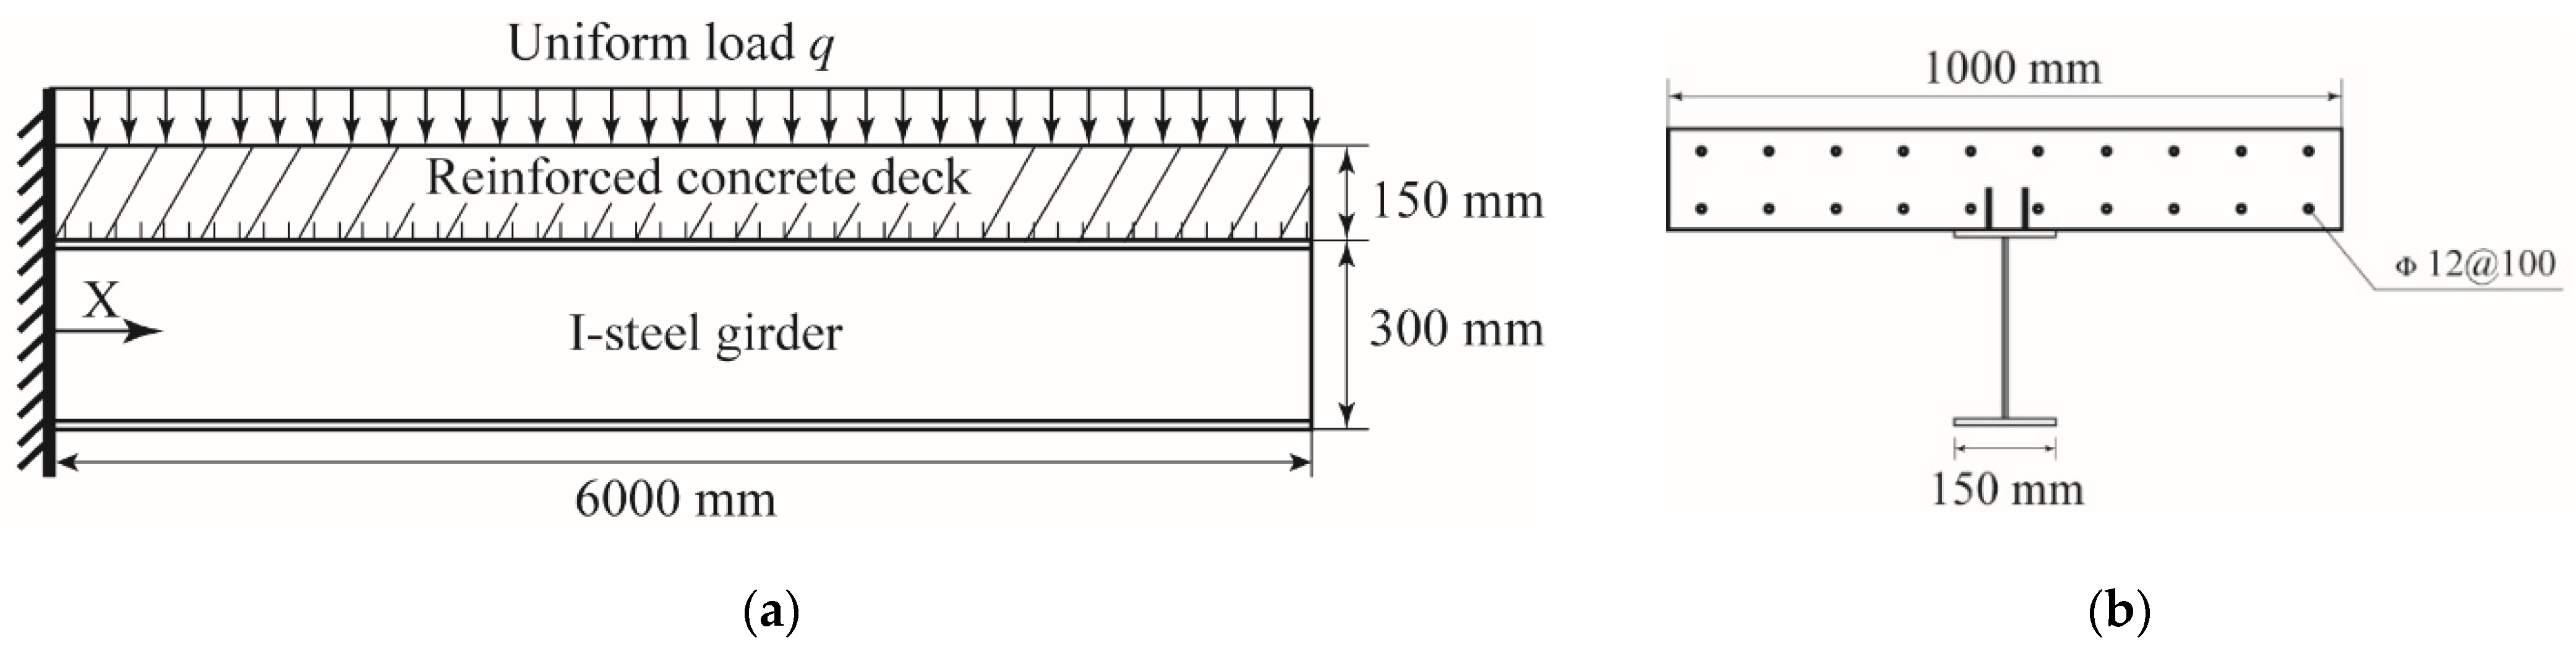
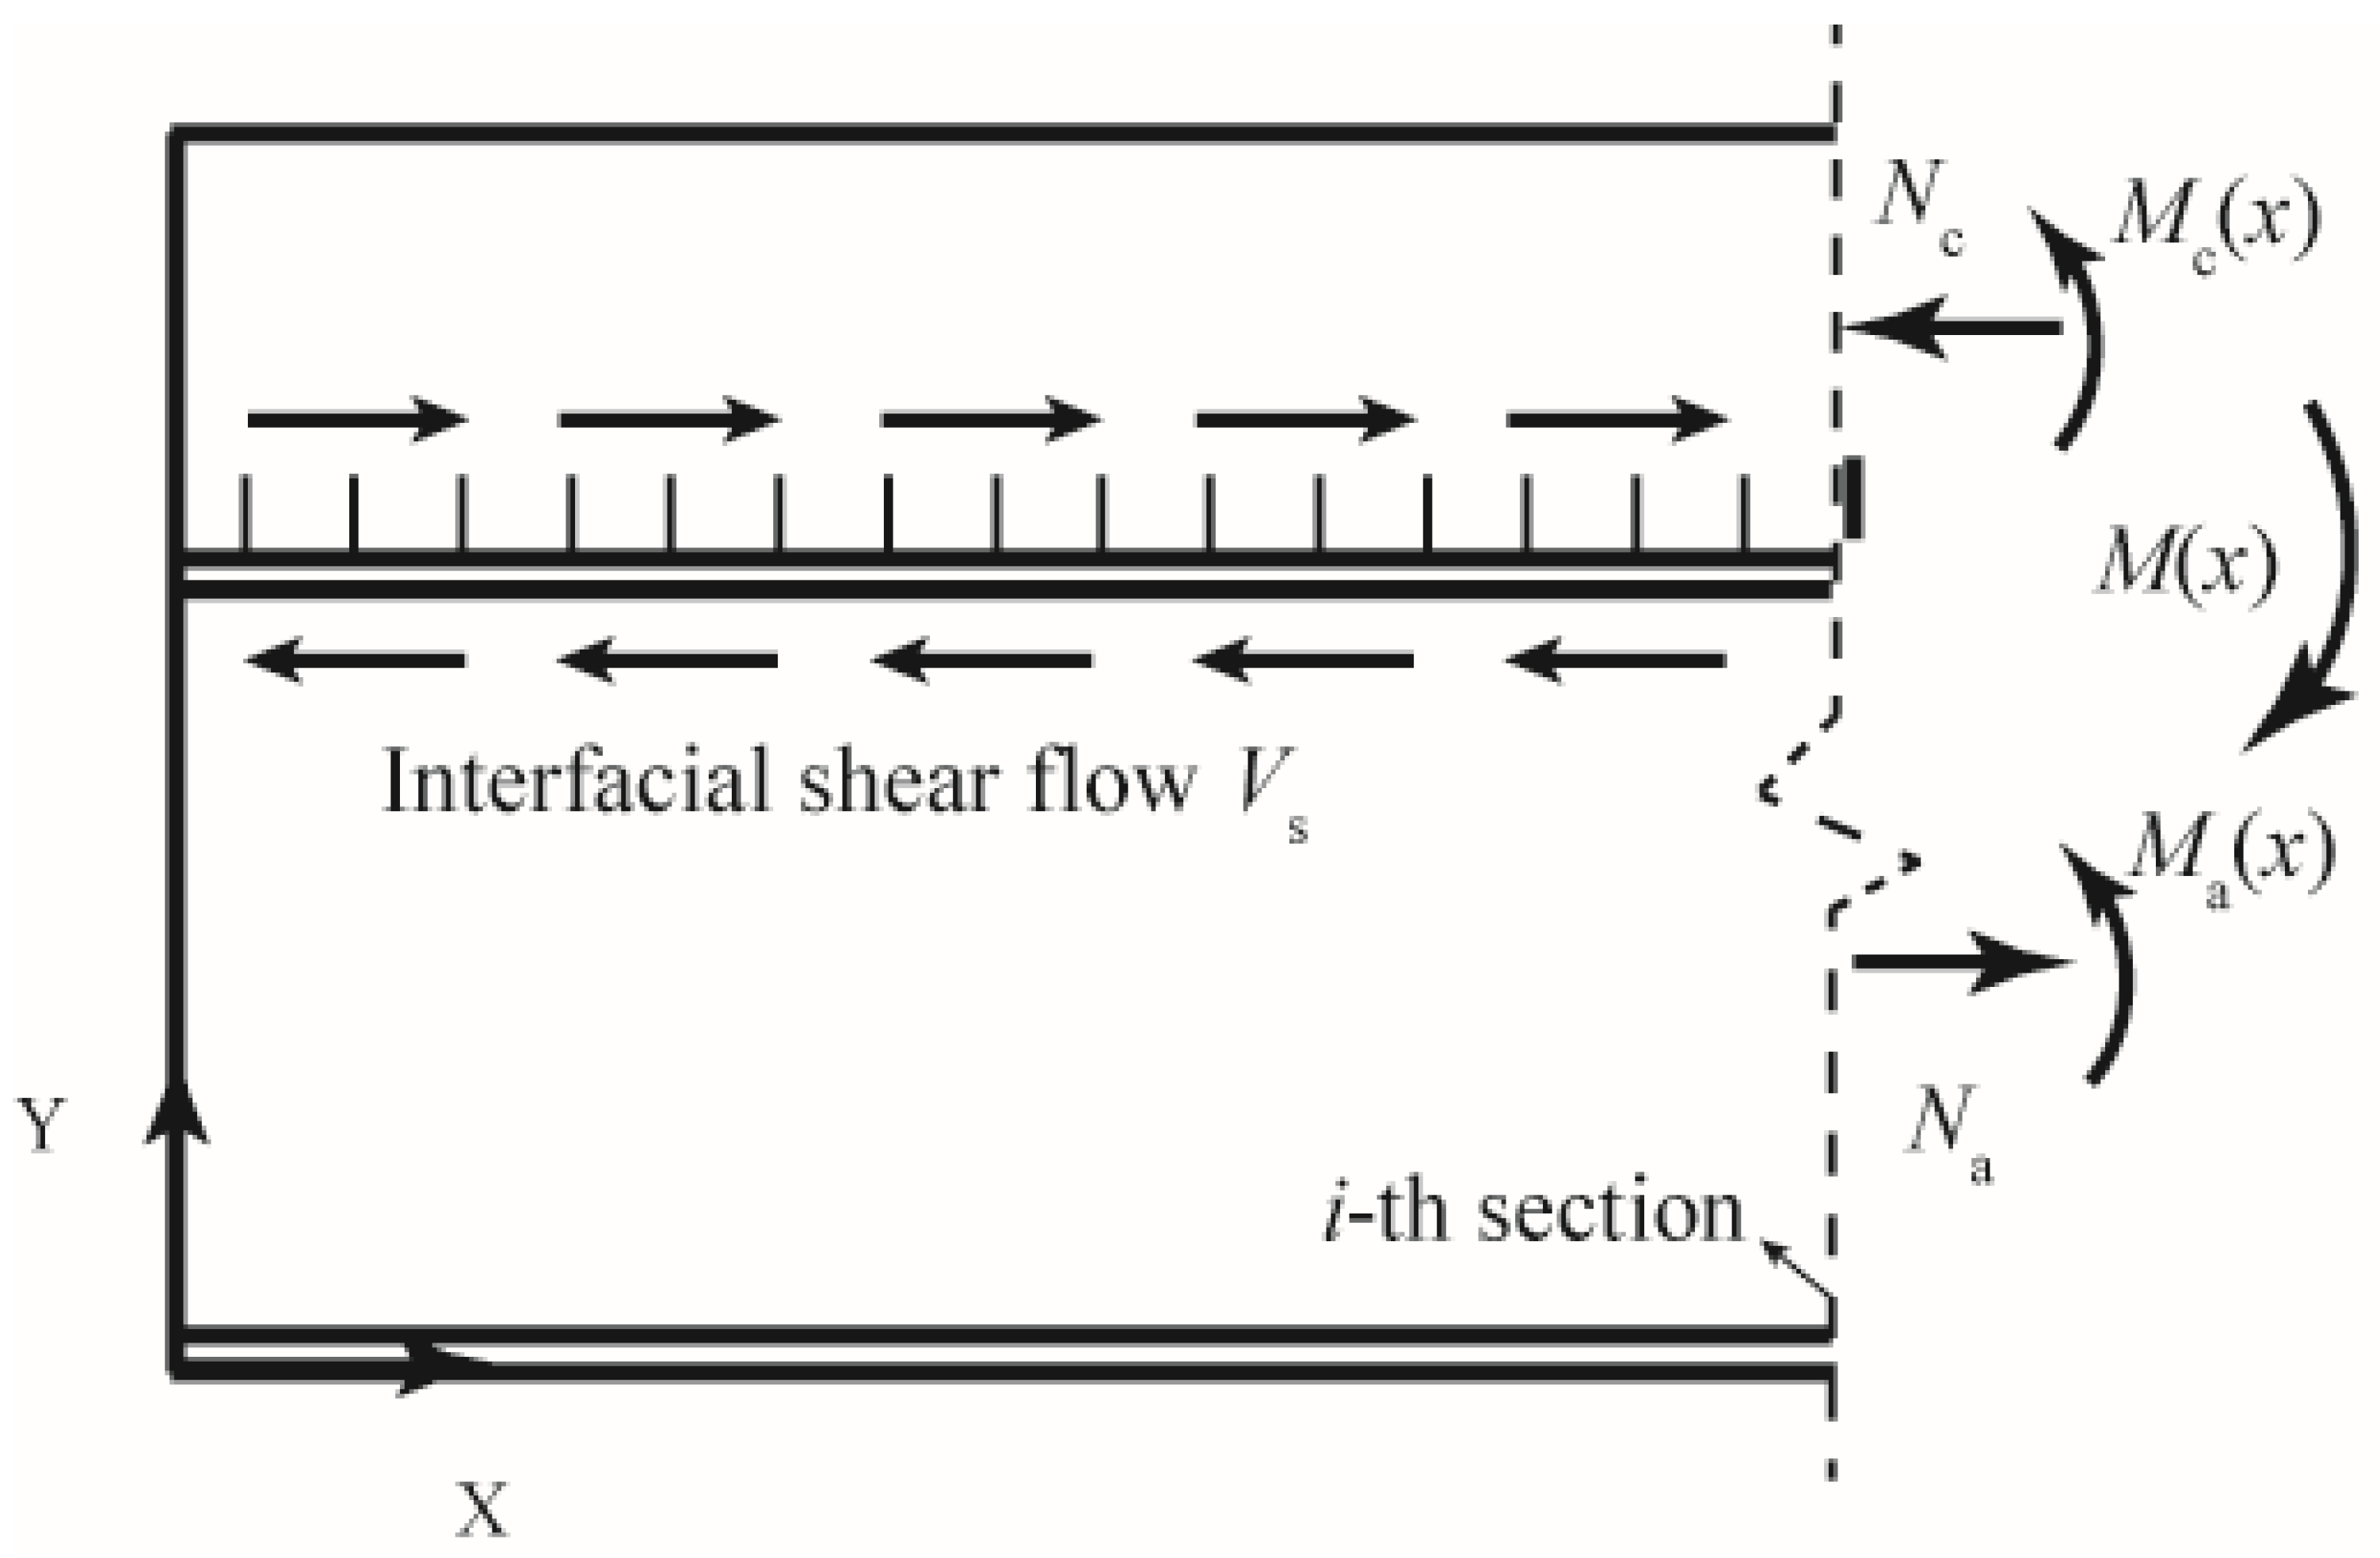
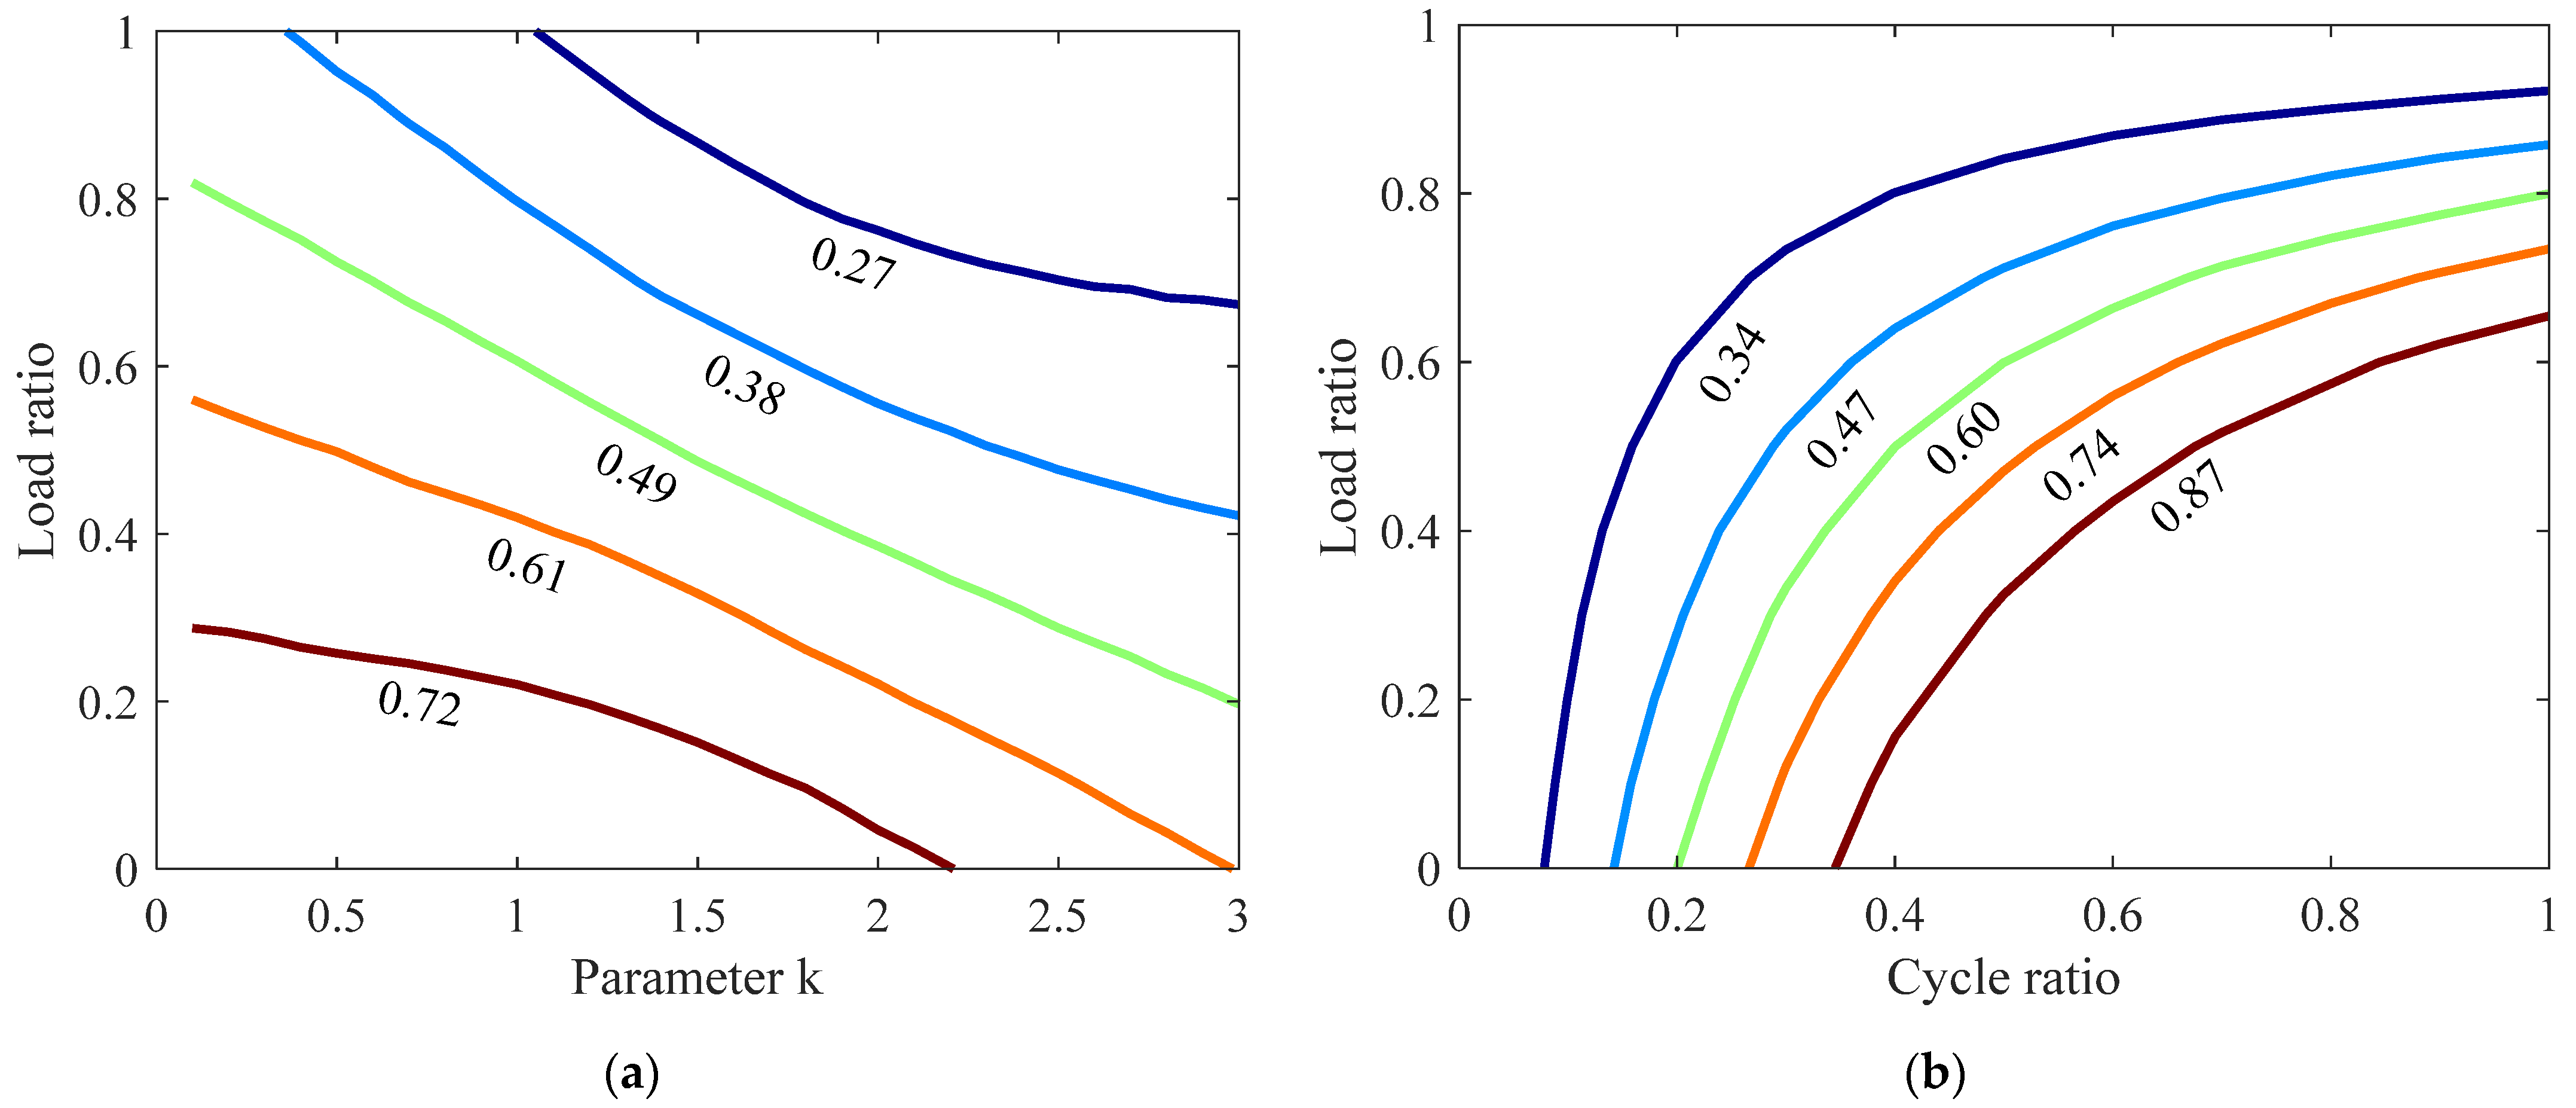
5. Analytical Derivation for Service Reliability of Composite Girder
6. Conclusions
- (1)
- There is a large variation in the traditional strength degradation model under the fatigue load, and the epistemic uncertainty in the unknown model parameters should be carefully considered;
- (2)
- For the same test results, there are significant differences among various strength degradation models and lack of necessary mathematical and physical background. The proposed physics-based degradation model can well fill up this shortcoming and consider the effects of various variables, such as the specimen size and loading mechanism;
- (3)
- Considering the shear-strength degradation of stud connectors, the composite beam may fail under the combined action of the self-weight and the design live load, which should be accounted for in the structural design phase.
Author Contributions
Funding
Data Availability Statement
Conflicts of Interest
References
- Saleh, S.M.; Majeed, F.H. Shear Strength of Headed Stud Connectors in Self-Compacting Concrete with Recycled Coarse Aggregate. Buildings 2022, 12, 505. [Google Scholar] [CrossRef]
- Fang, Z.; Fang, S.; Liu, F. Experimental and Numerical Study on the Shear Performance of Short Stud Shear Connectors in Steel-UHPC Composite Beams. Buildings 2022, 12, 418. [Google Scholar] [CrossRef]
- Wang, B.; Huang, Q.; Liu, X.; Ding, Y. Study on stiffness deterioration in steel-concrete composite beams under fatigue loading. Steel Compos. Struct. 2020, 34, 499–509. [Google Scholar] [CrossRef]
- Qin, X.; Yang, G.T. Elastic stiffness of stud connection in composite structures. Steel Compos. Struct. 2021, 39, 419–433. [Google Scholar] [CrossRef]
- Xu, X.; Liu, Y. Analytical prediction of the deformation behavior of headed studs in monotonic push-out tests. Adv. Struct. Eng. 2019, 22, 1711–1726. [Google Scholar] [CrossRef]
- Xu, C.; Sugiura, K.; Su, Q. Fatigue Behavior of the Group Stud Shear Connectors in Steel-Concrete Composite Bridges. J. Bridge Eng. 2018, 23, 04018055. [Google Scholar] [CrossRef]
- Hanswille, G.; Porsch, M.; Ustundag, C. Resistance of headed studs subjected to fatigue loading—Part II: Analytical study. J. Constr. Steel Res. 2007, 63, 485–493. [Google Scholar] [CrossRef]
- Bro, M.; Wilde, M. Influence of Fatigue on Headed Stud Connectors in Composite Bridges. Master’s Thesis, Lulea University of Technology Sweden, Luleå, Sweden, 2004. [Google Scholar]
- Veljkovic, M.; Johansson, B. Residual static resistance of welded stud shear connectors. In Proceedings of the 5th International Conference on Composite Construction in Steel and Concrete V, Berg-En-Dal, South Africa, 18–23 July 2004; p. 524. [Google Scholar]
- Feldmann, M.; Hechler, O.; Hegger, J.; Rauscher, S. New investigations on the fatigue behavior of composite beams made of high strength materials with two different kinds of shear connection. Stahlbau 2007, 76, 826–844. [Google Scholar] [CrossRef]
- Kim, S.H.; Kim, K.S.; Park, S.; Aim, J.H.; Lee, M.K. Y-type perfobond rib shear connectors subjected to fatigue loading on highway bridges. J. Constr. Steel Res. 2016, 122, 445–454. [Google Scholar] [CrossRef]
- Alsharari, F.; El-Sisi, A.E.D.; Mutnbak, M.; Salim, H.; El-Zohairy, A. Effect of the Progressive Failure of Shear Connectors on the Behavior of Steel-Reinforced Concrete Composite Girders. Buildings 2022, 12, 596. [Google Scholar] [CrossRef]
- Wang, B.; Liu, X.L.; Zhuge, P. Residual bearing capacity of steel-concrete composite beams under fatigue loading. Struct. Eng. Mech. 2021, 77, 559–569. [Google Scholar] [CrossRef]
- Fang, L.; Zhou, Y.; Jiang, Y.; Pei, Y.; Yi, W. Vibration-Based Damage Detection of a Steel-Concrete Composite Slab Using Non-Model-Based and Model-Based Methods. Adv. Civ. Eng. 2020, 2020, 8889277. [Google Scholar] [CrossRef]
- Pranno, A.; Greco, F.; Lonetti, P.; Luciano, R.; De Maio, U. An improved fracture approach to investigate the degradation of vibration characteristics for reinforced concrete beams under progressive damage. Int. J. Fatigue 2022, 163, 107032. [Google Scholar] [CrossRef]
- Philippidis, T.P.; Passipoularidis, V.A. Residual strength after fatigue in composites: Theory vs. experiment. Int. J. Fatigue 2007, 29, 2104–2116. [Google Scholar] [CrossRef]
- Wang, B.; Huang, Q.; Liu, X.L. Deterioration in strength of studs based on two-parameter fatigue failure criterion. Steel Compos. Struct. 2017, 23, 239–250. [Google Scholar] [CrossRef]
- He, J.; Lin, Z.; Liu, Y.; Xu, X.; Xin, H.; Wang, S. Shear stiffness of headed studs on structural behaviors of steel-concrete composite girders. Steel Compos. Struct. 2020, 36, 553–568. [Google Scholar] [CrossRef]
- Oehlers, D.J. Deterioration in strength of stud connectors in composite bridge beams. J. Struct. Eng. 1990, 116, 3417–3431. [Google Scholar] [CrossRef]
- Ahn, J.-H.; Kim, S.-H.; Jeong, Y.-J. Fatigue experiment of stud welded on steel plate for a new bridge deck system. Steel Compos. Struct. 2007, 7, 391–404. [Google Scholar] [CrossRef]
- GB50017-2017; Standard for Design of Steel Structures. China Machine Press: Beijing, China, 2017.
- Broutman, L.J.; Sahu, S. A New Theory to Predict Cumulative Fatigue Damage in Fiberglass Reinforced Plastics. In Composite materials: Testing and Design (Second Conference), Proceedings of the Second Conference on Composite Materials: Testing and Design, Anaheim, PA, USA, 20–22 April 1971; ASTM International: West Conshohocken, PA, USA, 1972. [Google Scholar]
- Li, L. Research on the Law of the Stiffness Degradation and Strength Degradation of the Bolt under Fatigue Loads. Master’s Thesis, Northeastern University, Shenyang, China, 2013. [Google Scholar]
- Zhang, L.; Ji, W.; Zhou, W.; Li, W.-L.; Ren, C.-X. Fatigue cumulative damage models based on strength degradation. Trans. Chin. Soc. Agric. Eng. 2015, 31 (Suppl. S1), 47–52. [Google Scholar]
- Gardoni, P.; Der Kiureghian, A.; Mosalam, K.M. Probabilistic capacity models and fragility estimates for reinforced concrete columns based on experimental observations. J. Eng. Mech. 2002, 128, 1024–1038. [Google Scholar] [CrossRef]
- Zheng, X.-W.; Li, H.-N.; Gardoni, P. Probabilistic seismic demand models and life-cycle fragility estimates for high-rise buildings. J. Struct. Eng. 2021, 147, 04021216. [Google Scholar] [CrossRef]
- Sobieraj, J.; Metelski, D. Quantifying Critical Success Factors (CSFs) in Management of Investment-Construction Projects: Insights from Bayesian Model Averaging. Buildings 2021, 11, 360. [Google Scholar] [CrossRef]
- Gelman, A.; Carlin, J.B.; Stern, H.S.; Dunson, D.B.; Vehtari, A.; Rubin, D.B. Bayesian Data Analysis, 3rd ed.; Chapman & Hall: New York, NY, USA, 2020. [Google Scholar]
- Papakonstantinou, K.G.; Shinozuka, M. Probabilistic model for steel corrosion in reinforced concrete structures of large dimensions considering crack effects. Eng. Struct. 2013, 57, 306–326. [Google Scholar] [CrossRef]
- He, Z.Q.; Ou, C.X.; Tian, F.; Liu, Z. Experimental Behavior of Steel-Concrete Composite Girders with UHPC-Grout Strip Shear Connection. Buildings 2021, 11, 182. [Google Scholar] [CrossRef]
- Zheng, X.-W.; Li, H.-N.; Li, C. Damage probability analysis of a high-rise building against wind excitation with recorded field data and direction effect. J. Wind. Eng. Ind. Aerodyn. 2019, 184, 10–22. [Google Scholar] [CrossRef]
- Barbato, M.; Gu, Q.; Conte, J.P. Probabilistic Pushover analysis of structural and soil-structure systems. J. Struct. Eng. 2010, 136, 1330–1341. [Google Scholar] [CrossRef] [Green Version]
- Xu, Q.H.; Shi, D.D.; Shao, W. Service life prediction of RC square piles based on time-varying probability analysis. Constr. Build. Mater. 2019, 227, 116824. [Google Scholar] [CrossRef]
- Melchers, R.E. Structural Reliability Analysis and Prediction; John Wiley: New York, NY, USA, 1999. [Google Scholar]
- Zheng, X.-W.; Li, H.-N.; Gardoni, P. Life-cycle probabilistic seismic risk assessment of high-rise buildings considering carbonation induced deterioration. Eng. Struct. 2021, 231, 111752. [Google Scholar] [CrossRef]
- Zheng, X.-W.; Li, H.-N.; Gardoni, P. Reliability-based design approach for high-rise buildings subject to earthquakes and strong winds. Eng. Struct. 2021, 244, 112771. [Google Scholar] [CrossRef]
- Zheng, X.-W.; Li, H.-N.; Yang, Y.-B.; Li, G.; Huo, L.-S.; Liu, Y. Damage risk assessment of a high-rise building against multihazard of earthquake and strong wind with recorded data. Eng. Struct. 2019, 200, 109697. [Google Scholar] [CrossRef]
- JTG-D64-2015; Specifications for Design of Highway Steel Bridge. China Communications Press: Beijing, China, 2015.
- GB50917-2013; Code for Design of Steel and Concrete Composite Bridges. China Planning Press: Beijing, China, 2013.


| Sources | Variable k | Loading Ratio | Fatigue Life N (×103) | Loading Cases | |||||
|---|---|---|---|---|---|---|---|---|---|
| Oehlers [19] | 0.59 | 0.3 | 1379 | n/N | 0.18 | 0.36 | 0.54 | 0.74 | 0.91 |
| P(n)/P(0) | 0.85 | 0.80 | 0.74 | 0.55 | 0.49 | ||||
| Hanswille et al. [7] | 1.0 | 0.3 | 6400 | n/N | 0.19 | 0.73 | – | – | – |
| P(n)/P(0) | 0.59 | 0.6 | – | – | – | ||||
| 0.44 | 6200 | n/N | 0.32 | 0.70 | – | – | – | ||
| P(n)/P(0) | 0.75 | 0.63 | – | – | – | ||||
| 0.44 | 5100 | n/N | 0.24 | 0.69 | – | – | – | ||
| P(n)/P(0) | 0.66 | 0.61 | – | – | – | ||||
| 0.71 | 3500 | n/N | 0.29 | 0.72 | – | – | – | ||
| P(n)/P(0) | 1.0 | 0.86 | – | – | – | ||||
| 0.71 | 1200 | n/N | 0.32 | 0.7 | – | – | – | ||
| P(n)/P(0) | 0.95 | 0.84 | – | – | – | ||||
| Wang et al. [17] | 0.59 | 0.6 | 2705 | n/N | 0.19 | 0.37 | 0.56 | 0.75 | 0.93 |
| P(n)/P(0) | 0.98 | 0.91 | 0.83 | 0.77 | 0.64 | ||||
| Ahn et al. [20] | 0.73 | 0.25 | 2495 | n/N | 0.2 | 0.4 | 0.6 | – | – |
| P(n)/P(0) | 0.909 | 0.875 | 0.787 | – | – | ||||
| Bro et al. [8] | 1.0 | 0.138 | 4900 | n/N | 0.082 | 0.204 | 0.245 | – | – |
| P(n)/P(0) | 0.929 | 0.905 | 0.893 | – | – | ||||
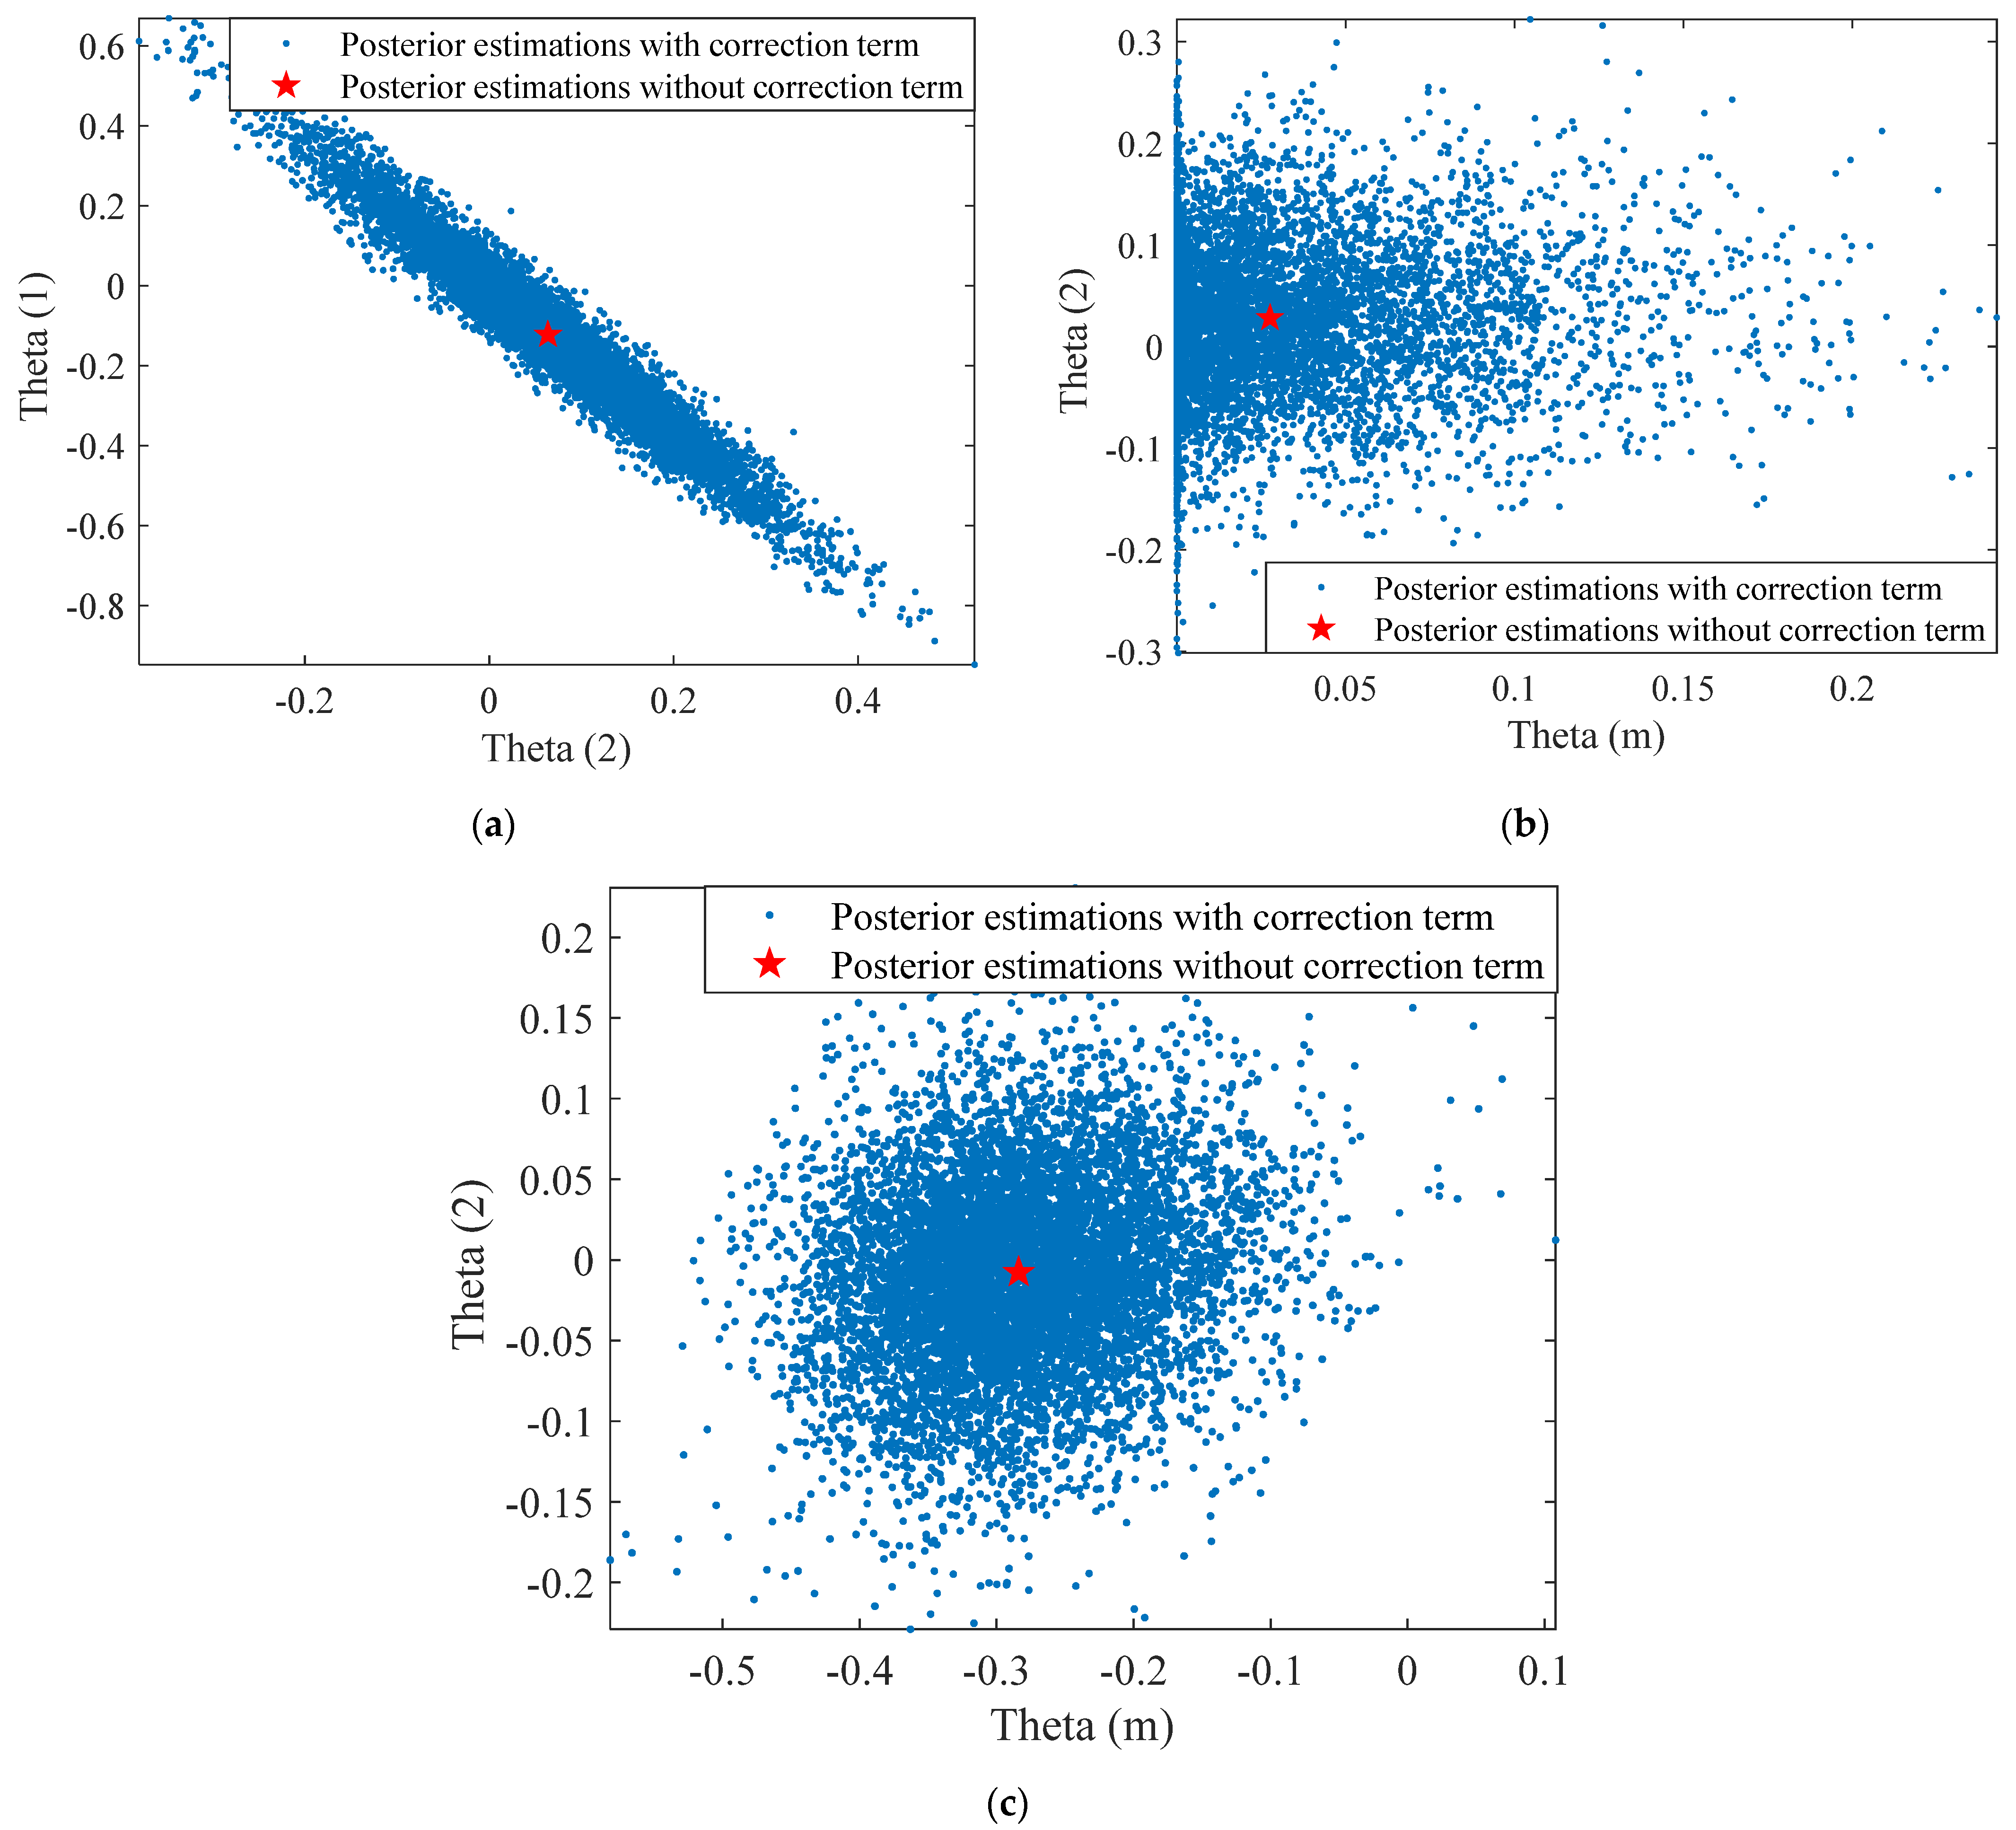
| Models | Parameters | Mean | Standard Deviation |
|---|---|---|---|
| I | θ1 | −0.125 | 0.222 |
| θ2 | 0.067 | 0.122 | |
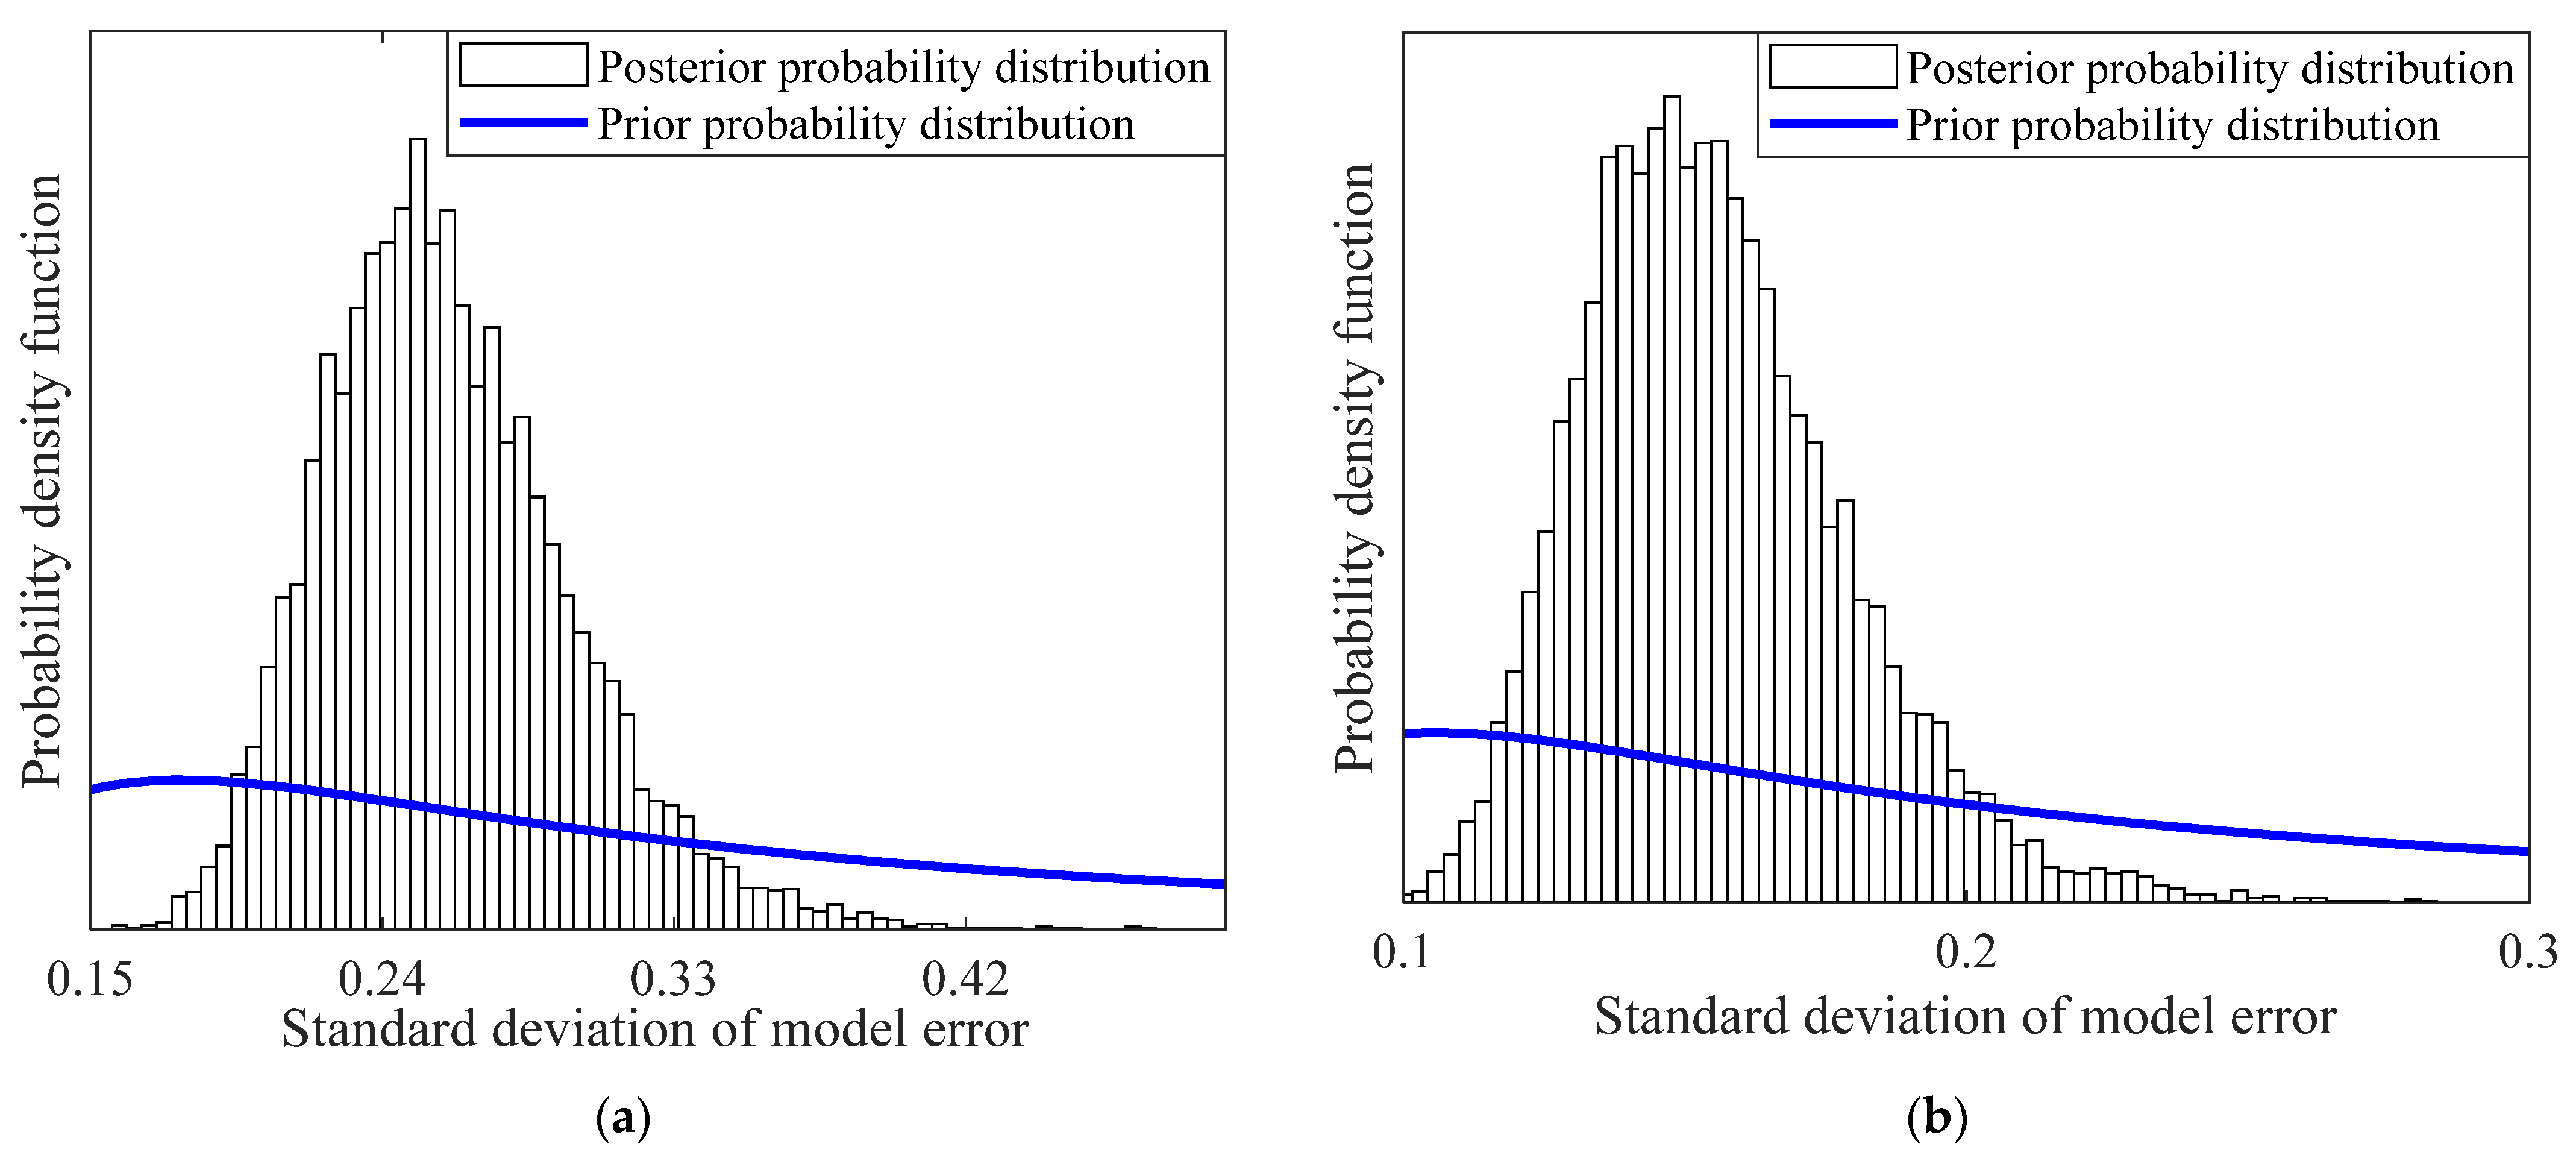
| σ | 0.260 | 0.038 | |
| II | θm | 0.025 | 0.038 |
| θ1 | −0.248 | 0.136 | |
| θ2 | 0.025 | 0.074 | |
| σ | 0.156 | 0.024 |
| Name | Mean (MPa) | COV/% | Distribution | Upper Level | Lower Level | References | |
|---|---|---|---|---|---|---|---|
| Q345 | fy1 | 352 | 5 | Lognormal | 1.1 fy1,mean | 0.9 fy1,mean | Zheng et al. [31] |
| fu1 | 495 | 5 | Lognormal | 1.1 fu1,mean | 0.9 fu1,mean | Zheng et al. [31] | |
| E1 | 2.06 × 10⁵ | 3.3 | Lognormal | 1.1 Ey1,mean | 0.9 Ey1,mean | Barbato et al. [32] | |
| C50 | fc | 44.8 | 20 | Lognormal | 1.4 fc,mean | 0.6 fc,mean | Barbato et al. [32] |
| Ec | 4733√fc | 12 | Normal | 1.2 fc,mean | 0.8 fc,mean | Xu et al. [33] | |
| ML-15 | fy2 | 442 | 5 | Lognormal | 1.1 fy2,mean | 0.9 fy2,mean | Melchers [34] |
| fu2 | 525 | 5 | Lognormal | 1.1 fu2,mean | 0.9 fu2,mean | Zheng et al. [35] | |
| E2 | 2.0 × 10⁵ | 3.3 | Lognormal | 1.1 Ey2,mean | 0.9 Ey2,mean | Barbato et al. [32] | |
| HPB300 | fy3 | 300 | 5 | Lognormal | 1.1 fy2,mean | 0.9 fy2,mean | Zheng et al. [36] |
| E2 | 2.0 × 10⁵ | 3.3 | Lognormal | 1.1 Ey2 mean | 0.9 Ey2,mean | Zheng et al. [37] | |
Publisher’s Note: MDPI stays neutral with regard to jurisdictional claims in published maps and institutional affiliations. |
© 2022 by the authors. Licensee MDPI, Basel, Switzerland. This article is an open access article distributed under the terms and conditions of the Creative Commons Attribution (CC BY) license (https://creativecommons.org/licenses/by/4.0/).
Share and Cite
Zheng, X.-W.; Lv, H.-L.; Fan, H.; Zhou, Y.-B. Physics-Based Shear-Strength Degradation Model of Stud Connector with the Fatigue Cumulative Damage. Buildings 2022, 12, 2141. https://doi.org/10.3390/buildings12122141
Zheng X-W, Lv H-L, Fan H, Zhou Y-B. Physics-Based Shear-Strength Degradation Model of Stud Connector with the Fatigue Cumulative Damage. Buildings. 2022; 12(12):2141. https://doi.org/10.3390/buildings12122141
Chicago/Turabian StyleZheng, Xiao-Wei, Heng-Lin Lv, Hong Fan, and Yan-Bing Zhou. 2022. "Physics-Based Shear-Strength Degradation Model of Stud Connector with the Fatigue Cumulative Damage" Buildings 12, no. 12: 2141. https://doi.org/10.3390/buildings12122141