Article

Effect of Fly Ash Content on the Microstructure and Strength of Concrete under Freeze–Thaw Condition

College of Hydraulic and Environmental Engineering, Three Gorges University, Yichang 443002, China
*
Authors to whom correspondence should be addressed.
Buildings 2022, 12(12), 2113; https://doi.org/10.3390/buildings12122113
Submission received: 10 November 2022 / Revised: 25 November 2022 / Accepted: 29 November 2022 / Published: 1 December 2022
(This article belongs to the Special Issue Advanced Studies in Structure Materials)

Abstract

:
To understand the influence of fly ash (FA) content on the microstructure and strength of concrete under freeze–thaw cycles (FTCs), four groups of concrete with different FA contents (0–30%) were tested under FTC condition. Mass loss rate, relative dynamic modulus of elasticity (RDME), splitting tensile strength and other damage indicators were selected to describe the impact of macro properties. The micro physical changes, porosity and pore size distribution parameters were obtained through scanning electron microscope (SEM) and nuclear magnetic resonance (NMR) experiments. The influence mechanism of FA content on the frost resistance durability of concrete under FTC was discussed from the macro and micro perspectives. The results show that under the action of FTC, the addition of FA fills the pores, reduces the pore spacing, improves the strength of concrete, and makes the RDEM and splitting tensile strength of concrete increase first and then decrease. Among them, 20% FA concrete has the best frost resistance. The pore structure parameters show that the content of pores smaller than 100 nm has a great impact on the frost resistance durability of FA concrete, and increasing the content of these pores can improve the frost resistance durability of concrete.

Graphical Abstract

1. Introduction

Freeze–thaw attack is one of the main reasons for durability degradation of concrete structures in cold regions, which seriously affects the service life of concrete structures in these regions [1,2]. Buildings in cold environments will be damaged by freeze–thaw due to the extension of winter duration [3,4]. In cold regions such as Northeast China, almost 100% of the concrete structures have been damaged by freeze–thaw damage [5].The microporous structure inside the concrete enables it to absorb and retain water [6]. When the tensile stress caused by pore water icing volume expansion exceeds the tensile strength of concrete, microcracks will occur, more water will be absorbed into the pores after ice melting, and new microcracks will be produced in the next FTC. The freeze–thaw damage will lead to the change of the microporous structure in concrete, accelerate the migration of ions, directly affect the macro mechanical properties of concrete, and reduce the durability of concrete structures and their service life [7,8]. As an important component structure of a concrete face rockfill dam, due to long-term contact with the reservoir and direct exposure to water and the atmospheric environment, the face concrete in the water level change area is prone to freeze–thaw damage, which poses a serious threat to the safety of the dam [9]. At present, few studies exist on the freeze–thaw durability of face concrete of rockfill dams, so it is of great significance to study the damage mechanism of face concrete under the action of freeze–thaw.
Coal is the largest energy source in China, and fly ash (FA) is the main solid waste of coal-fired power plants. It has broad application prospects in concrete production [10]. Because of its pozzolanic characteristics, FA can be used as a cement substitute in concrete and other building applications. It can not only reduce the entry of chloride ions and other corrosives and improve the durability of concrete, but also reduce production costs and environmental pollution. FA has been widely used in the construction industry [11]. Ma et al. [12,13] showed that using a certain amount of recycled powder in concrete has good economic and environmental benefits. The composition of FA is similar to that of recycled powder, in which sio2 and Al2O3 can promote the pozzolanic effect and combine with calcium hydroxide to produce additional cement gel, reducing the permeability and porosity. Since the sphericity of FA particles reduces the discharge channel and void space, which will reduce the amount of water required in the mixture by about 2–10%, the reduction of the drainage channel limits the water entry [12]. As a partial substitute of cement, FA can fill micropores to make concrete denser and reduce its permeability [13,14]. This study showed that adding FA to improve freeze–thaw durability is an effective method [15,16]. To meet the freeze–thaw durability of face concrete in cold areas, FA is widely used as a concrete admixture. Therefore, researchers have conducted considerable research on the frost resistance of ordinary concrete from a macro point of view, and put forward practical suggestions [14,15,16]. Benli et al. [17] studied the effect of different amounts of FA and silica fume on the frost resistance of self-compacting mortars. Islam et al. [18] studied the weight and volume changes, compressive strength, dynamic modulus of elasticity, permeability characteristics, and resistance to rapid chloride ion permeability of specimens with different FA contents, and measured the damage degree. The research showed that FA concrete presented enhanced freeze–thaw deterioration resistance. Ke et al. [19] made concrete specimens with different FA contents and selected mass loss rate, dynamic modulus of elasticity, compressive strength, and porosity as damage indexes to study and analyze the freeze–thaw failure mechanism of concrete. Feng et al. [20] take the mass loss rate as the frost resistance design index, and think that 45% FA can obtain the best frost resistance performance. In the micro evaluation of concrete freeze–thaw damage, SEM technology is used to study the damage mechanism of bond force between reinforcement and concrete and the micro pore structure after FTC [21]. Liu et al. [22] considered the microstructure of cement paste from the perspective of thermodynamics, and quantitatively analyzed the damage caused by freezing and thawing water pressure through numerical simulation. Convolutional neural network (CNN) is used to identify the microscopic corrosion damage of steel rust and to test the cracks in concrete bridge structures [23]. Wang et al. [24] measured the micropore structure of the paste before and after freeze–thaw by using a high pressure mercury intrusion porosity (MIP), indicating that the FTC will lead to an increase in micropore content in the pore size range from 25 nm to 250 nm. Through the microscopic test index, combined with the pore system, the freeze–thaw deterioration mechanism of concrete is analyzed and the effective measures to improve frost resistance are summarized [25]. Nuclear magnetic resonance (NMR) technology can obtain pore structure information such as porosity and pore size distribution, which has been widely used in the study of micro pore structure of rock samples during freezing and thawing cycles [26,27,28]. By summarizing the previous research results in the frost resistance durability of concrete, it can be found that the frost resistance of conventional concrete is mostly studied through macro frost resistance test indicators such as mass loss rate, RDEM, strength, etc. However, previous studies rarely considered the influence of microscopic parameters on macroscopic properties. In terms of microscopic testing methods, there are still some inadequately considered aspects. SEM and MIP experiments require that the sample size be very small, which makes it difficult to represent the situation of the whole test piece. SEM images can only obtain real-time observation of a very small area, and the high pressure during the MIP experiment will introduce additional structural damage [6]. In addition, the mix proportion of surface concrete is different from that of conventional concrete, and the current conclusions are difficult to represent the face concrete of rockfill dam. Considering the importance of face slab concrete to a rockfill dam, this paper studies the influence of FA content on the degradation of mechanical properties of face slab concrete under FTC conditions, and the relationship between macro quantitative change and micro qualitative change.
In this study, through the FTC test of concrete with different contents of FA (0–30%), the changes in the macroscopic comprehensive mechanical properties (mass loss, RDEM, and splitting strength) of concrete under the action of FTC were tested, and the changes in microphysics, porosity and pore diameter, were determined using SEM and NMR. The effects of different contents of FA on the mechanical properties and microstructure of concrete were studied. In addition, the relationship between the splitting strength, RDEM, and pore structure of concrete with different FA contents was established, and the mechanism of the effect of FA content on the degradation of the mechanical properties of concrete was revealed from micro to macro.

2. Experimental Program

The purposes of this experiment are to explore the effect of FA content on the freeze–thaw resistance of concrete and to explain its influence mechanism from micro to macro. According to the requirements of Chinese standard design code for concrete face rockfill dams [29], the content of fly ash should not exceed 30%; thus, four groups of concrete specimens with different FA contents were tested by FTC in accordance with 0, 10%, 20%, and 30% of the weight of cementitious materials, and the macroscopic properties and microstructure indexes of the specimens were tested. The flow diagram of the experiment is shown in Figure 1.

2.1. Materials

The cement used in the experiment was PO 42.5 ordinary Portland cement produced by Hubei Cement Plant, with a specific surface area of 350 m2/kg. The initial setting time was 3 h and 18 min, and the final setting time was 3 h and 59 min. The fine aggregate was the river sand with a silt content of 0.89% produced in Yichang, Hubei Province, and its fineness modulus was 2.78, and the saturated surface dry apparent density was 2612 m2/kg. Coarse aggregate was composed of gravels with a diameter from 5 to 40 mm, and the unit weight was 2500 kg/m3. The class I fly ash with fineness of 8.7% used in the experiment was provided by Yichang Building Materials Co., Ltd. (Yichang, China). Shanxi Building Materials Co., Ltd. (Weinan, China) provided the air-entraining agent and the water-reducing agent for the experiment. Tap water was used in all the mixtures. The design of mix proportion and the numbering of the concrete specimens are shown in Table 1.

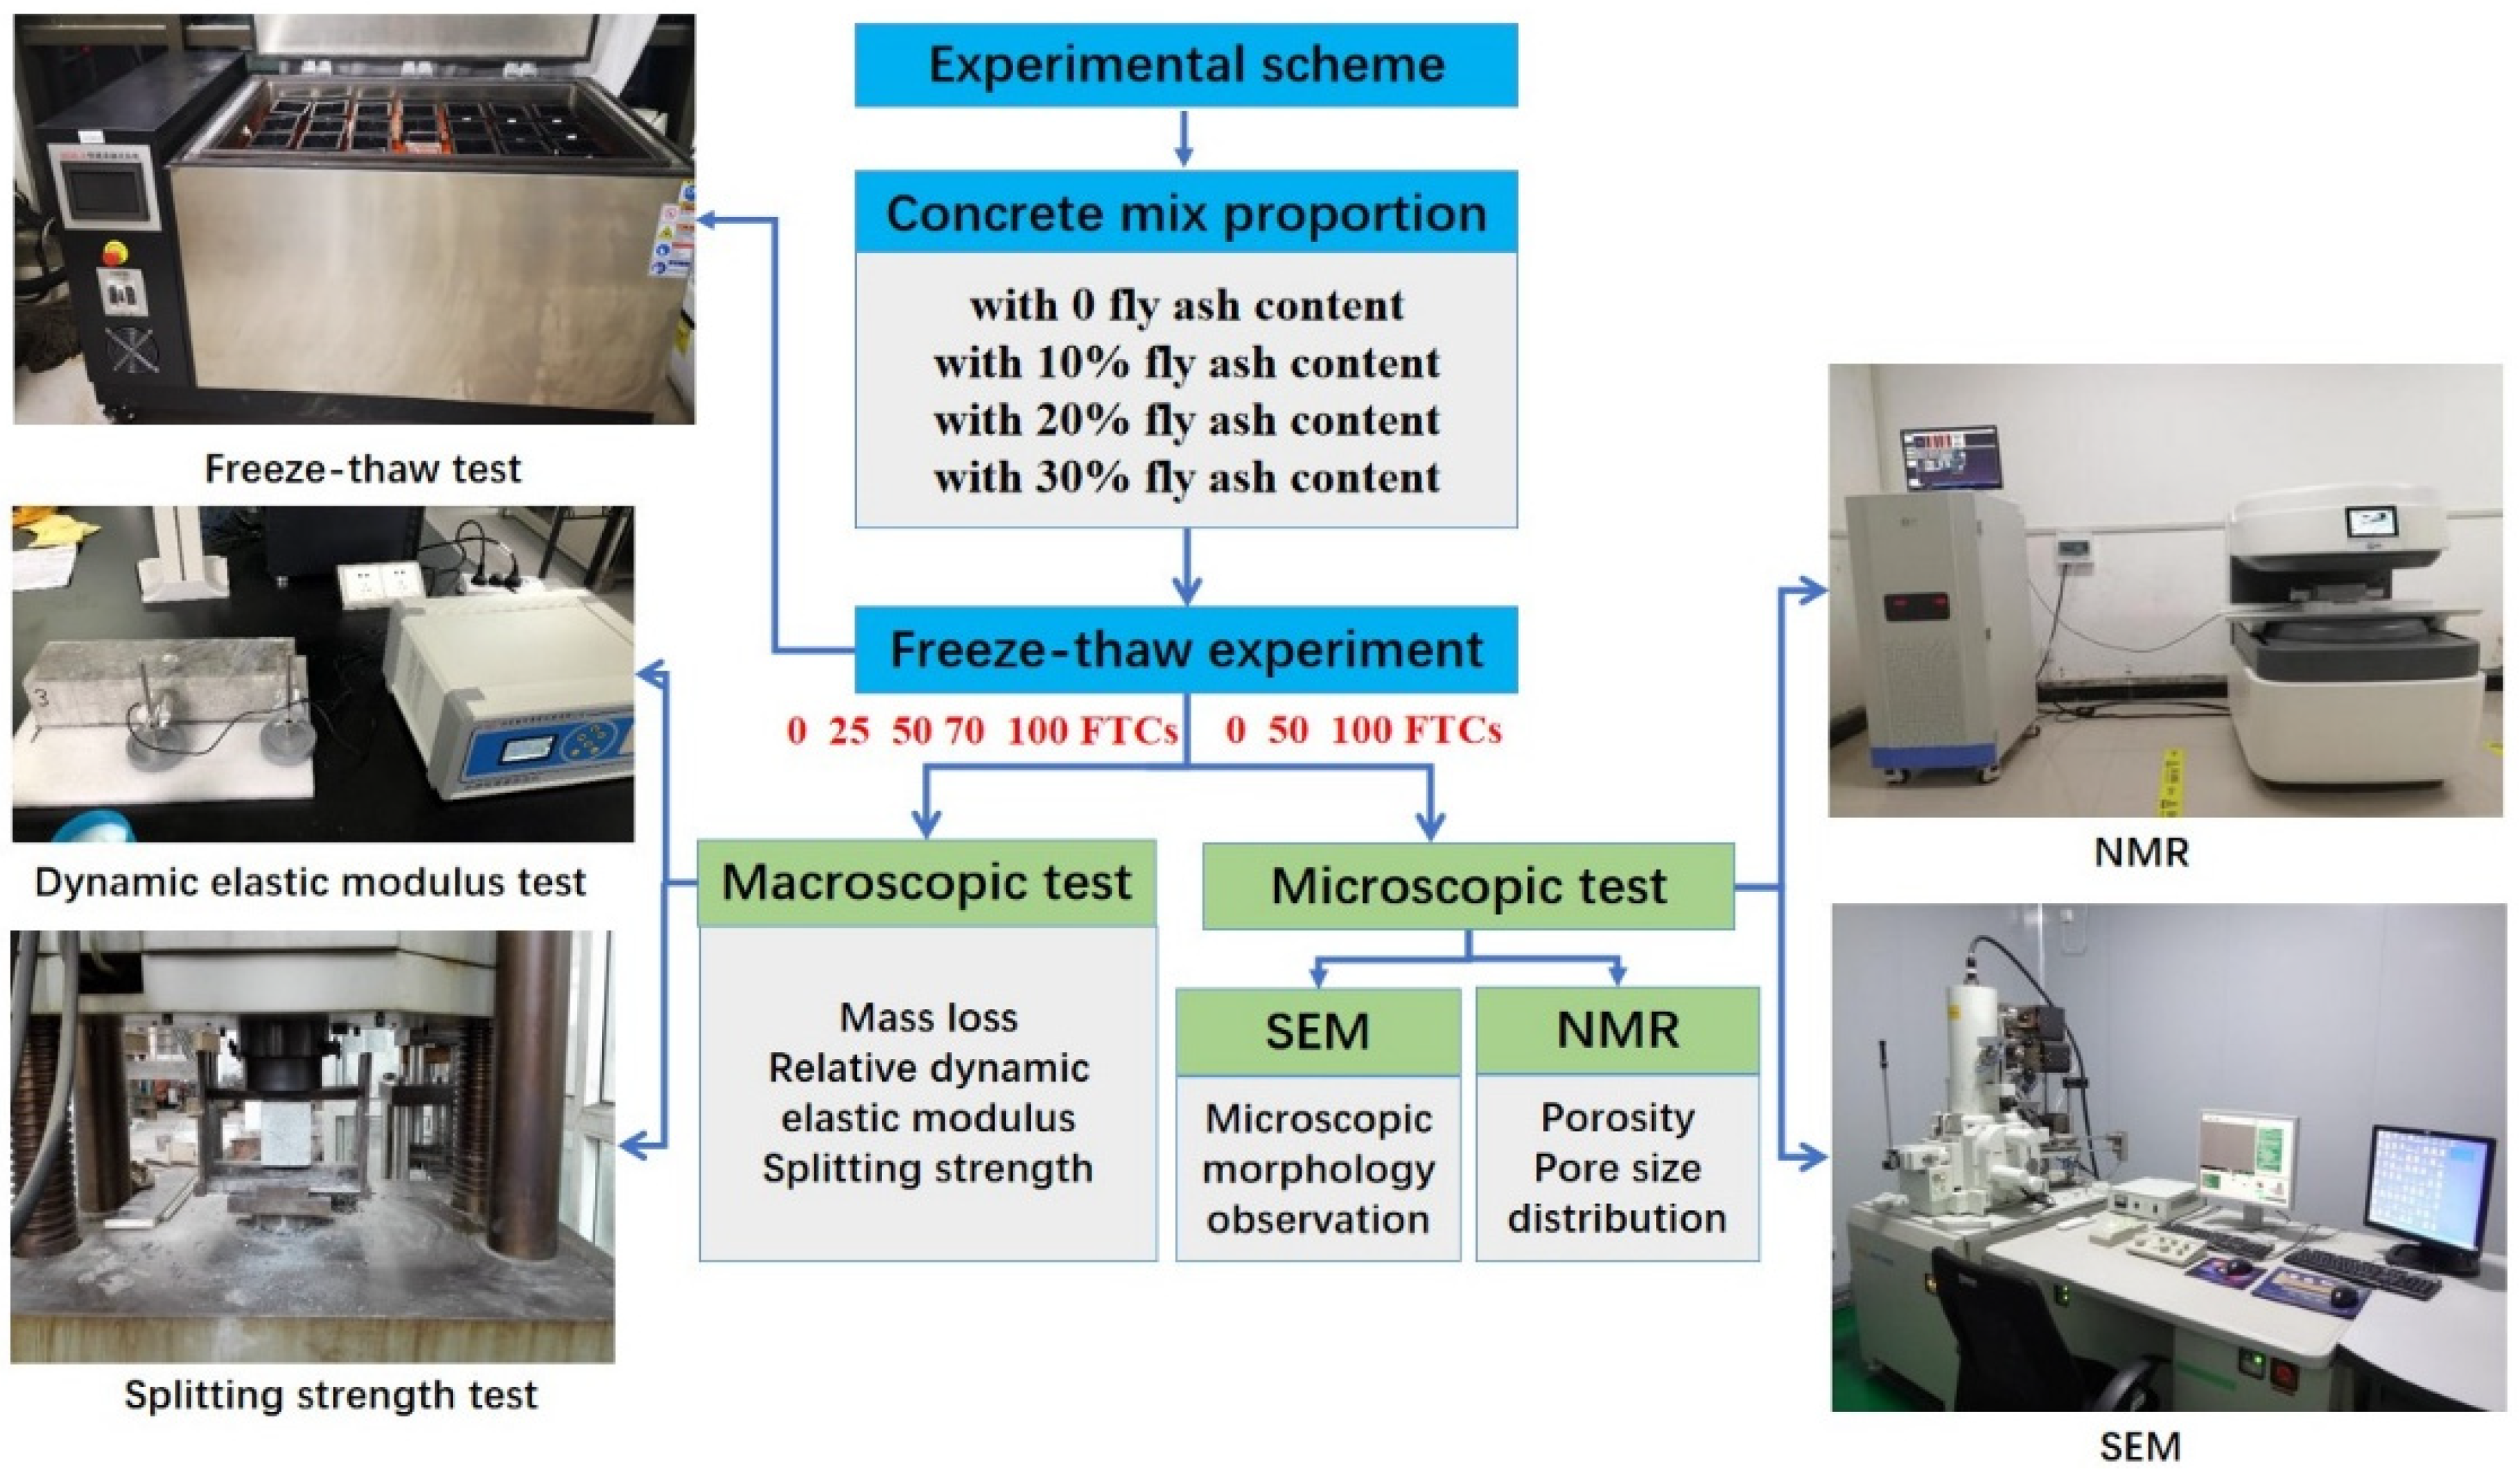
2.2. Freeze–Thaw Test

This study examines the mechanisms underlying the effect of FA content on face slab concrete’s frost resistance. Concrete specimens with dimensions of 100 mm × 100 mm × 400 mm were used to measure the mass loss rate and RDEM, and the size of 100 mm × 100 mm × 100 mm was used to measure the splitting tensile strength. After the specimen was finished in the steel mold, it was placed on the vibrating table to vibrate and compact. After 24 h, the steel formwork was removed and placed in a standard maintenance box with a temperature of 20 ± 3 °C and a relative humidity of 95% for 24 days. Before FTC, samples were immersed in water for 4 days to make them water-saturated, and then placed into a freeze–thaw machine.
According to Chinese code GB/T 50082-2009, the FTC tests were carried out with the TR-TSDRSL freeze–thaw machine [30]. The temperature in one cycle set by the FTC system decreased from 8 ± 2 °C to −17 ± 2 °C, and then increased to 8 ± 2 °C within 4 h. After predefined numbers of FTCs (n = 0, 25, 50, 75, 100) were reached, all specimens were removed from the test chamber to measure the RDEM and weight, and then recorded. Dynamic elastic modulus test is a kind of non-destructive testing, and the instrument used was a DT-W18S dynamic elastic modulus tester to detect the internal damage degree of face concrete specimens during a freeze–thaw cycle. In accordance with the procedure requirements, the failure of the specimen is judged by the reduction in RDEM to 60% or its mass loss rete of more than 5.0%. Three concrete specimens were taken as a group, and the average value was taken. Three layers of butter and three layers of plastic film were used as antifriction pads to reduce the influence of test error [31]. Every 50 FTCs, the cube specimens were removed from the freeze–thaw testing machine, and the splitting tensile strength, porosity and pore size distribution were tested.

2.3. Splitting Tensile Strength Test

The splitting tensile strength of the concrete was the macroscopic index to evaluate its frost resistance, and these macroscopic mechanical properties were determined by the characteristics of their internal microstructure. To determine how FA affects the mechanical properties of concrete after FTC, the splitting tensile strength was tested using the WAW-Y1000C-type microcomputer control electrohydraulic servo universal test with a loading rate 0.05 MPa/s (0.5 kN/s). The splitting tensile strength test of concrete was carried out with the specimen of 100 mm × 100 mm × 100 mm.

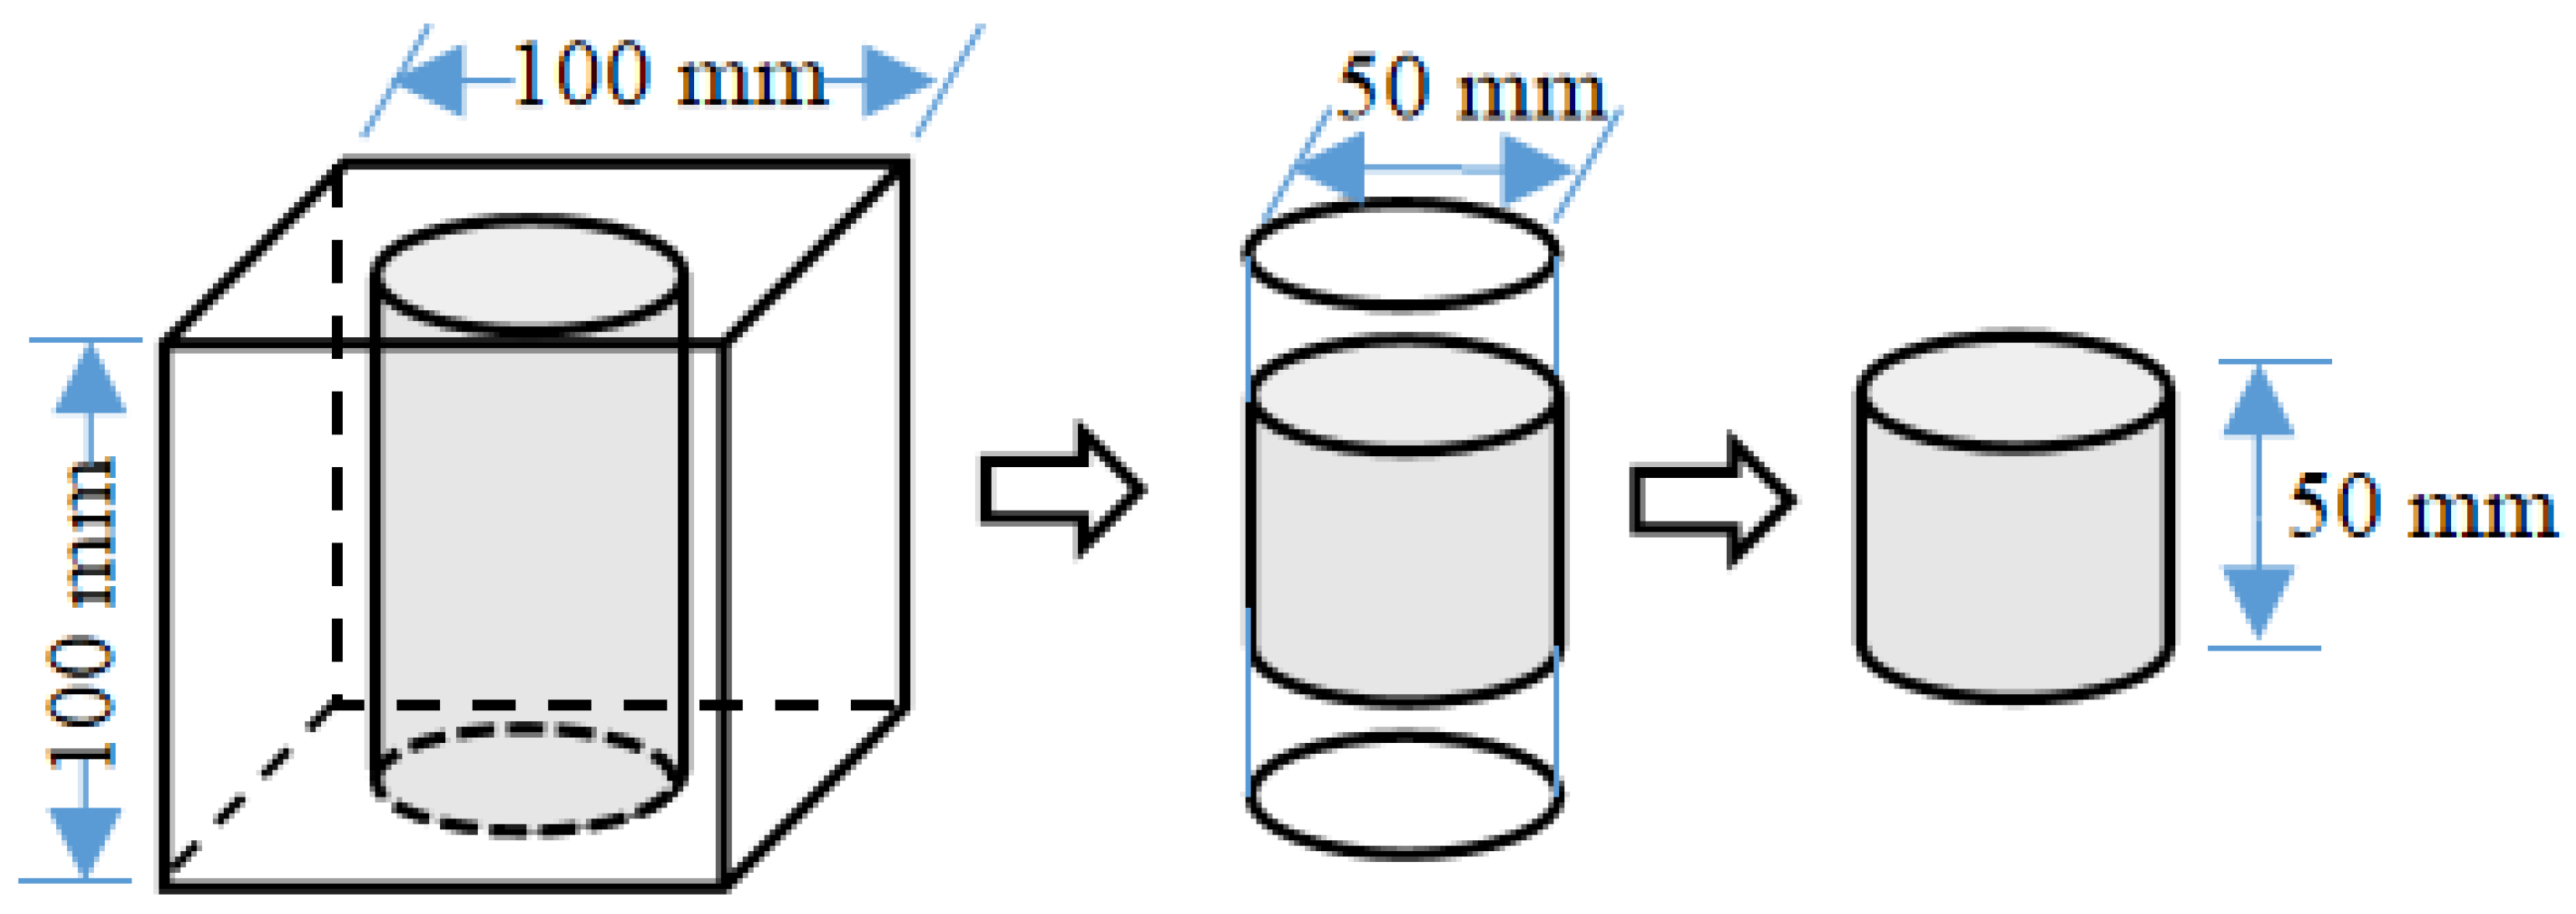
2.4. Microscopic Test

By analyzing the microstructure of concrete, we can determine its macroscopic mechanical properties, such as splitting tensile strength. A diamond saw was used to collect representative samples from the concrete after splitting test with thickness, length, and width of 1 mm, 3 mm, and 3 mm. Through SEM, the effect of FA content on the microstructure and mechanical properties of concrete under FTC was revealed microscopically. The microstructure arrangement of C-S-H and other hydration products in concrete under the action of FTC was analyzed using a JEOL JSM 7500F Scanning Electron Microscope (SEM). Before the SEM test, the samples were pretreated by drying, vacuuming, and spraying with high-pressure gold to obtain high-quality images. In order to avoid the change of the surface characteristics of the specimen during SEM analysis, the samples were freeze-dried; this method is a process in which the frozen sample is placed in high vacuum air and the water or dehydrating agent in the sample is removed by sublimation. NMR microstructure analysis was performed by Suzhou Niumag Analytical Instrument Co., Ltd. using an NMR microstructure analysis system (type: MacroMR12-150H-I, Suzhou, China). In order to fully understand the internal pore structure of the specimen before and after FTC, we selected 0, 50 and 100 FTCs specimens for NMR testing. In order to eliminate the influence of uneven freeze–thaw at both ends of the test results during NMR testing, the sample was cut into a cylinder with a diameter of 50 mm and a height of 50 mm using a cutter. The process is shown in Figure 2. After sampling, we used a vacuum saturator with a pressure of 0.1 MPa to saturate the concrete sample, and the evacuation time was 4 h. Next, we soaked the sample in distilled water for 24 h. To avoid water evaporation impacting the test result, we wiped off the surface of the water before taking the sample from the water and wrapping it in plastic, placing it on the NMR instrument to ensure the pore parameters of the sample, and determining the average value [28,32,33]. The concrete specimens with unknown porosity were measured by NMR, and the results of porosity and pore size distribution could then be obtained.

3. Experimental Results

3.1. Surface Change

The surface change of four groups of concrete specimens subjected to 50 and 100 FTCs is shown in Figure 3. After 50 and 100 FTCs, the apparent changes of the four groups of concrete samples are basically the same. With the increase in FTC, the degree of apparent damage of concrete increases gradually, which is consistent with the research results of Yao et al. [34]. As the thermal expansion coefficient of ice is greater than that of concrete, the concrete surface will be subject to freeze–thaw action in both directions during the FTC, and is more vulnerable to freeze–thaw damage. During the FTC experiment, the apparent changes caused by 25 FTCs were small, so 50 and 100 FTCs were selected to explain this problem. It can be seen from Figure 3 that after 50 FTCs, the color of the sample without FA and the sample with 30% FA became darker, and the surface cement paste felled. The surface of the sample with an FA content of 20% is relatively complete. After 100 FTCs, the surface of the specimens with an FA content of 0 and 30% is relatively rough, and the cement mortar drops seriously. From the perspective of appearance damage, the concrete specimen with 20% FA has the lightest surface color and the least loss of cement paste on the surface, so it can be seen that the damage degree is the smallest. However, there are many holes on the surface of the sample without FA, the aggregate has been exposed, and obvious defects can be seen on four corners, which shows that the damage is the greatest. The damage degree under FTC is described by the surface change of the specimen, which has been used in references [34,35,36].

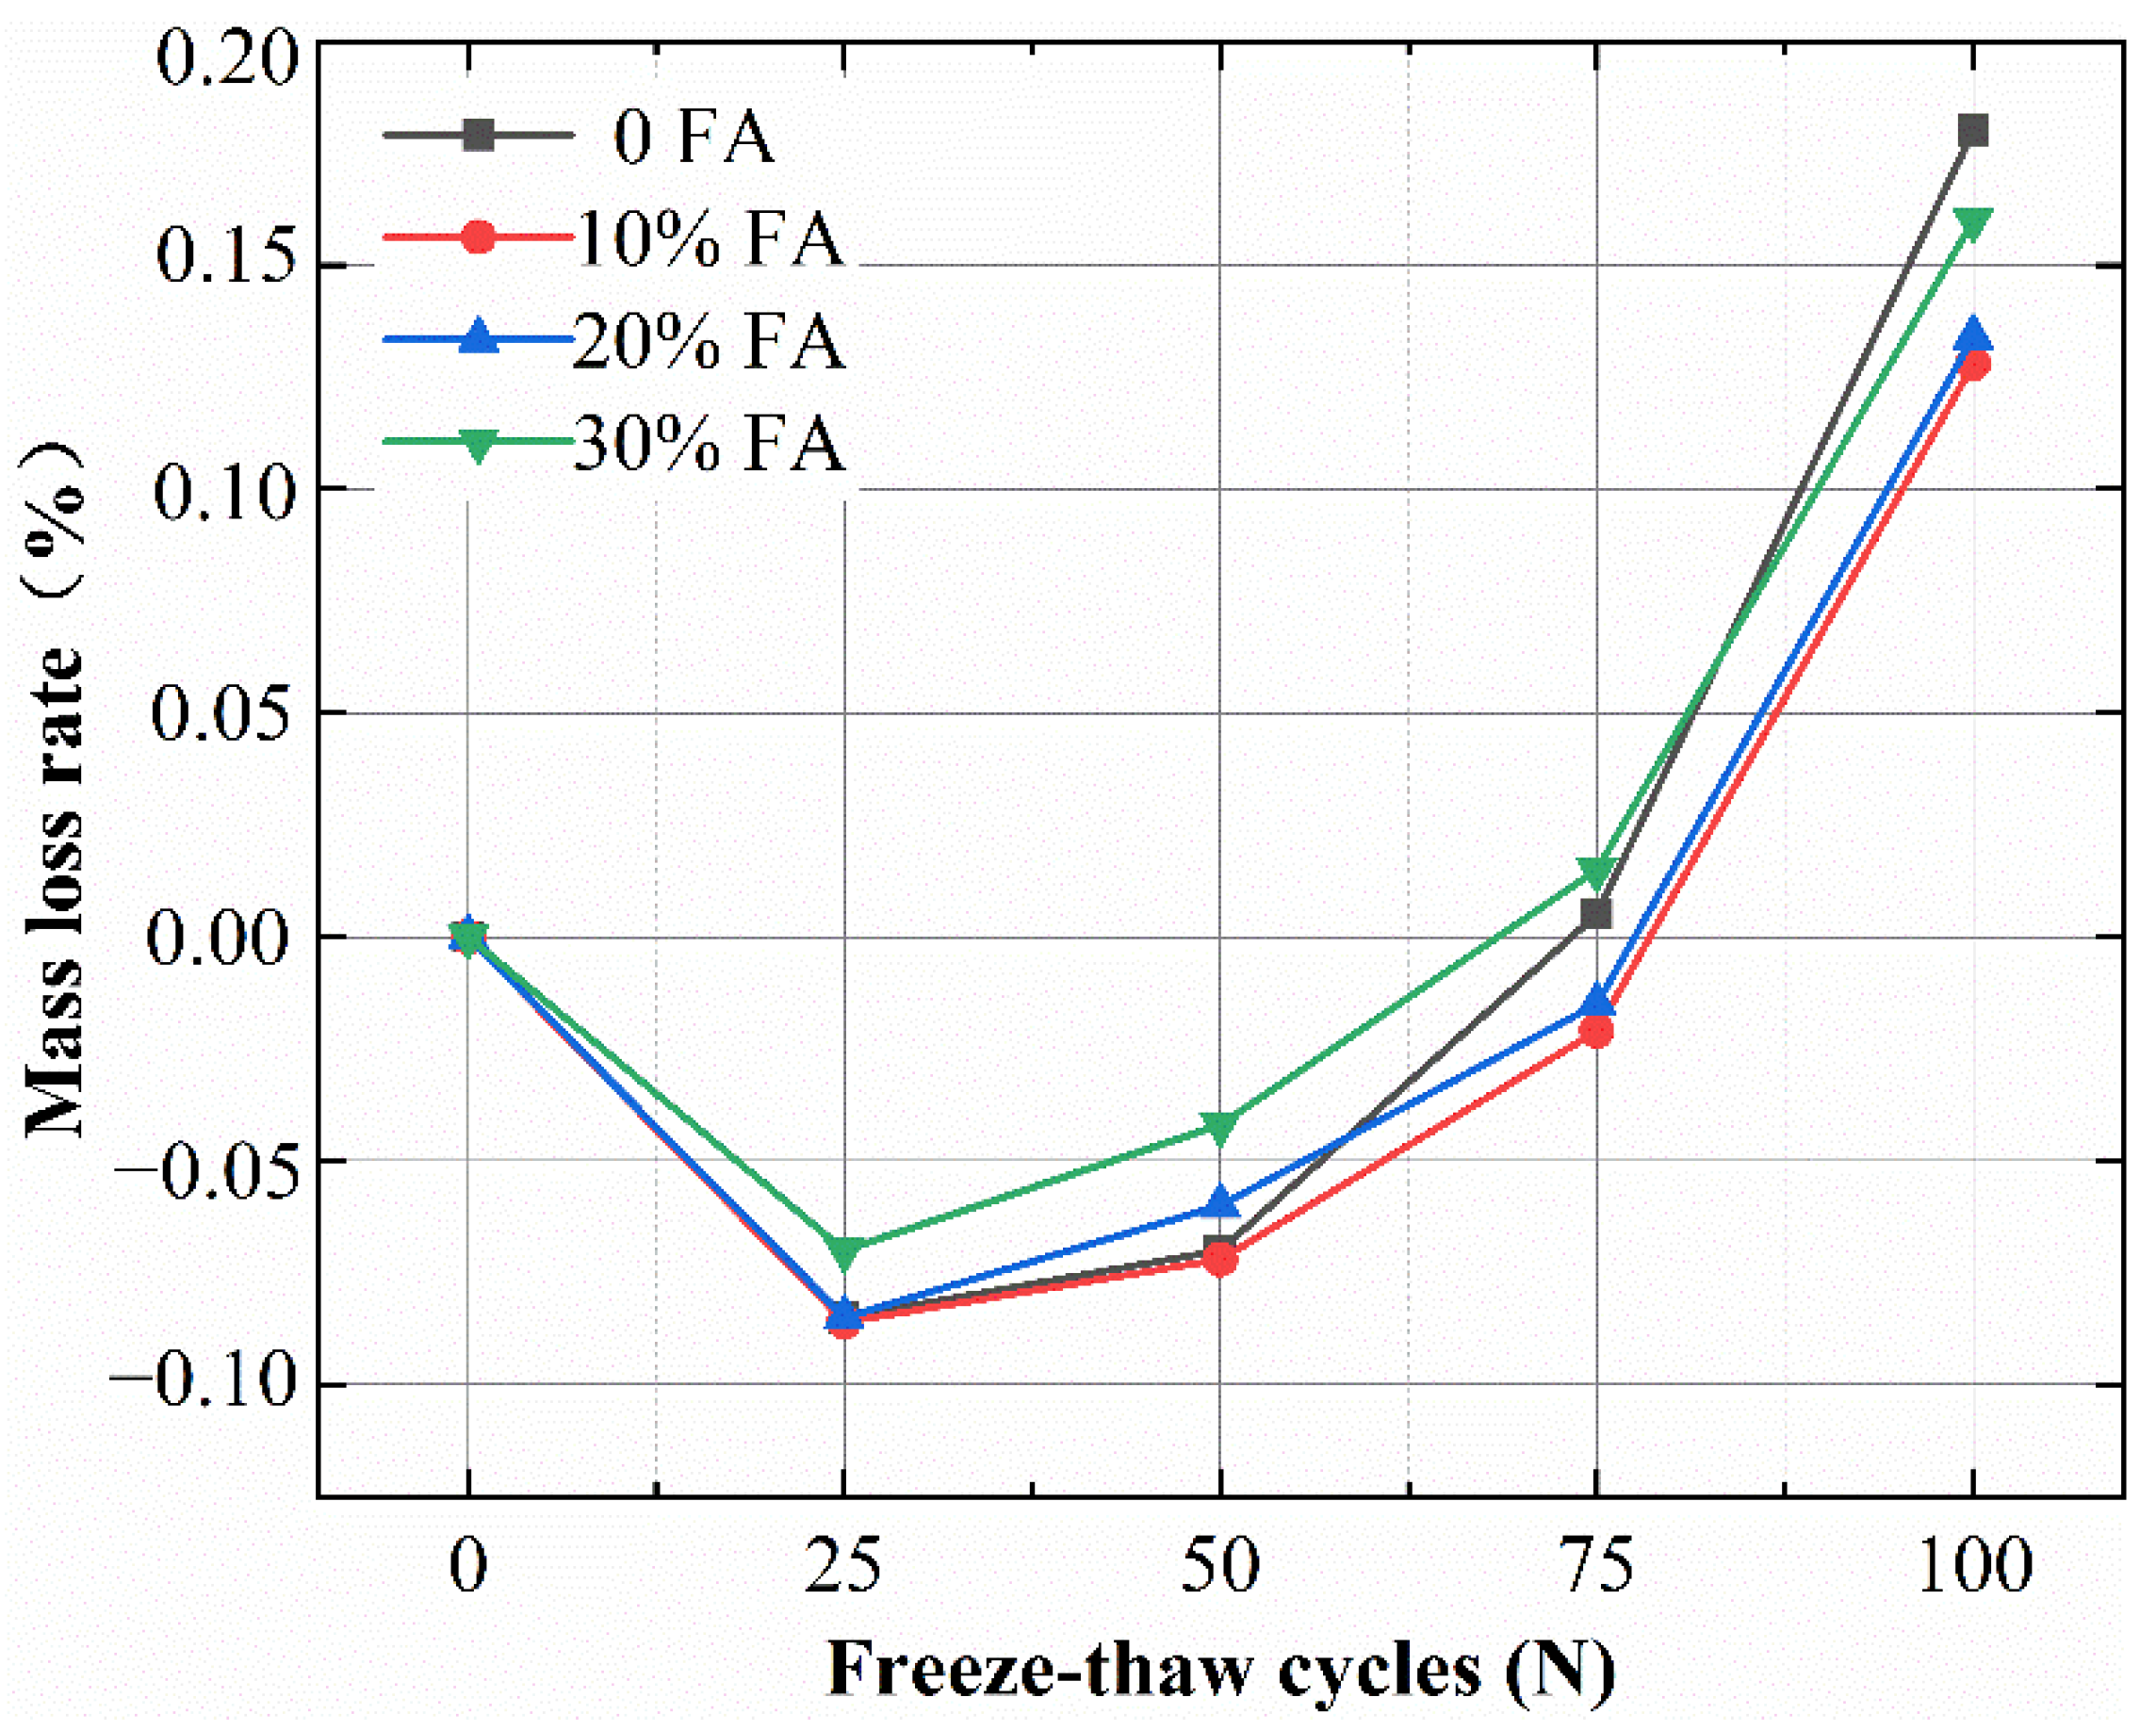
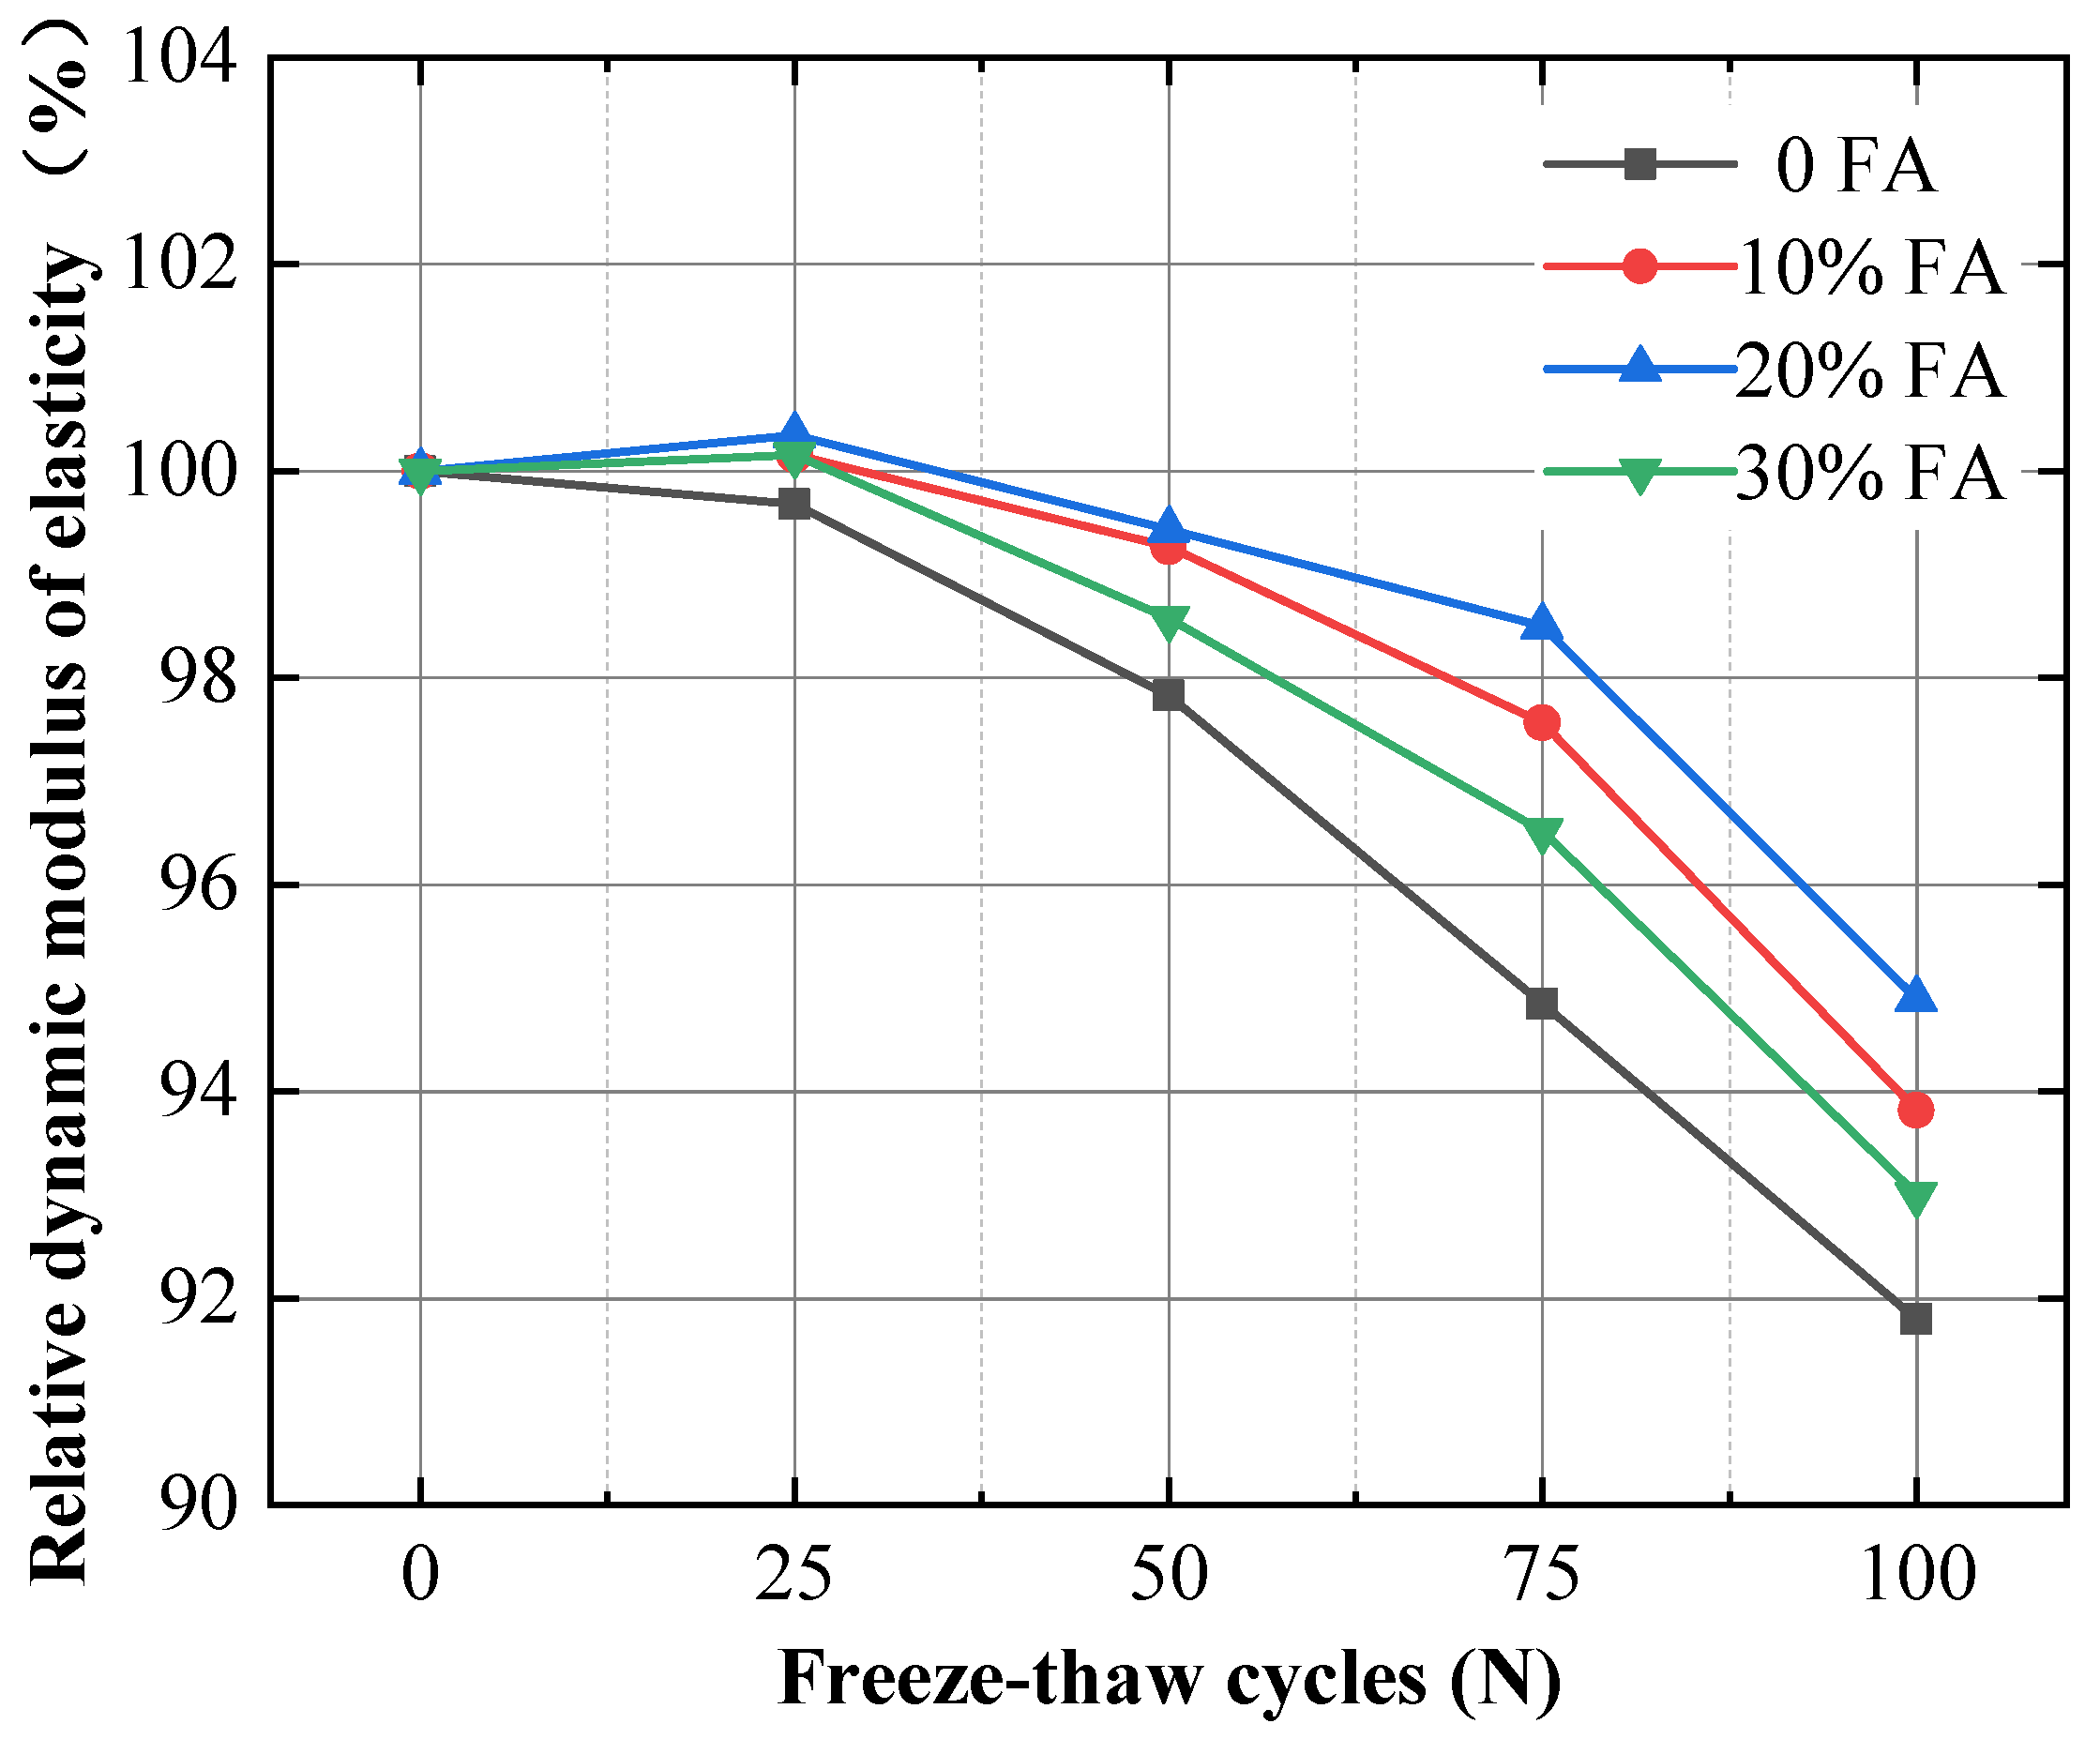
3.2. Mass Loss and RDEM

During FTC, the mass loss rate can be used to determine the degree of concrete spalling. During the process of FTC, it can be seen from the observation of the concrete surface that the surface gradually changes from a dense structure to a porous and loose structure, which is also the reason for the decline of the mass of the specimen. The mass loss rate for the four groups of specimens is shown in Figure 4. It can be seen that, with the increase of FTC, the mass loss rate of concrete samples decreases first and then increases, and the mass loss rate of 10% and 20% FA content samples is basically the same. After 100 FTCs, the mass loss rate of the four groups of samples was 0.18%, 0.129%, 0.132% and 0.16%, respectively. The maximum sample of concrete without FA is 0.18%. The sample with an FA content of 10% and 20% is the minimum, close to 0.13%. In the process of FTC, once microcracks occur, the intrusion of water will lead to the change of material weight. Generally, if the surface-peeling mortar weighs more than the water absorbed by the concrete, then the concrete sample will weigh more; otherwise, it will weigh less. Before 25 FTCs, the increased water mass is greater than the reduced mass of freeze–thaw damage, so the mass loss is negative. Figure 4 describes the difference of mass loss of samples with different FA contents after FTC, and the difference is not obvious, which indicates that the evaluation of early freeze–thaw damage of hydraulic concrete by mass loss rate is not very accurate, and it must be supplemented with other damage indicators.
Material properties are reflected by dynamic elastic modulus, and the loss of dynamic elastic modulus of concrete after FTC means that the material is no longer elastic [31]. As shown in Figure 5, the RDEM test results were positive. The RDEM of concrete specimens with FA first increases and then decreases with the increase in FTC time, whereas that of the specimen without FA is decreasing all the time. After 100 FTCs, the RDEM of the specimen without FA is the smallest, which is 91.8%. RDEM reflects the internal compactness of concrete specimens and then their damage changes. FTC will cause internal damage to the concrete specimens, which will make the structure change from compact to loose, and cause the RDEM to decrease. The small increase in RDEM value may be related to its continuous hydration reaction. The addition of FA reduces the loss of RDEM because the pozzolanic activity of FA produces more hydrated calcium silicate gel, which fills the pore space and makes the interior of the concrete compact. The RDEM of the specimen mixed with 20% FA decreases the slowest, indicating that it has good freeze–thaw resistance.

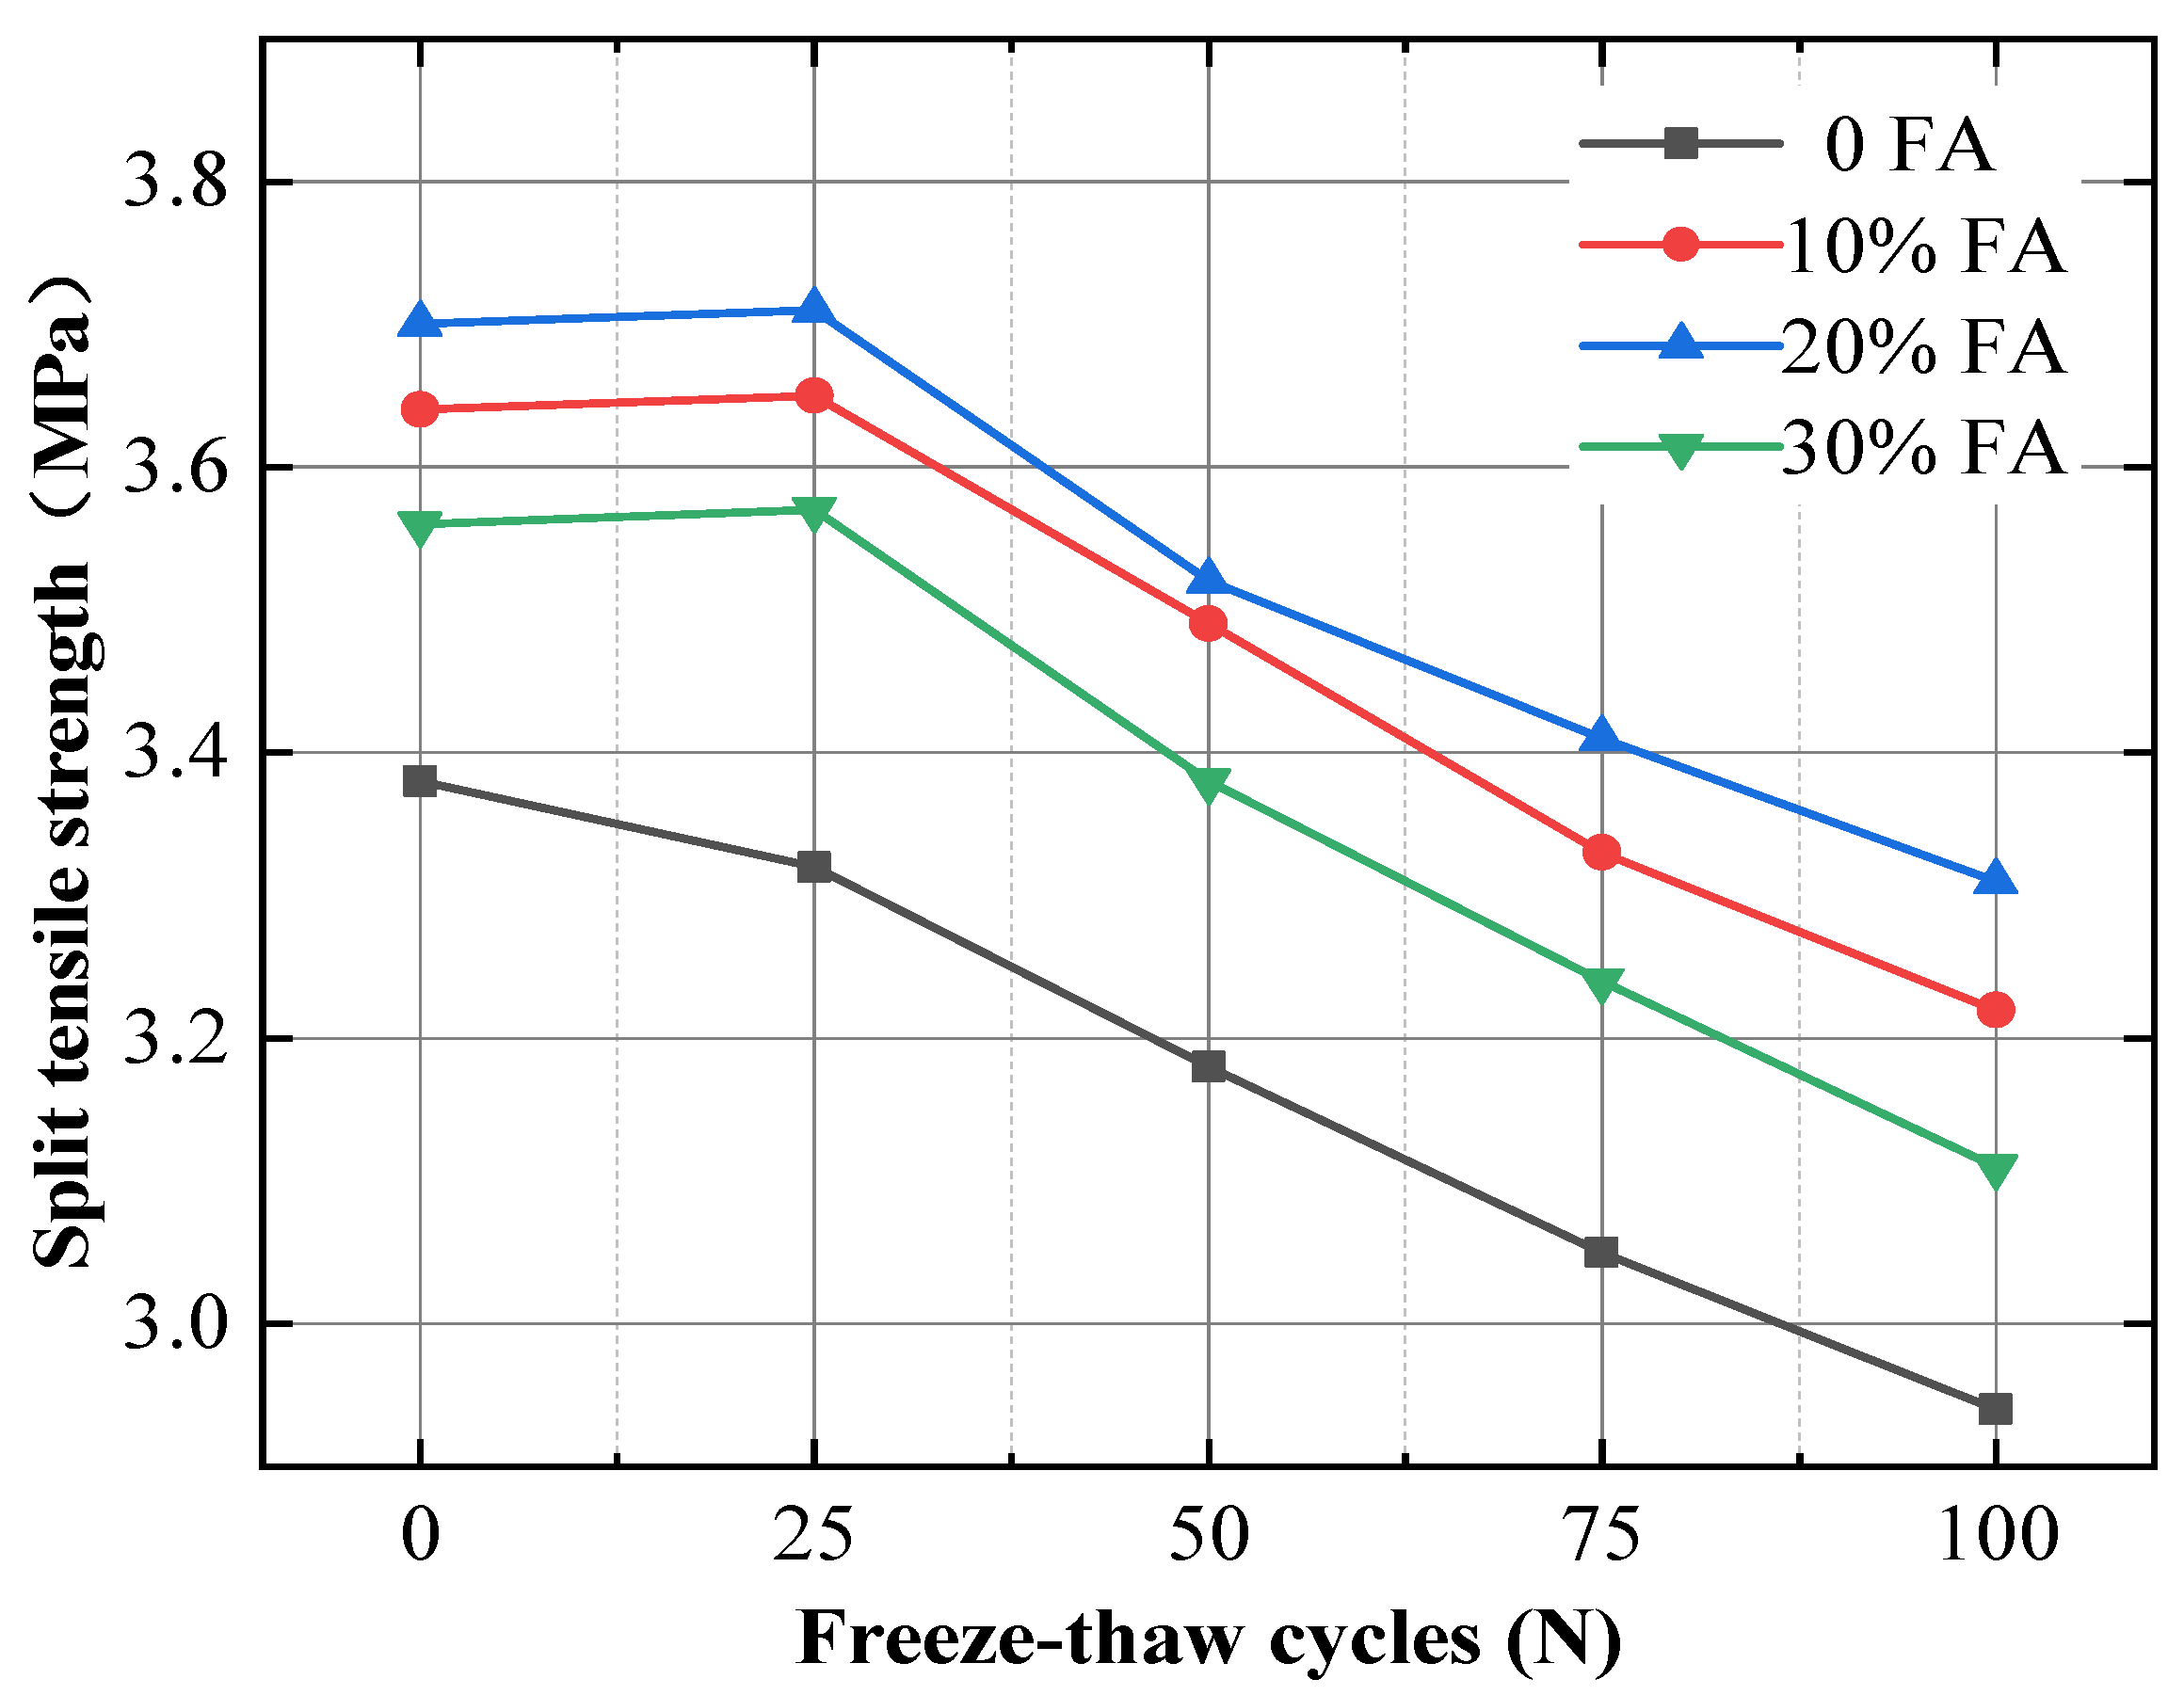
3.3. Split Tensile Strength
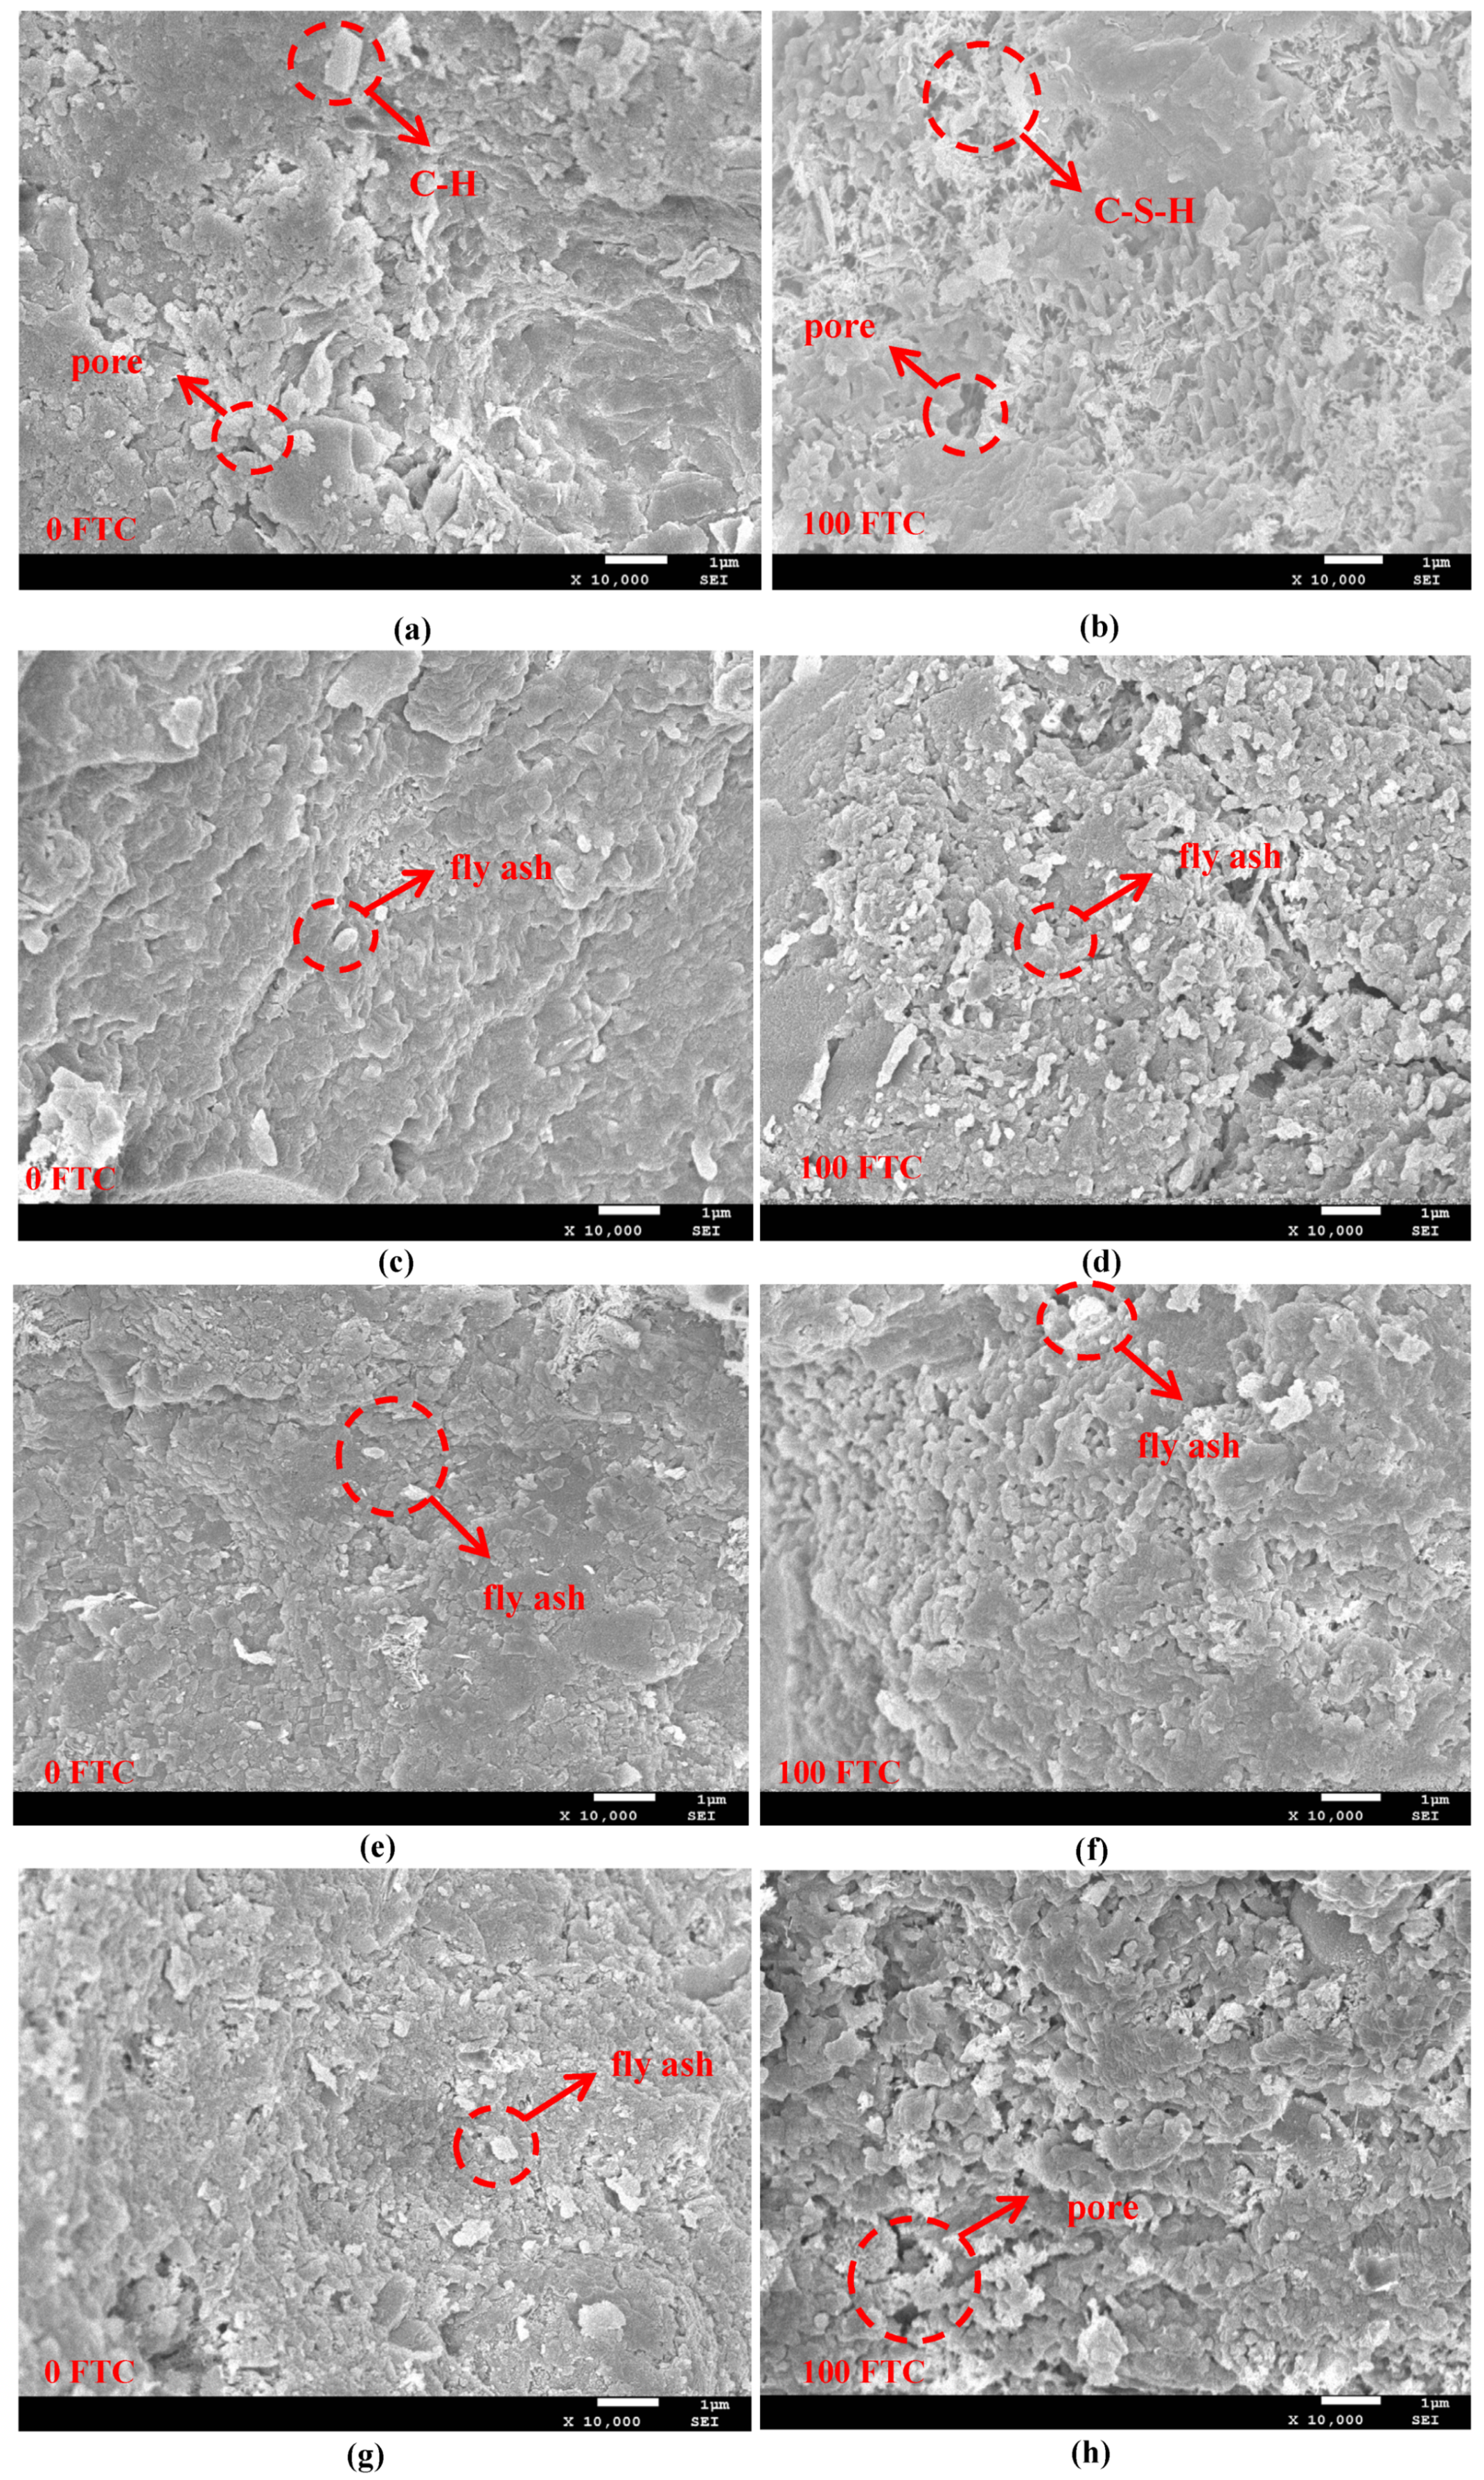
The splitting tensile strength of the four groups of concrete specimens with different FA contents was tested every 25 FTCs. The effect of FA content on the splitting tensile strength of concrete under FTC action is shown in Figure 6. The splitting tensile strength of concrete specimens mixed with FA first increases and then decreases with the increase of FTCs, whereas the splitting tensile strength of the concrete specimen without FA decreases all the time. When FA is added to concrete, the splitting tensile strength increases, with the strength of the concrete with 20% FA content increasing the most. Owing to the filling effect of FA, the pozzolanic effect produces more gel to make the concrete compact and improve the strength. Before 25 FTCs, due to the prolongation of age and continuous hydration, the splitting tensile strength of the concrete mixed with FA increases slightly, which is the same as the mass loss. In the whole test process, the splitting tensile strength of the concrete without FA is always lower than that of the other three groups of specimens and decreases the fastest, followed by that of the specimen with 30% FA, and then that of the specimen with 10% FA. The splitting tensile strength of the specimen with 20% FA decreases the most, indicating that the freeze–thaw resistance of concrete can be improved by adding an appropriate amount of FA. This conclusion is consistent with the results of reference [37].

3.4. SEM Analysis

In macroscopic tests, the FA content of concrete has a significant effect on frost resistance. The macroscopic properties of materials depend on their composition and internal structure [38]. To further explore the effect of FA content on the internal damage of concrete after freeze–thaw from a microscopic point of view, 0 and 100 FTCs specimens were selected because the difference between these two groups was the largest. The pore structures of four FA content specimens 0 and 100 FTCs are clearly observed in Figure 7 (10,000× magnification, the scale length is 1 μm).
Figure 7 shows that after 100 FTCs the internal pores of the four groups of concrete specimens increase, the structure becomes loose, the hydration products change from dense to loose, and microcracks appear. In Figure 7a, some holes are present in the 0 FTC concrete sample. The sample without FA has more pores and a looser structure, providing more channels for water transmission. In Figure 7b–d, the overall structure of the 0 FTC concrete sample is denser, and the pores are smaller. Some FA particles can be observed at the center. Given that FA exists in cement paste, it participates in the hydration reaction of cement, forming a certain amount of calcium silicate hydrate gel, filling the pores, and making the structure compact. After 100 FTCs, the hydration products of the specimen without FA become very loose and the integrity of the structure is damaged, which is the reason for the decrease in RDEM and splitting tensile strength under FTC. For the test piece added with FAwith a particle distribution range of 1–100 µm fills some large pores, due to its filling effect, resulting in the increase in the proportion of small pores and slowing down the freeze–thaw damage of the structure. The structure of the 20% FA specimen is relatively compact and has good integrity, indicating that the freeze–thaw resistance effect of 20% FA content is the best.
Cement and FA are hydrated together to form an overall structure by overlapping their hydration products. Hydration products fill the pores in the concrete, reduce the porosity, refine and improve the pore structure, and improve the frost resistance.

3.5. NMR Analysis

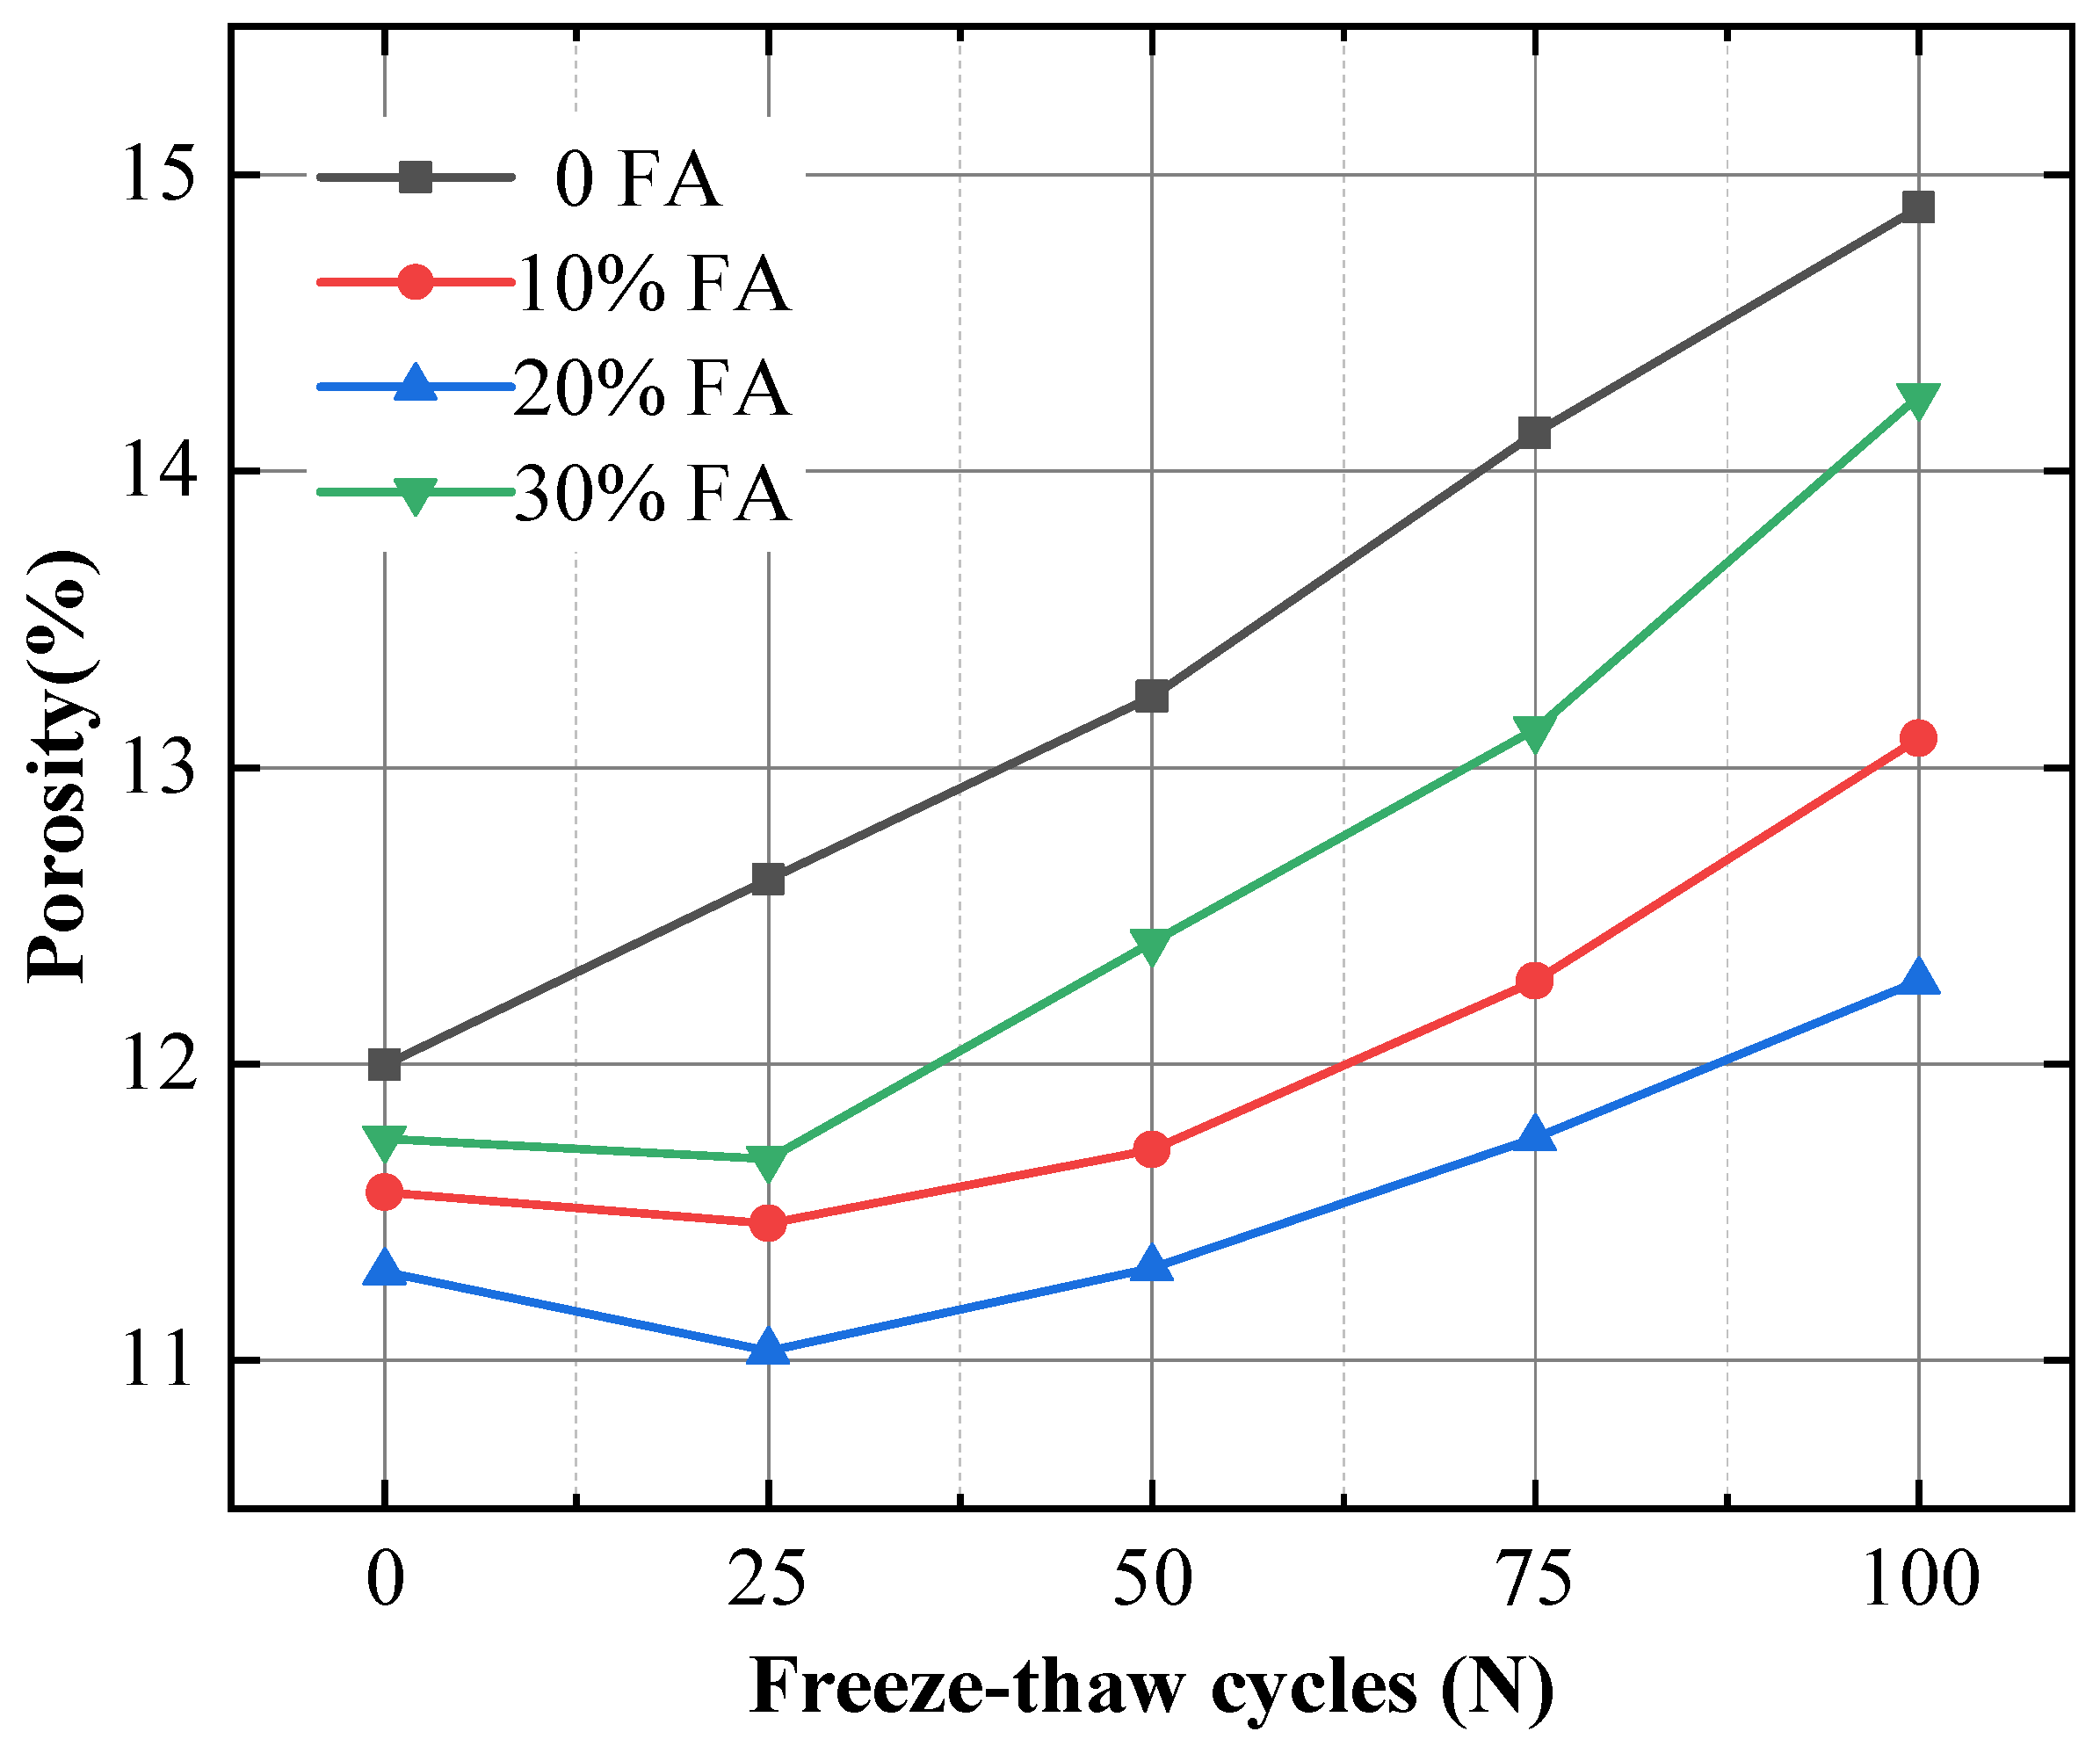
3.5.1. Porosity Evolution

The frost resistance of concrete reflects the important indexes of concrete durability. Most scholars [39,40,41] think that the main factor influencing concrete’s frost resistance is the pore structure, considering that concrete has different scales of pores. The ratio of pore volume to total volume in concrete is called porosity. Figure 8 shows the porosity of concrete samples measured by NMR. The porosity of concrete specimens with FA first decreases and then increases with the increase of FTCs, whereas the porosity of the concrete specimen without FA is always increasing. The addition of FA reduces the porosity of concrete specimens, and the porosity of the concrete with 20% FA is the lowest. In the FTC process, the porosity of the specimen without FA is always higher than that of the three other groups. After 100 FTCs, the porosity of the sample without FA increases to 15%, whereas that of the sample with 20% FA is the lowest at 12.3%. The porosity of the four groups of concrete is 1.241, 1.218, 1.087, and 1.213 times higher than that of unfrozen–thawed concrete. This result is due to the influence of repeated entry and exit of water in and out of concrete pores, hydrostatic pressure, and osmotic pressure in the processes of freeze–thaw, which further develops, expands, and intersects with one another and increases the porosity. The porosity of the concrete mixed with 20% FA before and after freeze–thaw is always the lowest among the four groups, which further confirms that the content of 20% FA can reduce the porosity of concrete.
The results are consistent with the RDEM and splitting tensile strength results, which were all due to the filling effect of FA, which filled the pores of cement paste, thereby reducing the internal space of concrete, refining and improving the pore structure, and decreasing the porosity. The addition of FA improved the microstructure of concrete, strengthened the bond between aggregate and cement paste, and improved its frost resistance. However, if the amount of FA is excessive, the cement gel will be relatively reduced, and the remaining pores will be more after the FA particles are filled.

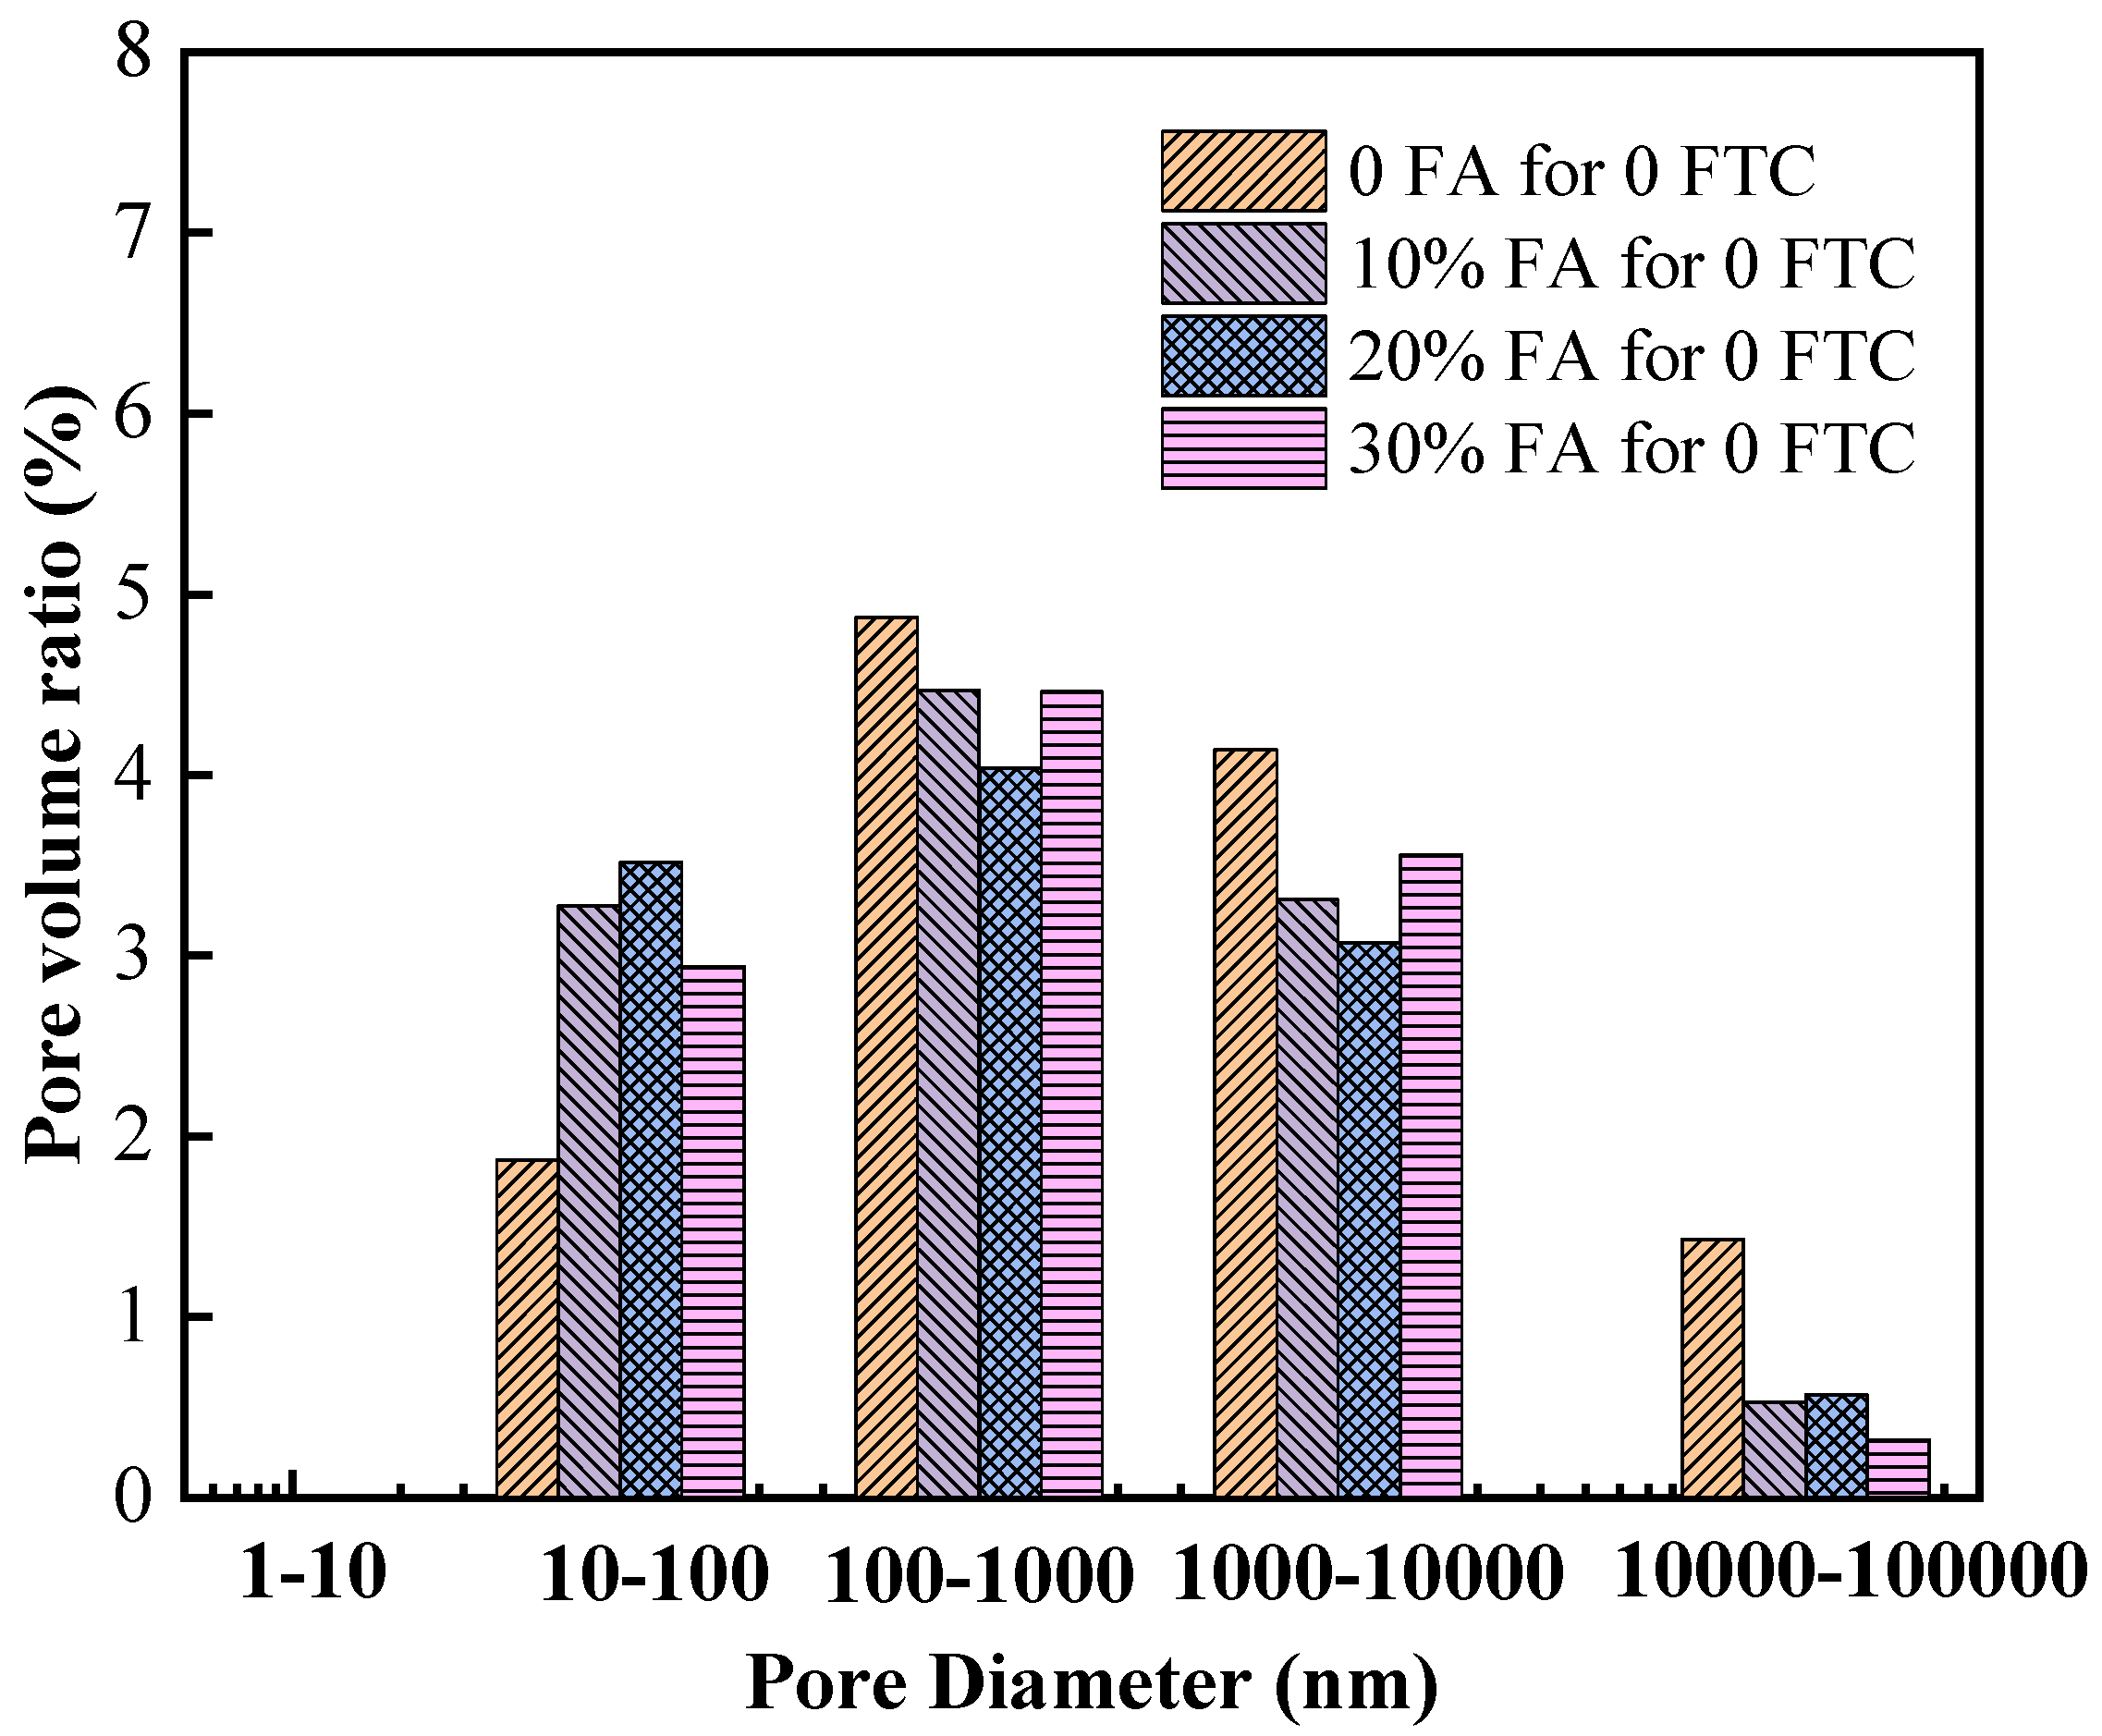
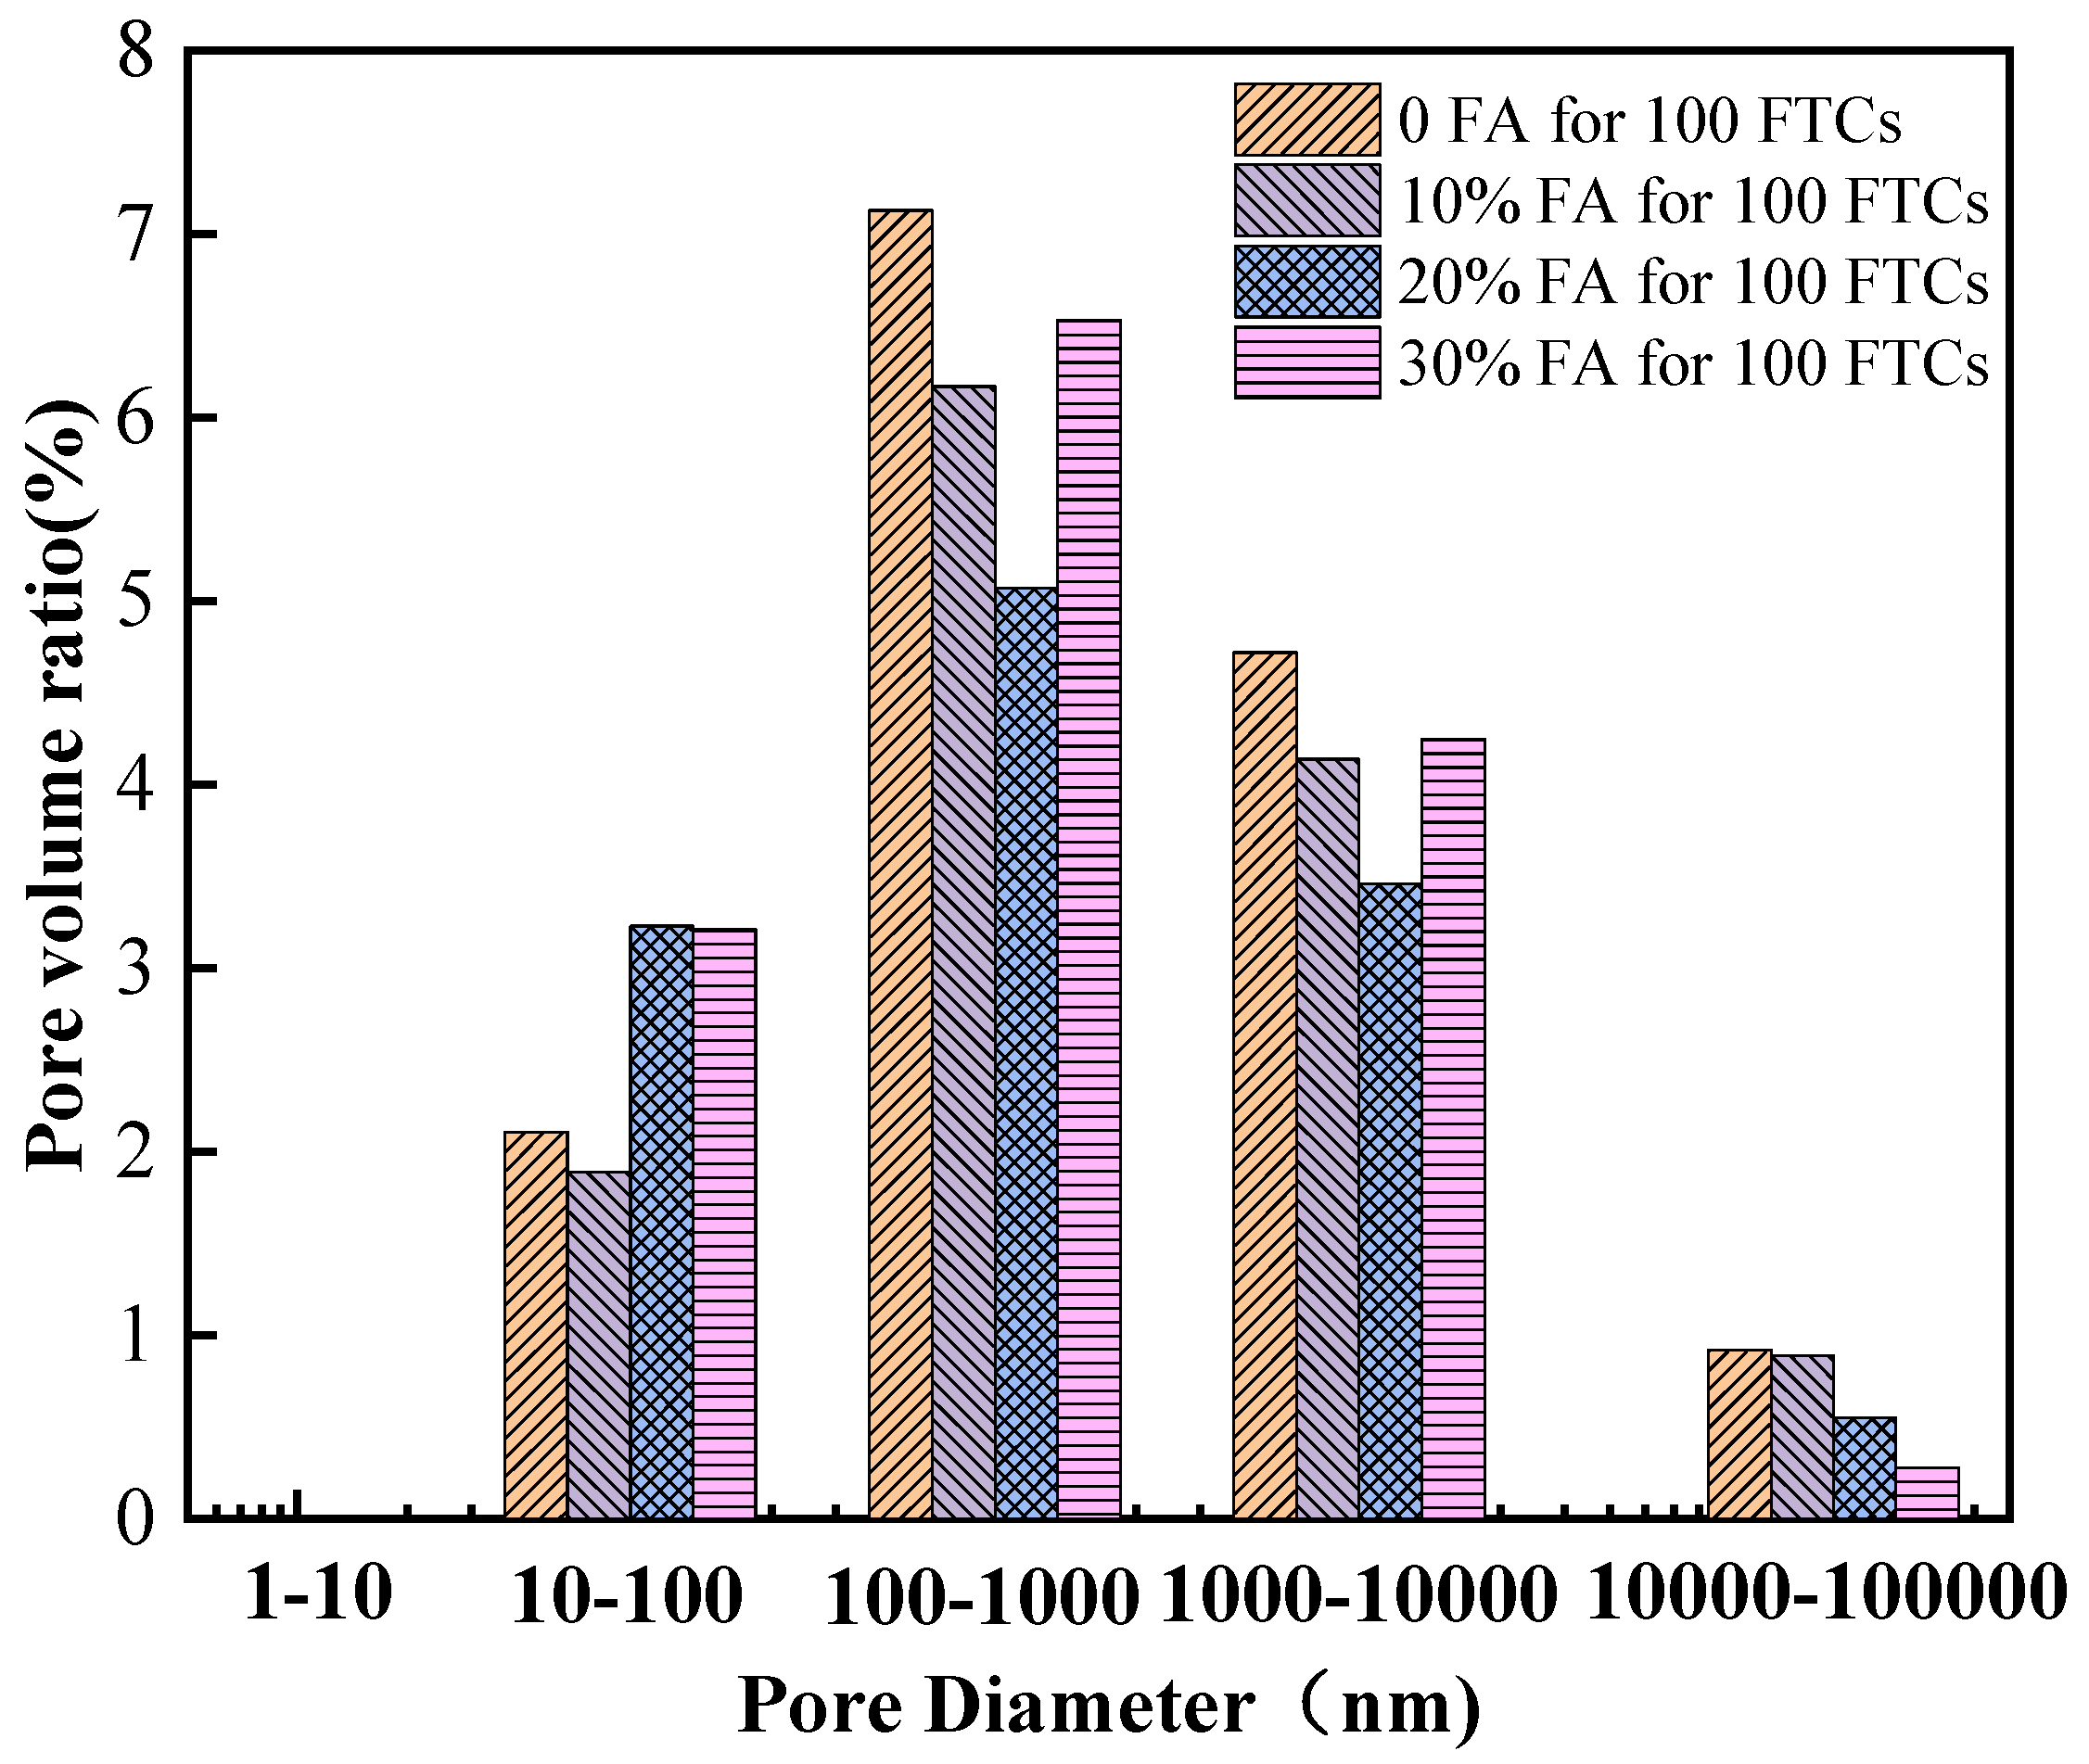
3.5.2. Pore Size Distribution Evolution

A cement mortar’s pores are distributed among cement grains as a result of cement hydration. Porosity, pore size distribution (PSD), and pore connectivity affect the permeability and frost resistance of concrete. Among them, the PSD can better evaluate the comprehensive properties of hydrated cement paste. The porosity and PSD in the samples under different FTC were detected by NMR. The PSD of the samples under 0 FTC is shown in Figure 9. The total porosity of the four groups of FA concrete specimens is 12%, 11.6%, 11.3%, and 11.8%, of which that of the specimen with 20% FA is the smallest at 11.3%. Figure 9 illustrates that the addition of FA reduces the proportion of pores with sizes larger than 100 nm and increases the content of pores with diameters smaller than 100 nm. The addition of FA fills some pores larger than 100 nm and reduces the porosity. When 30% FA is added, the porosity increases in the range of 1000–10,000 nm, which may be because the addition of excessive FA reduces the volume of cement slurry, lowers the degree of cementation, and increases the number of pores. Adding FA to concrete improves its bubble structure, increases the number of small bubbles and gel pores, and reduces the number of atmospheric bubbles, thus decreasing the distance between two bubbles, which has a positive contribution to the freeze–thaw durability of concrete.
The pore size distribution after 100 FTCs is shown in Figure 10. The total porosity of the four groups of concrete specimens is 14.9%, 13.1%, 12.3%, and 14.3%, of which the porosity of 20% FA concrete is the lowest at 12.3%. Figure 10 demonstrates that, after the FTC, the addition of FA increases the proportion of holes in the range of 10–100 nm and reduces the number of holes larger than 100 nm. Compared with the concrete specimen with 30% FA content, that with 20% FA has a similar number of voids in the range of 10–100 nm but a lower number of voids larger than 100 nm. In combination with the results of RDEM and splitting strength, the reason 20% FA has better freeze–thaw resistance than 30% FA is explained from the microscopic point of view. Figure 9 and Figure 10 demonstrate that after 100 FTCs, the porosity of concrete specimens with FA content in the four groups increases by 23.9%, 12.9%, 8.9%, and 21.1%. Among them, the increment in the test piece with FA content of 20% is the smallest, which is only 8.9%, and the maximum increment in the specimen without FA is 23.9%. Therefore, the addition of FA controls the increase in porosity in the FTC process, and the effect of 20% FA is the best.
Generally speaking, concrete deteriorates as the number of macroscopic pores increases, the number of microscopic pores decreases, and microcracks expand. In the FTC process, the water in the pores of concrete condenses into ice, which increases in volume and leads to expansion. When the expansion stress exceeds the tensile strength of concrete, microcracks will appear around the hole. Combined with the changes in mass loss rate, RDEM, and splitting tensile strength of concrete after FTC, the change in micropore size is related to macroscopic frost resistance. The pore content smaller than 100 nm has great influence on the frost resistance durability of fly ash concrete. The freeze–thaw damage of concrete will be delayed when the number of pores smaller than 100 nm increases and the number of pores larger than 100 nm decreases. When the number of pores with diameters larger than 100 nm increases, the freeze–thaw damage of concrete will be aggravated.

4. Discussion

In order to determine the freeze–thaw degradation mechanism of concrete, microparameters and macroparameters were fitted to concrete with different FA contents under freeze–thaw conditions. The relationships between pore structure and RDEM, and between pore structure and splitting tensile strength were determined, and the influence mechanism of FA on the freeze–thaw durability of concrete is discussed below.

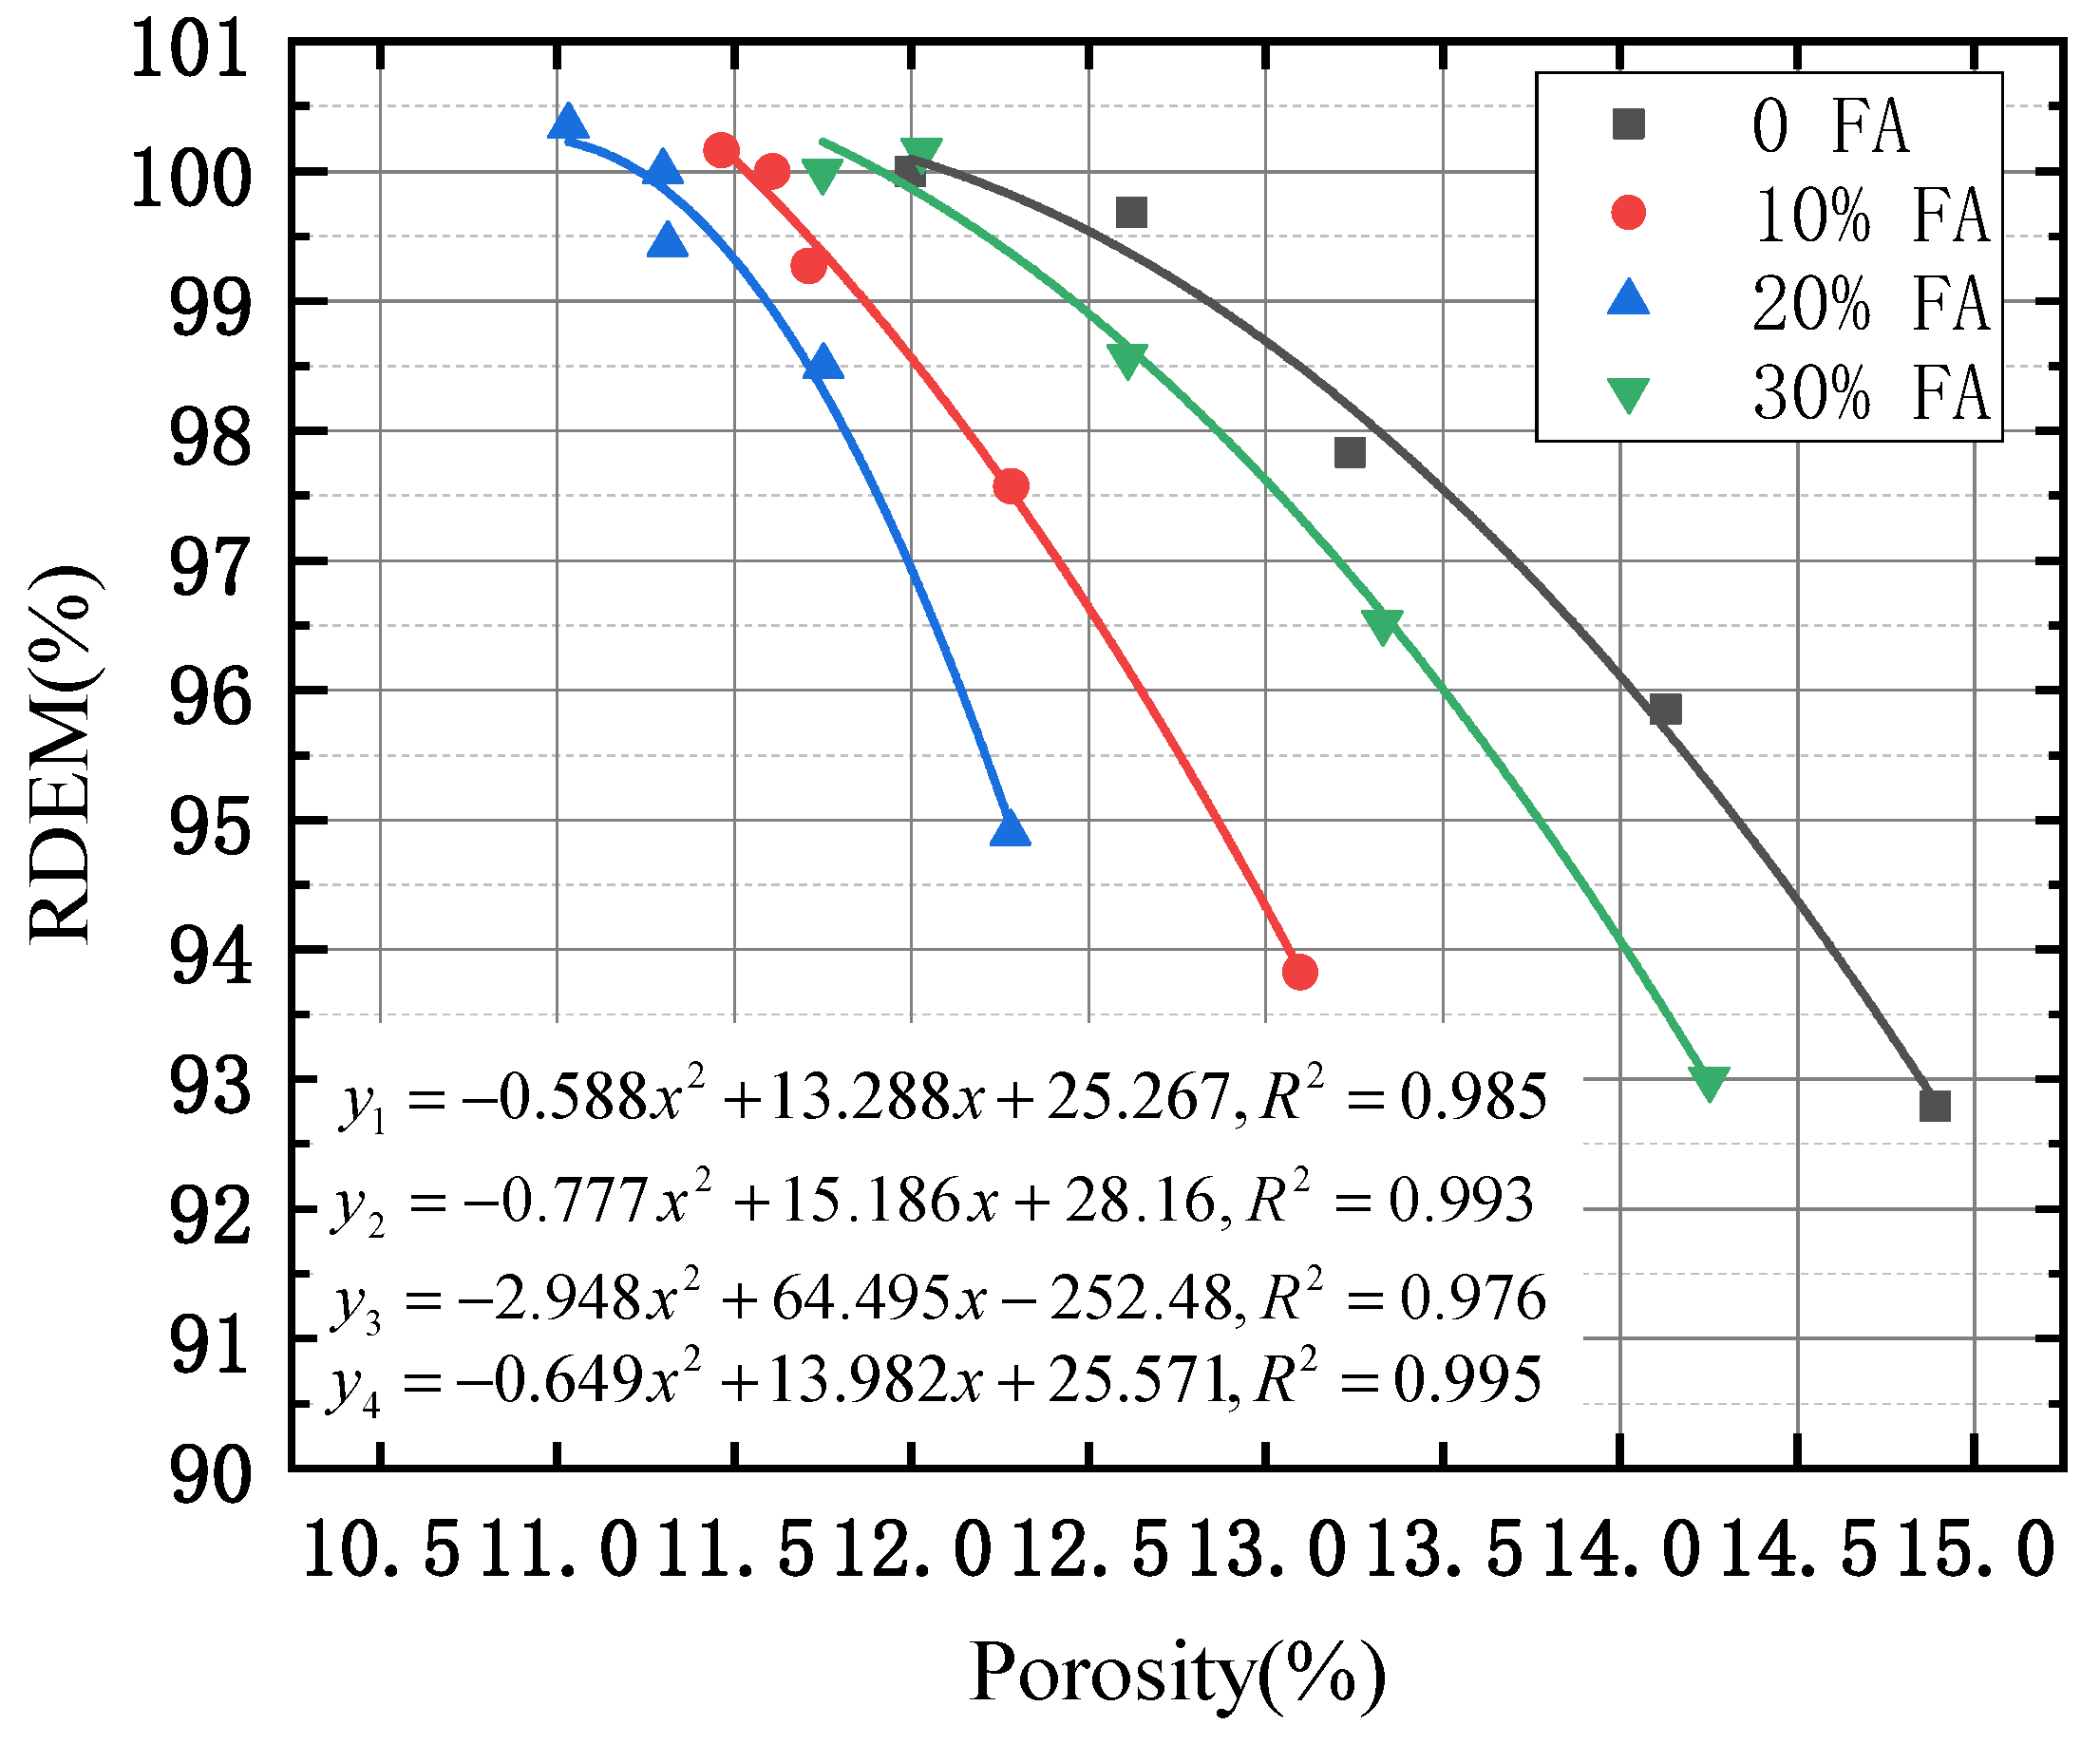
4.1. Relationship between RDEM and Pore Structure

To obtain reliable test results, concrete specimens with different FA contents after FTC were analyzed to determine the relationship between RDEM and pore structure. Figure 11 illustrates the relationship between RDEM and the porosity of concrete specimens with different FA contents under the action of FTC. RDEM decreases with the increase in porosity, and a nonlinear negative correlation is presented.
The most probable pore diameter refers to the pore with the most obvious change in total volume when the pore diameter of this part changes [42]. It is obtained from NMR pore size distribution data, and it is the pore with the largest percentage of porosity. Figure 12 depicts the relationship between the evolution of RDEM and the most probable pore diameter. The figure shows a negative linear correlation between the RDEM of concrete and the most probable pore size no matter how much FA is added in the FTC. At the microlevel, freeze–thaw damage affects the number of pores connected and the way water is transported.

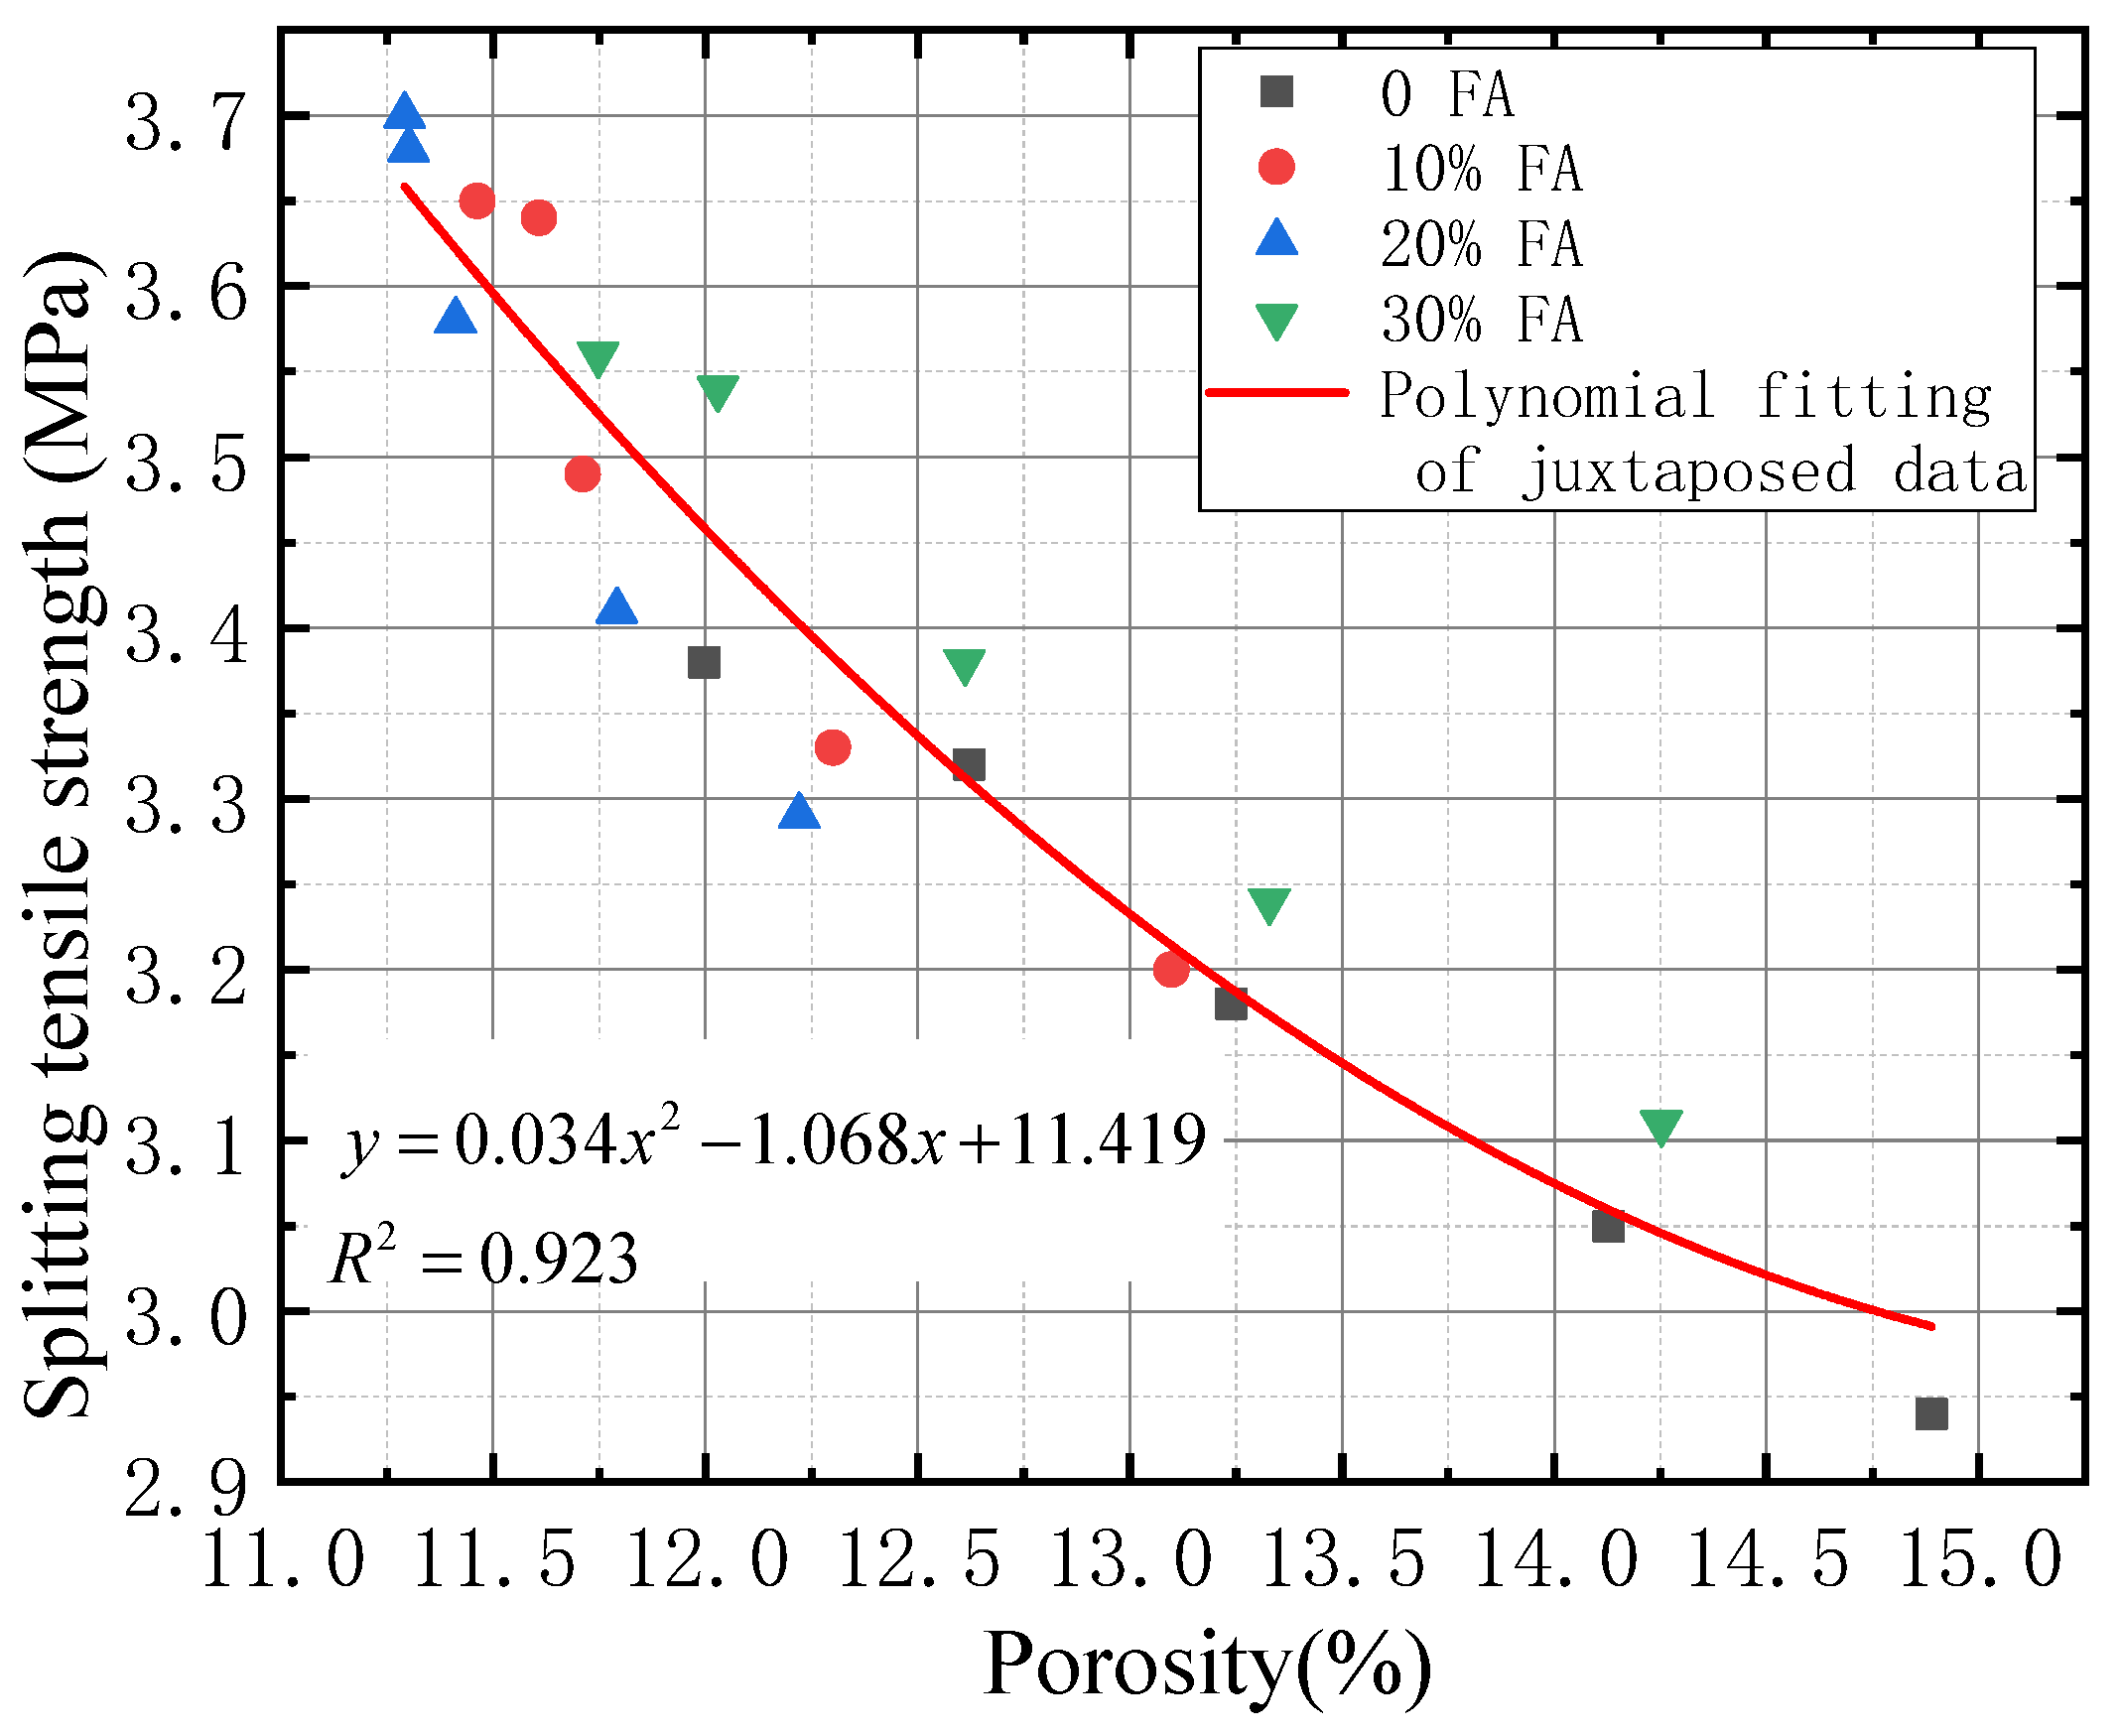
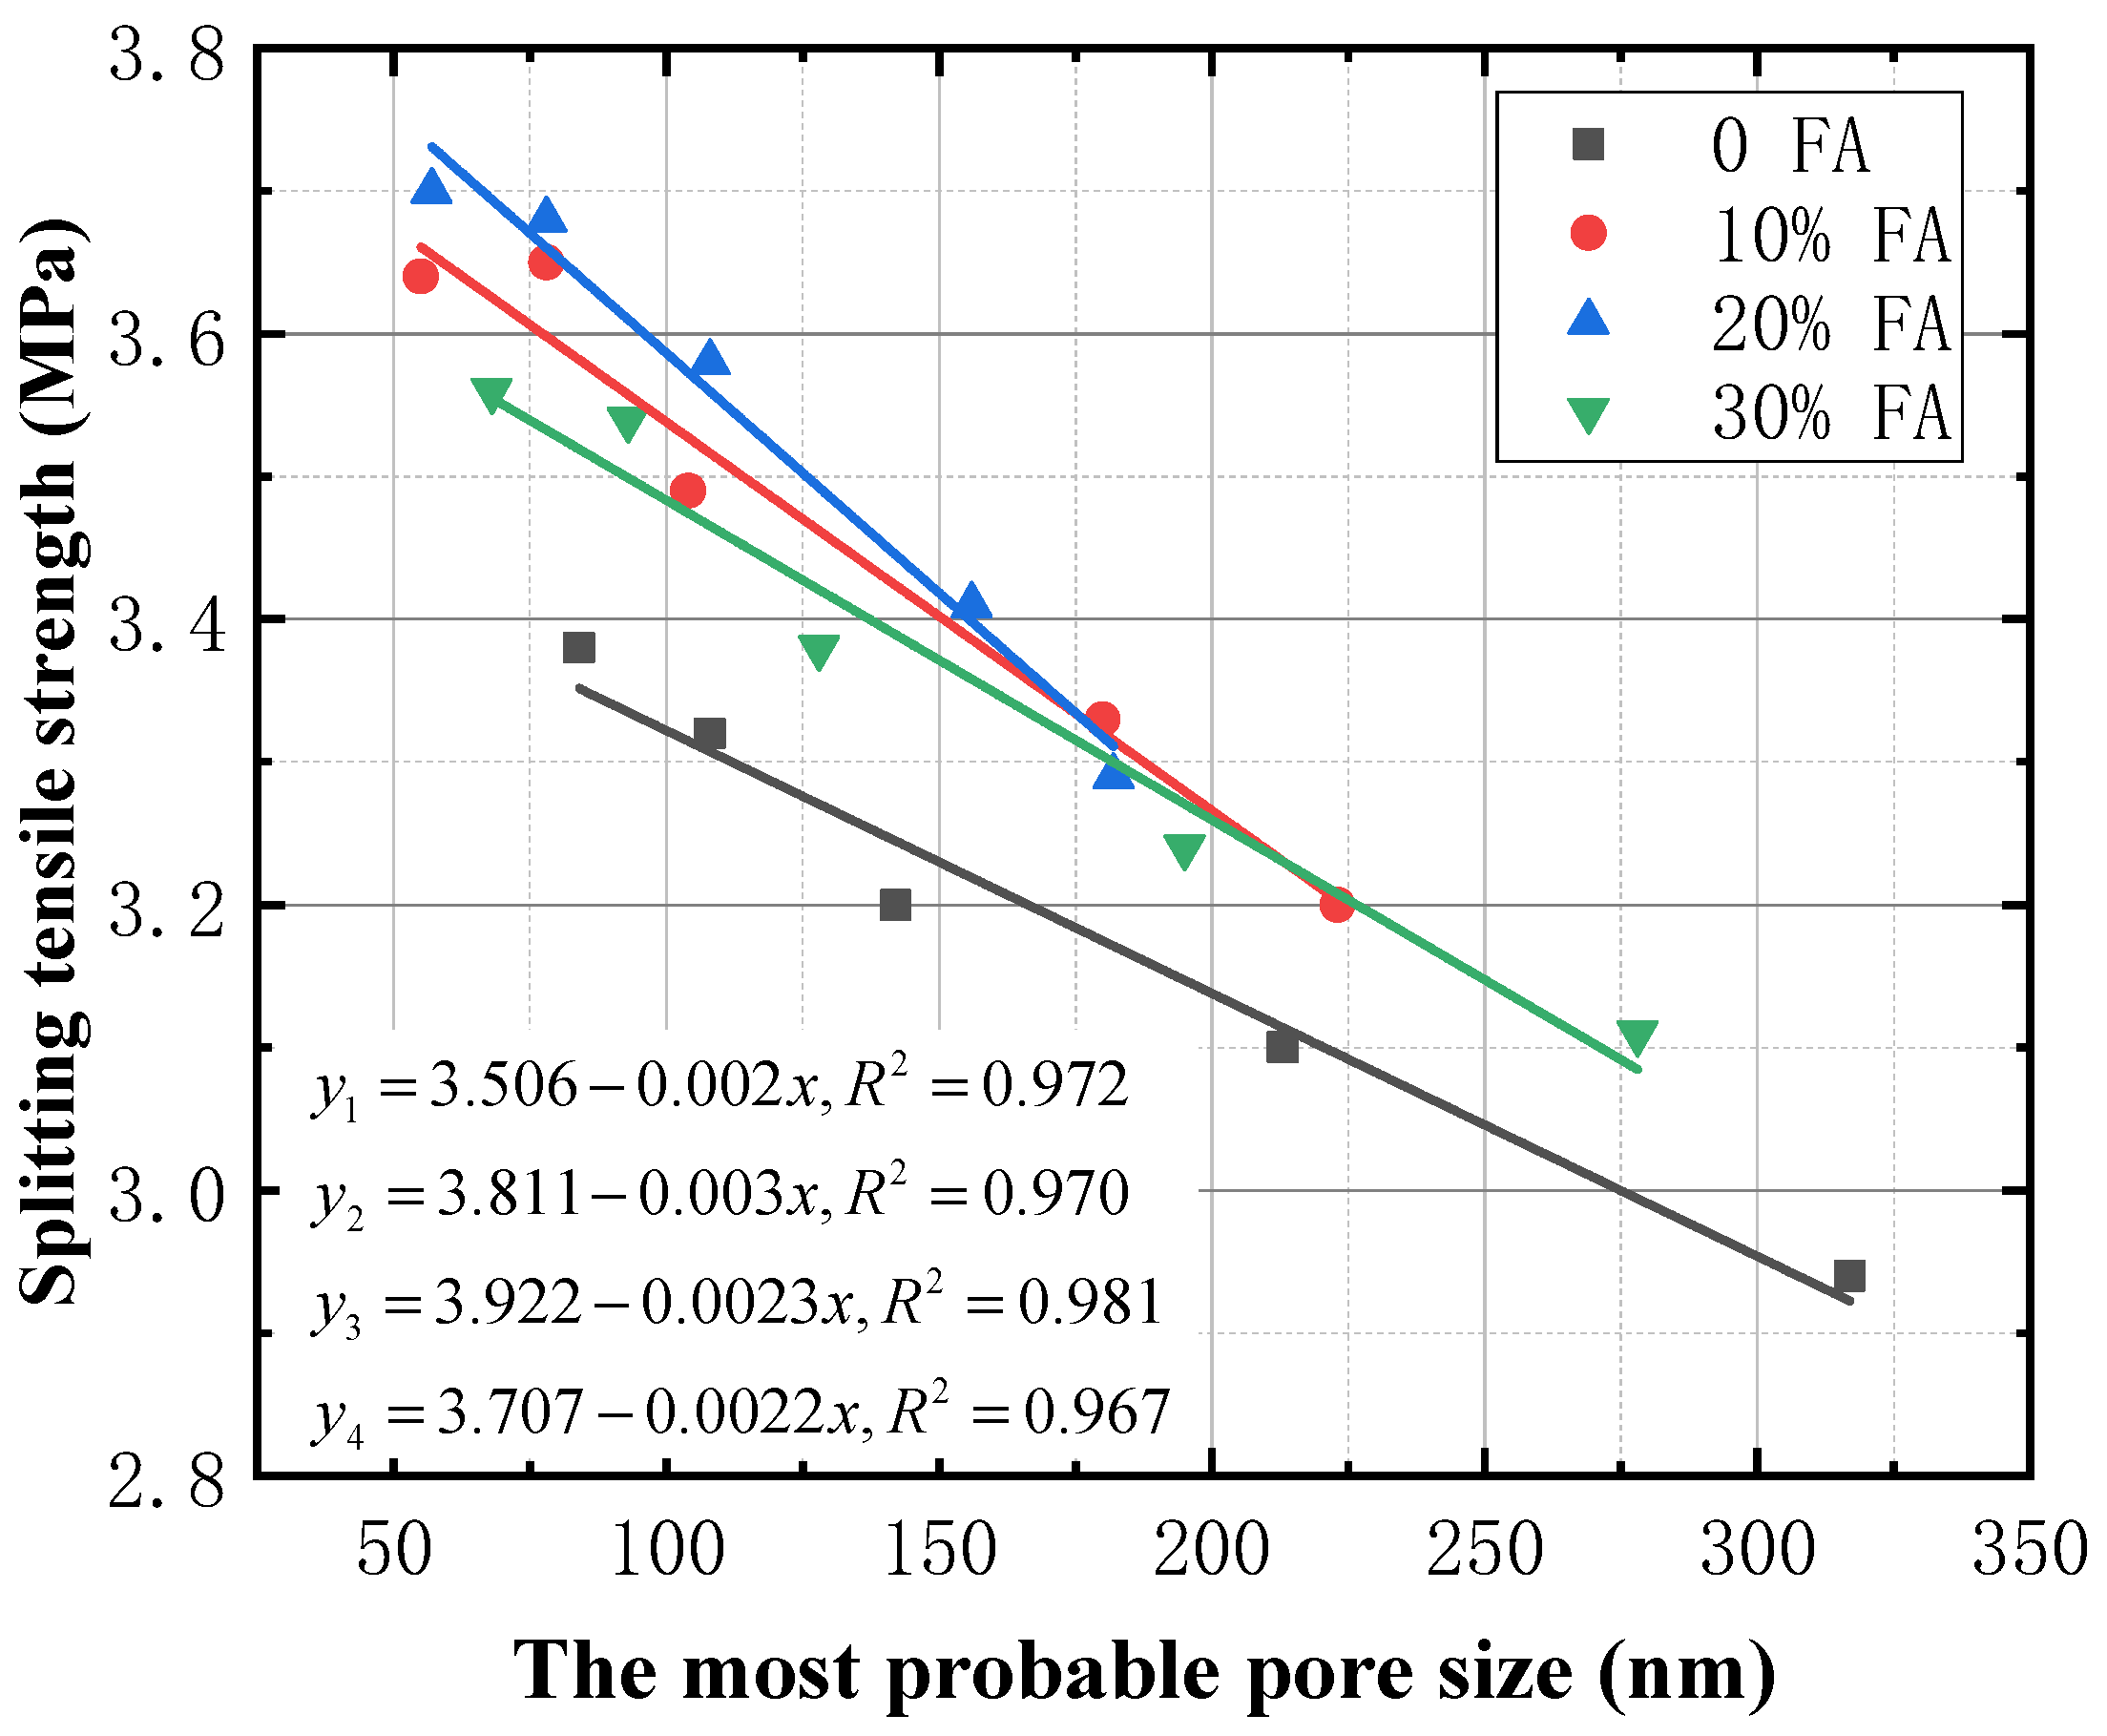
4.2. Relationship between Splitting Tensile Strength and Pore Structure

To study the effect of FTC on the splitting tensile strength of concrete, we investigated the relationship between splitting tensile strength and pore structure of specimens with different FA contents under FTC condition. The relationship between splitting tensile strength and the porosity of concrete under FTC is shown in Figure 13. In Figure 13 and the above formula, there is a nonlinear negative correlation between splitting tensile strength and porosity, regardless of FA content. As porosity increases, splitting tensile strength decreases. In microstructure analysis, increased porosity leads to more water transport channels and accelerated freeze–thaw damage.
The relationship between the splitting tensile strength of concrete blocks with different FA contents and the most probable pore size is shown in Figure 14. The figure illustrates that the relationship between the splitting strength and the most probable pore size is linear and negative in the FTC process. The splitting tensile strength decreases with the increase in the most probable pore size, which is due to the increase in internal microcracks and capillary pores after repeated FTC. Concrete microstructure distribution is affected by these pores and pore water migration is accelerated by them. Water becomes ice, and volume expansion causes tensile stress, resulting in new microcracks and thus reducing the strength.

4.3. Mechanism of the Effect of FA Content on the Mechanical Properties of Concrete

The relationship between the content of FA and splitting tensile strength and RDEM under FTC condition shows that the addition of FA improves the initial splitting tensile strength and frost resistance of concrete. The micro-morphology shows that the concrete with 20% FA content has a denser structure and fewer pores. According to the relationship between porosity and RDEM, the RDEM decreases with the increase in porosity. The relationship between porosity and splitting tensile strength shows that the splitting tensile strength decreases with the increase in porosity. The most probable pore size represents the largest pore in the porosity, so it reflects the porosity to a certain extent and affects RDEM and splitting tensile strength. This finding is proved by the linear negative correlation between the most probable size and RDEM and splitting tensile strength. The analysis results show that the addition of FA reduces the mass loss rate of concrete, RDEM, and porosity, and increases the splitting strength. The reason is that the pozzolanic activity of FA produces more hydrated calcium silicate gel, fills part of the pore space, improves the pore structure, reduces the migration of pore water, and enhances the freeze–thaw resistance of concrete. Given that the secondary hydration of FA needs cement hydration products as activators, when the content of FA is excessive, the amount of cement is very small. Consequently, hydration products of cement are very few, and the secondary reaction of FA slows down. The amount of hydrated calcium silicate gel produced is small, which is not enough to effectively fill the pores and spaces in the concrete that are beneficial to strength and durability; as a result, the internal structure of the concrete is loose, and finally the porosity of the concrete increases and the frost resistance decreases.

5. Conclusions

The relationship between the mechanical properties and microstructure of concrete with different FA contents under FTC was studied, and the influence mechanism of FA content on the frost resistance durability of concrete was revealed from macro to micro. On this basis, the relationship between RDEM, splitting tensile strength and pore structure of the face slab concrete with the studied mix ratio was obtained. The main conclusions are summarized as follows:
(1)
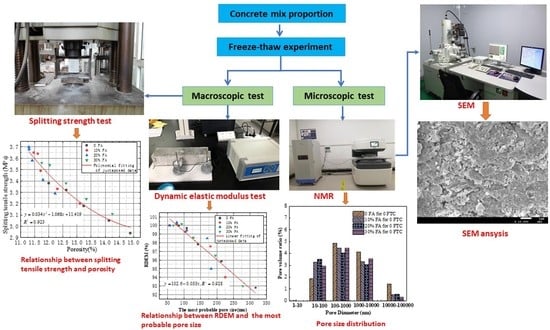
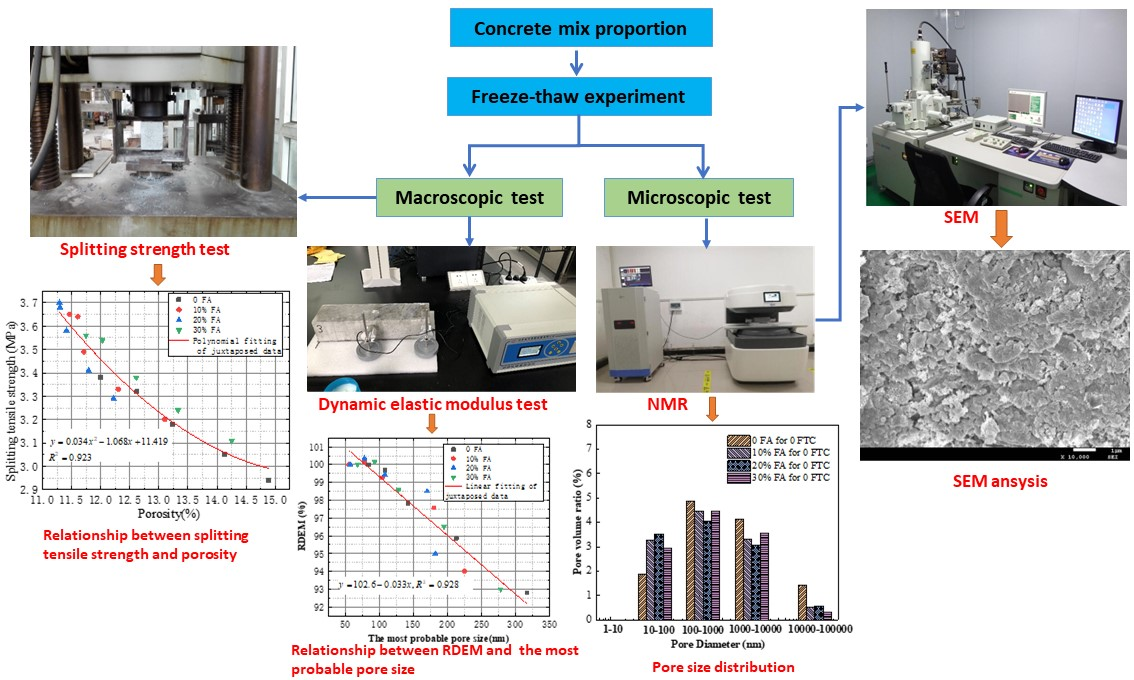
The effect of FA on the strength of concrete under freeze–thaw cycles mainly includes the changes in initial strength and frost resistance durability of concrete. After 100 FTCs, the splitting tensile strength of the test pieces with an FA content of 0, 10%, 20% and 30% are 2.94 MPa, 3.24 MPa, 3.47 MPa and 3.15 MPa, respectively. The splitting tensile strength of the concrete with an FA content of 20% is the highest, reflecting the best frost resistance.
(2)
The frost resistance of concrete is mainly affected by the content of pores with a pore diameter lower than 100 nm. The filling and secondary hydration of FA can improve the porosity and PSD of concrete to some extent, but excessive FA content will affect the secondary reaction and the formation of hydrated calcium silicate gel. 20% FA concrete has the lowest initial porosity, more pores below 100 nm, and more uniform pores, so it has the largest initial splitting tensile strength and the best frost resistance.
(3)
In the process of FTC, there is a nonlinear negative correlation between RDEM and porosity of concrete with different FA contents, and there is a linear negative correlation between the splitting strength and the most probable pore size. These relationships indicate that the strength of concrete under FTC is mainly controlled by porosity, and FA content affects the evolution of porosity during freeze–thaw cycles.
(4)
This study provides a certain reference for the improvement of initial strength and frost resistance of concrete in cold regions, and gives the suggested FA parameters, which can provide a new idea for concrete mix proportion design based on durability.

Author Contributions

Conceptualization, X.L.; Formal analysis, B.X.; Investigation, S.Z.; Methodology, B.C.; Project administration, S.Z.; Resources, X.L.; Writing—review & editing, B.T. All authors have read and agreed to the published version of the manuscript.

Funding

This work was financially supported by the National Natural Science Foundation of China (Nos. 51879145 and 52109158) and the Research Fund for Excellent Dissertation of the China Three Gorges University (2020BSPY012).

Data Availability Statement

Not applicable.

Conflicts of Interest

The authors declare no conflict of interest.

References

  1. Baykal, G.; Saygili, A. A New Technique to Improve Freeze-Thaw Durability of Fly Ash. Fuel 2012, 102, 221–226. [Google Scholar] [CrossRef]
  2. Mao, J.; Zhang, Z.; Liu, Z.; Sun, C. Damage Analysis of Concrete Subjected to Freeze-Thaw Cycles and Chloride Ion Erosion. Key Eng. Mater. 2012, 489, 464–467. [Google Scholar] [CrossRef]
  3. Li, Y.; Wang, R.; Zhao, Y. Effect of Coupled Deterioration by Freeze-Thaw Cycle and Carbonation on Concrete Produced with Coarse Recycled Concrete Aggregates. J. Ceram. Soc. Japan 2017, 125, 36–45. [Google Scholar] [CrossRef] [Green Version]
  4. Shang, H.; Yi, T. Freeze-Thaw Durability of Air-Entrained Concrete. Sci. World J. 2013, 2013, 650791. [Google Scholar] [CrossRef] [Green Version]
  5. Pigeon, M. Durability of Concrete in Cold Climates; CRC Press: Boca Raton, FL, USA, 1995. [Google Scholar] [CrossRef]
  6. Qin, X.; Meng, S.; Cao, D.; Tu, Y.; Sabourova, N.; Grip, N. Evaluation of Freeze-Thaw Damage on Concrete Material and Prestressed Concrete Specimens. Constr. Build. Mater. 2016, 125, 892–904. [Google Scholar] [CrossRef]
  7. Gooi, S.; Mousa, A.A.; Kong, D. A Critical Review and Gap Analysis on the Use of Coal Bottom Ash as a Substitute Constituent in Concrete. J. Clean. Prod. 2020, 268, 121752. [Google Scholar] [CrossRef]
  8. Li, Y.; Wang, R.; Li, S.; Zhao, Y.; Qin, Y. Resistance of Recycled Aggregate Concrete Containing Low- and High-Volume Fly Ash against the Combined Action of Freeze–Thaw Cycles and Sulfate Attack. Constr. Build. Mater. 2018, 166, 23–34. [Google Scholar] [CrossRef]
  9. Lu, X.C.; Guan, B.; Chen, B.F.; Zhang, X.; Xiong, B.B. The Effect of Freeze-Thaw Damage on Corrosion in Reinforced Concrete. Adv. Mater. Sci. Eng. 2021, 2021, 9924869. [Google Scholar] [CrossRef]
  10. Luo, Y.; Wu, Y.; Ma, S.; Zheng, S.; Zhang, Y.; Chu, P.K. Utilization of Coal Fly Ash in China: A Mini-Review on Challenges and Future Directions. Environ. Sci. Pollut. Res. 2021, 28, 18727–18740. [Google Scholar] [CrossRef]
  11. Yao, Z.T.; Ji, X.S.; Sarker, P.K.; Tang, J.H.; Ge, L.Q.; Xia, M.S.; Xi, Y.Q. A Comprehensive Review on the Applications of Coal Fly Ash. Earth-Sci. Rev. 2015, 141, 105–121. [Google Scholar] [CrossRef] [Green Version]
  12. Güllü, H.; Fedakar, H.İ. Use of Factorial Experimental Approach and Effect Size on the CBR Testing Results for the Usable Dosages of Wastewater Sludge Ash with Coarse-Grained Material. Eur. J. Environ. Civ. Eng. 2018, 22, 42–63. [Google Scholar] [CrossRef]
  13. Gao, Y.M.; Shim, H.S.; Hurt, R.H.; Suuberg, E.M.; Yang, N.Y.C. Effects of Carbon on Air Entrainment in Fly Ash Concrete: The Role of Soot and Carbon Black. Energy Fuels 1997, 11, 457–462. [Google Scholar] [CrossRef]
  14. Baert, G.; Poppe, A.; De Belie, N. Strength and Durability of High-Volume Fly Ash Concrete. Struct. Concr. 2008, 9, 101–108. [Google Scholar] [CrossRef]
  15. Topçu, I.B.; Canbaz, M. Effect of Different Fibers on the Mechanical Properties of Concrete Containing Fly Ash. Constr. Build. Mater. 2007, 21, 1486–1491. [Google Scholar] [CrossRef]
  16. Wang, R.; Zhang, Q.; Li, Y. Deterioration of Concrete under the Coupling Effects of Freeze–Thaw Cycles and Other Actions: A Review. Constr. Build. Mater. 2022, 319, 126045. [Google Scholar] [CrossRef]
  17. Benli, A.; Turk, K.; Kina, C. Influence of Silica Fume and Class F Fly Ash on Mechanical and Rheological Properties and Freeze-Thaw Durability of Self-Compacting Mortars. J. Cold Reg. Eng. 2018, 32, 2–9. [Google Scholar] [CrossRef]
  18. Islam, M.M.; Alam, M.T.; Islam, M.S. Effect of Fly Ash on Freeze–Thaw Durability of Concrete in Marine Environment. Aust. J. Struct. Eng. 2018, 19, 146–161. [Google Scholar] [CrossRef]
  19. Kadapure, S.A.; Kulkarni, G.S.; Prakash, K.B. Study on Properties of Bacteria-Embedded Fly Ash Concrete. Asian J. Civ. Eng. 2019, 20, 627–636. [Google Scholar] [CrossRef]
  20. Feng, Y.; Wang, D.; Li, J. Study on the Effect of Large Amount of Fly Ash on Frost Resistance of Concrete. Hans J. Civ. Eng. 2019, 8, 1039–10440. [Google Scholar] [CrossRef]
  21. Zhang, S.; Tian, B.; Chen, B.; Lu, X.; Xiong, B.; Shuang, N. The Influence of Freeze–Thaw Cycles and Corrosion on Reinforced Concrete and the Relationship between the Evolutions of the Microstructure and Mechanical Properties. Materials 2022, 15, 6215. [Google Scholar] [CrossRef]
  22. Liu, L.; Shen, D.; Chen, H.; Sun, W.; Qian, Z.; Zhao, H.; Jiang, J. Analysis of Damage Development in Cement Paste Due to Ice Nucleation at Different Temperatures. Cem. Concr. Compos. 2014, 53, 1–9. [Google Scholar] [CrossRef]
  23. Modarres, C.; Astorga, N.; Droguett, E.L.; Meruane, V. Convolutional Neural Networks for Automated Damage Recognition and Damage Type Identification. Struct. Control Health Monit. 2018, 25, e2230. [Google Scholar] [CrossRef]
  24. Li, W.Z.; Shi, J.Z.S. Development of Microscopic Structure of Concrete Exposed to Freeze-Thaw Cycles. WANFANG Data 2012, 1, 13–14. [Google Scholar] [CrossRef]
  25. Wang, R.; Hu, Z.; Li, Y.; Wang, K.; Zhang, H. Review on the Deterioration and Approaches to Enhance the Durability of Concrete in the Freeze–Thaw Environment. Constr. Build. Mater. 2022, 321, 126371. [Google Scholar] [CrossRef]
  26. Zhou, K.P.; Li, B.; Li, J.L.; Deng, H.W.; Bin, F. Microscopic Damage and Dynamic Mechanical Properties of Rock under Freeze-Thaw Environment. Trans. Nonferrous Met. Soc. China (Engl. Ed.) 2015, 25, 1254–1261. [Google Scholar] [CrossRef]
  27. Li, J.-I.; Zhou, K.-P.; Liu, W.-J.; Deng, H.-W. NMR Research on Deterioration Characteristics of Microscopic Structure of Sandstones in Freeze–Thaw Cycles. Trans. Nonferrous Met. Soc. China (Engl. Ed.) 2016, 26, 2997–3003. [Google Scholar] [CrossRef]
  28. Wang, X.X.; Shen, X.D.; Wang, H.L.; Zhao, H.X. Nuclear Magnetic Resonance Analysis of Air Entraining Natural Pumice Concrete Freeze-Thaw Damage. Adv. Mater. Res. 2014, 919–921, 1939–1943. [Google Scholar] [CrossRef]
  29. DL/T 5016-1999; Design Code for Concrete Face Rockfill Dams. China Renewable Energy Engineering Institute: Beijing, China, 1999.
  30. GB/T 50082-2009; Standard for Test Methods of Long-Term Performance and Durability of Ordinary Concrete. Ministry of Construction of the People’s Republic of China: Beijing, China, 2009. (In Chinese)
  31. Shang, H.; Song, Y.; Ou, J. Behavior of Air-Entrained Concrete after Freeze-Thaw Cycles. Acta Mech. Solida Sin. 2009, 22, 261–266. [Google Scholar] [CrossRef]
  32. Wang, X.; Shen, X.; Wang, H.; Gao, C.; Zhang, T. Nuclear Magnetic Resonance Analysis of Freeze-Thaw Damage in Natural Pumice Concrete. Mater. Constr. 2016, 66, e087. [Google Scholar] [CrossRef]
  33. Gran, H.C.; Hansen, E.W. Effects of Drying and Freeze/Thaw Cycling Probed by 1H-NMR. Cem. Concr. Res. 1997, 27, 1319–1331. [Google Scholar] [CrossRef]
  34. Yao, X.; Zhang, M.; Guan, J.; Li, L.; Bai, W.; Liu, Z. Research on the Corrosion Damage Mechanism of Concrete in Two Freeze-Thaw Environments. Adv. Civ. Eng. 2020, 2020, 8839386. [Google Scholar] [CrossRef]
  35. Wang, Y.; Liu, Z.; Fu, K.; Li, Q.; Wang, Y. Experimental Studies on the Chloride Ion Permeability of Concrete Considering the Effect of Freeze–Thaw Damage. Constr. Build. Mater. 2020, 236, 117556. [Google Scholar] [CrossRef]
  36. Zhang, W.; Pi, Y.; Kong, W.; Zhang, Y.; Wu, P.; Zeng, W. Influence of Damage Degree on the Degradation of Concrete under Freezing-Thawing Cycles. Constr. Build. Mater. 2020, 260, 119903. [Google Scholar] [CrossRef]
  37. Yang, D. Influence of Fly Ash Content and Fineness on Concrete Strength. Bulk Cem. 2019, 4, 88–100. [Google Scholar]
  38. Fu, Y.; Cai, L.; Yonggen, W. Freeze-Thaw Cycle Test and Damage Mechanics Models of Alkali-Activated Slag Concrete. Constr. Build. Mater. 2011, 25, 3144–3148. [Google Scholar] [CrossRef]
  39. Fa-Ming, L.; Chuan-Qing, F. Influence of Freeze-Thaw Cycle on SFRC with Different Fly Ash Mixing. In Proceedings of the 2011 International Conference on Electric Technology and Civil Engineering (ICETCE), Lushan, China, 22–24 April 2011; pp. 1310–1313. [Google Scholar] [CrossRef]
  40. Powers, T.C. Absorption of Water by Portland Cement Paste during the Hardening Process. Ind. Eng. Chem. Res. 1935, 27, 790–794. [Google Scholar] [CrossRef]
  41. Xiao, S.; Zhu, L. Study on Effects of Voids on Macro-Mechanical Properties of Concrete. Shenyang Jianzhu Daxue Xuebao (Ziran Kexue Ban)/J. Shenyang Jianzhu Univ. (Nat. Sci.) 2016, 32, 608–618. [Google Scholar] [CrossRef]
  42. Fan, Y.N.; Du, H.X.; Shi, L.N. The Fractal Characteristics of C80 High Performance Concrete Pore Structure Subject to High Temperatures. IOP Conf. Ser. Earth Environ. Sci. 2020, 510, 052016. [Google Scholar] [CrossRef]
Figure 1. Flow diagram of the experiment.
Buildings 12 02113 g001
Figure 2. Sampling flowchart.
Buildings 12 02113 g002
Figure 3. Surface of the concrete after 50 and 100 FTCs: (a) 0 FA for 50 FTCs, (b) 10% FA for 50 FTCs, (c) 20% FA for 50 FTCs, (d) 30% FA for 50 FTCs, (e) 0 FA for 100 FTCs, (f) 10% FA for 100 FTCs, (g) 20% FA for 100 FTCs, (h) 30% FA for 100 FTCs.
Buildings 12 02113 g003
Figure 4. Mass loss rate of concrete specimens.
Buildings 12 02113 g004
Figure 5. RDEM of concrete specimens.
Buildings 12 02113 g005
Figure 6. Splitting tensile strength of concrete.
Buildings 12 02113 g006
Figure 7. Microstructure of concrete in different solutions after 0 and 100 FTCs: (a) 0 FA for 0 FTCs, (b) 0 FA for 1000 FTCs, (c) 10% FA for 0 FTCs, (d) 10%0 FA for 100 FTCs, (e) 20% FA for 0 FTCs, (f) 20% FA for 100 FTCs, (g) 30% FA for 0 FTCs, (h) 30% FA for 100 FTCs.
Buildings 12 02113 g007
Figure 8. Porosity of concrete with different FA contents.
Buildings 12 02113 g008
Figure 9. Pore size distribution under 0 FTC.
Buildings 12 02113 g009
Figure 10. Pore size distribution under 100 FTCs.
Buildings 12 02113 g010
Figure 11. Relation between RDEM and porosity.
Buildings 12 02113 g011
Figure 12. Relationship between RDEM and the most probable pore size.
Buildings 12 02113 g012
Figure 13. Relationship between splitting tensile strength and porosity.
Buildings 12 02113 g013
Figure 14. Relationship between splitting tensile strength and the most probable pore size.
Buildings 12 02113 g014
Table 1. Design of mix proportion and numbering of the concrete specimens (in kilograms per cubic meter).
CementFASandStoneWaterDosage of FAWater-Reducing AgentAir-Entraining Agent
340055312911360%1%0.02%
30634553129113610%1%0.02%
27268553129113620%1%0.02%
238102553129113630%1%0.02%
Publisher’s Note: MDPI stays neutral with regard to jurisdictional claims in published maps and institutional affiliations.

