1. Introduction
Subway projects are an important way to solve urban traffic problems. However, the energy consumption of a subway is staggering [
1,
2], most of which is generated by ventilation and air conditioning systems [
3,
4]. The proposal of the adjustable ventilation platform door system realizes the effective utilization of piston wind [
5,
6,
7]. The subway station tested in this study uses adjustable ventilation platform doors. The energy consumption of stations’ mechanical ventilation can be greatly reduced by using piston wind in transitional seasons (i.e., non-air-conditioning seasons) [
8,
9,
10,
11].
However, the piston wind contains particles. Cross et al. [
12] and Izadi et al. [
13] noted that the normal operation of trains in subway stations and tunnels can produce a certain amount of particles. Passengers may be exposed to high concentrations of particulate matter while waiting on the platform [
14]. PM2.5 is more harmful to human health [
15,
16]. Pan et al. [
17] analyzed and interpreted the concentrations of PM10 and PM2.5 at subway stations in Beijing. They found that the outdoor environment was the main source of the PM10 and PM2.5 in the subway. Huang et al. [
18] and Zhao et al. [
19] showed that the most abundant element in the PM2.5 was Fe (iron). Passi et al. [
20] presented a comprehensive review of different types of air pollutants, and they observed that compared to the outdoor environments, resuspension of particulate matter was another significant cause of the continued higher concentration levels of particulate matter in subway air. He et al. [
21] found that particulate matter concentrations on the platform nearer to the station entrance were greater than those in the middle of the platform. The effect of the PM2.5 concentration carried in the train-induced unsteady airflow on the indoor PM2.5 concentration is worth exploring. However, previous studies have lacked the description of the variation in PM2.5 concentration in this unstable airflow with the movement of trains.
Many studies [
5,
6,
9,
10,
11,
22] have shown that the piston wind volume entering a subway station in transitional seasons can meet the ventilation demand of the station. However, the train-induced unsteady airflow is unevenly distributed [
6,
23,
24] and causes discomfort to passengers [
25,
26,
27]. Izadi et al. [
28] showed that natural ventilation in subways could be significantly affected by the piston wind. Air curtains were used to reduce the influence of the piston effect in the station [
29].
The above studies showed that the volume of the piston wind entering the station could meet the ventilation volume requirements of the station. However, the piston wind carried the particles from the tunnels to the subway platforms, causing discomfort to passengers. The above studies provide some measurements; however, two problems still need to be solved: First, the variation in the PM2.5 concentration in piston wind with the movement of trains is still unclear. Moreover, this study was carried out at the Zhangmatun subway station in Jinan, China. The high groundwater level in Jinan leads to high air humidity in the tunnels, and the variation in the PM2.5 concentration in the piston wind may be different from that in other regions. Second, there is a lack of analysis of air velocity distribution at the controllable vents. The uneven distribution of airflow causes discomfort to passengers.
In the present study, a field test of piston wind velocity and PM2.5 concentration was performed at the Zhangmatun standard island subway station. The variations in PM2.5 concentration were discussed and analyzed, and the distribution of air velocity was determined. An improvement measure for the uniform distribution of the air volume at the controllable vents was proposed and verified by numerical calculation.
2. Field Test
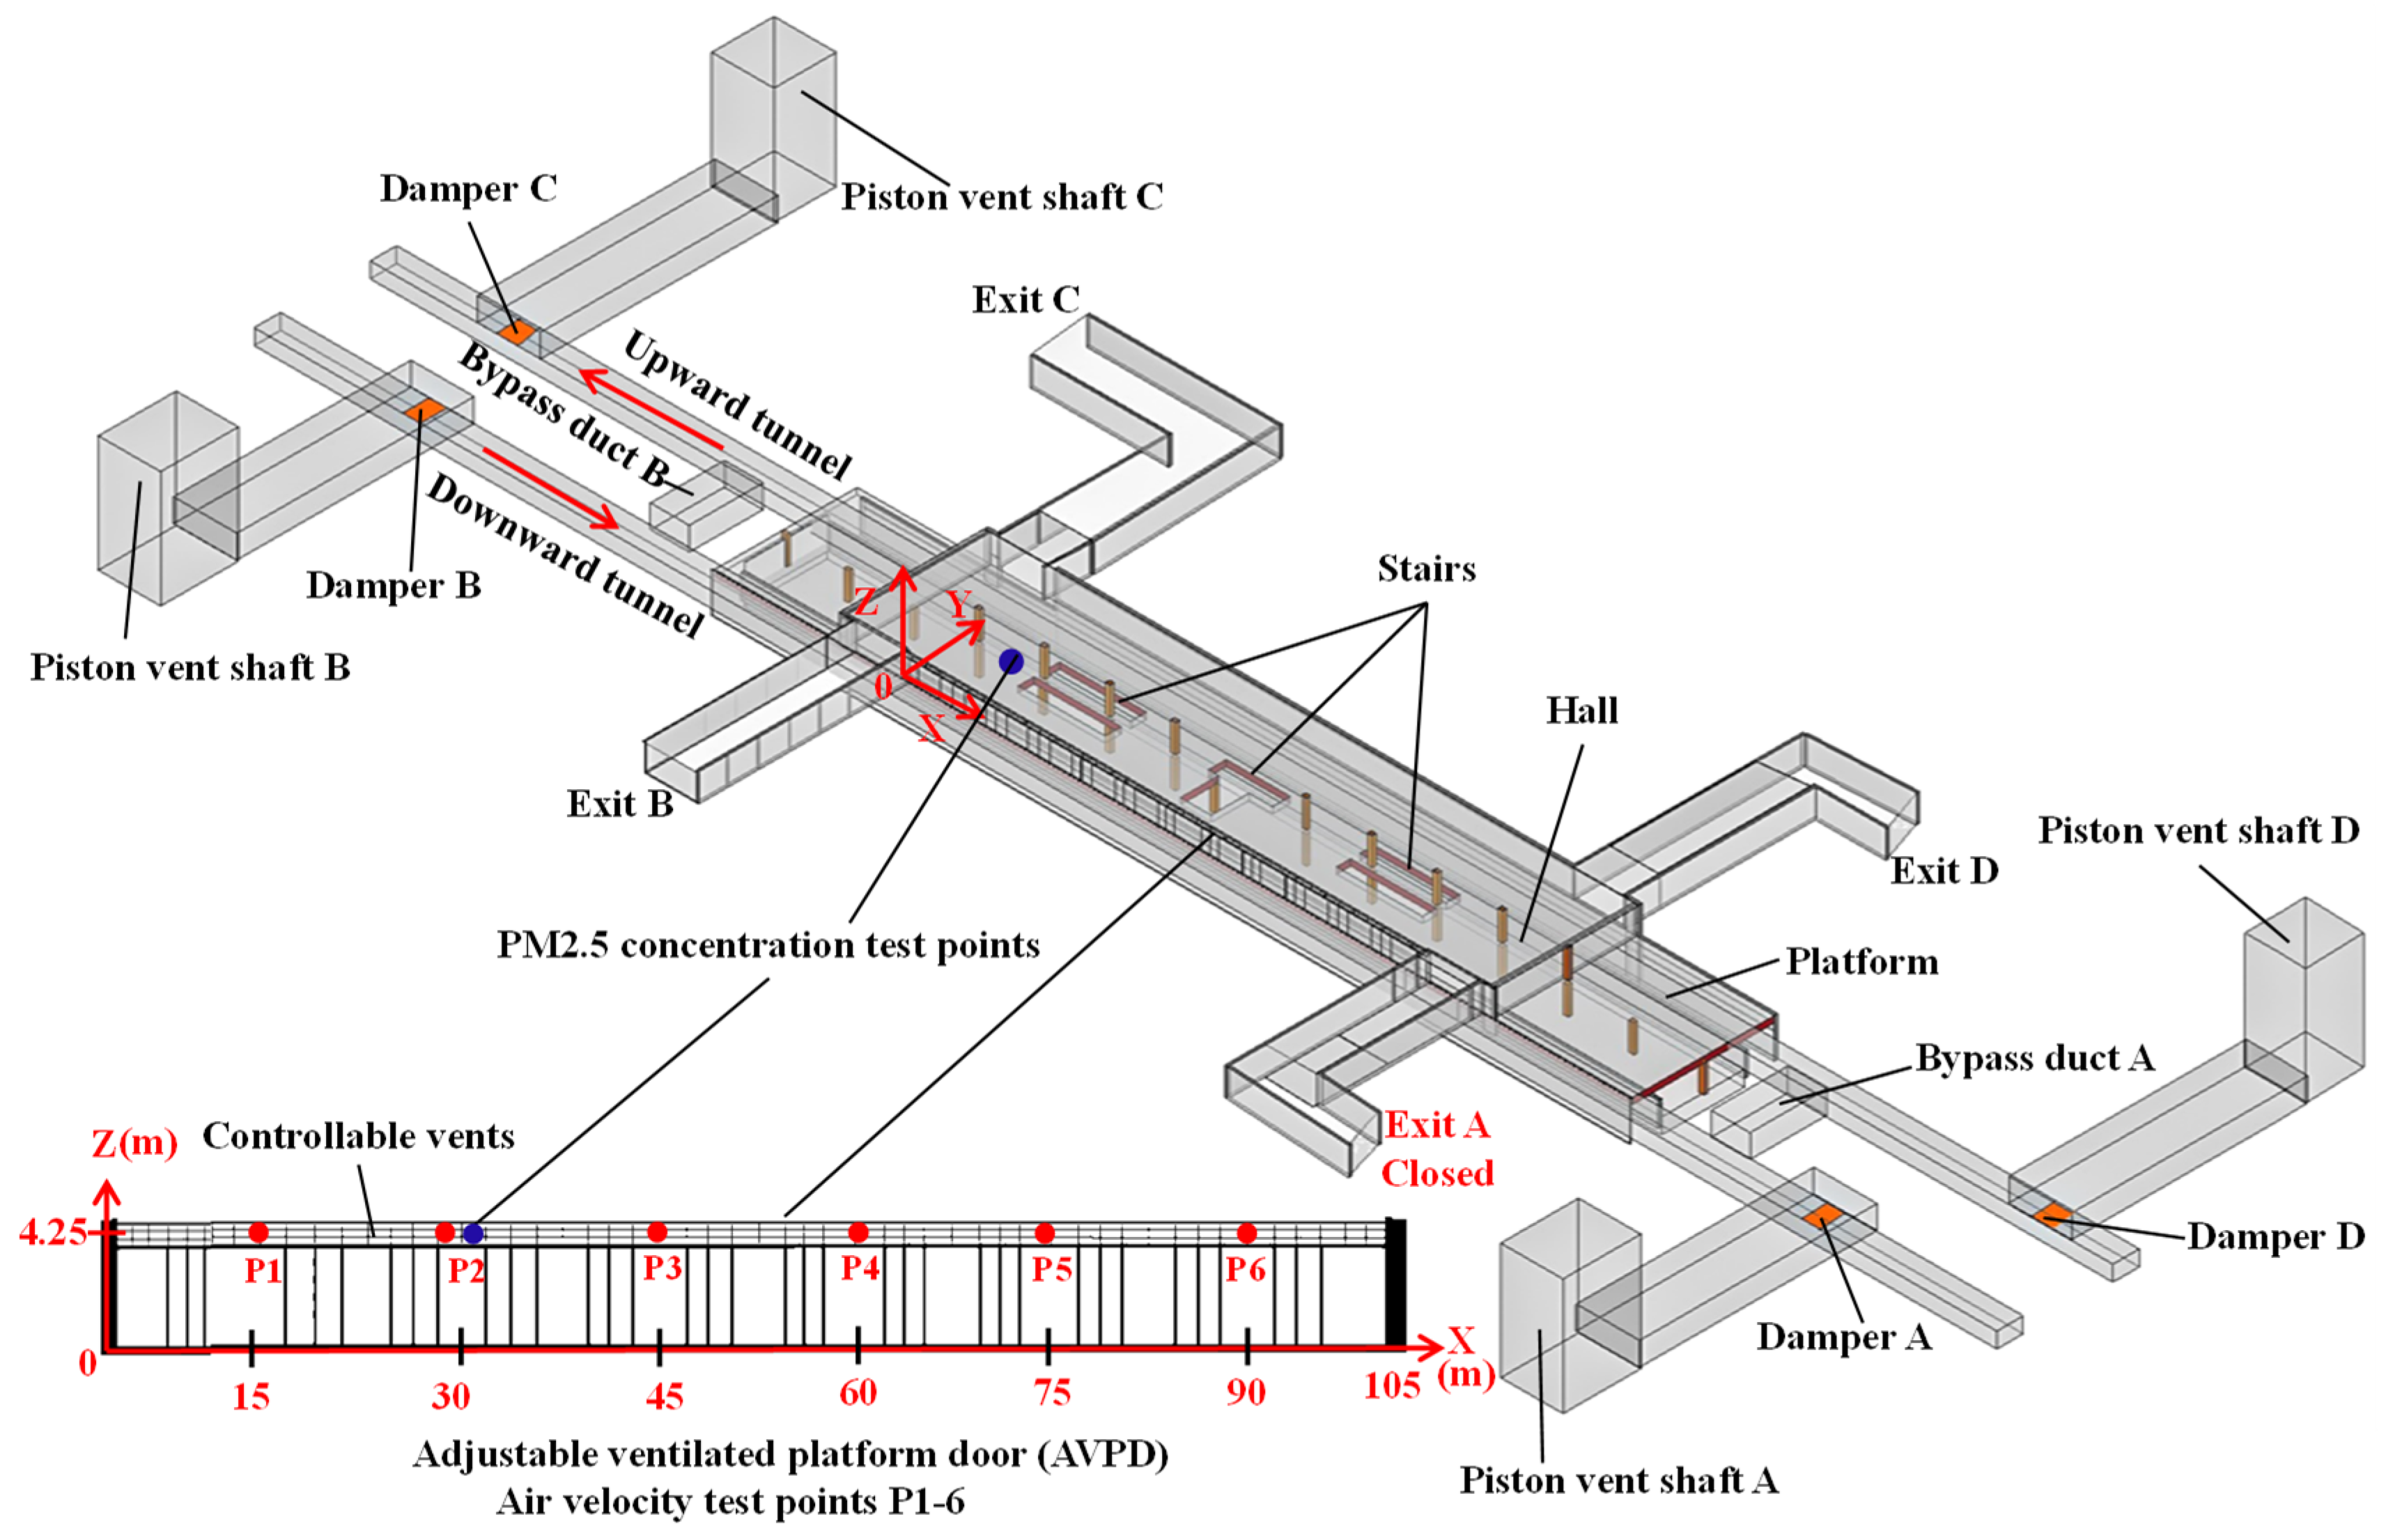
2.1. Tested Subway Station
On 17 October 2021, field tests were performed at the Zhangmatun subway station. A schematic of the station’s structure is shown in
Figure 1.
Table 1 shows the detailed geometric parameters of the Zhangmatun subway station. Exit A was closed due to ground construction. All piston air shafts were open and all bypass ducts were closed during the field tests.
During the field tests, the controllable vents of the upward line were closed. Therefore, the train schedule of the upward line was not considered. The train interval is about 460–500 s, and the train stays at the station for about 40–60 s. The maximum speed of the train is approximately 100 km/h. The uniform speed is 80–90 km/h. As the train drives into the station, it starts to slow down at around 300 m away from the station.
2.2. Test Instrument
The air velocity and PM2.5 concentration were recorded. Mechanical ventilation was not turned on during the tests. Air velocities were recorded using hot-wire anemometers. DustTrak monitors were used to record PM2.5 concentrations at the platform and the controllable vent. All devices were calibrated before the tests. The sampling interval of the air velocity and PM2.5 concentration monitoring instruments was 1 s. Details of the instruments are listed in
Table 2.
2.3. Test Point Arrangement
Six air velocity test points (P1–P6) were uniformly arranged at the controllable vents of the downward line, as shown in
Figure 1. In order to avoid affecting the normal operation of the subway station, the air velocity test instruments were installed above the fixed doors. To reduce the influence of vortices, each air velocity test instrument was situated 4.25 m above the platform floor (
Figure 2a). According to Li et al. [
6], the air velocities at measuring points P1-P3 were relatively high. In order to determine the relationship between PM2.5 concentration and air velocity, one of the measuring points was selected to set up a measuring point of PM2.5 concentration. In this study, one DustTrak monitor was located near test point P2 to record the PM2.5 concentration at the vents, as shown in
Figure 1 and
Figure 2a. The other DustTrak monitor was located in the passenger waiting area on the platform, as shown in
Figure 1 and
Figure 2b. The height of the PM2.5 concentration test point on the platform was approximately at the position of the breathing zone of a standing adult passenger.
3. Analysis of Test Results
3.1. Analysis of PM2.5 Concentration
Through the tests, the variations in PM2.5 concentration at the controllable vent of test point P2 and on the platform were determined. In this study, the variations in PM2.5 concentration for approximately 2000 s from 15:00 to 15:33 were measured, as shown in
Figure 3. The variation in air velocity at test point P2 for the same period is also given.
As shown in
Figure 3, the variations in PM2.5 concentration were periodic with the variation in air velocity. Each cycle was a train interval (ΔT) of approximately 460–500 s. The PM2.5 concentrations rose with the increase in air velocity. This means that the train-induced unsteady airflow carried the particles into the station. This finding is consistent with those of Cross et al. [
12] and Izadi et al. [
13]. The PM2.5 concentrations at the vent and platform were positively correlated with the air velocity. According to the ambient air quality standard GB3095-2012 [
30], the daily average concentration of PM2.5 should be less than 0.075 mg/m
3. The maximum concentration of PM2.5 on the platform was 0.067 mg/m
3, and the average value of PM2.5 was 0.037 mg/m
3. The maximum concentration of PM2.5 in piston wind was 0.057 mg/m
3, and the average value of PM2.5 was 0.028 mg/m
3. All values were lower than the limit value of 0.075 mg/m
3 (GB3095-2012) [
30].
The PM2.5 concentration at the platform was higher than that at the controllable vents. The average ratio of the PM2.5 concentration in the piston wind to the PM2.5 concentration on the platform was 71.15%. The PM2.5 concentration at the platform may also be affected by factors such as the PM2.5 concentration in the outdoor air and the PM2.5 carried by passengers [
21]. In this study, a field test was conducted at the time when the outdoor PM2.5 concentration was relatively low and the number of passengers was small. If the outdoor PM2.5 concentration was high, or if the experiment was performed during rush hour, the PM2.5 concentration of the subway station would rise. The PM2.5 concentration of the subway station was continuously monitored to determine the main influencing factors. Moreover, platform doors may play an essential role in the spread and dynamic distribution of PM2.5 [
5,
18]. Thus, relevant investigation will be needed to consider the condition of platform doors (i.e., open/closed).
3.2. Analysis of the Air Velocity Distribution at Controllable Vents
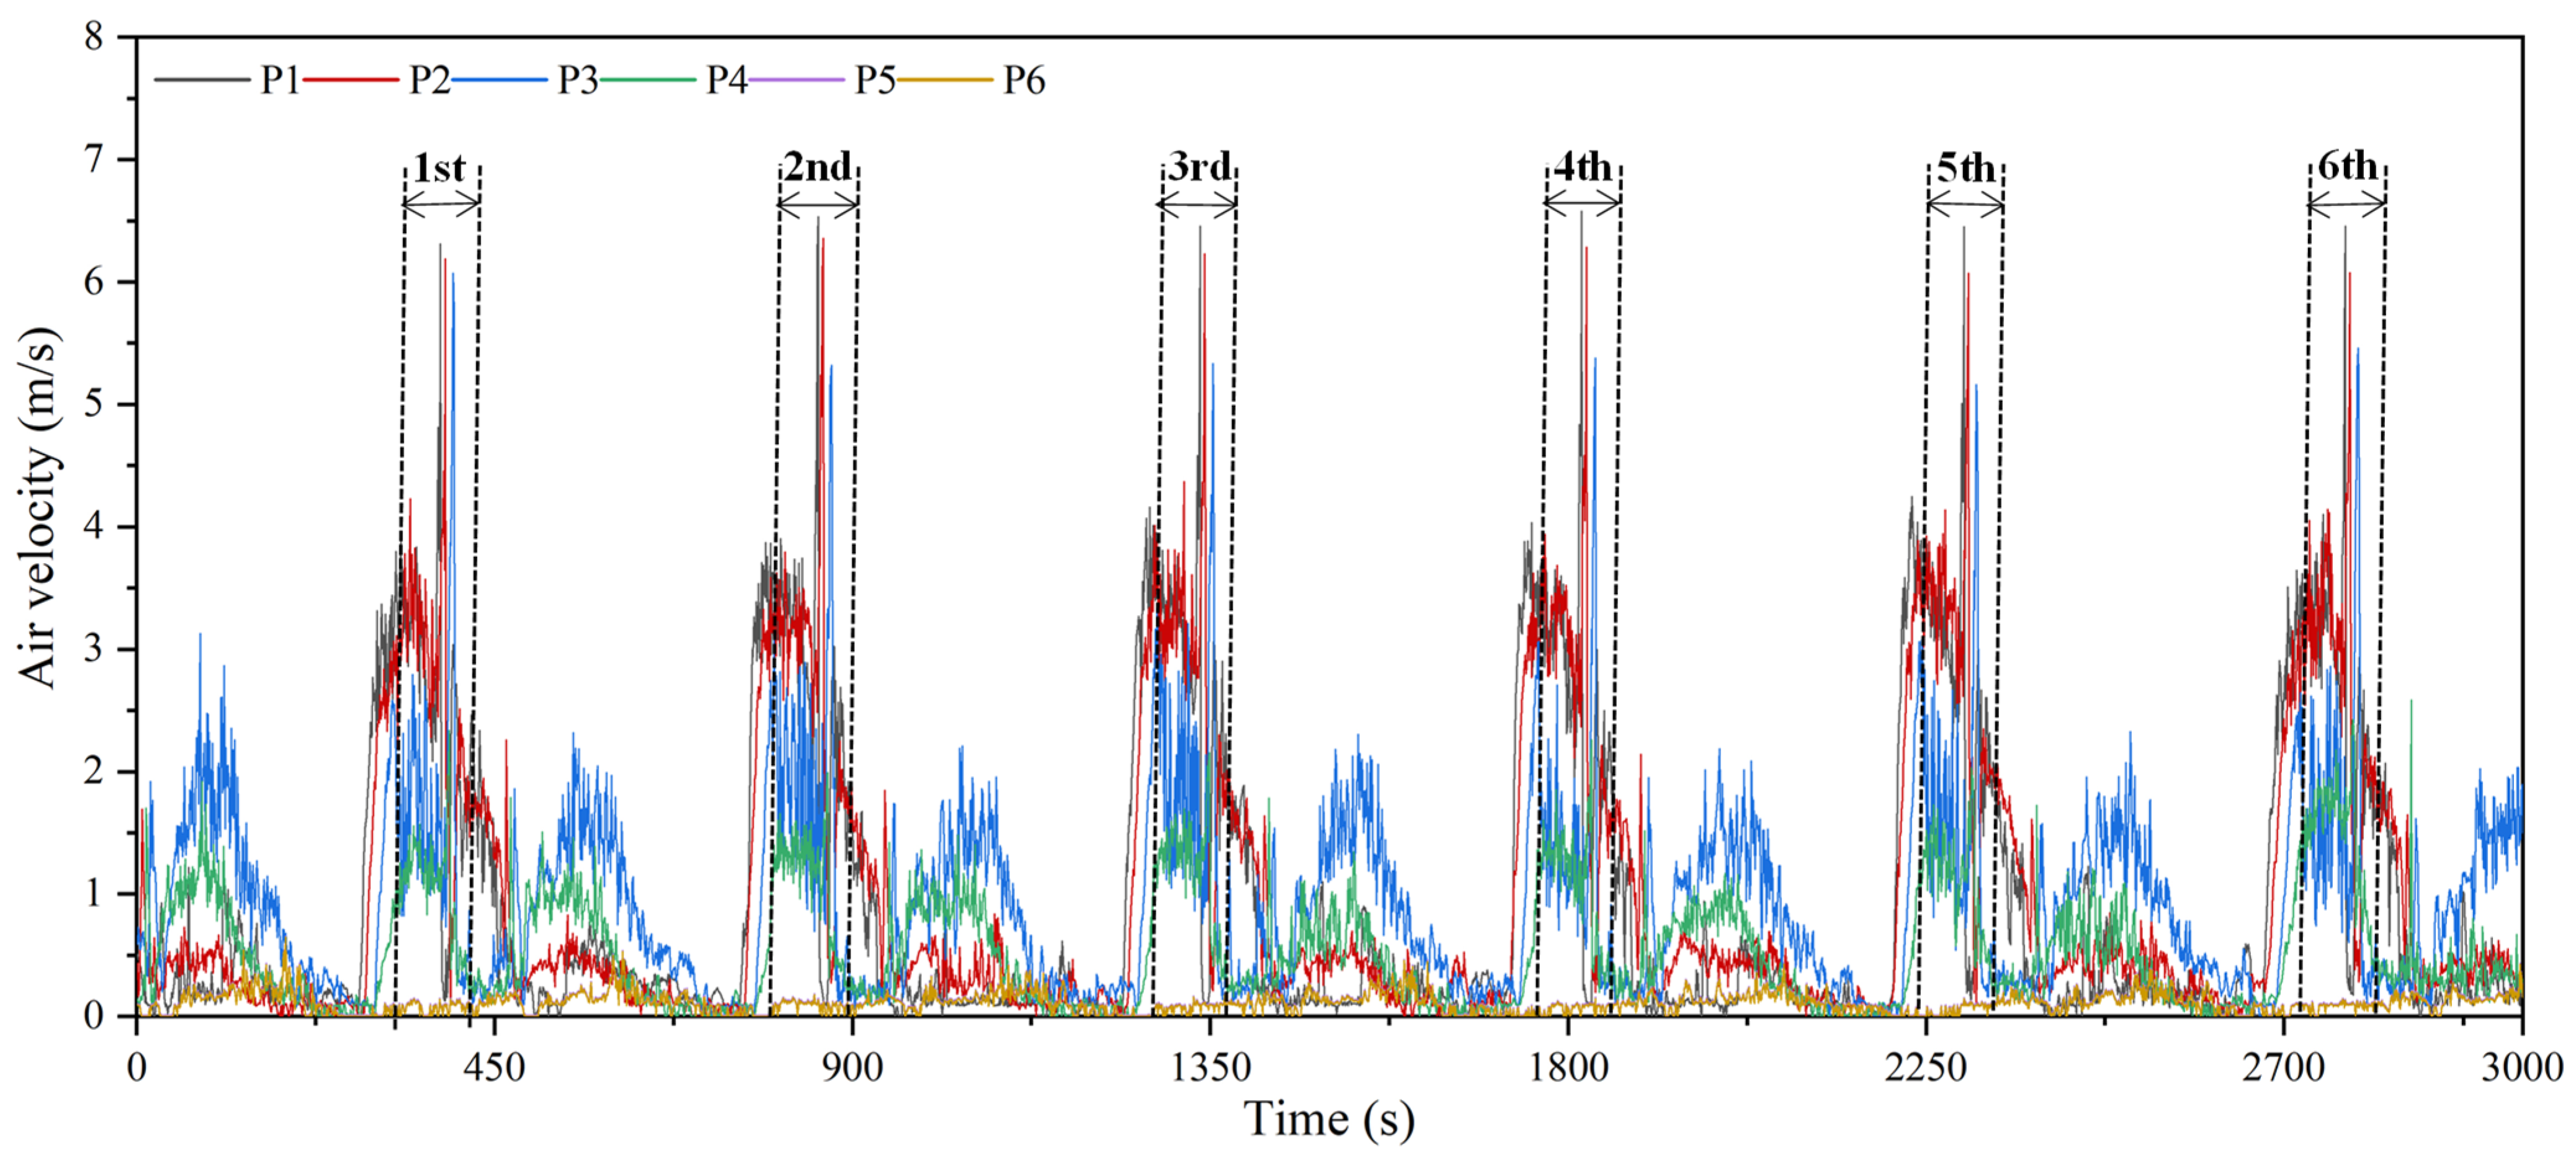
Variations in air velocity over approximately 3000 s from 15:03 to 15:53 were selected for analysis, as shown in
Figure 4.
As shown in
Figure 4, the variations in air velocity were periodic. Each cycle was a train interval (ΔT). There were minimal differences in the air velocities between six cycles. However, the air velocities of the controllable vents at different positions at the same time were different. The highest air velocities at the controllable vents in each cycle occurred as the train was about to arrive and had just stopped at the station. In each cycle, this process lasted approximately 90–100 s (refer to the 1st–6th percentiles in
Figure 4). Li et al. [
6], Zhang et al. [
9], and Zhang et al. [
24] also focused on the air velocity variations in this process and noted that the piston air volume occurring in this process accounts for most of the ventilation volume of a station. However, they did not pay attention to the air velocity distribution in this process. The distribution of the air velocity at the controllable vents directly affects the air distribution in the subway station. Therefore, in this study, the average air velocity at each vent in the period corresponding to the 1st–6th percentiles in
Figure 4 was measured. Then, the air velocity distribution at the controllable vents in the length direction of the platform in each cycle was determined, as shown in
Figure 5.
As shown in
Figure 5, the air velocity at the same controllable vents exhibited small differences in each cycle, which may be attributed to the differences in the running speeds of different trains. The air velocity distribution in these six cycles was consistent. Along the direction of the train entering the station, the air velocity showed a steep decreasing trend. The air velocity distribution was very uneven. The air velocities of the controllable vents located in the ranges of 0–45 m and 45–60 m were greater than 2 m/s and in the range of 1–2 m/s, respectively. The air velocities of the controllable vents located beyond 60 m and beyond 75 m were less than 1 m/s and less than 0.2 m/s, respectively.
The air velocities at the same controllable vents in six cycles were averaged, and the distribution of the average air velocity was obtained, as shown in
Figure 5. The statistical analysis shows that the air velocities at different positions on the platform of the 1st–6th percentiles conform to logistic regression, as shown in Equation (1):
where:
v—Air velocity at the controllable vent, m/s;
x—Location of the controllable vent, m (note that the position of the first controllable vent passed by the train entering the station is considered 0 m in this study).
The opening area of each controllable vent on the platform is identical. However, the air velocities at different positions vary greatly. As a result, the distribution of piston air volume over the length of the platform is also uneven. This uneven piston air volume distribution on the platform is not conducive to the airflow distribution of the station—especially to the airflow at the end of the platform.
3.3. Piston Air Volume Adjustment Method
In an actual project, the controllable vents on the adjustable ventilation platform door are spliced by vent units of the same size. To ensure that the airflow rate at each controllable vent is identical, the airflow rate of each controllable vent can be calculated by Equation (2):
where:
QN—Airflow rate of each controllable vent, m3/s;
L—Total length of controllable vents on platform doors, m;
h—Height of the controllable vent, m;
N—Number of controllable vents.
To ensure an identical airflow rate at each controllable vent, the opening area of each controllable vent can be adjusted. To ensure the distribution of the piston airflow in the length direction of the platform, only the opening heights of the controllable vents were adjusted in this study. According to the air velocity and the average airflow rate of the controllable vents, the areas of the controllable vents at different positions can be calculated by Equation (3):
The opening heights of the controllable vents at different positions can be calculated by Equation (4):
where:
—Area of the controllable vent at x m, m2;
l—Length of a controllable vent, m;
—Opening height of the controllable vent at x m, m.
4. Validation of the Adjustment Method
4.1. Numerical Method
A full-scale geometric model of the Zhangmatun subway station was established, as shown in
Figure 1. The dimensions of the tunnel are 4.8 m (W) × 4.8 m (H). There are six carriages in a train. The dimensions of the train are 117 m (L) × 2.8 m (W) × 3.8 m (H). The height of the adjustable ventilation platform door is 4.0 m, and the height of the controllable vent is 0.5 m.
In the numerical simulation, the focus is on the flow field of the piston air at the controllable vents as a train is about to arrive and has just stopped at the station. The following assumptions were made:
- (1)
Only one train is running in the downward line tunnel.
- (2)
There is no air leakage through the gaps of platform doors.
- (3)
The air is considered as an incompressible fluid.
- (4)
The air meets the Boussinesq hypothesis [
31].
4.1.1. Governing Equations
In the study, the airflow is high-Reynolds turbulent flow. Therefore, in the simulation, the standard k-ε model was used. The governing equations are shown in Equations (5)–(9):
The turbulent viscosity
ηt can be by calculated by Equation (7):
The
ε equation:
where
Cε1 = 1.44,
Cε2 = 1.92,
Cμ = 0.09,
σk = 1.00, and
σε = 1.30 [
9,
22,
28].
4.1.2. Numerical Simulation Setup
FLUENT was used to calculate the air velocity distribution for the train’s arrival at the station. A dynamic grid method was used to determine the relative motion between the train and the tunnel. The tunnel was meshed using structured grids. Other flow fields at the Zhangmatun station were meshed using unstructured grids. Grids were refined at the controllable vents. The total number of cells was 2,470,414. The calculated time was 90 s, including uniform motion of 22 m/s for 45 s, a deceleration process for 25 s, and a stopping process in the Zhangmatun station for 15 s.
4.2. Validation
To verify the accuracy of the numerical model, the field test data were compared with the simulation results, as shown in
Figure 6. The tested air velocities at the three test points P1, P3, and P5 were used.
As shown in
Figure 6, the variations in the simulated and tested air velocities were consistent. When the train approached the station at a constant speed, the air velocities at the controllable vents were also relatively uniform. After approximately 45 s, the train slowed and entered the station. Since the platform door occupies part of the tunnel space, the tunnel section suddenly shrinks, causing the air velocities to sharply rise and reach their maximum values. When the train passed through the controllable vents, the air velocities dropped to approximately 0 m/s. Then, when the train was about to stop, the piston wind from the back of the train poured into the station, and the air velocities at the controllable vents increased again. Supplementary video related to this process can be found in the study of Li et al. [
6]. In
Figure 6, the simulation results are slightly higher than the field test data. In the numerical calculation, the air leakage of the platform door gap was disregarded. The Pearson correlation coefficient (PCC) can be applied to analyze the coefficient between the simulation and the test [
9,
22,
32]. The PCC can be calculated by Equation (10):
The value of PCC is between −1 and 1. The larger the absolute value of the PPC, the stronger the correlation among the data. The PCCs of P1, P3, and P5 were 0.91, 0.90, and 0.95, respectively. The simulation results show agreement with the test data.
4.3. Air Velocity Distribution after Adjustment of the Controllable Vents
According to Equations (1)–(4), the opening heights of the controllable vents were adjusted. The distribution of the opening height of the controllable vents is shown in
Figure 7.
Using the controllable vent structure shown in
Figure 7, the air velocity distribution was obtained by numerical calculation, as shown in
Figure 8.
As shown in
Figure 8, the air velocity distribution was improved. In particular, the air velocities of the controllable vents located at the positions of 60–105 m of the platform were increased. Taking the controllable vent at 90 m as an example, the air velocity was increased from less than 0.5 m/s before adjustment to approximately 1.75 m/s after adjustment. According to
Figure 7 and
Figure 8, the distributions of the airflow rate were determined, as shown in
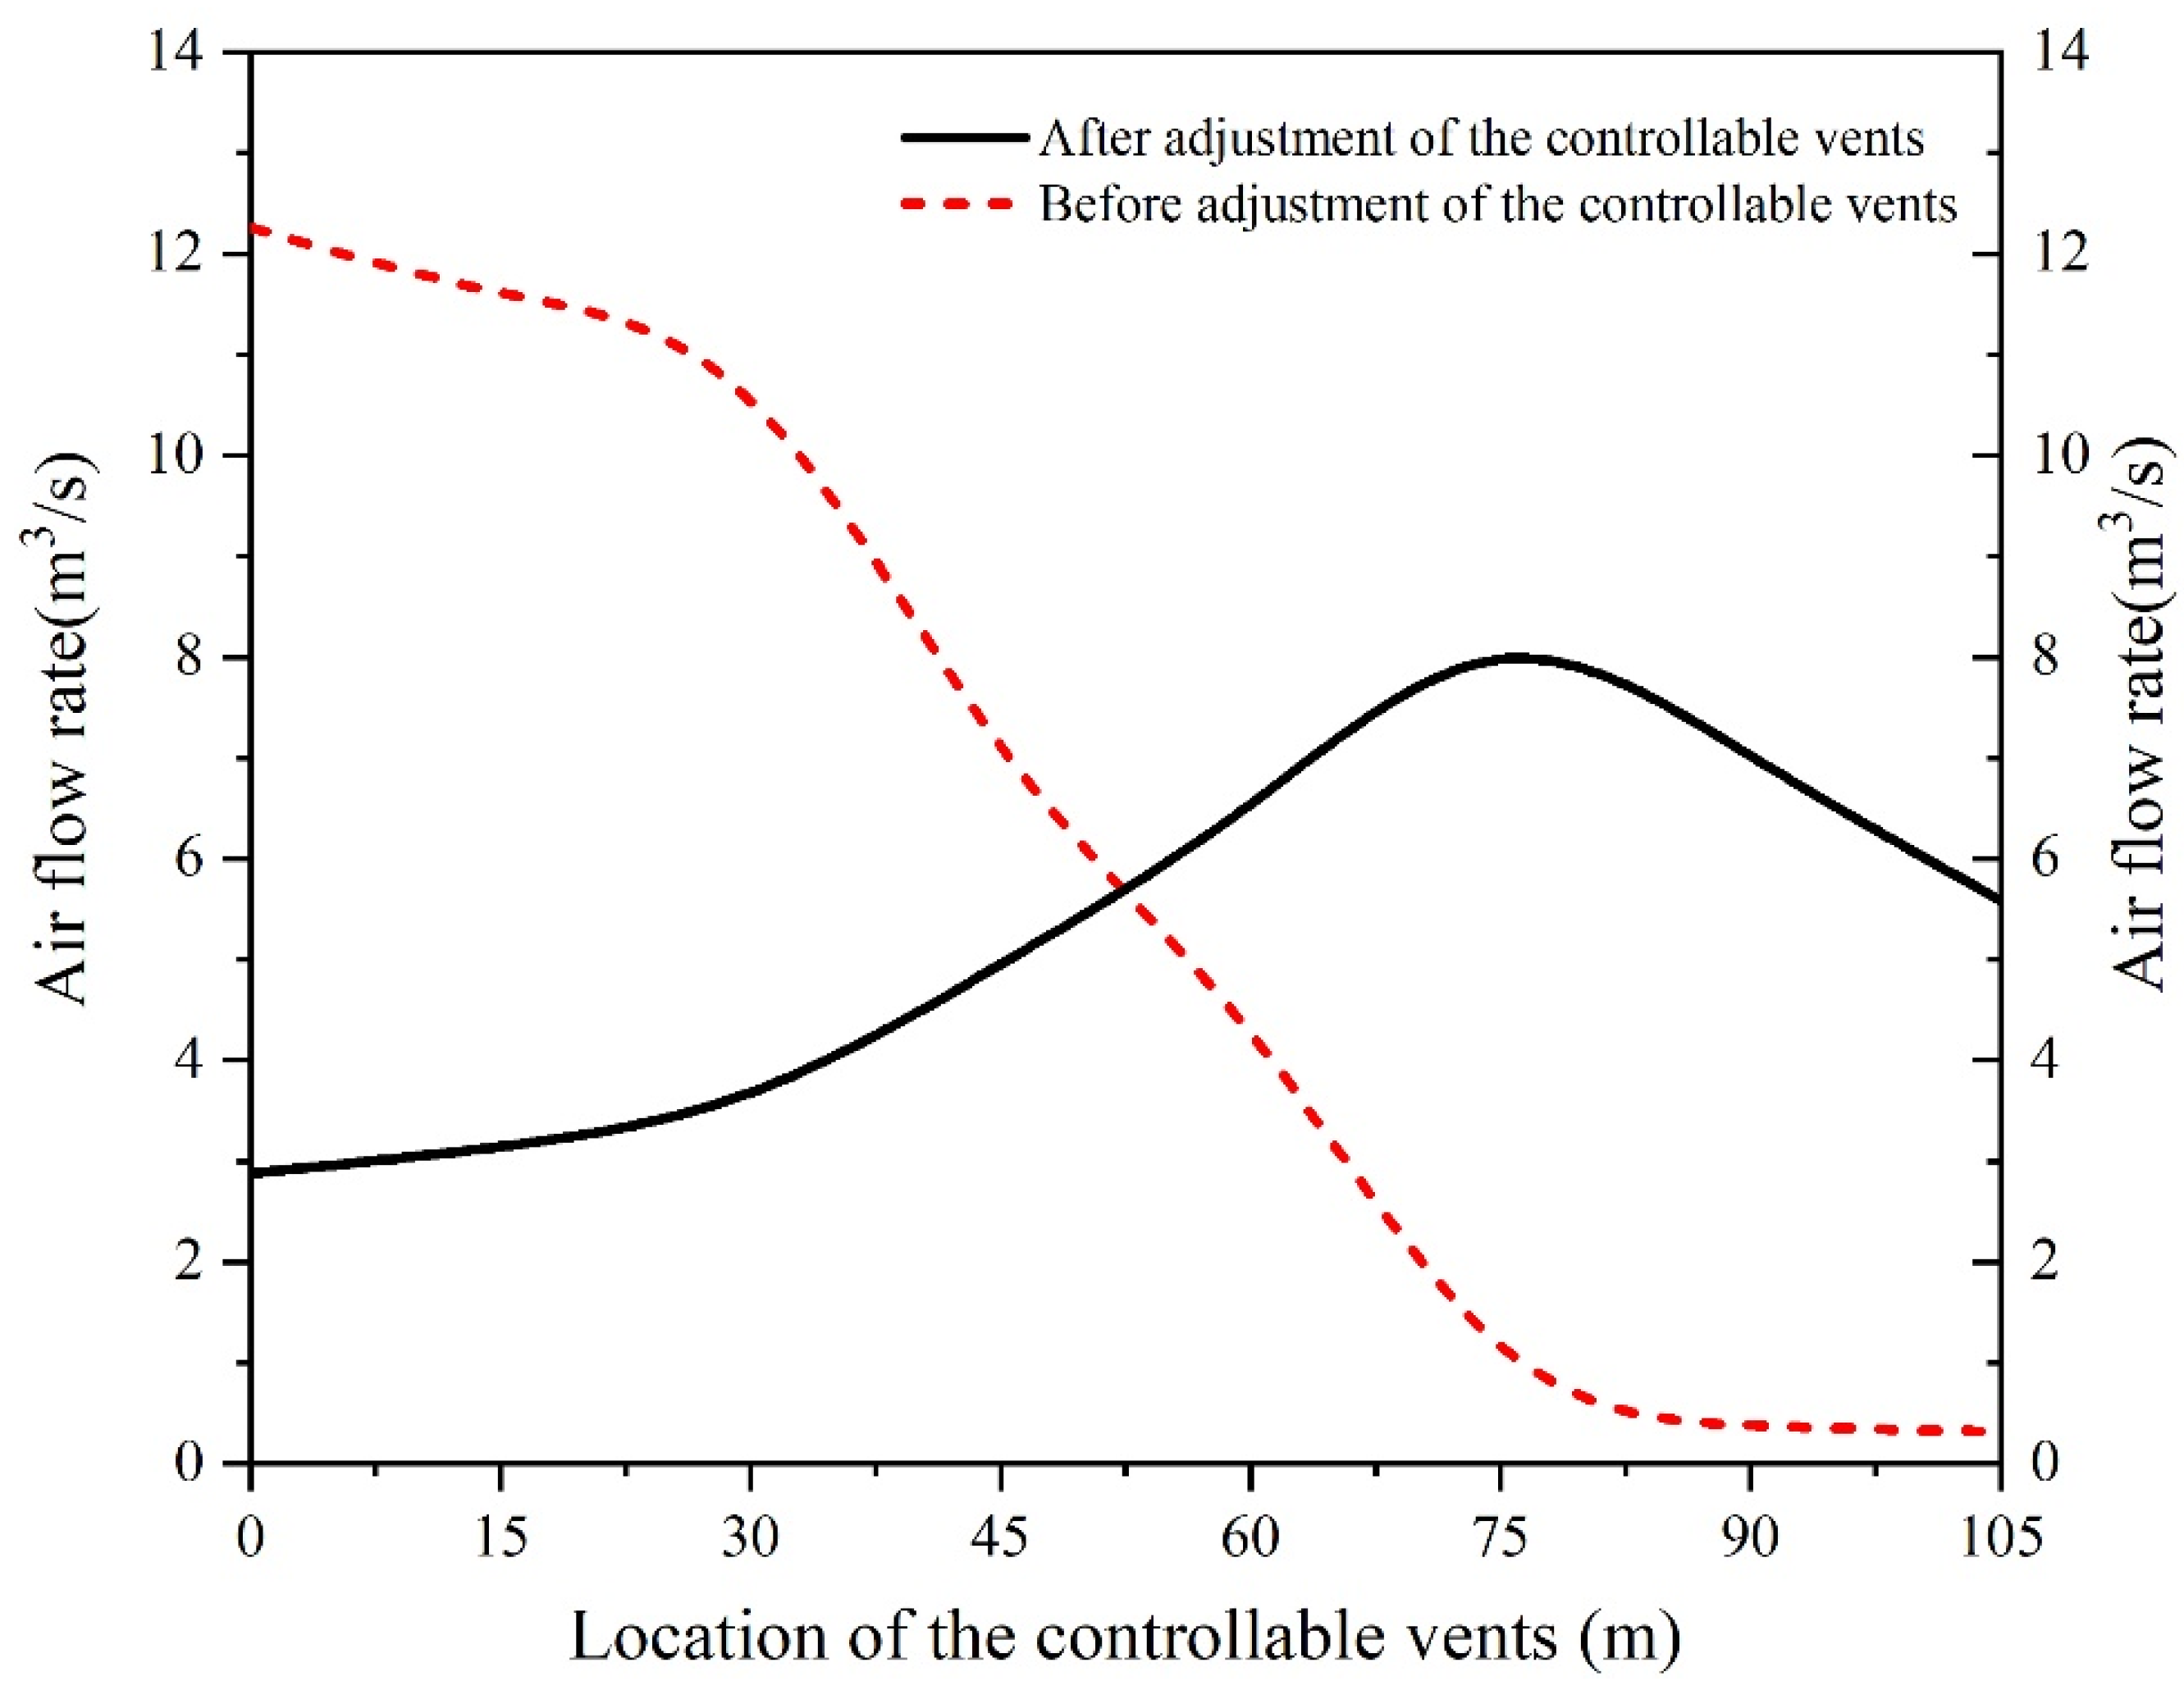
Figure 9.
As shown in
Figure 9, after adjustment of the controllable vents, the airflow rates were improved. However, the distribution of the airflow rates was uneven. Additionally, the airflow rates of the controllable vents located after approximately 60 m were greatly increased, whereas the airflow rates of the controllable vents located before 50 m were significantly reduced. After adjustment, the opening heights of the controllable vents located at 0–50 m of the platform were low, while the opening heights of the controllable vents located after 50 m were either adjusted to a small extent or were not adjusted.
After adjustment of the controllable vents, the air velocity and airflow rates were improved, showing the effectiveness of adjusting the opening height of the controllable vents. However, the improved airflow distribution of the controllable vents on the platform did not meet expectations. Further adjustments of the opening heights of the controllable vents are needed. Only the method of further adjustment is given in this study. According to the air velocity distribution after adjusting the opening height of the controllable vents as shown in
Figure 8a, the readjusted opening height of each controllable vent can be calculated by using Equations (2)–(4). The numerical calculation model given in
Section 4.1 can be employed to calculate the air velocity field again, and then the airflow rate distribution is obtained. This process can be repeated until the airflow rate distribution meets the requirements.
5. Conclusions
In this study, the concentrations of PM2.5 at the platform and at the controllable vents of the adjustable ventilation and platform door were measured on-site in the Jinan Zhangmatun subway station. The air velocities of the controllable vents at different positions in the length direction of the platform door were recorded. Combined with the measured data, a suggestion for adjusting the opening height of the controllable vents at different positions was given. The main findings can be summarized as follows:
(1) The variations in PM2.5 concentration were periodic with the variation in air velocity at the controllable vents and on the platform. Each cycle was a train interval (ΔT). The average ratio of the PM2.5 concentration in the piston wind to the PM2.5 concentration on the platform was 71.15%. The maximum PM2.5 concentration values on the platform and in the piston wind were 0.067 mg/m3 and 0.057 mg/m3, respectively. All values were lower than the standard limit of 0.075 mg/m3. The PM2.5 concentrations at the vents and on the platform were positively correlated with the air velocity.
(2) The air velocity distribution along the length of the platform was uneven. The minimum air velocity was only 5.9% of the maximum air velocity. The statistics of the air velocity distributions in a six-cycle train arrival process reveal that the air velocity distribution conforms to logistic regression.
(3) According to the air velocity distribution, adjustment of the opening height of the vents is proposed. Through numerical simulation, after adjustment of the vents, the distributions of air velocity and the airflow rates reached their maxima. This shows that adjusting the opening height of the vents is effective.
In this study, field tests were conducted under the conditions of low outdoor PM2.5 concentration and small passenger flow. In order to measure the variation in PM2.5 concentration in a station under different external conditions, we also need to continuously monitor the PM2.5 concentration to determine the main influencing factors. In addition, Hu et al. [
5] and Huang et al. [
18] noted that platform doors may play a crucial role in the propagation and dynamic distribution of PM2.5. Therefore, the condition of platform doors (i.e., open/closed) should be considered in subsequent studies.
Author Contributions
Conceptualization, H.L.; methodology, W.L.; software, H.L. and W.L.; validation, J.W.; formal analysis, H.H., S.C. and W.L.; investigation, X.L.; resources, X.L.; data curation, H.H.; writing—original draft preparation, H.L.; writing—review and editing, H.L. and W.L.; visualization, H.H.; supervision, S.C. and J.W.; project administration, H.L., X.L.; S.C. and J.W.; funding acquisition, X.L. and W.L. All authors have read and agreed to the published version of the manuscript.
Funding
This research was funded by the National Natural Science Foundation of China (No. 51908333); the Plan of Introduction and Cultivation for Young Innovative Talents in Colleges and Universities of Shandong Province, China; the Scientific and Technological Innovation Project for Youth of Shandong Provincial Colleges and Universities (No. 2019KJH012), China; and the project of Jinan Rail Transit Group Co., Ltd. (No. JGJS-QT-ZF-2021-094), China.
Acknowledgments
This work was supported by the National Natural Science Foundation of China (No. 51908333); the Plan of Introduction and Cultivation for Young Innovative Talents in Colleges and Universities of Shandong Province, China; the Scientific and Technological Innovation Project for Youth of Shandong Provincial Colleges and Universities (No. 2019KJH012), China; and the project of Jinan Rail Transit Group Co., Ltd. (No. JGJS-QT-ZF-2021-094), China.
Conflicts of Interest
The authors declare no conflict of interest.
References
- He, D.; Teng, X.; Chen, Y.; Yuan, Y.; Li, X.; Shan, S. Piston wind characteristic and energy saving of metro station environmental control system. J. Build. Eng. 2021, 44, 102664. [Google Scholar] [CrossRef]
- Yang, Z.; Su, X.; Ma, F.; Yu, L.; Wang, H. An innovative environmental control system of subway. J. Wind Eng. Ind. Aerod. 2015, 147, 120–131. [Google Scholar] [CrossRef]
- Su, Z.; Li, X. Sub-system energy model based on actual operation data for subway stations. Sustain. Cities Soc. 2020, 52, 101835. [Google Scholar] [CrossRef]
- Yin, H.; Yang, C.; Yi, L.; Yu, J.; Wu, Y.; Deng, Y.; Tang, Z. Ventilation and air conditioning system of deep-buried subway station in sub-tropical climates: Energy-saving strategies. Appl. Therm. Eng. 2020, 178, 115555. [Google Scholar] [CrossRef]
- Hu, M.; Liu, M.; You, D.; Zhang, Y. Influence of train arrival characteristics on unorganized ventilation in underground subway station with platform screen doors. J. Wind Eng. Ind. Aerod. 2020, 198, 104089. [Google Scholar] [CrossRef]
- Li, H.; Han, H.; Li, F.; Gao, Y.; Qin, J.; Chen, S.; Lei, W.; Wang, J. Field study of the effect of piston wind on the airflows at the controllable vents and exits of a subway station. J. Wind Eng. Ind. Aerod. 2022, 229, 105165. [Google Scholar] [CrossRef]
- Zhang, Y.; Li, X. Research on airflow and energy performance in PBD, PSD and PBD and PSD combined environment control systems in subway. Sustain. Cities Soc. 2018, 42, 434–443. [Google Scholar] [CrossRef]
- Ma, J.; Zhang, X.; Li, A.; Deng, B.; Lv, W.; Guo, Y.; Zhang, W.; Huang, L. Analyses of the improvement of subway station thermal environment in northern severe cold regions. Build. Environ. 2018, 143, 579–590. [Google Scholar] [CrossRef]
- Zhang, H.; Zhu, C.; Zheng, W.; You, S.; Ye, T.; Xue, P. Experimental and numerical investigation of braking energy on thermal environment of underground subway station in China’s northern severe cold regions. Energy 2016, 116, 880–893. [Google Scholar] [CrossRef]
- Zhang, Y.; Li, X. A study of fresh air control in subway stations. J. Wind Eng. Ind. Aerod. 2018, 175, 384–390. [Google Scholar] [CrossRef]
- Yang, J.; Liu, M.; Zhang, H.; Zheng, W.; You, S.; Cui, T. Ventilation and energy performance study on platform screen doors with adjustable vents in a subway station. Tunn. Undergr. Space Technol. 2022, 120, 104291. [Google Scholar] [CrossRef]
- Cross, D.; Hughes, B.; Ingham, D.; Ma, L. A validated numerical investigation of the effects of high blockage ratio and train and tunnel length upon underground railway aerodynamics. J. Wind Eng. Ind. Aerod. 2015, 146, 195–206. [Google Scholar] [CrossRef] [Green Version]
- Izadi, T.; Mehrabian, M.A.; Ahmadi, G.; Abouali, O. Numerical analysis of the mirco-particles distribution inside an underground subway system due to train piston effect. J. Wind Eng. Ind. Aerod. 2021, 211, 104533. [Google Scholar] [CrossRef]
- Targino, A.C.; Krecl, P.; Brimblecombe, P.; Oukawa, G.Y.; Filho, J.; Moreno, F. Spatio-temporal variability of airborne particulate matter in the São Paulo subway. Build. Environ. 2021, 189, 107526. [Google Scholar] [CrossRef]
- Strassmann, A.; Hoogh, K.D.; Röösli, M.; Haile, S.R.; Turk, A.; Bopp, M.; Puhan, M.A. NO2 and PM2.5 exposures and lung function in Swiss adults: Estimated effects of short-term exposures and long-term exposures with and without adjustment for short-term deviations. Environ. Health Perspect. 2021, 129, 17009. [Google Scholar] [CrossRef]
- Yu, H.; Guo, H.; Feng, Y.; Cheng, W.; Wang, Y. Exosomes from PM2.5-treated Human Bronchial Epithelial Cells Increase Lung Cancer Metastatic Potential. Biomed. Environ. Sci. 2022, 35, 473–484. [Google Scholar]
- Pan, S.; Du, S.; Wang, X.; Zhang, X.; Xia, L.; Liu, J.; Pei, F.; Wei, Y. Analysis and interpretation of the particulate matter (pm10 and pm2.5) concentrations at the subway stations in Beijing, China. Sustain. Cities Soc. 2019, 45, 366–377. [Google Scholar] [CrossRef]
- Huang, S.; Chen, P.; Hu, K.; Qiu, Y.; Feng, W.; Ren, Z.; Wang, X.; Huang, T.; Wu, D. Characteristics and source identification of fine particles in the Nanchang subway, China. Build. Environ. 2021, 199, 107925. [Google Scholar] [CrossRef]
- Zhao, Q.; Xiao, Y.; Lin, J.; Mao, H.; Zeng, Z.; Liu, Y. Measurement-based evaluation of the effect of an over-track-exhaust ventilation system on the particulate matter concentration and size distribution in a subway. Tunn. Undergr. Space Technol. 2021, 109, 103772. [Google Scholar] [CrossRef]
- Passi, A.; Nagendra, S.; Maiya, M.P. Characteristics of indoor air quality in underground metro stations: A critical review. Build. Environ. 2021, 198, 107907. [Google Scholar] [CrossRef]
- He, S.; Shen, F.; Jin, L.; Song, D.; He, X.; Khan, M. Characteristics of subway air quality and favorable locations for passengers waiting and taking the subway. Atmos. Pollut. Res. 2022, 13, 101482. [Google Scholar] [CrossRef]
- He, D.; Teng, X.; Chen, Y.; Liu, B.; Wang, H.; Li, X.; Ma, R. Energy saving in metro ventilation system based on multi-factor analysis and air characteristics of piston vent. Appl. Energy 2022, 307, 118295. [Google Scholar] [CrossRef]
- Zhang, H.; Zhu, C.; Liu, M.; Zheng, W.; You, S.; Li, B.; Xue, P. Mathematical modeling and sensitive analysis of the train-induced unsteady airflow in subway tunnel. J. Wind Eng. Ind. Aerod. 2017, 171, 67–78. [Google Scholar] [CrossRef]
- Zhang, X.; Ma, J.; Li, A.; Lv, W.; Zhang, W. DLi Ventilation for subway stations with adjustable platform doors created by train-induced unsteady airflow. Build. Environ. 2019, 152, 87–104. [Google Scholar] [CrossRef]
- Du, J.; Zhang, L.; Yang, M.-Z.; Wu, F.; Li, K. Moving model experiments on transient pressure induced by a high-speed train passing through noise barrier. J. Wind Eng. Ind. Aerod. 2020, 204, 104267. [Google Scholar] [CrossRef]
- Li, J.; Li, A.; Hou, Y.; Zhang, C.; Yang, C.; Zhang, X.; Che, J.; Guo, J. Air distribution and thermal environment optimization on subway platform using an innovative attached ventilation mode. Build. Environ. 2021, 204, 108226. [Google Scholar] [CrossRef]
- Lv, W.; Li, A.; Ma, J.; Cui, H.; Zhang, X.; Zhang, W.; Guo, Y. Relative importance of certain factors affecting the thermal environment in subway stations based on field and orthogonal experiments. Sustain. Cities Soc. 2020, 56, 102107. [Google Scholar] [CrossRef]
- Izadi, T.; Mehrabian, M.A.; Abouali, O.; Ahmadi, G. 3-D numerical analysis of train-induced flow inside four ventilated underground subway stations and connecting tunnels. J. Wind Eng. Ind. Aerod. 2019, 193, 103974. [Google Scholar] [CrossRef]
- Khaleghi, M.; Talaee, M.R. Analysis of unsteady airflow in a subway station influenced by train movement. Sci. Technol. Built Environ. 2020, 26, 210–218. [Google Scholar] [CrossRef]
- GB3095-2012; Ambient Air Quality Standard. China Environment Publishing Group: Beijing, China, 2012.
- Schmitt, F.G. About Boussinesq’s turbulent viscosity hypothesis: Historical remarks and a direct evaluation of its validity. Comptes Rendus Mécanique 2007, 335, 617–627. [Google Scholar] [CrossRef] [Green Version]
- Adler, J.; Parmryd, I. Quantifying colocalization by correlation: The Pearson correlation coefficient is superior to the Mander’s overlap coefficient. Cytom. Part A 2010, 77, 733. [Google Scholar] [CrossRef]
| Publisher’s Note: MDPI stays neutral with regard to jurisdictional claims in published maps and institutional affiliations. |
© 2022 by the authors. Licensee MDPI, Basel, Switzerland. This article is an open access article distributed under the terms and conditions of the Creative Commons Attribution (CC BY) license (https://creativecommons.org/licenses/by/4.0/).


