Article

Selective Milling and Elemental Assay of Printed Circuit Board Particles for Their Recycling Purpose

by
Akira Otsuki
1,2,*,
Pedro Pereira Gonçalves
1 and
Emilien Leroy
1
1
Ecole Nationale Supérieure de Géologie, GeoRessources UMR 7359 CNRS, University of Lorraine, 2 Rue du Doyen Marcel Roubault, BP 10162, 54505 Vandoeuvre-lès-Nancy, France
2
Waste Science & Technology, Luleå University of Technology, SE 97187 Luleå, Sweden
*
Author to whom correspondence should be addressed.
Metals 2019, 9(8), 899; https://doi.org/10.3390/met9080899
Submission received: 18 July 2019 / Revised: 2 August 2019 / Accepted: 12 August 2019 / Published: 16 August 2019
(This article belongs to the Special Issue Advances in Characterization of Heterogeneous Metals/Alloys)

Abstract

:
Selective/preferential milling of printed circuit board (PCB) particles followed by non-destructive characterization of the mill products was performed in order to understand the effects of different feed masses into a hammer mill and different milling time on the metal recovery and enrichment ratio. Those are important variables affecting and determining the process performance and capacity. The milling tests and elemental assay characterization were conducted by using a hammer mill and a portable X-ray fluorescence analysis (XRF), respectively. The results showed the preferential metal concentration/enrichment was achieved for several elements and their degree was varied depending on the parameters. Using the experimental data, predictive models of metal recovery were developed and the global trend of metal recoveries was observed under different mill feed and milling time and discussed.

1. Introduction

Waste electrical and electronic equipment (WEEE) is one of the fast growing waste categories in the EU, with the growth rate of 3–5% per year [1]. It is about three times higher than the rate of municipal waste. This is the result of massive production of the electric-electronic equipment and its market expansion based on technological progress. Therefore, there is a huge need for recovering valuable materials from WEEEs. However, their complex and heterogeneous structures (e.g., mixture of number of different metals, plastics, and ceramics in different sizes) and their variation with time lead to technical difficulties and environmental issues for their effective pre-concentration process development to improve material recycling. For recycling purposes, the combination of selective milling and physical separation was proposed by previous researchers, e.g., reference [2]. For selective milling, the application of an impact mill (e.g., hammer mill) has been suggested to enhance the metal recovery from WEEE, including printed circuit boards (PCBs), e.g., reference [3].
On the other hand, there are still limited ideas about the effects of different operation parameters on the global recovery of different metals and their liberation/association with non-metallic components. In the work of Koyanaka et al. [3], the effect of selectively grinding and separating the metallic fraction from the non-metallic fraction was investigated by regulating the hammer rotation speed in their hammer mill. Through a high-speed video camera analysis, the “phases of destruction” when using the hammer mill were investigated. The metal liberation was achieved through an exfoliation from the PCB substrate with increasing the rotation speed, upon the pre-weakening of the particles with slow rotation speed.
The degree of liberation, a key factor when establishing the liberation (particles/minerals of interest from gangue particles/non-metallic particles) performance of the comminution, determines the success of subsequent process for valuable material recovery. For the PCBs, the degree of liberation is strongly affected by the substrate material strength. The composition of the PCB substrate may vary depending on the application/functionality of the PCB. The two most common substrates are the phenolic resins and the epoxy resins [4], which are often glass reinforced. It is important to highlight that metals are not as easily ground as the non-metals, due to their ductility, hence the brittle glass and plastic particles are expected to be more present in the finer fractions.
In addition to a proper understanding of the behavior of PCB particles when subjected to hammer milling, one of the major limitations is a lack of proper characterization method to quantitatively evaluate the distribution and liberation/association of each component without destroying the heterogeneous particle status at each separation/beneficiation unit operation [5,6]. Within the above background and based on our previous experience, e.g., references [4,5,6,7,8,9,10,11], in this article, we introduce and discuss our results on selective milling of PCB particles with the following objectives:
  • To further understand selective milling and the effect of different operational parameters (i.e., feed mass, milling time) in the global recovery and selective enrichment of different metals in comparison with the non-metallic fractions when milling PCB particles with the hammer mill;
  • To apply non-destructive characterization of heterogeneous feeds and products in order to capture the metal deportment/concentration and liberation/association for optimizing/maximizing the metal recovery by pre-concentration unit operations; and
  • To develop a predictive model to estimate the metal recovery as a function of important milling process parameters, i.e., feed mass and milling time.

2. Materials and Methods

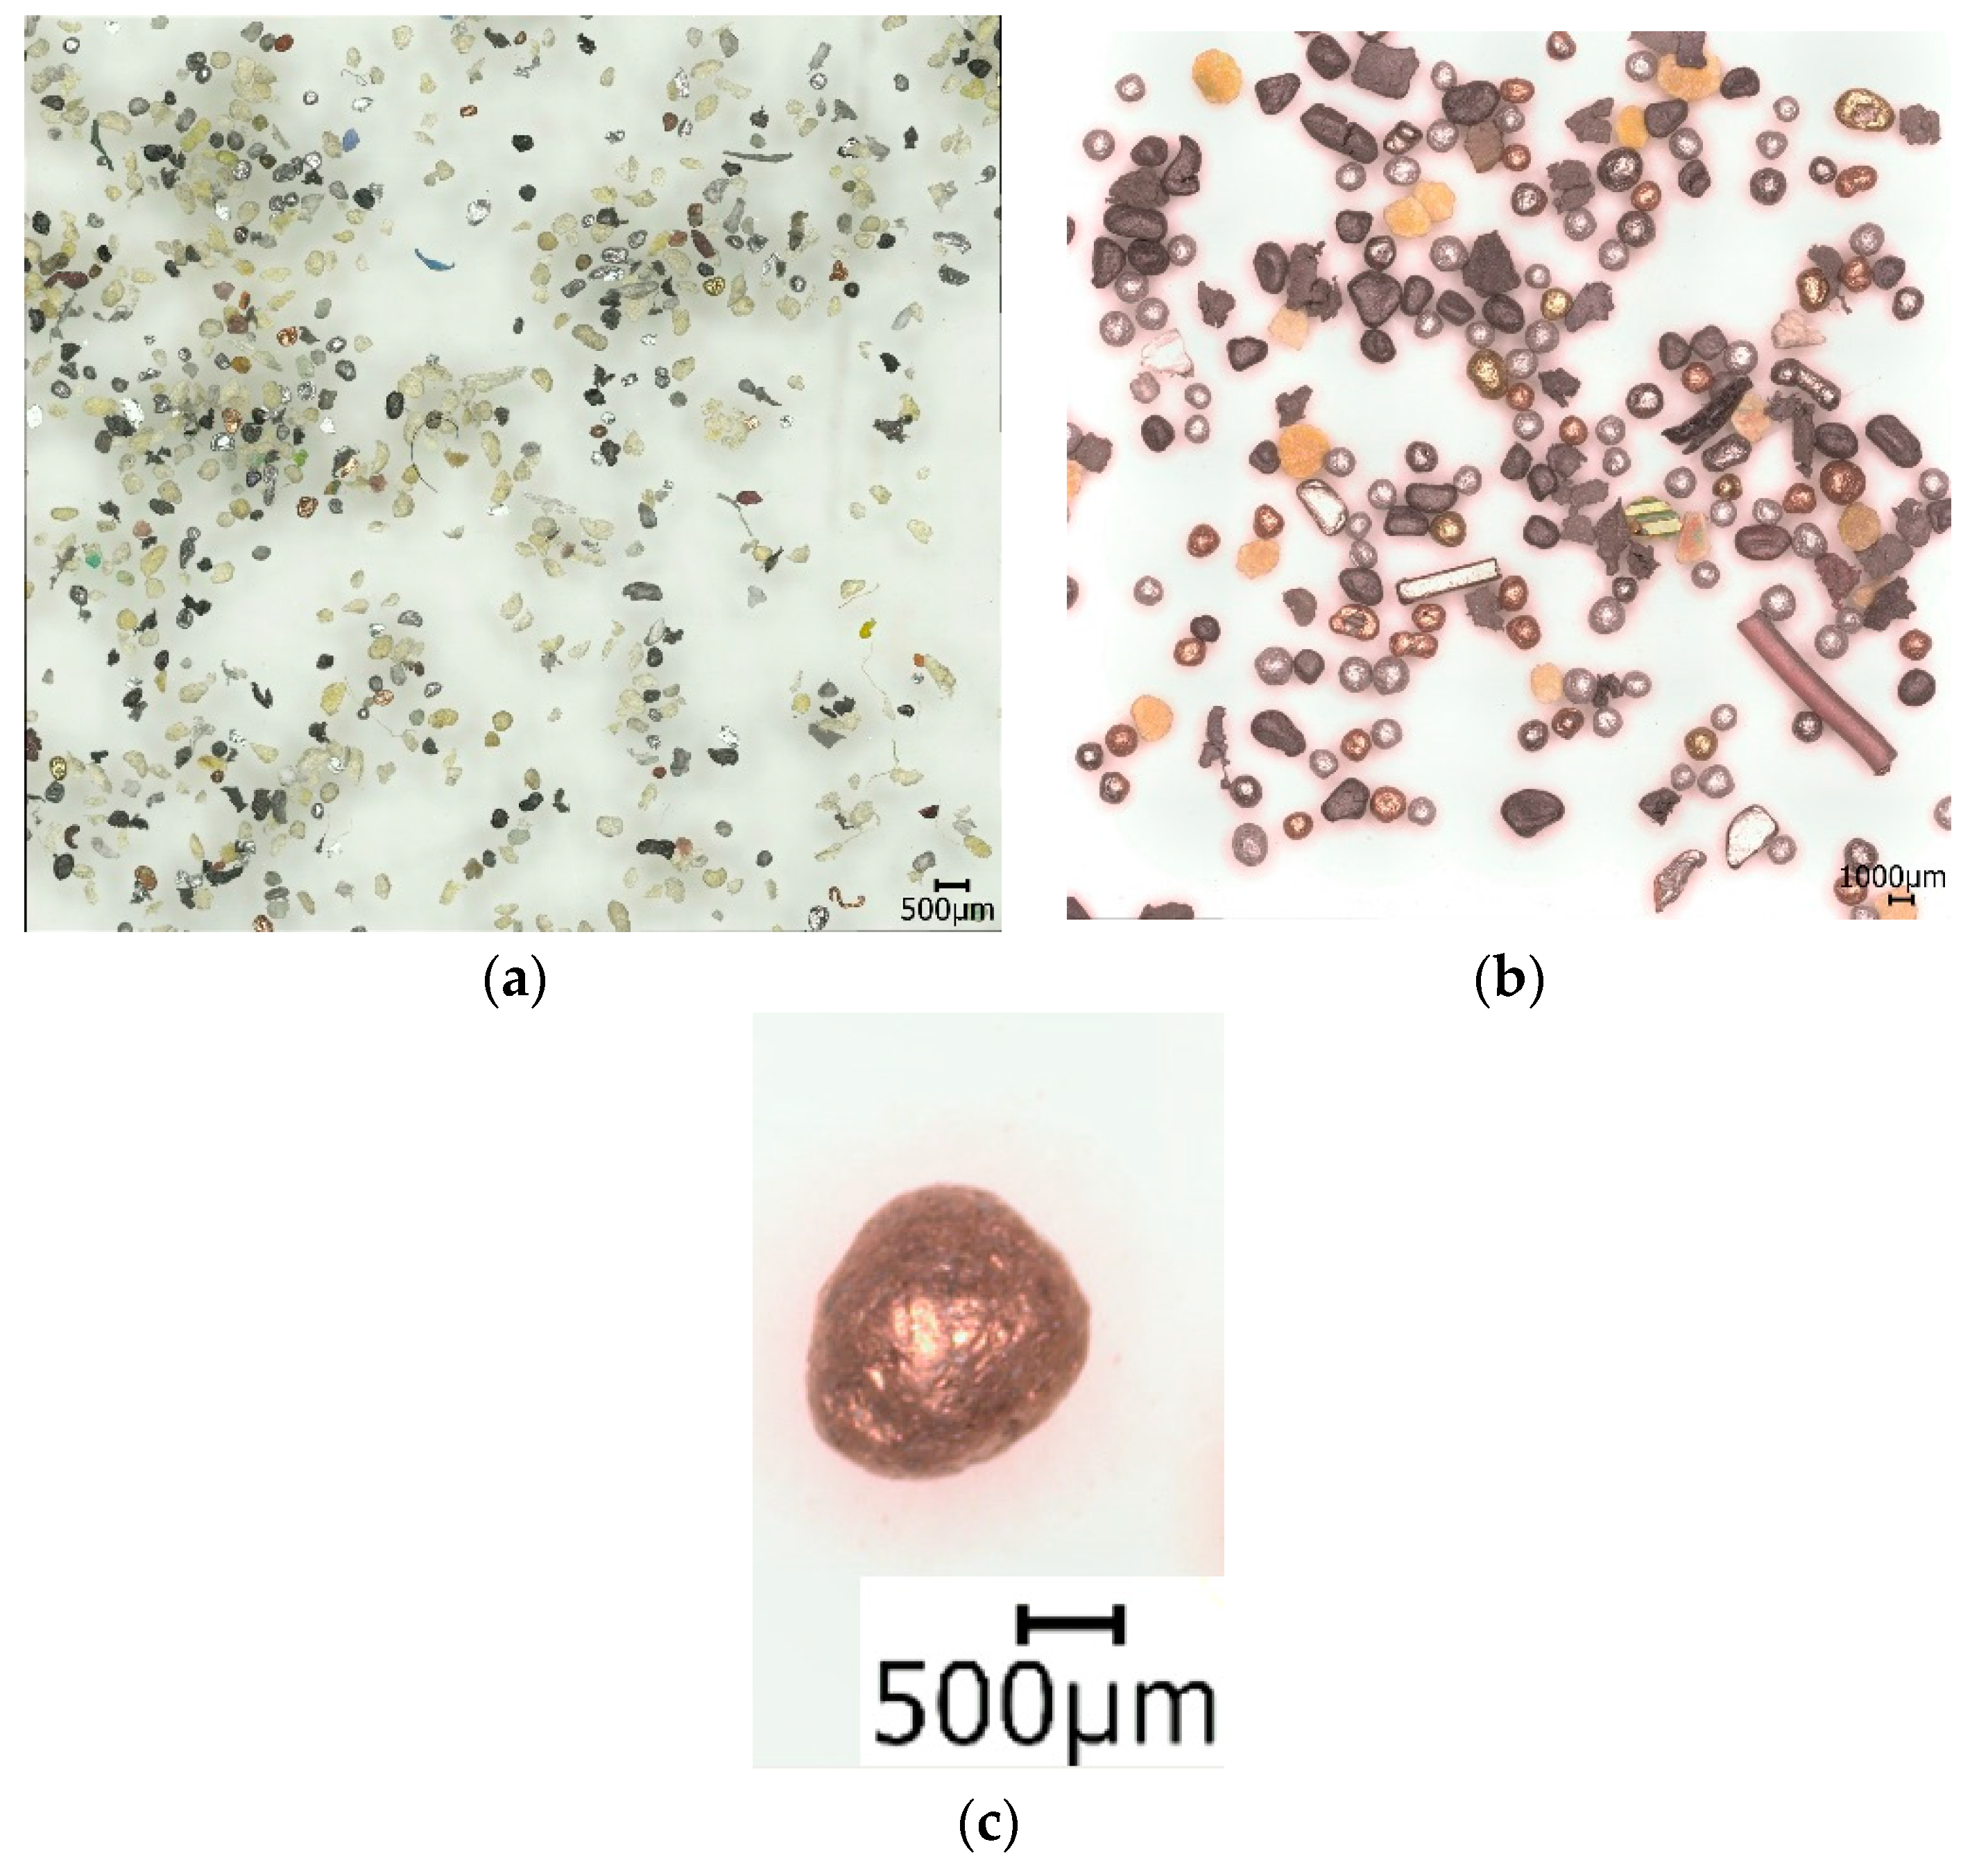
2.1. Material Preparation
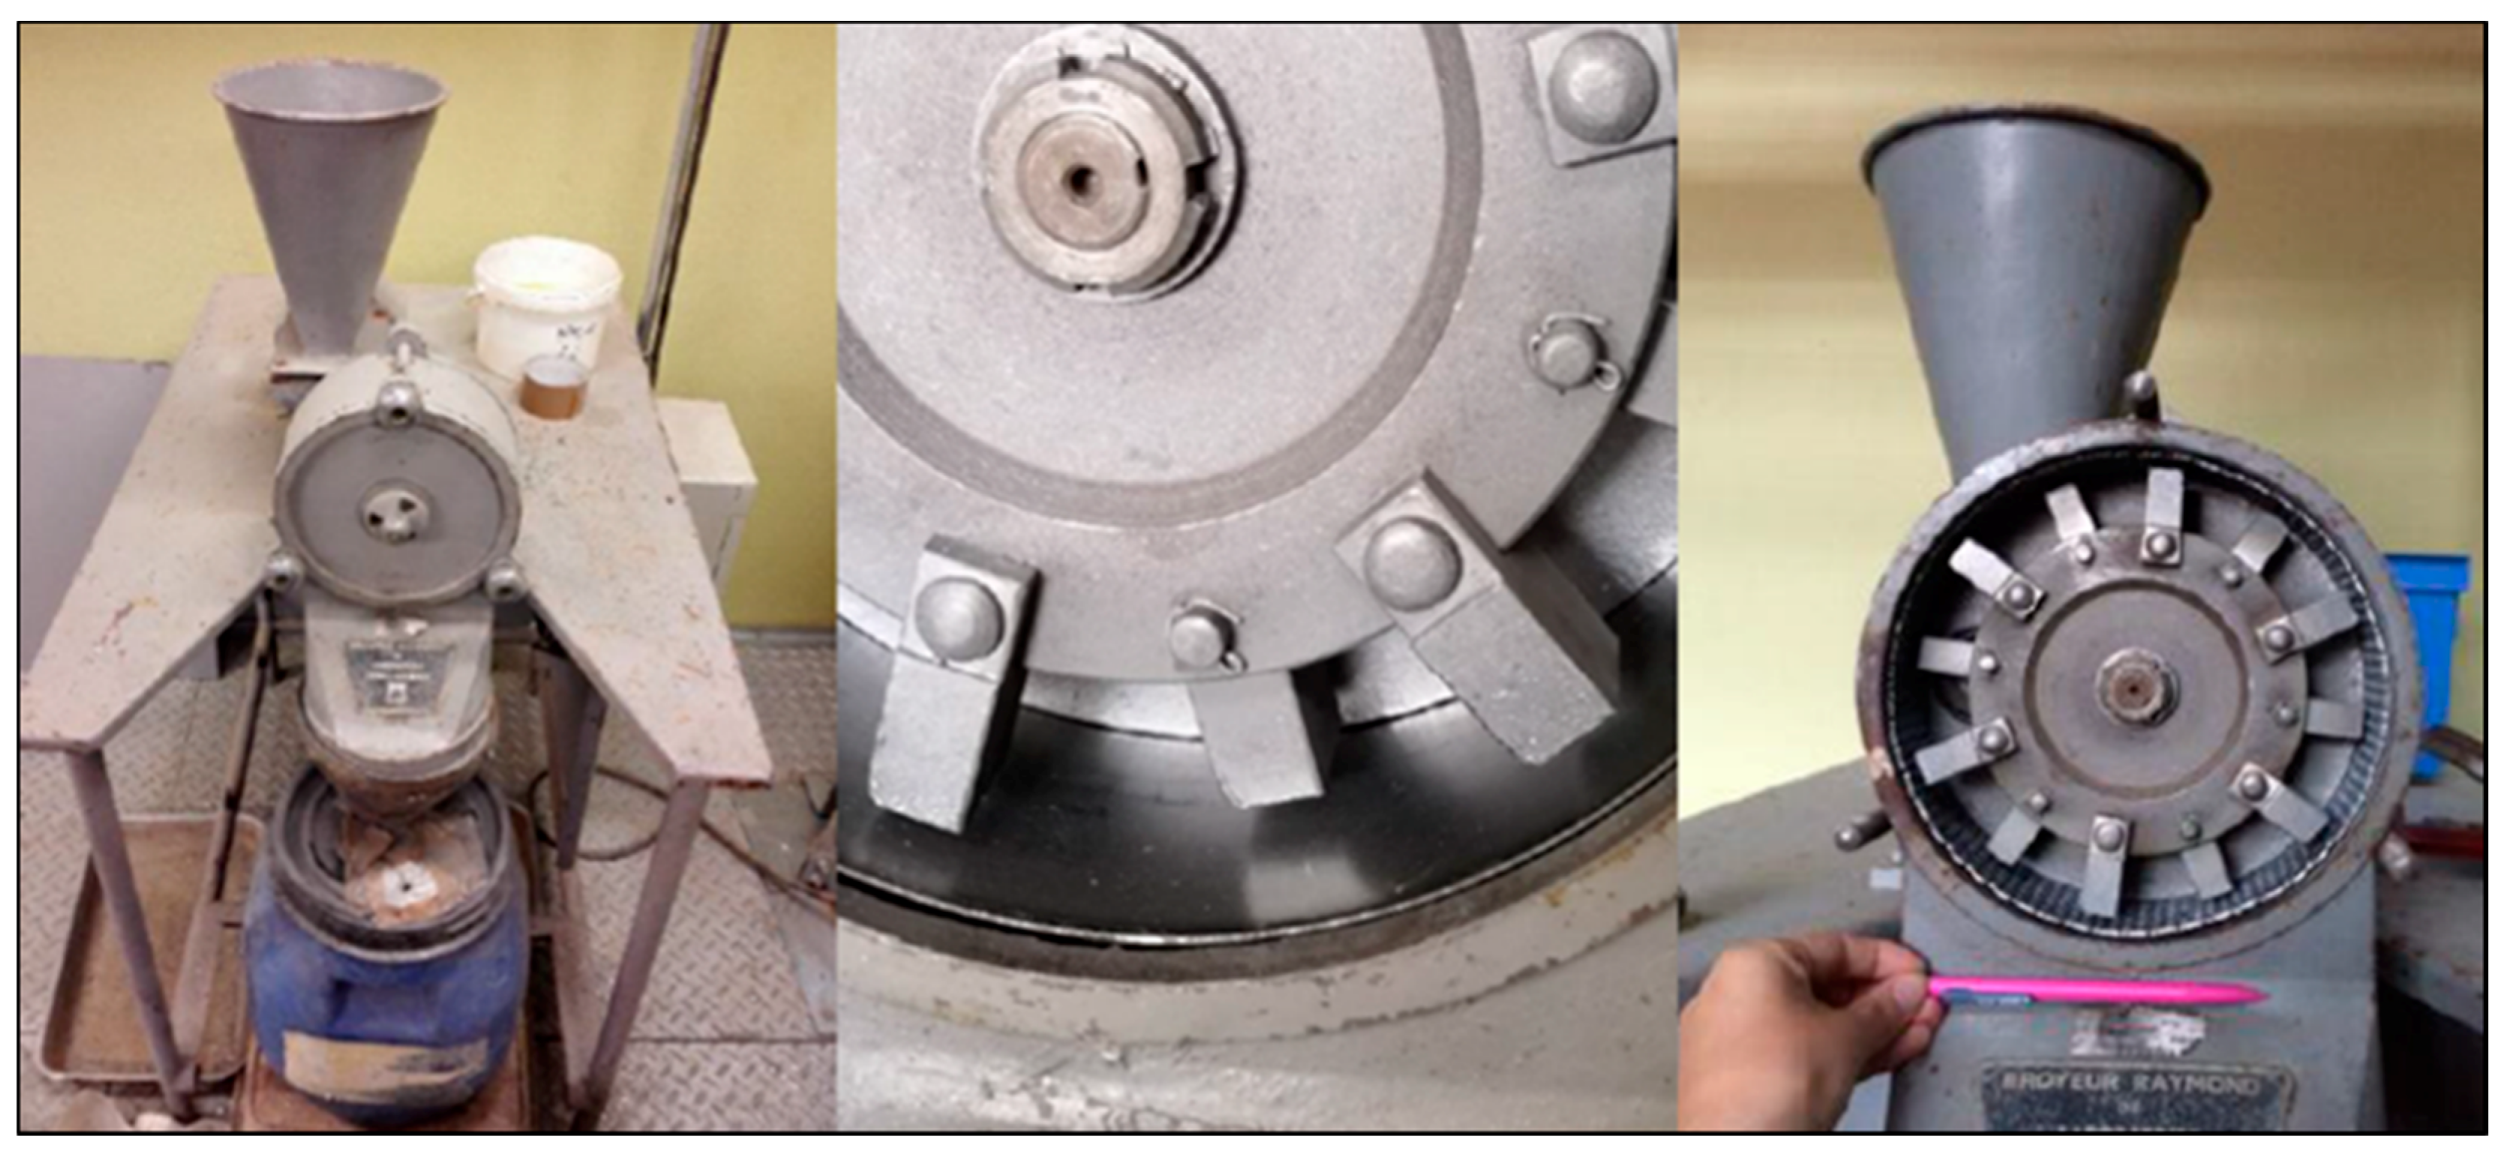
Printed circuit boards mounted with their electric components (origin confidential) roughly 100 cm² each and weighting a total of 4.75 kg, were manually broken into centimeter-scale slabs, and fed into a rotary blade shredder until an output passing size of 10 mm, fixed by the grid size coupled in the equipment.
The product generated from the shredder was the feed material for the hammer milling. In this study, a hammer mill armed with 12 rotary hammers (Broyeur Raymond (Laboratoire Stein et Roubaix, Roubaix, France) assembled in two different settings was used, HM1 (Raymond Hammer Mill—equipped with a 20 cm diameter sieve having 5 mm diameter openings—running in an open-circuit setting) followed by HM2 (Raymond Hammer Mill—running in a closed-circuit setting—steel sheet lining).

2.2. Hammer Milling

Based on our preliminary tests and literature study, including Koyanaka et al. [3] who studied the selective milling of PCBs with varying the mill rotor velocity, and the volumetric capacity of the hammer mills; in this study, two other parameters: the milling time and the feed mass ranges, were investigated for understanding their effects on the behavior of metallic deportment. The feed mass was 20 g, 40 g or 80 g while milling time was 30 s, 60 s or 90 s. The products from the open-circuit hammer milling HM1 were sieved into the fractions 2–4 mm, 1—2 mm, 0.5–1 mm, 0.25–0.5 mm, 0.125–0.25 mm, and <0.125 mm for particle size distribution analysis. Such size distribution was selected based on our preliminary study to selectively enrich metal contents [12]. Among them, the 1–2 mm or 2–4 mm fraction was fed into the second hammer milling step (HM2) with a closed-circuit operation (Figure 1) was performed under the conditions mentioned above (feed mass, milling time). Prior to feeding the mill, a representative sample from each size fraction was obtained by using a splitter. The secondary mill products were also subjected to particle size distribution analysis with the same sieve sets used to evaluate the HM1 products.

2.3. Non-Destructive Elemental Assay

The hammer mill products followed by sieving analysis were weighted and sampled for non-destructive X-ray fluorescence analysis (XRF). A portable XRF machine (Niton XL3t GOLDD+, Thermo Scientific, Waltham, MA, USA) locked on a stationary stand was remotely operated through a connected PC. The mining Cu/Zu testing mode equipped with the full fundamental parameter algorithm was used. The concentrations of the following metals can be detected: Mg, Al, Si, P, S, Cl, As, K, Ca, Ti, V, Cr, Mn, Fe, Co, Ni, Cu, Zn, W, Pb, Bi, Zr, Nb, Mo, Sn, Ba, Sb, Cd, Pd, Sr, Rb, Se, and Ag and Au [13].
Particles were fed into a plastic container with X-ray thin film (TF-160–255, MYLAR, Port St. Lucie, FL, USA) window facing the X-ray beam and were measured during 120 s/point to have the elemental composition. Due to the heterogeneity of the samples, especially for coarser fractions, i.e., 0.25 mm and above; the XRF results consist of batches of five measures for each size fraction (2–4 mm; 1–2 mm; 0.5–1 mm; 0.25–0.5 mm; 0.125–0.25 mm and −0.125 mm) in each milling condition. In some coarsest size fractions, there was not enough product to perform a measurement. The average grade (element %) by size fraction for each metal and the 95% confidence interval were calculated and used for further calculation and evaluation of the milling performance.

Feed Elemental Composition

From the XRF elemental assay, the backcalculated grade of the different metals of interest in this study in the feed material are given in Table 1, together with some values reported in the past [14,15]. In general, our values are in the range reported previously with some deviation that could be due to differences in the heterogeneity and preparation of samples and analytical methods. This does not affect the evaluation and comparison among our products discussed in this paper.

2.4. Calculation of Metal Recovery and Enrichment

The metal recovery was calculated as follows:
R e = C i c i F f
where Ci is the mass in the product particle size fraction “i” after hammer milling, ci is the metal grade (element %) in the product particle size fraction “i” after hammer milling, F is the feed mass and f is the feed metal grade (element %).
The metal enrichment ratio can be defined as:
E n r i c h m e n t   r a t i o = E l e m e n t %   i n   t h e   c o n c e n t r a t e / E l e m e n t %   i n   t h e   F e e d
It was calculated as a function of each milled particle fraction size as a concentrate in order to evaluate the enrichment ratio under different milling conditions.
By calculating the metal recovery and enrichment ratio, the presence of selective/preferential metal concentrations to specific size fractions can be identified under different milling conditions.

2.5. Modeling the Metal Recovery

In order to better understand and predict selective concentration of the metal components from the non-metallic components, by fully utilizing the experimental results, the response surface modeling of metal recoveries based on the 2-level factorial design was performed. Such modeling approach was applied to predict physical separation performance of PCB particles [16] and many other applications. The modeling of enrichment ratio is not discussed in this paper due to the unsatisfactory results obtained.
The nine experimental conditions, i.e., the combination of the three different feed masses and the three different grinding times was designed, via our previous experiments [12]. Each of the experimental points, i, was associated with its response to the recovery (Re) that was modeled by the following polynomial equation:
R e =   a 0 + a 1 W + a 2 t + a 12 W t
where a0, a1, a2 and a12 stand for the coefficients to be determined by using experimental determined recovery data and matrix calculation, W is the feed mass used in the experiment (domains 1 for 80 g; 0 for 40 g and −0.5 for 20 g) and t is the milling time parameter (domains 1 for 90 s; 0 for 60 s and −1 for 30 s). Those conditions were pre-determined experimentally [12].

3. Results and Discussion

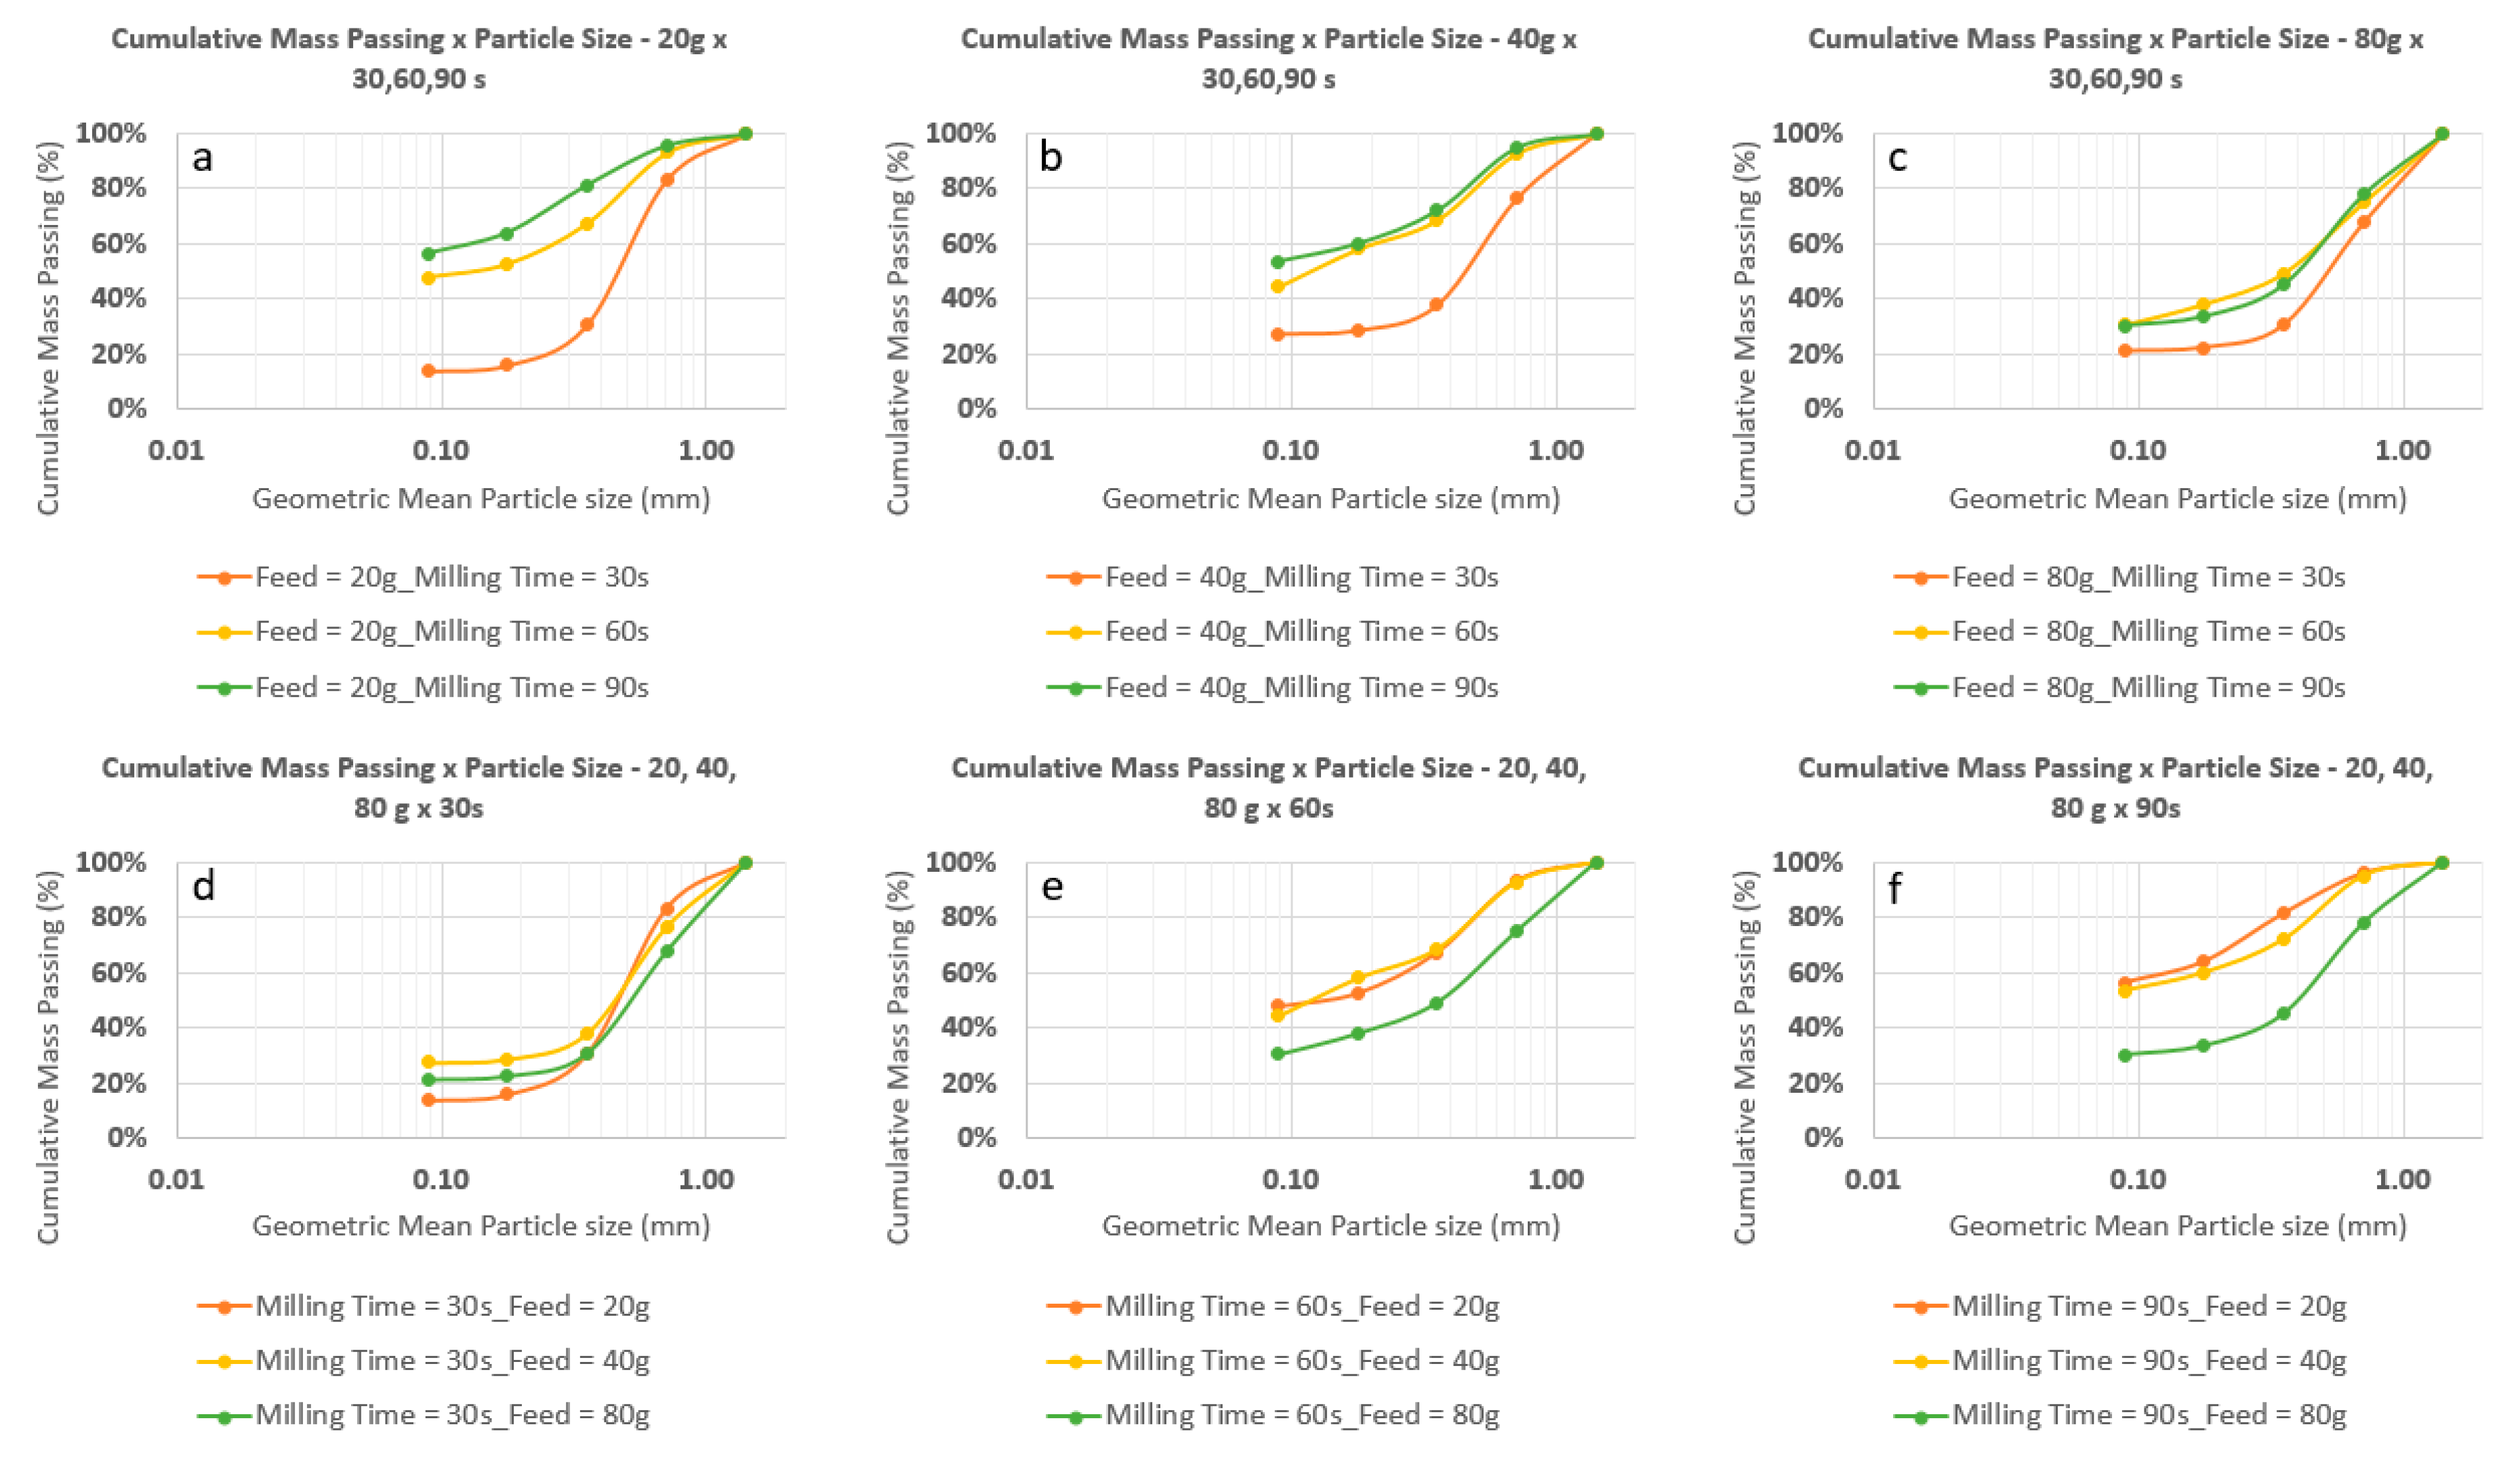
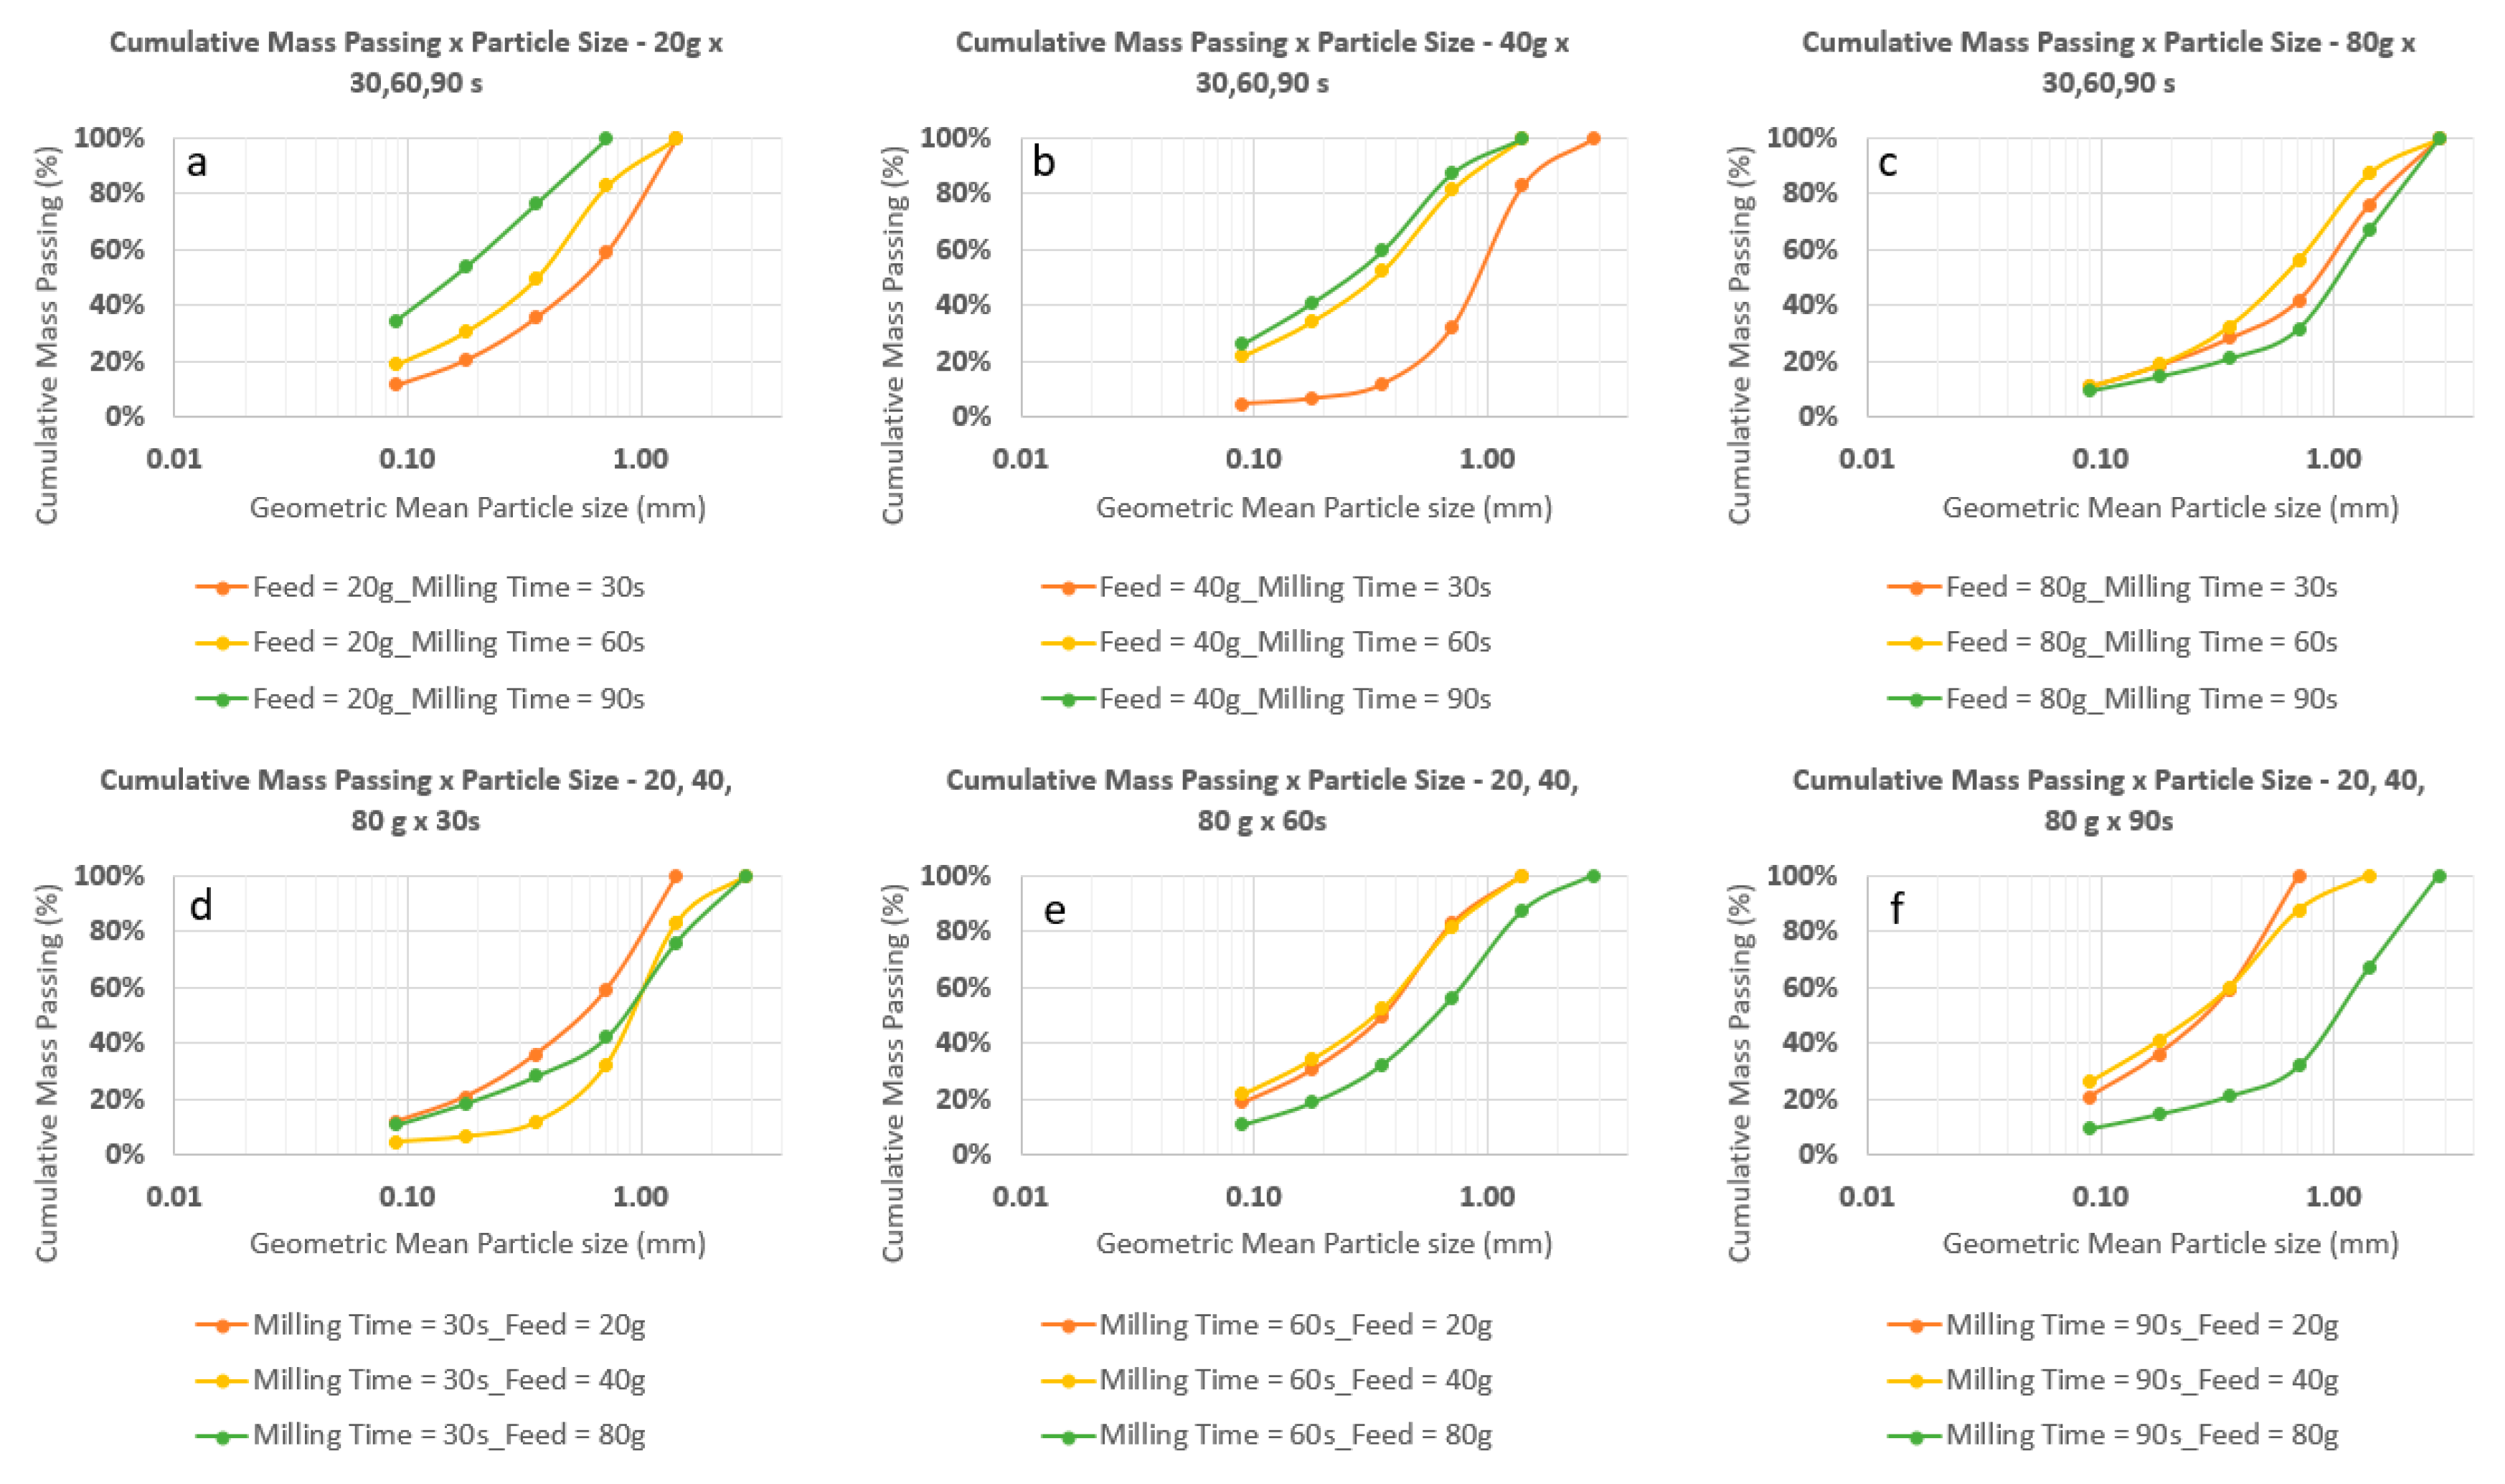
3.1. Particle Size Distribution (PSD) of Mill Products

Under nine different experimental settings described in the Materials and Methods section, both the 2–4 mm feed and 1–2 mm feed were milled in the closed circuit and the product PSD curves were are analyzed. In order to understand the influence of each parameter individually, either the feed mass (20, 40 and 80 g) or the grinding time (30, 60 and 90 s) were fixed for each sub-figure (a–f). In Figure 2 and Figure 3 (and other figures given in this paper), the geometric mean size is used, based on the calculation with an equation: √ (xi × xi+1); where xi is the finest sieve opening size in the fraction, while xi+1 is referring to the coarsest sieve opening size in a fraction [17]. As an example, for the top size fraction 2–4 mm, the calculation √ (2 × 4) results in the value of 2.83.
Figure 2 and Figure 3 clearly indicate that considerably higher amount of fine particles were generated by milling the 1–2 mm feed (Figure 2) in comparison with the products obtained from the feed 2–4 mm (Figure 3) under the same conditions applied. For most experiments (e.g. 20 g–30 s; 20 g–60 s; 40 g–30 s; 40 g–60 s; 80 g–30/60/90 s) with the 1–2 mm feed, the D20 (20% of the material was ground to a particle size below that size range) was in between the sizes of 80–200 µm. The general behavior mentioned above contradicts with the common behavior of rock/ore size reduction that a coarser feed generally leads a slightly finer product, mostly if comparing two feed materials of the same nature and hence, similar breakage characteristics expected [18].
Regarding the experiments performed with a fixed mass, it is observed that for both feed sizes (1–2 mm and 2–4 mm), grinding the same feed mass for 30 s, generates a considerable coarser product in comparison to grinding time for 60 s and 90 s, as expected. On the other hand, the magnitude of size reduction is not proportional to the grinding time. For example, for a fixed feed mass of 40 g (Figure 2b), the D50 is about 500 µm at 30 s milling time. When increasing the time to 60 s, the D50 decreases to about 100 µm while for 90 s there is almost no more size reduction. Such behavior can be explained by the “phase of destruction” for a PCB material going through hammer milling [3], as the grinding time of 30 s is probably not enough for the substrate exfoliation phase to take place while 60 s is necessary. Hence, the composite material (substrate + metal) is considerably more resistant to comminution in comparison with a material that already went through the exfoliation phase completely.
When considering a fixed grinding time (mostly 60 and 90 s), for both Figure 2d–f and Figure 3d–f, in general, feeding the hammer mill with either 20 or 40g does not change the PSD curves significantly while the 80g feed mass, results in a noticeable coarser product. This is the indication of less grinding and/or agglomeration of ductile materials. This aspect will be further discussed in the following sections.

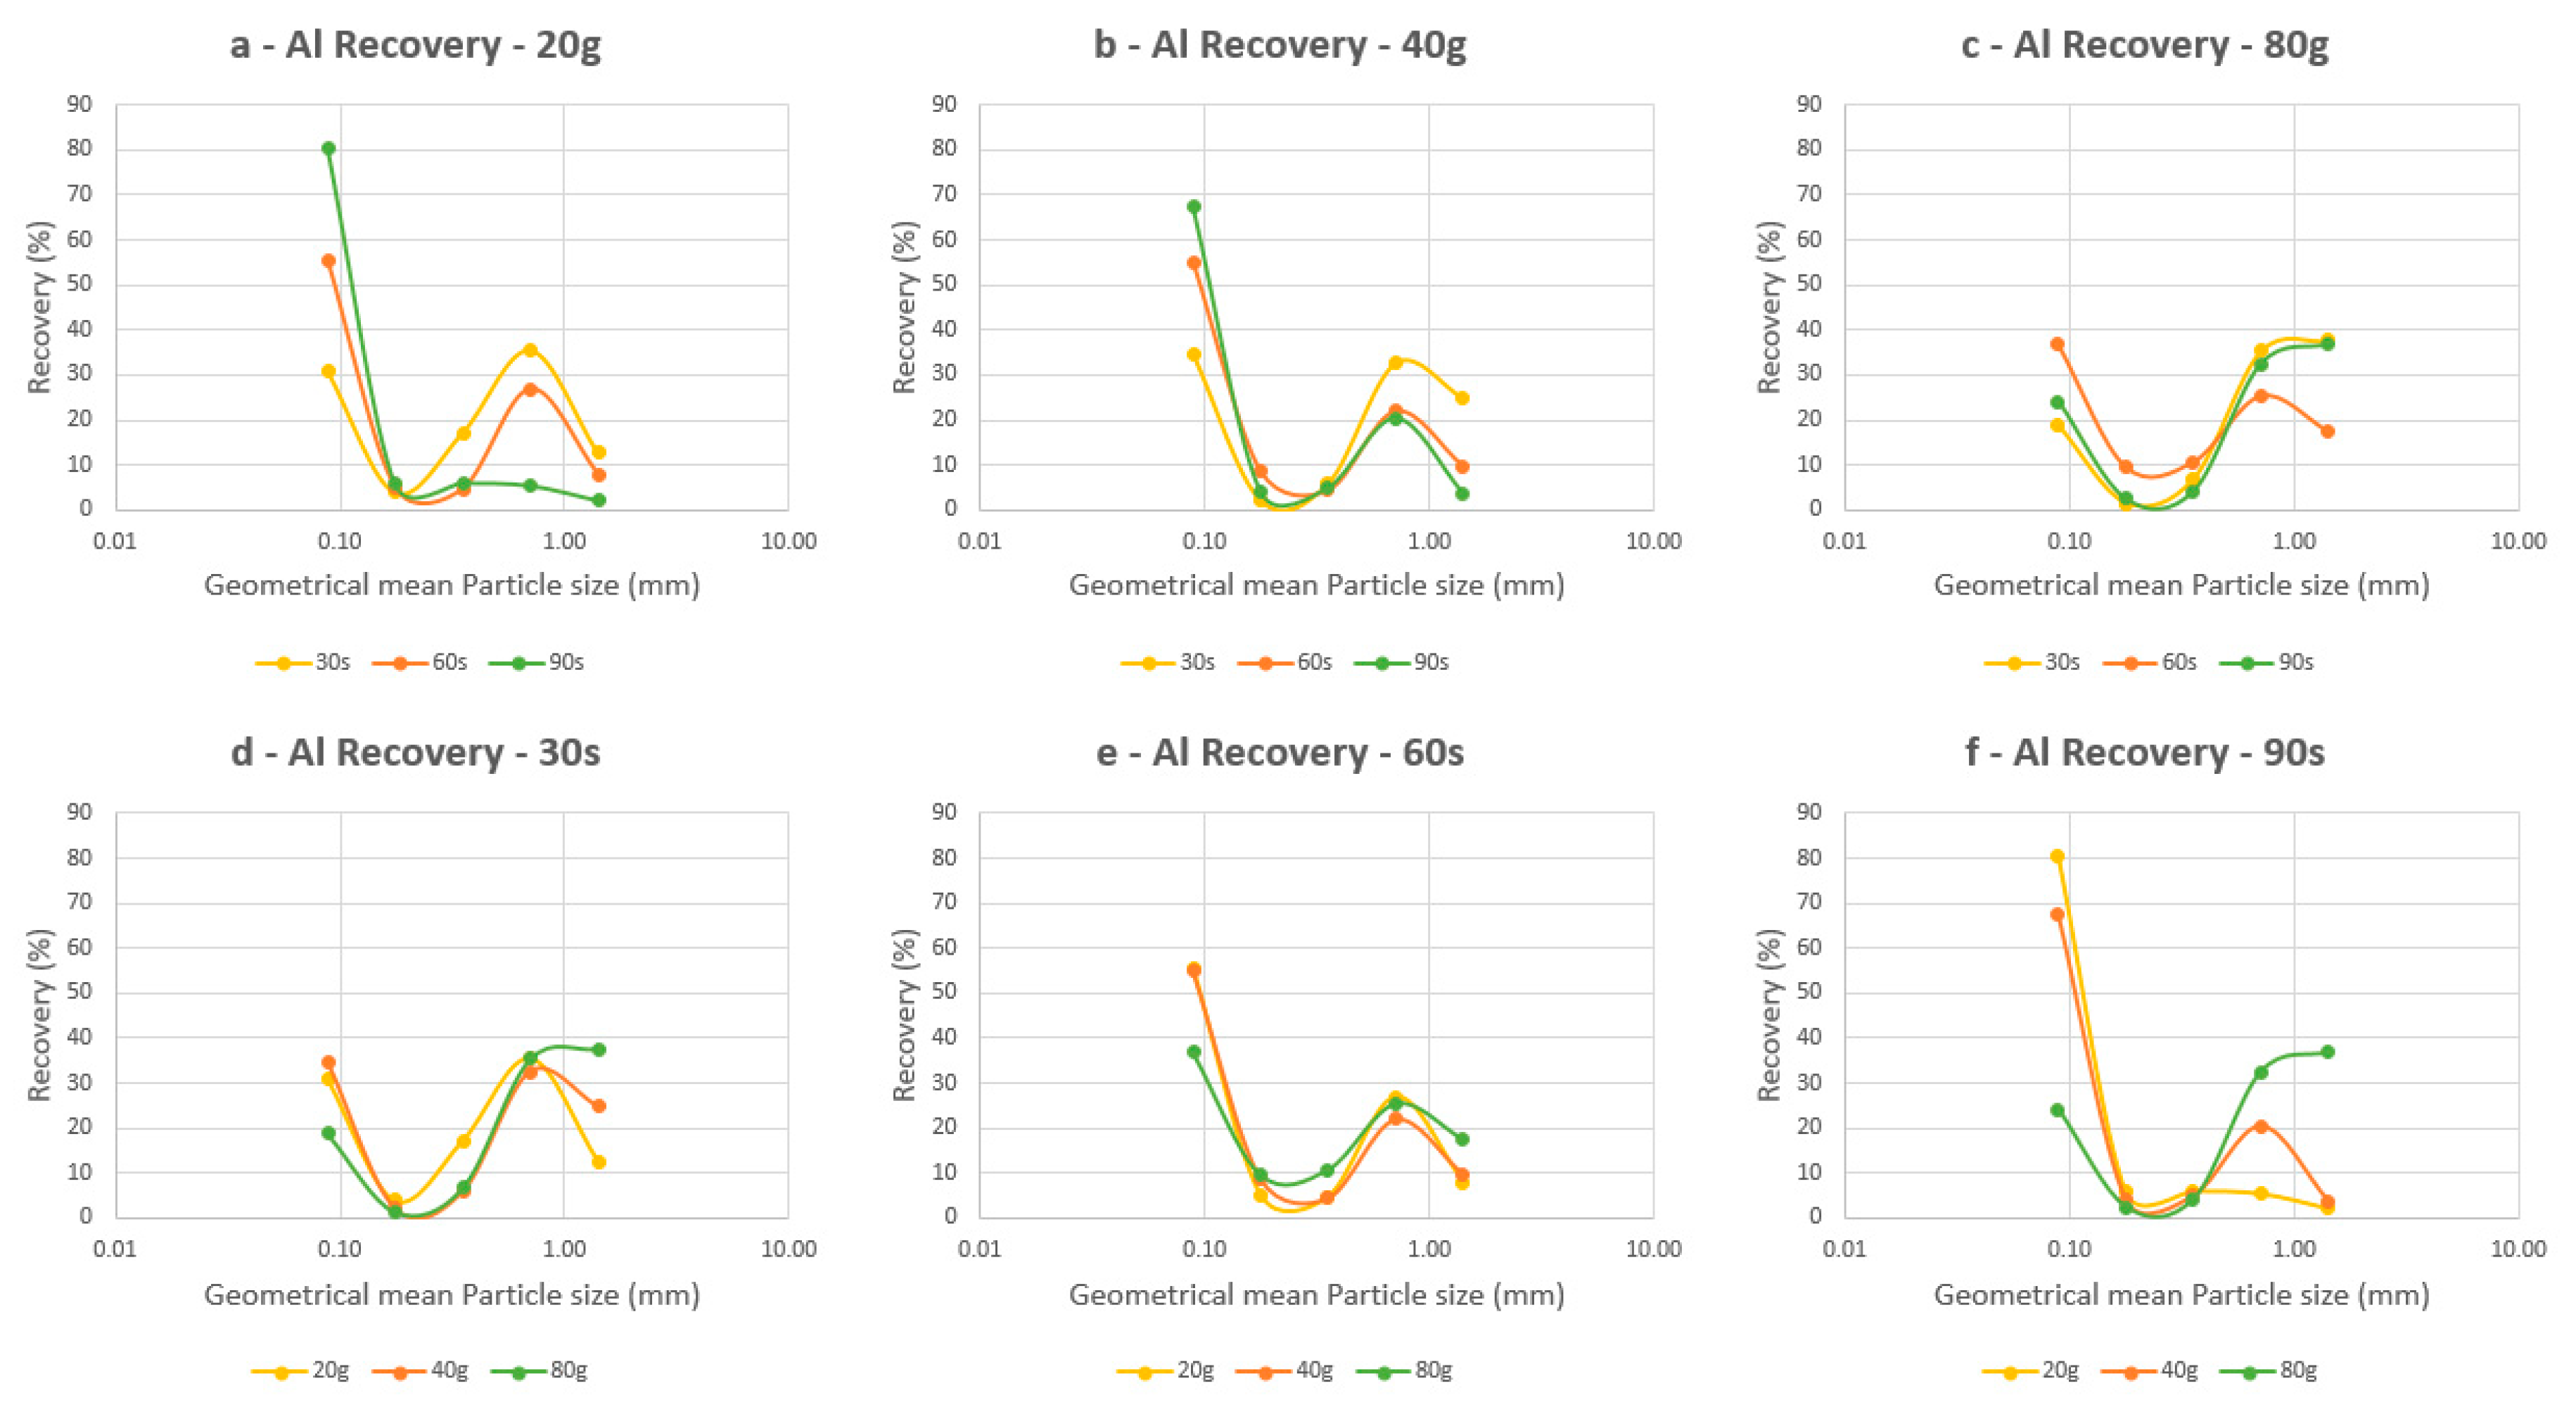
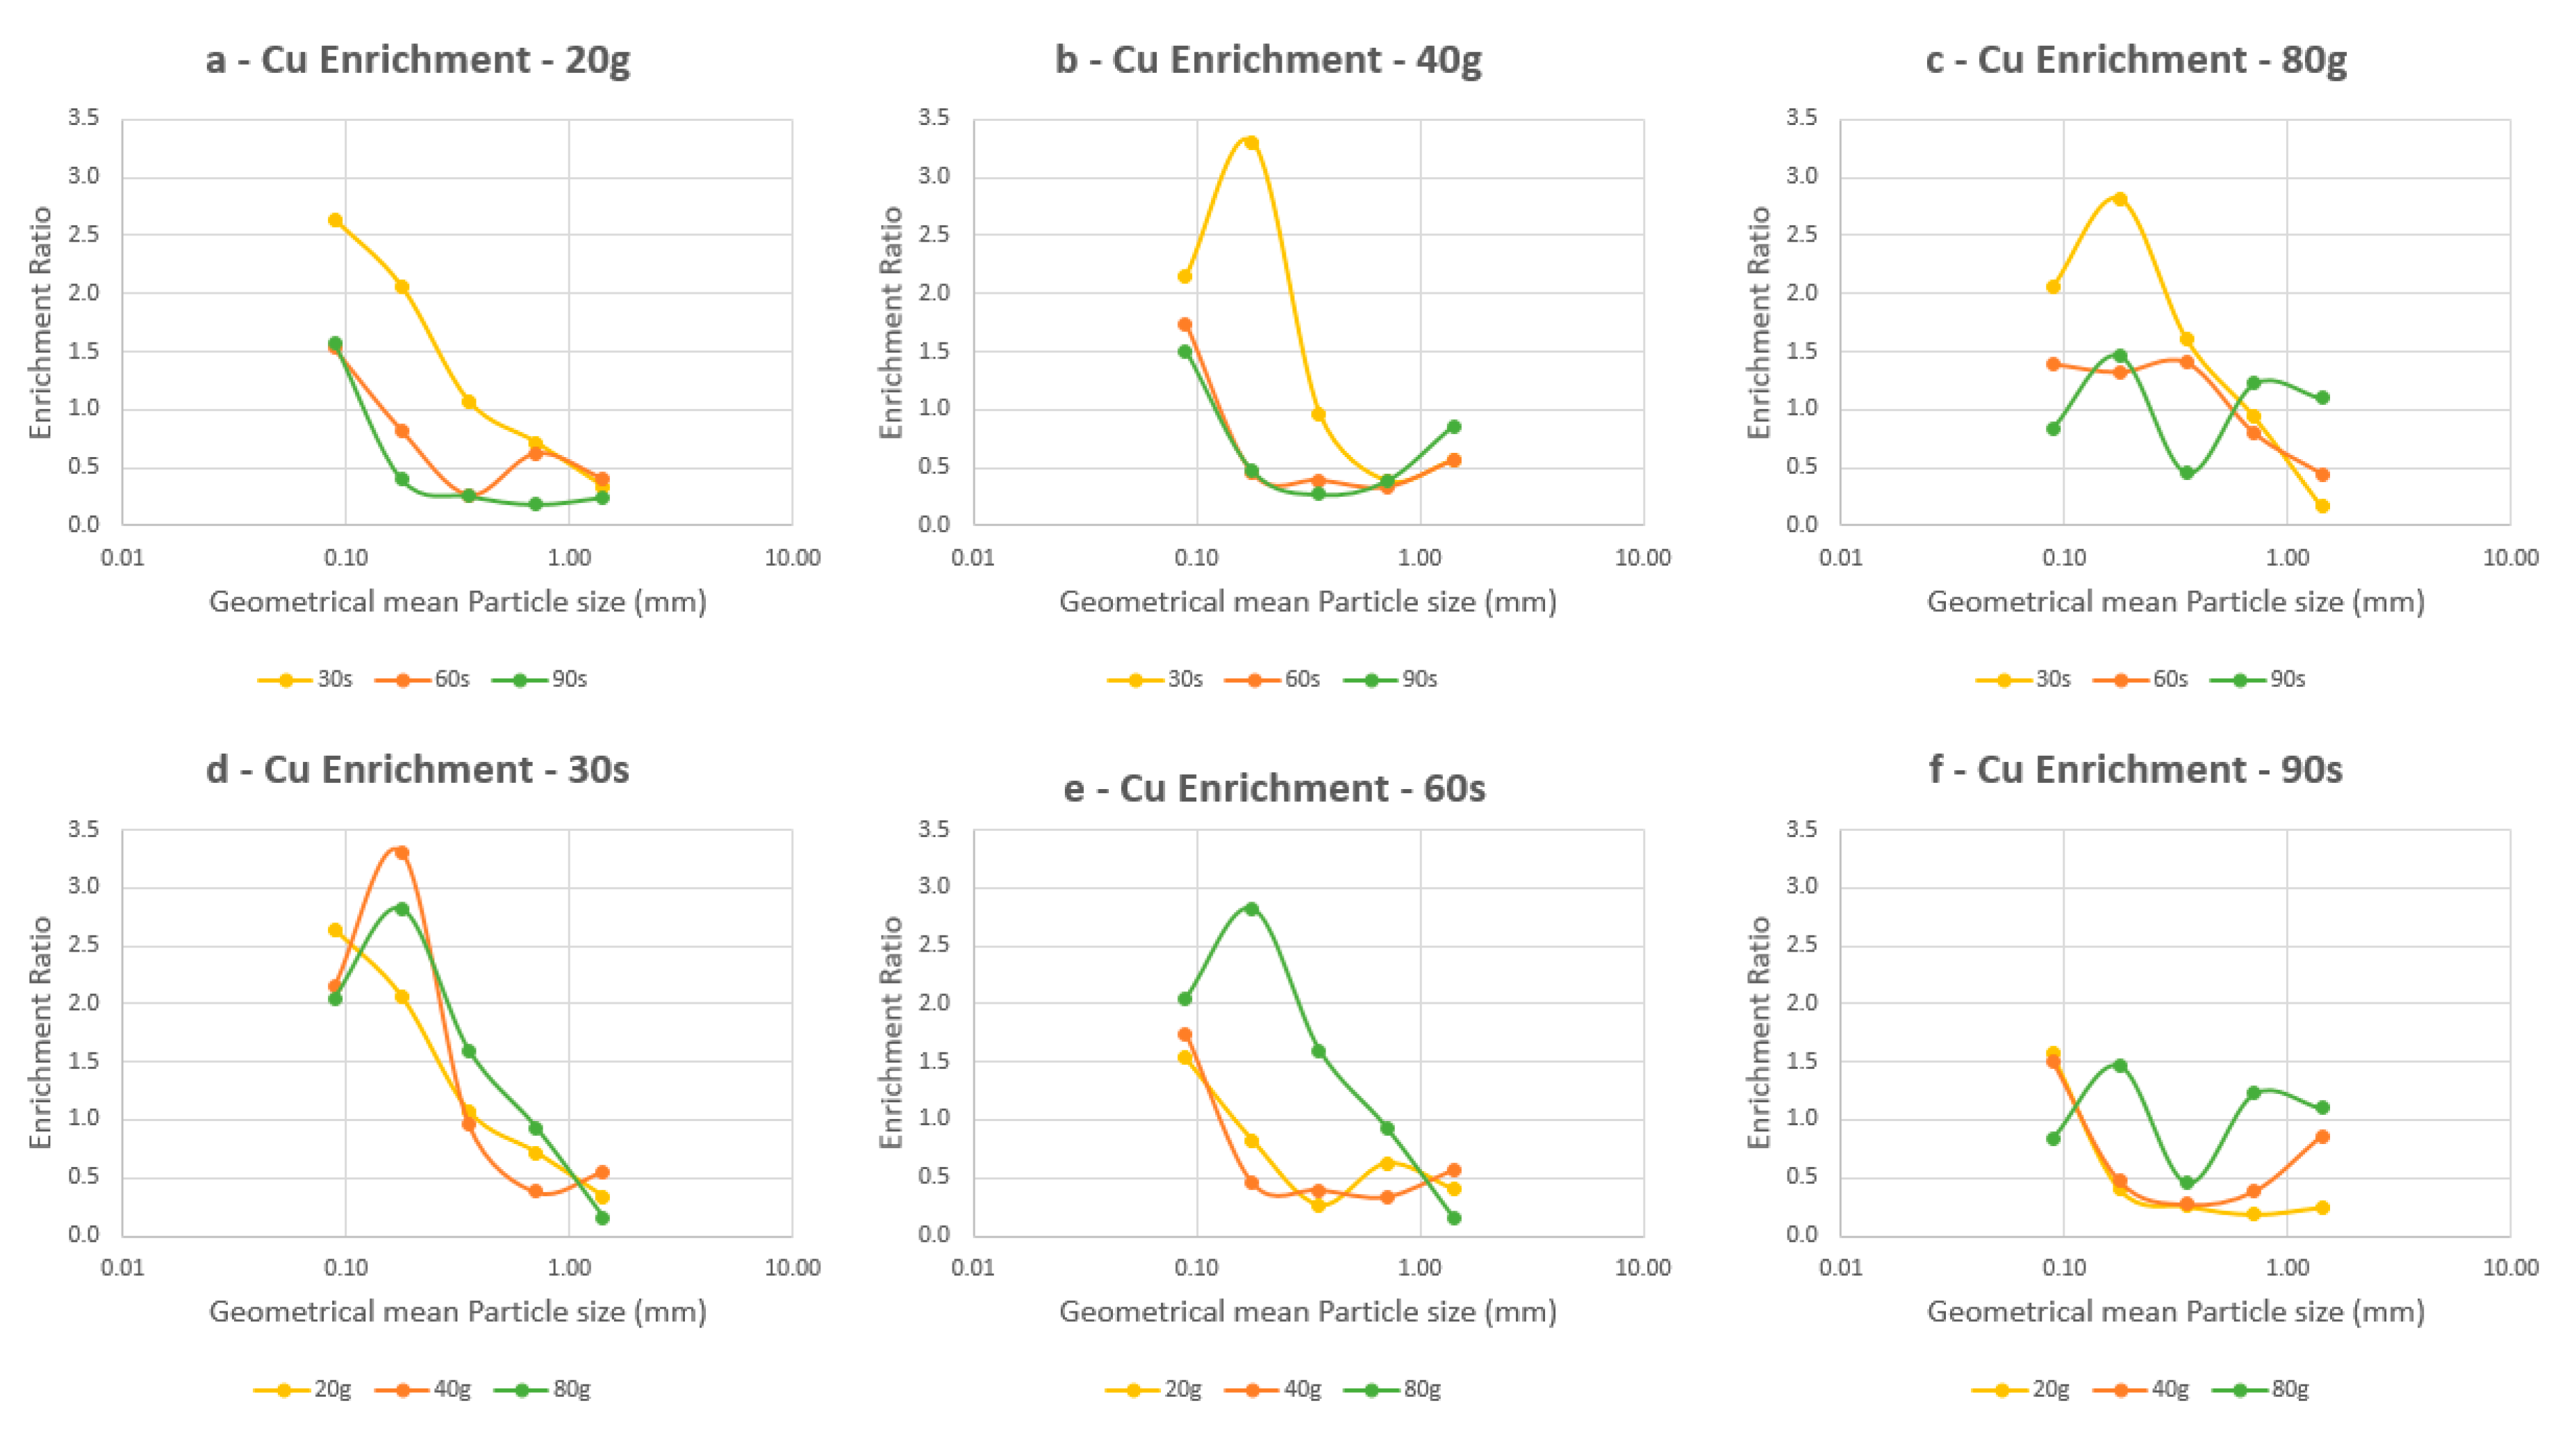
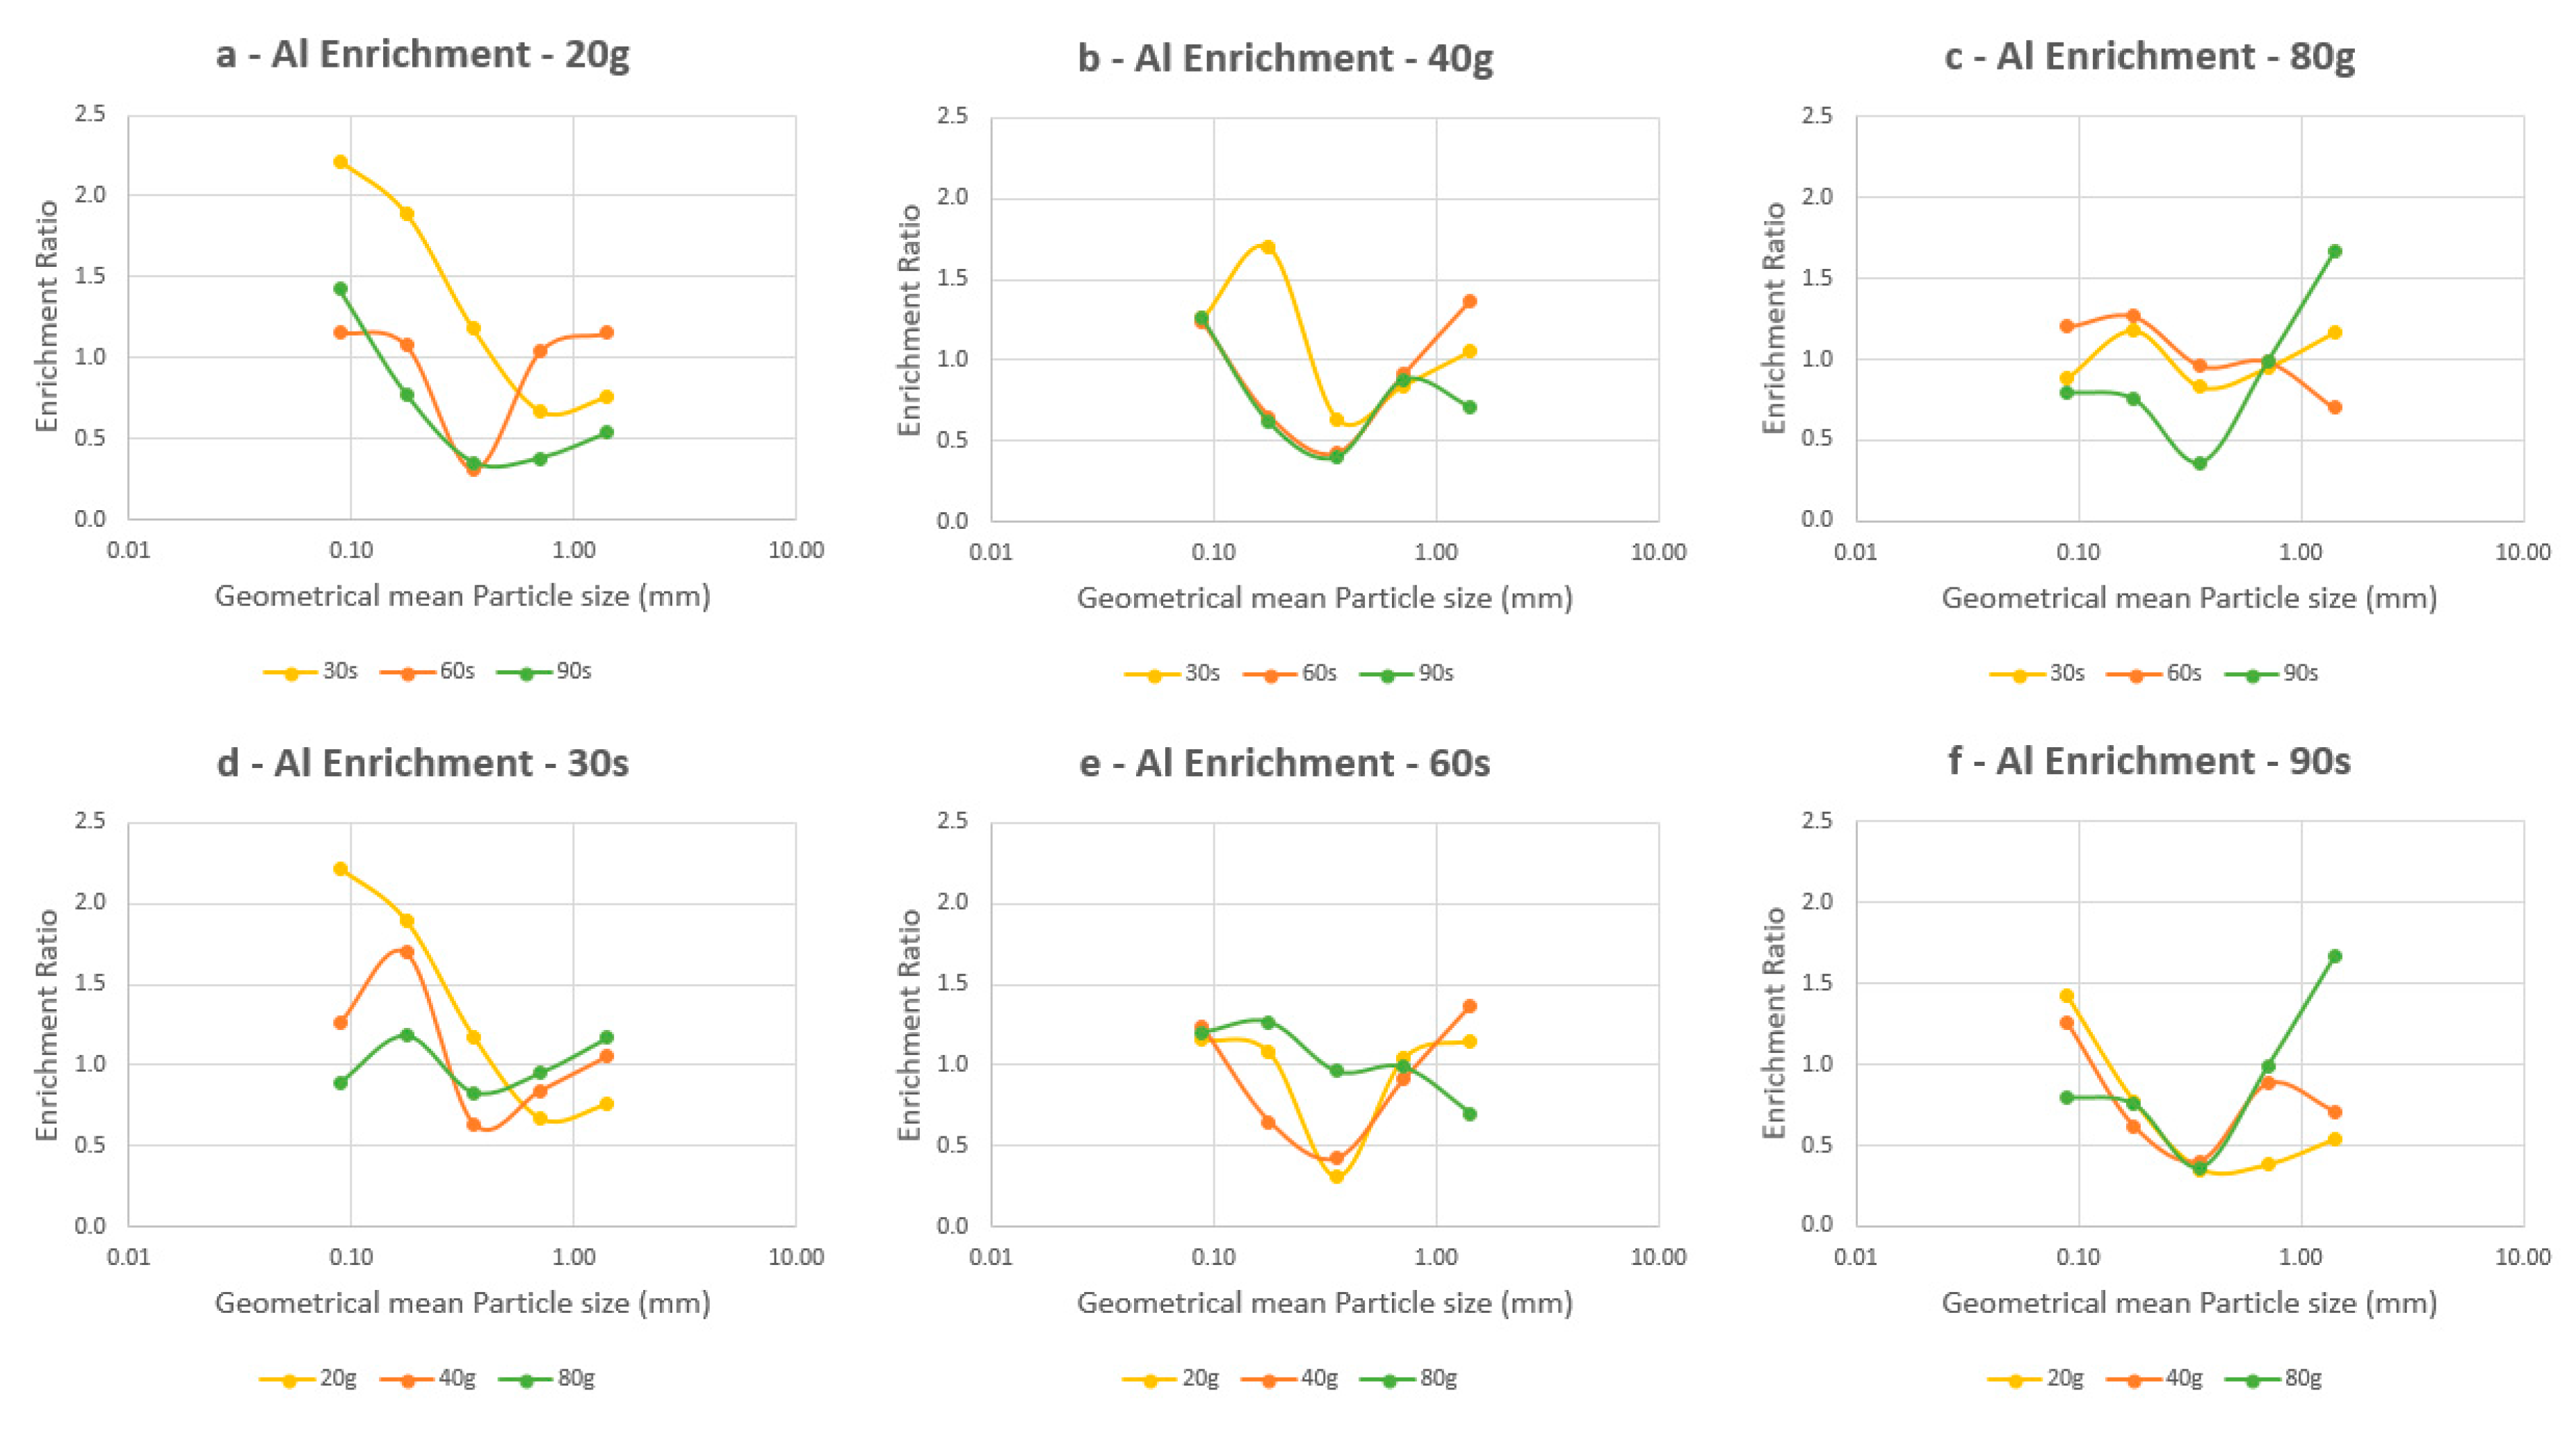
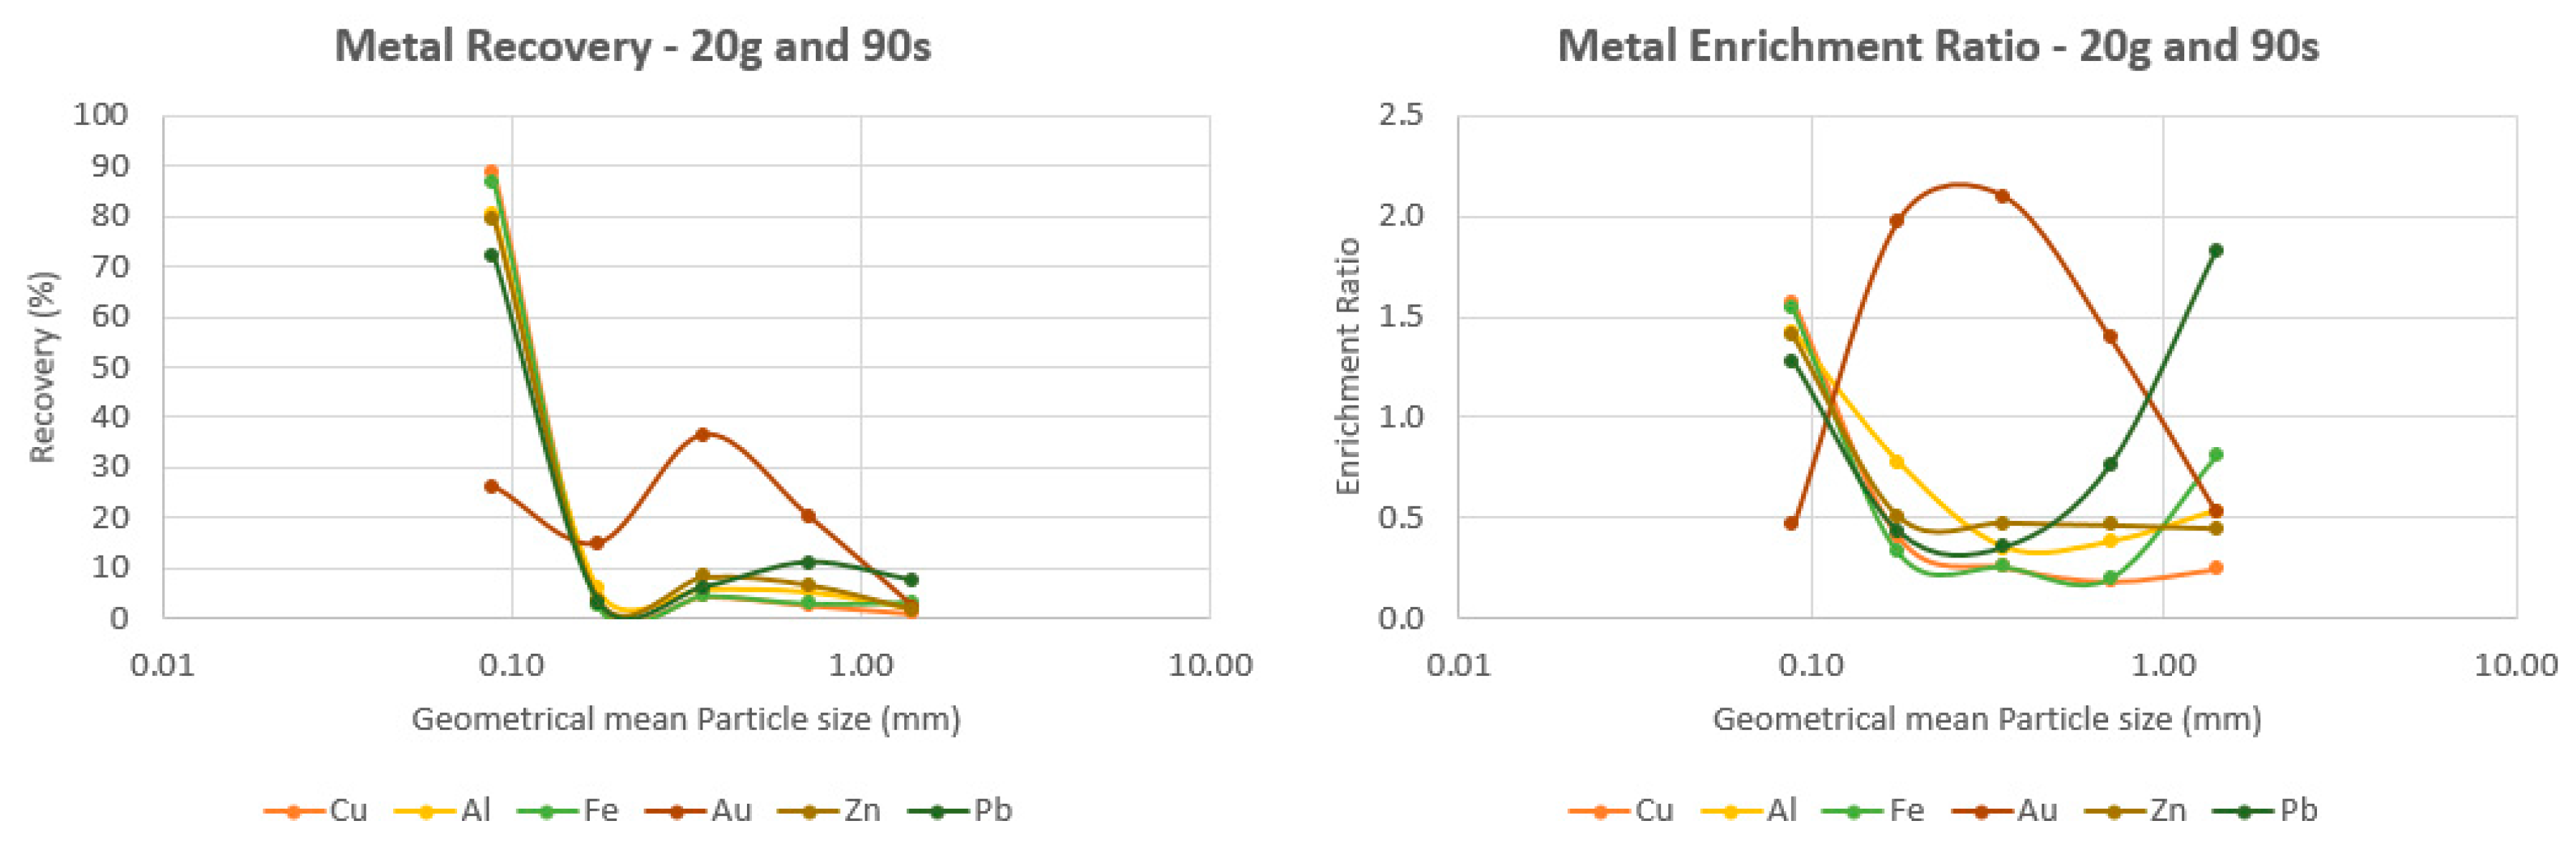
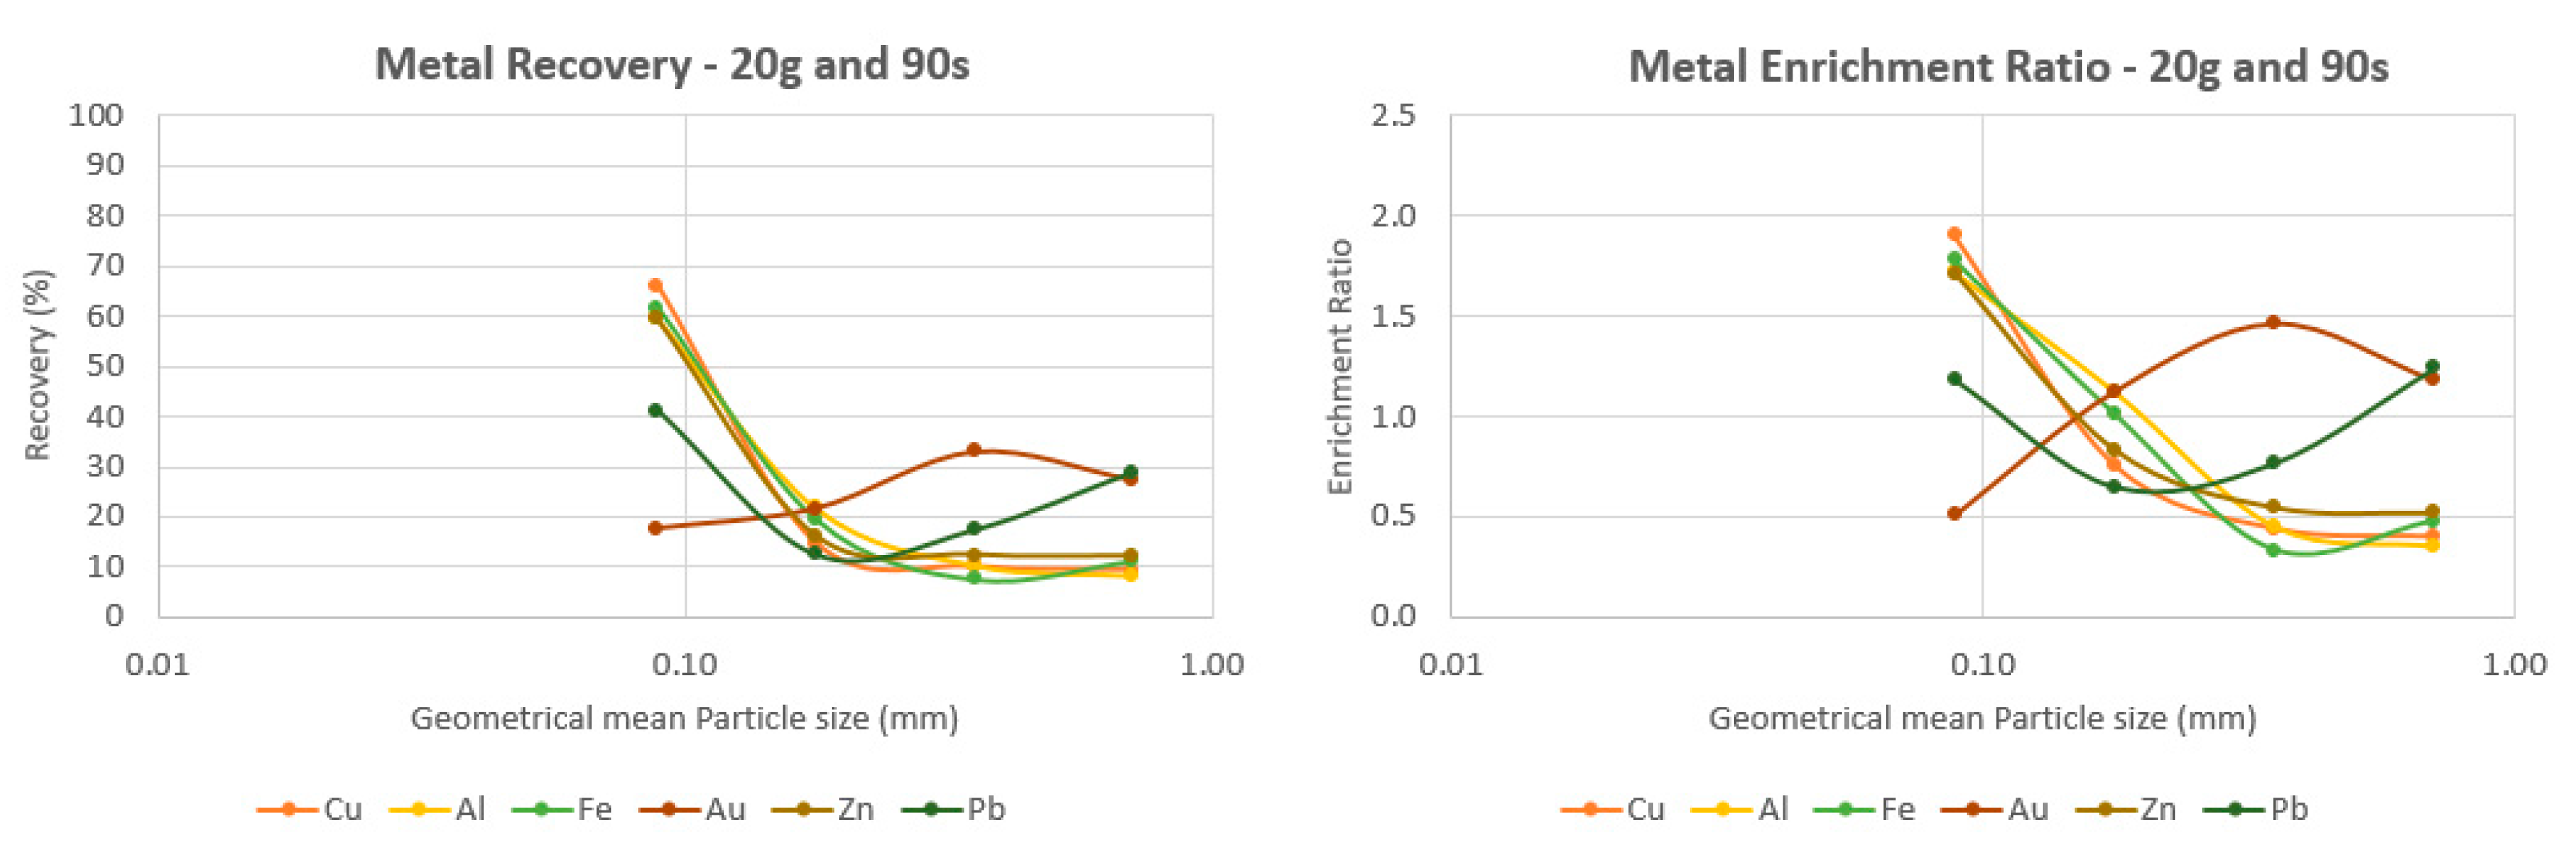
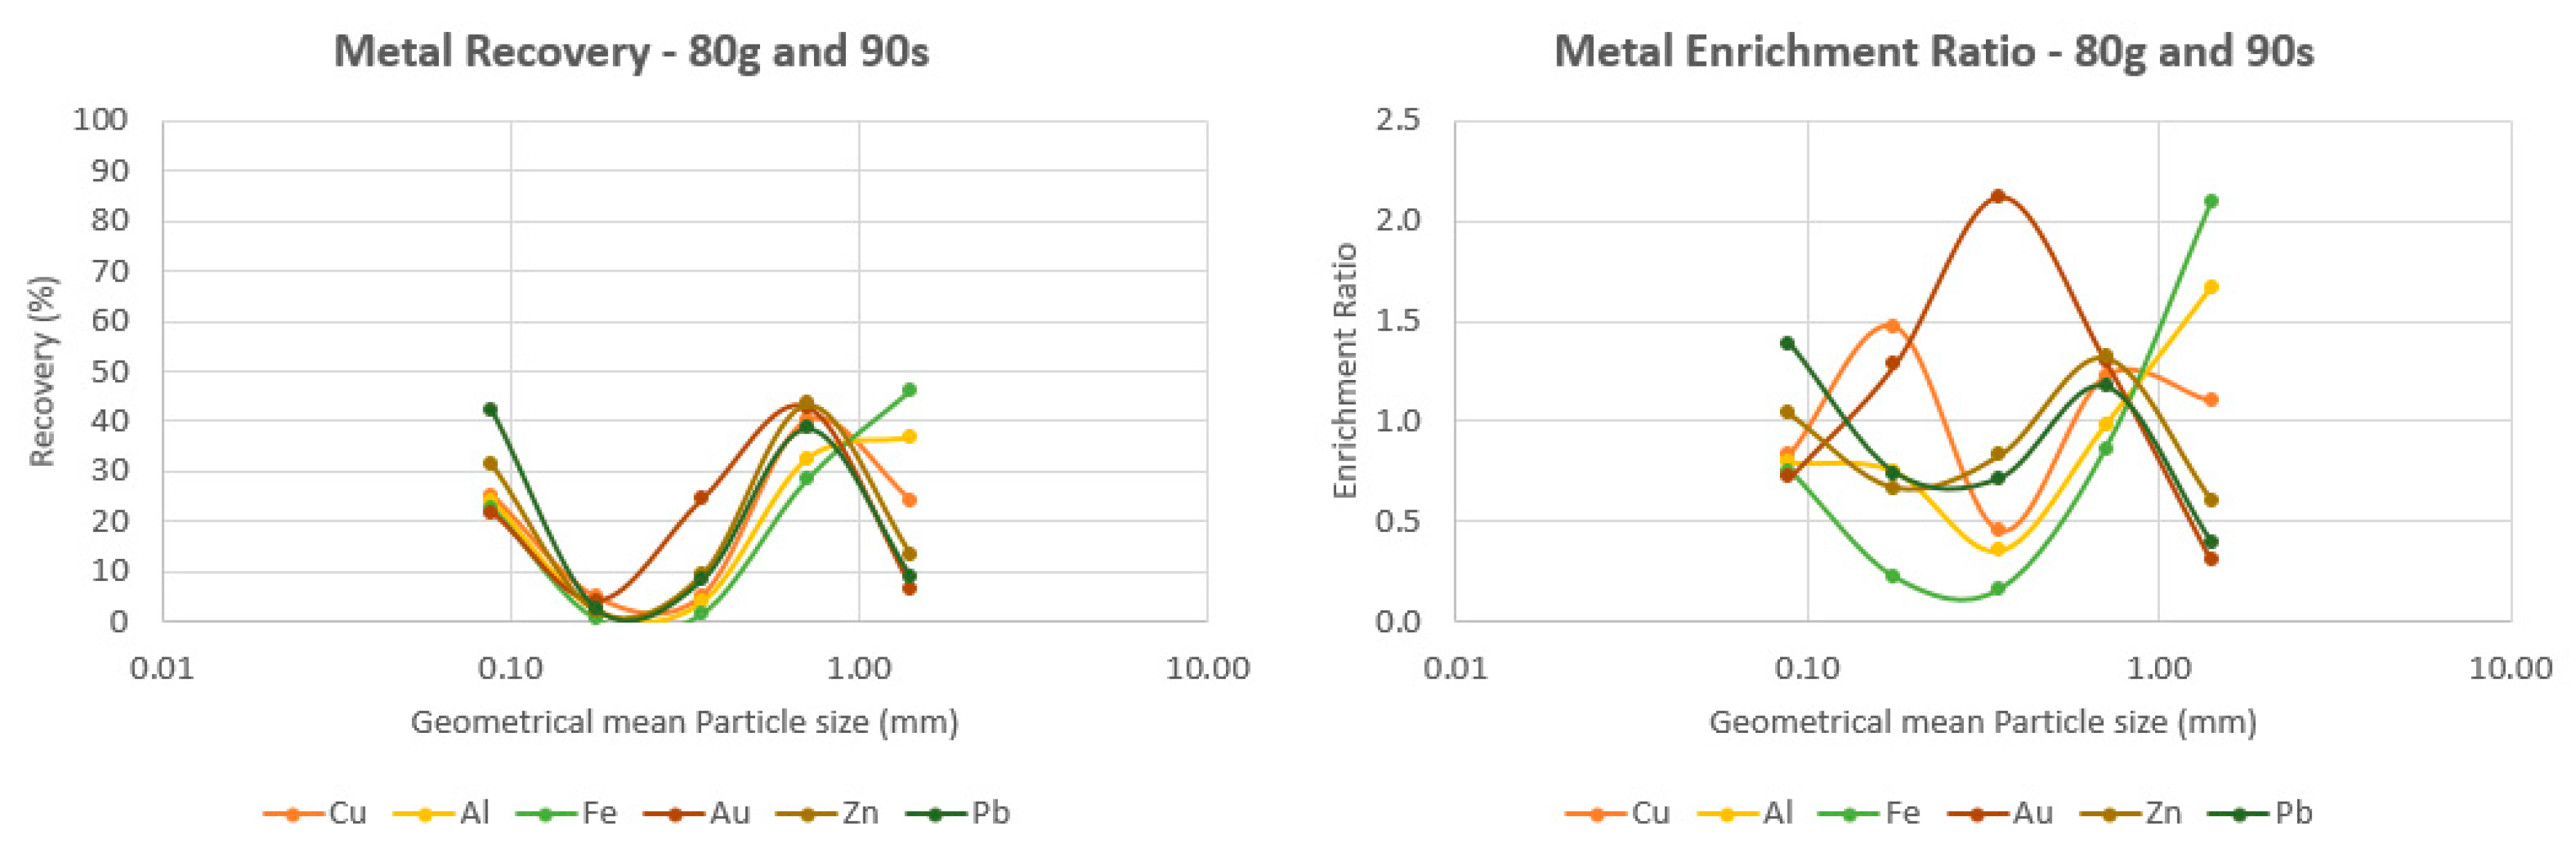
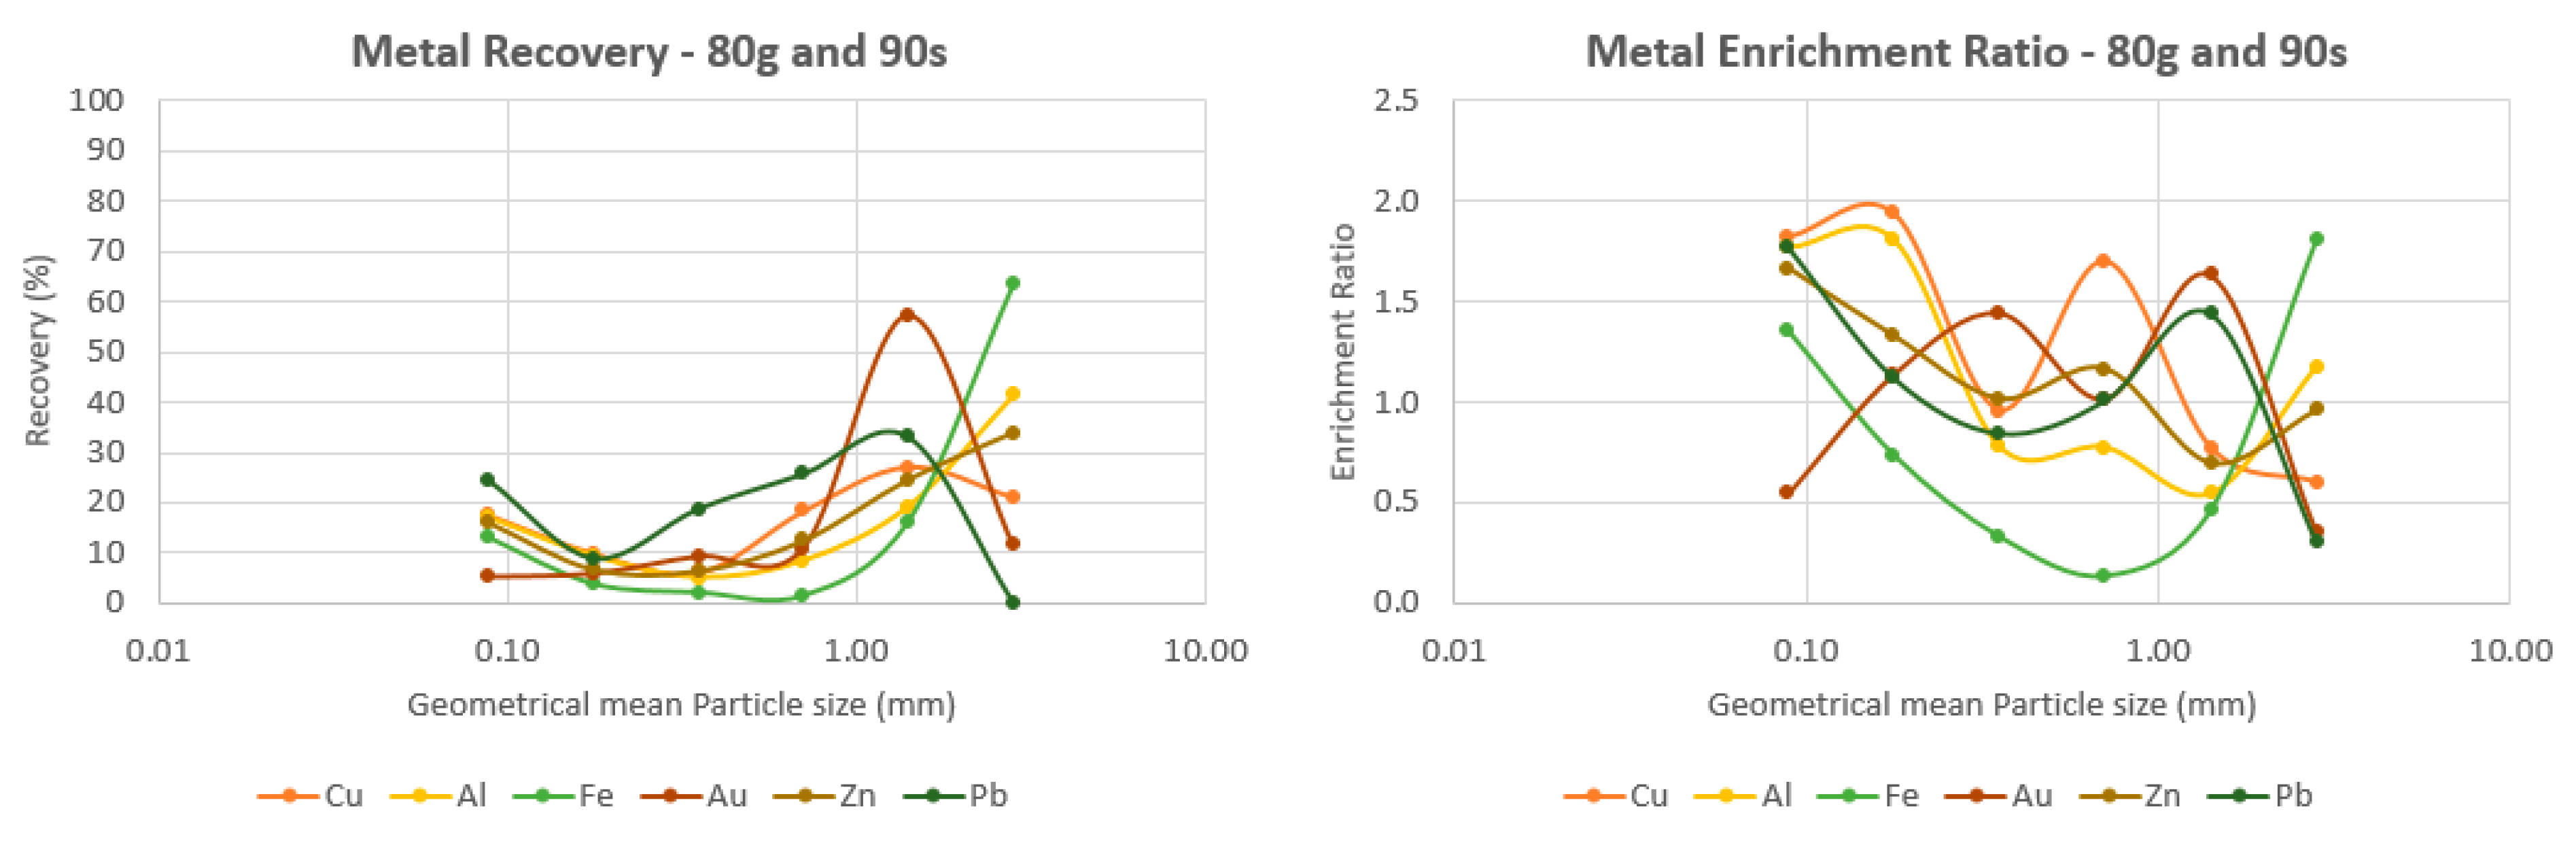
3.2. Metal Recovery and Enrichment Ratio

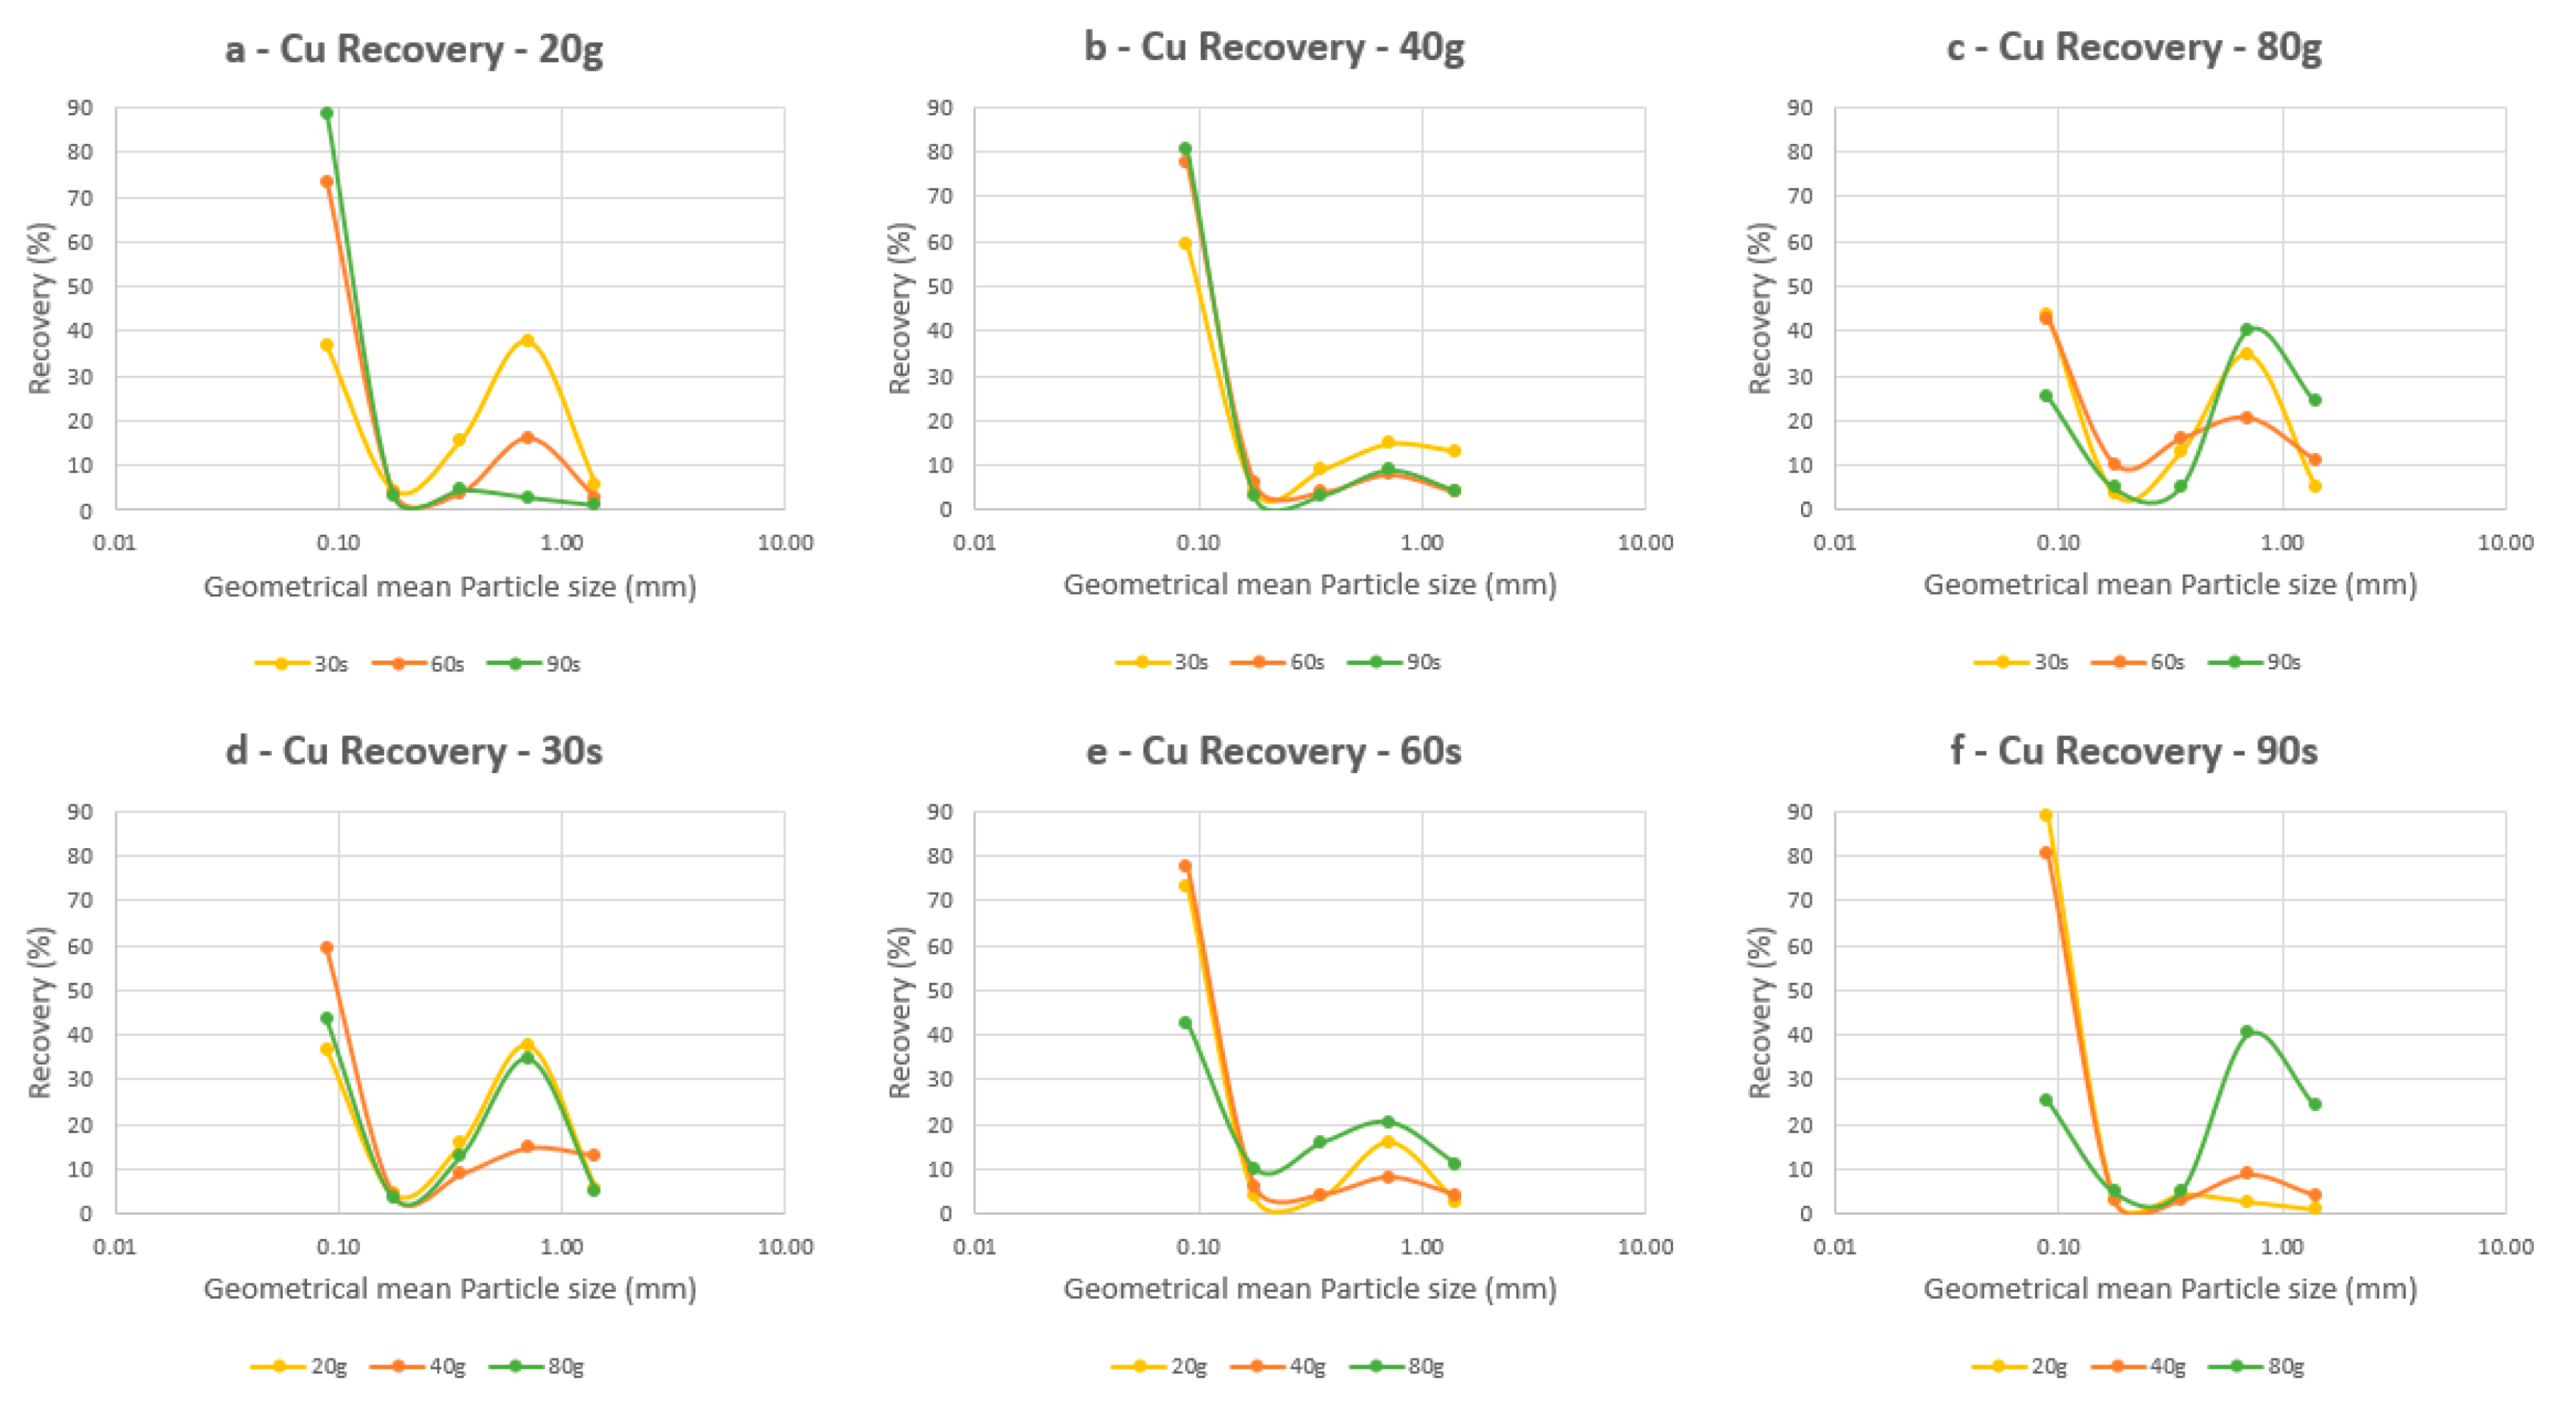
3.2.1. Behavior of Cu and Al

The recovery and enrichment ratio of several metals of our interests (i.e., Cu, Al, Fe, Au, Zn, Pb) after hammer milling were calculated and their plots are given below. The effects of the feed mass and milling time are discussed. First, the results of the two major metals, Cu and Al, are described and discussed in Figure 4, Figure 5, Figure 6, Figure 7 and Figure 8, followed by the results and discussion including all the six metals (Figure 9, Figure 10, Figure 11 and Figure 12). In order to calculate the recovery and enrichment, a back-calculation of the different metal feed grade was performed through reconciliation of the datasets. Due to some material loss during the milling and product recovery, the back-calculation is necessary to obtain representative values of metal recovery in each size fraction, instead of directly using the raw feed grade detected by the XRF measurements as they were. The error bars were not added in the Figures in order to maintain their better readability. The error range was between 0.000392 and 4.77%.
Figure 4 shows the Cu recovery at constant feed mass under different milling time (a–c) while for a constant milling time with different feed mass (d–f). In general, there is a clear trend of Cu concentration in coarse (0.5–1 mm) and fine (−0.125 mm) size fractions with its absence/minimum concentration in the middle (0.125–0.5 mm) size fraction. It indicates the selective enrichment of Cu in those coarse and fine size fractions after the hammer milling. Enrichment into fine size can be explained by selective Cu liberation (Figure 5a) while the enrichment in coarse size can be due to the selective agglomeration (Figure 5b). Figure 5c shows a typical Cu agglomerate formed during hammer milling operation. The agglomeration can be due to the mechano-chemical reaction enhanced by the heat generated inside the mill chamber. Similar agglomerate formations were reported by the application of a ball mill [19]. The mechanism study is not within the focus of this paper; but it could be performed in our future work.
Figure 4 shows that the Cu recovery for 30 s milling time is considerably higher both in the finest (above 35% for all the feed mass) and a coarse fraction (0.5–1 mm) for a feed mass of 20 g (37.76%) and 40 g (14.74%). When the feed mass increased to 80 g, slightly different Cu recovery behavior was obtained while the general trend is similar. Figure 4c shows that with the increase in milling time the Cu recovery in the finest size fraction decreased to 26% (90 s) from 43% (60 s) while the Cu recovery in the coarse fraction (0.5–1 mm) increased to 40% (90 s) from 20% (60 s). This indicates the Cu agglomeration enhanced more than the Cu size reduction, with increasing milling time. Overall, a trend that is easily recognized is that for the intermediate fractions (0.125–0.5 mm), regardless of the milling conditions (i.e., different feed mass and milling time), the recoveries were considerably low, sometimes even close to 0%.
Figure 6 shows that the Al recovery behavior is similar to the Cu recovery, especially for the lower feed mass i.e., 20 g and 40 g (Figure 6a,b). A clearly different trend is observed for the Al recovery with the feed mass of 80 g (Figure 6c), the highest recoveries were obtained in the coarser fraction (18–38%) and lowest recoveries in the finest fraction (20–38%), indicating less milling and/or more agglomeration (Figure 2 and Figure 3). That can be explained by the enhancement of particle collisions with the higher feed mass and thus more agglomeration. For the fixed milling times (Figure 6d–f), the high Al recovery in a coarser fraction (0.5–1 mm) is more pronounced with the least milling time (30 s, 36% with 80 g feed mass, Figure 6d) and less pronounced with longer time (60 s, 25% with 80 g feed mass, Figure 6e; 90 s, 32% with 80 g feed mass, Figure 6f). This trend is more intense but similar to the global low recovery for Cu in the coarser fractions (Figure 4d–f), and confirmed that less time enhanced more agglomeration than size reduction.
Figure 7 and Figure 8 show the Cu and Al enrichment ratio after hammer milling, respectively, using the same set of experimental conditions as shown in Figure 4 and Figure 6. In Figure 7, the Cu enrichment is especially prominent with the 30 s milling time in comparison with the other milling times at a fixed feed mass rate (Figure 7a–c), and with an enrichment peak in the finer fractions (i.e., 0.125–0.25 mm and −0.125 mm). For example, the enrichment ratio was 2.8 in 0.125–0.25 mm while 0.2 in 1–2 mm with 80 g feed mass and 30 s milling time (Figure 7c). At a fixed grinding time (Figure 7d–f), the variation in the feed mass rate is not as conclusive in terms of which feed mass rate provides the optimal enrichment ratios, although the general trend of high enrichment into the finer fractions was achieved (e.g., 2.6 in −0.125 mm vs 0.3 in 1–2 mm with 20 g feed mass and 30 s milling time, Figure 7a).
Figure 8 shows the Al enrichment varies and more enrichment in coarse size fraction in comparison with the Cu enrichment (Figure 7). This trend also agrees with the Al recovery trends shown in Figure 6. Figure 8c,f clearly show that 80 g feed increased the enrichment ratio of Al (1.7 for 90 s) in the coarsest size fraction (1–2 mm) due to agglomeration with a higher probability of particle collision, in comparison with the finest size fraction (0.8 for 90 s in −0.125 mm). Figure 8b shows that with 40 g feed mass the similar enrichment ratio in the coarsest size fraction (1.4 in 1–2 mm vs 1.3 in −0.125 mm for both 60 s) but less intense comparing with 80 g feed (Figure 8c). Increasing the milling time to 90 s with 40 g feed enhanced the size reduction than agglomeration (0.7 in 1–2 mm vs 1.3 in −0.125 mm), as shown in Figure 8b.
Comparing between the Cu (Figure 7) and Al (Figure 8) enrichment ratio, there is a slightly higher possibility to obtain a higher Al enrichment ratio in the coarse size fractions than the one of the Cu enrichment ratio. Such difference can be due to the slightly higher ductility of Al (0.65) than Cu (0.62) [20], leading the higher probability of agglomeration formation. This trend agreed with a previous report by Zhang and Forssberg (1999) [21] who briefly pointed out the ball shaped Al particle formation.
For example, 80 g feed mass for 90 s milling time (Figure 8c) and 40 g feed mass for 60 s milling time (Figure 8b) gave the higher Al enrichment ratio in the coarsest size fraction (1–2 mm; 1.7 for 80 g/90 s; 1.4 for 40 g/60 s) than the finest size fraction (−0.125 mm; 0.8 for 80 g/90 s; 1.3 for 40 g/60 s). Under the 80 g feed mass and 90 s milling time condition, this Al enrichment is well correlated with the highest and selective Al recovery in the coarsest size fraction (Figure 6f, 36% in 1–2 mm vs 25% in −0.125 mm, 80 g/90 s).

3.2.2. Behavior of all the Six Elements

Based on the results discussed in Figure 4, Figure 5, Figure 6, Figure 7 and Figure 8, two conditions were plotted and discussed in order to understand the behavior of other metals (i.e., Fe, Zn, Pb and Au). They were (1) selective size reduction condition (20 g feed mass and 90 s milling time) and (2) selective agglomeration condition (80 g feed mass and 90 s milling time). These two conditions were selected because they exhibited the best results in terms of the metal recovery and enrichment ratio, especially for Cu. Figure 9a (feed 1–2 mm) and Figure 10a (feed 2–4 mm). The general trend is similar to Cu (Figure 4) and partially Al (Figure 6), meaning that all the metals (except Au) investigated reached their peak recoveries in the finest size fraction (−0.125 mm).
Figure 9b shows that from the 1–2 mm feed with selective size reduction conditions (20 g feed mass and 90 s milling time) the enrichment ratio of the majority of metals (Zn, Fe, Cu, Al) is high (1.4–1.7) in the finest fraction (−0.125 mm) while it is also high in the coarsest fraction (1–2 mm) with Pb (1.8). Figure 10b shows the similar trend; but confirmed more intense selective enrichment into the finest size fraction, except Pb and Au.
The Au is enriched into an intermediate size fraction (0.25–0.5 mm, enrichment ratio 2.2). One possibility of the unique Au recovery and enrichment ratio can be related to its association with the plastics that was reported to concentrate in middle size fraction after hammer milling [4] and can be associated with Au used either as a conductive contact between components or used in the printed pathways of the circuits.
Figure 11a (feed 1–2 mm) and Figure 12a (feed 2–4 mm) indicate the selective agglomeration previously discussed for the metallic recovery plots, not only for Cu and Al but also confirmed with the other elements (Fe, Au, Zn, Pb). The coarse fraction achieved the highest obtained recoveries (about 40–45%, e.g., ReCu = 40.34% in the size fraction 0.5–1 mm). Under this selective agglomeration conditions, the enrichment ratio, shown in Figure 11b (feed 1–2 mm) and Figure 12b (feed 2–4 mm) of the different metals, is high (>1) in coarse size fraction(s), as opposed to the selective size reduction condition (20 g feed mass and 90 s milling time) that only Pb is enriched in the coarsest size fraction. Again, for the feed size 1–2 mm, the metal Au exhibited its steep enrichment into an intermediate size fraction. This behavior is less obvious with the 2–4 mm feed, indicating the effect of pre-weakening stage is present. In other words, the higher liberation prior to the hammer milling operation can further enhance liberation and enrichment of Au into a specific size fraction.

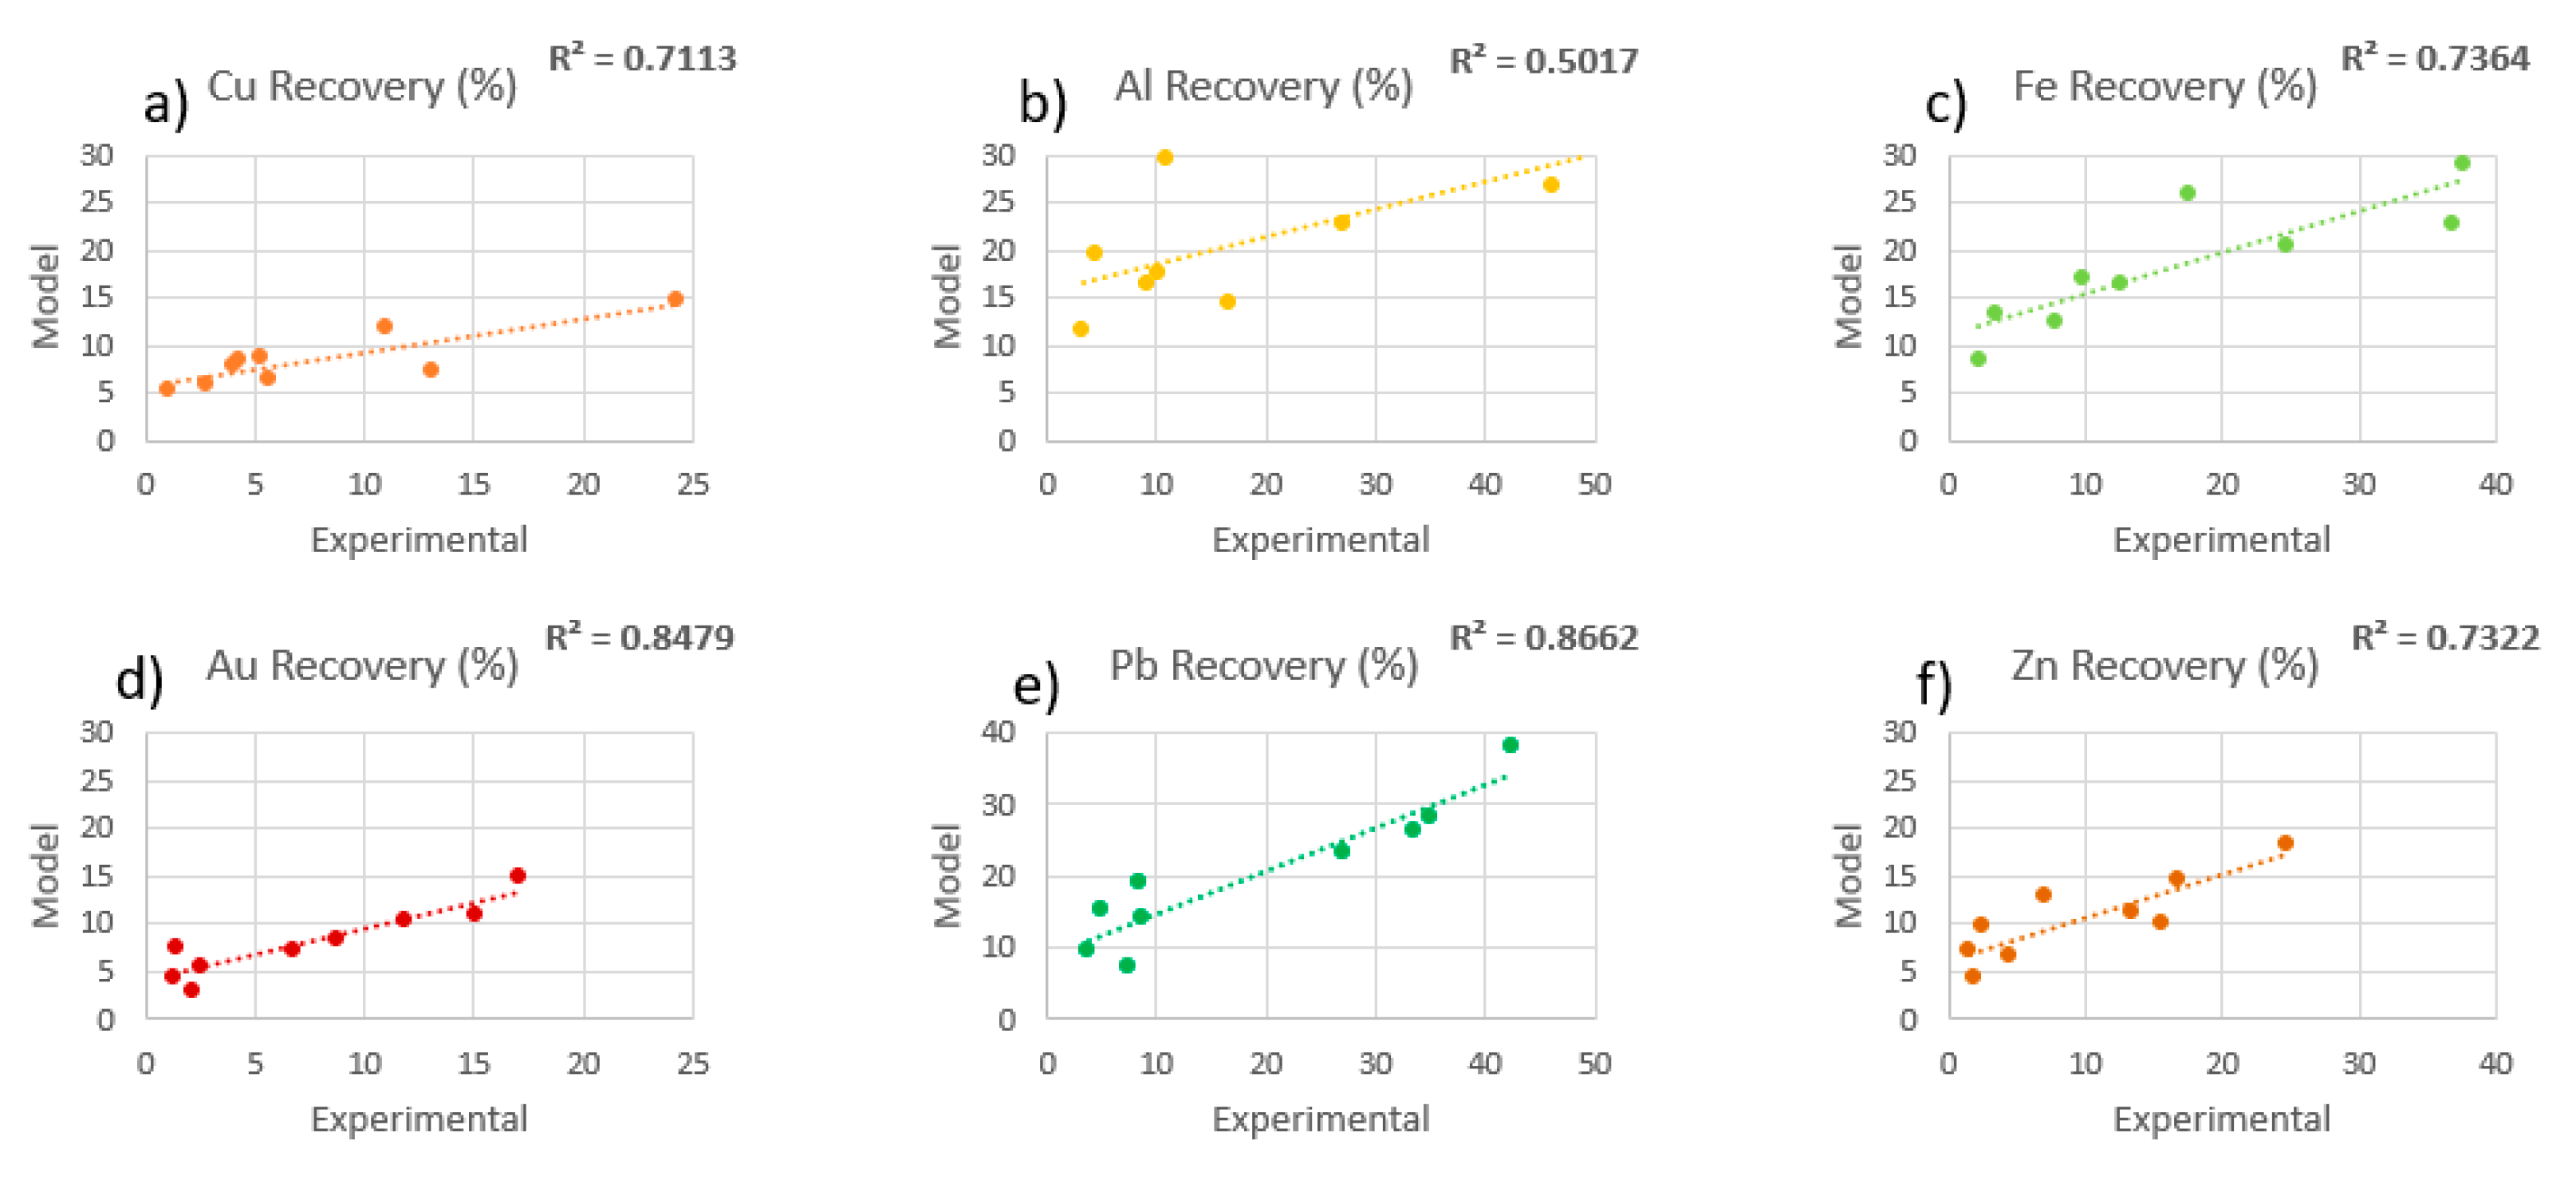
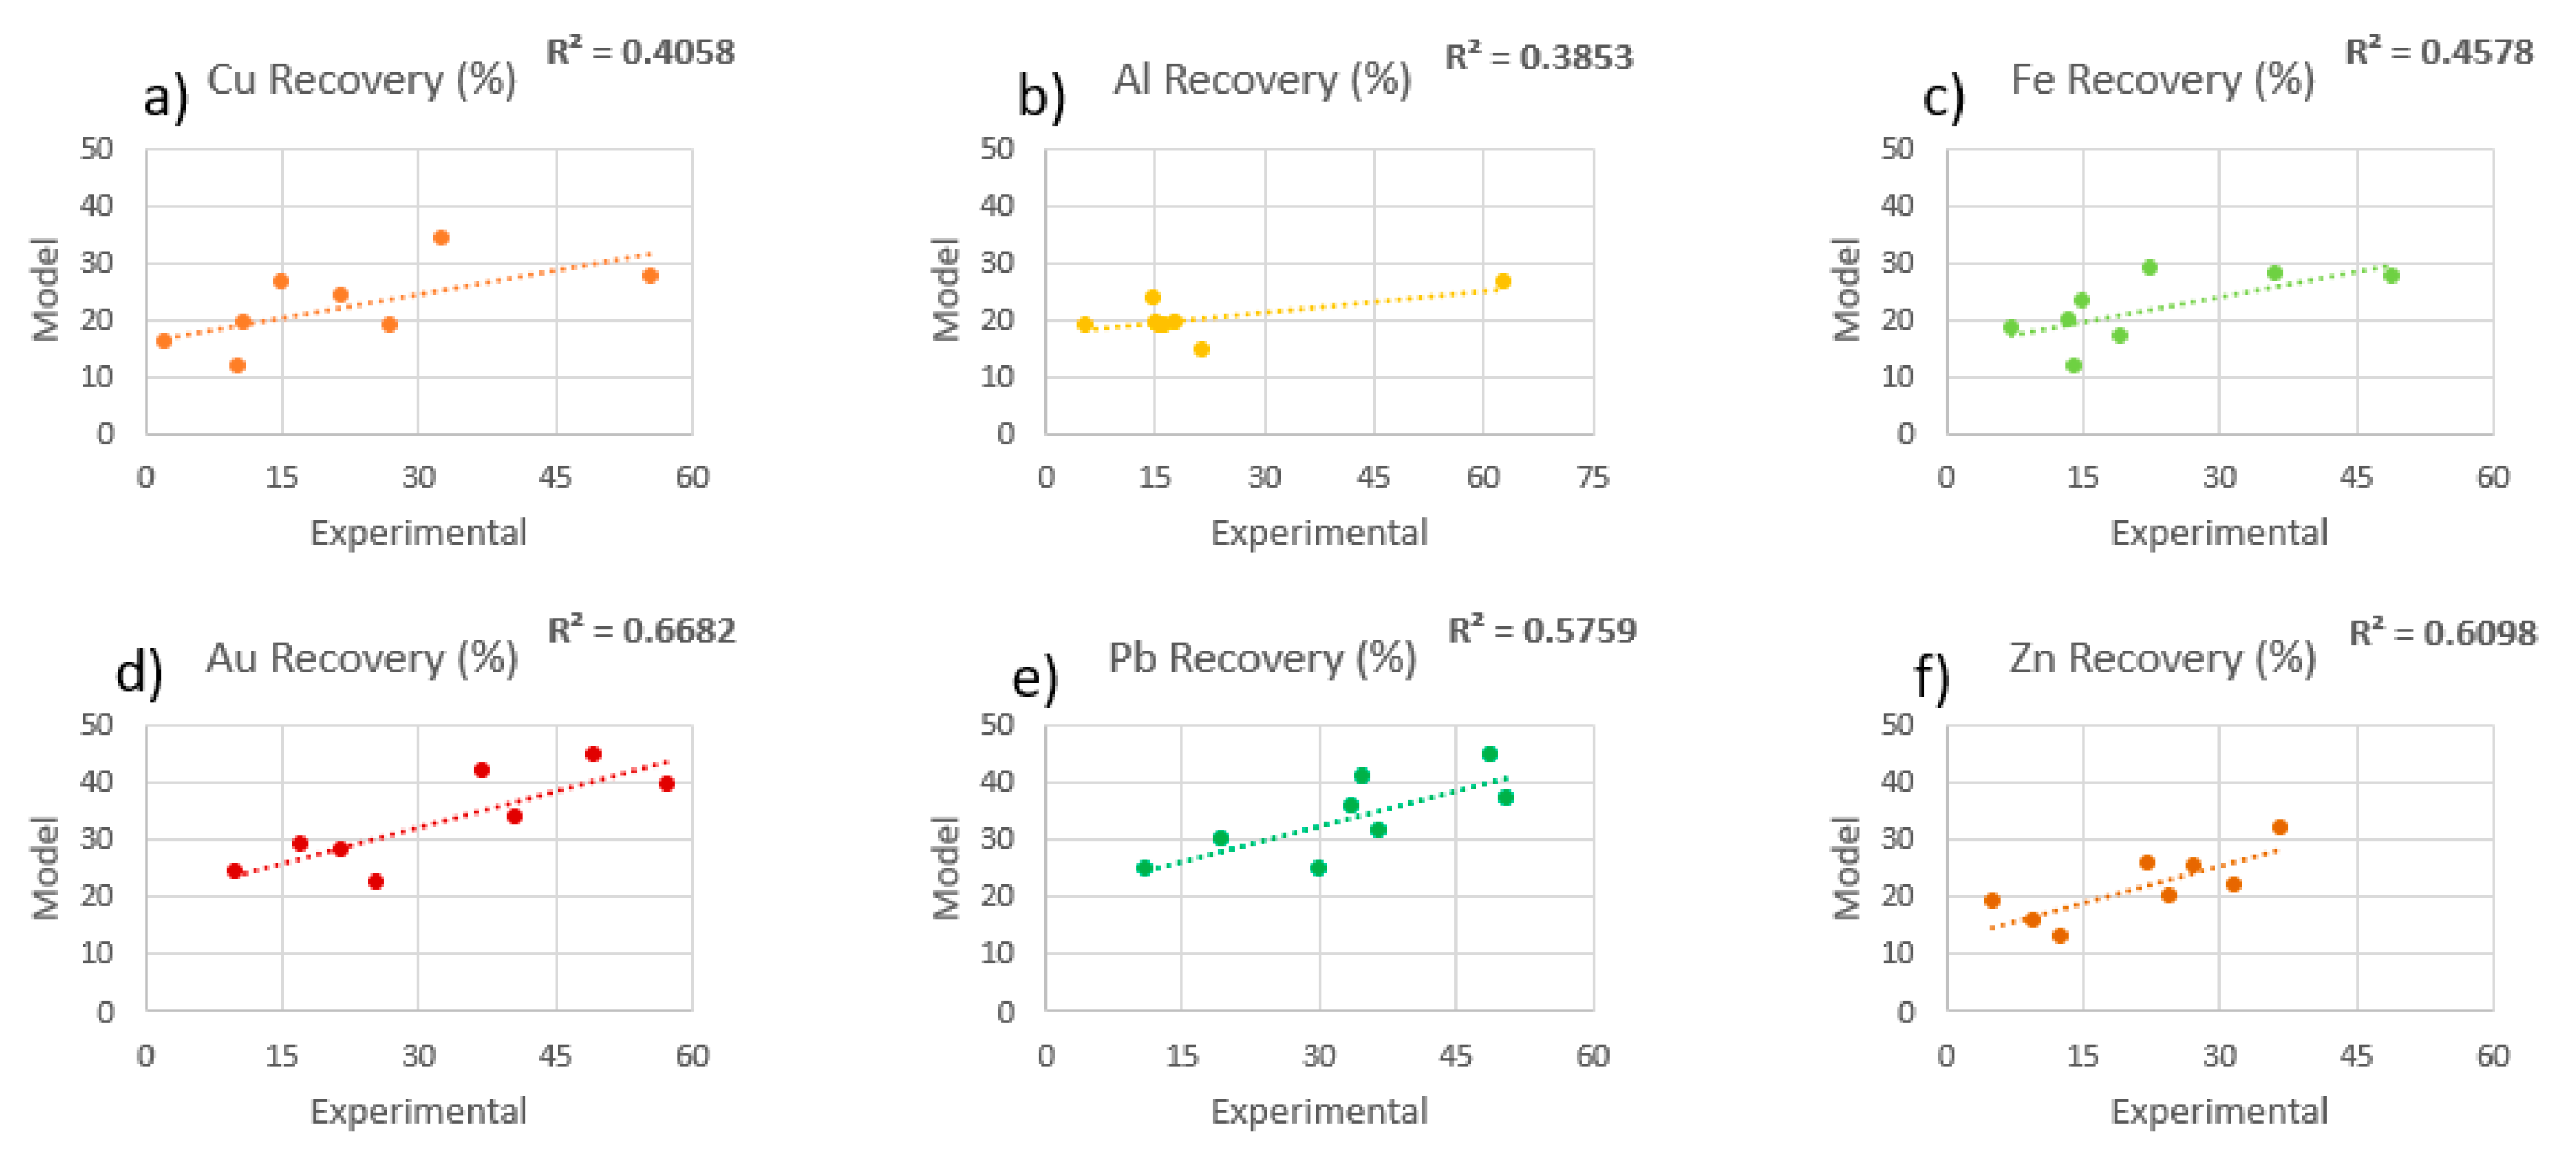
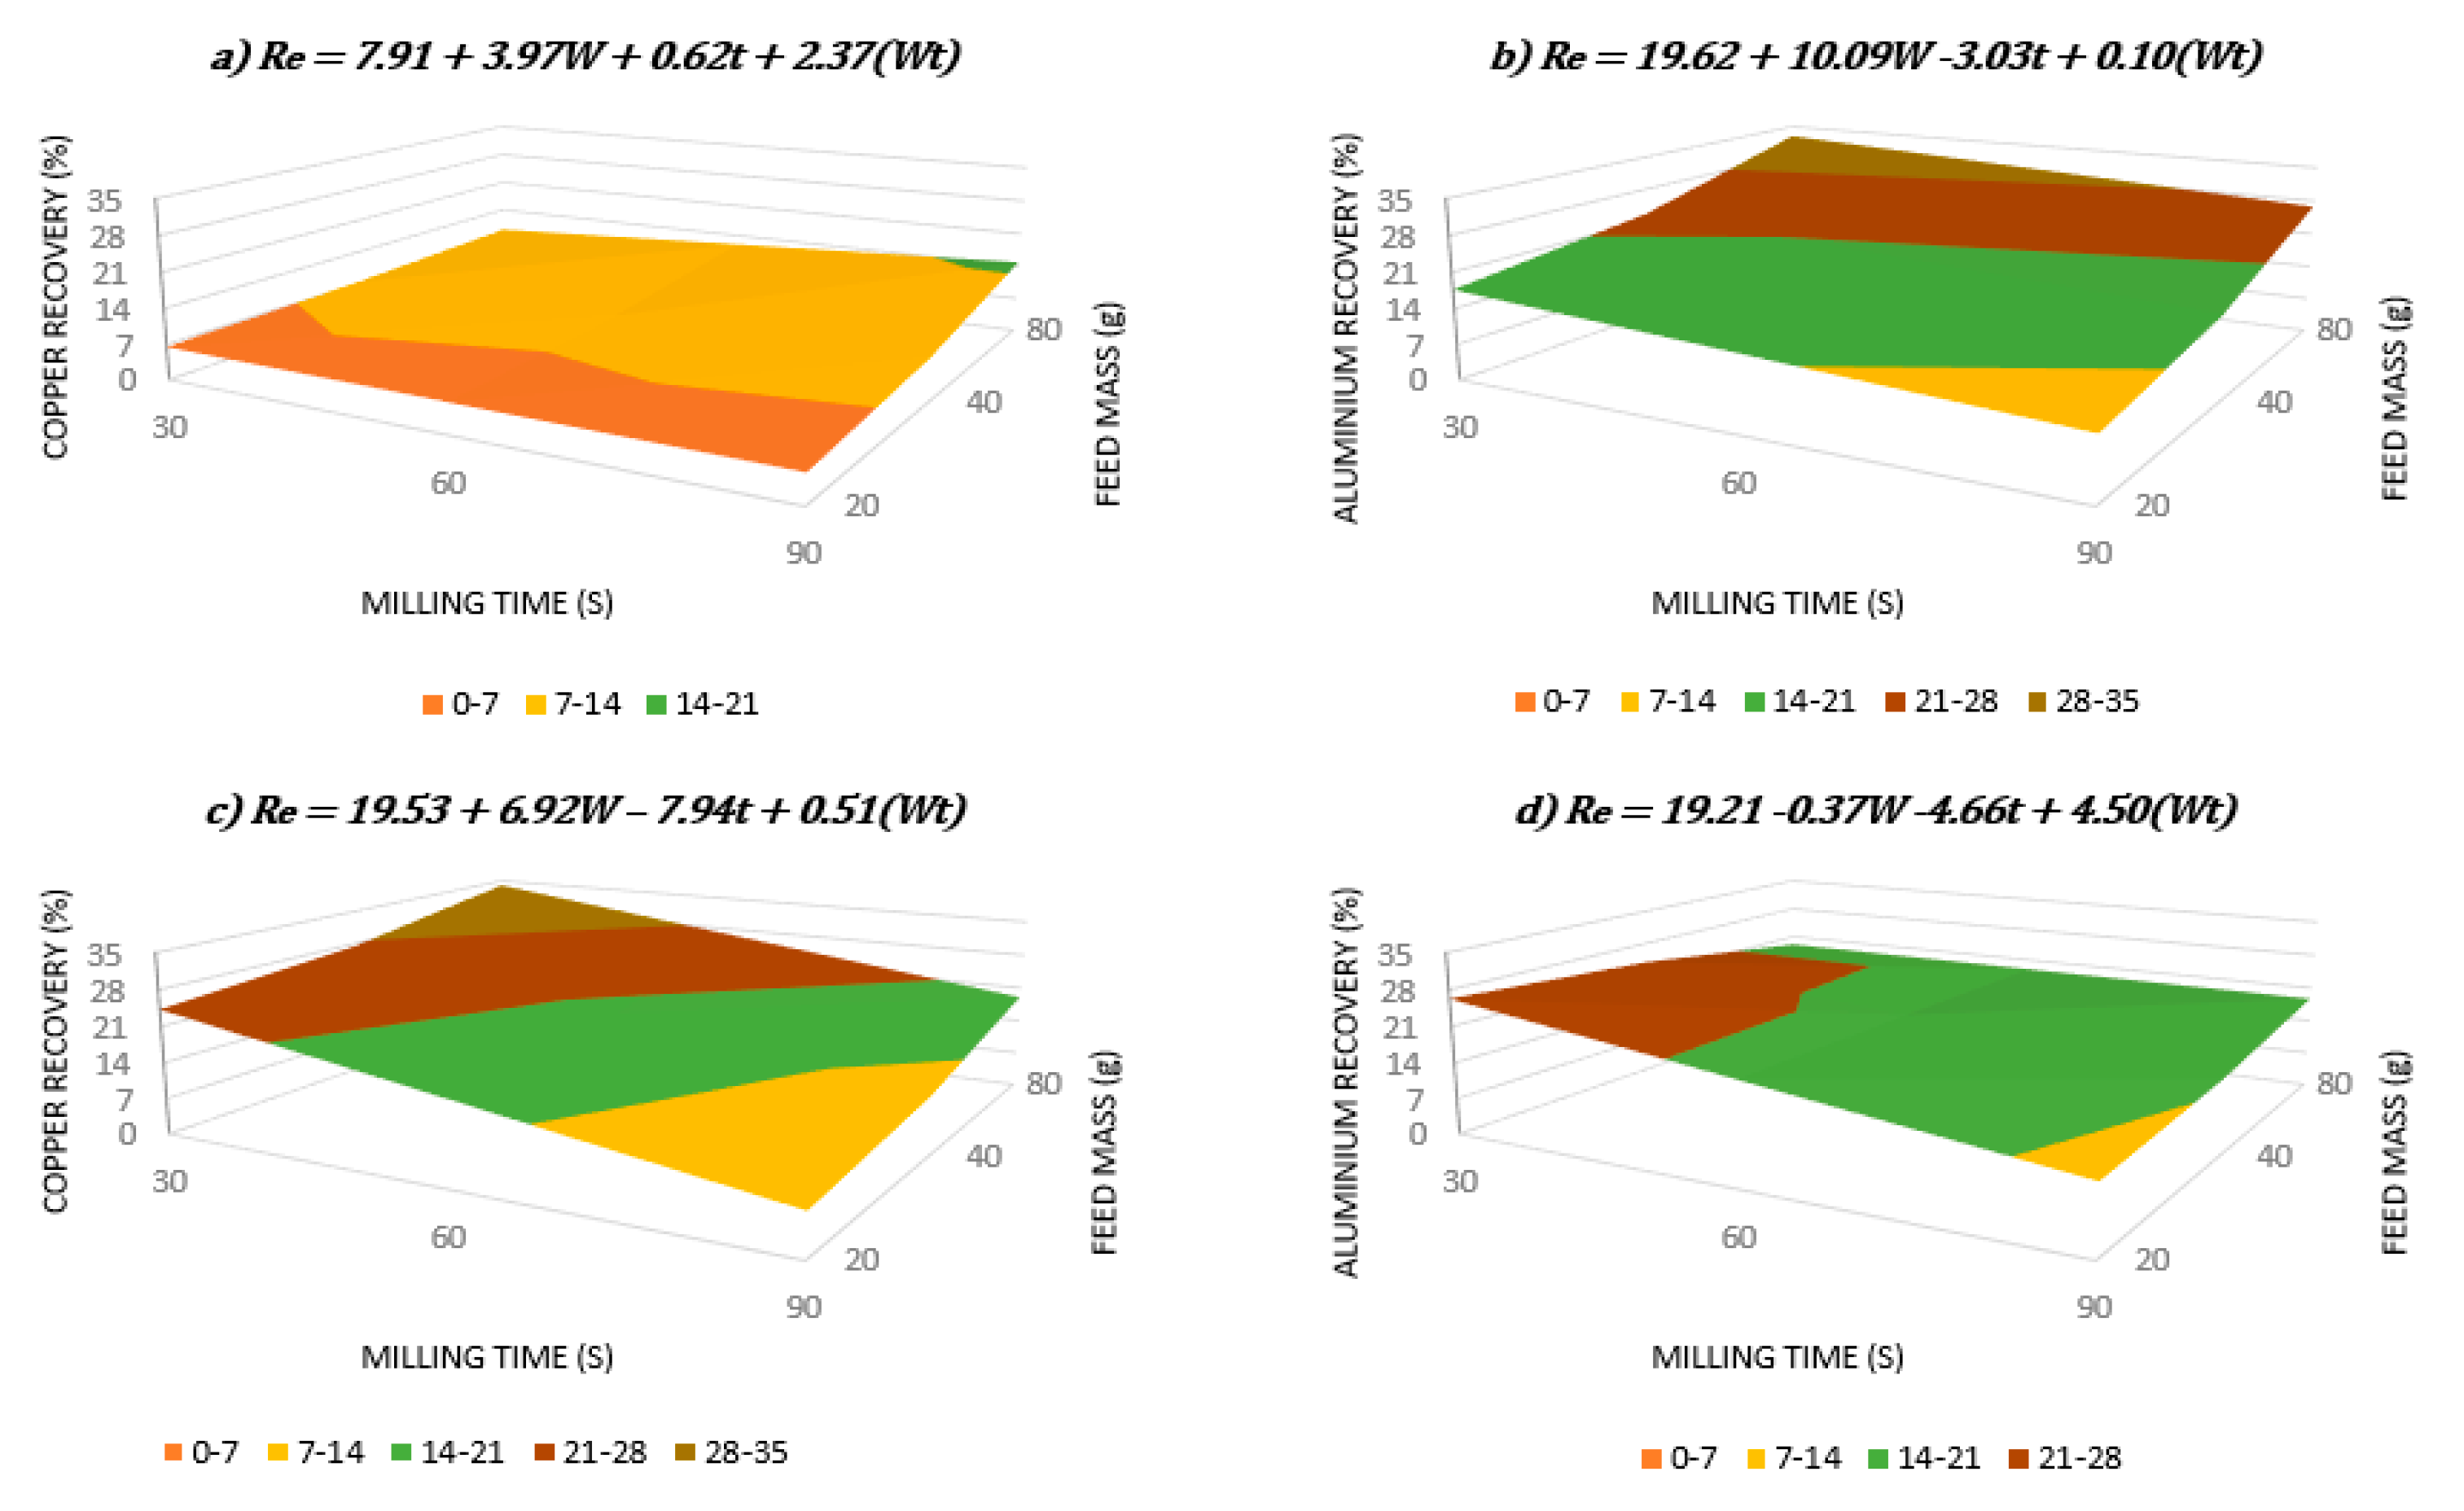
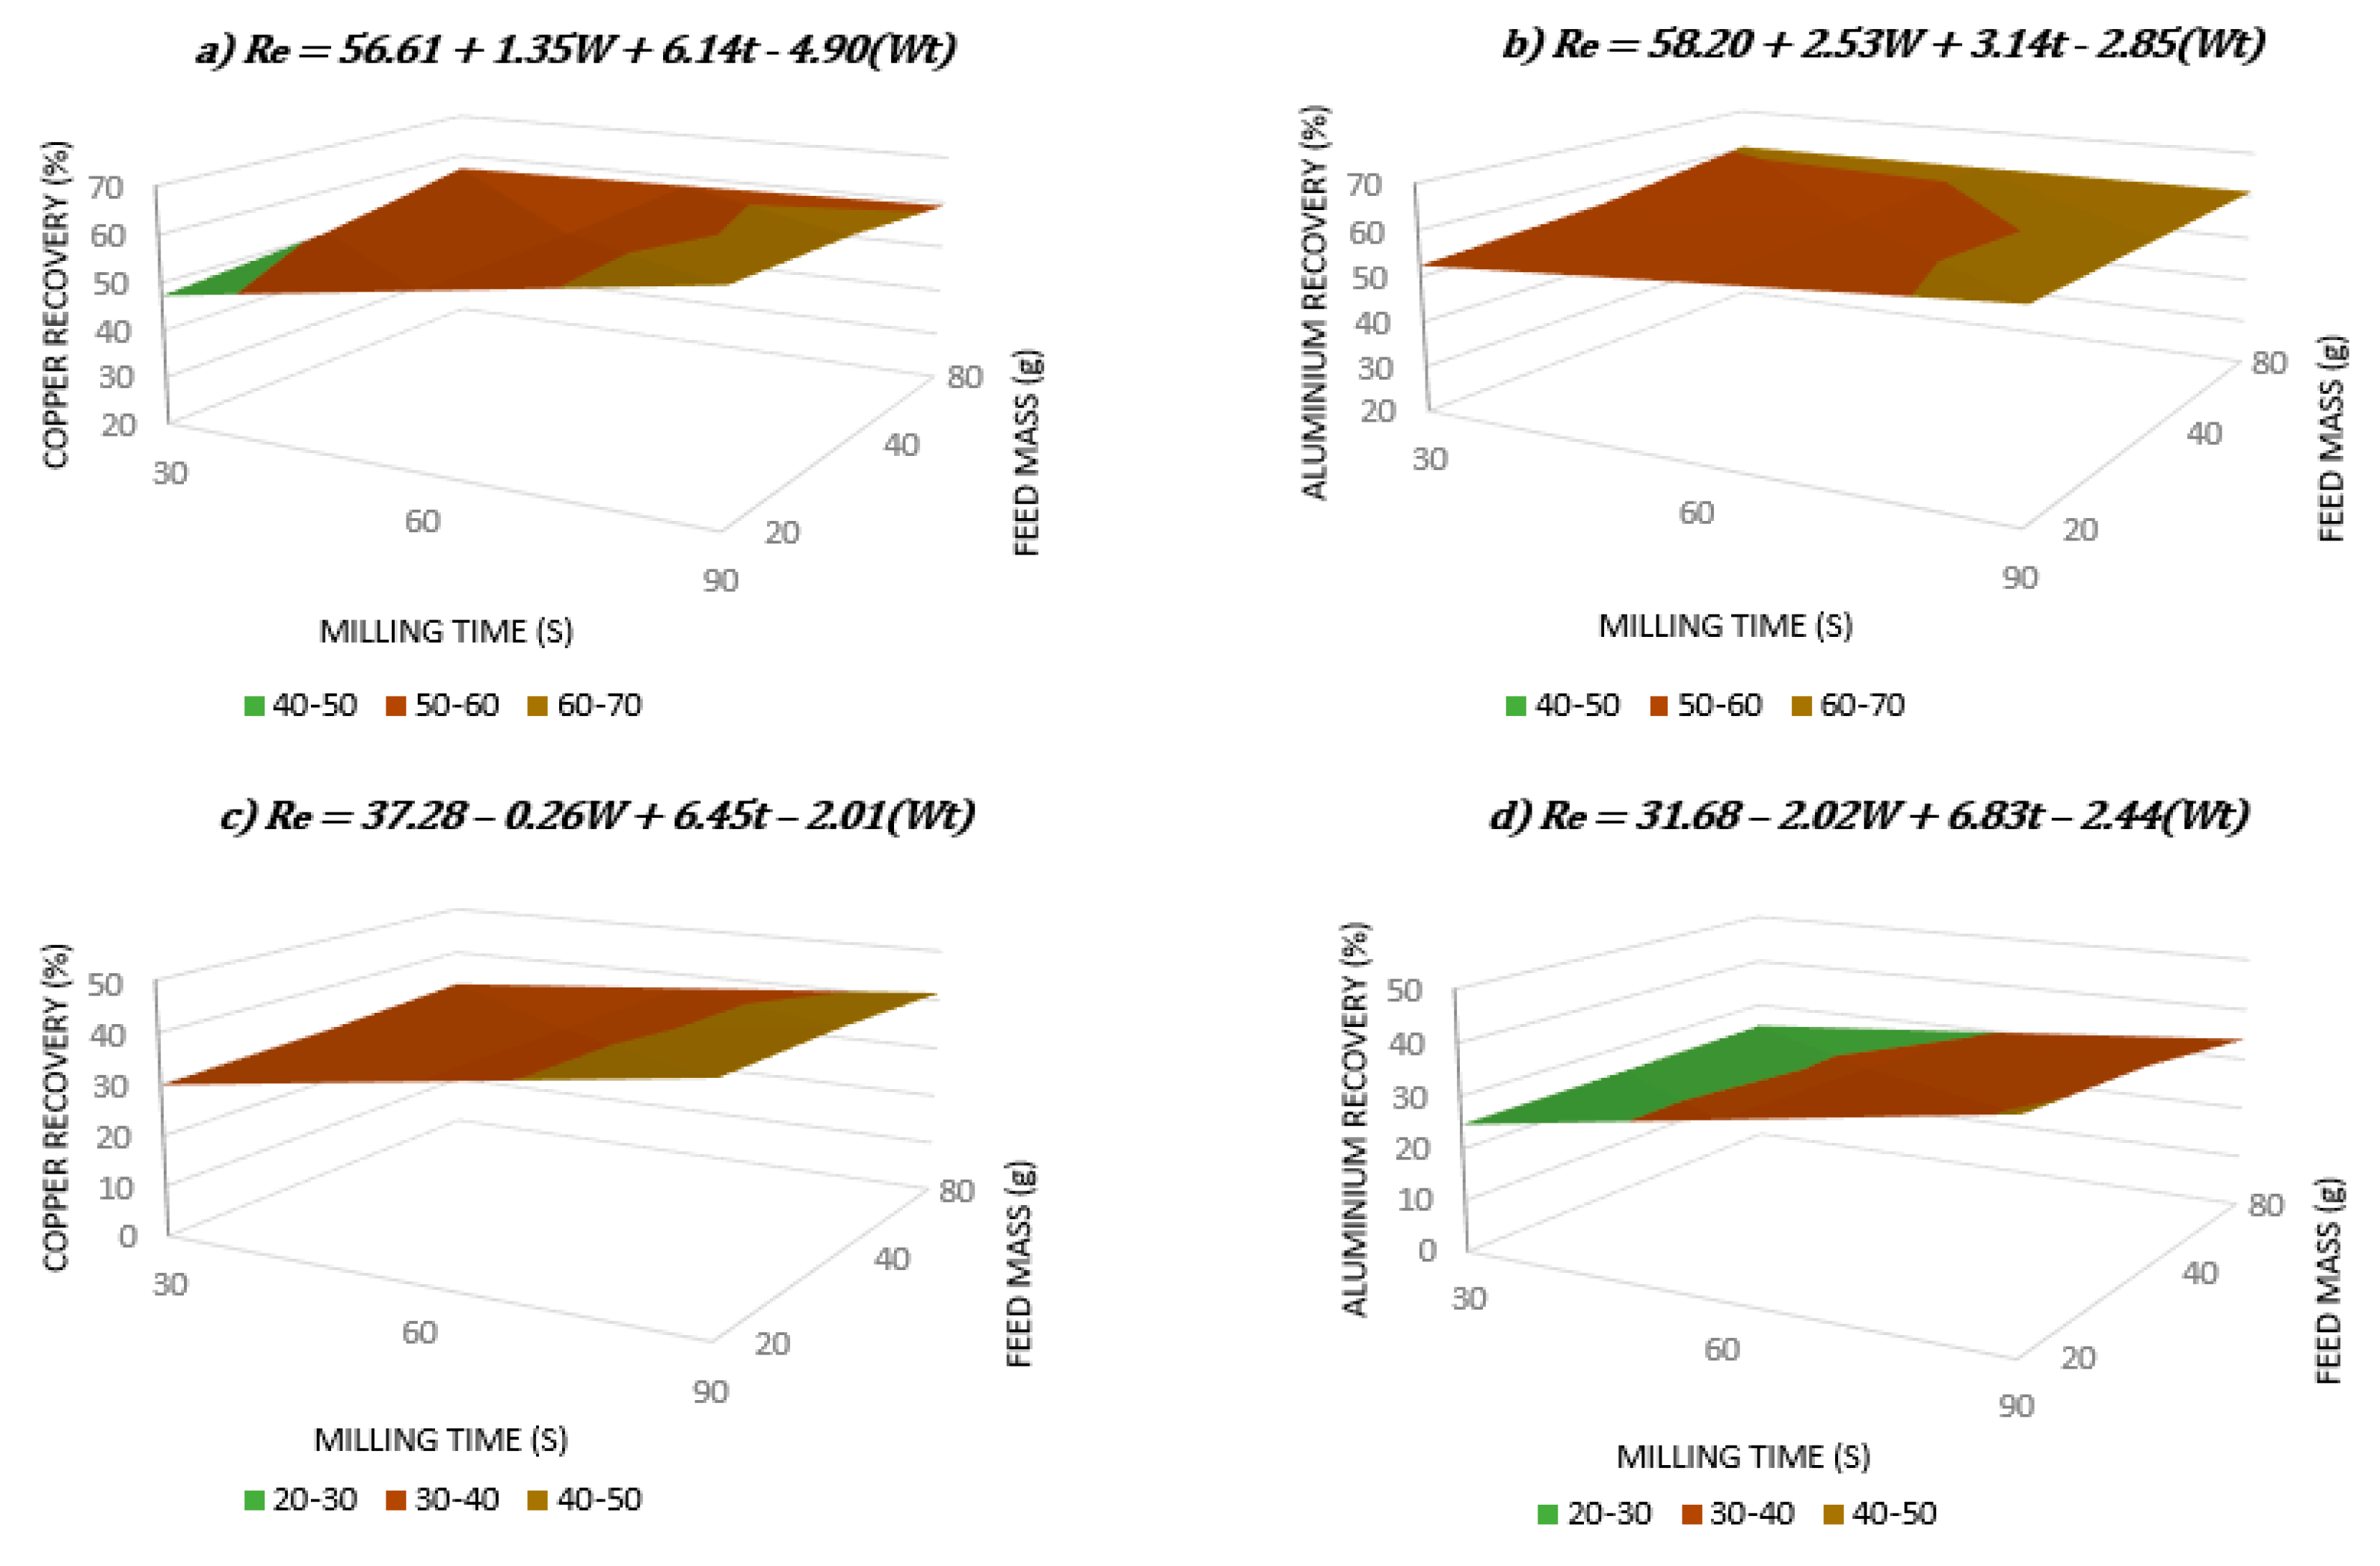
3.3. Modeling the Metal Recovery

Using the experimental data and the methodologies stated in Section 2.5, the modeling of the metal recovery was performed in order to capture the global idea about the effects of feed mass and milling time on selective metal concentration in specific size fraction(s). For each size fraction, the experimental recoveries obtained for each metal composed of the matrix of experiments. The unknown variables, model coefficients (i.e., a0, a1, a2, a12 in Equation (3)) were then calculated based on the experimental recoveries and the different set of conditions were established as domains, aforementioned in the methodology section. The model recovery equations with determined coefficients were used to calculate the recovery and compared with the experimentally determined recovery values. Figure 13 and Figure 14 illustrate the correlation between experimental and the modeled recovery for each metal within the product size fraction 1–2 mm generated from feed sizes 1–2 mm and 2–4 mm, respectively.
Table 2 summarizes the correlation between experimentally determined and model metal recoveries for the entire set of product size fractions for the six metals. It is clear that the model provided a reasonable response within the coarsest fractions (>0.5 mm). On the other hand, for product particle size below 0.5 mm (except −0.125 mm fraction generated from 2–4 mm feed), the determination coefficient does not indicate a reasonable correlation between experimental and modeled recovery, meaning that the independent variable (X axis—experimental recovery) does not well correlate with the dependent variable (Y axis–model recovery). This can be explained by the failure of the assumption on the linear relationship between the recovery and two variables given in Equation (3), for those size fractions, possibly due to non-linear size reduction/metal recovery behavior obtained by hammer milling products. It partially agreed with our previous investigation performed open-circuit hammer milling enriched Cu and Al in a coarse size fraction (1–2 mm or 2–4 mm, respectively) [4].
From the calculation of the unknown coefficients, the modeled recovery equation was derived for each metal and each product particle size from Equation (3). In order to visualize the optimal conditions of W (feed mass) and t (milling time) in the modeled equations, the following surface plots of the polynomial equations, Figure 15 and Figure 16 were given for the main metals of interest Cu and Al. The product size fraction of 1–2 mm was the one with the best response in terms of experimental vs model recovery correlation and the finest fraction −0.125 mm is where selective metal recovery was achieved. Figure 15 is shown to describe and discuss the Cu and Al recovery in the coarse fraction in relation to their selective agglomeration while Figure 16 is given to discuss their recovery in the finest fraction in relation to selective size reduction.
In general, 80 g feed mass gave the highest Cu and Al recovery in 1–2 mm hammer mill product (Figure 15a–c), except the Al recovery from 2–4 mm hammer mill feed (Figure 15d). It can be explained by the higher probably of particle collision during hammer mill operation to enhance particle agglomeration. With the higher feed particle size to 2–4 mm, Al agglomeration might happen with less feed mass and milling time (20 g, 30 s, Figure 15d). Figure 15a shows the from the 1–2 mm feed the highest Cu recovery was achieved, 15% under the conditions of the feed mass of 80 g and a milling time of 90 s. The Figure 15b shows the highest Al recovery, 33%, was again with the highest feed mass 80 g, although the milling time necessary for the optimal recovery was only 30 s.
Figure 15c shows the highest Cu recovery from the 2–4 mm feed was achieved, 34%, meaning that it is related to the feed mass of 80 g and a milling time of 30 s. On the other hand, Figure 15d indicates the highest Al recovery, 26% with the feed mass of 20 g and milling time for 30 s.
Comparing the effect of two different feed size (1–2 mm and 2–4 mm) on the Cu and Al recoveries in the coarse fraction (1–2 mm), there are some differences and similarities. Most datasets (i.e., Figure 15a–c) shows the highest feed mass is a key to obtain the highest metal recovery, except Al recovery from 2–4 mm (Figure 15d). This confirms that the selective agglomeration of metallic particles can be enhanced by the higher mass presence in the mill leading the higher collision among the particles when their size is optimal.
In comparison between the Cu recovery from two different feed size (Figure 15a,c), the milling time required to have the maximum Cu recovery is higher (90 s) with 1–2 mm feed than the one (30 s) for 2–4 mm feed. It indicates the presence of larger feed particles (2–4 mm, Figure 15c) can accelerate the agglomeration more rapid (30 s) and achieve the higher Cu recovery (34%) than the presence of smaller feed particles (1–2 mm, Figure 15a; 15% Cu recovery after 90 s).
In comparison between the Al recovery from two different feed size (Figure 15b,d), the feed mass required to have the maximum Al recovery is higher (80 g) with 1–2 mm feed than the one (20 g) with 2–4 mm feed. It indicates the presence of larger feed mass (80 g) (Figure 15b) can enhance the agglomeration and achieve the higher Al recovery (32%) for the 1–2 mm feed while the presence of less feed mass (20 g) and milling time (30 s) are required for the 2–4 mm feed (Figure 15d; 26% Al recovery) to achieve selective agglomeration due to coarser feed size. In other words, with the higher feed mass (80 g) and longer milling time (90 s), the Al recovery into the 1–2 mm product fraction is minimized (14%) possibly due to the less probably of particle collision with the coarse feed size (2–4 mm).
Figure 16 shows the high recoveries for the major metals of interest Cu and Al achieved in the finest product size fraction, i.e., −0.125mm. Figure 16a shows the highest Cu recovery can be achieved, 65%, but overall, high recoveries are related to the highest milling time of 90 s and for both the feed sizes, as expected for the selective size reduction. Figure 16b shows the highest Al recovery, 62%, was related to the 20 g feed mass and 90 s milling time.
The recoveries in the fine products from the 2–4mm feed were slightly lower, which was expected, since with the coarser feed fewer particles were comminuted to the finest size range. Figure 16c shows the highest Cu recovery was achieved, 45% with the feed mass of 20 g and a milling time of 90 s. Figure 16d indicates the highest Al recovery, 41%, was obtained under the same conditions.
Comparing the effect of two different feed size (1–2 mm and 2–4 mm) on the Cu and Al recoveries in the finest product fraction (−0.125 mm), the main similarity is that for all the datasets, the lowest feed mass condition (i.e., 20 g) is a key to obtain the highest metal recovery into the finest size fraction (−0.125 mm) due to the enhancement of selective size reduction via the higher probability of particle-hammer collision.

4. Conclusions

The experiments in this study aimed at further understanding the selective milling of PCBs by using a hammer mill. Specifically, a matrix of different conditions of milling time and the feed mass were investigated for better understanding their effects on the behavior of metal deportment and enrichment in different product size fractions. The products were characterized in order to assess the presence of metals in each size fraction by the portable XRF. A predictive model was developed to estimate metal recovery as function of the aforementioned two operation parameters studied. The developed methodologies for the milling optimization and predictive model can be applicable not only to this specific mill and sample combination, but also many other milling parameters/setups and other samples. The Cu and Al recovery in the coarse fraction was related to their selective agglomeration, while their recovery in the finest fraction was related to selective size reduction.
The results obtained in this research are certainly useful to enhance the further beneficiation processes of the PCBs, since the efficiency of most physical separation methods are conditioned to a specific size range of the material. An optimized and enriched PCB product fraction shall be sent to the subsequent processing stages, hence, studying how to enhance mechanical pre-concentration is strongly necessary.
A future research aiming to investigate the effect of sample physical properties on the selective hammer milling performance should be useful and worth conducting. Furthermore, other operational parameters of the hammer milling, such as hammer rotation velocity and the screen opening ratio, could be further optimized in order to further enhance the selective enrichment of metallic particles.

Author Contributions

Conceptualization, A.O.; methodology, A.O., P.P.G. and E.L.; software, A.O., P.P.G.; validation, A.O. and P.P.; formal analysis, A.O. and P.P.G.; investigation, A.O., P.P.G. and E.L.; resources, A.O.; data curation, A.O. and P.P.G.; writing—original draft preparation, A.O. and P.P.G.; writing—review and editing, A.O. and P.P.G.; visualization, A.O. and P.P.G.; supervision, A.O.; project administration, A.O.

Funding

This research received no external funding.

Acknowledgments

The authors wish to acknowledge their appreciation to all the students contributed to experimental part and initial data analysis of this project, as well as technical support from GeoRessources laboratory.

Conflicts of Interest

The authors declare no conflict of interest.

References

  1. Eurostat. Available online: http://ec.europa.eu/eurostat/web/waste/key-waste-streams/weee (accessed on 18 May 2018).
  2. Fujita, T.; Ono, H.; Dodbiba, G.; Yamaguchi, K. Evaluation of a recycling process for printed circuit board by physical separation and heat treatment. Waste Manag. 2014, 34, 1264–1273. [Google Scholar] [CrossRef] [PubMed]
  3. Koyanaka, S.; Endoh, S.; Ohya, H. Effect of impact velocity control on selective grinding of waste printed circuit boards. Adv. Powder Technol. 2006, 17, 113–126. [Google Scholar] [CrossRef]
  4. Otsuki, A.; Gonçalves, P.P.; Stieghorst, C.; Révay, Z. Non-destructive characterization of mechanically processed waste printed circuit boards: X-ray fluorescence spectroscopy and prompt gamma activation analysis. J. Compos. Sci. 2019, 3, 54. [Google Scholar] [CrossRef]
  5. Otsuki, A. Non-destructive liberation analysis of printed circuit board. In Proceedings of the 16th International Waste Management and Landfill Symposium, Sardinia Italy, 2–6 October 2017. [Google Scholar]
  6. Otsuki, A.; Chen, Y.; Zhao, Y. Characterization and beneficiation of complex ores for sustainable use of mineral resources: Refractory gold ore beneficiation as an example. Int. J. Soc. Mater. Eng. Resour. 2014, 20, 126–135. [Google Scholar] [CrossRef]
  7. Otsuki, A.; Dodbiba, G.; Shibayama, A.; Sadaki, J.; Mei, G.; Fujita, T. Separation of rare earth fluorescent powders by two-liquid flotation using organic solvents. Jpn. J. Appl. Phys. 2008, 47, 5093–5099. [Google Scholar] [CrossRef]
  8. Otsuki, A.; Dodbiba, G.; Fujita, T. Two-liquid flotation: Heterocoagulation of fine particles in polar organic solvent. Mater. Trans. 2007, 48, 1095–1104. [Google Scholar] [CrossRef]
  9. Otsuki, A.; Mei, G.; Yuren, J.; Matsuda, M.; Shibayama, A.; Sadaki, J.; Fujita, T. Solid-Solid separation of fluorescent powders by liquid-liquid extraction using aqueous and organic phases. Resour. Process. 2006, 53, 121–133. [Google Scholar] [CrossRef]
  10. Otsuki, A.; Shibayama, A.; Sadaki, J.; Fujita, T.; Watanabe, M. Removal of nickel, zinc and phosphorus from wastewater of industrial factories. Resour. Process. 2004, 51, 14–19. [Google Scholar] [CrossRef]
  11. Shibayama, A.; Matsuda, M.; Otsuki, A.; Dodbiba, G.; Fujita, T.; Jeyadevan, B.; Takahashi, K. The recovery and life cycle assessment of nickel particles in a multi-solenoid open-gradient magnetic separator. Magn. Electr. Sep. 2002, 11, 127–139. [Google Scholar] [CrossRef]
  12. Leroy, E.; Otsuki, A. ENSG, University of Lorraine, Vandoeuvre-lès-Nancy, France. Unpublished work. 2018. [Google Scholar]
  13. Thermo Fisher Scientific Inc. NITON XL3t 900Analyzer with GOLDD Technology, User’s Guide. Available online: https://www.thermoscientic.com/niton (accessed on 22 March 2019).
  14. Hadi, P.; Xu, M.; Lin, C.S.K.; Hui, C.-W.; Mckay, G. Waste printed circuit board recycling techniques and product utilization. J. Hazard. Mater. 2015, 283, 234–243. [Google Scholar] [CrossRef] [PubMed]
  15. Yamane, L.H.; de Moraes, V.T.; Espinosa, D.C.R.; Tenório, J.A.S. Recycling of WEEE: Characterization of spent printed circuit boards from mobile phones and computers. Waste Manage. 2011, 31, 2553–2558. [Google Scholar] [CrossRef] [PubMed]
  16. Duan, C.; Wen, X.; Shi, C.; Zhao, Y.; Wenet, B.; He, Y. Recovery of metals from waste printed circuit boards by a mechanical method using a water medium. J. Hazard. Mater. 2009, 166, 478–482. [Google Scholar] [CrossRef] [PubMed]
  17. Abouzeid, A.Z.M. Mineral Processing Laboratory Manual. Trans. Tech. Publ. 1990, 9, 23–27. [Google Scholar]
  18. Bouajila, A.; Bartolacci, G.; Kock, N.; Cayouette, J.; Coté, C. Toward the improvement of primary grinding productivity and energy consumption efficiency. Part 1: Investigation of the feed ore size effects. IFAC Proc. Volumes 2000, 33, 267–272. [Google Scholar] [CrossRef]
  19. Zhang, Q.; Kano, J.; Saito, F. Mechanochemical technology: Application to material synthesis and to the separation and processing of recyclable materials from wastes. KONA Powder Part. J. 2001, 19, 7–15. [Google Scholar] [CrossRef]
  20. Physical Ductility of the Elements. Available online: http://www.failurecriteria.com/physicalductilit.html (accessed on 23 June 2019).
  21. Zhang, S.; Forssberg, E. Intelligent liberation and classification of electronic scrap. Powder Technol. 1999, 105, 295–301. [Google Scholar] [CrossRef]
Figure 1. Raymond Hammer mill (Laboratoire Stein et Roubaix); (Left) the whole equipment; (Center) closed-circuit setting (closed lining); and (Right) open-circuit setting (dented lining).
Metals 09 00899 g001
Figure 2. Particle size distribution of hammer mill products from 1–2 mm feed. (a) 20 g feed, (b) 40 g feed (c) 80 g feed, (d) 30 s milling time, (e) 60 s milling time, and (f) 90 s milling time.
Metals 09 00899 g002
Figure 3. Particle size distribution of hammer mill products from 2–4 mm feed. (a) 20 g feed, (b) 40 g feed, (c) 80 g feed, (d) 30 s milling time, (e) 60 s milling time, and (f) 90 s milling time.
Metals 09 00899 g003
Figure 4. Cu recovery after hammer milling as a function of feed mass, milling time and particle size. Feed size 1–2 mm (a) 20 g feed, (b) 40 g feed, (c) 80 g feed, (d) 30 s milling time, (e) 60 s milling time, and (f) 90 s milling time. Experimental data points are connected with lines for the purpose of visual aid only.
Metals 09 00899 g004
Figure 5. Digital microscopic images of (a) a product (−0.125 mm) under selective size reduction (20 g feed mass, 90 s milling time) condition from 1–2 mm feed, (b) a product (1–2 mm) under selective agglomeration (80 g feed mass, 90 s milling time) condition from 1–2 mm feed, and (c) Cu agglomerate formed in the product size 1–2 mm during the hammer milling operation under 80 g feed mass and 90 s milling time.
Metals 09 00899 g005
Figure 6. Al recovery after hammer milling as a function of feed mass, milling time and particle size. Feed Size 1–2 mm (a) 20 g feed, (b) 40 g feed (c) 80 g feed, (d) 30 s milling time, (e) 60 s milling time, and (f) 90 s milling time. Experimental data points are connected with lines for the purpose of visual aid only.
Metals 09 00899 g006
Figure 7. Cu enrichment ratio after hammer milling as a function of feed mass, milling time and particle size. Feed Size 1–2 mm. (a) 20 g feed, (b) 40 g feed (c) 80 g feed, (d) 30 s milling time, (e) 60 s milling time, and (f) 90 s milling time. Experimental data points are connected with lines for the purpose of visual aid only.
Metals 09 00899 g007
Figure 8. Al enrichment ratio after hammer milling as a function of feed mass, milling time and particle size. Feed Size 1–2 mm. (a) 20 g feed, (b) 40 g feed (c) 80 g feed, (d) 30 s milling time, (e) 60 s milling time, and (f) 90 s milling time. Experimental data points are connected with lines for the purpose of visual aid only.
Metals 09 00899 g008
Figure 9. (a) Metal recovery and (b) metal enrichment ratio after hammer milling as a function of feed mass, milling time and particle size. Feed particle size fraction was 1–2 mm. The feed mass was 20 g and milling time was 90 s. Experimental data points are connected with lines for the purpose of visual aid only.
Metals 09 00899 g009
Figure 10. (a) Metal recovery and (b) Metal enrichment ratio after hammer milling as a function of feed mass, milling time and particle size. Feed particle size fraction was 2–4 mm. The feed mass was 20 g and milling time was 90 s. Experimental data points are connected with lines for the purpose of visual aid only.
Metals 09 00899 g010
Figure 11. (a) Metal recovery and (b) Metal enrichment ratio after hammer milling as a function of feed mass, milling time and particle size. Feed particle size fraction was 1–2 mm. The feed mass was 80 g and milling time was 90 s. Experimental data points are connected with lines for the purpose of visual aid only.
Metals 09 00899 g011
Figure 12. (a) Metal recovery and (b) Metal enrichment ratio after hammer milling as a function of feed mass, milling time and particle size. Feed particle size fraction was 2–4 mm. The feed mass was 80 g and milling time was 90 s. Experimental data points are connected with lines for the purpose of visual aid only.
Metals 09 00899 g012
Figure 13. Correlation between the experimentally determined and calculated metal recovery using the model equations after hammer milling for product size fraction 1–2 mm. (a) Cu, (b) Al (c) Fe, (d) Au, (e) Pb, and (f) Zn. Feed particle size fraction was 1–2 mm.
Metals 09 00899 g013
Figure 14. Correlation between the experimentally determined and calculated metal recovery using the model equations after hammer milling for product size fraction 1–2 mm. (a) Cu, (b) Al (c) Fe, (d) Au, (e) Pb, and (f) Zn. Feed particle size fraction was 2–4 mm.
Metals 09 00899 g014
Figure 15. Surface plots of the metal recovery in the product size 1–2 mm after hammer milling as a function of feed mass and milling time: (a) Cu-Feed particle size fraction was 1–2 mm; (b) Al-Feed particle size fraction was 1–2 mm; (c) Cu-Feed particle size fraction was 2–4 mm; (d) Al-Feed particle size fraction was 2–4 mm.
Metals 09 00899 g015
Figure 16. Surface plots of the metal recovery in the product size −0.125 mm after hammer milling as a function of feed mass and milling time: (a) Cu-Feed particle size fraction was 1–2 mm; (b) Al-Feed particle size fraction was 1–2 mm; (c) Cu-Feed particle size fraction was 2–4 mm; (d) Al-Feed particle size fraction was 2–4 mm.
Metals 09 00899 g016
Table 1. Feed metal composition and some values reported in the literature.
Sample/Element %Au%Pb%Zn%Cu%Fe%Al%
FEED 2–4 mm0.030.540.624.405.257.33
FEED 1–2 mm0.040.860.498.392.335.34
Data from [14]0.030.2–3.00.5–3.07.0–36.02.0–12.01.0–22.0
Data from [15]0.102.402.3022.05.703.90
Table 2. Coefficient of determination (R²) obtained from the linear regression analyses between experimental and modeled calculation of the metal recovery.
R2 (Determination Coefficient)–Experimental x Modeled Metal Recovery
Feed SizeProduct Size FractionAuPbZnCuAlFe
1–2 mm1–2 mm0.850.870.730.710.500.74
0.5–1 mm0.630.410.570.500.350.65
0.25–0.5 mm0.520.150.090.570.310.19
0.125–0.25 mm0.280.090.070.260.020.01
−0.125 mm 0.440.340.310.220.000.46
2–4 mm2–4 mm0.600.540.800.330.150.02
1–2 mm0.670.580.610.410.390.46
0.5–1 mm0.000.010.140.000.000.01
0.25–0.5 mm0.170.200.210.000.180.03
0.125–0.25 mm0.350.280.120.010.460.27
−0.125 mm 0.510.280.460.310.540.51

