Microstructural Changes and Impact Toughness of Fill Pass in X80 Steel Weld Metal


Abstract
:1. Introduction
2. Materials and Methods
2.1. Materials and Welding Parameters
2.2. Experimental Method
3. Results and Discussion
3.1. Measurement of Welding Thermal Cycles
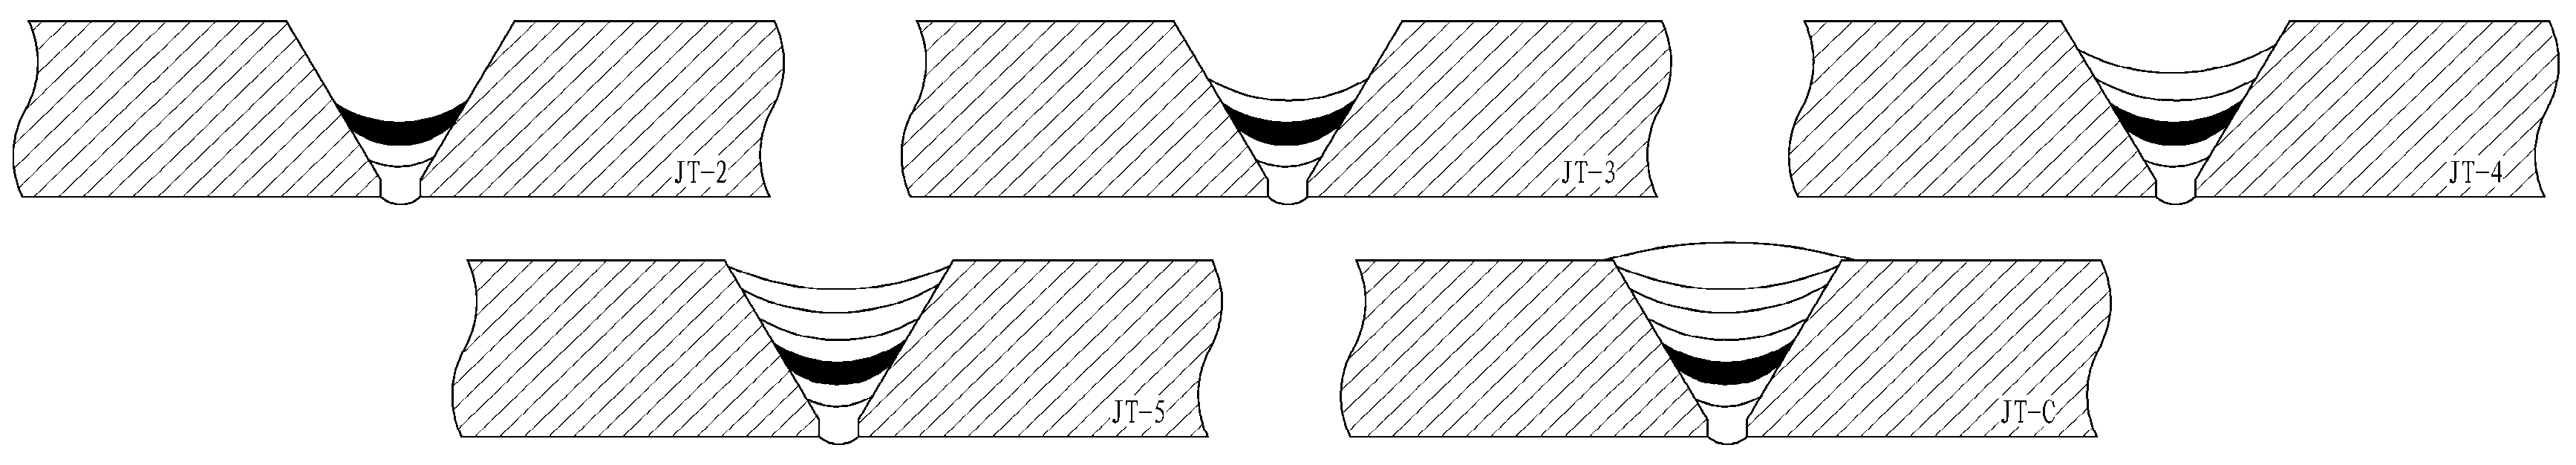
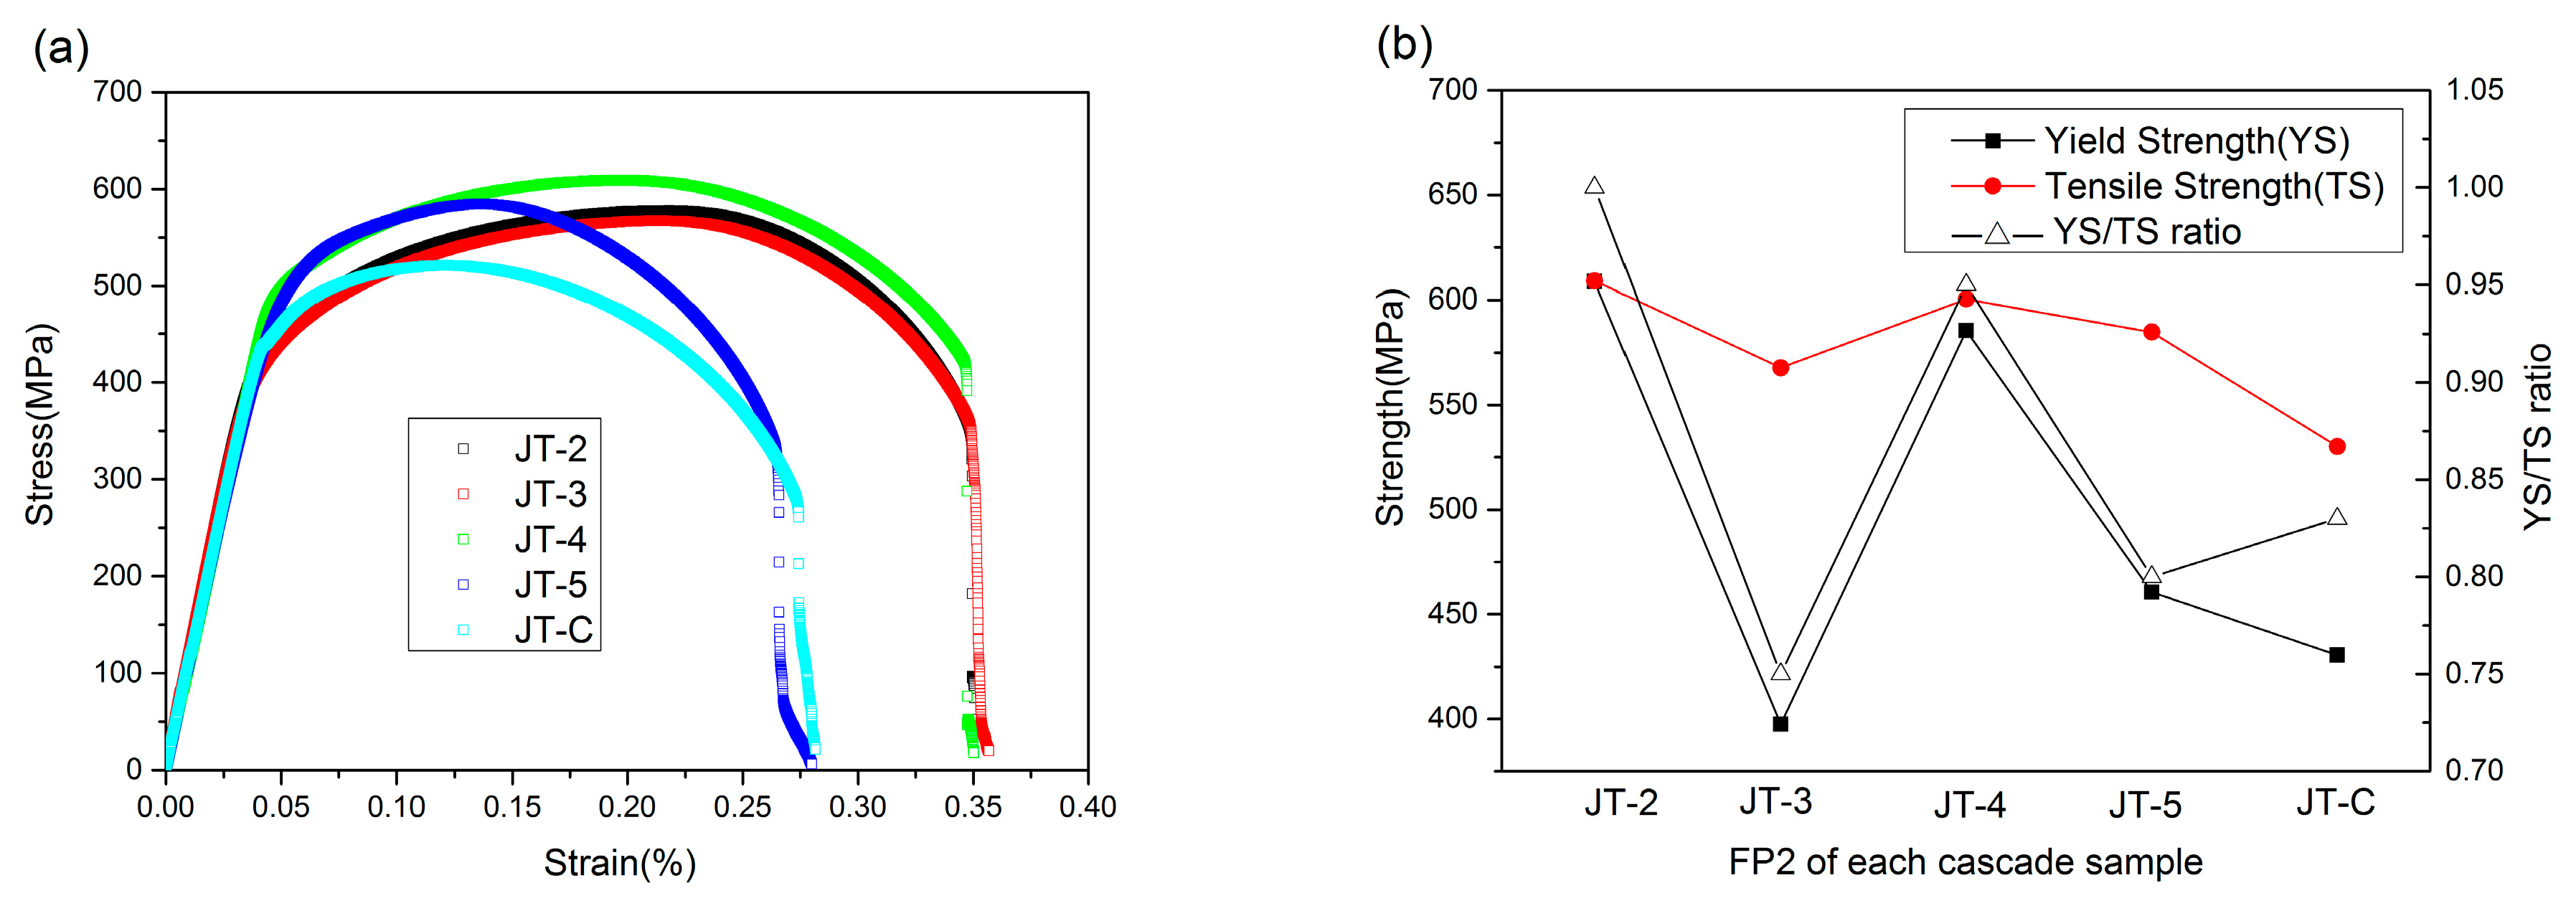
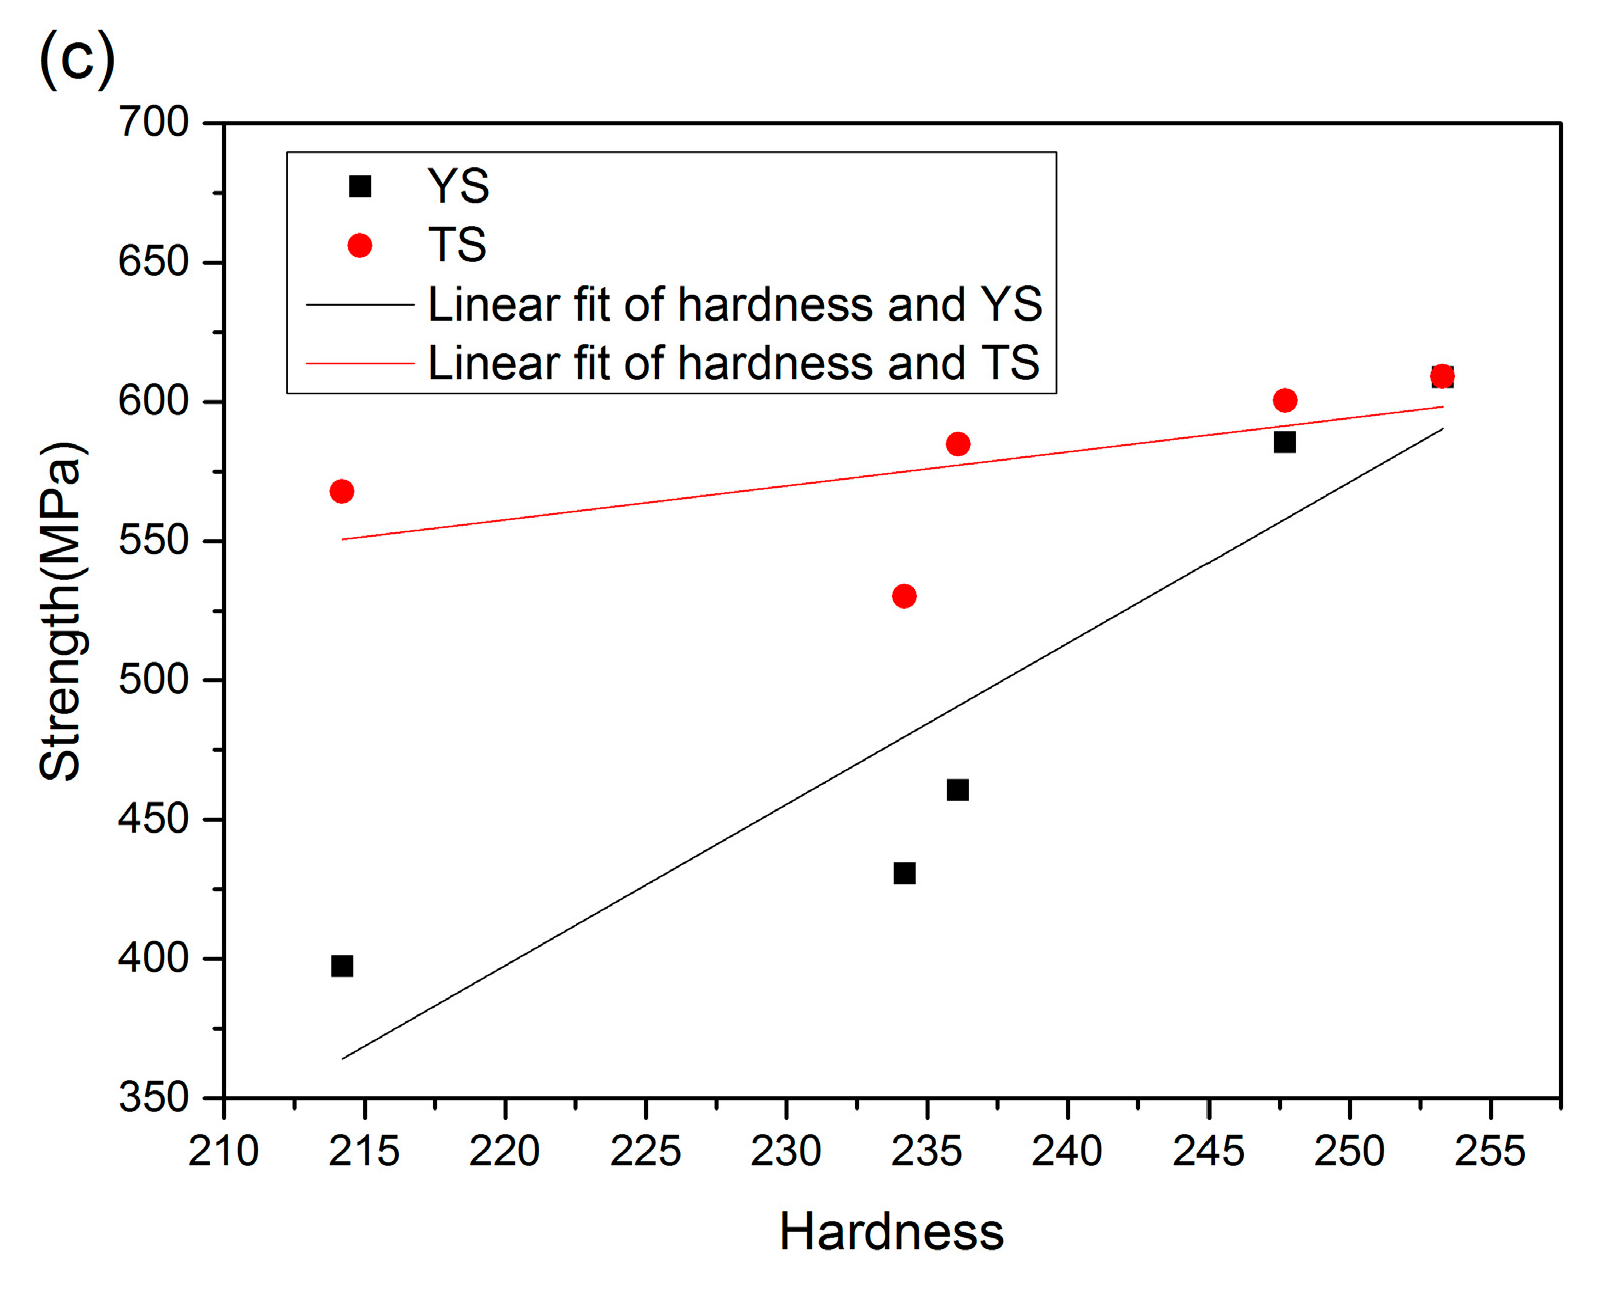
3.2. Tensile Test and Hardness Test
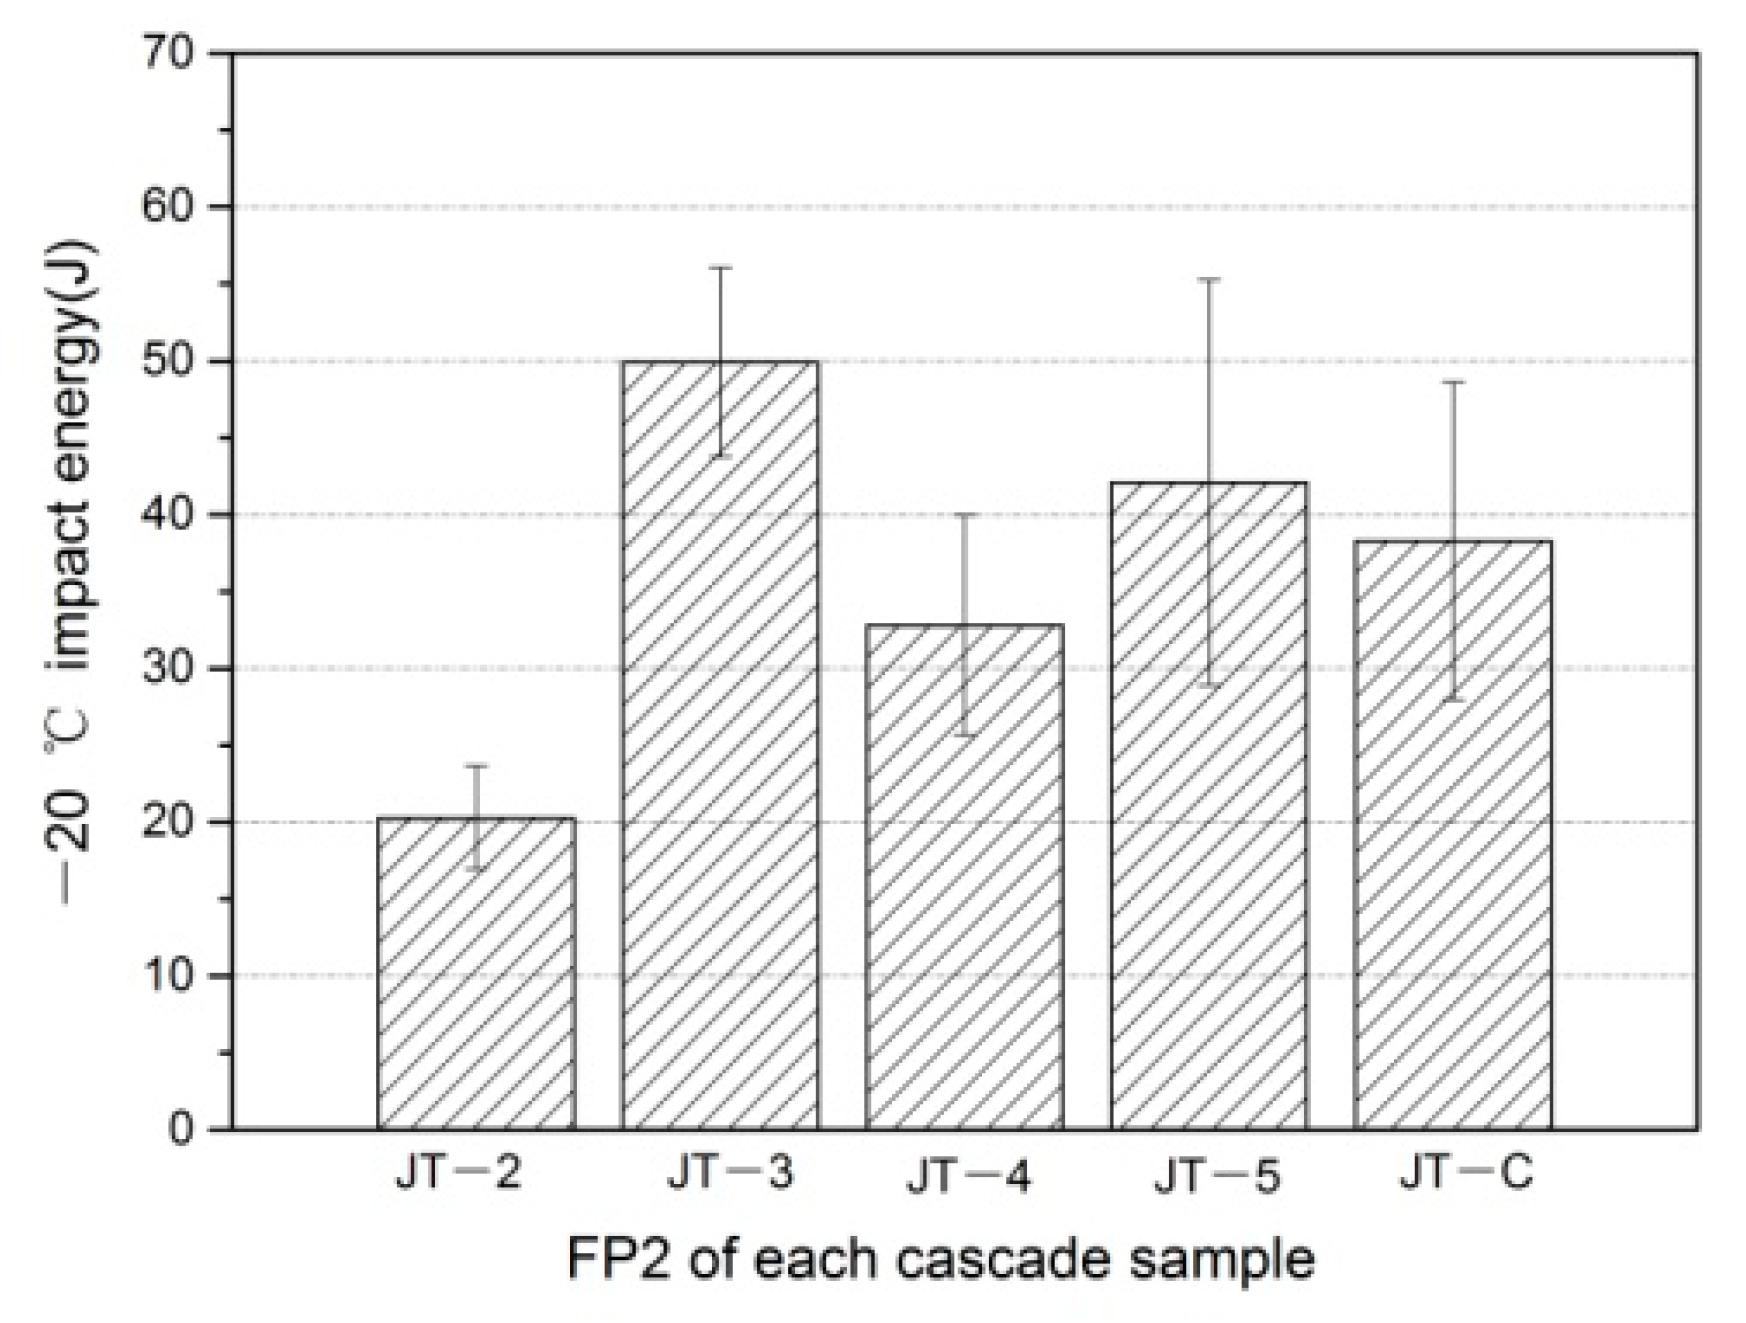
3.3. Toughness Impact Test
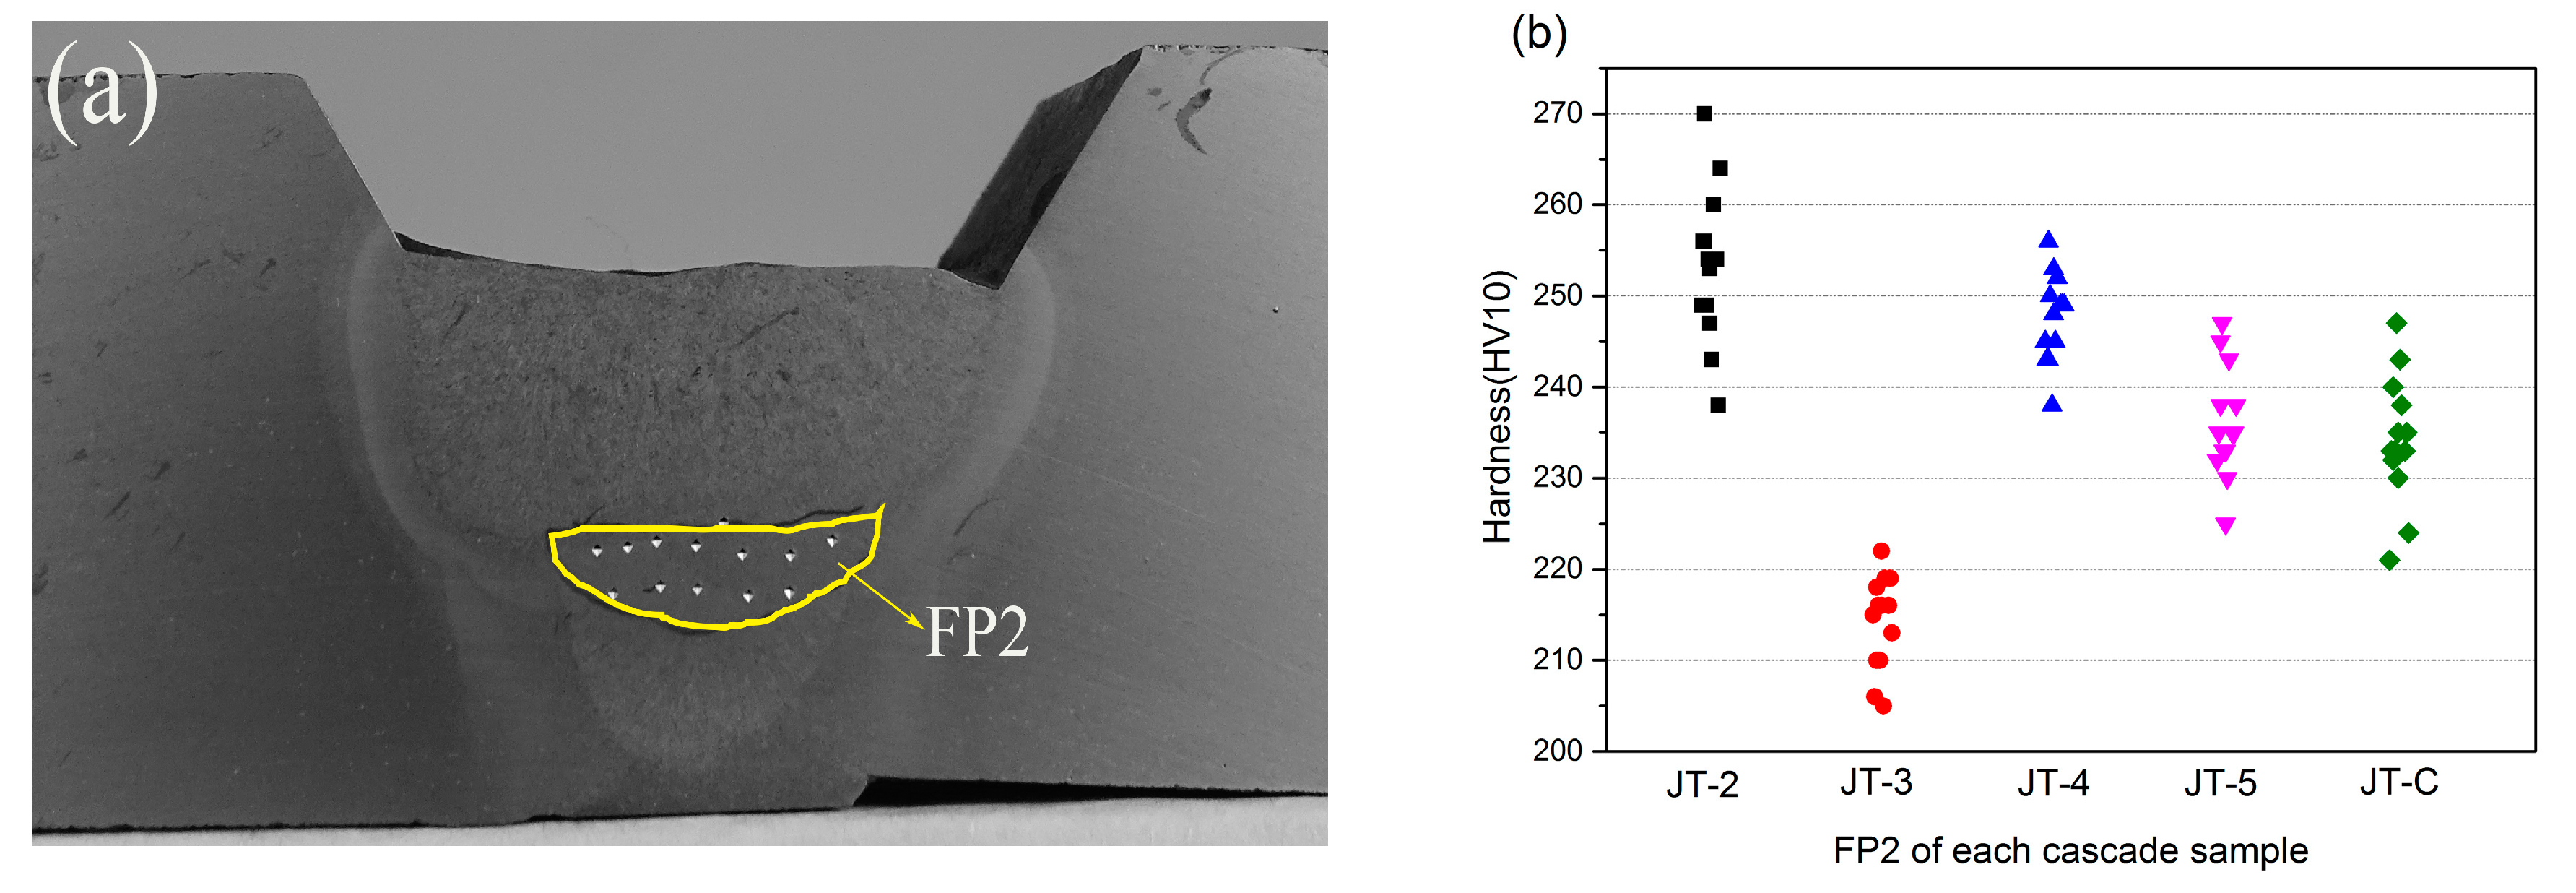
3.4. Hardness Test
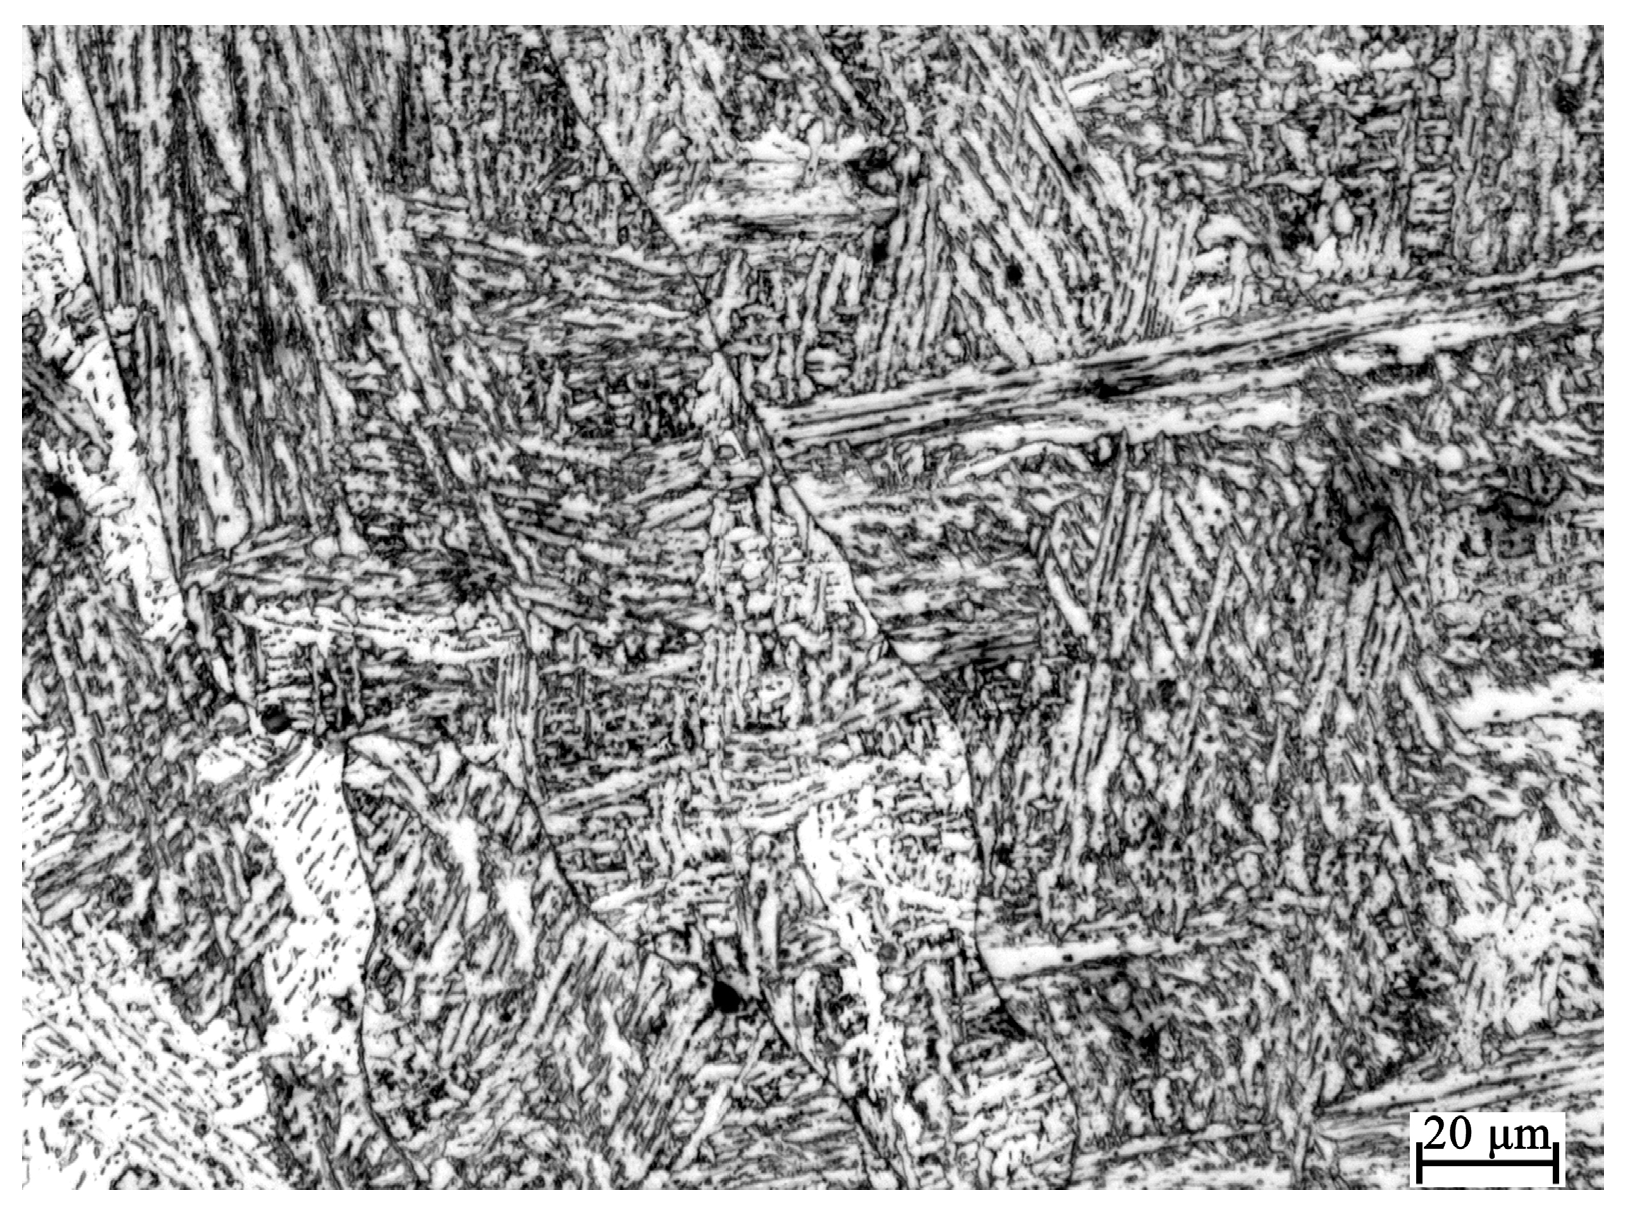
3.5. Microstructure
3.6. Grain Size
3.7. M–A Constituents
3.8. Analysis
4. Conclusions
- (1)
- Yield and tensile strength showed an approximate linear relationship with the Vickers hardness in the FP2 in each cascade specimen, and the original FP2 and FP2 after double thermal cycles (JT-2 and JT-4) had the worse deformation ability.
- (2)
- The toughness of FP2 after a single thermal cycle improved, decreased after double thermal cycles, and improved again after triple thermal cycles. Weld metal toughness did not improve further after quadruple thermal cycles. Therefore, on the basis of the total number of weld layers, the number of thermal cycles each weld layer experienced and the toughness of each weld layer could be obtained.
- (3)
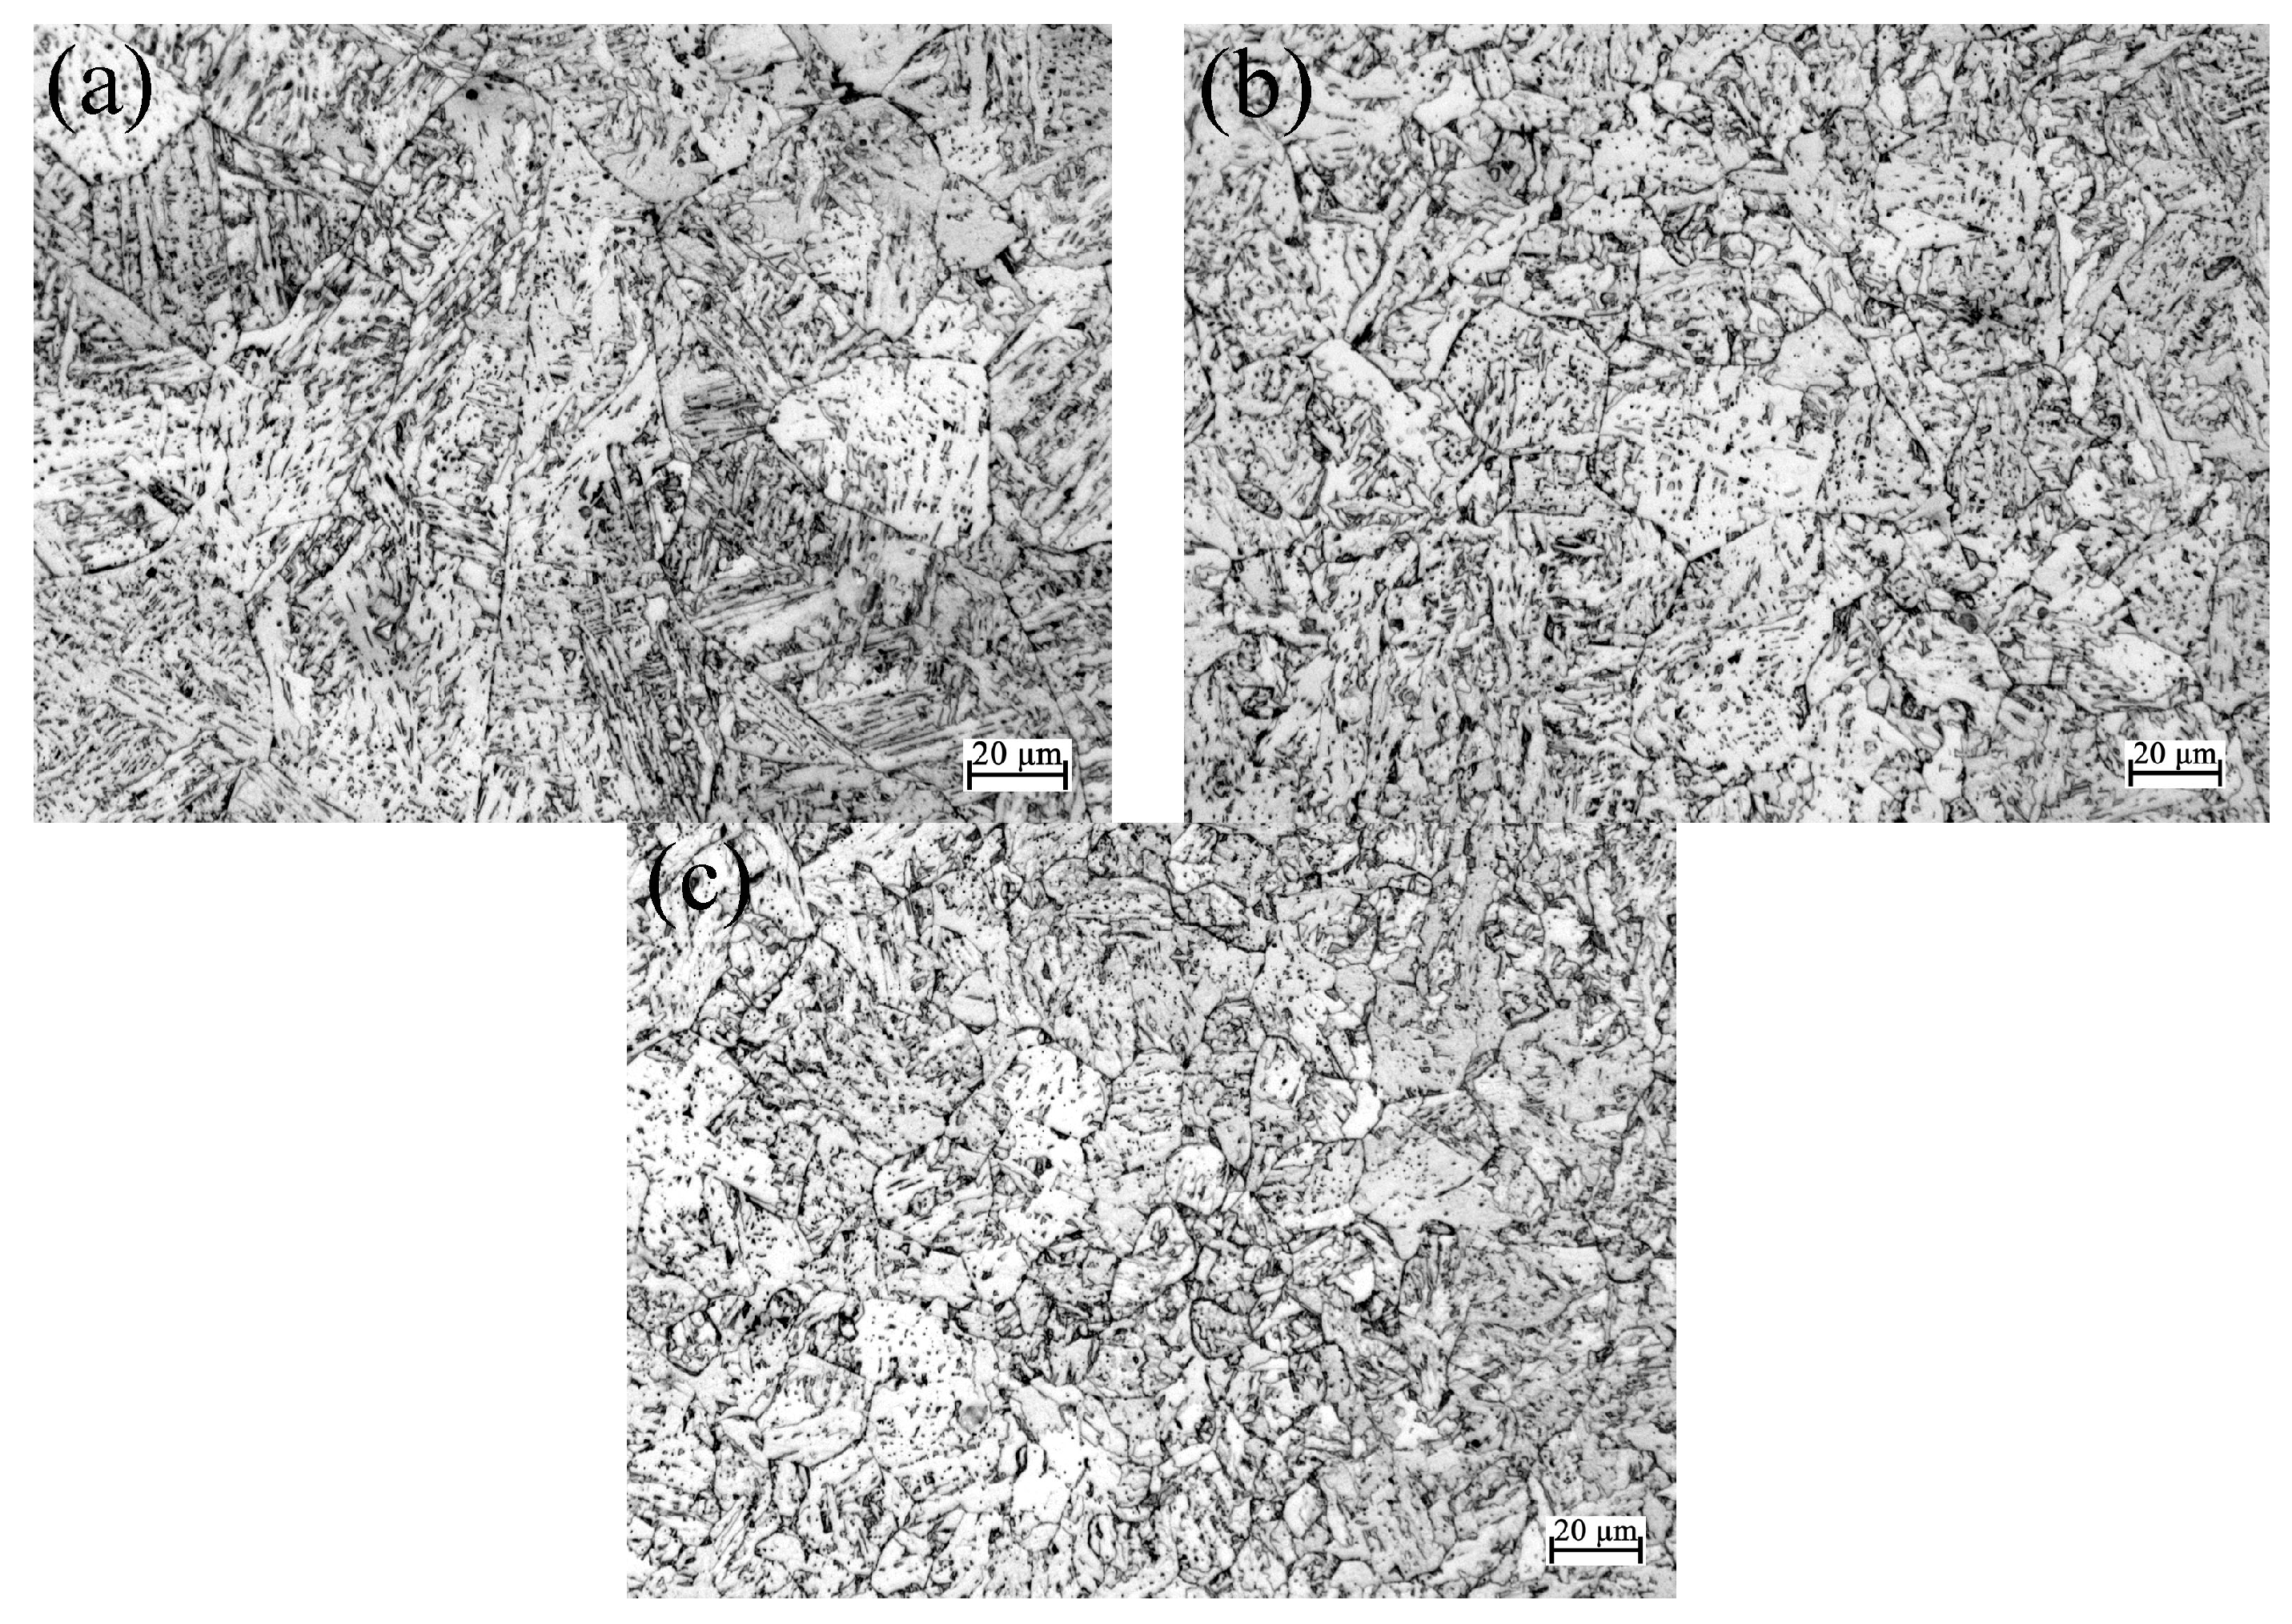
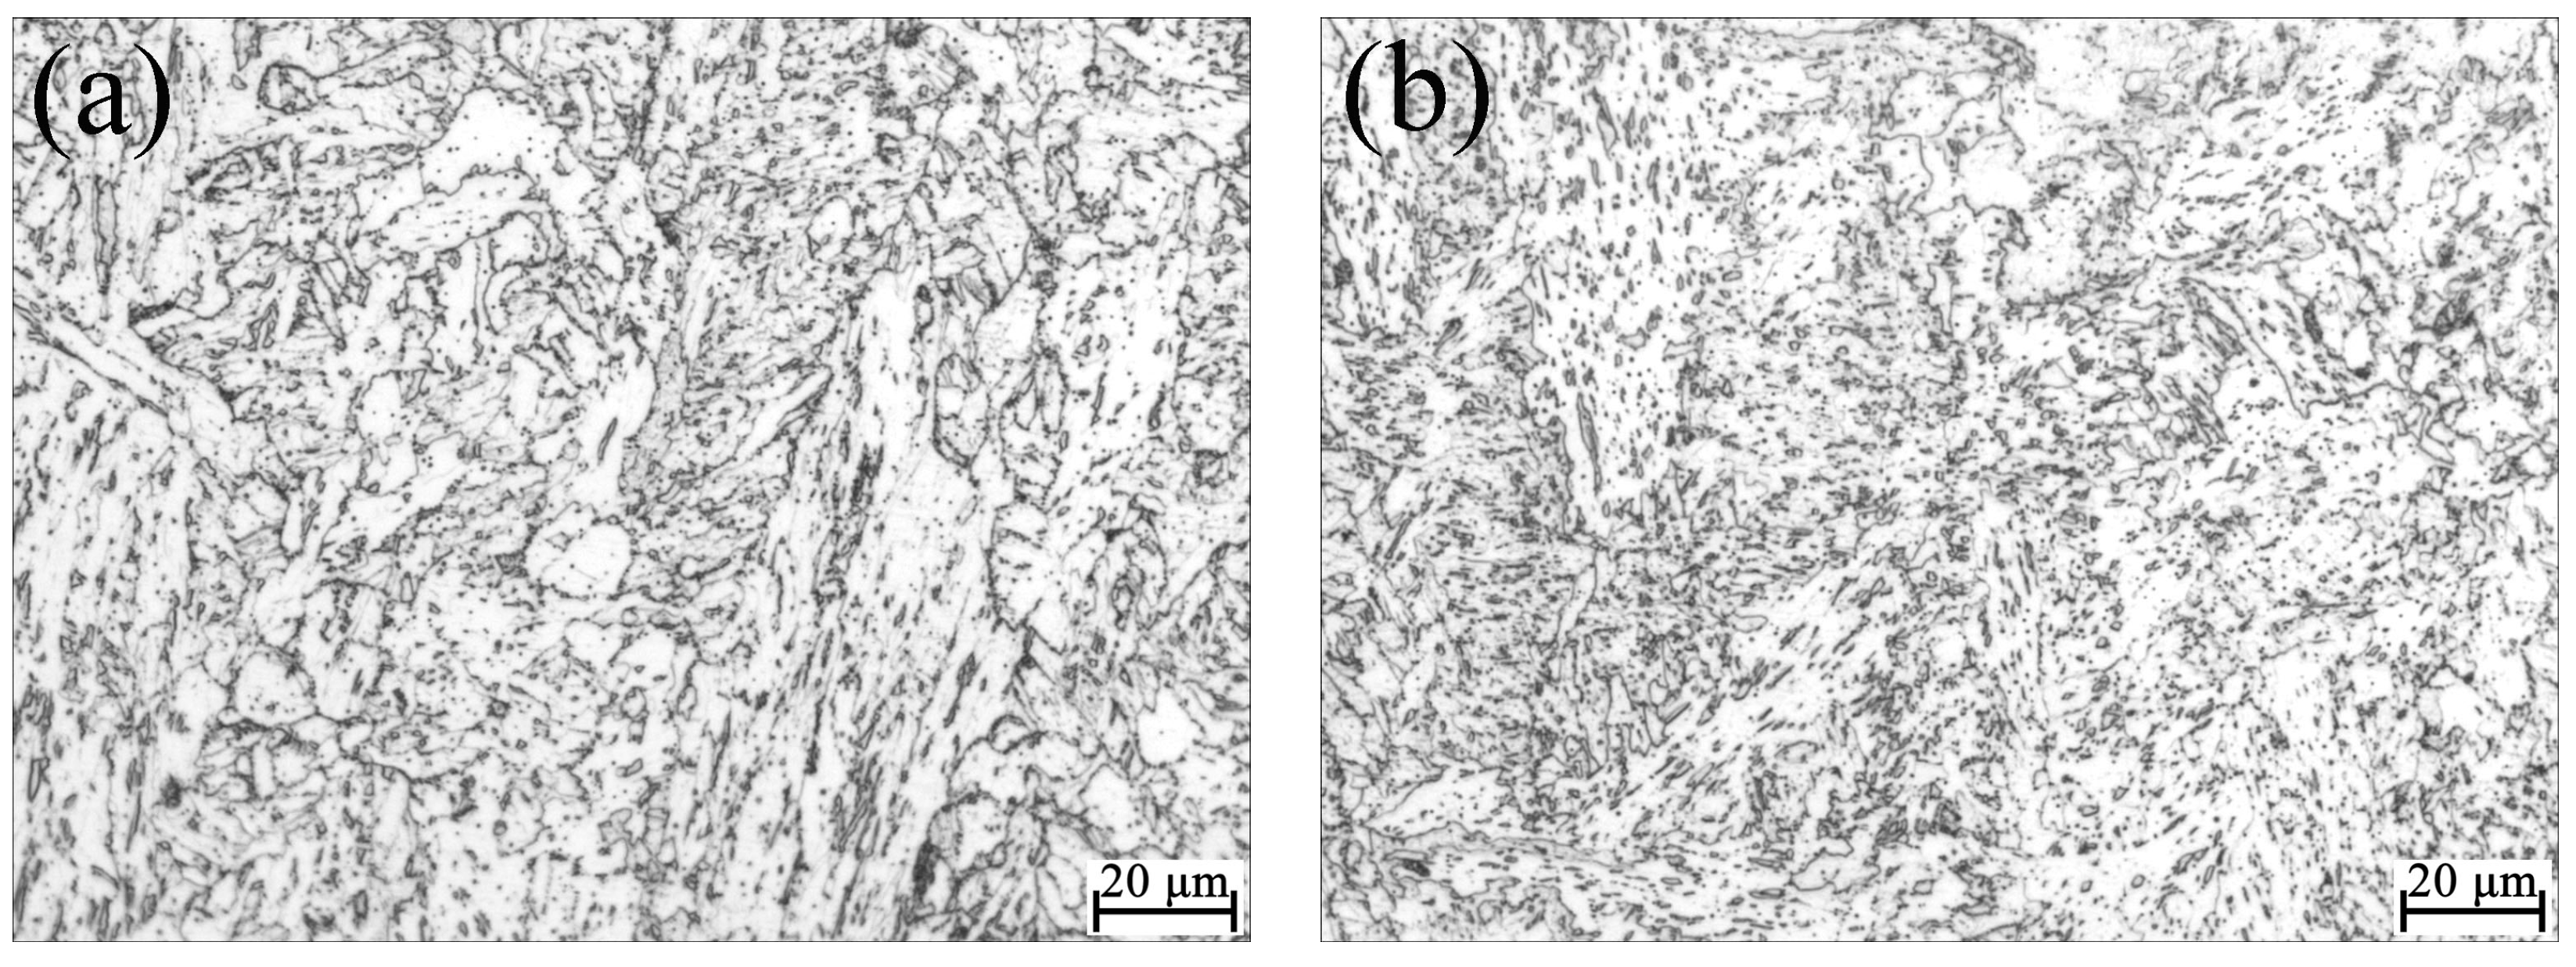
- The FP2 microstructure was not uniform after a single thermal cycle. The WM-CG, WM-CFG, and WM-FG regions were formed when FP2 underwent the single thermal cycle. However, microstructural uniformity increased along with the increase in the number of thermal cycles.
- (4)
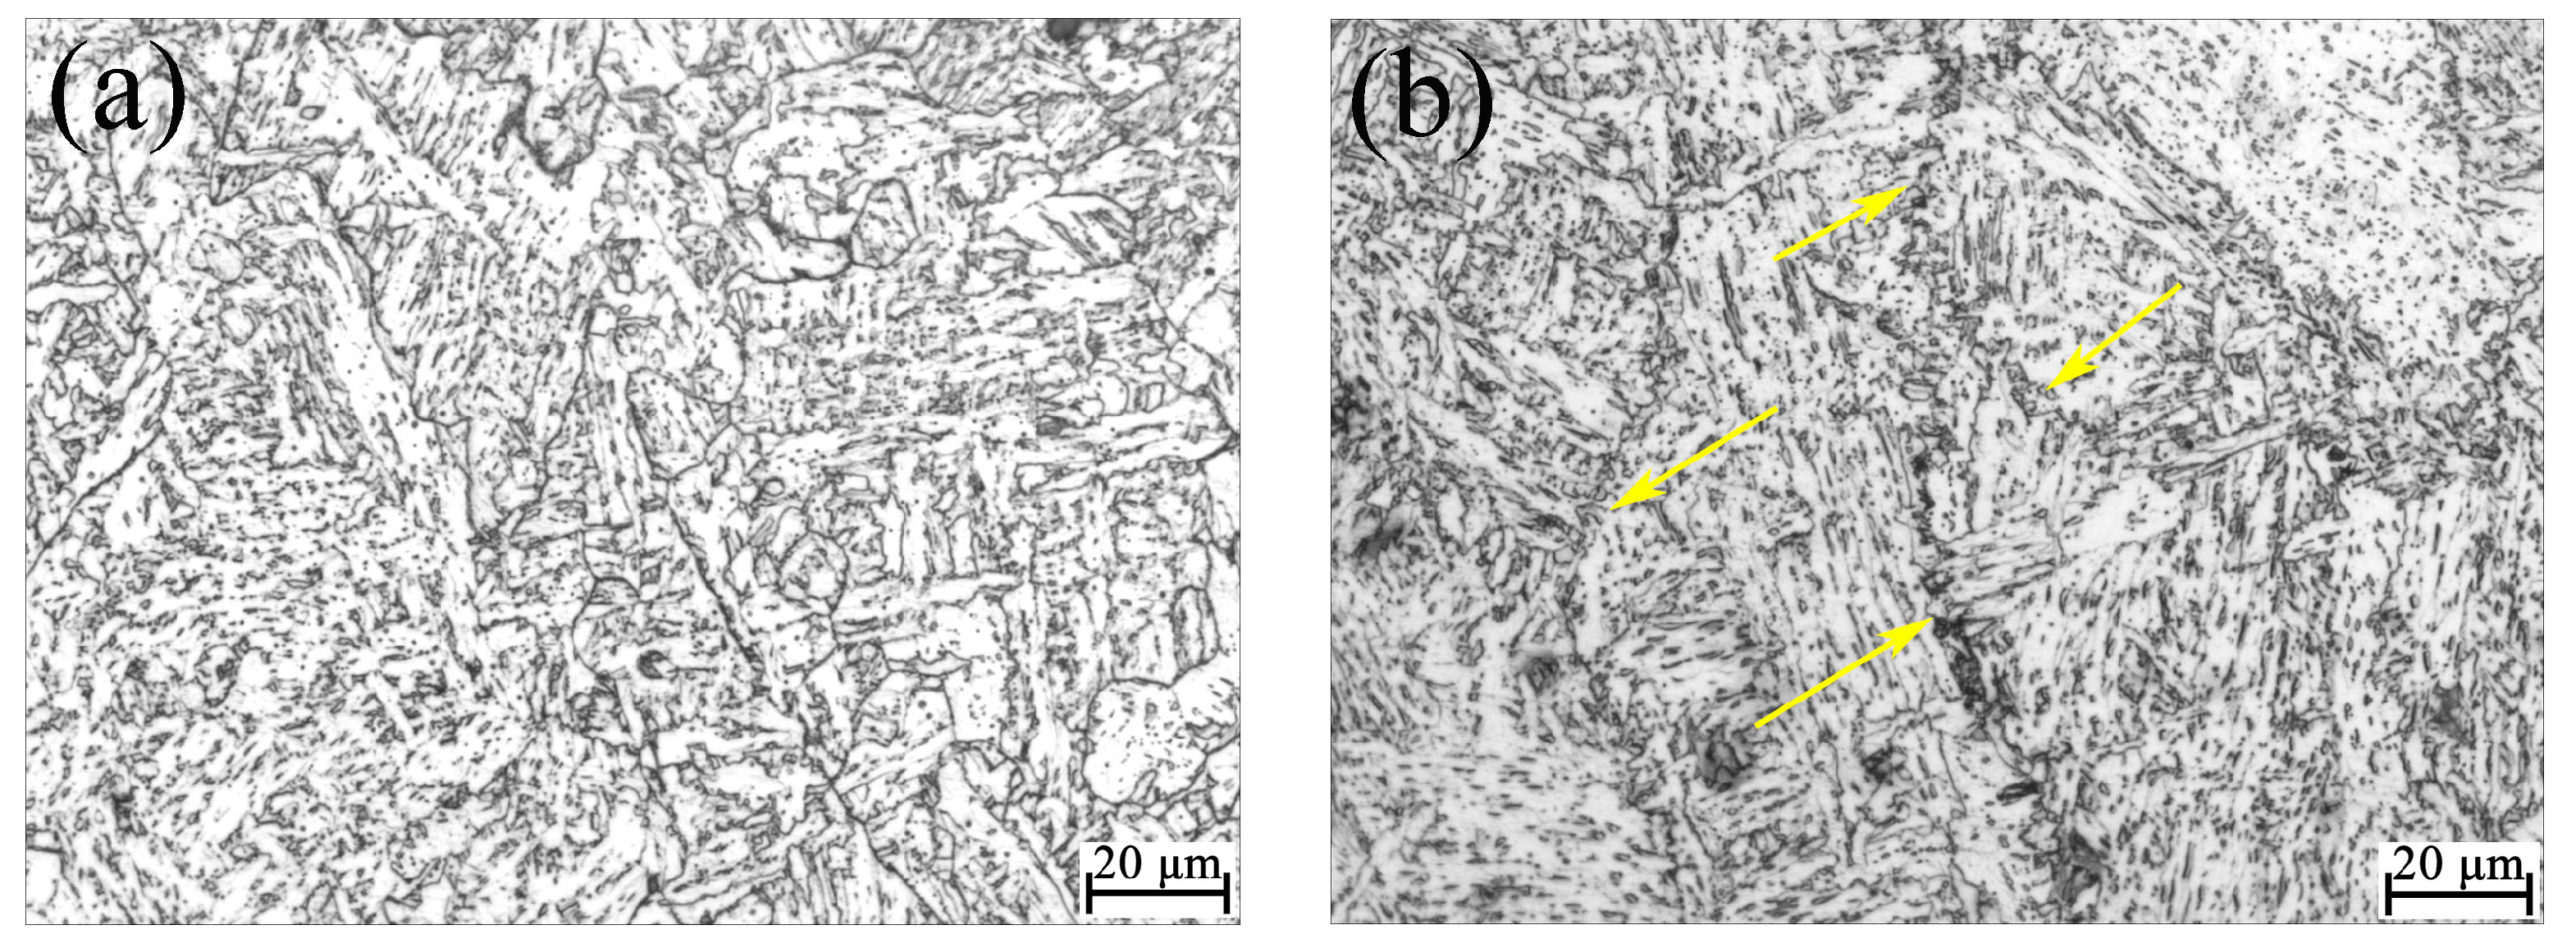
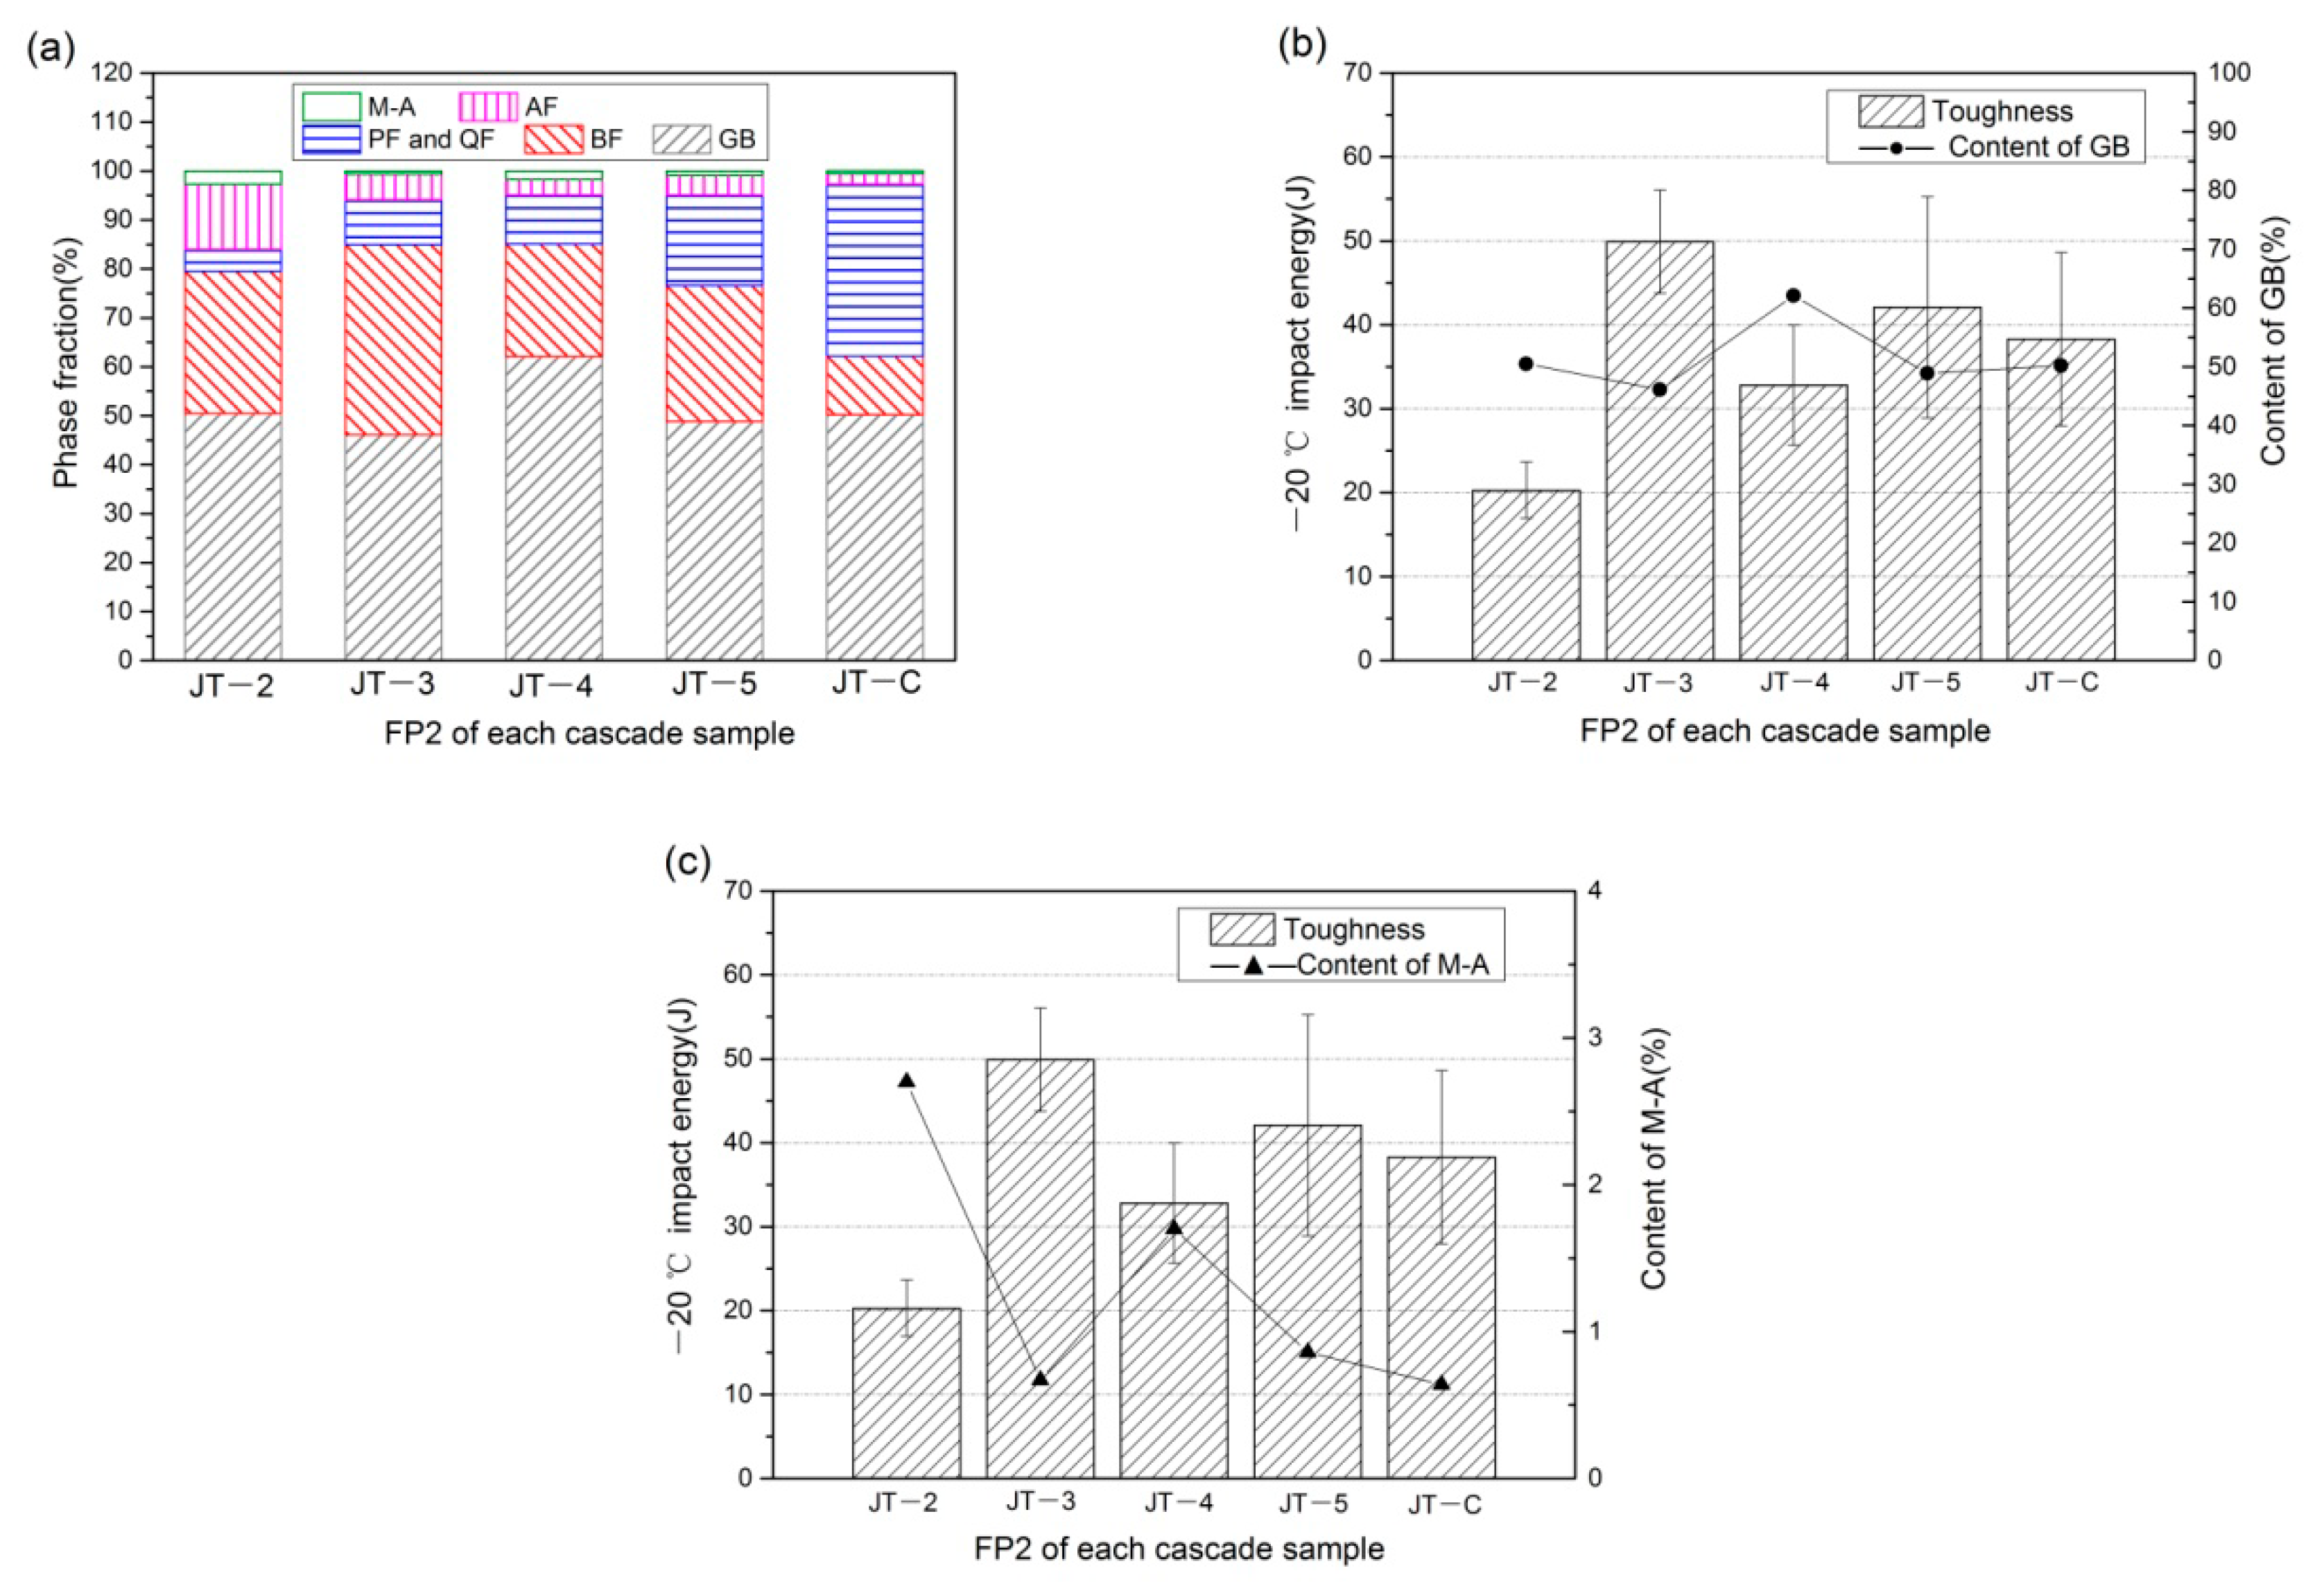
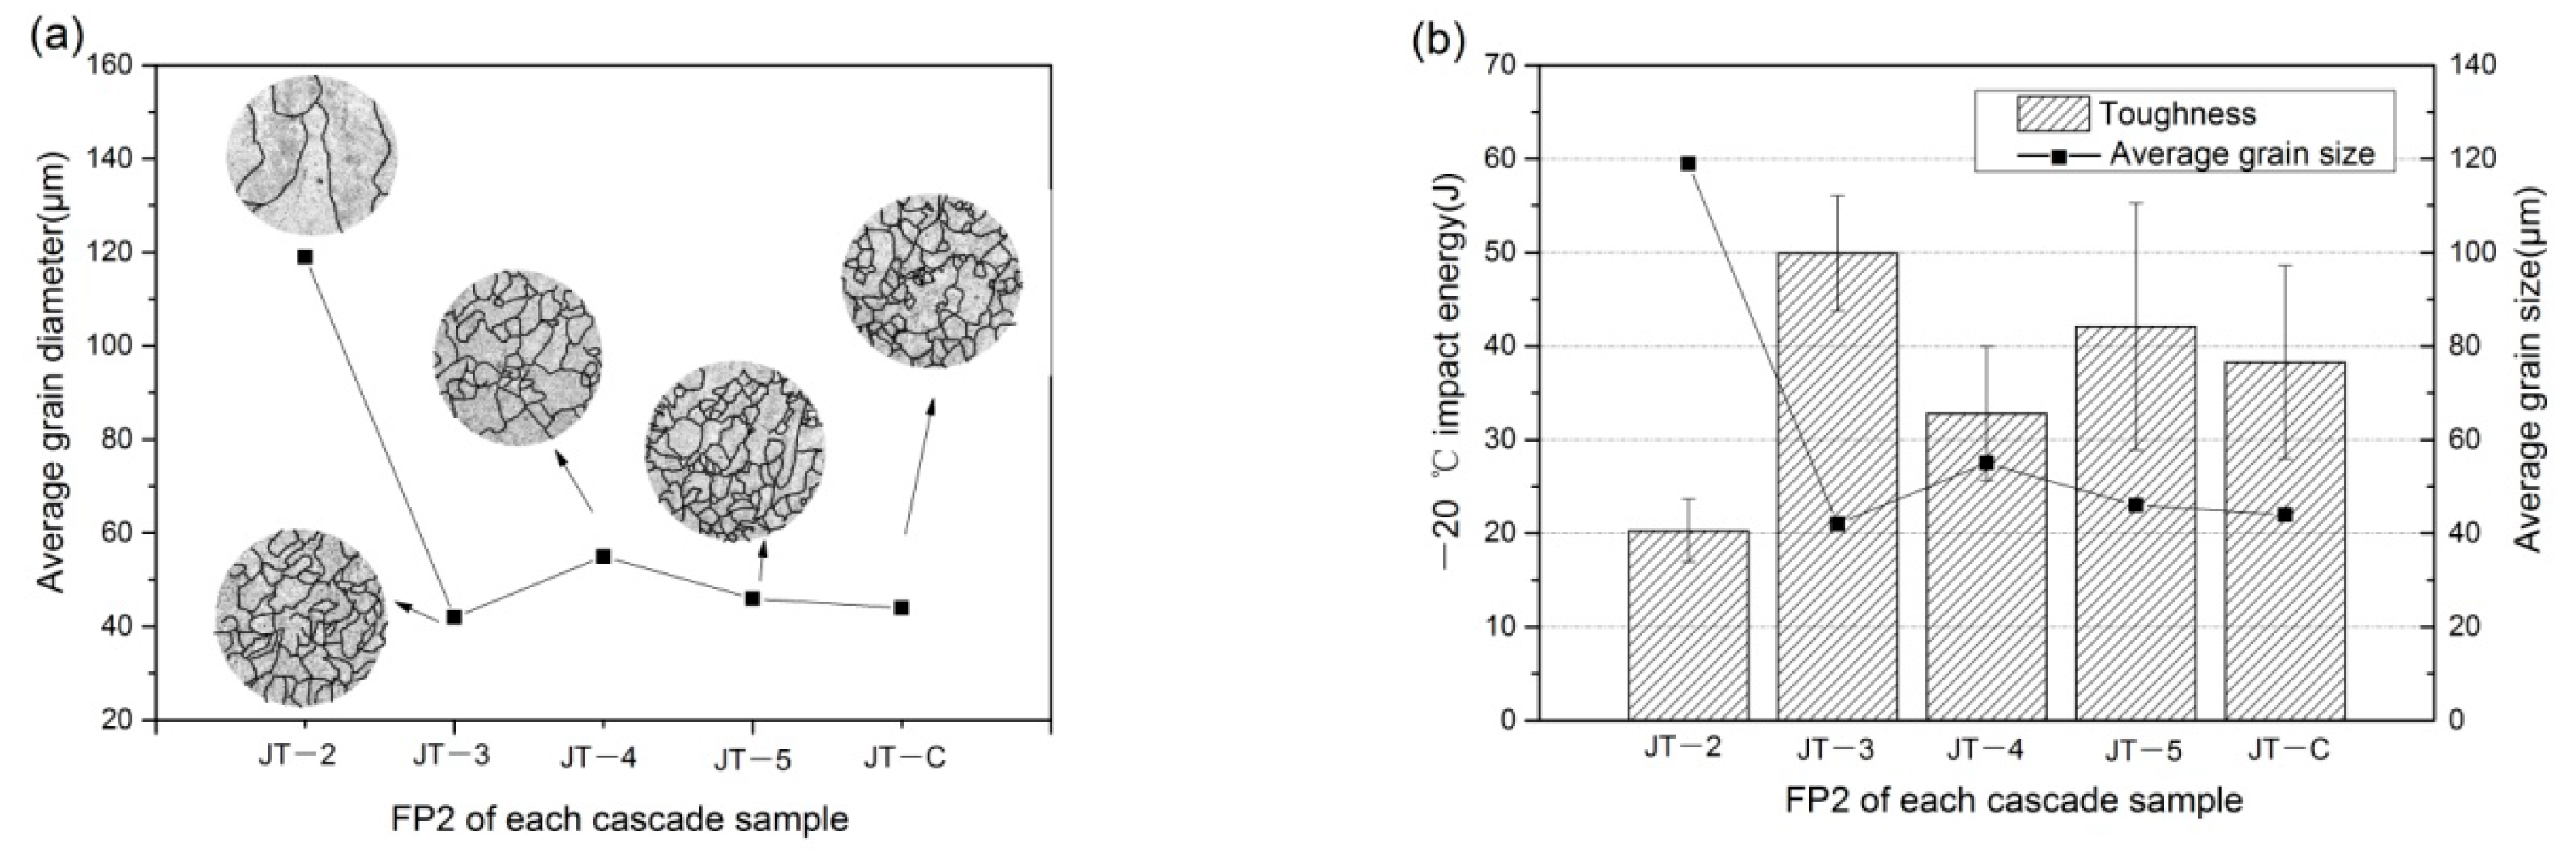
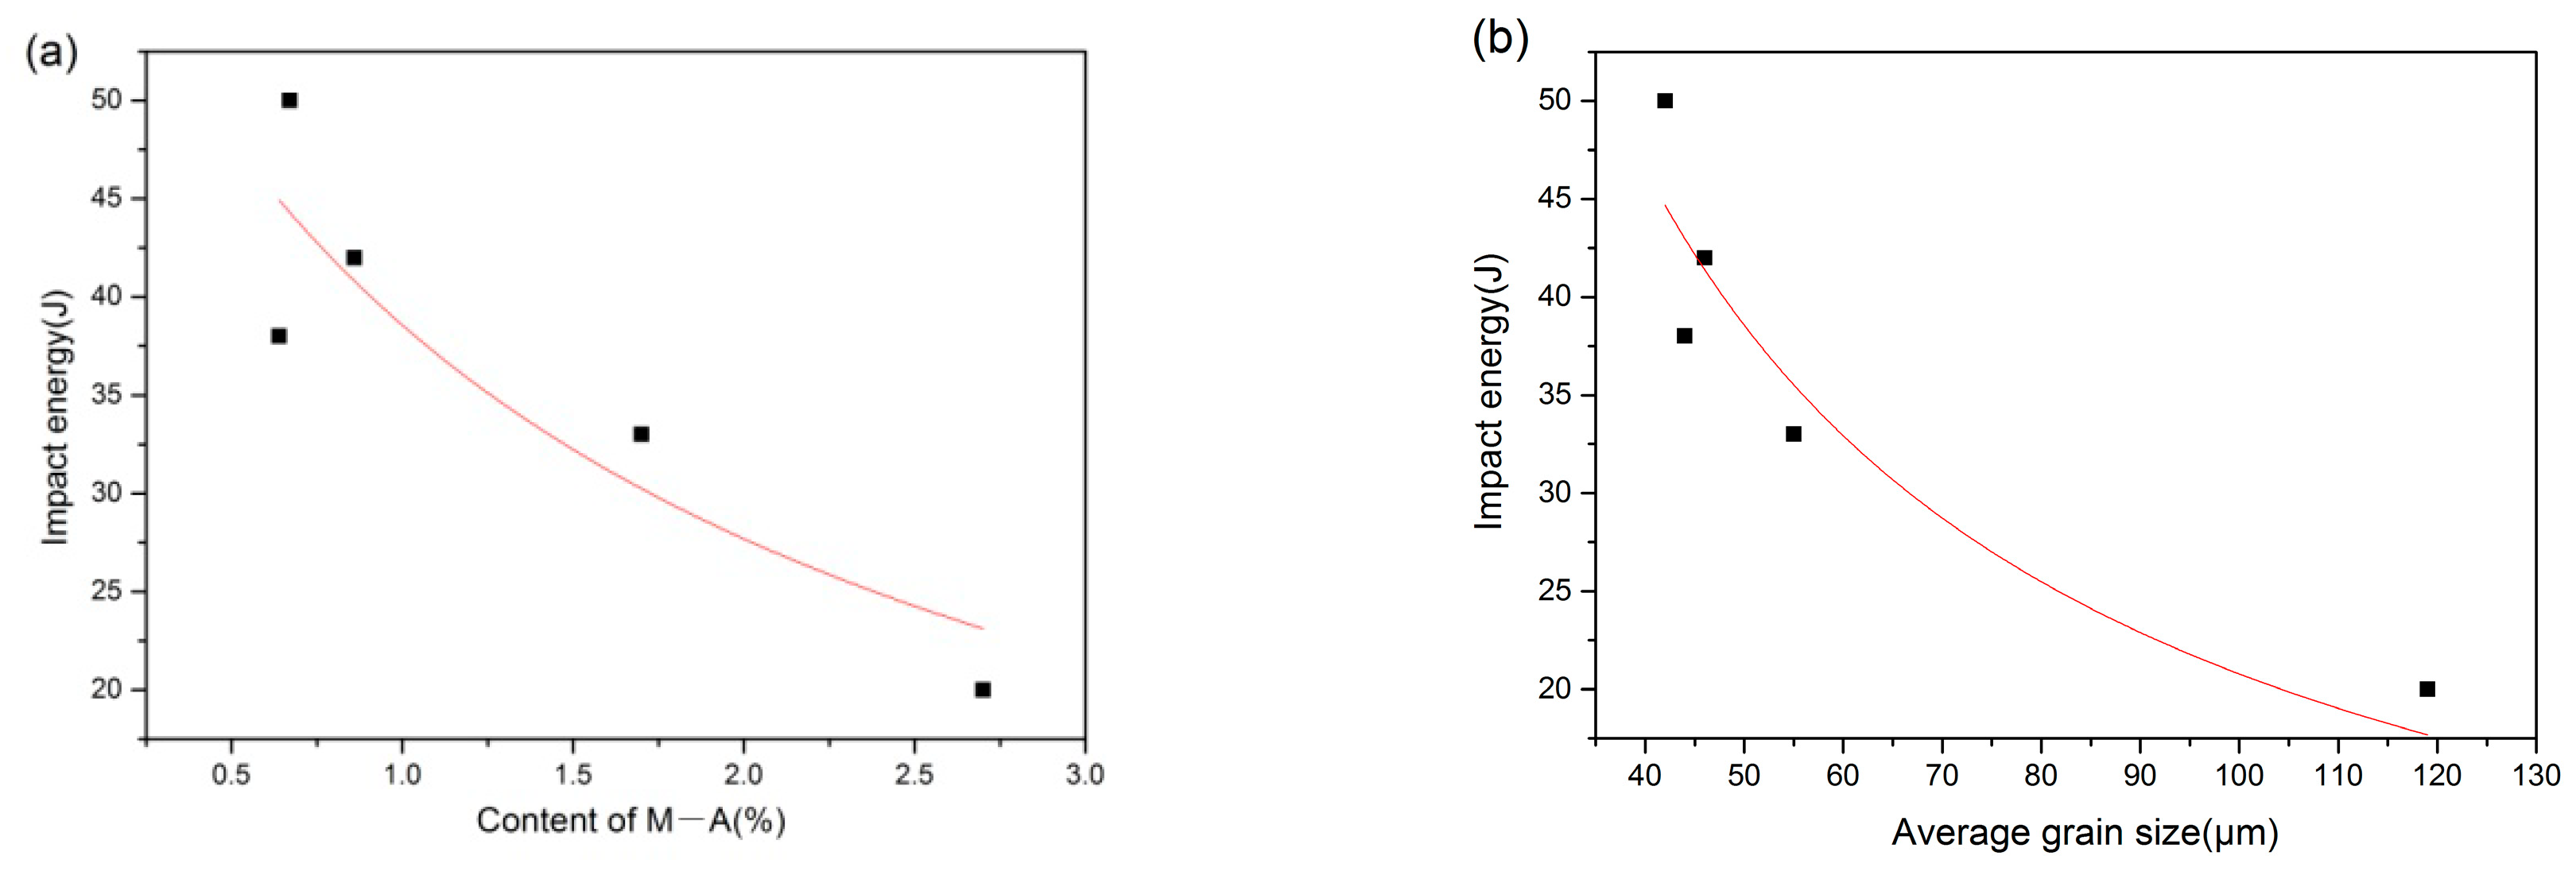
- The content of each phase in the microstructure of FP2 changed under different thermal cycles. Granular bainite (GB) and Bainitic ferrite (BF) were the main phases in FP2 during the entire welding process. However, the content of the M–A constituents and the toughness of FP2 revealed a certain relationship, that is, the content of the M–A constituents was inversely proportional to FP2 toughness. Average grain size and toughness of FP2 also had the same relationship.
- (5)
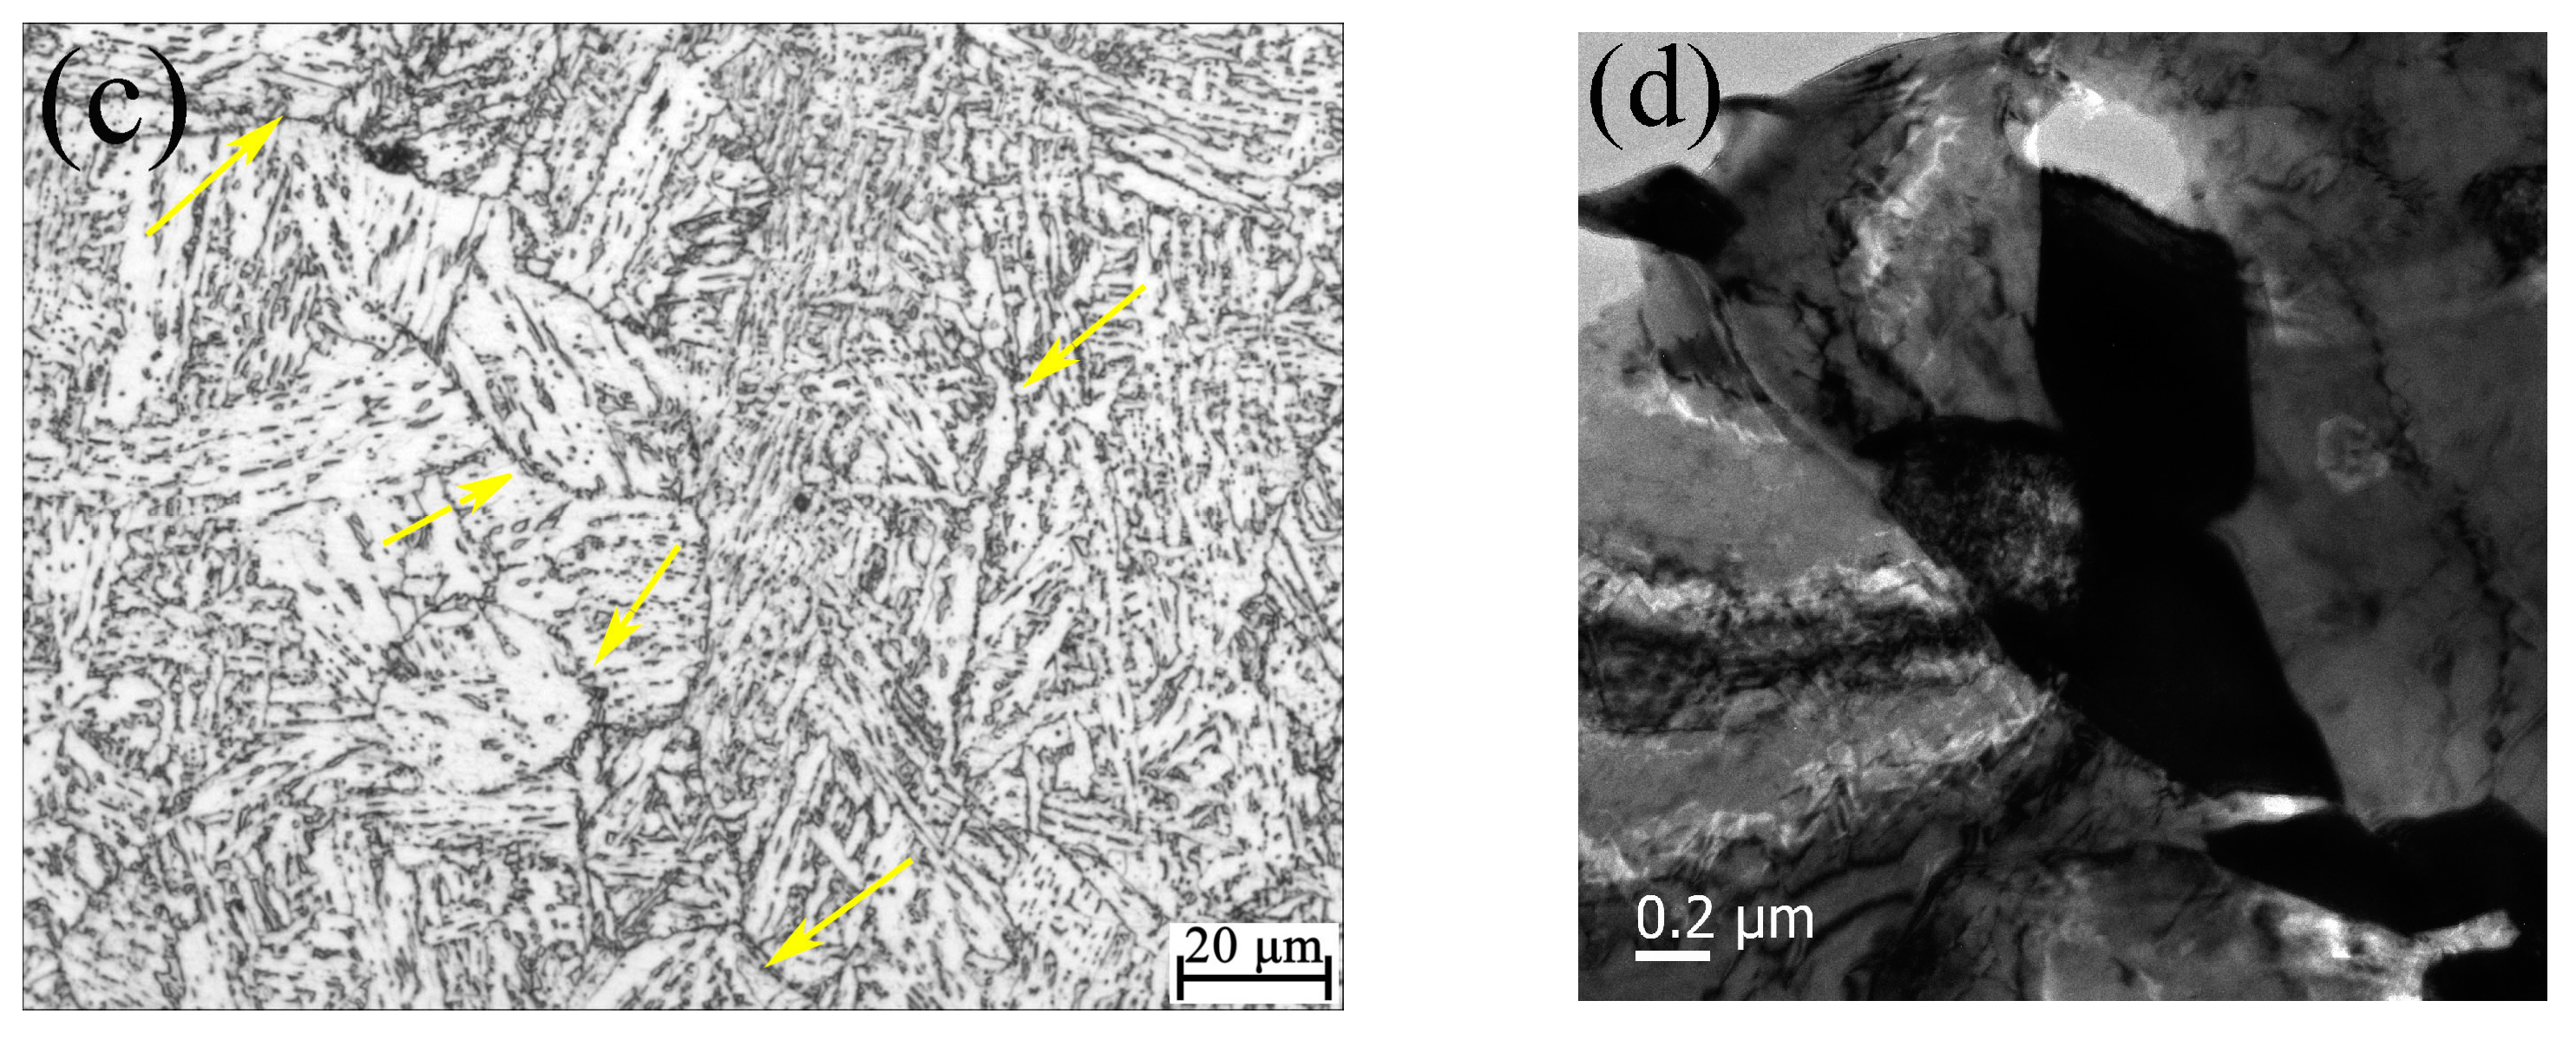
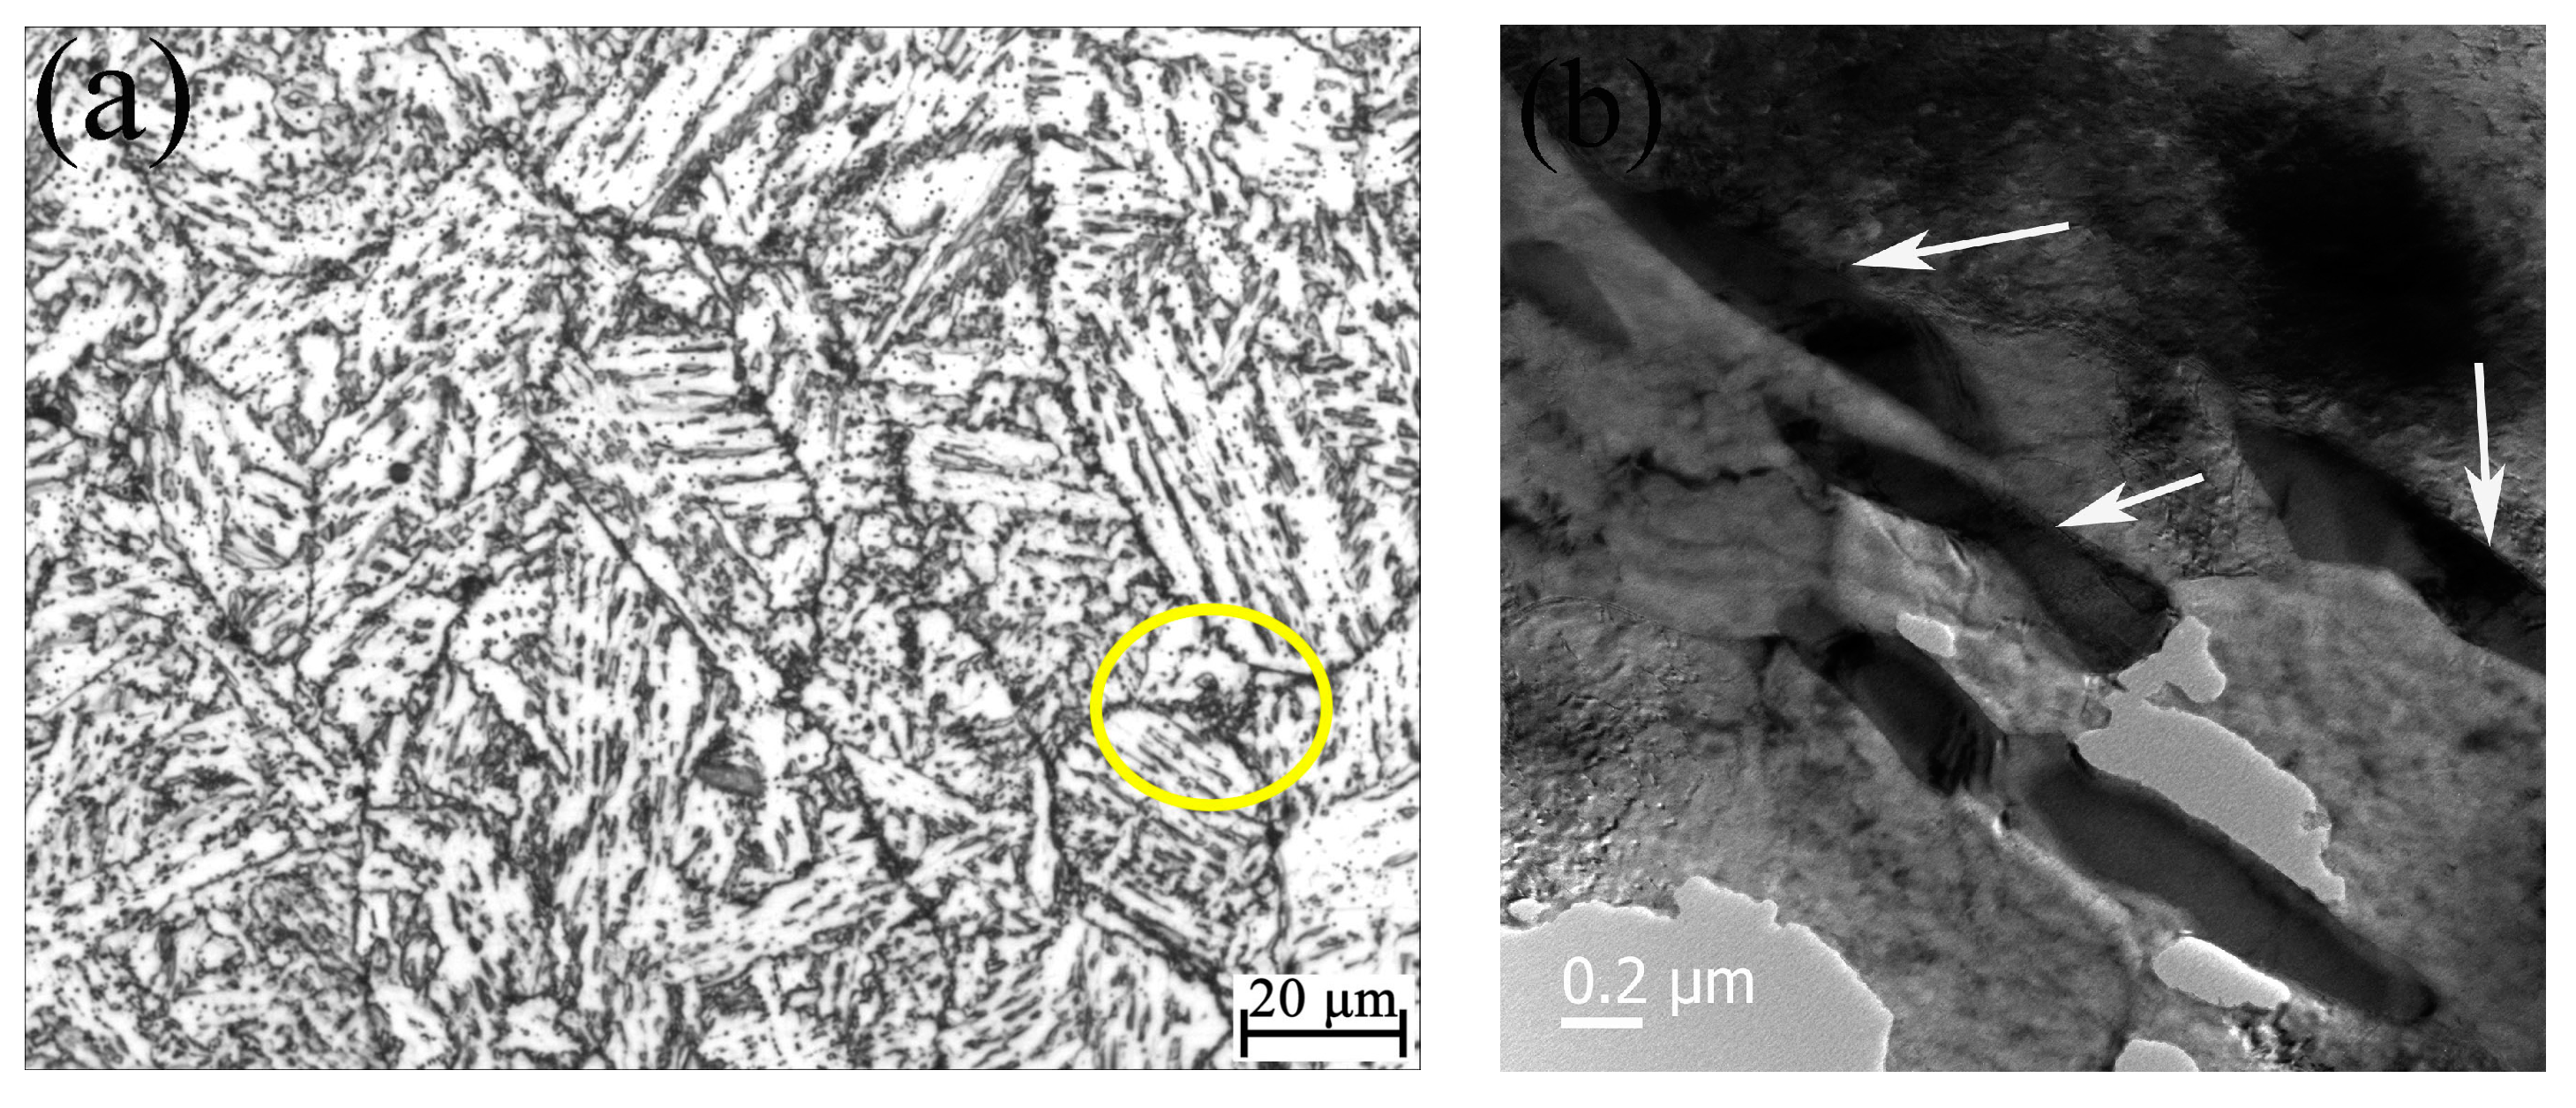
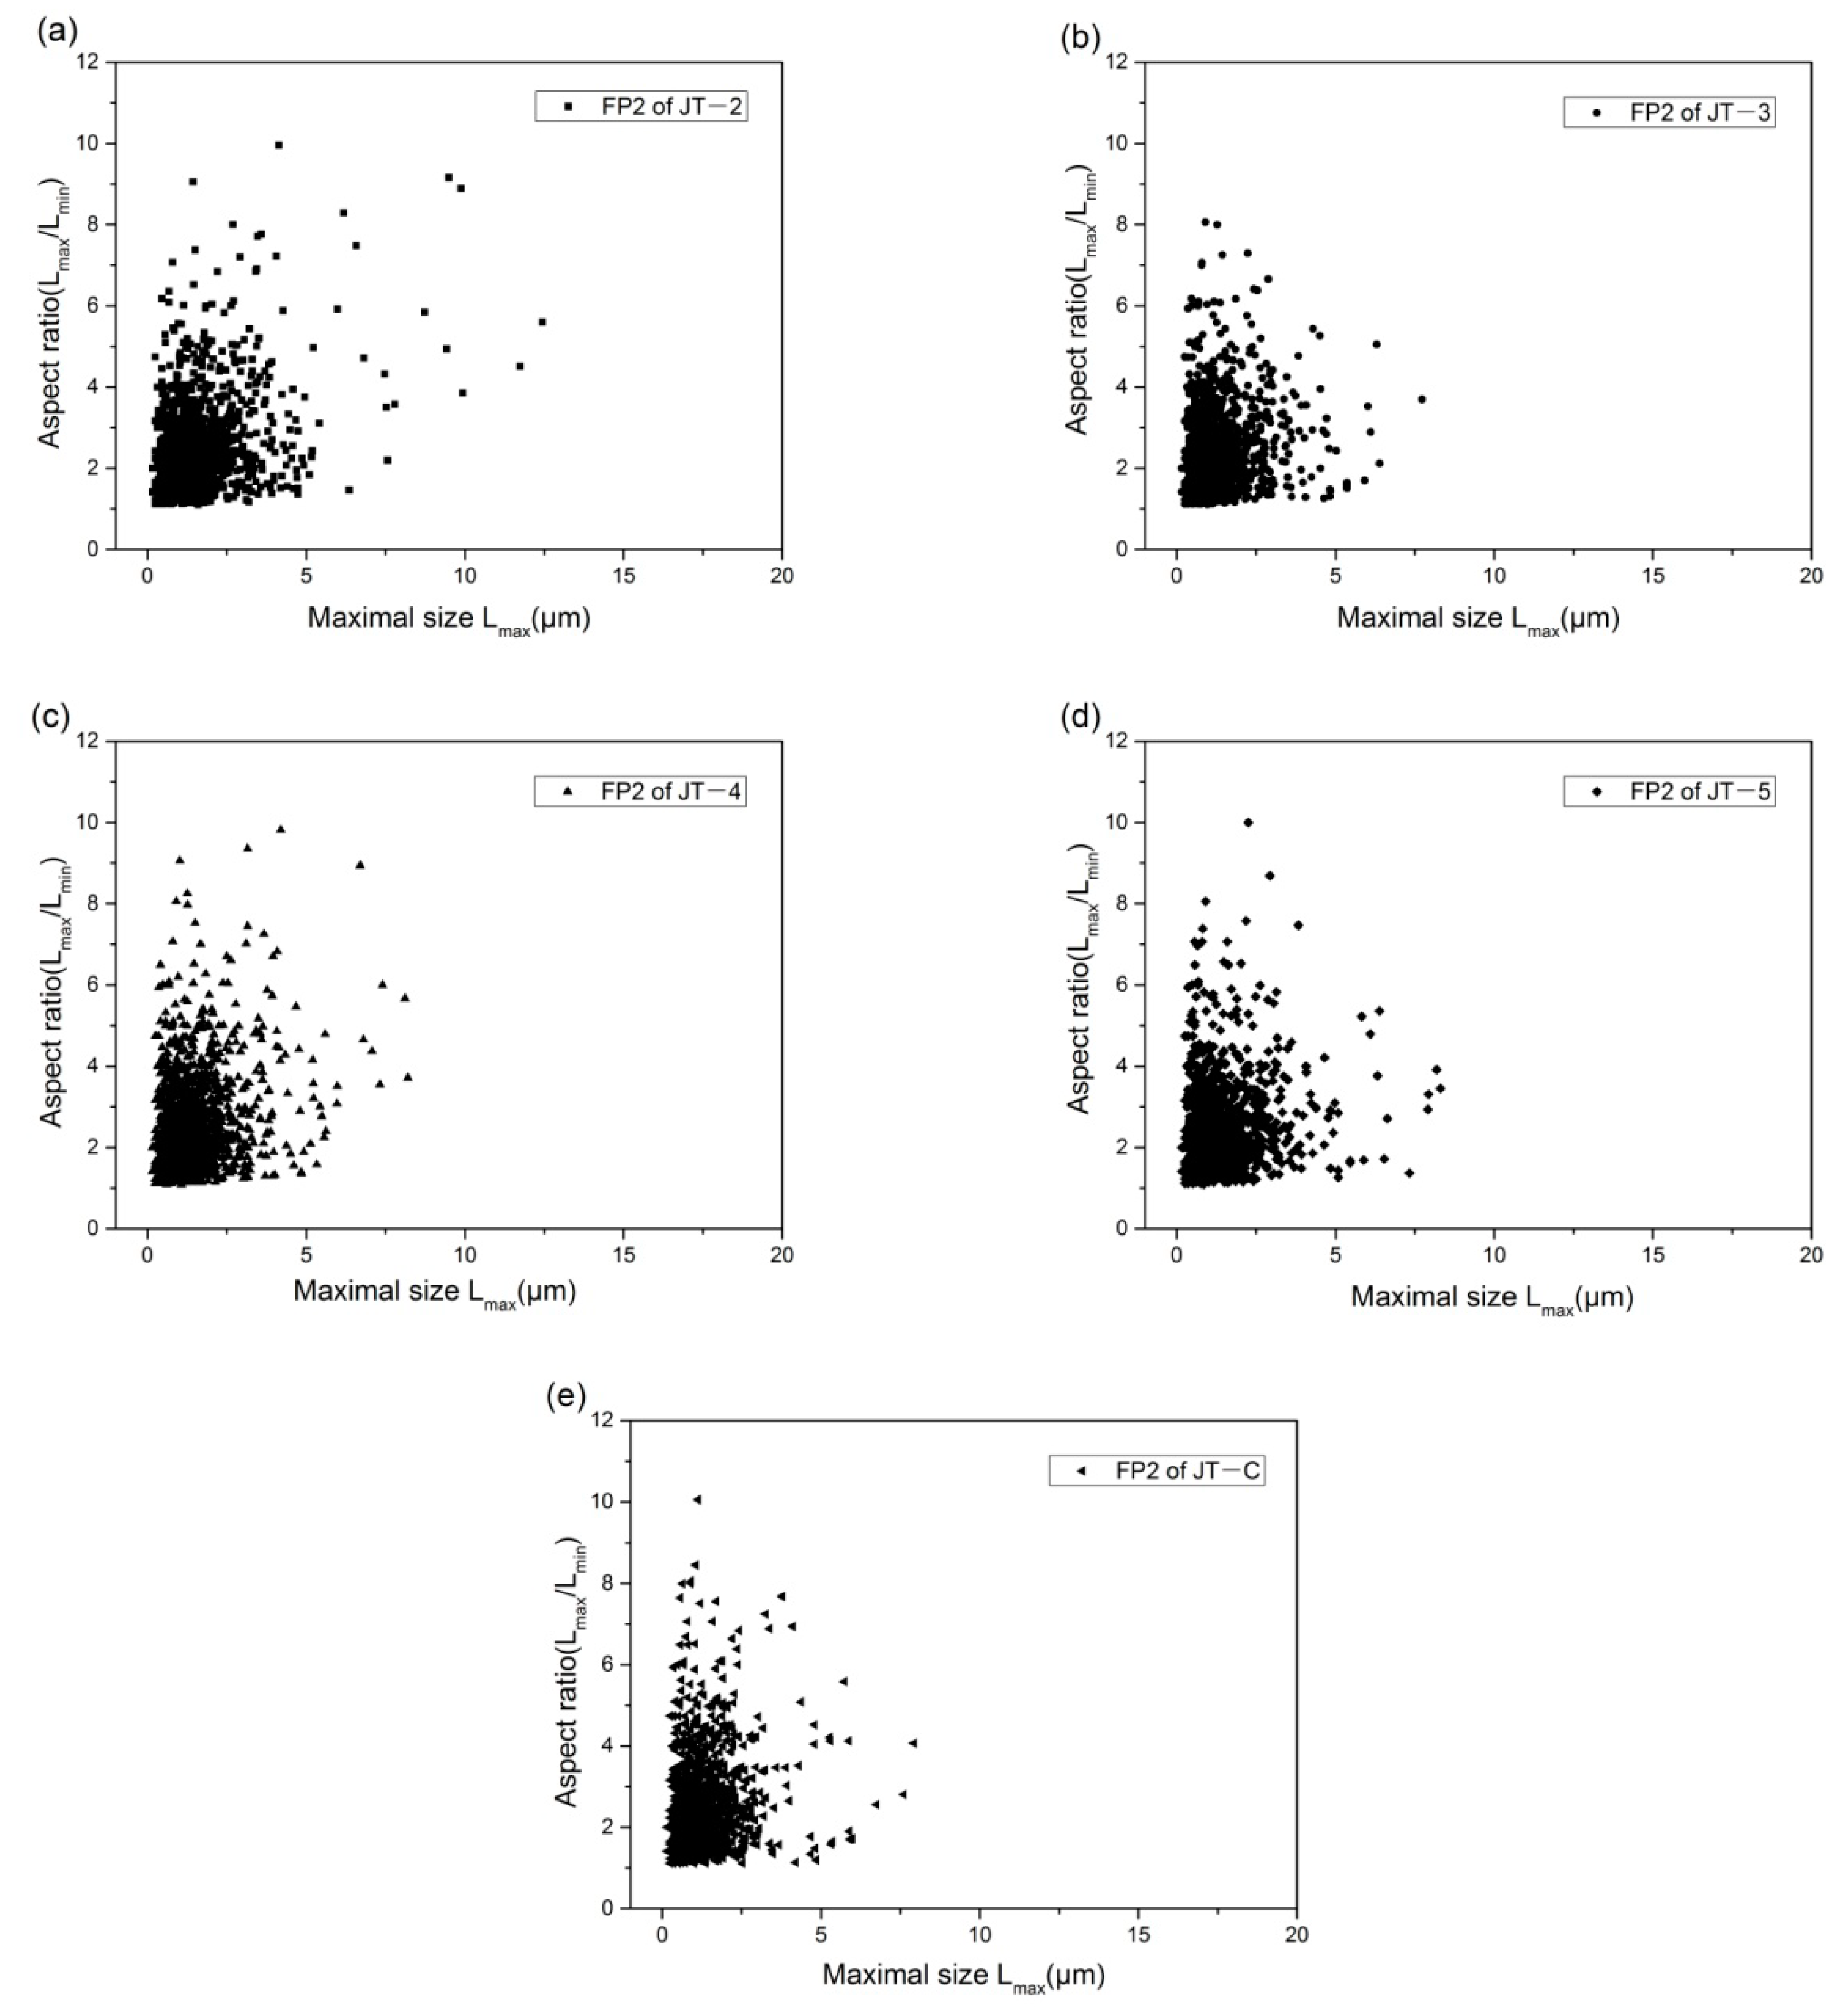
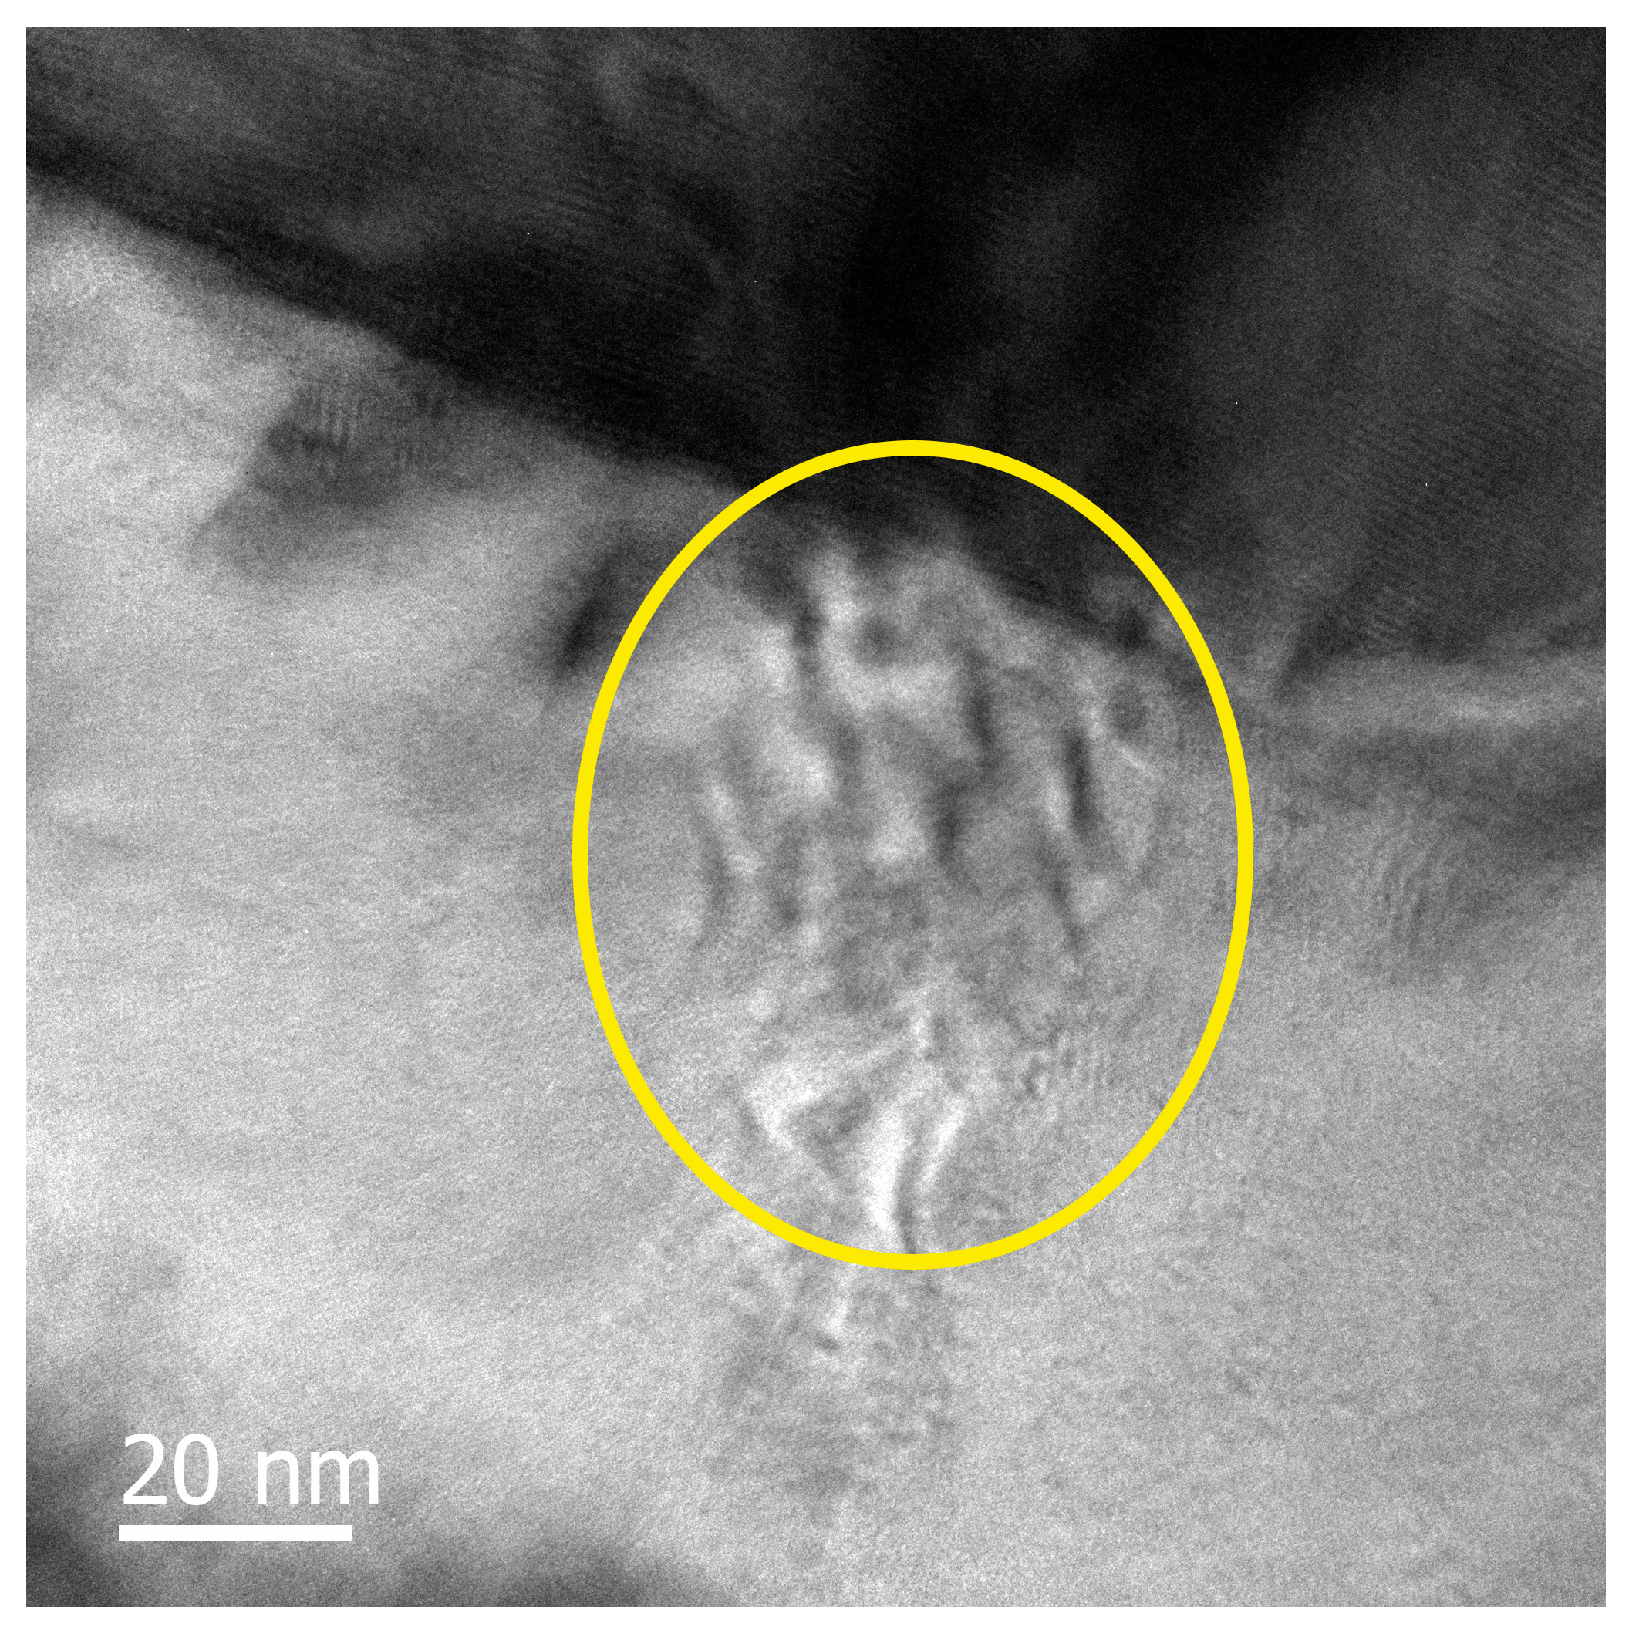
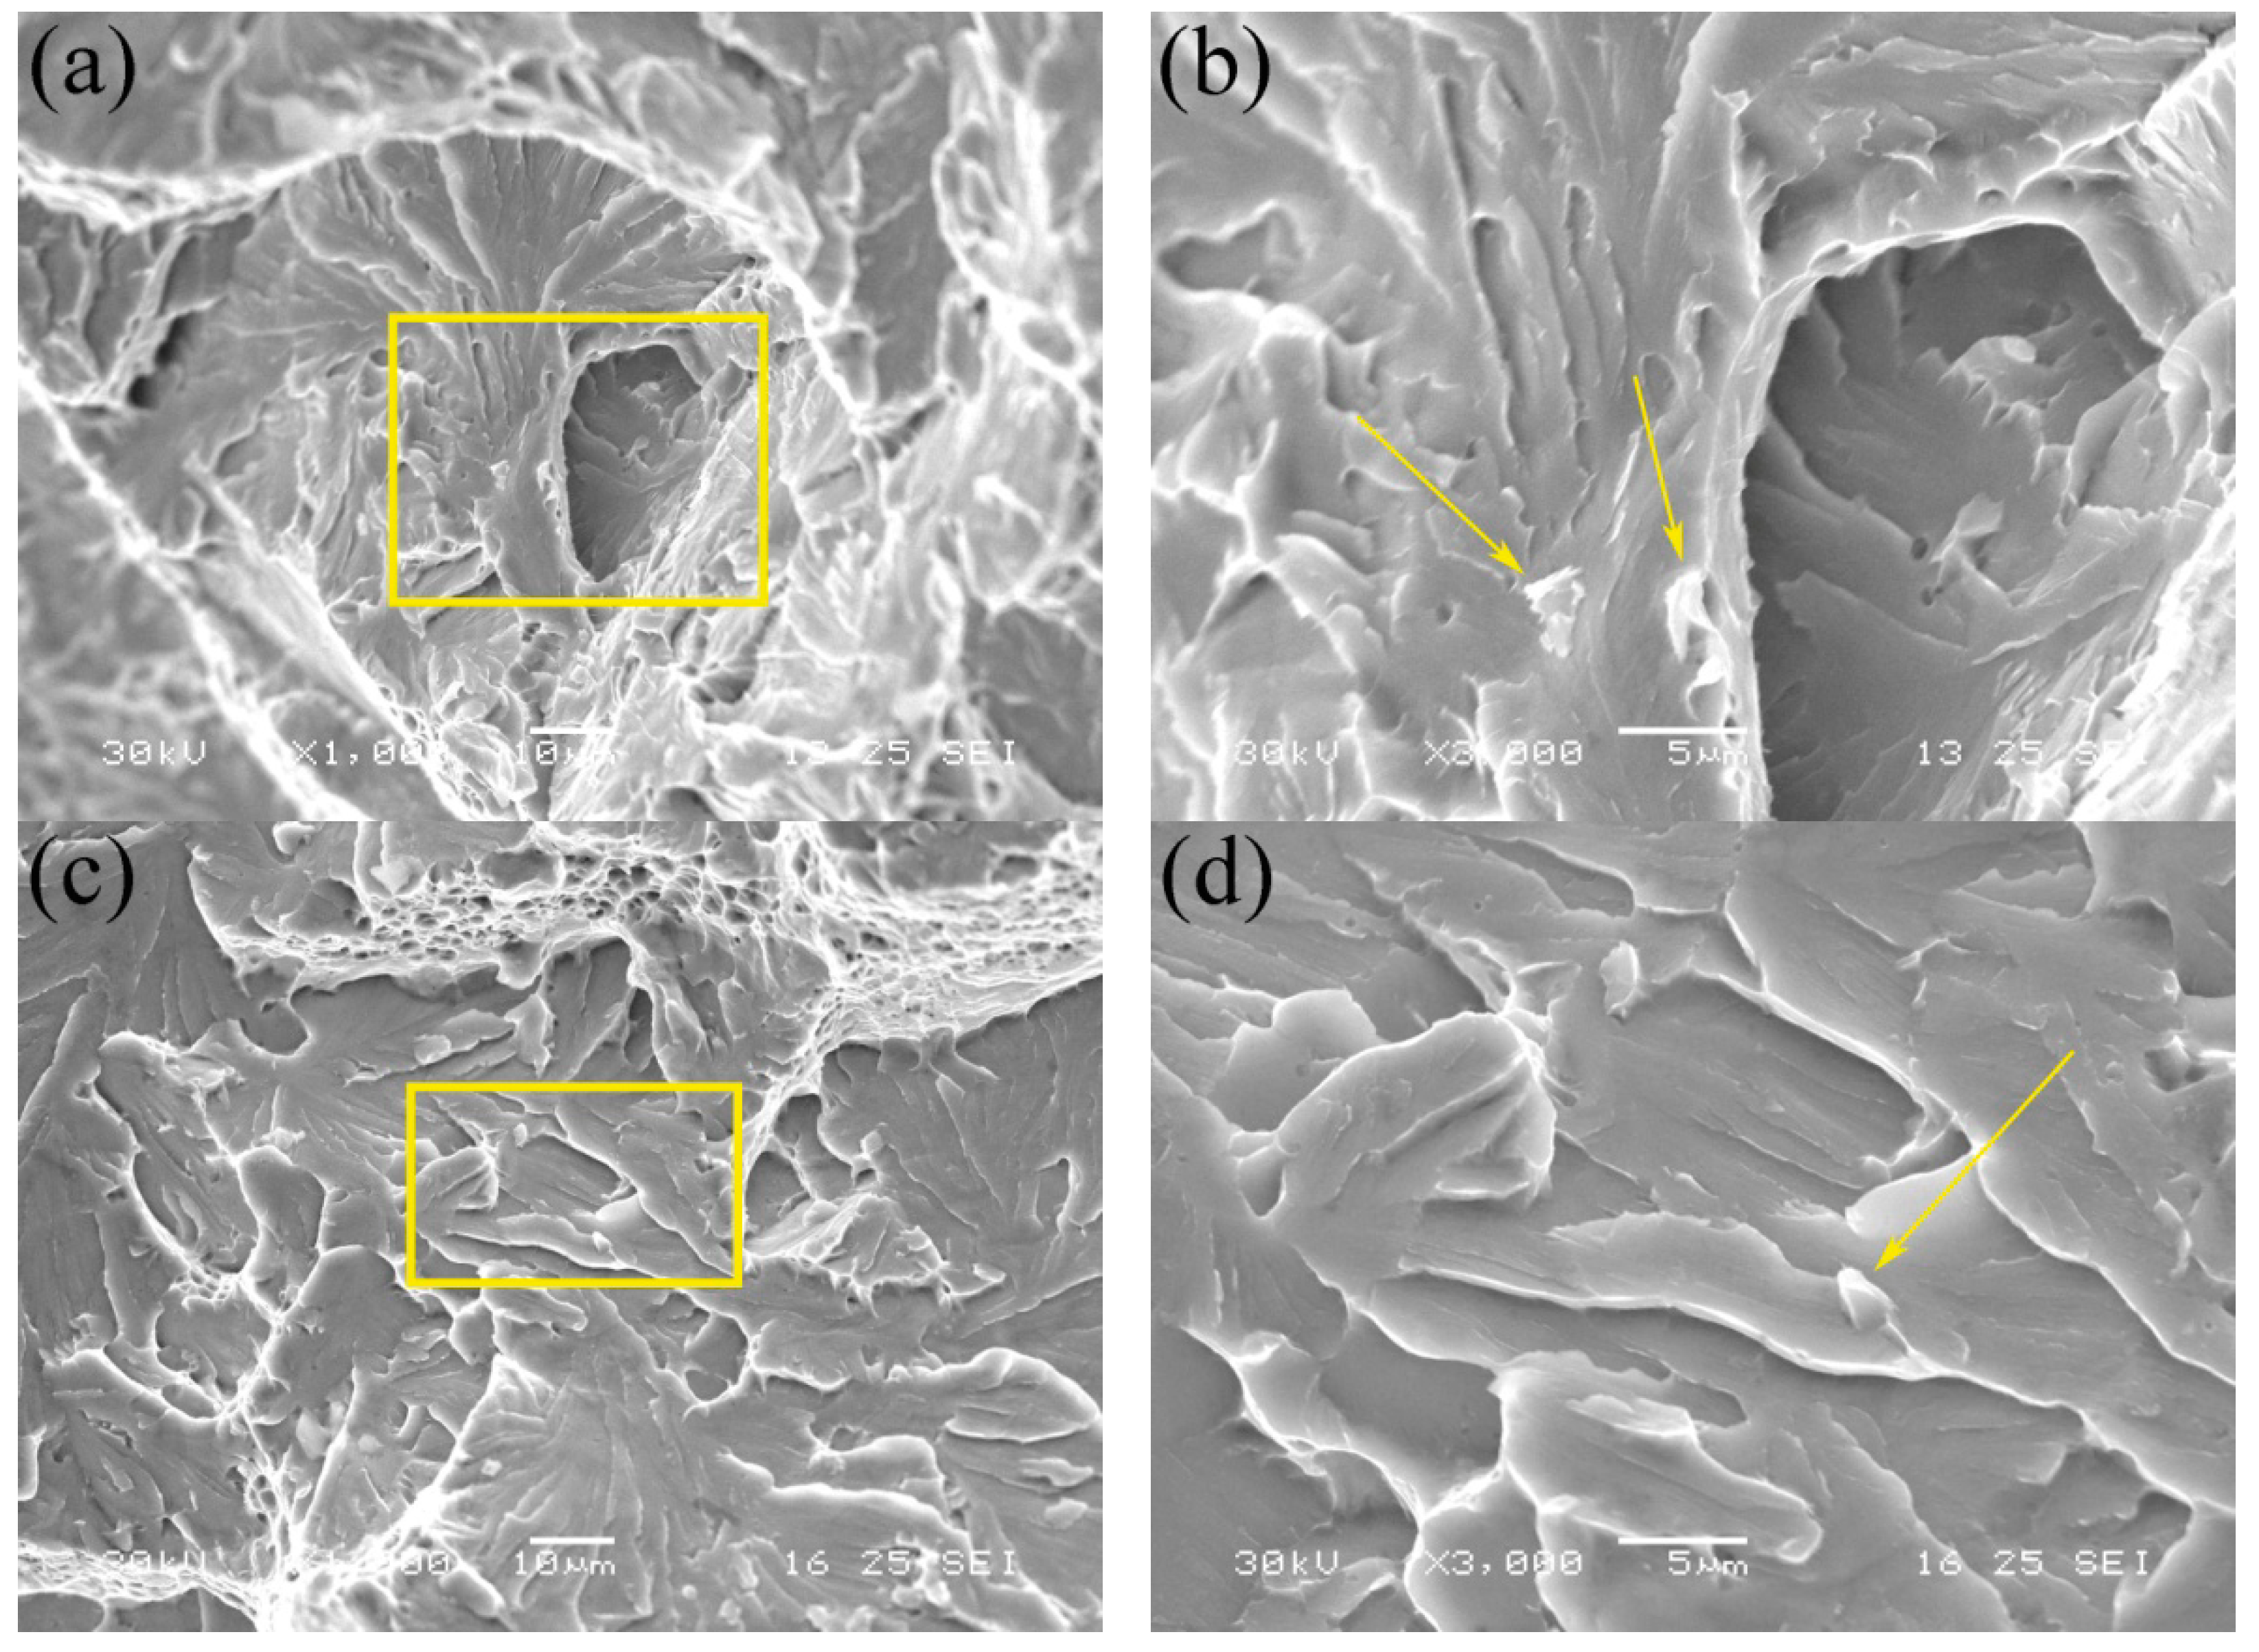
- In the samples with low impact toughness, stress concentration was observed around the M–A constituents in the FP2 microstructure. Large massive M–A constituents and necklace-type M–A constituents were harmful to the toughness. The total content of M–A constituents was inversely proportional to the weld metal toughness.
- (6)
- The weld layer that did not undergo any welding thermal cycle and the weld layer that underwent two welding thermal cycles had the worst toughness. These weld layers were more affected by residual stress compared with other weld layers.
Author Contributions
Funding
Acknowledgments
Conflicts of Interest
References
- Alipooramirabad, H.; Paradowska, A.; Ghomashchi, R.; Reid, M. Investigating the effects of welding process on residual stresses, microstructure and mechanical properties in HSLA steel welds. J. Manuf. Process. 2017, 28, 70–81. [Google Scholar] [CrossRef]
- Cristina, C.; Mariane, C.; Manuel, P.L.; Antonio, D.A.; Francisco, A.F.; Jose, M.S.A. Laser Hybrid Butt Welding of Large Thickness Naval Steel. Metals 2019, 9, 100. [Google Scholar] [CrossRef]
- Sung, H.K.; Sin, S.Y.; Cha, W.; Oh, K.; Lee, S.; Kim, N.J. Effects of acicular ferrite on charpy impact properties in heat affected zones of oxide-containing API X80 linepipe steels. Mater. Sci. Eng. A 2011, 528, 3350–3357. [Google Scholar] [CrossRef]
- Eva, Z.; Ján, S. Mechanical and microstructural investigations of the laser welding of different zinc-coated steels. Metals 2019, 9, 1–13. [Google Scholar]
- Zhang, X.G.; Li, L.Q.; Chen, Y.B.; Zhu, X.C.; Ji, S.J. Numerical simulation analysis of dual-beam laser welding of tailored blanks with different thicknesses. Metals 2019, 9, 135. [Google Scholar] [CrossRef]
- Wang, H.; Woo, W.; Kim, D.K.; Em, V. Effect of chemicaldilution and the number of weld layers on residual stresses in a multi-pass low-transformation temperature weld. Mater. Des. 2018, 160, 384–394. [Google Scholar] [CrossRef]
- Luo, X.; Chen, X.H.; Wang, T.; Pan, S.W.; Wang, Z.D. Effect of morphologies of martensite-austenite constituents on impact toughness in intercritically reheated coarse-grained heat-affected zone of HSLA steel. Mater. Sci. Eng. A 2018, 710, 192–199. [Google Scholar] [CrossRef]
- Lan, L.Y.; Qiu, C.L.; Zhao, D.W.; Gao, X.H.; Du, L.X. Analysis of martensite-austenite constituent and its effect on toughness in submerged arc welded joint of low carbon bainitic steel. J. Mater. Sci. 2012, 47, 4732–4742. [Google Scholar] [CrossRef]
- Li, X.D.; Fan, Y.R.; Ma, X.P.; Subramanian, S.V.; Shang, C.J. Influence of martensite-austensite constituents formed at different intercritical temperatures on toughness. Mater. Des. 2015, 67, 457–463. [Google Scholar] [CrossRef]
- Mohammadijoo, M.; Valloton, J.; Collins, L.; Henein, H.; Ivey, D.G. Characterization of martensite-austenite constituents and micro-hardness in intercritical reheated and coarse-grained heat affected zones of API X70 HSLA steel. Mater. Charact. 2018, 142, 321–331. [Google Scholar] [CrossRef]
- Lan, H.F.; Du, L.X.; Misra, R.D.K. Effect of microstructural constituents on strength-toughness combination in a low carbon bainitic steel. Mater. Sci. Eng. A 2014, 611, 194–200. [Google Scholar] [CrossRef]
- Zheng, C.C.; Wang, X.M.; Li, S.R. Effects of inclusions on microstructure and properties ofheat-affected-zone for low-carbon steels. Sci. China Technol. Sci. 2012, 55, 1556–1565. [Google Scholar] [CrossRef]
- Moeinifar, S.; Kokabi, A.H.; Hosseini, H.R.M. Influence of peak temperature during simulation and real thermal cycles on microstructure and fracture properties of the reheated zones. Mater. Des. 2010, 31, 2948–2955. [Google Scholar] [CrossRef]
- Haugen, V.G.; Rogne, B.R.S.; Akselsen, O.M.; Thaulow, C.; Østby, E. Local mechanical properties of intercritically reheated coarse grained heat affected zone in low alloy steel. Mater. Des. 2014, 59, 135–140. [Google Scholar] [CrossRef]
- Zhang, W.D.; Zhao, G.Q.; Fu, Q.J. Study on the effects and mechanisms of induction heat treatment cycles on toughness of high frequency welded pipe welds. Mater. Sci. Eng. A 2018, 736, 276–287. [Google Scholar] [CrossRef]
- Maresca, F.; Kouznetsova, V.G.; Geers, M.G.D.; Curtin, W.A. Contribution of austenite-martensite transformation to deformability of advanced high strength steels: From atomistic mechanisms to microstructural response. Acta. Mater. 2018, 156, 463–478. [Google Scholar] [CrossRef] [Green Version]
- Huda, N.; Midawi, A.R.H.; Gianetto, J.; Lazor, R.; Gerlich, A.P. Influence of martensite-austenite(MA) on impact toughness of X80 line pipe steels. Mater. Sci. Eng. A 2016, 662, 481–491. [Google Scholar] [CrossRef]
- Ci, Y.; Zhang, Z.Z. Simulation study on heat-affected zone of high-strain X80 pipeline steel. J. Iron Steel Res. Int. 2017, 24, 966–972. [Google Scholar] [CrossRef]
- Lee, S.G.; Sohn, S.S.; Kim, B.; Kim, W.G.; Um, K.K.; Lee, S. Effects of martensite-austenite constituent on crack initiation and propagation in inter-critical heat-affected zone of high-strength low-alloy (HSLA) steel. Mater. Sci. Eng. A 2018, 715, 332–339. [Google Scholar] [CrossRef]
- Kumar, S.; Nath, S.K. Effect of weld thermal cycles on microstructures and mechanical properties in simulated heat affected zone of a HY 85 steel. Trans. Indian Inst. Met. 2017, 70, 239–250. [Google Scholar] [CrossRef]
- Wang, X.L.; Nan, Y.R.; Xie, Z.J.; Tsai, Y.T.; Yang, J.R.; Shang, C.J. Influence of welding pass on microstructure and toughness in the reheated zone of multi-pass weld metal of 550MPa offshore engineering steel. Mater. Sci. Eng. A 2017, 702, 196–205. [Google Scholar] [CrossRef]
- Xie, Z.J.; Han, G.; Zhou, W.H.; Wang, X.L.; Shang, C.J.; Misra, R.D.K. A novel multi-step intercritical heat treatment induces multi-phase microstructure with ultra-low yield ratio and high ductility in advanced high-strength steel. Scr. Mater. 2018, 155, 164–168. [Google Scholar] [CrossRef]
- Martinez Krahmer, D.; Polvorosa, R.; Lopez de Lacalle, L.N.; Alonso-Pinillos, U.; Abate, G.; Riu, F.A. Alternatives for specimens manufacturing in tensile testing of steel plates. Exp. Tech. 2016, 40, 1555–1565. [Google Scholar] [CrossRef]
- Zhang, S.H.; Zhao, D.W.; Wang, X.N. Influence of yield-to-tensile strength ratio(Y/T) on failure assessment of defect-free and corroded X70 steel pipeline. J. Cent. South Univ. 2014, 21, 460–465. [Google Scholar] [CrossRef]
- Pavlina, E.J.; Van Tyne, C.J. Correlation of Yield Strength and Tensile Strength with Hardness for Steels. J. Mater. Eng. Perform. 2008, 17, 888–893. [Google Scholar] [CrossRef]
- Li, Y.; Baker, T.N. Effect of morphology of martensite-austenite phase on fracture of weld heat affected zone in vanadium and niobium microalloyed steels. Mater. Sci. Technol. 2010, 26, 1029–1040. [Google Scholar] [CrossRef]
- Mohseni, P.; Solberg, J.K.; Karlsen, M.; Akselsen, O.M.; Østby, E. Cleavage fracture initiation at M-A constituents in intercritically coarse-grained heat-affected zone of a HSLA steel. Metall. Mater. Trans. 2014, 45, 384–394. [Google Scholar] [CrossRef]
- Wang, X.L.; Wang, Z.Q.; Dong, L.L.; Shang, C.J.; Ma, X.P.; Subramanian, S.V. New insights into the mechanism of cooling rate on the impact toughness of coarse grained heat affected zone from the aspect of variant selection. Mater. Sci. Eng. A 2017, 704, 448–458. [Google Scholar] [CrossRef]
- Shim, D.H.; Lee, T.; Lee, J.; Lee, H.J.; Yoo, J.Y.; Lee, C.S. Increased resistance to hydrogen embrittlement in high-strength steels composed of granular bainite. Mater. Sci. Eng. A 2017, 700, 473–480. [Google Scholar] [CrossRef]
- Cao, R.; Li, J.; Liu, D.S.; Ma, J.Y.; Chen, J.H. Micromechanism of decrease of impact toughness in coarse-grain heat-affected zone of HSLA steel with increasing welding heat input. Metall. Mater. Trans. A 2015, 46, 2999–3014. [Google Scholar] [CrossRef]
- Wang, X.L.; Wang, X.M.; Shang, C.J.; Misra, R.D.K. Characterization of the multi-pass weld metal and the impact of retained austenite obtained through intercritical heat treatment on low temperature toughness. Mater. Sci. Eng. A 2016, 649, 282–292. [Google Scholar] [CrossRef]
- Fang, Z.; Li, A.Q.; Bao, H.Y. Calculation of stress intensity factor in two-dimensional cracks by strain energy density factor procedure. Sci. China Technol. Sci. 2018, 61, 542–550. [Google Scholar] [CrossRef]
- Mirzaee-Sisan, A.; Wub, G. Residual stress in pipeline girth welds-A review of recent data and modeling. Int. J. Press. Vessel. Pip. 2019, 169, 142–152. [Google Scholar] [CrossRef]


| Material | Yield Strength Rt0.5 (MPa) | Tensile Strength Rm (MPa) | YS (Rt0.5)/TS (Rm) | Elongation (%) |
|---|---|---|---|---|
| X80 | 605 | 700 | 0.86 | 20.5 |
| Parameters | Interpass Temperature (°C) | Arc Voltage (V) | Welding Current (A) | Welding Speed (cm/min) | Weld Heat Input (kJ/cm) |
|---|---|---|---|---|---|
| Root weld | 100 | 19–20 | 87–92 | 5.38 | 20.5 |
| Fill pass 1 (FP1) | 100 | 20 | 200–210 | 18.7 | 13.6 |
| Fill pass 2 (FP2) | 95 | 20 | 220–230 | 16.1 | 17.1 |
| Fill pass 3 (FP3) | 103 | 19 | 210–230 | 10.9 | 24.1 |
| Fill pass 4 (FP4) | 97 | 20 | 210–220 | 9.34 | 28.2 |
| Fill pass 5 (FP5) | 101 | 20 | 210–220 | 12.05 | 21.9 |
| Cap weld | 104 | 20 | 210–220 | 7.9 | 33.4 |
| Content | C | Si | Mn | P | S | Nb | Cr | Ni | Mo | Ti | Al |
|---|---|---|---|---|---|---|---|---|---|---|---|
| wt.% | 0.074 | 0.184 | 1.839 | 0.015 | 0.008 | 0.097 | 0.099 | 0.223 | 0.264 | 0.011 | 0.035 |
| Content | C | Si | Mn | P | S | Nb | Cr | Ni | Mo | Ti | Al |
|---|---|---|---|---|---|---|---|---|---|---|---|
| wt.% | 0.033 | 0.184 | 1.440 | 0.009 | 0.003 | 0.005 | 0.025 | 1.660 | 0.006 | 0.004 | 1.090 |
| Content | C | Si | Mn | P | S | Nb | Cr | Ni | Mo | Ti | Al |
|---|---|---|---|---|---|---|---|---|---|---|---|
| wt.% | 0.044 | 0.197 | 1.530 | 0.008 | 0.004 | 0.010 | 0.070 | 1.480 | 0.033 | 0.007 | 0.815 |
| Sample | JT-2 | JT-3 | JT-4 | JT-5 | JT-6 |
|---|---|---|---|---|---|
| Cycles | None | Single | Double | Triple | Quadruple |
| Welding thermal cycles process | None |  |  |  |  |
© 2019 by the authors. Licensee MDPI, Basel, Switzerland. This article is an open access article distributed under the terms and conditions of the Creative Commons Attribution (CC BY) license (http://creativecommons.org/licenses/by/4.0/).
Share and Cite
Bai, F.; Ding, H.; Tong, L.; Pan, L.; Wang, L. Microstructural Changes and Impact Toughness of Fill Pass in X80 Steel Weld Metal. Metals 2019, 9, 898. https://doi.org/10.3390/met9080898
Bai F, Ding H, Tong L, Pan L, Wang L. Microstructural Changes and Impact Toughness of Fill Pass in X80 Steel Weld Metal. Metals. 2019; 9(8):898. https://doi.org/10.3390/met9080898
Chicago/Turabian StyleBai, Fang, Hongsheng Ding, Lige Tong, Liqing Pan, and Li Wang. 2019. "Microstructural Changes and Impact Toughness of Fill Pass in X80 Steel Weld Metal" Metals 9, no. 8: 898. https://doi.org/10.3390/met9080898