Article

Al–Fe–Si–La Alloys for Current Collectors of Positive Electrodes in Lithium Ion Batteries

1
Institute of Electronic Materials and Technology, School of Materials Science and Engineering, Shanghai Jiao Tong University, Shanghai 200240, China
2
SJTU-Huafon Joint Lab, Huafon NLM Al Co., Ltd., Shanghai 201506, China
3
Lab of Aluminium Alloys, Shanghai Huafon Materials Technology Institute, Shanghai 201203, China
*
Author to whom correspondence should be addressed.
Metals 2020, 10(1), 109; https://doi.org/10.3390/met10010109
Submission received: 15 December 2019 / Revised: 29 December 2019 / Accepted: 4 January 2020 / Published: 10 January 2020
(This article belongs to the Special Issue Advances in Characterization of Heterogeneous Metals/Alloys)

Abstract

:
Al–xFe–Si–La alloys (x = 0.07, 0.2, 0.4 wt. %) were designed as current collectors of positive electrodes in lithium ion batteries, and the microstructure, tensile strength, electrical conductivity and corrosion resistance of the alloys were investigated with scanning electron microscopy (SEM) and energy dispersive spectroscopy (EDS), a tensile test, an electrical conductivity test, and an electrochemical test. It was found that the amount of Fe content greatly affected the quantity of the second phases in the alloys. The higher the Fe content was, the more the second phases were. With increase of the Fe content, the tensile strength and corrosion resistance of the Al–xFe–Si–La alloys were improved, and the electrical conductivity of the Al–xFe–Si–La alloys could meet the application requirements. Compared to the Al–0.07Fe–0.1Si–0.07La alloy, the strength of the Al–0.4Fe–0.1Si–0.07La alloy was greatly enhanced. The Al–0.4Fe–0.1Si–0.07La alloy also had a higher corrosion potential than that of the Al–0.07Fe–0.1Si–0.07La alloy.

1. Introduction

With the rapid development of new-energy vehicles and portable mobile devices, lithium ion batteries (LIBs) have developed as good choices for their power supply. As an important component of lithium-ion batteries, current collector materials for positive electrodes have aroused great interest. Traditional aluminum alloys cannot meet the requirements of current collector materials for positive electrodes in lithium-ion batteries because they do not have good comprehensive properties (high electrical conductivity, high strength, and high corrosion resistance) [1,2,3,4]. Al–Fe alloy foils are believed to have high tensile strength, high electrical conductivity and good corrosion resistance, all of which make these foils suitable to be the materials for the current collectors of positive electrodes in LIBs. However, coarse a Fe-rich phase deteriorates the comprehensive performance of Al–Fe alloys. The rare earth element La can refine the Fe-rich phase and decrease the bad effects of the coarse Fe-rich phases on the microstructure and comprehensive performance of Al–Fe alloys [5,6,7,8]. Additionally, studies have shown that the addition of 0.1 wt.% Si could result in a good grain refinement of Al–Fe–Cu–La alloys and could improve overall performance of Al–Fe–Cu–La alloys [9].
Thus far, few papers have reported on Al–Fe–Si–La alloys as current collectors of positive electrodes in LIBs. Therefore, in this paper, the effects of Fe content on the microstructure, tensile strength, electrical conductivity and corrosion resistance of Al–Fe–Si–La alloys are investigated.

2. Experimental Process

The experimental aluminum alloy foils were Al–0.07Fe–0.10Si–0.07La (wt.%), Al–0.2Fe–0.10Si–0.07La (wt.%) and Al–0.4Fe–0.10Si–0.07La (wt.%). All of the aluminum alloy foils were melted, homogenized, rolled into foils with a thickness of 0.07–0.08 mm, and then heated at 120 °C for 5 h in a drying box. The second phases of the aluminum alloy specimens were observed with a scanning electron microscope (SEM, NOVA NANOSEM 230, FEI, Hillsborough, OR, USA). SEM specimens were obtained through mechanical polishing and then etched with Keller reagent, which is composed of 95 mL of H2O, 2.5 mL of HNO3, 1.5 mL of HCl and 1.0 mL of HF. Tensile tests of specimens were carried out on a universal tensile machine (Zwick/Roell Z020, Ulm, Germany) at room temperature. The tensile tests were based on ASTM E8/E8M-13a (standard test methods for the tension testing of metallic materials, America), and the tensile speed was 1 mm/min. Four parallel experiments were conducted to ensure the accuracy of the tensile tests. The fracture morphology of the tensile specimens was observed via SEM. The electrical conductivity of the aluminum foil was measured with a German Hoffett FOERSTER portable conductivity tester (SIGMATEST 2.069).
The electrochemical tests of the Al–xFe–0.10Si–0.07La alloys were carried out on a CHI 660E station. Before testing, the specimens for the electrochemical tests were ultrasonically cleaned. Three parallel experiments were conducted to avoid errors of the electrochemical tests. All specimens used a 3.5% NaCl solution to conduct the electrochemical tests at room temperature with a three-electrode system. The testing range was from −1 to 0 V, and the scan rate was 1 mV/s. The working electrode, reference electrode and auxiliary electrode were the specimens, the saturated calomel and platinum electrode, respectively. All potentials were relative to the saturated calomel electrode. The corrosion surface morphology and corrosion cross-sectional morphology of the Al–xFe–0.10Si–0.07La alloys were observed, respectively, by SEM (VEGA 3, TESCAN, Brno, Czech Republic) and SEM (NOVA NANOSEM 230, FEI, Hillsborough, OR, USA).

3. Results and Discussion
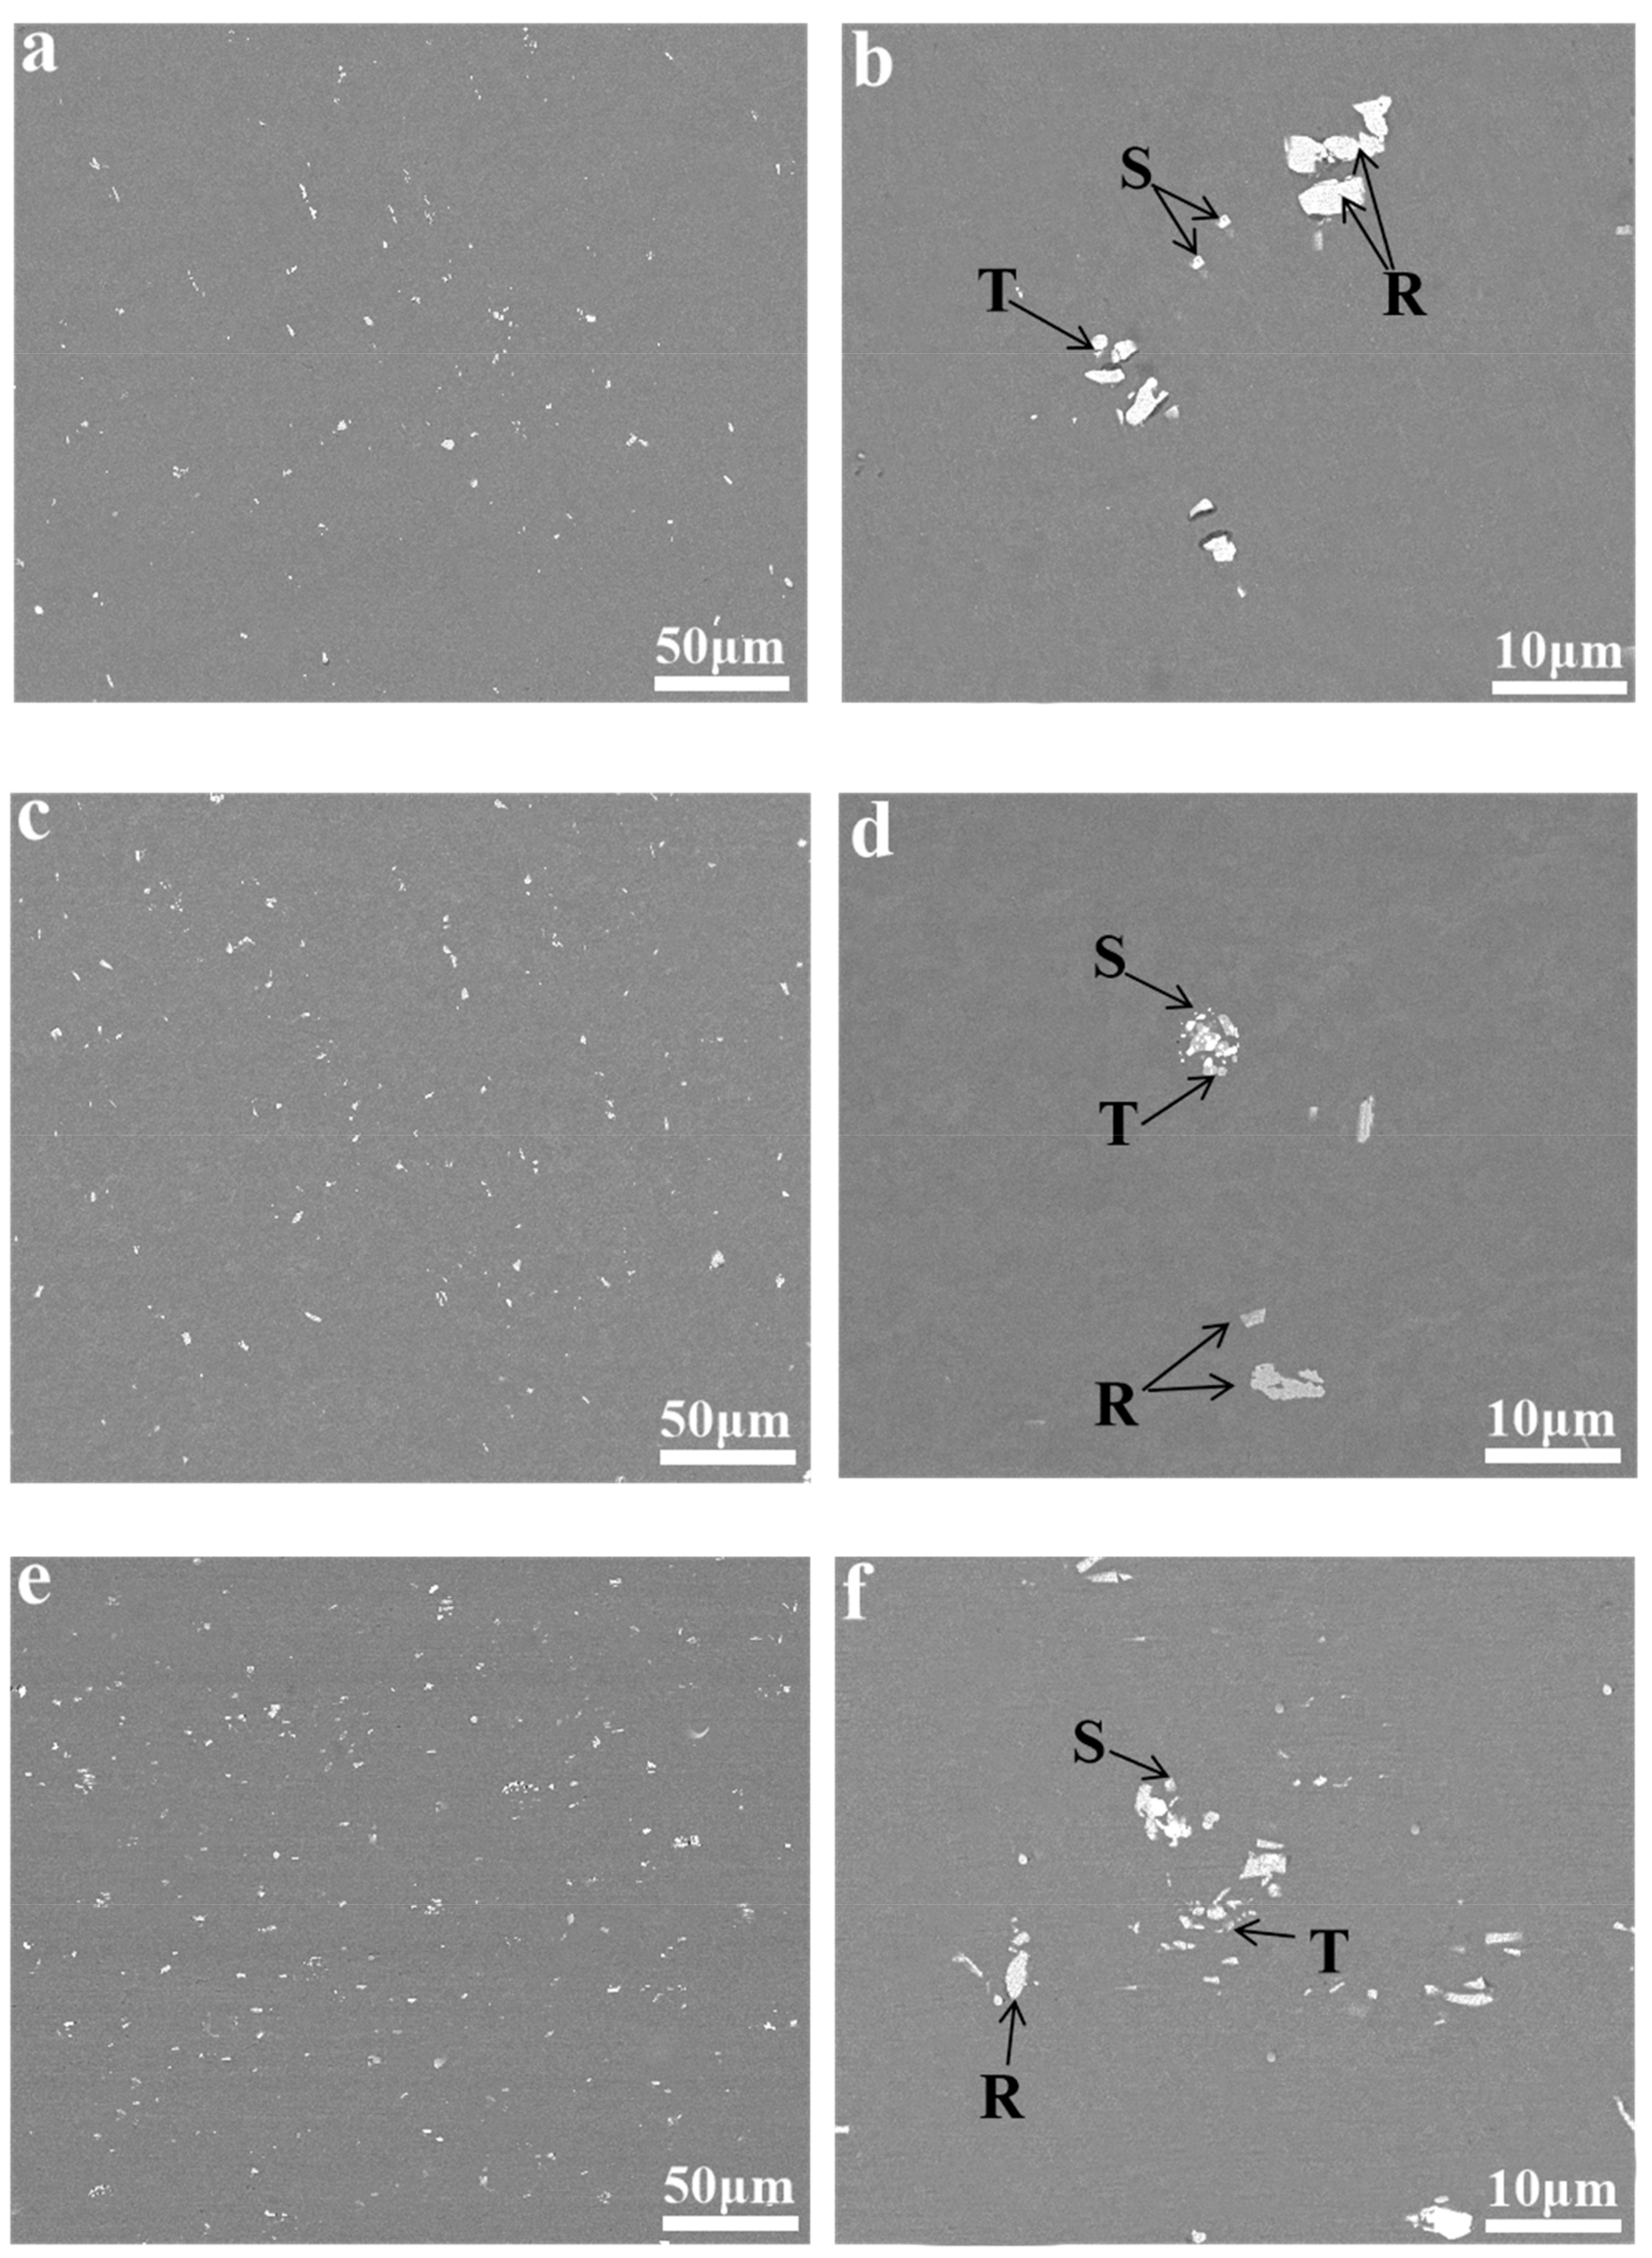
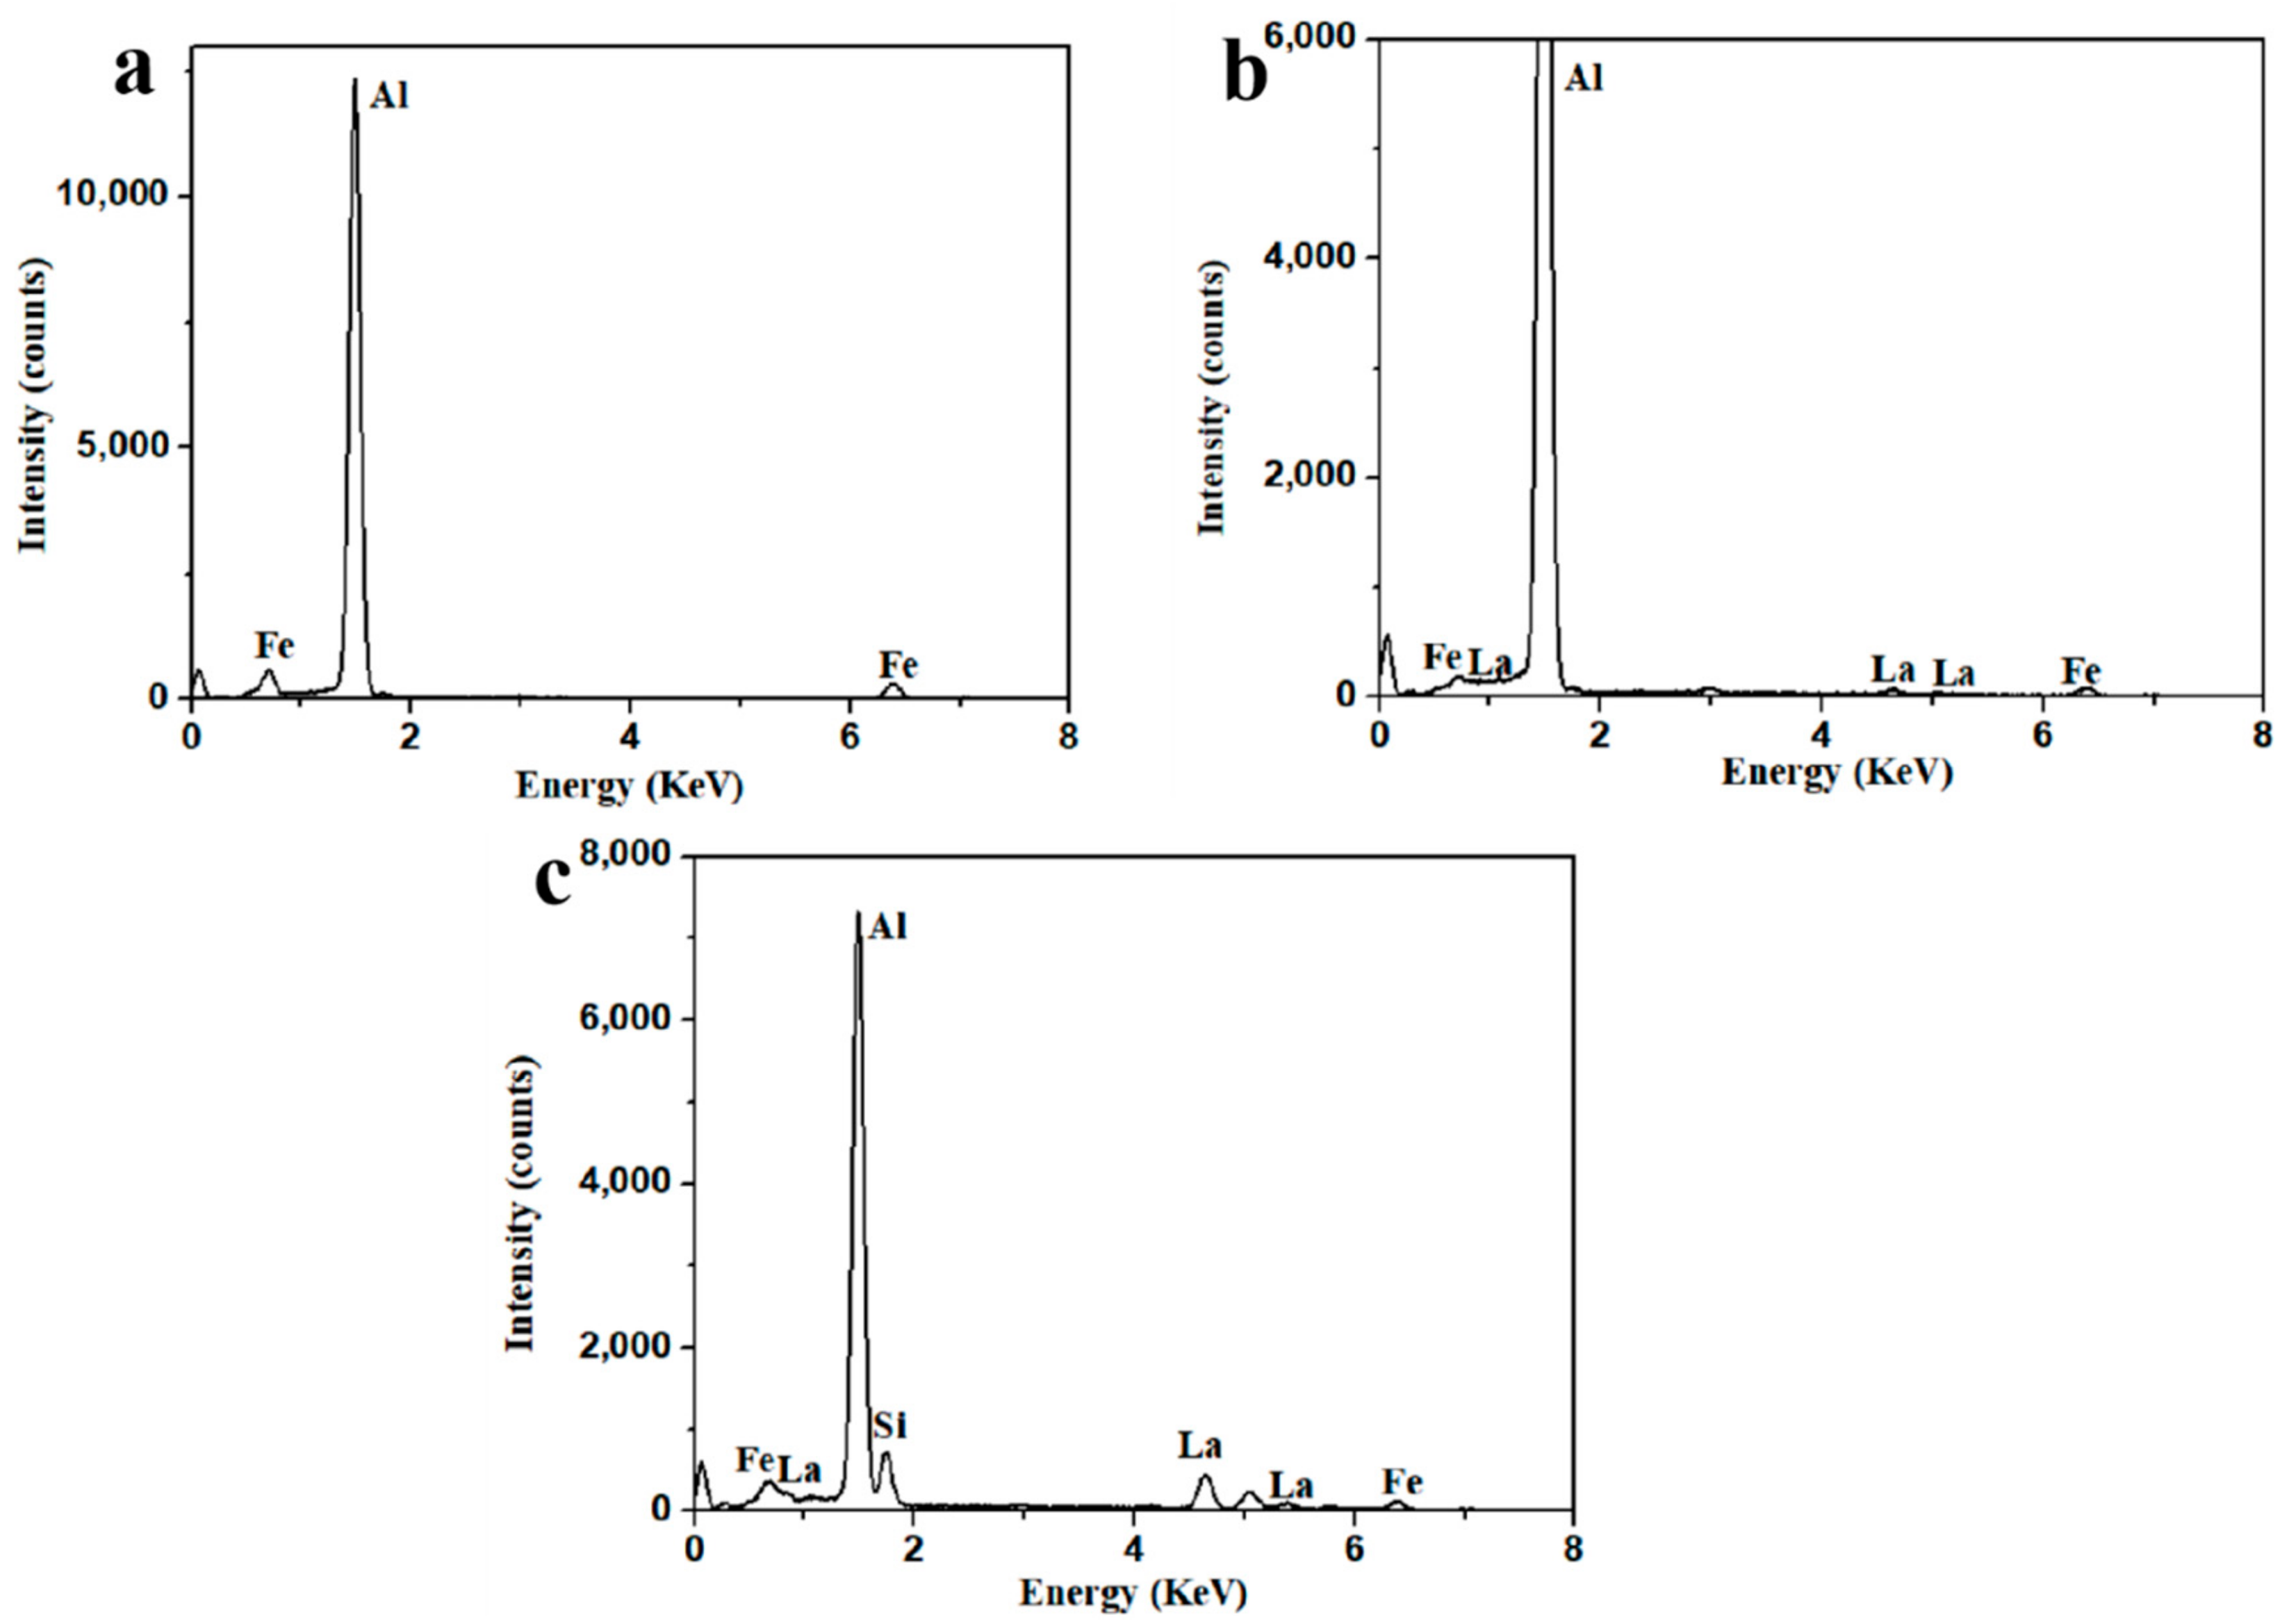
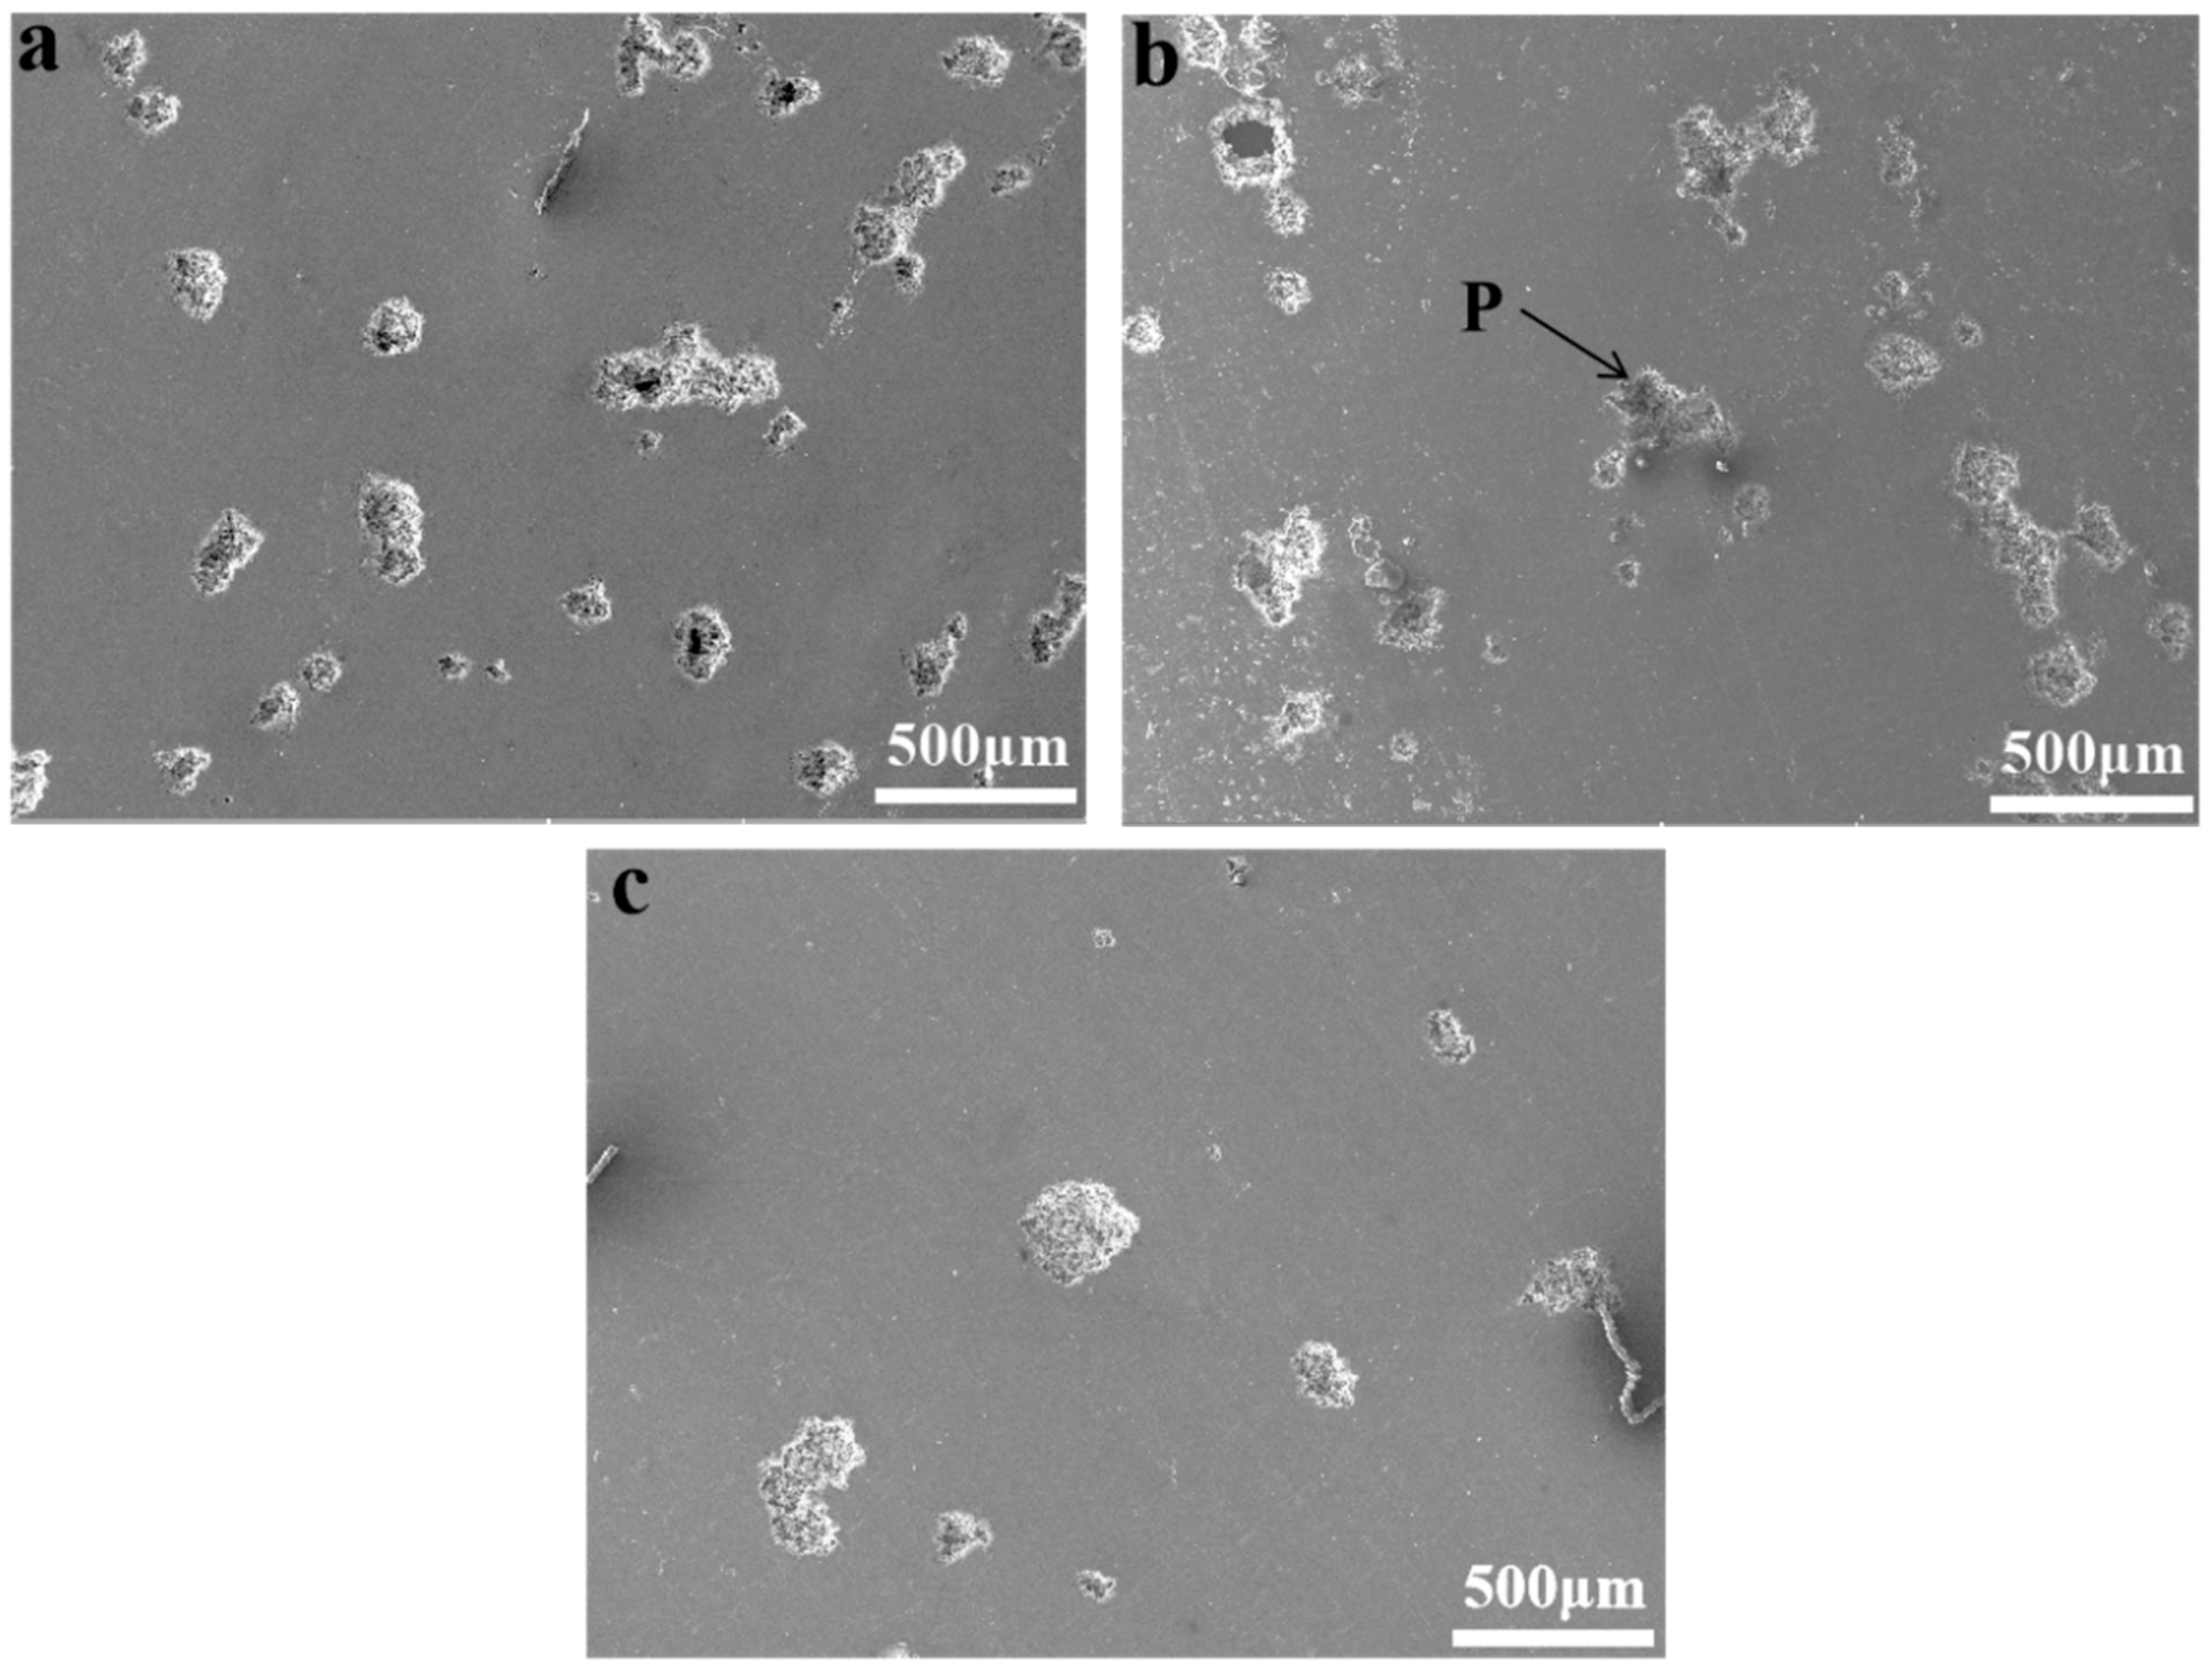
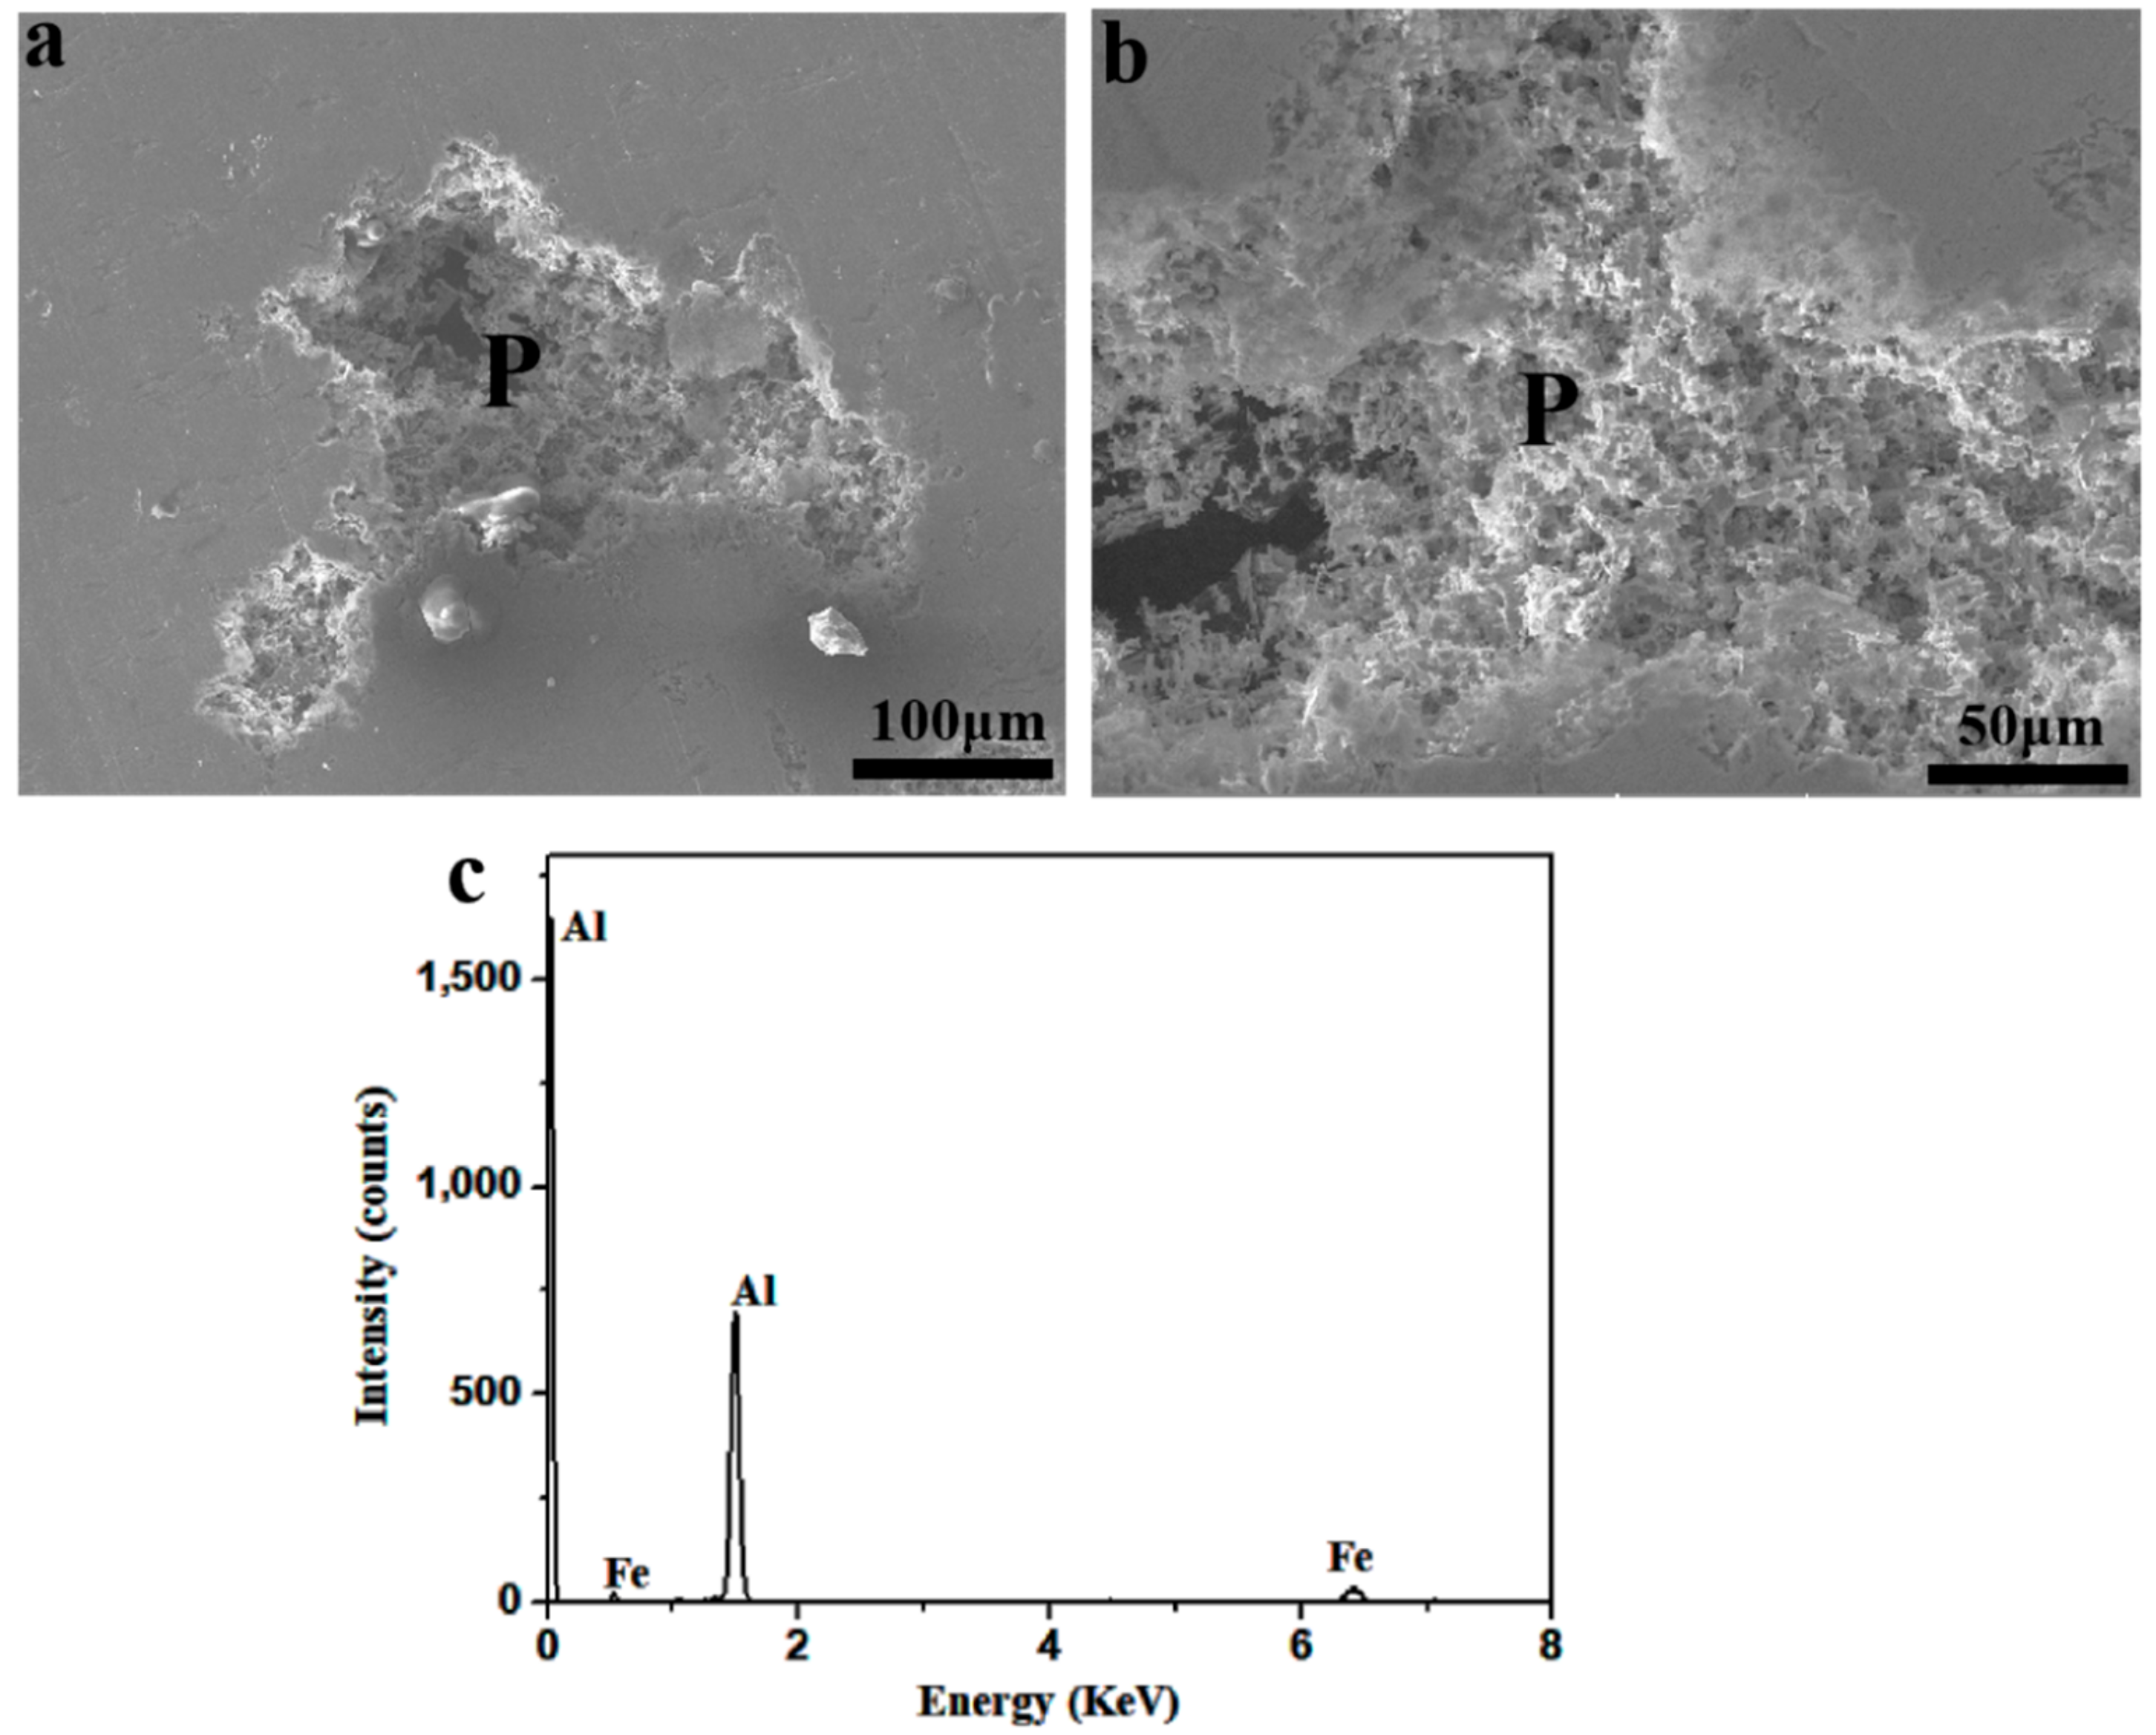
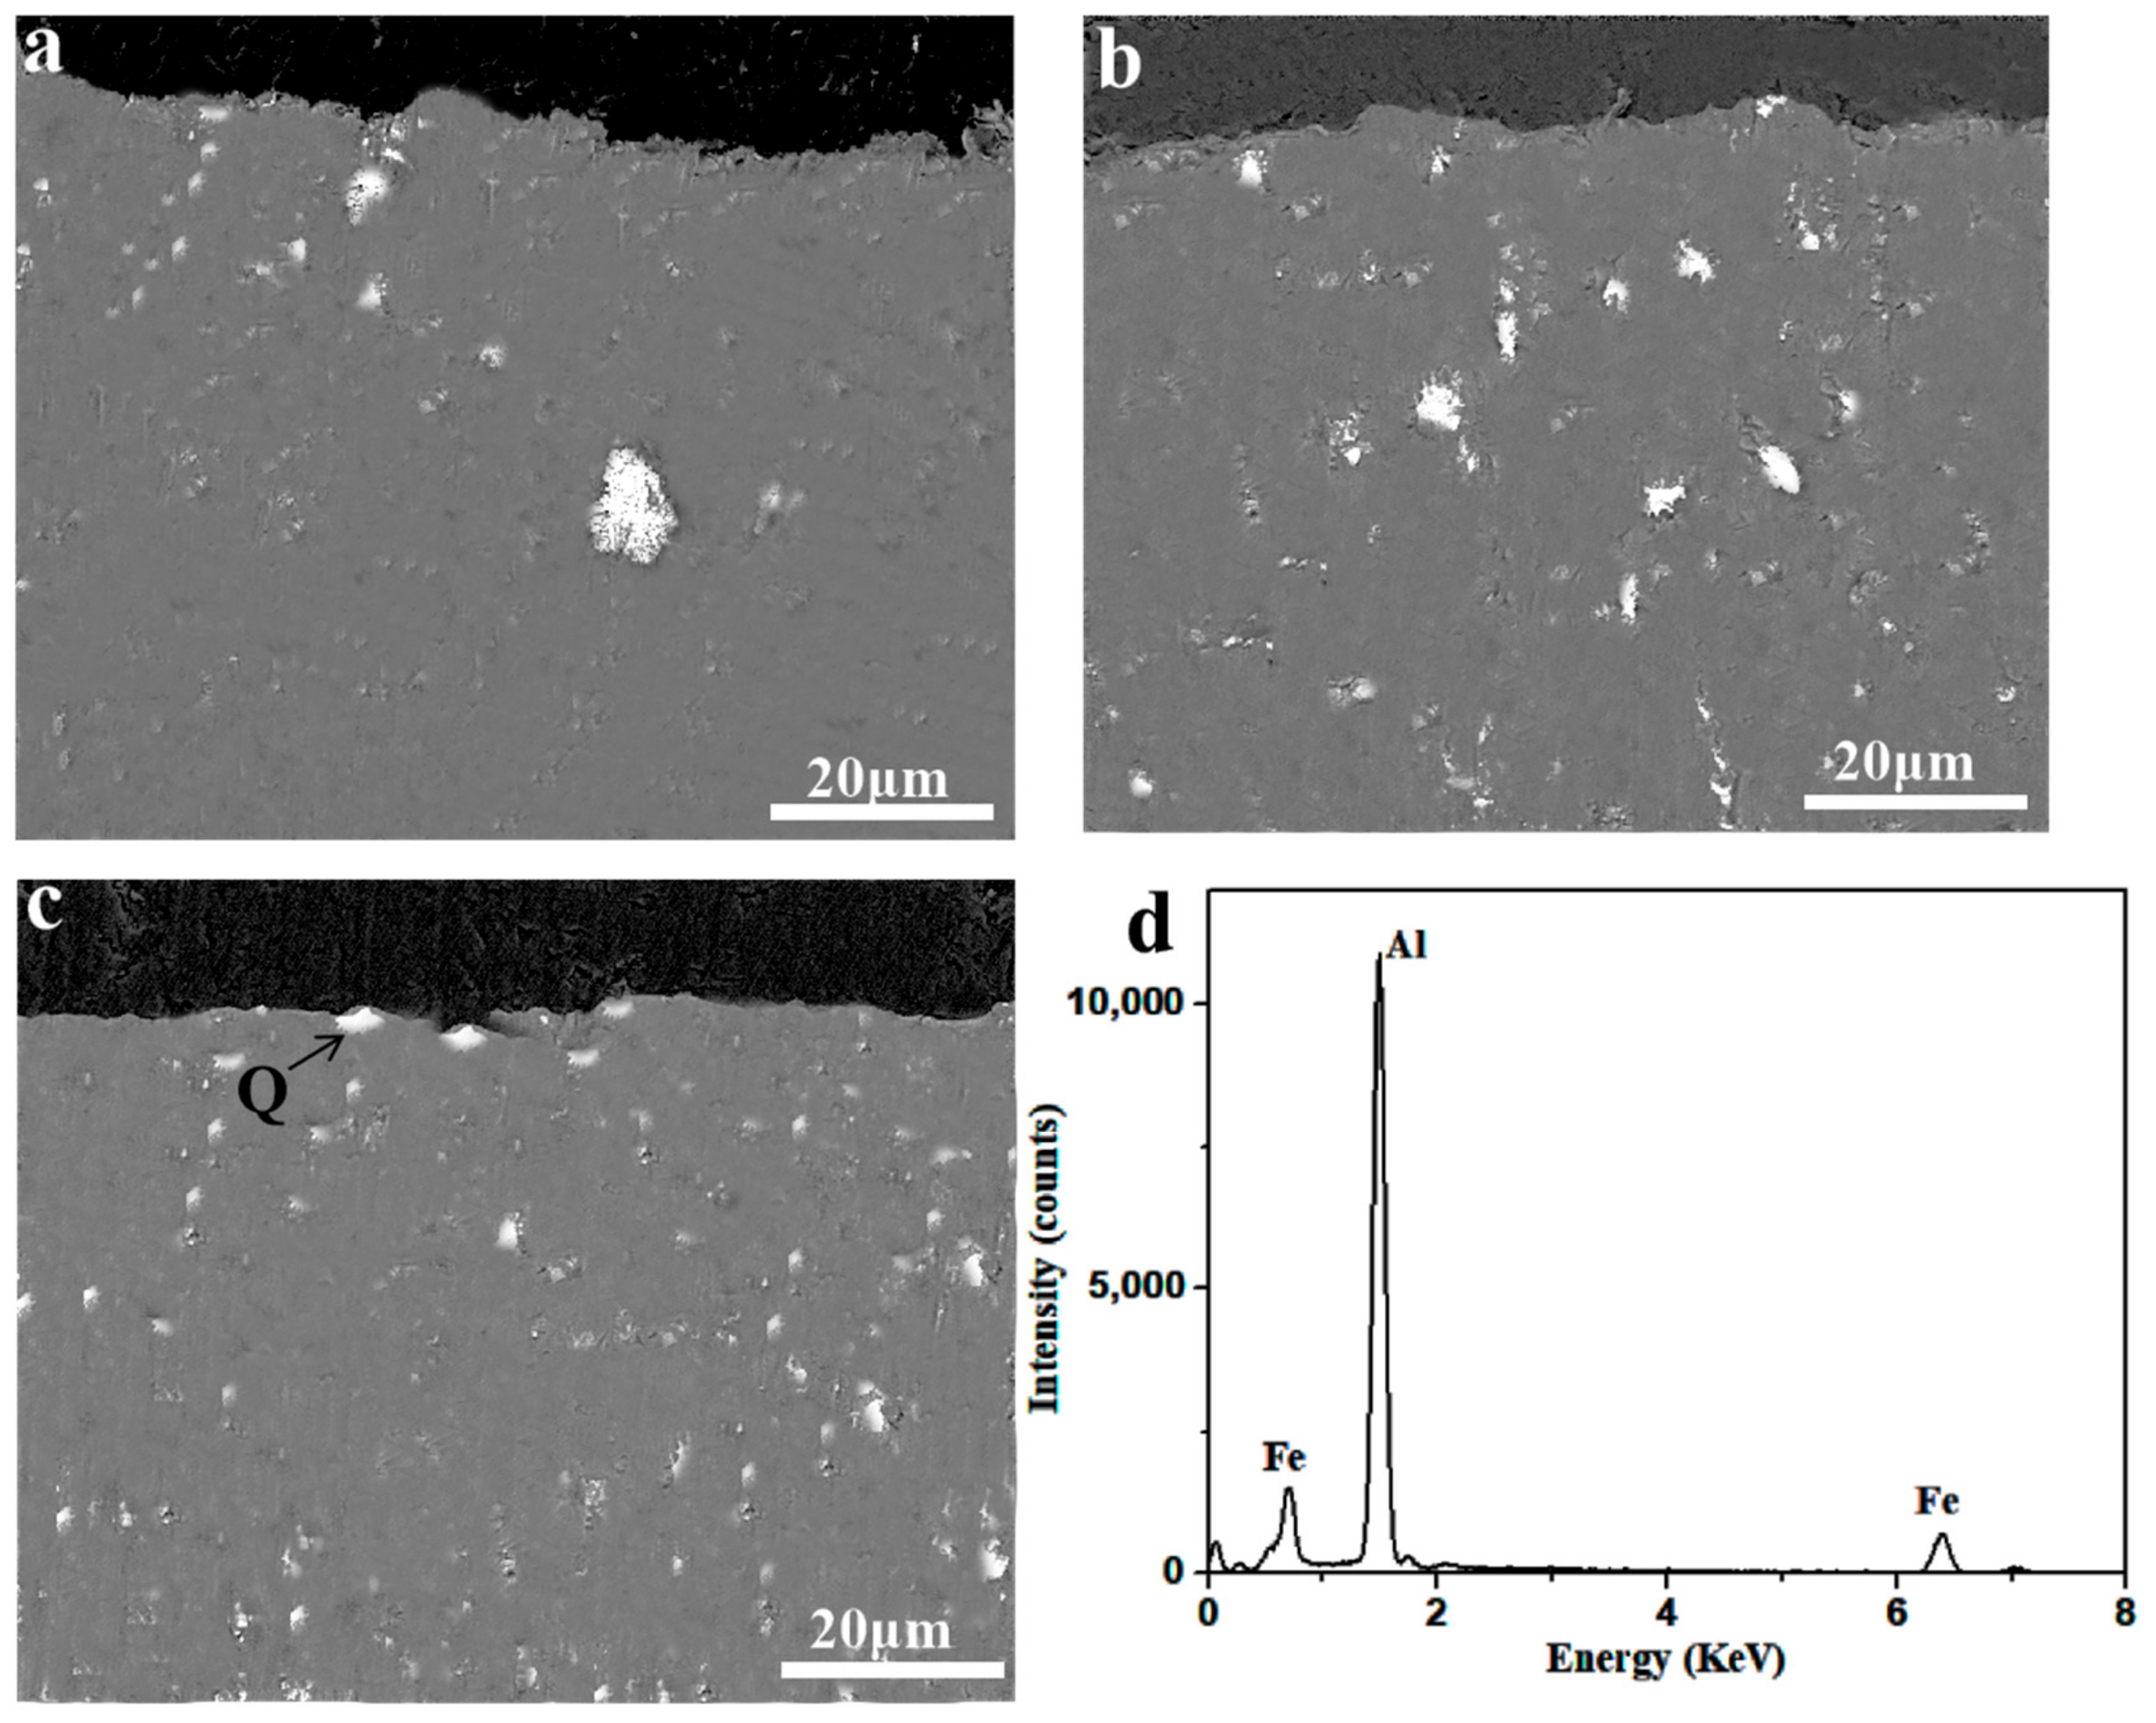
3.1. Microstructure

The microstructure of the Al–xFe–0.1Si–0.07La alloy foils that were annealed at 120 °C for 5 h is shown in Figure 1. It can be seen in Figure 1a,c,e that the second phases in the alloy became finer and the number of the second phases also greatly increased. This phenomenon indicated that the amount of Fe content greatly determined the quantity and the size of the second phases in the alloys. The higher the Fe content was, the finer the second phases were. The Al–0.07Fe–0.1Si–0.07La alloy had the least second phases, and the Al–0.4Fe–0.1Si–0.07La alloy had the most second phases. The finely dispersed second phases were evenly distributed in the Al–0.4Fe–0.1Si–0.07La alloy, which could not only improve the mechanical properties but also enhance the electrical conductivity and corrosion resistance of the Al–0.4Fe–0.1Si–0.07La [10,11,12,13]. From Figure 1b,d,f, it can be seen that all of the three alloys had a sharp coarse bulk phase (R), a fine spherical phase (S), and a clustered irregular phase (T). To obtain the composition of the R, S, and T phases in the Al–xFe–0.1Si–0.07La alloys, composition analyses were conducted on the R, S and T phases by energy dispersive spectroscopy (EDS). It was found that the coarse bulk phase (R) was the AlFe phase, the fine spherical phase (S) was the AlFeLa phase, and the clustered irregular phase (T) was the AlFeSiLa phase (Figure 2).
Obviously, the sizes of the AlFe(R), AlFeLa(S), and AlFeSiLa(T) phases became finer and the amounts of the AlFe(R), AlFeLa(S), and AlFeSiLa(T) phases became bigger as the Fe content increased. The sizes of the AlFe, AlFeLa and AlFeSiLa phases in the Al–0.4Fe–0.1Si–0.07La alloy were the smallest. La contributed to the refinement of these second phases. The rare earth element La was an effective modifier of the microstructure. It could transform the coarse Fe-rich phases into small, spherical, or short rod-like complex compounds. The mechanism of La modification was that La accumulated in front of the solid–liquid interface of the second phases and then entered the phases to form complex compounds such as AlFeSiLa, or it was adsorbed on the surface of the phases and hindered the growth of the impurity phase [14,15,16,17,18,19,20]. According to previous research [21], the modifying effects on the microstructure of 0.07 wt.% La becomes better when Fe content increases. Thus, it was easy to explain why the sizes of the second phases in the Al–0.4Fe–0.1Si–0.07La alloy were smallest.

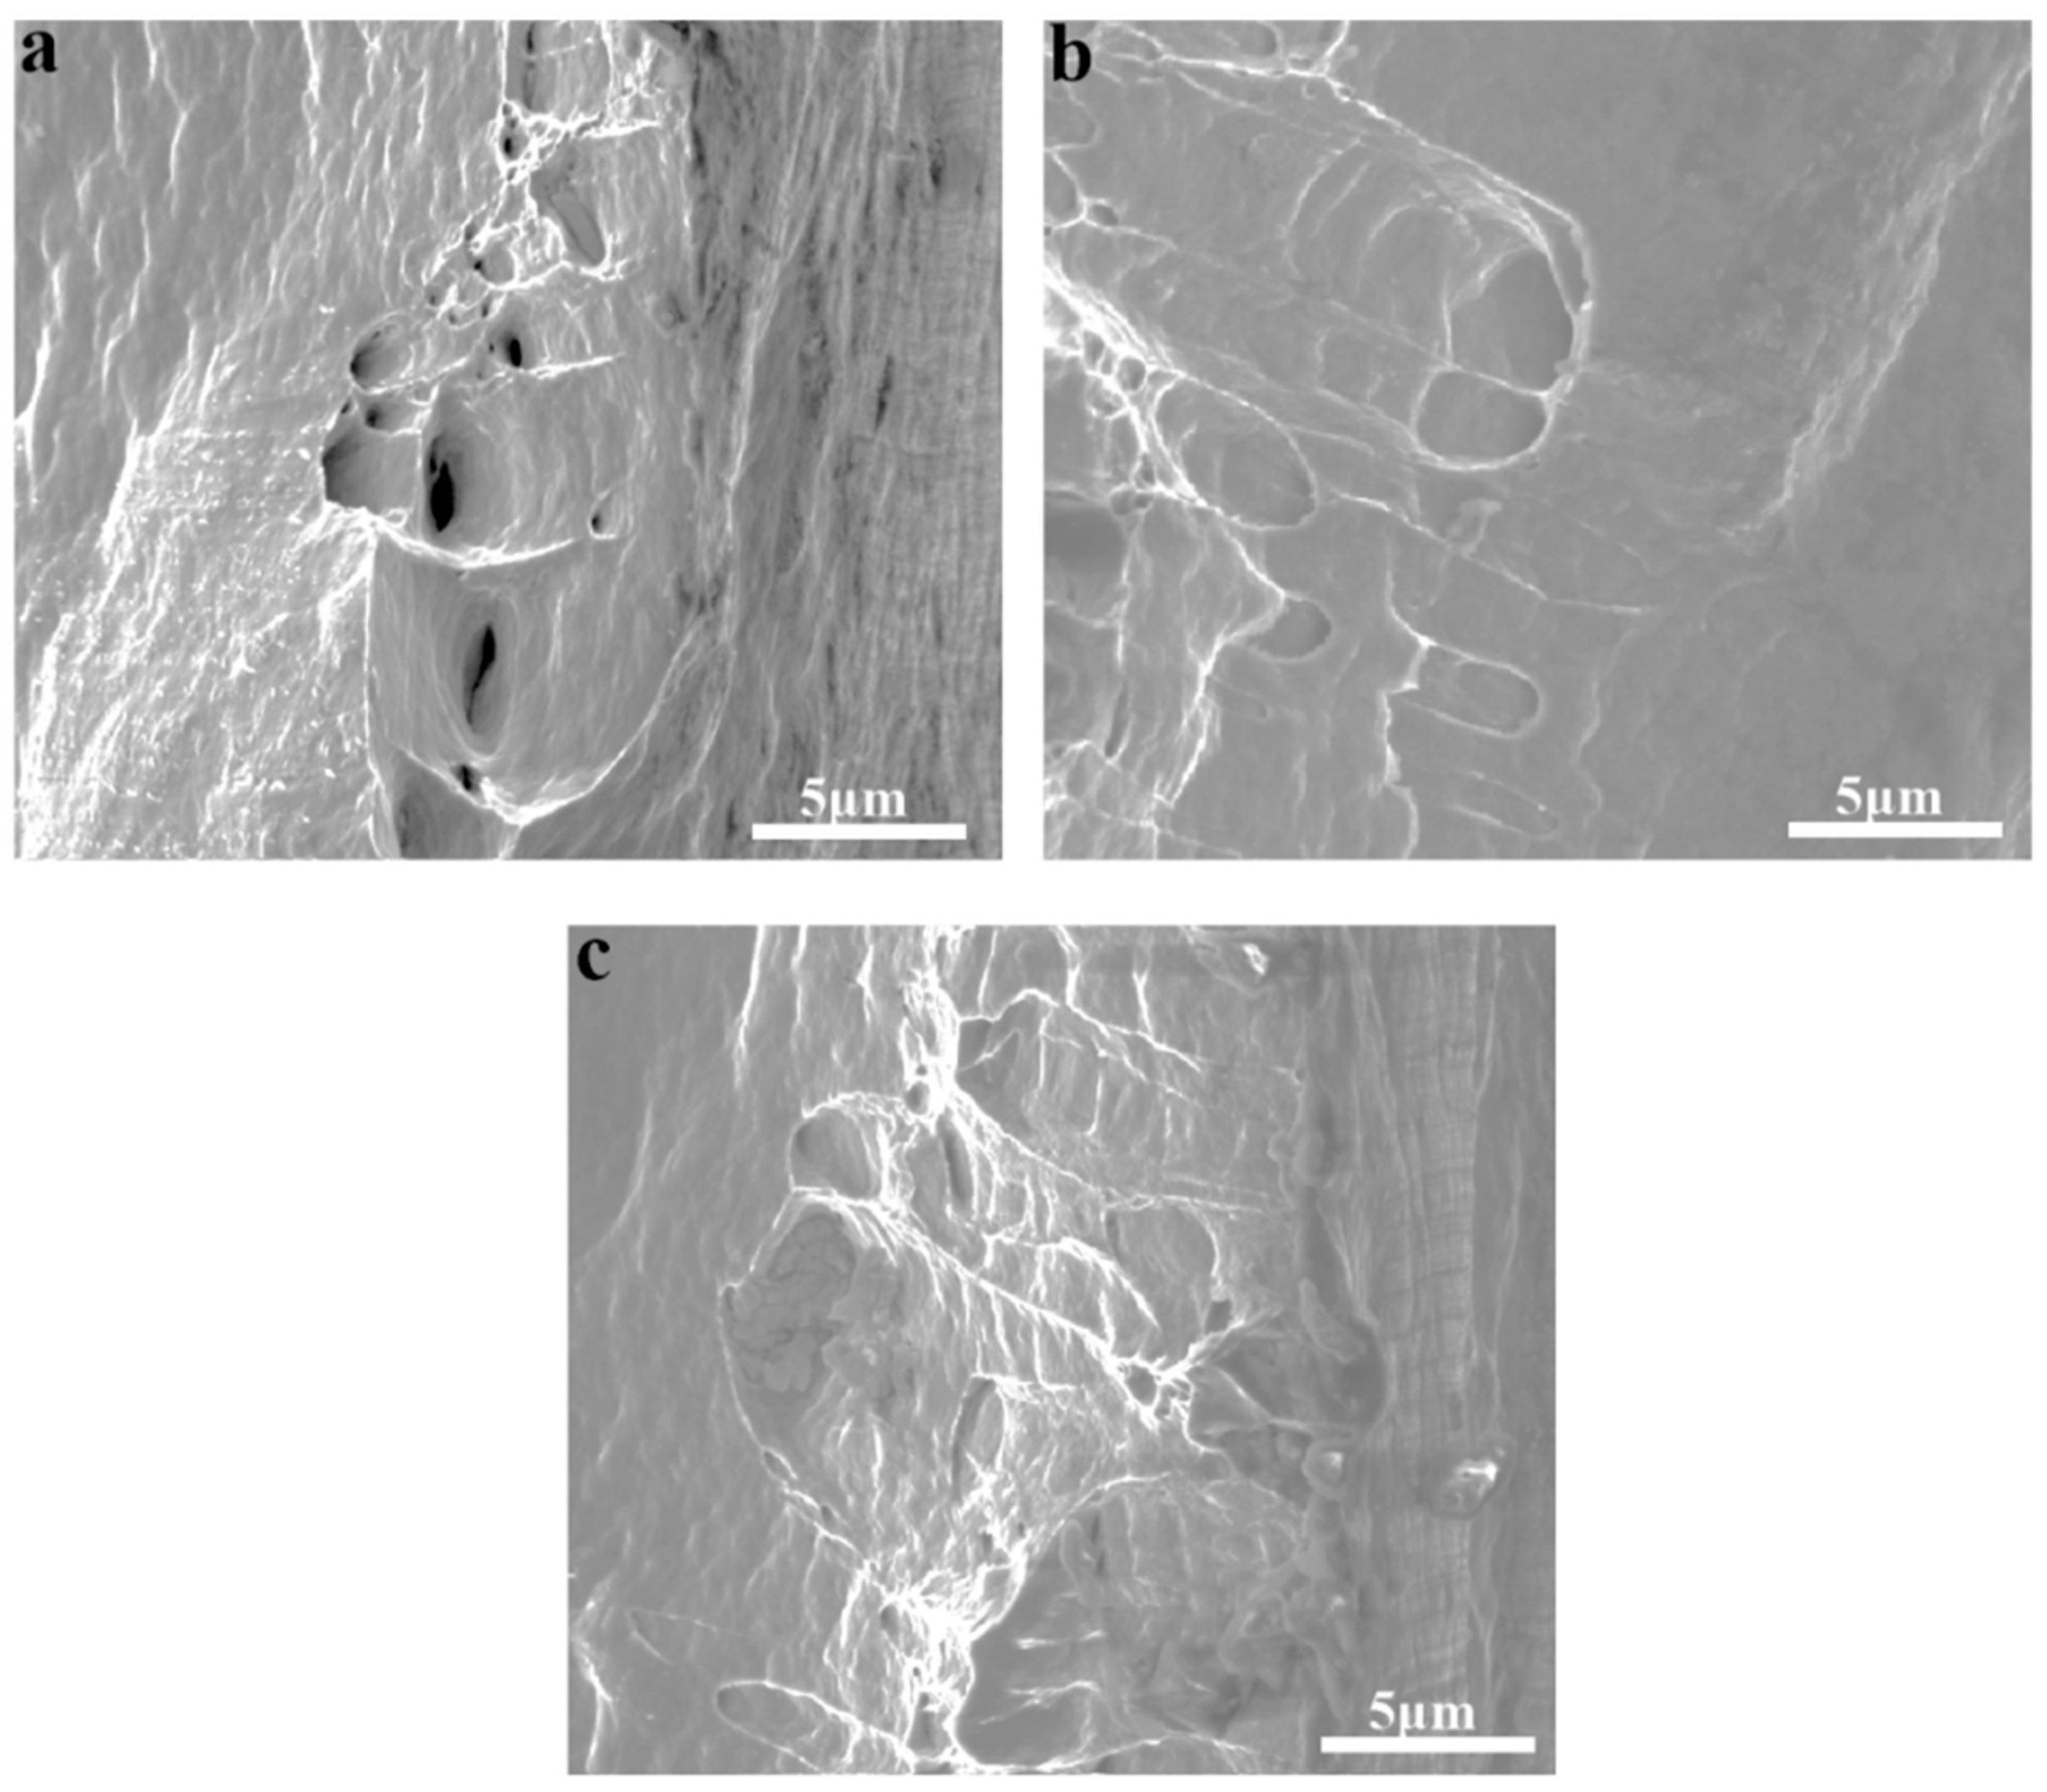
3.2. Tensile Properties

The strength of the Al–xFe–0.1Si–0.07La alloy that was annealed at 120 °C for 5 h is shown in Table 1. The strength of the Al–xFe–0.1Si–0.07La alloy increased, and the elongation decreased as the Fe content increased. Though the strength of the Al–0.2Fe–0.1Si–0.07La alloy was just slightly bigger than that of the Al–0.07Fe–0.1Si–0.07La alloy, the strength of the Al–0.4Fe–0.1Si–0.07La alloy increased more than that of the Al–0.2Fe–0.1Si–0.07La alloy. The total growth rates in yield strength and tensile strength from the Al–0.07Fe–0.1Si–0.07La alloy to the Al–0.4Fe–0.1Si–0.07La alloy were 21.39% and 21.03%, respectively.
To investigate the fracture mechanism of the Al–xFe–0.1Si–0.07La alloy foils in tensile tests, the fracture surfaces of the Al–xFe–0.1Si–0.07La alloy foils were studied by SEM, the results of which are shown in Figure 3. The Al–xFe–0.1Si–0.07La alloy foils all exhibited ductile fracture (Figure 3a,c,e), and they all had slip patterns and dimples on their fracture surfaces. Generally speaking, dimples usually occur in the positions of the second phases. According to the mechanism of the second phase-strengthened metals, the strength of the Al–xFe–0.1Si–0.07La alloy foils was controlled by the number of second phases. The tensile strength of the alloy was mainly attributed to the number of second phases in the alloy. In the three kinds of the Al–xFe–0.1Si–0.07La alloys, the most second phases occurred in the Al–0.4Fe–0.1Si–0.07La alloy and the least second phases occurred in the Al–0.07Fe–0.1Si–0.07La alloy, so there was no doubt that the strength of the Al–0.4Fe–0.1Si–0.07La alloy was the highest and the strength of the Al–0.07Fe–0.1Si–0.07La alloy was the lowest. The composition of the second phase in the dimple of the Al–xFe–0.1Si–0.07La alloy was analyzed by EDS, and it was confirmed to be an Fe-rich phase, which proved that the second phase in the alloy was mainly the Fe-rich phase.
When large plastic deformation occurred near the intermetallic compound, brittle fracture or debonding easily occurred around the intermetallic compound and played a role in crack initiation. Debonding could reduce the plasticity of the Al–xFe–0.1Si–0.07La alloys, especially when the number of the second phases in the Al–xFe–0.1Si–0.07La alloys was very high [22]. Therefore, it was not surprising that the elongation of the Al–xFe–0.1Si–0.07La alloy foils was poor when the Fe content was higher.

3.3. Electrical Conductivity

Table 2 shows the electrical conductivity test results of the three as-annealed alloy foils. The electrical conductivity of the Al–xFe–0.1Si–0.07La alloy slightly decreased with the increase of the Fe content, and all of them were higher than 55% IACS (International Annealed Copper Standard), a standard that could meet application requirements. According to previous studies, excessive second phases may enhance the pinning effect of the second phases and lead to some side effects, such as the deterioration of electrical conductivity. However, the Fe content here was in the range of less than 0.4wt%, and the second phases of the three alloys were fine that the electrical conductivity was only slightly decreased but not deteriorated when the Fe content became higher [23,24,25,26,27,28,29].

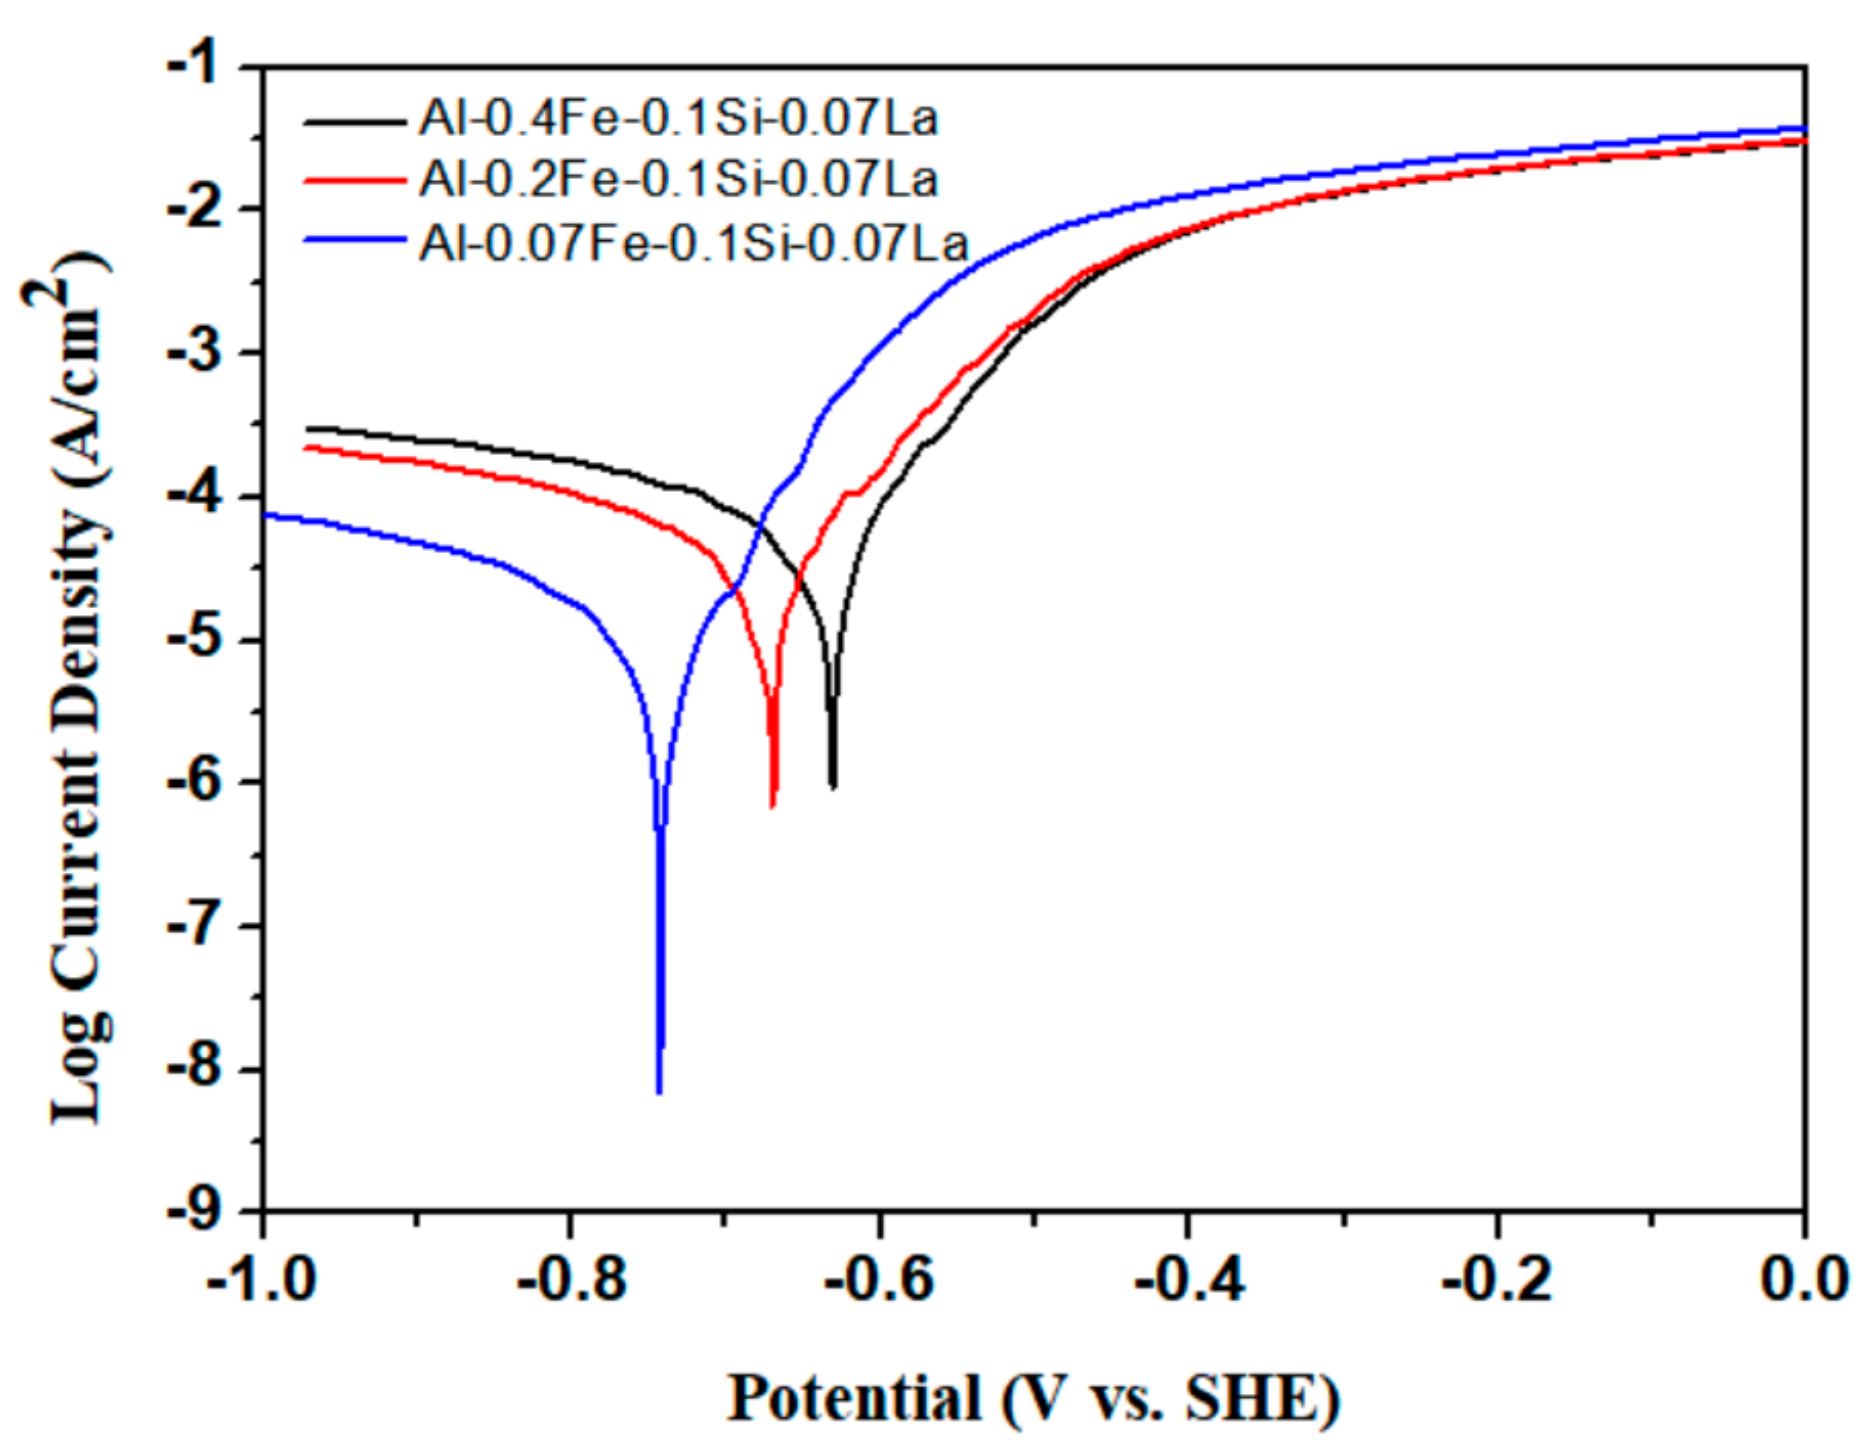
3.4. Electrochemical Performance

Typical Tafel curves of the Al–xFe–0.1Si–0.07La alloys are exhibited in Figure 4. Table 3 shows the results obtained through the Tafel curves. Ecorr is the corrosion potential, which demonstrates the difficulty to be corroded, and Icorr is the corrosion current density, which demonstrates the corrosion speed. The Tafel curves of the Al–xFe–0.1Si–0.07La alloys were typical Tafel curves of aluminum alloys (Figure 4). The higher the Ecorr was, the more difficult the alloy was to corrode [30]. The testing results shown in Table 3 indicate that the Ecorr of the Al–xFe–0.1Si–0.07La alloy became more positive as the Fe content increased, which indicates that the Al–xFe–0.1Si–0.07La alloy was more difficult to corrode. Additionally, the Al–0.4Fe–0.1Si–0.07La alloy had the highest Ecorr, so its corrosion resistance was the best. However, the larger the Fe content was, the larger the Icorr was. Thus, the content of the Fe element that is added to Al–xFe–0.1Si–0.07La alloys should not be too excessive.
The corrosion surface of the Al–xFe–0.1Si–0.07La specimens tested in the Tafel tests are shown in Figure 5. According to Figure 5a–c, the Al–xFe–0.1Si–0.07La alloys all exhibited pitting corrosion. However, there were big differences in the number of corrosion pits on the corrosion surfaces of the Al–xFe–0.1Si–0.07La alloys. The number of corrosion pits can characterize the degree of corrosion in an alloy. The alloy sequence, sorted by the number of corrosion pits, was as follows (from big to small): Al–0.07Fe–0.1Si–0.07La, Al–0.2Fe–0.1Si–0.07La, and Al–0.4Fe–0.1Si–0.07La. Thus, the corrosion indeed became more severe as Fe content increased; this finding agrees with the conclusions of the Tafel curves. EDS was conducted to analyze the phase composition in the corrosion pit P of the Al–0.2Fe–0.1Si–0.07La alloy (Figure 6). The main phase in the corrosion pit P was found to be the Fe-rich phase, which indicated the corrosion source was the Fe-rich phase.
Cross-sections of the Al–xFe–0.1Si–0.07La alloy foils corroded in 3.5% NaCl solution are shown in Figure 7. EDS analyses were conducted at the corrosion pits with white phases, and it was found that these white phases were AlFe phases. The corrosion source of the Al–xFe–0.1Si–0.07La alloy foil was confirmed to be the Fe-rich phase again. The number of the white phases in the Al–xFe–0.1Si–0.07La alloys became bigger and the sizes of the white phases in Al–xFe–0.1Si–0.07La alloy became smaller, as seen in Figure 7a–c, which was consistent with the phenomena of Figure 1.
Generally, the finer the second phases were, the higher the corrosion resistance of alloys was, which was actually caused by the corrosion characteristics of intermetallic aluminum alloys [31,32,33]. In the corrosion process, the Fe-rich phase particles acted as cathodes, and the Al matrixes around the Fe-rich phase particles acted as anodes. However, it was not the number of the second phases that affected the corrosion process—it was the size and shape of the second phases. The size and shape of intermetallic compounds affects the local dissolution rate of Al matrixes in the later stage of corrosion hole formation, and the dissolution rate of Al matrixes near small or spherical Fe-rich phase particles is slower than that in other regions. In these experiments, the size of second phases became smaller, although the number of second phases increased. Based on the corrosion process above, the finer second phases were more beneficial corrosion resistance of the Al–xFe–0.1Si–0.07La alloys, which explained the better corrosion resistance of the Al–0.4Fe–0.1Si–0.07La alloy [13,34].

4. Conclusions

The effects of Fe content on the microstructure, strength, electrical conductivity and corrosion resistance of Al–xFe–0.1Si–0.07La (x = 0.07, 0.2, 0.4 wt. %) alloy foils were investigated. The strength and corrosion resistance of the Al–xFe–0.1Si–0.07La alloy foil were enhanced, and the electrical conductivity could meet application requirements as the Fe content increased. In particular, the strength and corrosion potential of the Al–0.4Fe–0.1Si–0.07La alloy were much higher than those of the other two alloys. The fine second phases in the Al–0.4Fe–0.1Si–0.07La alloy contributed to the enhancement of the microstructure and comprehensive performance of the Al–0.4Fe–0.1Si–0.07La alloy in this paper.

Author Contributions

Conceptualization, D.D.; formal analysis, W.Z., Y.G., G.C., Y.H., J.T.; investigation, Y.X., Z.W., and R.C.; writing—original draft preparation, X.Y.; writing—review and editing, X.Y. and D.D.; project administration, D.D. All authors have read and agreed to the published version of the manuscript.

Funding

This work was supported by Shanghai Excellent Technical Leader Project (No. 15XD1524600).

Acknowledgments

The authors would like to thank the Instrumental Analysis Center of Shanghai Jiao Tong University for SEM experiments.

Conflicts of Interest

The authors declare no conflict of interest.

References

  1. Manthiram, A. Materials challenges and opportunities of lithium ion batteries. J. Phys. Chem. Lett. 2011, 2, 176–184. [Google Scholar] [CrossRef]
  2. Iwakura, C.; Fukumoto, Y.; Inoue, H.; Ohashi, S.; Kobayashi, S.; Tada, H.; Abe, M. Electrochemical characterization of various metal foils as a current collector of positive electrode for rechargeable lithium batteries. J. Power Sources 1997, 68, 301–303. [Google Scholar] [CrossRef]
  3. Whitehead, A.H.; Schreiber, M. Current collectors for positive electrodes of lithium-based batteries. J. Electrochem. Soc. 2006, 152, A2105. [Google Scholar] [CrossRef]
  4. Church, B.C.; Kaminski, D.T.; Jiang, J. Corrosion of aluminum electrodes in aqueous slurries for lithium-ion batteries. J. Mater. Sci. 2014, 49, 3234–3241. [Google Scholar] [CrossRef]
  5. Raghavan, V. Al-Fe-La (Aluminum-Iron-Lanthanum). J. Phase Equilib. 2001, 22, 566–567. [Google Scholar] [CrossRef]
  6. Li, G.; Bian, X.; Song, K.; Guo, J.; Li, X.; Wang, C. Effect of Si addition on glass forming ability and thermal stability of Al–Fe–La alloys. J. Alloys Compd. 2009, 471, L47–L50. [Google Scholar] [CrossRef]
  7. Liang, Y.H.; Shi, Z.M.; Li, G.W.; Zhang, R.Y.; Zhao, G. Effects of Er addition on the crystallization characteristic and microstructure of Al-2wt. %Fe cast alloy. J. Alloys Compd. 2019, 781, 235–244. [Google Scholar] [CrossRef]
  8. Lai, X.F.; Peng, H.P.; Wang, J.H.; Wu, C.J.; Tu, H.; Liu, Y.; Su, X.P. Effect of La on intermetallic layer of galvalume. Surf. Eng. 2013, 29, 390–395. [Google Scholar] [CrossRef]
  9. Xu, Y.W.; Ding, D.Y.; Yang, X.; Zhang, W.L.; Gao, Y.J.; Wu, Z.L.; Chen, G.Z.; Chen, R.Z.; Huang, Y.W.; Tang, J.S. Effect of Si addition on mechanical and electrochemical properties of Al-Fe-Cu-La alloy for current collector of lithium battery. Metals 2019, 9, 1072. [Google Scholar] [CrossRef] [Green Version]
  10. Sherby, O.D.; Taleff, E.M. Influence of grain size, solute atoms and second-phase particles on creep behavior of polycrystalline solids. Mater. Sci. Eng. A 2002, 322, 89–99. [Google Scholar] [CrossRef]
  11. Yamanaka, A.; Okamoto, M. Grain growth in a system containing finely dispersed mobile second-phase particles: A GPU-accelerated multi-phase-field study. In Proceedings of the 6th International Conference on Recrystallization and Grain Growth (ReX&GG 2016), Pittsburgh, PA, USA, 17–21 July 2016; pp. 29–34. [Google Scholar]
  12. Brunner, J.G.; Birbilis, N.; Ralston, K.D.; Virtanen, S. Impact of ultrafine-grained microstructure on the corrosion of aluminium alloy AA2024. Corros. Sci. 2012, 57, 209–214. [Google Scholar] [CrossRef]
  13. Ralston, K.D.; Fabijanic, D.; Birbilis, N. Effect of grain size on corrosion of high purity aluminium. In Proceedings of the Electrochimica Acta, Columbus, OH, USA, 15 January 2011; Volume 56, pp. 1729–1736. [Google Scholar]
  14. Mi, G.F.; Dong, C.F.; Zhao, D.W. Effect of different cooling speed and rare earth La on the microstructures and phase constitution of Al-Fe alloy. Appl. Mech. Mater. 2010, 44–47, 2126–2130. [Google Scholar] [CrossRef]
  15. Zhu, M.; Jian, Z.; Yao, L.; Liu, C.; Yang, G.; Zhou, Y. Effect of mischmetal modification treatment on the microstructure, tensile properties, and fracture behavior of Al-7.0%Si-0.3%Mg foundry aluminum alloys. J. Mater. Sci. 2011, 46, 2685–2694. [Google Scholar] [CrossRef]
  16. Chang, J.; Moon, I.; Choi, C. Refinement of cast microstructure of hypereutectic Al-Si alloys through the addition of rare earth metals. J. Mater. Sci. 1998, 33, 5015–5023. [Google Scholar] [CrossRef]
  17. Chang, J.Y.; Kim, G.H.; Moon, I.G. Rare earth concentration in the primary Si crystal in rare earth added Al-21 wt. % Si alloy. Scr. Mater. 1998, 39. [Google Scholar] [CrossRef]
  18. Huang, X.; Yan, H. Effect of trace La addition on the microstructure and mechanical property of as-cast ADC12 Al-Alloy. J. Wuhan Univ. Technol. Mater. Sci. Ed. 2013, 28, 202–205. [Google Scholar] [CrossRef]
  19. Yao, D.; Xia, Y.; Qiu, F. Effects of La addition on the elevated temperature properties of the casting Al–Cu alloy. Mater. Sci. Eng. A 2011, 528, 1463–1466. [Google Scholar] [CrossRef]
  20. Yao, D.; Zhao, W.; Zhao, H. High creep resistance behavior of the casting Al–Cu alloy modified by La. Scr. Mater. 2009, 61, 1153–1155. [Google Scholar] [CrossRef]
  21. Yang, X.; Ding, D.; Xu, Y. Tensile properties and corrosion resistance of Al-xFe-La alloys for aluminum current collector of lithium-Ion batteries. Metals 2019, 9, 706. [Google Scholar] [CrossRef] [Green Version]
  22. Zhang, J.C.; Ding, D.Y.; Xu, X.L.; Gao, Y.J.; Chen, G.Z.; Chen, W.G.; You, X.H.; Huang, Y.W.; Tang, J.S. Effect of Ce addition on the mechanical and electrochemical properties of a lithium battery shell alloy. J. Alloys Compd. 2014, 617, 665–669. [Google Scholar] [CrossRef]
  23. Miyake, J.; Fine, M.E. Electrical conductivity versus strength in a precipitation hardened alloy. Acta Metall. Mater. 1992, 40, 733–741. [Google Scholar] [CrossRef]
  24. Kino, T.; Endo, T.; Kawata, S. Deviations from matthiessen’s rule of the electrical resistivity of dislocations in aluminum. J. Phys. Soc. Jpn. 1974, 36, 698–705. [Google Scholar] [CrossRef]
  25. Han, K.; Walsh, R.P.; Ishmaku, A.; Toplosky, V.; Brandao, L.; Embury, J.D. High strength and high electrical conductivity bulk Cu. Philos. Mag. 2004, 84, 3705–3716. [Google Scholar] [CrossRef]
  26. Valiev, R.Z.; Murashkin, M.Y.; Sabirov, I. A nanostructural design to produce high-strength Al alloys with enhanced electrical conductivity. Scr. Mater. 2014, 76, 13–16. [Google Scholar] [CrossRef]
  27. Sauvage, X.; Bobruk, E.V.; Murashkin, M.Y.; Nasedkina, Y.N.; Enikeev, A.R.; Valiev, Z. Optimization of electrical conductivity and strength combination by structure design at the nanoscale in Al-Mg-Si alloys. Acta Mater. 2015, 98, 355–366. [Google Scholar] [CrossRef]
  28. Hou, J.P.; Wang, Q.; Zhang, Z.J.; Tian, Y.Z.; Wu, X.M.; Yang, H.J.; Li, X.W.; Zhang, Z.F. Nano-scale precipitates: The key to high strength and high conductivity in Al alloy wire. Mater. Des. 2017, 132, 148–157. [Google Scholar] [CrossRef]
  29. Hou, J.P.; Wang, Q.; Zhang, Z.J.; Tian, Y.Z.; Wu, X.M.; Yang, H.J.; Li, X.W.; Zhang, Z.F. Breaking the trade-off relation of strength and electrical conductivity in pure Al wire by controlling texture and grain boundary. J. Alloys Compd. 2018, 769, 96–109. [Google Scholar] [CrossRef]
  30. Zhang, R.; Ding, D.Y.; Zhang, W.L.; Gao, Y.J.; Wu, Z.L.; Chen, G.Z.; Chen, R.Z.; Huang, Y.W.; Tang, J.S. Al-1.5Fe-xLa alloys for lithium-ion battery package. Metals 2018, 8, 890. [Google Scholar] [CrossRef] [Green Version]
  31. Seri, O.; Furumata, K. Effect of Al-Fe-Si intermetallic compound phases on initiation and propagation of pitting attacks for aluminum 1100. Mater. Corros. 2002, 53, 111–120. [Google Scholar] [CrossRef]
  32. Park, J.O. Influence of Fe-Rich Intermetallic inclusions on pit initiation on aluminum alloys in aerated NaCl. J. Electrochem. Soc. 1999, 146, 517. [Google Scholar] [CrossRef]
  33. Nişancioğlu, K. Electrochemical behavior of aluminum-base intermetallics containing iron. J. Electrochem. Soc. 2006, 137, 69. [Google Scholar] [CrossRef]
  34. Argade, G.R.; Panigrahi, S.K.; Mishra, R.S. Effects of grain size on the corrosion resistance of wrought magnesium alloys containing neodymium. Corros. Sci. 2012, 58, 145–151. [Google Scholar] [CrossRef]
Figure 1. Microstructure of the Al–xFe–0.1Si–0.07La alloy foils: (a) and (b) Al–0.07Fe–0.1Si–0.07La; (c) and (d) Al–0.2Fe–0.1Si–0.07La; and (e) and (f) Al–0.4Fe–0.1Si–0.07La.
Metals 10 00109 g001
Figure 2. Typical energy dispersive spectroscopy (EDS) analyses of: (a) sharp coarse bulk (R) phase; (b) fine spherical (S) phase; and (c) clustered irregular T phase.
Metals 10 00109 g002
Figure 3. Fracture surface of the Al–xFe–0.1Si–0.07La alloys: (a) Al–0.07Fe–0.1Si–0.07La; (b) Al–0.2Fe–0.1Si–0.07La; and (c) Al–0.4 Fe–0.1Si–0.07La.
Metals 10 00109 g003
Figure 4. Typical Tafel polarization curve of the Al–xFe–0.1Si–0.07La alloys tested in a 3.5% NaCl solution.
Metals 10 00109 g004
Figure 5. Corrosion surfaces of the Al–xFe–0.1Si–0.07La alloy foils tested in a 3.5% NaCl solution: (a) Al–0.07Fe–0.1Si–0.07La; (b) Al–0.2Fe–0.1Si–0.07La; and (c) Al–0.4Fe–0.1Si–0.07La.
Metals 10 00109 g005
Figure 6. EDS analysis of the corrosion pit P. (a,b) SEM images of corrosion pits; (c) EDS pattern.
Metals 10 00109 g006
Figure 7. Corrosion cross sections of the Al–xFe–0.1Si–0.07La alloy foils tested in a 3.5% NaCl solution: (a) Al–0.07Fe–0.1Si–0.07La; (b) Al–0.2Fe–0.1Si–0.07La; and (c) Al–0.4Fe–0.1Si–0.07La. (d) EDS analysis of phase Q.
Metals 10 00109 g007
Table 1. Tensile strength of the Al–xFe–0.1Si–0.07La alloy foils.
Alloyσ0.2 (MPa)σb (MPa)δ (%)
Al–0.07Fe–0.1Si–0.07La148.47161.231.37
Al–0.2Fe–0.1Si–0.07La154.32167.001.27
Al–0.4Fe–0.1Si–0.07La188.86204.161.01
Table 2. Electrical conductivity of the Al–xFe–0.1Si–0.07La alloys.
AlloyElectrical Conductivity (%IACS)
Al–0.07Fe–0.1Si–0.07La60.96
Al–0.2Fe–0.1Si–0.07La60.07
Al–0.4Fe–0.1Si–0.07La59.33
Table 3. Tafel polarization parameters of the Al–xFe–0.1Si–0.07La alloys tested in a 3.5% NaCl solution.
AlloyEcorr (mV vs. SCE)Icorr (μA/cm2)
Al–0.07Fe–0.1Si–0.07La−7434.867
Al–0.2Fe–0.1Si–0.07La−69834.91
Al–0.4Fe–0.1Si–0.07La−65947.22

