Article

Tensile Behavior and Deformation Mechanism of Fe-Mn-Al-C Low Density Steel with High Strength and High Plasticity

1
Collaborative Innovation Center of Steel Technology, University of Science and Technology Beijing, Xueyuan Road 30, Beijing 100083, China
2
Beijing Laboratory for Modern Transportation Advanced Metal Materials and Processing Technology, University of Science and Technology Beijing, Beijing 100083, China
*
Author to whom correspondence should be addressed.
Metals 2019, 9(8), 897; https://doi.org/10.3390/met9080897
Submission received: 23 July 2019 / Revised: 9 August 2019 / Accepted: 12 August 2019 / Published: 16 August 2019

Abstract

:
Tensile behavior and plastic deformation mechanisms of Fe-22.8Mn-8.48Al-0.86C low-density steel were studied in this thesis. After solution treatment 1100 °C for 1 h; the steels obtained an excellent combination in mechanical properties; with tensile strength of 757.4 MPa and total elongation of 68%; which were attributed to the existence of annealing twins in austenite. The present steel presented a multiple stage strain hardening behavior which was associated with the changes of such dislocation substructures. With the increase of strain, the gradual transition from tangled dislocations to dense dislocation walls and microbands was found in (the transmission electron microscopy) TEM microstructures. Due to the influence of the evolution of the microstructure during the deformation process, the work hardening behavior of the experimental steel shows three distinct stages.

1. Introduction

Automobile weight reduction is the direction of the development of modern automotive technology to meet the requirements of energy saving. Austenitic high-Mn(15–30 wt%)Fe-Mn-Al-C steels show particularly outstanding mechanical properties and are therefore highly promising candidates for such applications [1,2,3,4]. Due to their low cost and good mechanical properties, in the beginning these steels were developed in a search to replace Cr-containing stainless steels. According to the chemical composition optimization, a higher content of aluminum was added to the high manganese steel. As a result, austenite Fe-Mn-Al-C steels have significantly reduced mass density (a 1.3% reduction in density is obtained per 1 wt% Al addition) and excellent strength–ductility balance due to alloying of Al and regained focus of researchers. Al is the most effective element in increasing the stacking fault energy (SFE) of austenite [5] and deformed microstructures exhibited the planar glide characteristics for high Mn-Al-C single phase steels.
According to the phase ingredient, Fe-Mn-Al-C steels can be classified as austenite, ferrite and duplex-based alloys. In austenitic Fe-Mn-Al-C steels containing high Al (5–12 wt%) and high C (0.5–1.3 wt%), nanometer-scale ordered κ-carbides precipitates can be precipitated on face-centered-cubic (fcc) austenite during water quenching. The mechanical properties of Fe-Mn-Al-C steels can differ significantly, because of their chemical composition. For fully austenitic high Mn steels, stacking fault energy (SFE) is the main determinant of its deformation mechanism [6]. For fully austenitic high Mn steels, SFE is the main determinant of its deformation mechanism. The deformation mechanism of Fe-Mn-Al-C steel varies greatly with SFE. When the stacking fault energy is low, the deformation mechanism is transformation-induced plasticity (TRIP). With the increase of stacking fault energy, it gradually changes to twinning induced plasticity (TWIP) and to dislocation gliding [7]. The high density dislocation wall structures are considered as impenetrable barriers to the dislocation motion and further slip in the systems interacting with them leads to high strain hardening [8].
At present, little attention has been paid to the tensile behavior and microstructural evolution during plastic deformation of high Mn (20–25 wt%) austenitic steels. The deformation mechanism of the steel is unclear. In the present investigation, a kind of high-strength plastic low-density steel (Fe-22.8Mn-8.48Al-0.86C) was developed by composition optimization. Tensile behavior and plastic deformation mechanisms of Fe22.8Mn-8.48Al-0.86C low-density steel were investigated in the present study based on SFE calculation, X-ray Diffraction (XRD), Optical Microscope (OM), Scanning Electron Microscope (SEM) and TEM at different deformation strains.

2. Experimental

A 20 kg ingot of experimental steel was prepared in a vacuum induction furnace. Chemical composition of the experimental steel is shown in Table 1. The cast steel was heated to 1150 °C for 1 h, and then hot forged into a 40 mm × 60 mm × 80 mm billet. The billet was homogenized at 1200 °C for 1 h, and hot rolled to the thickness of 5 mm with a reduction of 87.5% followed by water cooling to room temperature.
The steel plate was solution treated at 1100 °C for 1 h followed by water quenching to obtain stable austenite structure. For tensile tests, specimens with a gauge width of 12.5 mm and a gauge length of 50 mm were machined from the water quenched plate along the longitudinal direction. The tensile tests were conducted at temperature with a constant speed (3 mm/min). Some tests were interrupted at different deformations (10%, 30% and 68% based on Figure 2) to observe the microstructures and the microstructural evolution.
The resulting microstructures were observed by OLS4100 (made by OLYMPUS, Tokyo, Japan) and Zeiss ULTRA 55-type (Oberkochen, Germany) field emission scanning electron microscopy (FE-SEM) after etching with 8% nital. Twin-jet polishing technique (5% perchlorate alcohol at −30 °C, applied potential of 50 V) was implemented to prepare thin foil samples for TEM observation (JEM 2100 made by JEOL, Tokyo, Japan). X-ray diffraction was employed on the samples for phase identification with CuKα radiation.

3. Results and Discussion

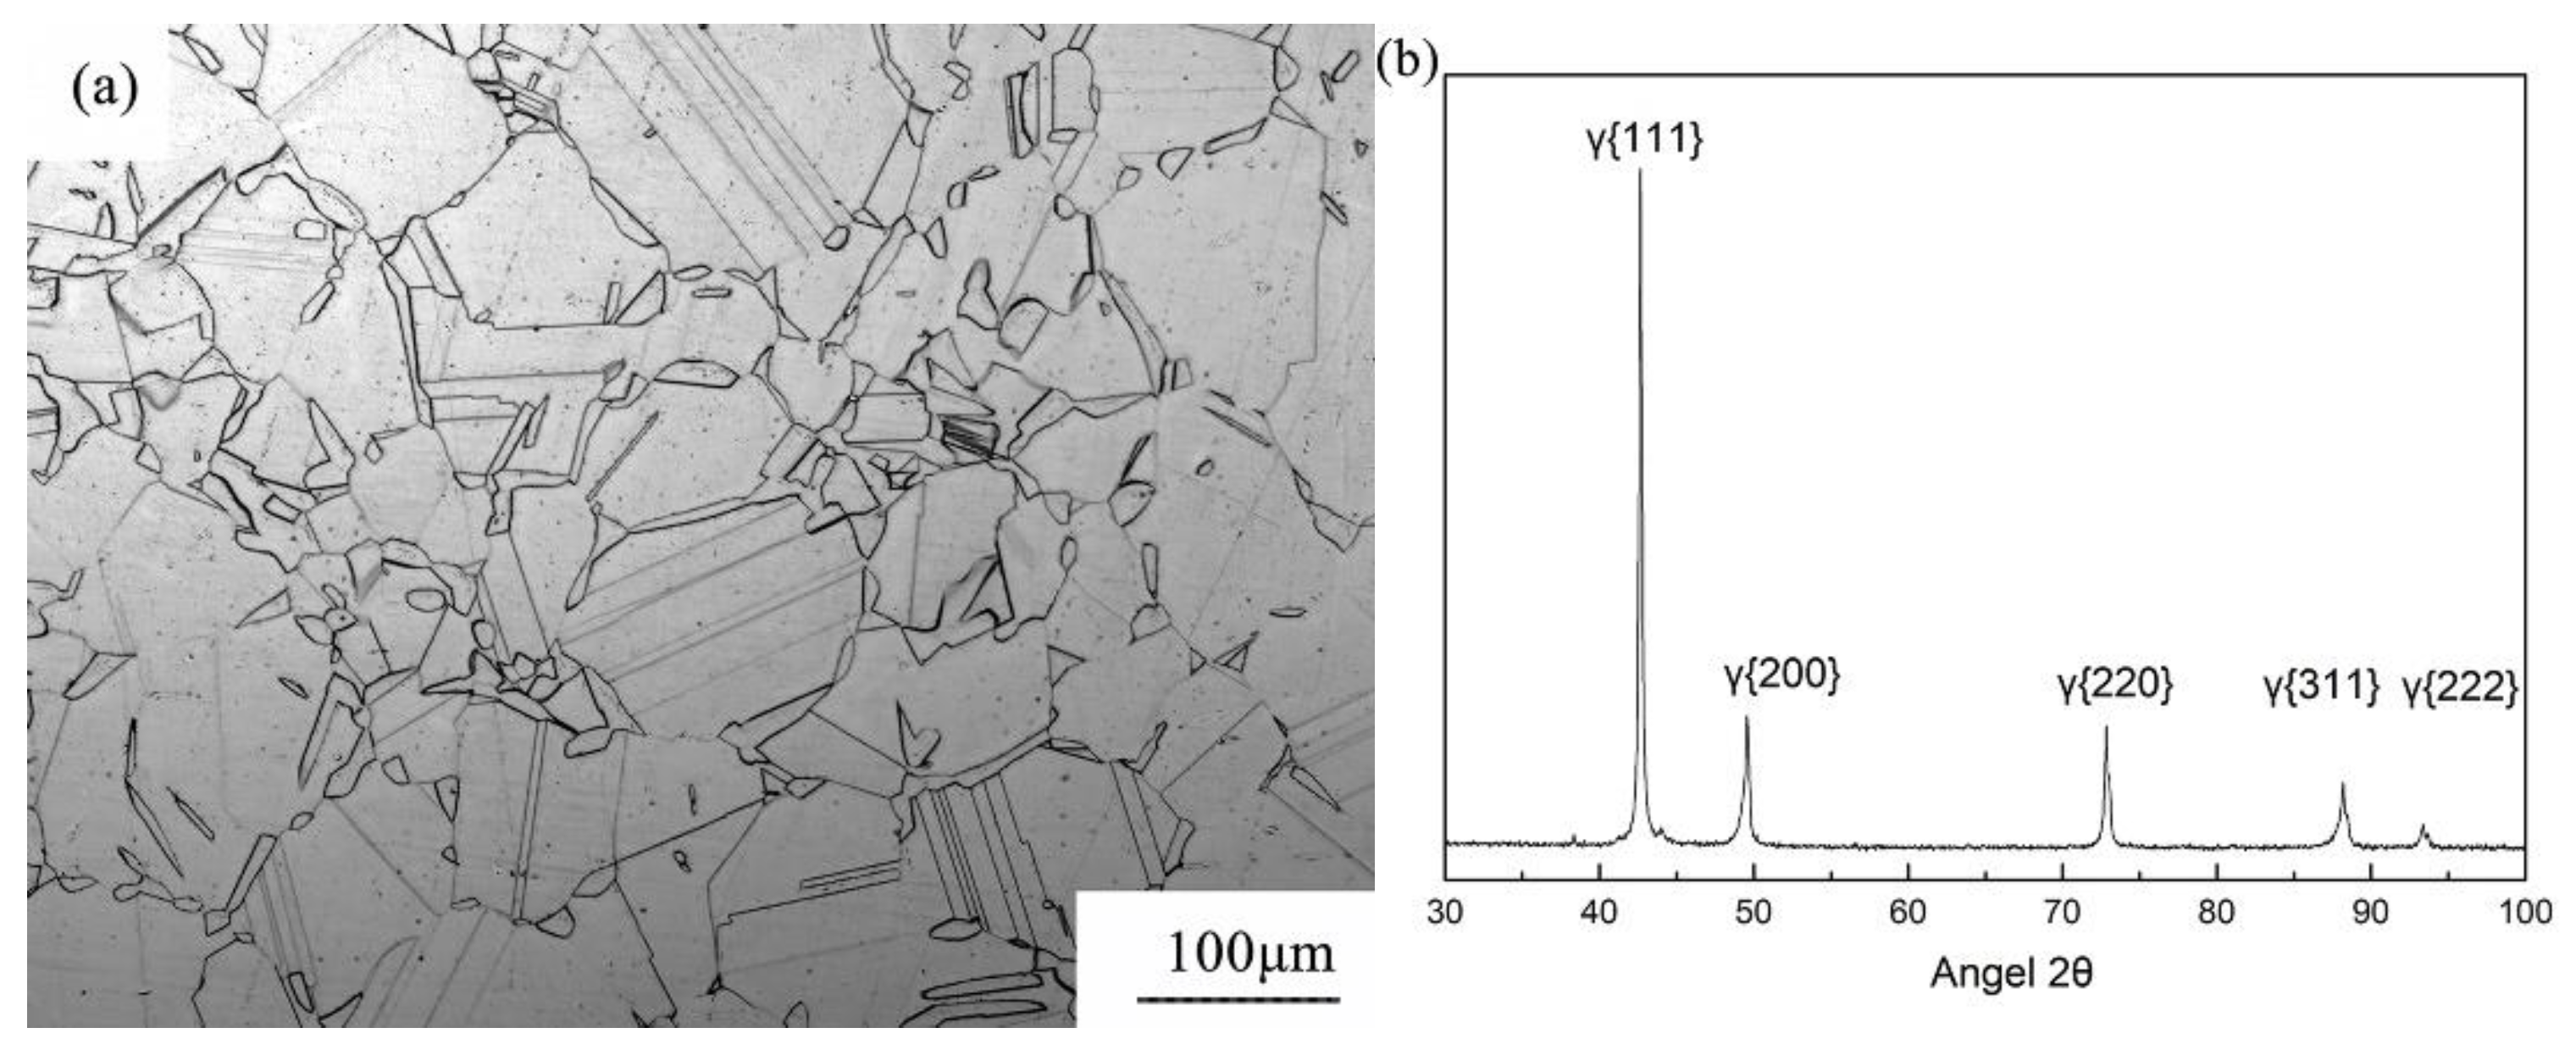
3.1. Initial Microstructure and Stacking Fault Energy of the Steel

The initial microstructure of the steel after solution treated at 1100 °C for 1 h followed by quenching is shown in Figure 1a. The annealing twins consisted in most grains and run through the entire austenite grain. The whole austenite’s grain size was 45 μm. The XRD analysis (Figure 1b) revealed that the steel was fully austenitic in which the integrated intensities of the peaks of γ (111), γ (200), γ (220), γ (311) and γ (222) are regarded as austenite.
SFE is an important parameter to study the correlation between microstructure and tensile behavior of the high-Mn Fe-Mn-Al-C steels. The most effective way to improve SFE is to increase the content of Al element in high-Mn steel [6]. The γ S F E can be estimated by [9]:
γ S F E = 2 ρ A Δ G γ ε + 2 σ γ ε ,
ρ = ( 4 3 ) ( 1 α 2 N A ) .
where ρ A is the molar planar density of {111} planes, σ is the interfacial energy of γ/ε, and N is the Avogadro number.
Δ G γ ε = X F e Δ G F e γ ε + X M n Δ G M n γ ε + X A l Δ G A l γ ε + X C Δ G C γ ε + X F e X M n Ω F e M n γ ε      + X F e X A l Ω F e A l γ ε + X F e X C Ω F e C γ ε + X M n X C Ω M n C γ ε + Δ G m g γ ε
where X is the atomic molar fraction, Ω is the excessive mixing energy and Δ G is the Gibbs energy for the magnetic state of the phase.
Δ G m g γ ε = G m σ ε G m σ γ ,
G m g φ = R T l n β φ + 1 f ( T / T N e e l ) .
T N e e l is the Neel temperature, β is the magnetic moment depending on the composition.
When τ = T / T Neel < 1 ,
f ( τ ) = 1 ( 79 τ φ 1 / 140 P ) + ( 474 / 497 ) [ ( 1 / P ) 1 ] [ ( τ φ 3 / 6 ) + ( τ φ 6 / 135 ) + ( τ φ 15 / 600 ) ] D
When τ = T / T Neel > 1 ,
f ( τ ) = τ φ 5 / 10 + τ φ 15 / 315 + ( τ φ 25 / 1500 ) D .
Where P = 0.28, D = 2.34.
The γ S F E and Δ G γ ε of the present Fe-22.8Mn-8.48Al-0.86C steel were calculated as 71.5 mJ/m2 and 910.1 J/mol at room temperature from equations. Table 2 lists the parameters used in the calculation.

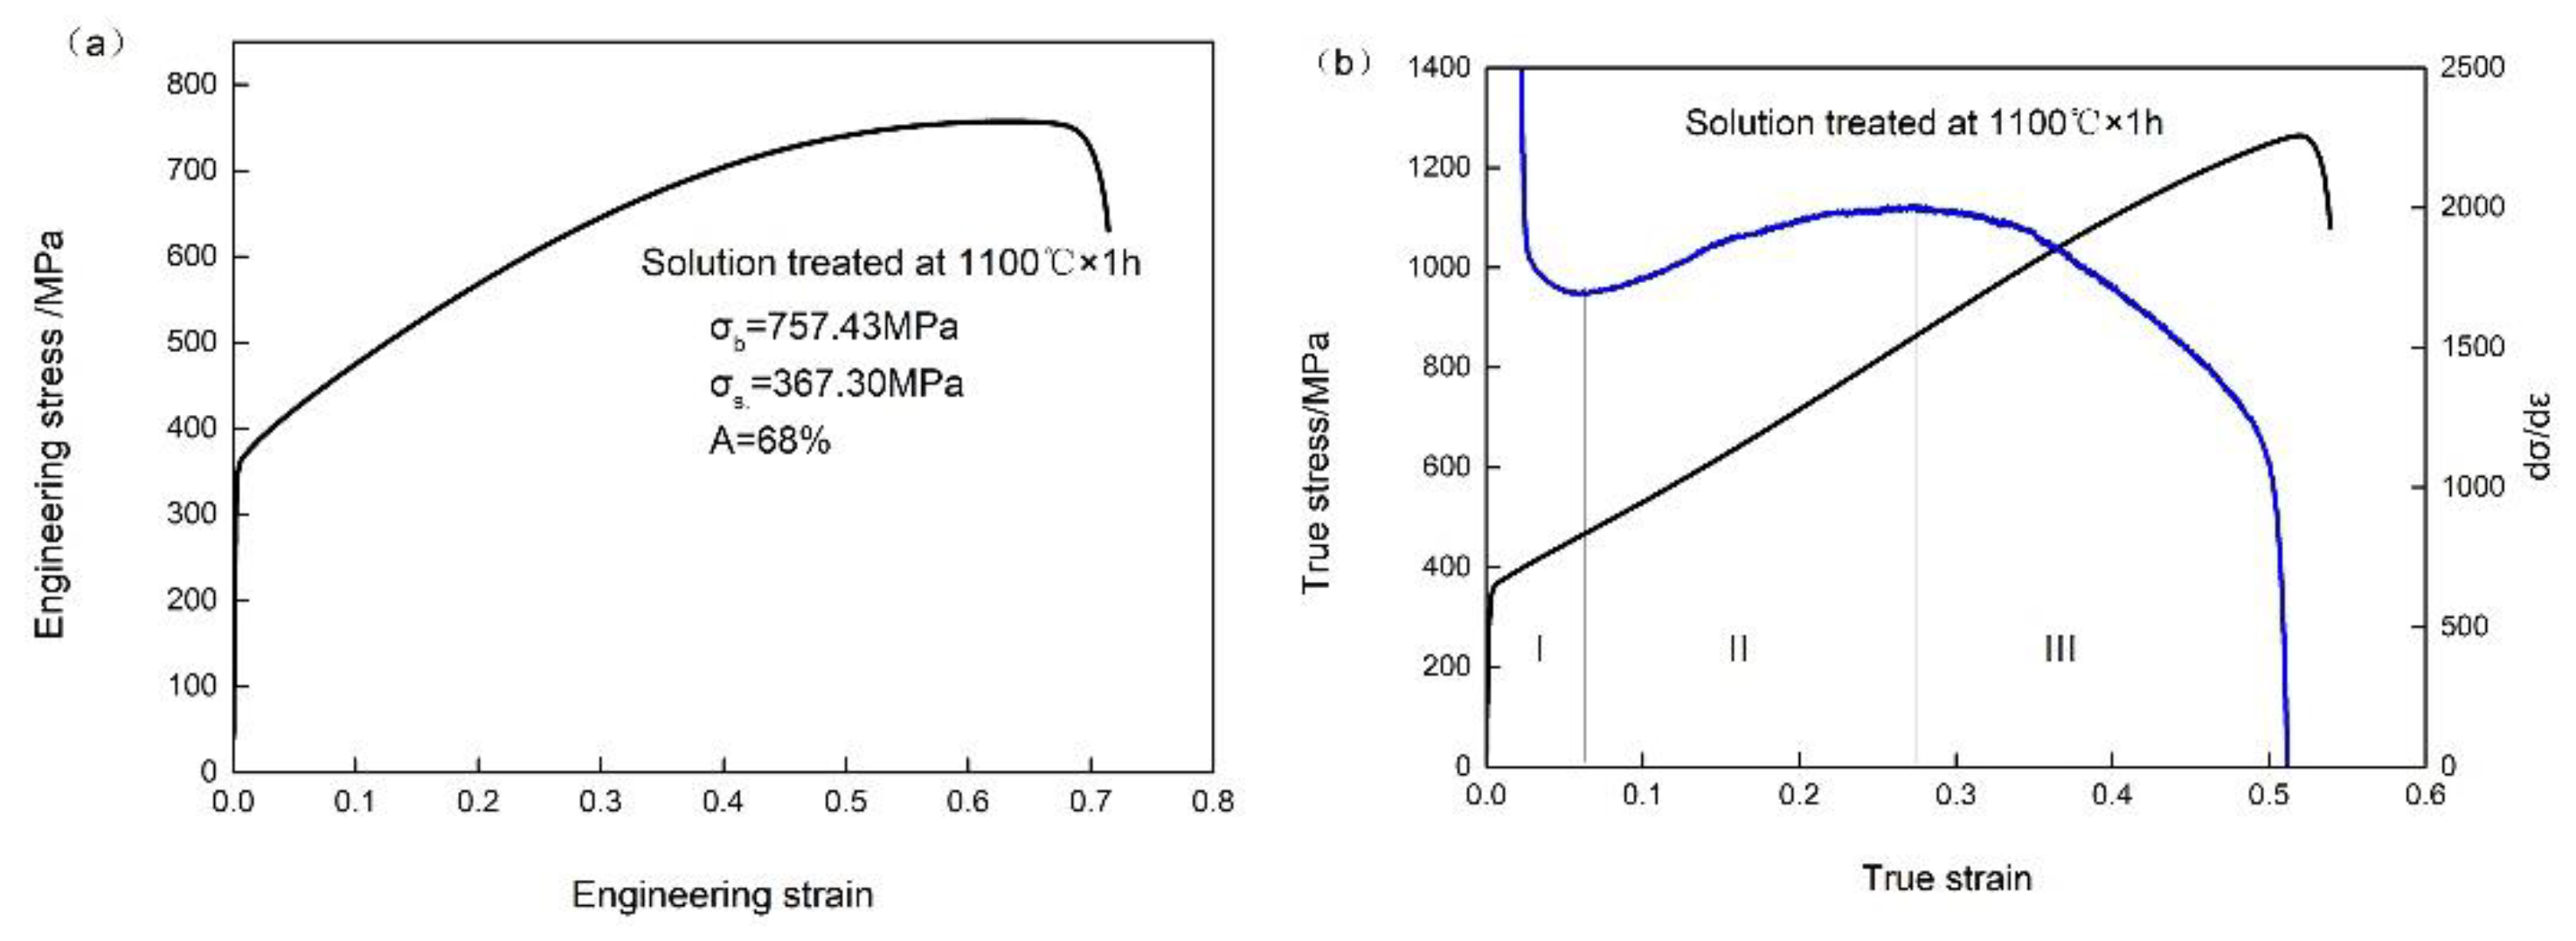
3.2. Mechanical Properties

Figure 2a shows the engineering stress–strain curve of experimental steel at room temperature. The steel exhibited continuous yielding and extensive strain hardening. Excellent mechanical properties, combining high strength (tensile strength of 757.43 MPa) and ductility (elongation to failure of 68%). The product of tensile strength and total elongation is 51.5 GPa%. The emergence of a large number of twins makes the experimental steel with a high degree of plasticity still maintain a certain intensity. The true stress–strain curve of the steel is presented in Figure 2b with the corresponding strain hardening rate ( d σ d ε ). Strain hardening was not linear but continuous. Analysis of the work hardening behavior of experimental steel shows that the d σ d ε curve can be subdivided into three stages: the first stage with a rapid reduction in work hardening rate until the strain of 0.06128; the continuous hardening state with a constant work hardening rate of 1691 MPa; the last stage with a work hardening rate that declines until failure occurs.

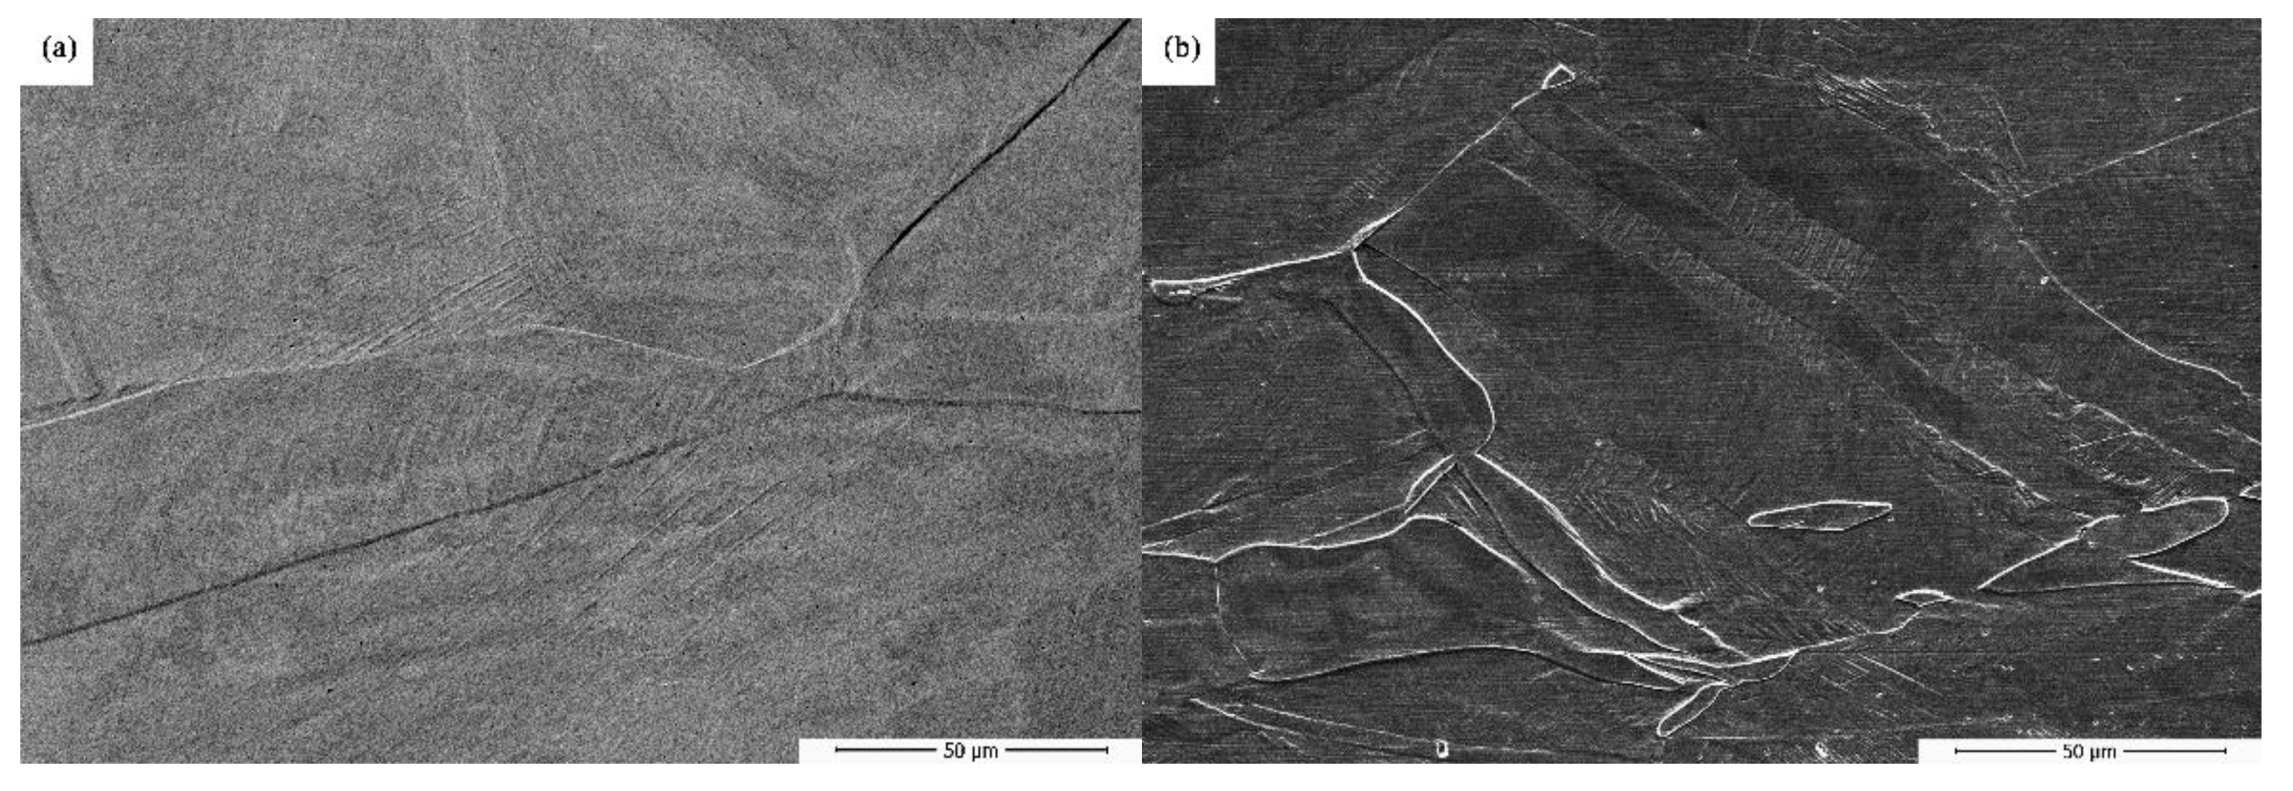
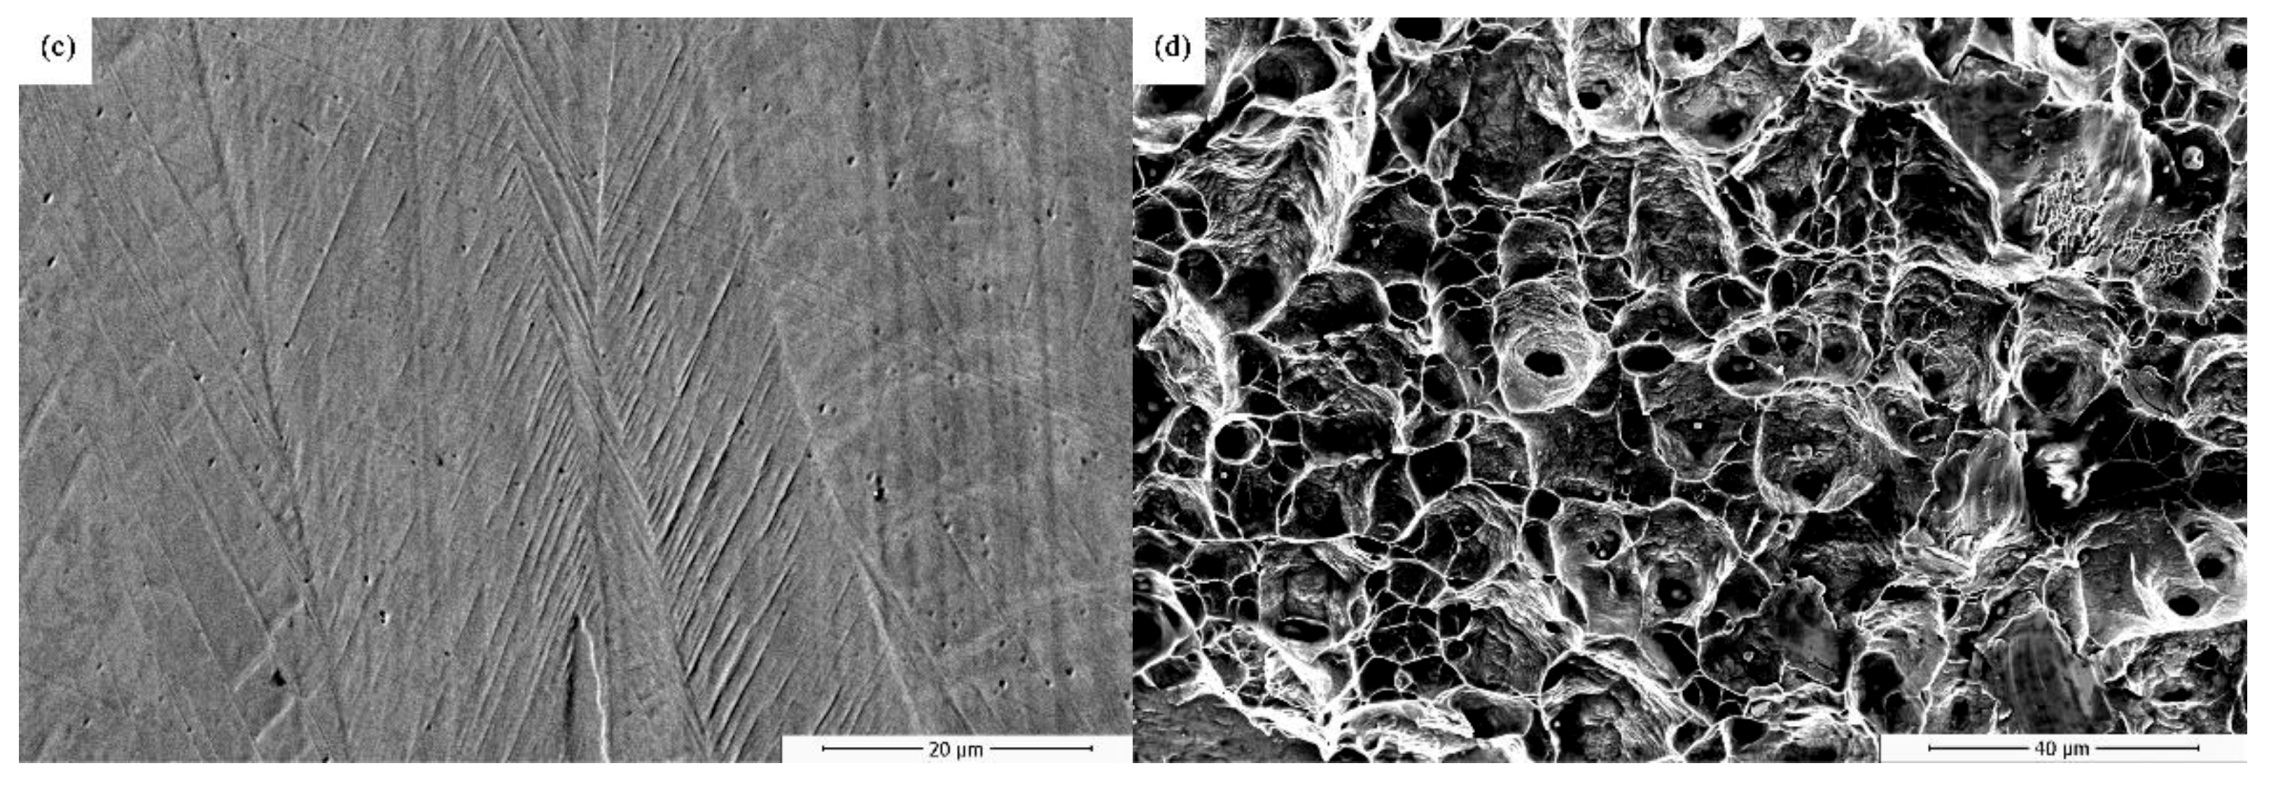
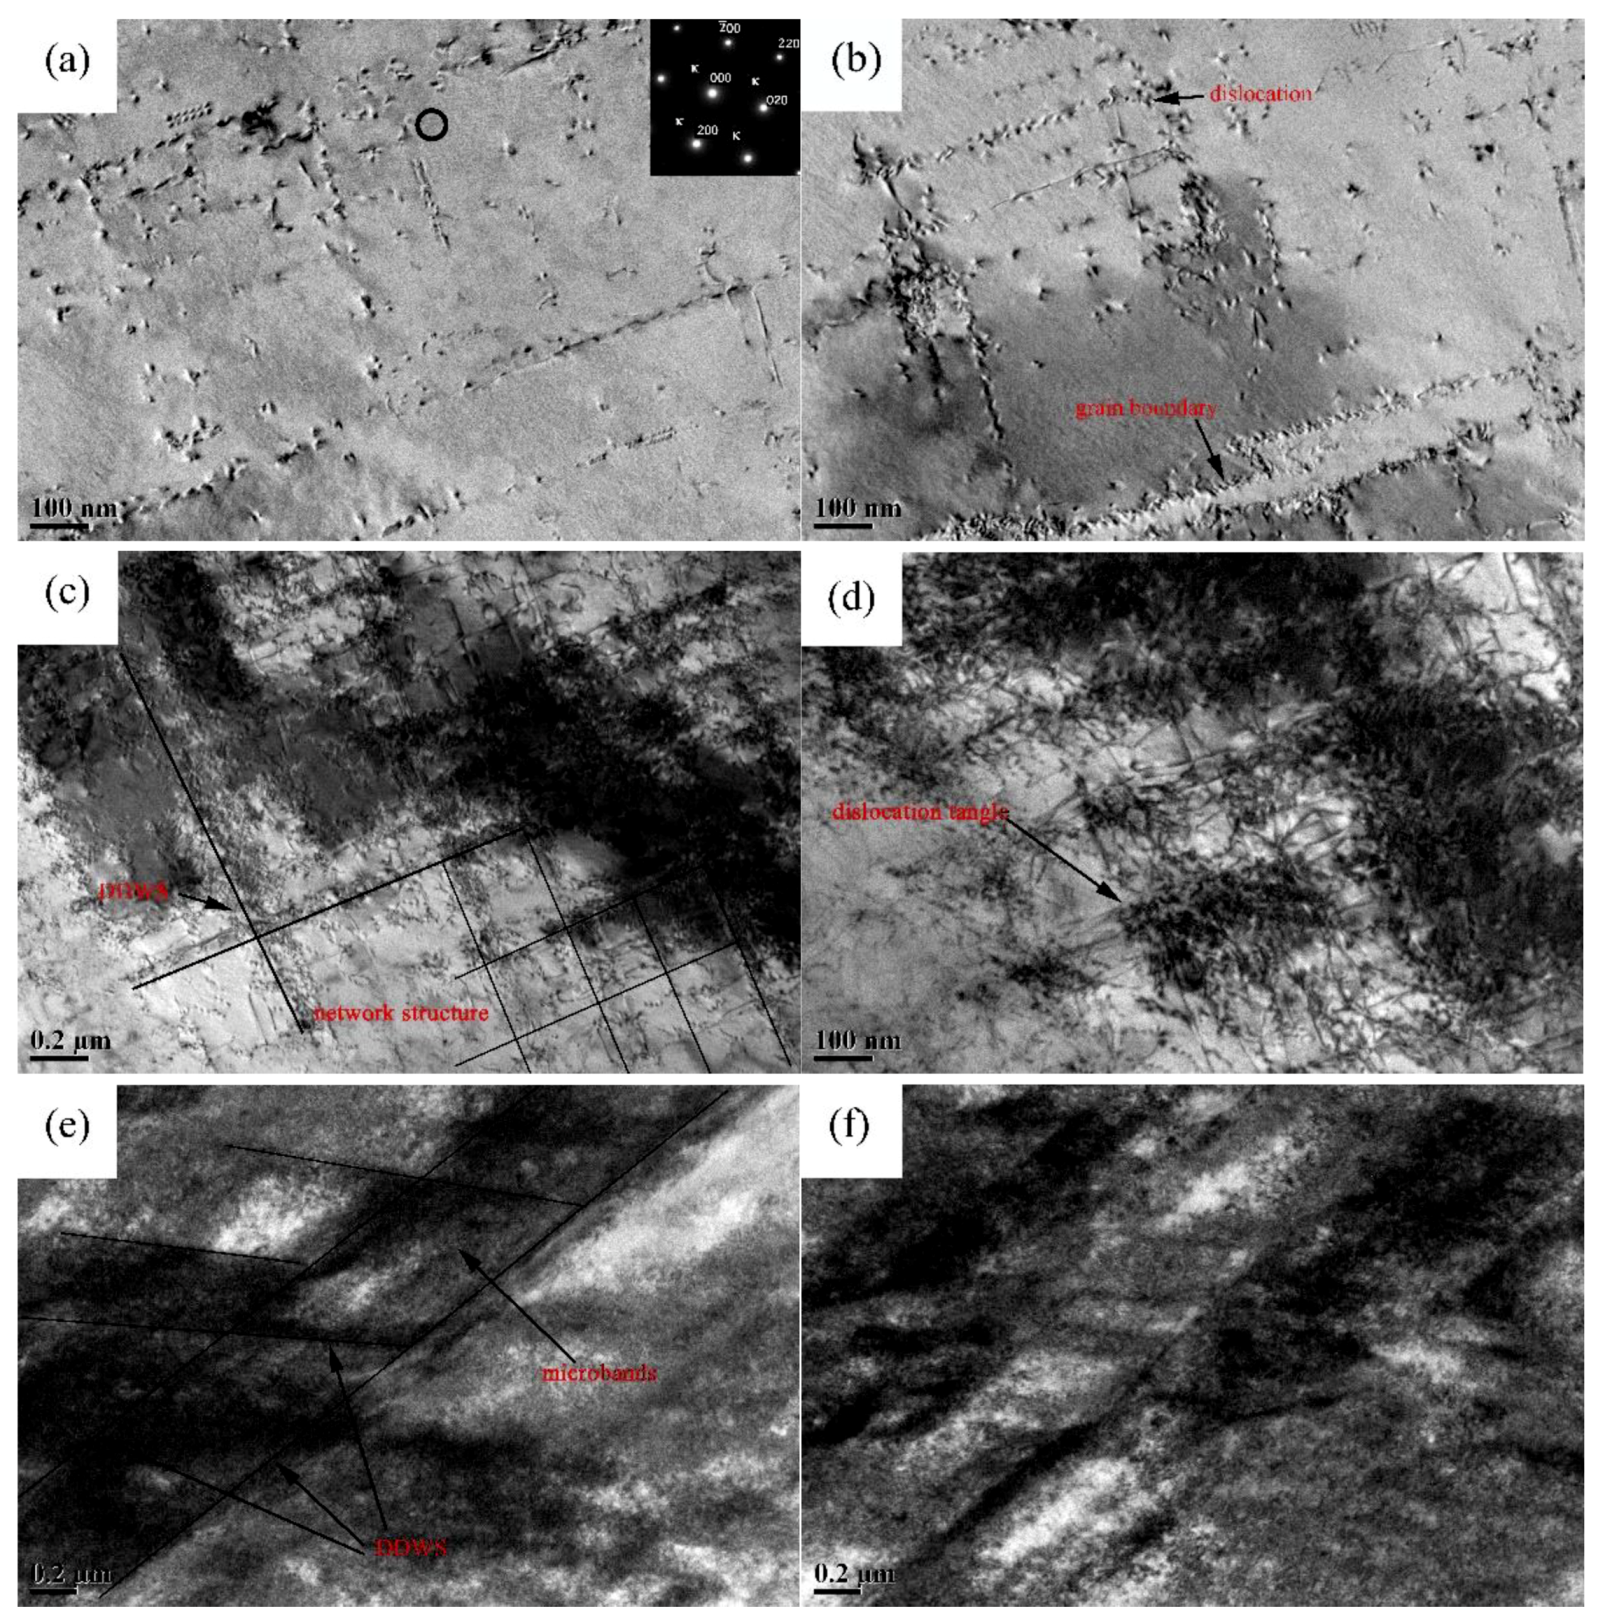
3.3. Deformation Structure with Increasing Strain

Figure 3a–c show the SEM micrographs of the steel deformed to the different strain levels. Due to the high content of alloying elements and the stacking fault energy, the austenite in the tensile deformation at room temperature showed a large number of slip bands, and as the strain increased, the amount of slip bands increased and formed cross-slip slip in different directions.
At 10% strain, only elastic deformation occurred without obvious change of sample, but a small amount of parallel slip bands appeared on the austenite matrix, and stretched slightly along the tensile direction. At 30% strain, the density of slip band increased obviously. Piles of slip bands continuously passed through the twin boundaries with internal deflection while maintaining the same extending direction. Some of the twins ruptured under the action of slip line, and the grains were bent along the direction of stretching. The phenomenon is due to the exactly same grain orientation and slip direction on the two sides of annealing twin boundaries. At the same time, a small amount of cross-slip bands started to appear among the grains. At 68% elongation, a large number of slip bands could be observed in the grains, symmetrical slip bands were observed on both sides of the twin boundaries, and the slip bands bent under the strain.
Samples were taken near the tensile fracture to observe. The tensile fracture was shown in Figure 3d, the fracture surface by the well-developed dimples. In the tensile fracture morphology small equiaxed dimples contained larger dimples in which the spiral stripes could be observed. This is the slip streak produced by the inner surface of the cavity when the dimple grew gradually. The pattern formed when the material fractured along the slip surface. Fracture morphology of the steel is a dimple pattern with features of plastic fracture.
It is known from the relationship between the rate of work hardening and the true strain that the characteristics of the microstructures are different in the three stages of the deformation, and the plastic deformation mechanism of steel is also different. As the amount of deformation increases, the experimental work-hardening mechanism of the test steel during the tensile deformation gradually changed from dislocation reinforcing to microbands reinforcing.
Metal working hardening is mainly caused by the dislocation slip behavior, and the disruption of dislocation slip is firstly the effect of the solution atom. A large amount of solid solution atoms in the test steel made the crystal lattice distortion, and the interaction between dislocations and solid solution atoms increased sharply, blocking dislocation slip strongly. Under stress, a slew of dislocations in the steel soon hindered, and the trend of hardening and work hardening curve was the same. The diffraction pattern (Figure 4a) confirms the existence of κ carbide which precipitated in austenite during water quenching. The κ carbide was a spinodally decomposed product corresponding to the carbon-rich regions in austenite. The κ-carbides have been universally observed in Fe-Mn-(6–11 wt%)Al-(0.5–1.8 wt%)C steels contents [10,11,12]. Dislocation-particle pinning event was not observed in detailed TEM observations. It indicates that the blocking effect of nanoscale k-carbide on dislocation motion is weak since the carbide is dislocated in the process of plastic deformation by dislocation carbide without shear dislocation entanglement [13]. The dislocation tangle and slip surface softening caused the increase and decrease of work hardening rate respectively.
In the second stage of deformation, Figure 4c,d show that dislocations were generated continuously as the deformation increased, single or multiple dislocations distributed or plugged at the grain boundaries continuously, and a large number of tangled dislocations caused stress concentration. The higher SFE of the steel inhibited the generation of deformation twins; these dislocation groups contain different average dislocation densities, indicating that the plastic deformation was in the direction of the main glide system. When secondary slides started, dislocation in different directions crossed and formed network structure. A number of dense density dislocation walls parallel to each other can be observed with an average distance of about 100 nm. This increasingly hindered dislocation movement and decreased the distance that the dislocations can slide freely, resulting in a local hardening rate improvement [14,15,16].
In the third stage of deformation, the maximum deformation at room temperature was 68%. The hardening rate decreased with increasing strain, and as the strain increased continuously, new slip lines did not appear between the slip bands any more. In the final stage of dislocation slip, two parallel dislocations walls containing a large amount of geometrically dislocations formed microbands. The dislocation density in the microbands is higher, but the activity ability is poor. The deformation is concentrated in the original slip band, and microbands delivery in different directions produced a structure similar to the cystiform microstructure as shown in Figure 4 Austenite grains were subdivided, and the effective free path of dislocation motion was shortened. This leads to a slight increase (compared with the second stage) in the work hardening effect of the material.

4. Conclusions

  • Fe-22.8Mn-8.48Al-0.86C steel after solid treatment at 1100 °C for 1 h was austenitic with annealing twins through the austenite grain. The experimental steel possesses excellent comprehensive mechanical properties, with a high strength of 757.43 MPa and an elongation of 68%. With the increase of strain, the working hardening rate is on the rise uninterruptedly during tensile deformation before plastic collapse;
  • γ S F E and Δ G γ ε of the present Fe-22.8Mn-8.48Al-0.86C steel at room temperature were estimated as 71.5 mJ/m2 and 910.1 J/mol. During the tensile deformation, amounts of slip parallel bands formed on austenite matrix. The density of the slip bands increased, and then slip bands in different directions crossed with the increase of strain.
  • The steel shows characteristics of typical glide during the deformation. Dislocation multiplied at low deformation, dislocations tangled and dense dislocation walls formed at middle deformation. As the deformation increased, microbands formed and intersected. The work-hardening mechanism of the test steel changed gradually from dislocation reinforcing to microbands reinforcing.

Author Contributions

Conceptualization, Z.Z. (Zhanming Zhou) and Z.Z. (Zhengzhi Zhao); methodology, J.P. and D.T.; validation, J.P., Z.Z. (Zhanming Zhou) and Q.H.; formal analysis, J.L., Z.Z. (Zhengzhi Zhao) and J.P.; writing—original draft preparation, J.P.; writing—review and editing, J.L. and Z.M.Z; supervision, D.T.; project administration, Z.Z. (Zhengzhi Zhao)

Funding

Zhengzhi Zhao acknowledges the financial supports by the National Key Research and Development Program of China (Project No. 2017YFB0304400) and the National Nature Science Foundation of China (No.51574028).

Conflicts of Interest

The authors declare no conflict of interest.

References

  1. Tang, D.; Mi, Z.-L.; Chen, Y.-L. Technology and research and development of advanced automobile steel abroad. J. Iron. Steel 2005, 40, 1–5. [Google Scholar]
  2. Cai, Z.H.; Ding, H.; Misra, R.D.K.; Kong, H.; Wu, H.Y. Unique impact of ferrite in influencing austenite stability and deformation behavior in a hot-rolled Fe-Mn-Al-C steel. Mater. Sci. Eng., A. 2014, 595, 86–91. [Google Scholar] [CrossRef]
  3. Kim, H.; Suh, D.W.; Kim, N.J. Fe-Al-Mn-C lightweight structural alloys: a review on the microstructures and mechanical properties. Sci. Technol. Adv. Mater. 2013, 14, 014205. [Google Scholar] [CrossRef] [PubMed]
  4. Yoo, J.D.; Park, K.T. Microband-induced plasticity in a high Mn-Al-C light. Mater. Sci. Eng., A. 2008, 496, 417–424. [Google Scholar] [CrossRef]
  5. Chen, S.; Rana, R.; Haldar, A.; Ranjit, K.R. Current state of Fe-Mn-Al-C low density steels. Prog. Mater. Sci. 2017, 89, 345–391. [Google Scholar] [CrossRef]
  6. Allain, S.; Chateau, J.P.; Bouaziz, O.; Migot, S.; Gueton, N. Correlations between the calculated stacking fault energy and the plasticity mechanisms in Fe-Mn-C alloys. Mater. Sci. Eng., A. 2004, 387, 158–162. [Google Scholar] [CrossRef]
  7. Park, K.T.; Kim, G.; Kim, S.K.; Lee, S.W.; Hwang, S.W.; Lee, C.S. On the transitions of deformation modes of fully austenitic steels at room temperature. Met. Mater. Int. 2010, 16, 1–6. [Google Scholar] [CrossRef]
  8. Canadinc, D.; Sehitoglu, H.; Maier, H.J.; Chumlyakov, Y.I. Strain hardening behavior of aluminum alloyed Hadfield steel single crystals. Acta Mater. 2005, 53, 1831–1842. [Google Scholar] [CrossRef]
  9. Hirth, J.P. Thermodynamics of stacking faults. Metall. Trans. 1970, 1, 2367. [Google Scholar]
  10. Choi, K.; Seo, C.H.; Lee, H.; Kim, S.K.; Kwak, J.H.; Chin, K.G.; Park, K.T.; Kim, N.J. Effect of aging on the microstructure and deformation behavior of austenite base lightweight Fe-28Mn-9Al-0.8C steel. Scr. Mater. 2010, 63, 1028–1031. [Google Scholar] [CrossRef]
  11. Chang, K.M.; Chao, C.G.; Liu, T.F. Excellent combination of strength and ductility in an Fe-9Al-28Mn-1.8C alloy. Scr. Mater. 2010, 63, 162–165. [Google Scholar] [CrossRef]
  12. Kimura, Y.; Handa, K.; Hayashi, K.; Mishima, Y. Microstructure control and ductility improvement of the two-phase γ-Fe/κ-(Fe, Mn)3AlC alloys in the Fe-Mn-Al-C quaternary system. Intermetallics 2004, 12, 607–617. [Google Scholar] [CrossRef]
  13. Gutierrez-Urrutia, I.; Raabe, D. Influence of Al content and precipitation state on the mechanical behavior of austenitic high-Mn low-density steels. Scr. Mater. 2013, 68, 343–347. [Google Scholar] [CrossRef]
  14. Park, K.T. Tensile deformation of low-density Fe-Mn-Al-C austenitic steels at ambient temperature. Scr. Mater. 2013, 68, 375–379. [Google Scholar] [CrossRef]
  15. Hughes, D.A. Microstructural evolution in a non-cell forming metal: Al-Mg. Acta Metall. Mater. 1993, 41, 1421–1430. [Google Scholar] [CrossRef]
  16. Yang, F.; Song, R.; Li, Y.; Sun, T.; Wang, K.K. Tensile deformation of low density duplex Fe-Mn-Al-C steel. Mater. Des. 2015, 76, 32–39. [Google Scholar] [CrossRef]
Figure 1. (a) Initial OM microphotograph of the steel; (b) XRD spectra of steel.
Metals 09 00897 g001
Figure 2. (a) The stress–strain curve of experimental steel; (b) the true stress–strain curve and work hardening curve of experimental steel.
Metals 09 00897 g002
Figure 3. Micrographs of steel at different strain. (a) 0%; (b) 30%; (c) after failure at 68%; (d) tensile fracture.
Metals 09 00897 g003aMetals 09 00897 g003b
Figure 4. TEM micrographs showing the microstructure of steel at different strain; (a), (b) 10%; (c), (d) 30%; (e), (f) after failure at 68%.
Metals 09 00897 g004
Table 1. Composition analysis of low-density steel (mass fraction, %).
MnAlCFe
22.88.480.86Bal.
Table 2. The parameters used in the calculation of the SFE.
ParametersValue and Functions
ρ A 2.94 × 10⁻⁵ (mol/m2)
σ γ ε 9 (mJ/m2)
Δ G F e γ ε –2243.38 + 4.309 T (J/mol)
Δ G M n γ ε –1000 + 1.123 T (J/mol)
Δ G A l γ ε 2800 + 5 T (J/mol)
Δ G C γ ε –22,166 (J/mol)
Ω F e M n γ ε 2180 + 532 ( X F e X M n ) (J/mol)
Ω F e A l γ ε 3339 (J/mol)
Ω F e C γ ε 42,500 (J/mol)
Ω M n C γ ε 26,910 (J/mol)
β γ 0.7 X F e + 0.62 X M n – 0.64 X F e X M n   – 4 X C
β ε 0.62 X M n – 4 X C
T N e e ; γ 250ln( X M n ) – 475 X M n X C   – 6.2 Al + 720 (K)
T N e e ; ε 58 X M n (K)

