
Optimizing the Gating System for Rapid Investment Casting of Shape Memory Alloys: Computational Numerical Analysis for Defect Minimization in a Simple-Cubic Cell Structure
 , , , and
Abstract
:1. Introduction
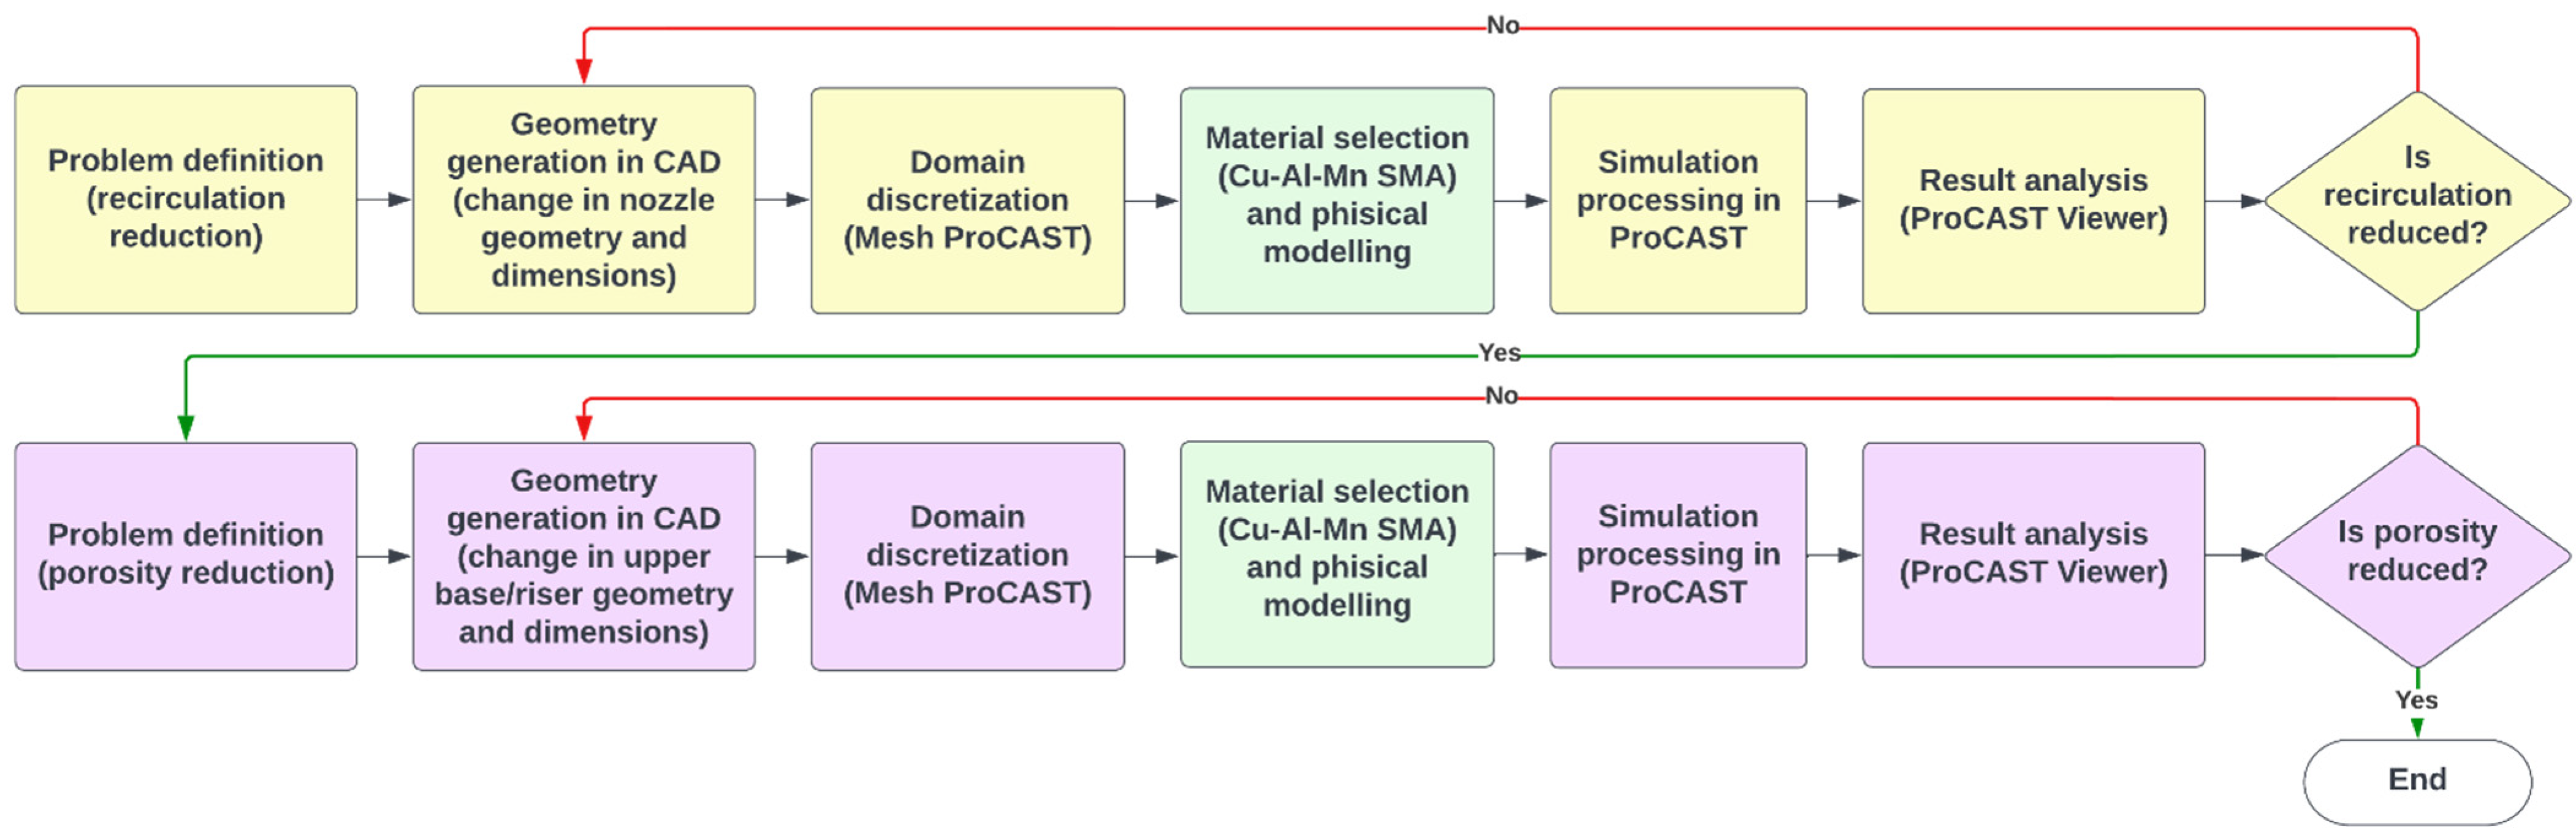
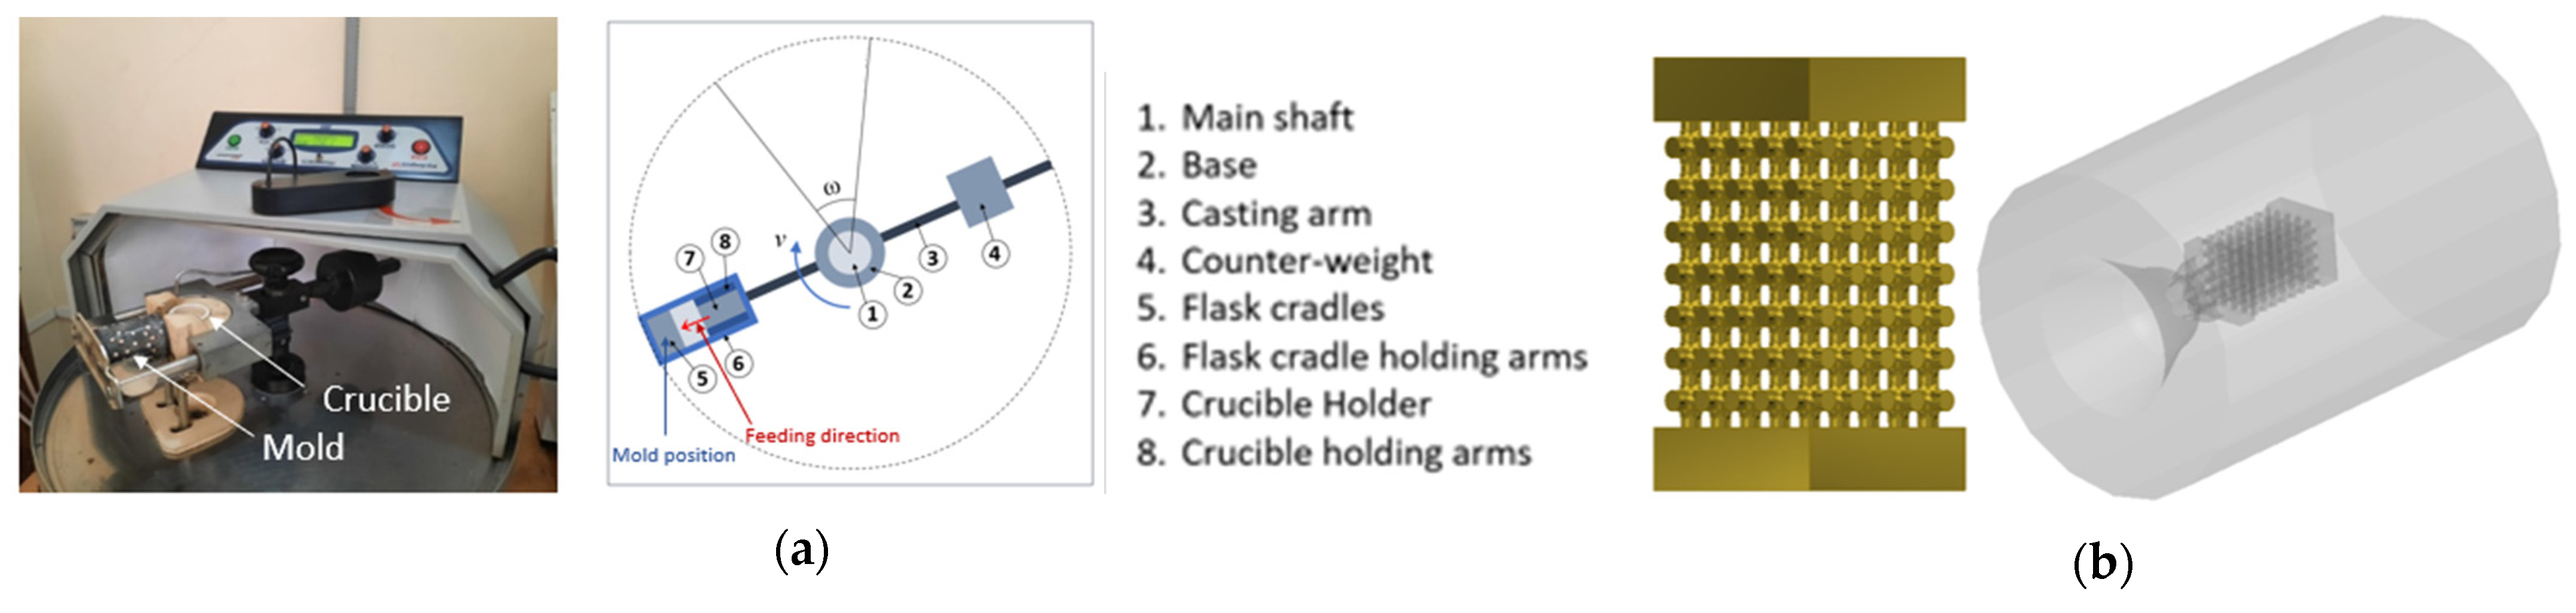
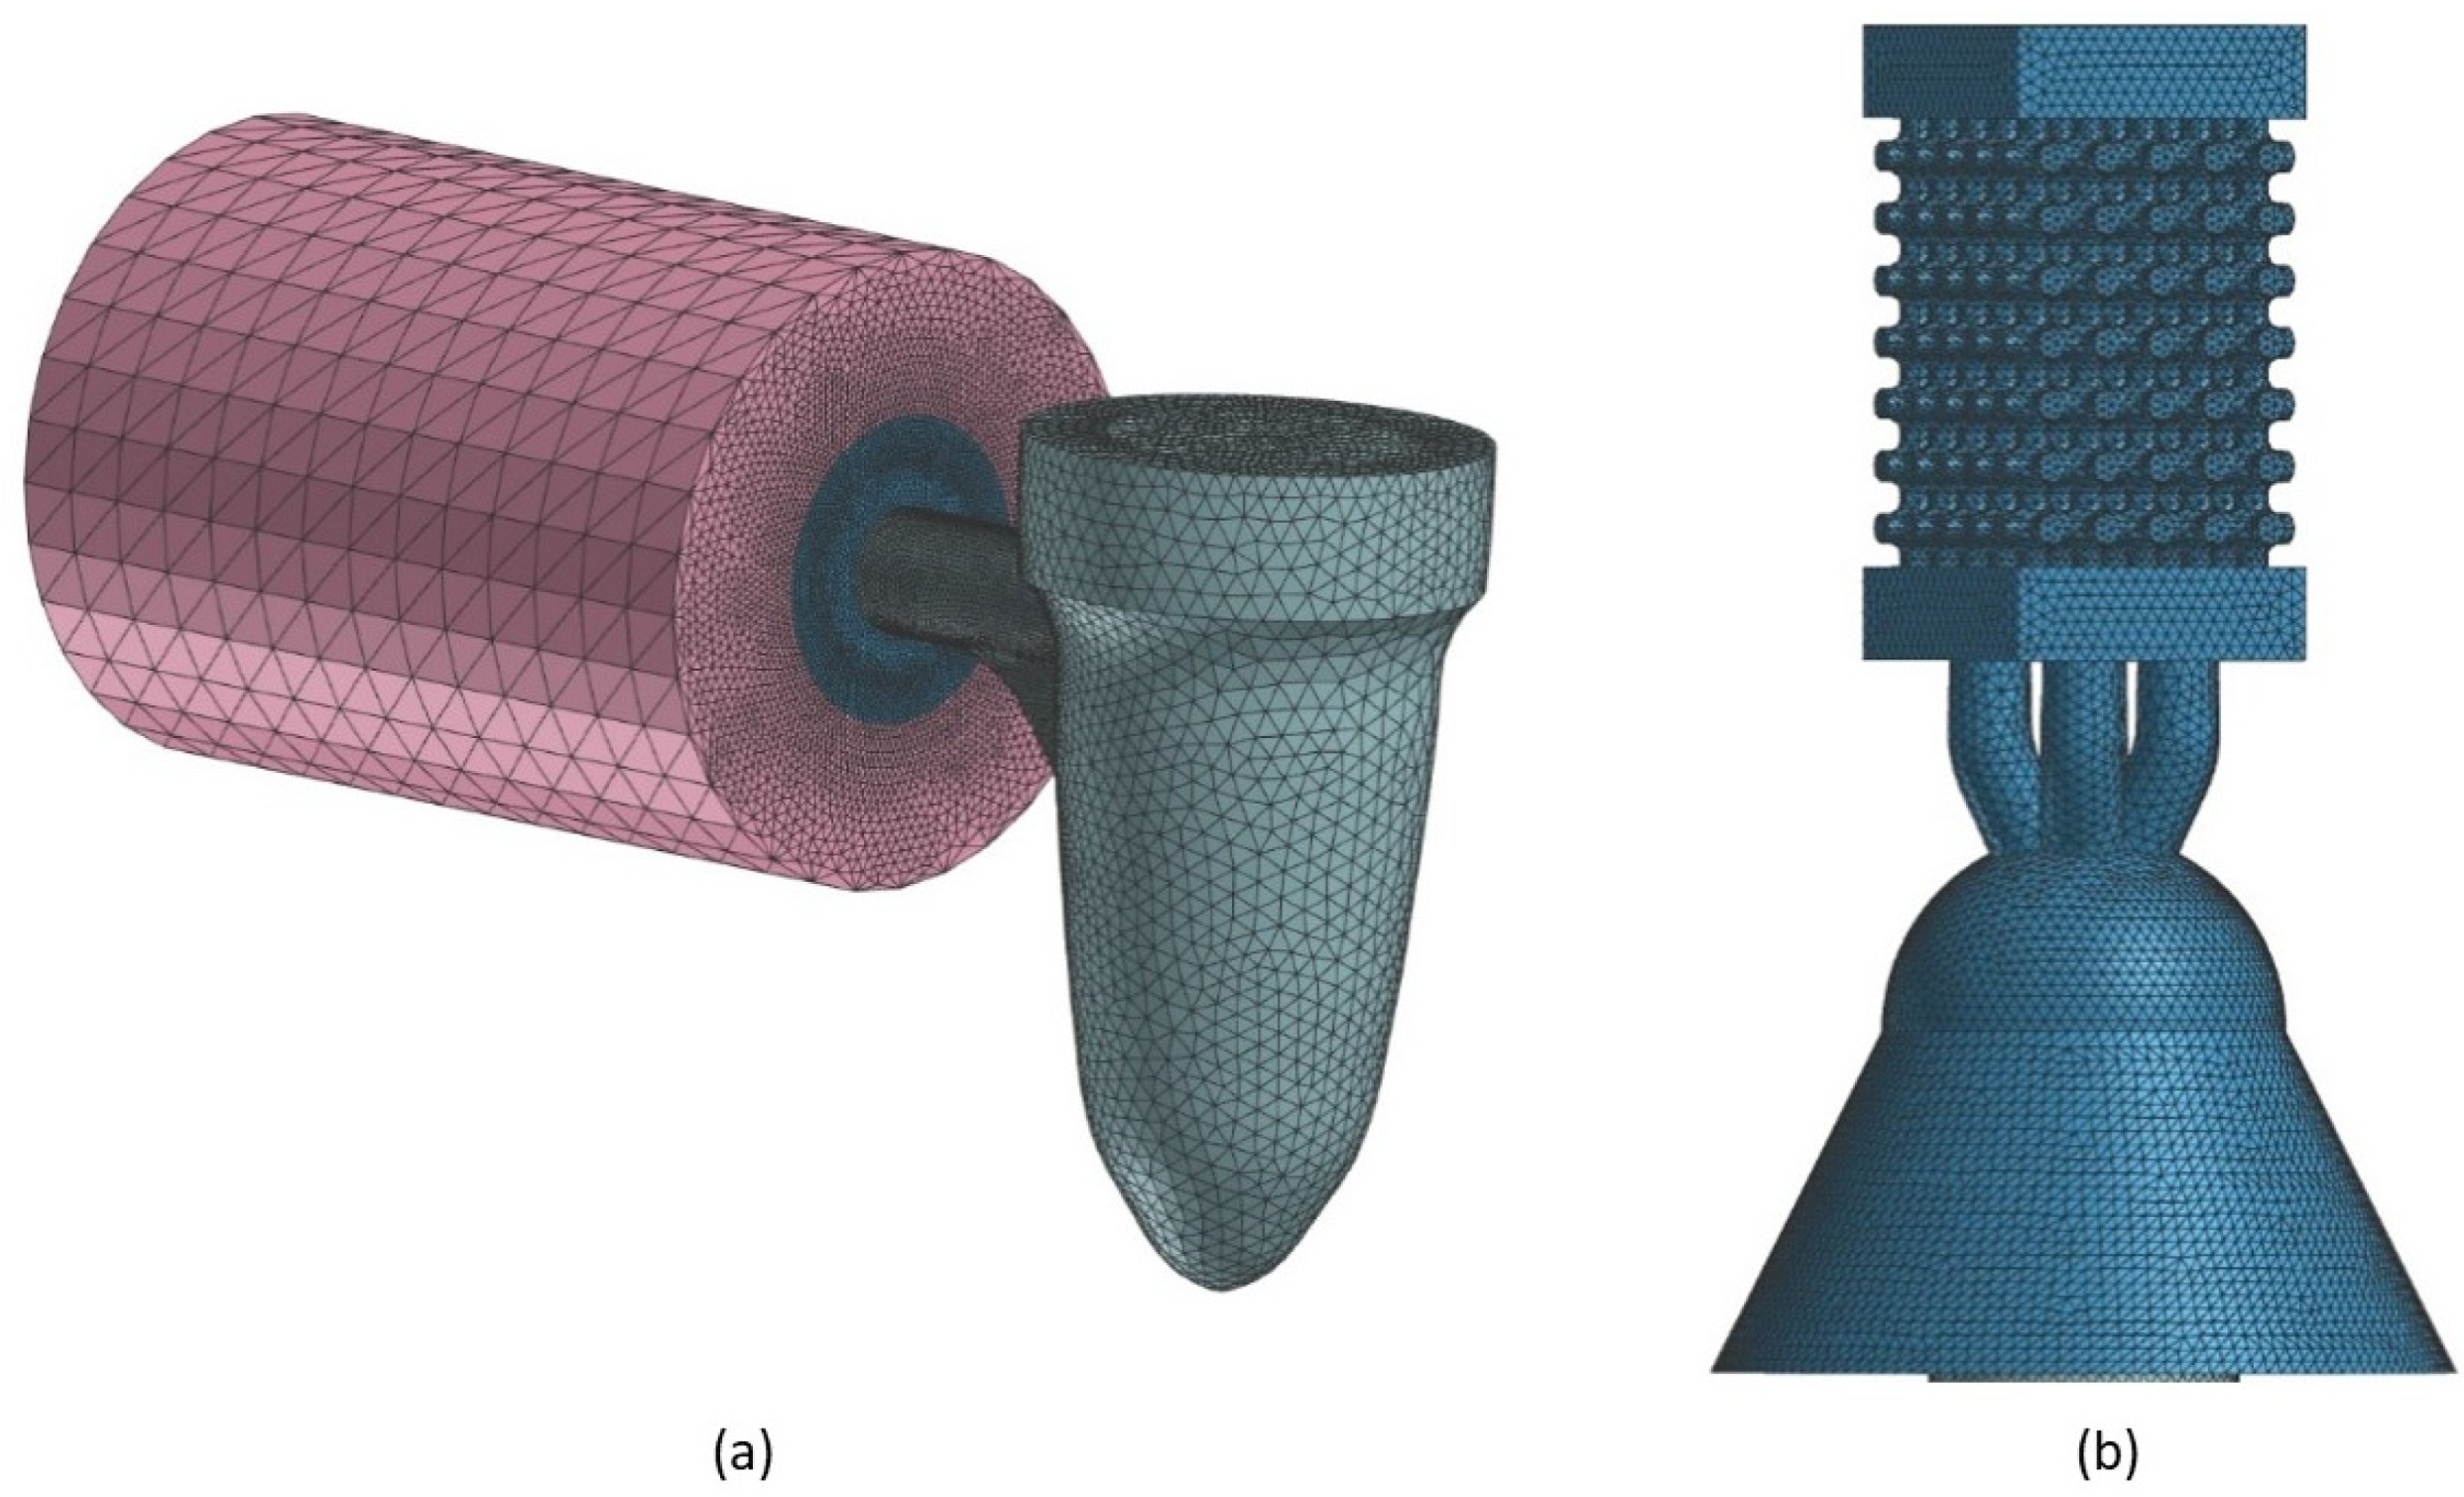
2. Methodology
- I.
- Import the CAD geometry (using .igs file format);
- II.
- Repair, if necessary, the geometry imported from Autodesk Inventor to ensure the geometry has a closed volume (using the Repair tool);
- III.
- Create the mold with a cylinder geometry (Basic Shapes and Cylinder tools);
- IV.
- Check for overlapping surface zones and create and merge volumes (Assembly tool);
- V.
- Create 2D mesh, which will be the basis for the volumetric mesh (Surface Mesh tool);
- VI.
- Check for the quality of the surface mesh and eliminate cracking, overlapping, intersection, poor-quality and coincident boundary nodes (Check Surface Mesh tool);
- VII.
- Create 3D mesh using tetrahedral elements (Tetra Mesh tool).
- I.
- Gravity Vector;
- II.
- Volume Manager;
- III.
- Interface HTC Manager;
- IV.
- Process Condition Manager;
- V.
- Simulate Parameters.
3. Mathematical Modeling
3.1. Turbulence Modeling
- I.
- Replacing the transport equation for ε in the standard k–ε model with a similar transport equation that models the dissipation rate according to the dynamic behavior of the mean square vorticity fluctuation in the high turbulent Reynolds Number limit;
- II.
- Replacing the eddy viscosity equation of the standard k–ε model with an eddy viscosity equation that ensures satisfaction of the realizability constraints (for the normal and shear turbulent stress components).
3.2. Porosity Modeling
- -
- Shrink porosity: solidification shrinkage cannot be compensated by incoming liquid flow when feed flow is no longer possible. Consequently, shrinkage porosity is formed.
- -
- Gas porosity: gas porosity is the result of two concomitant mechanisms among solidification, shrinkage and segregation of gases. The higher density of the solid induces a suction of the viscous liquid towards the pasty permeable zone, thus decreasing the pressure in the liquid. Being segregated in the remaining part of the liquid, the gas in the liquid can reach a concentration that exceeds the solubility limit, especially since this limit decreases with the temperature, and the pressure of the liquid. Nucleation and pore growth must be considered at this stage.
4. Results and Discussion
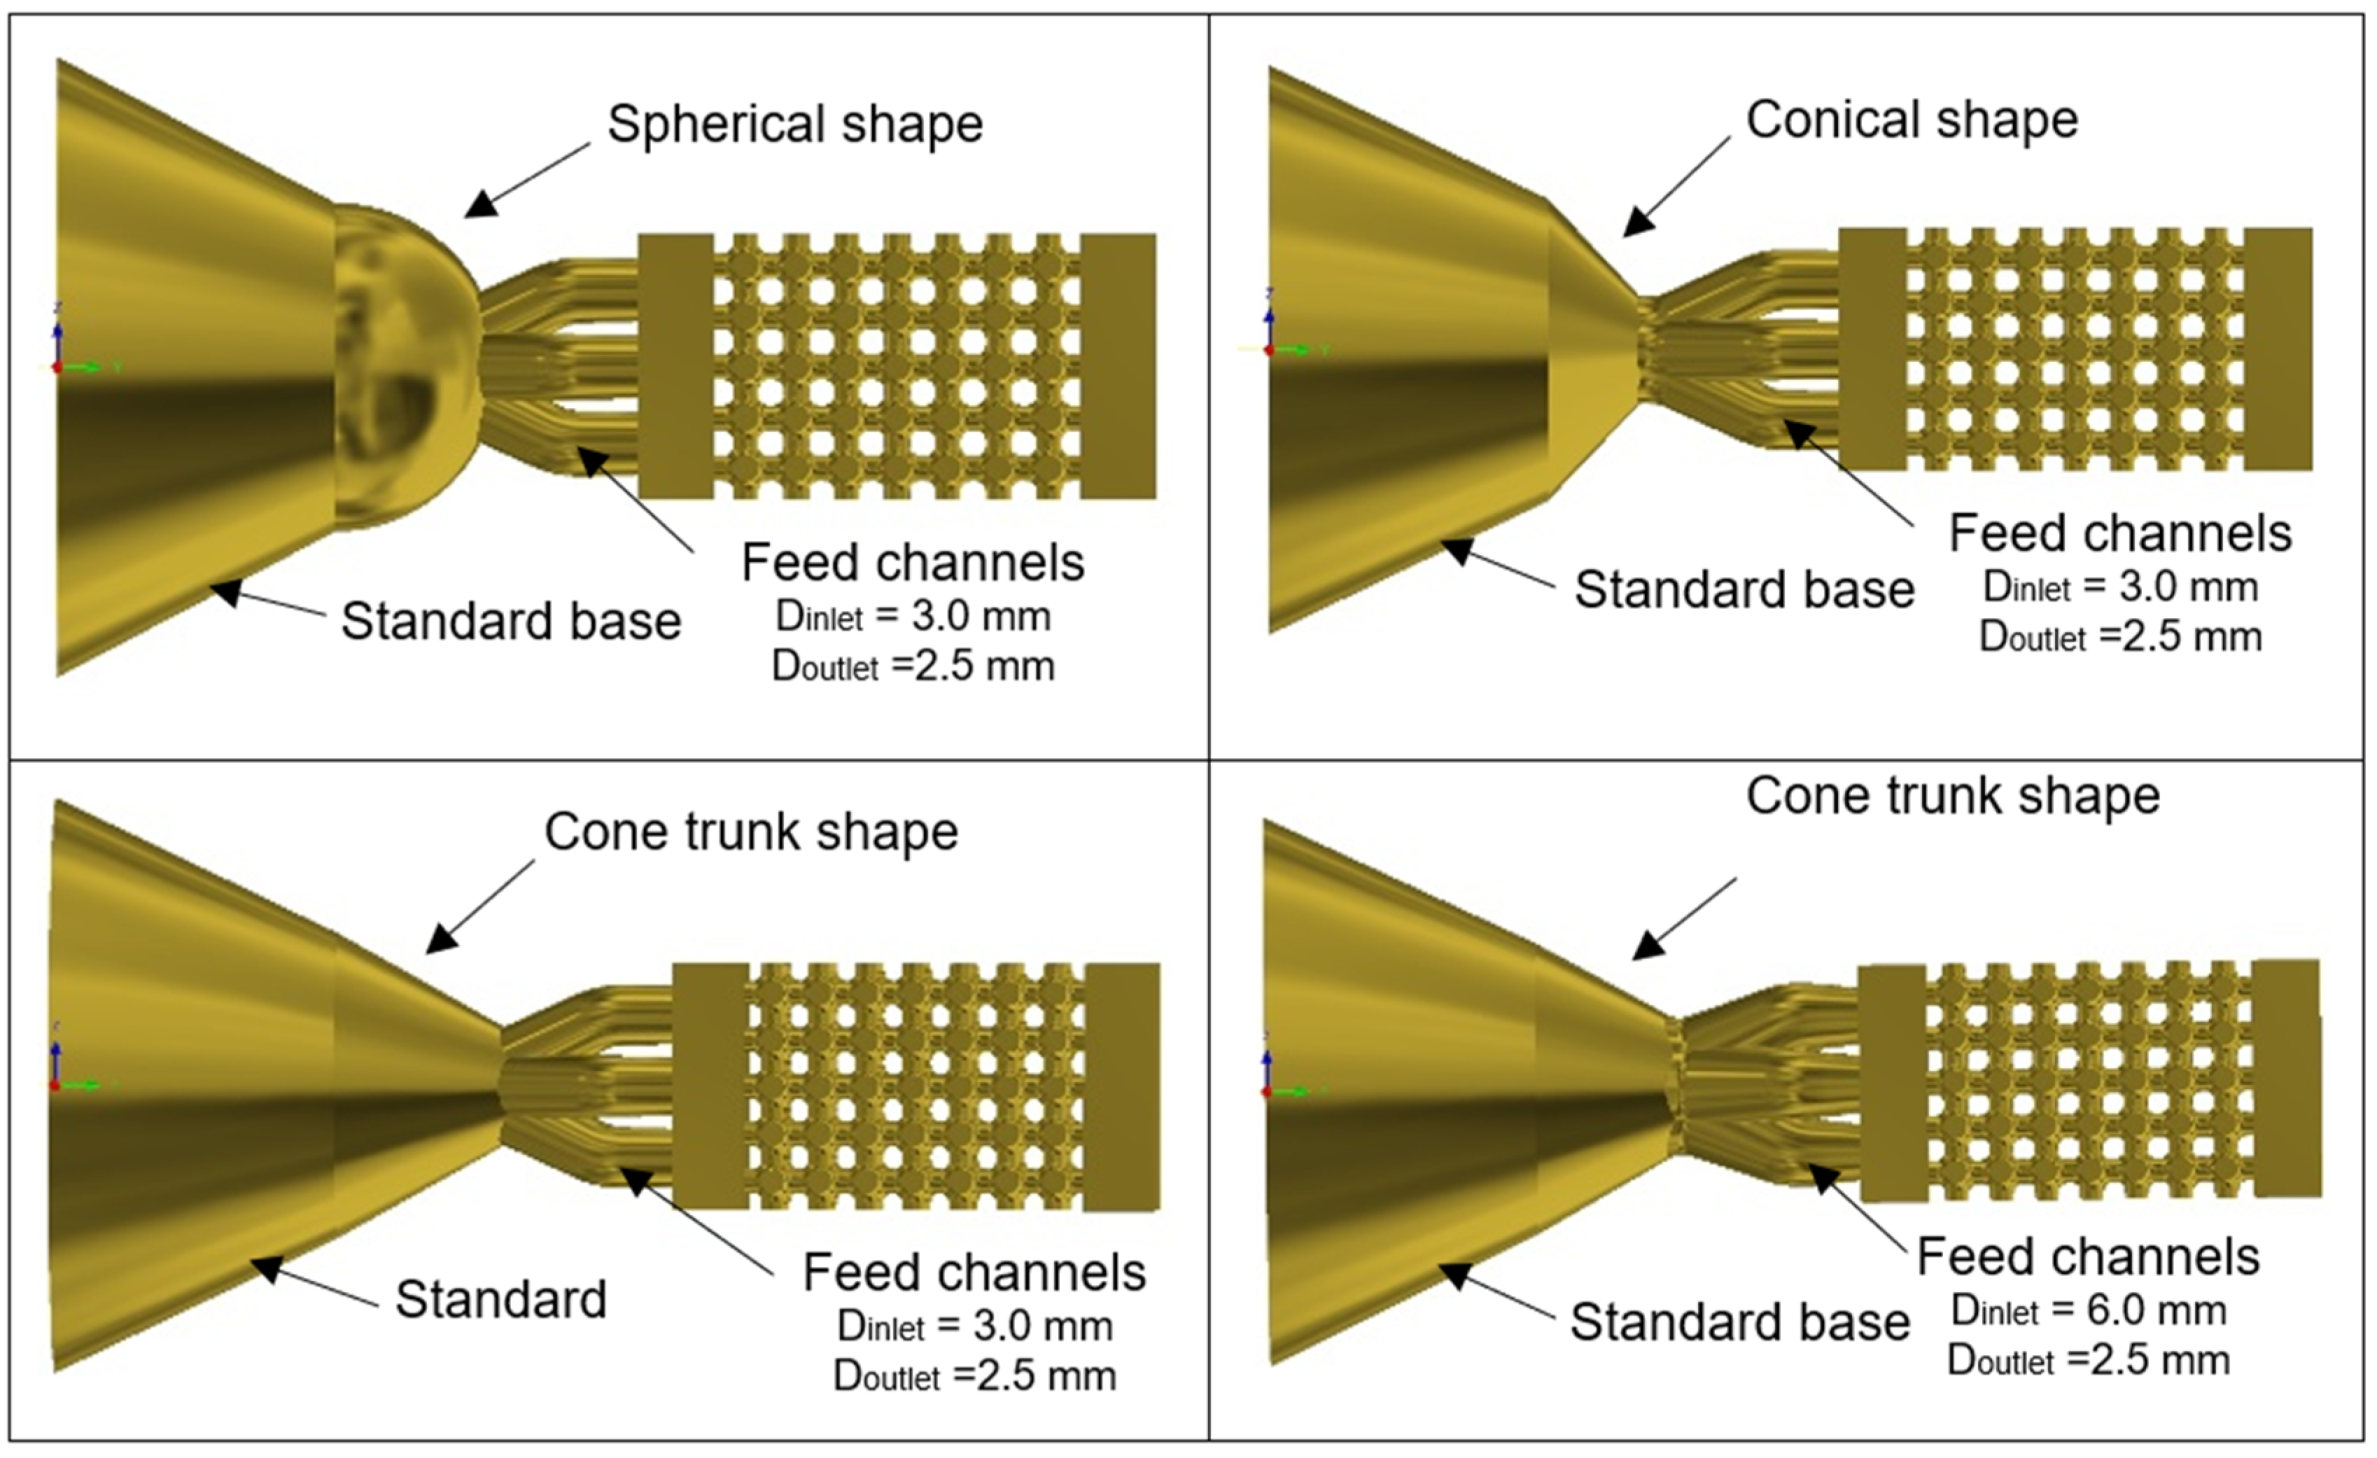
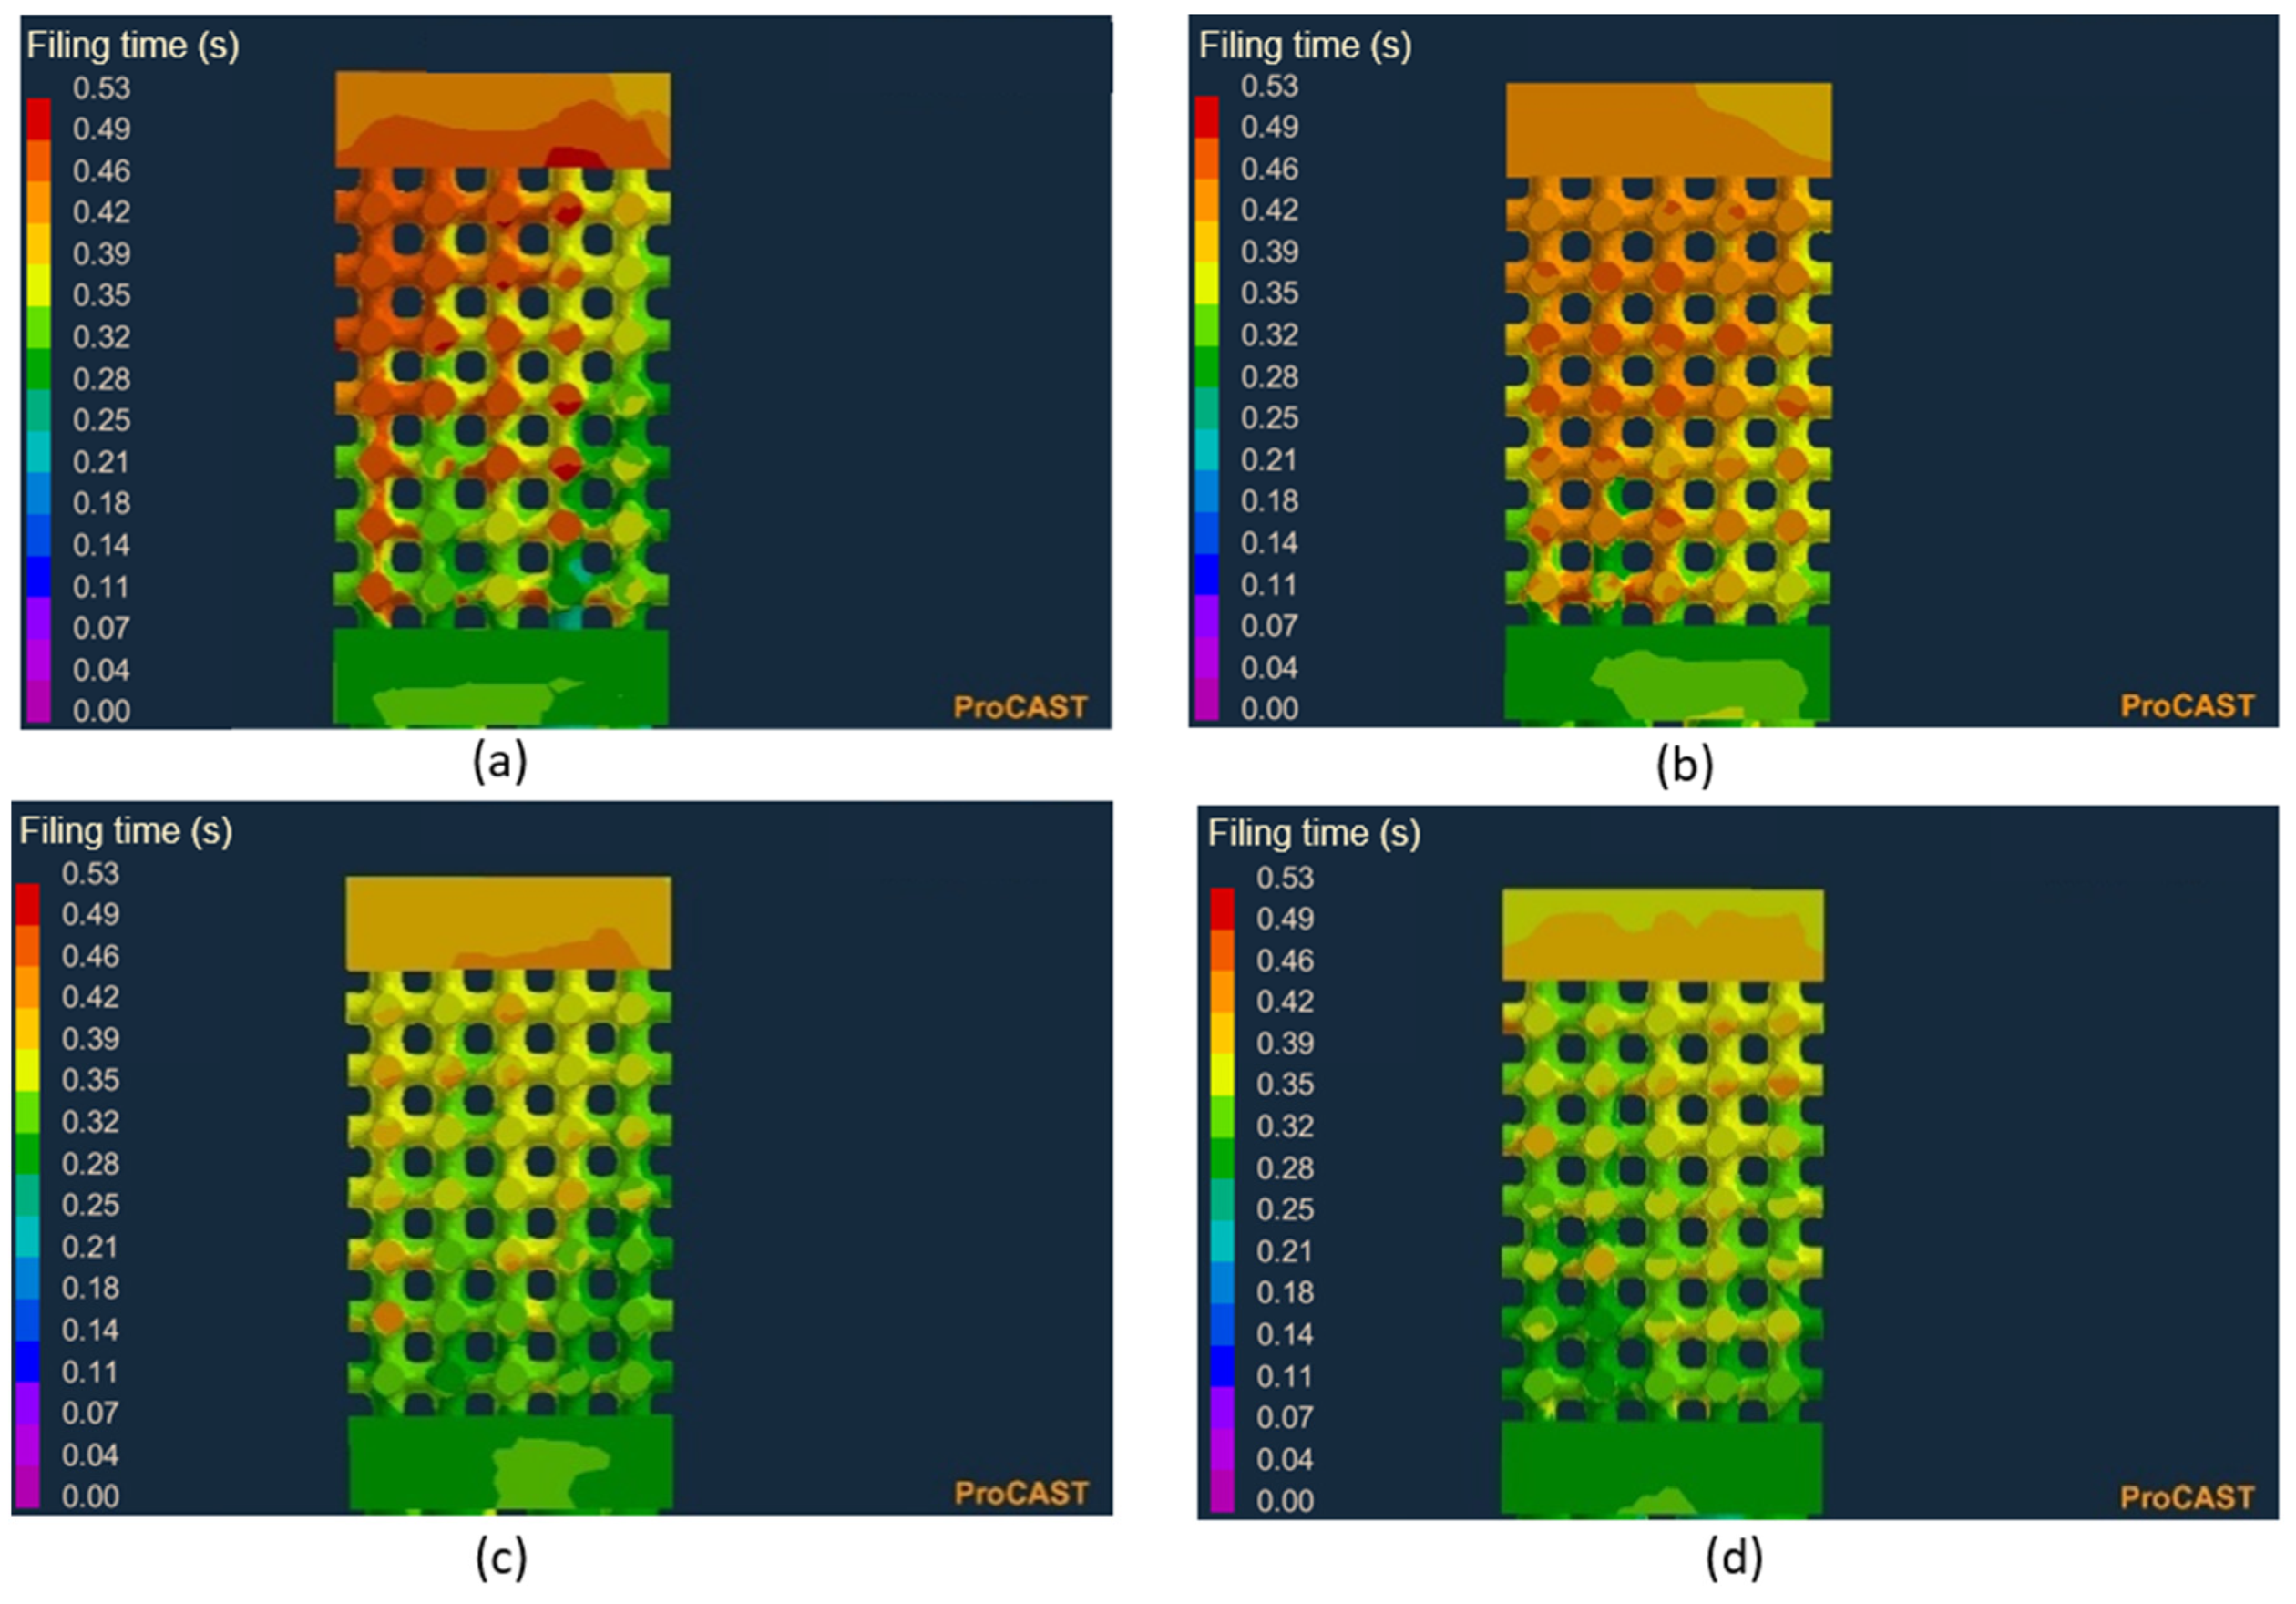
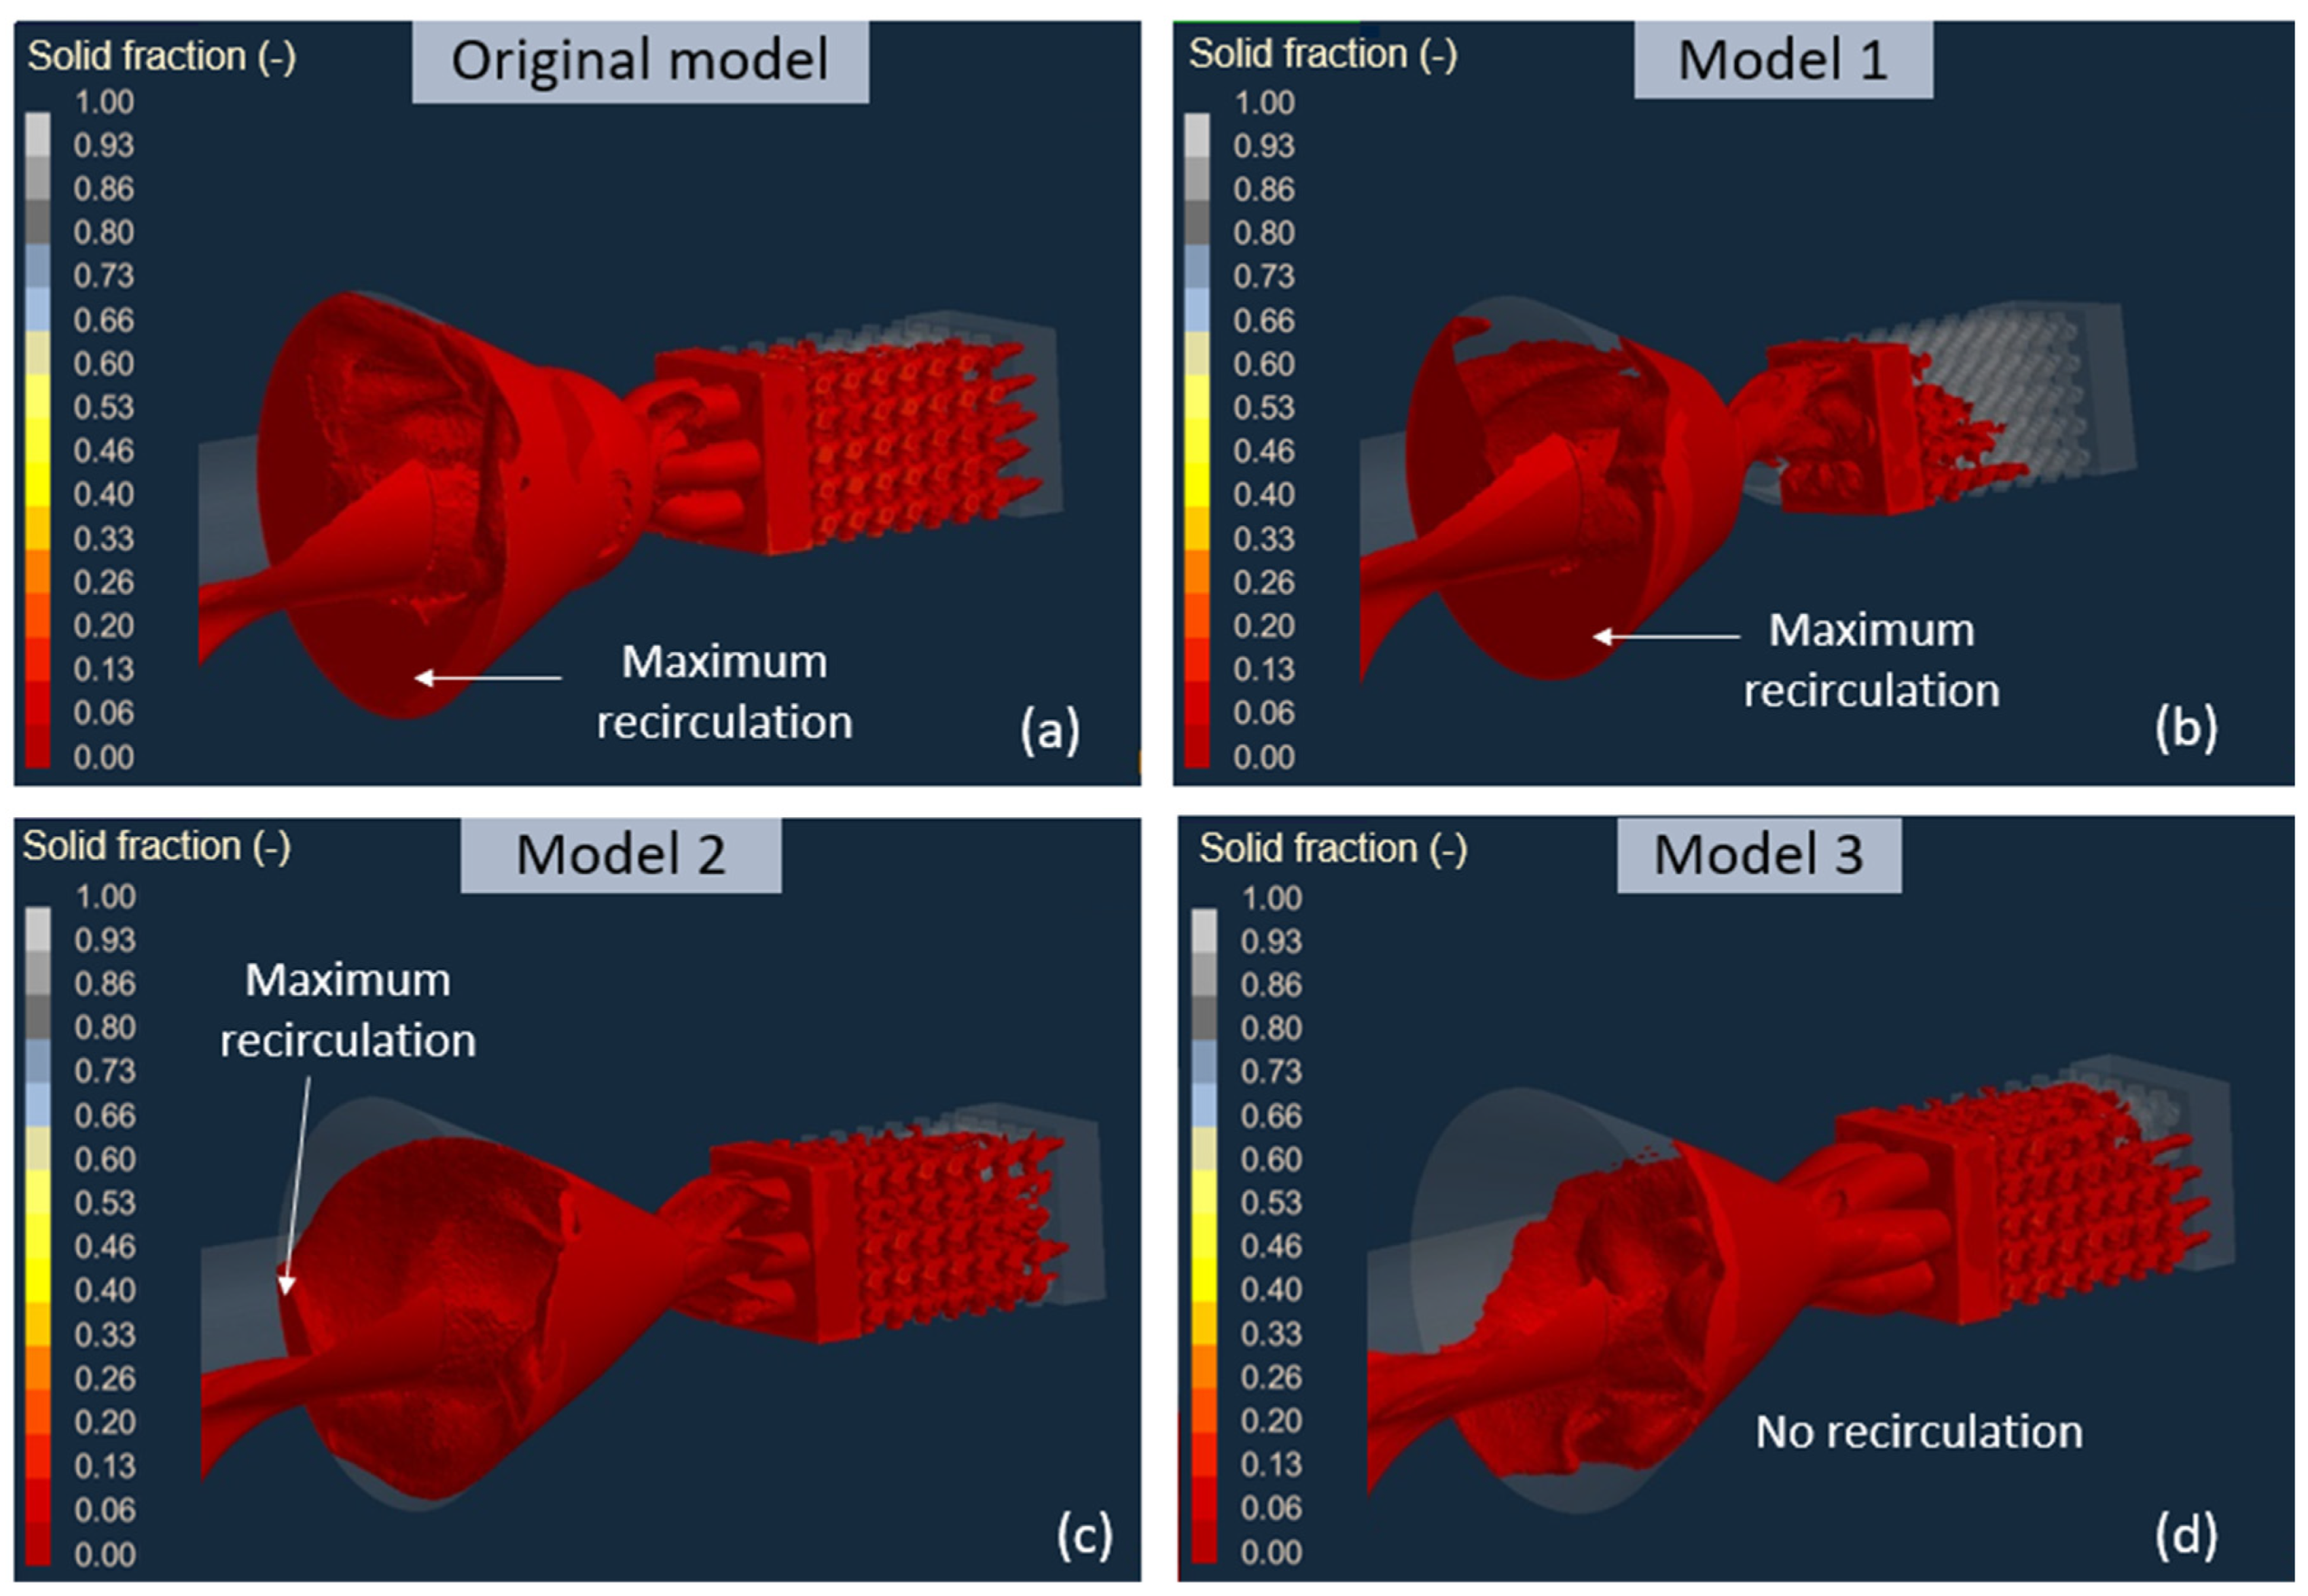
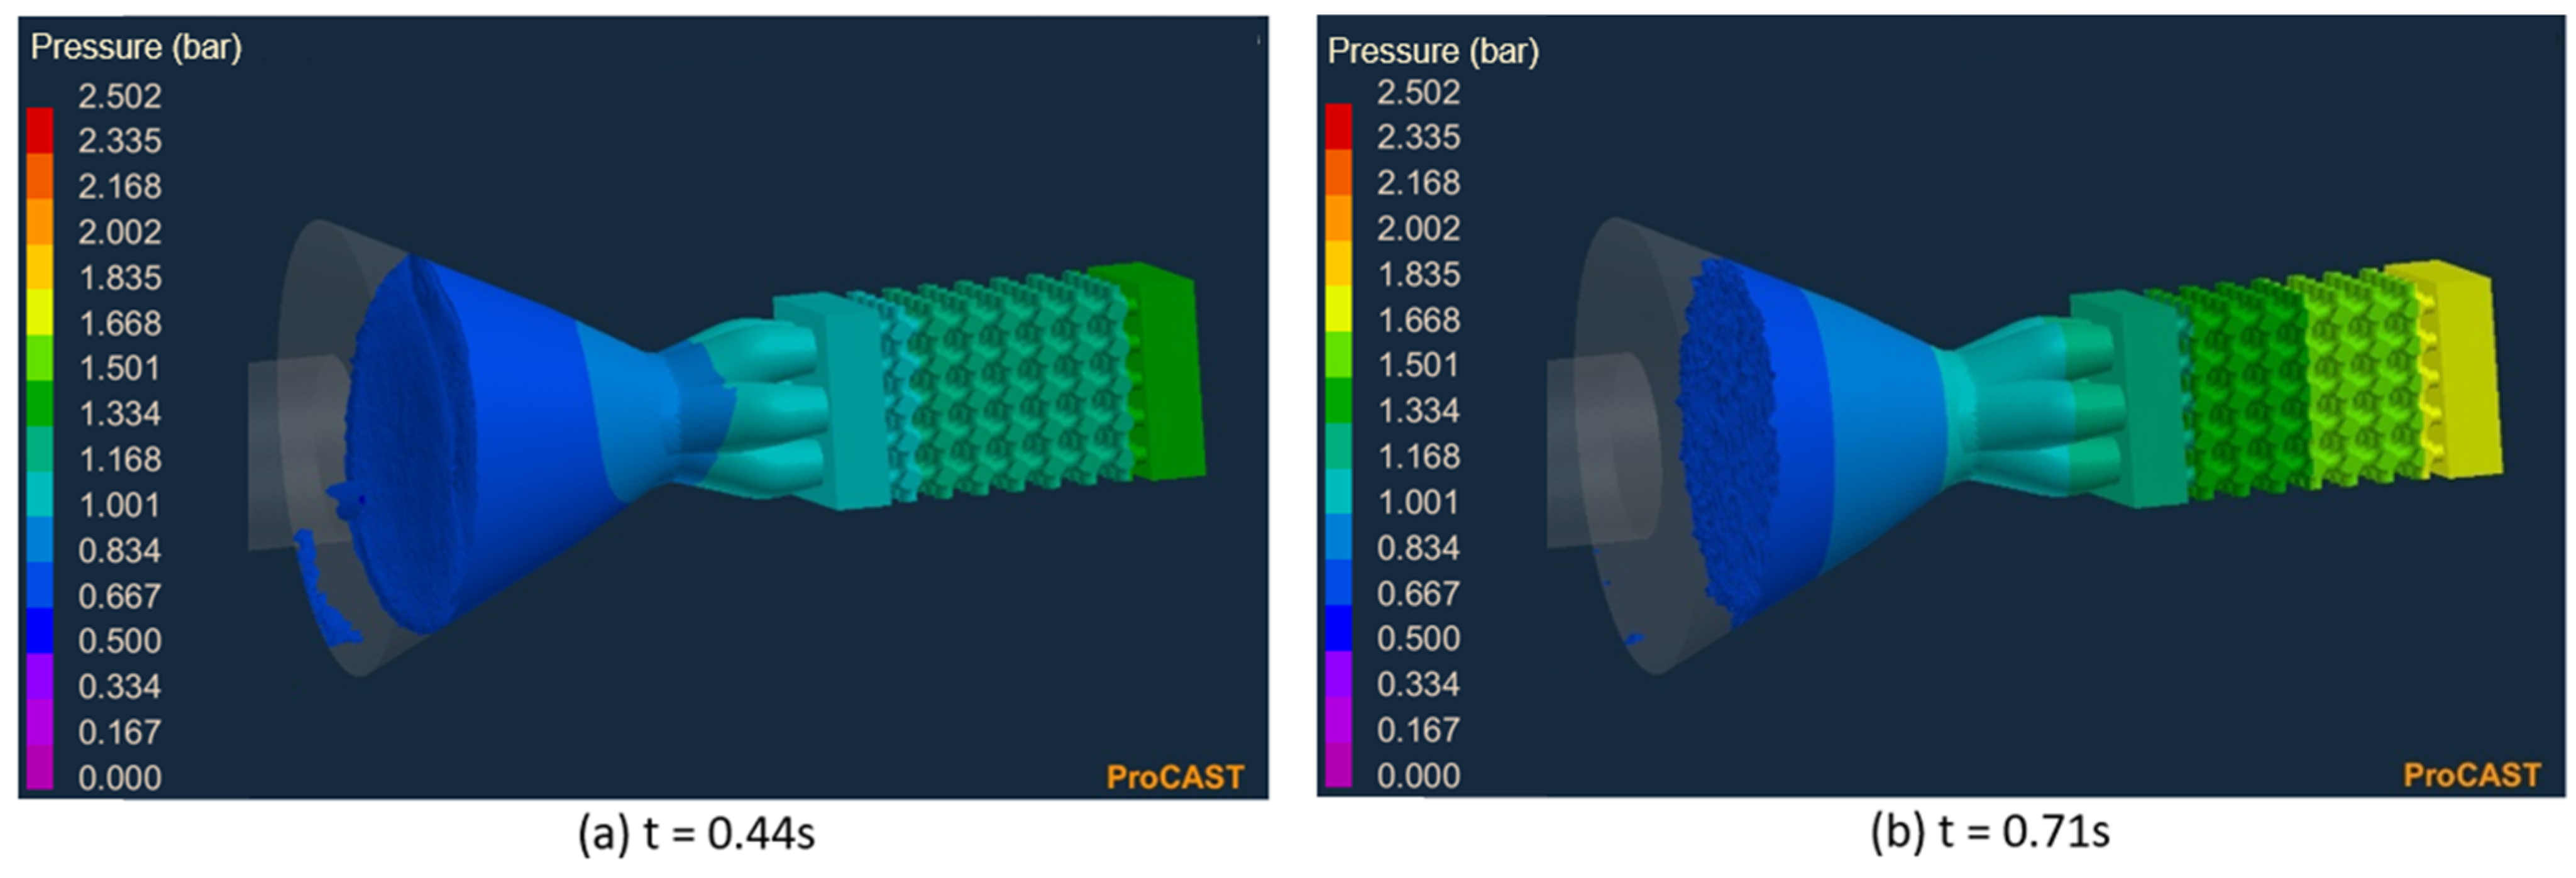
4.1. Converging Nozzle Optimization: Simulation
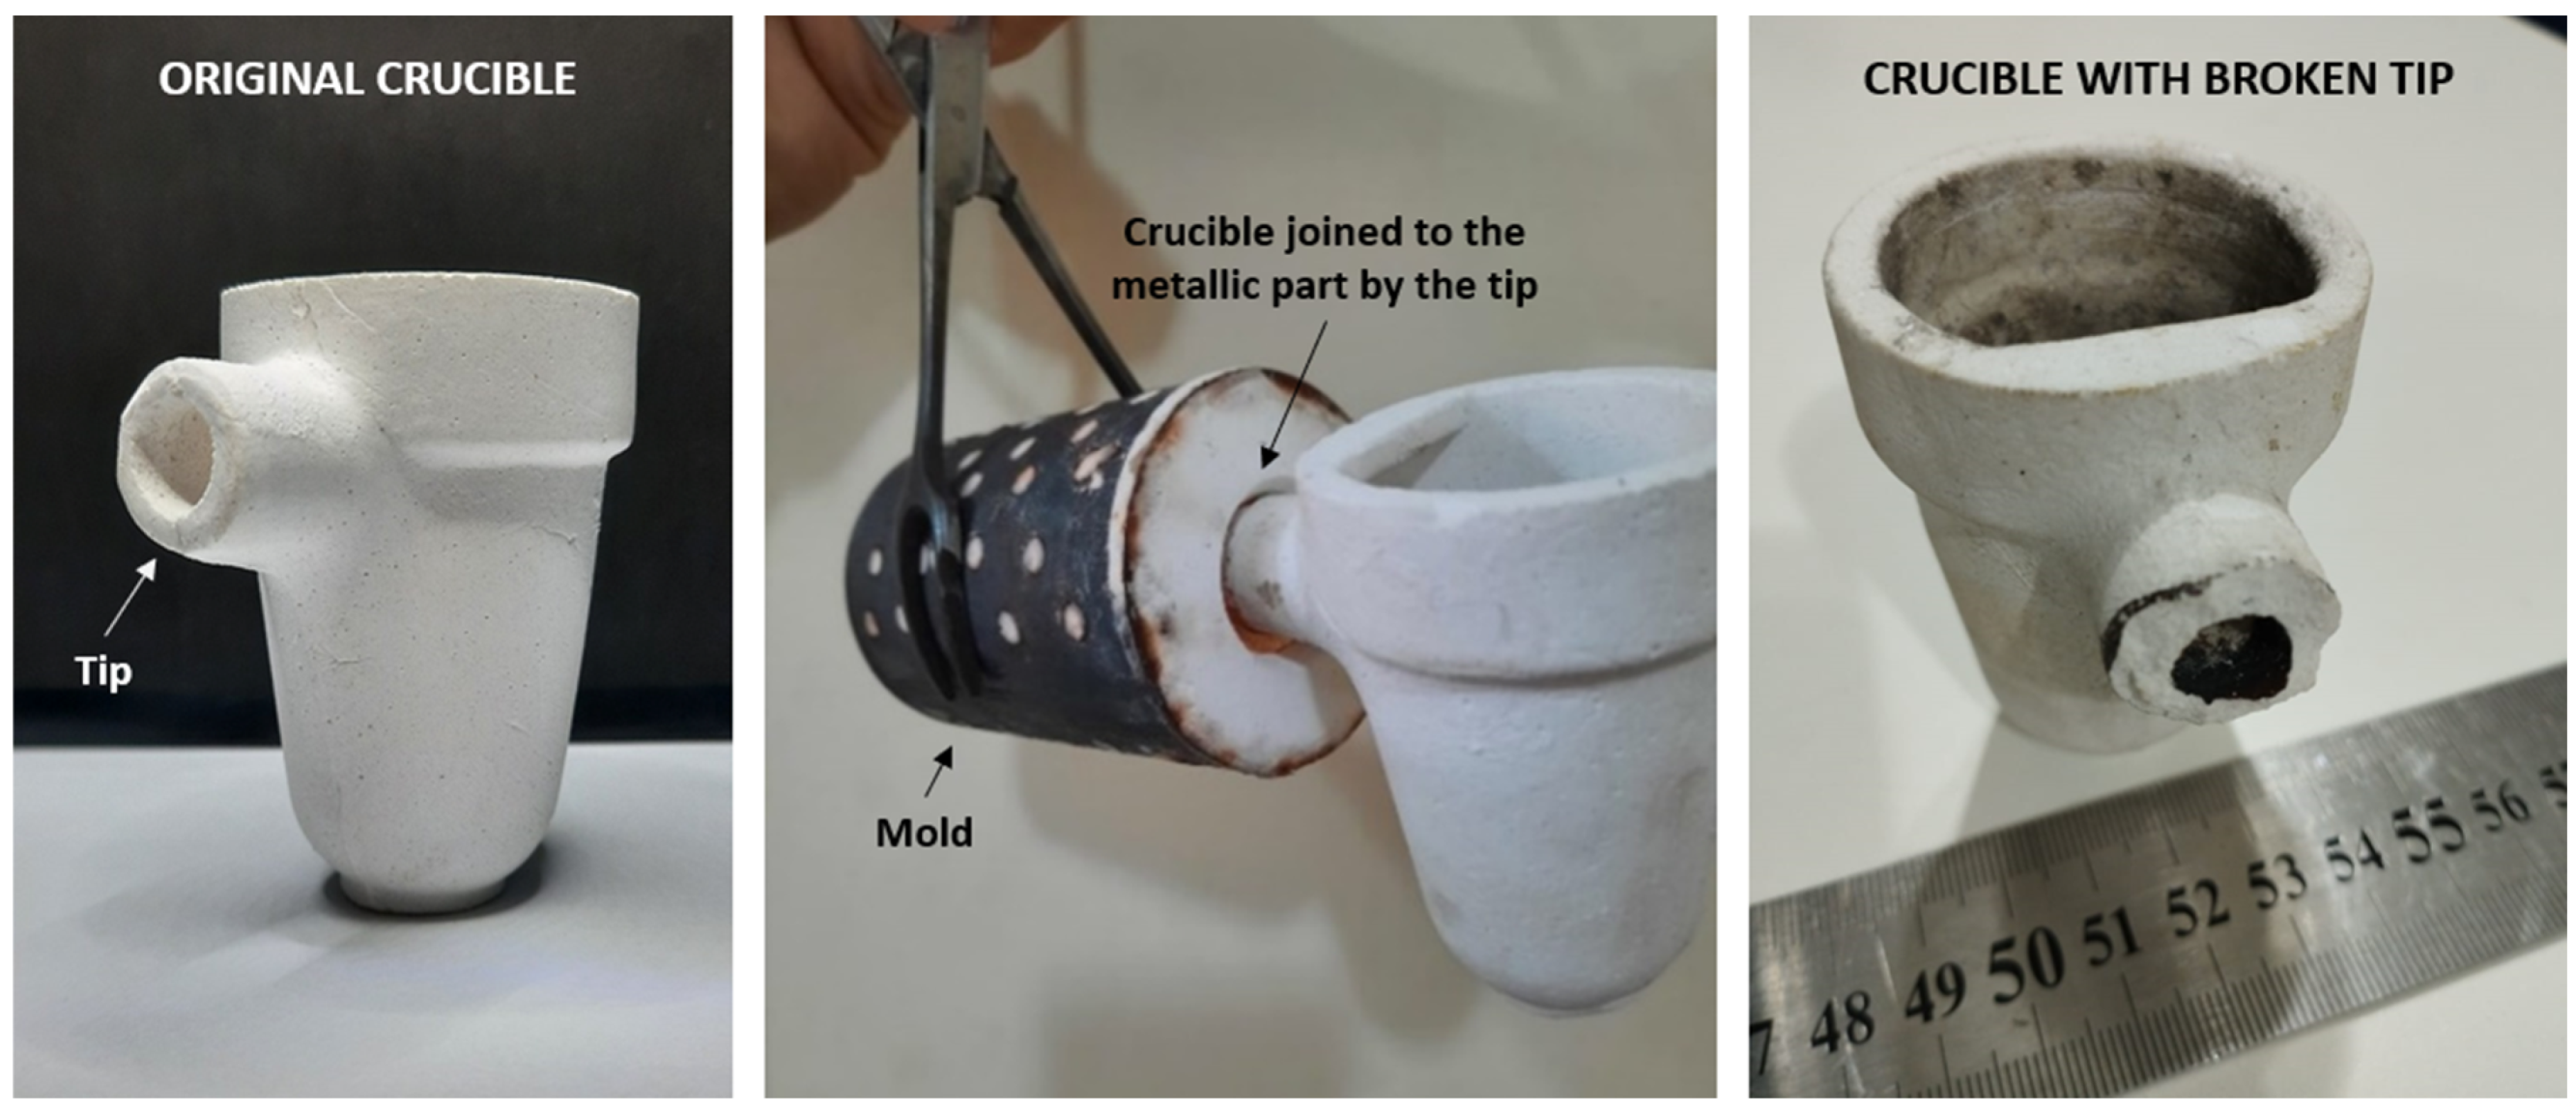
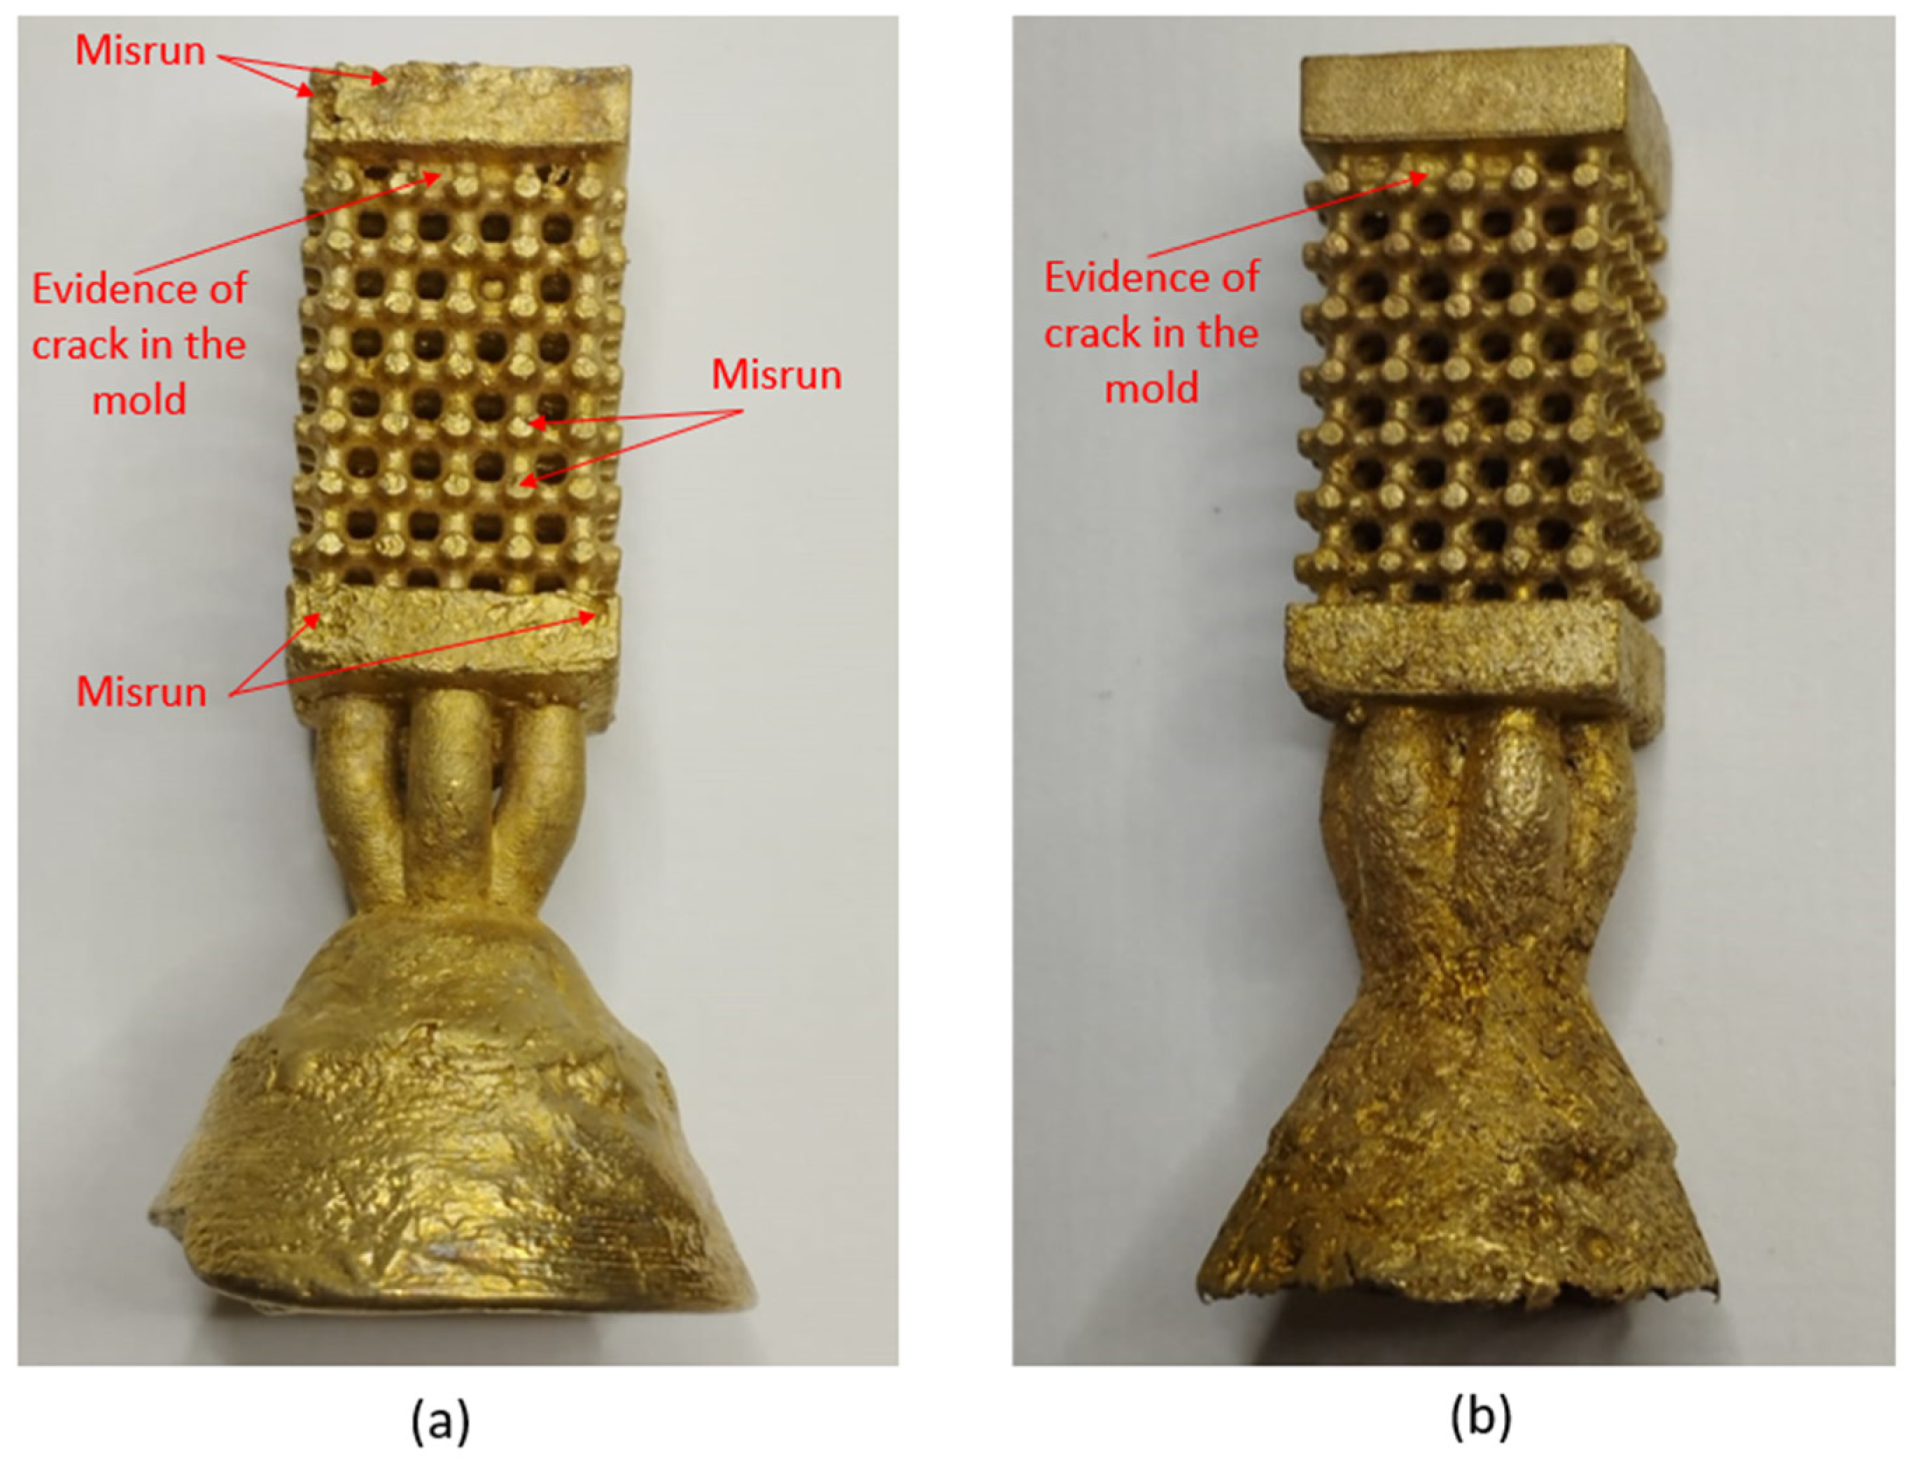
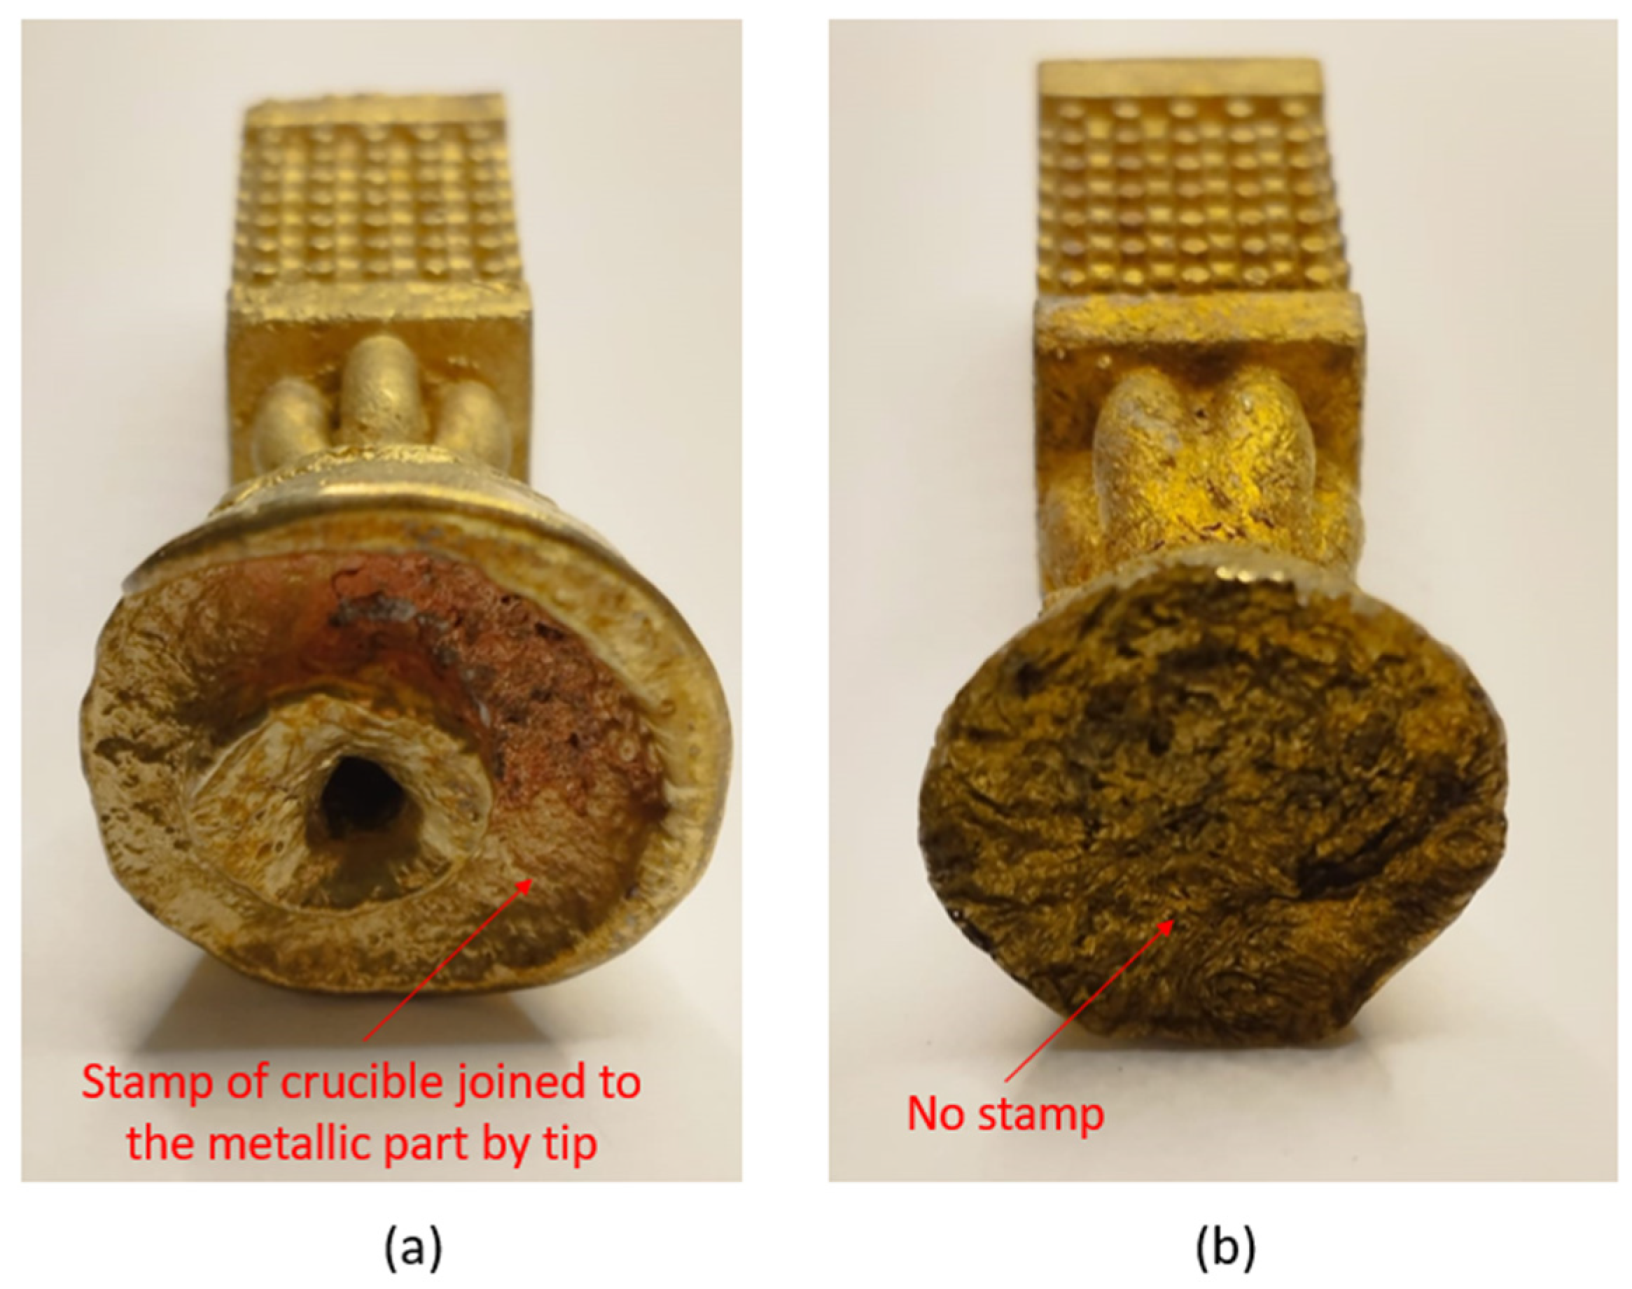
4.2. Converging Nozzle Optimization: Experiments
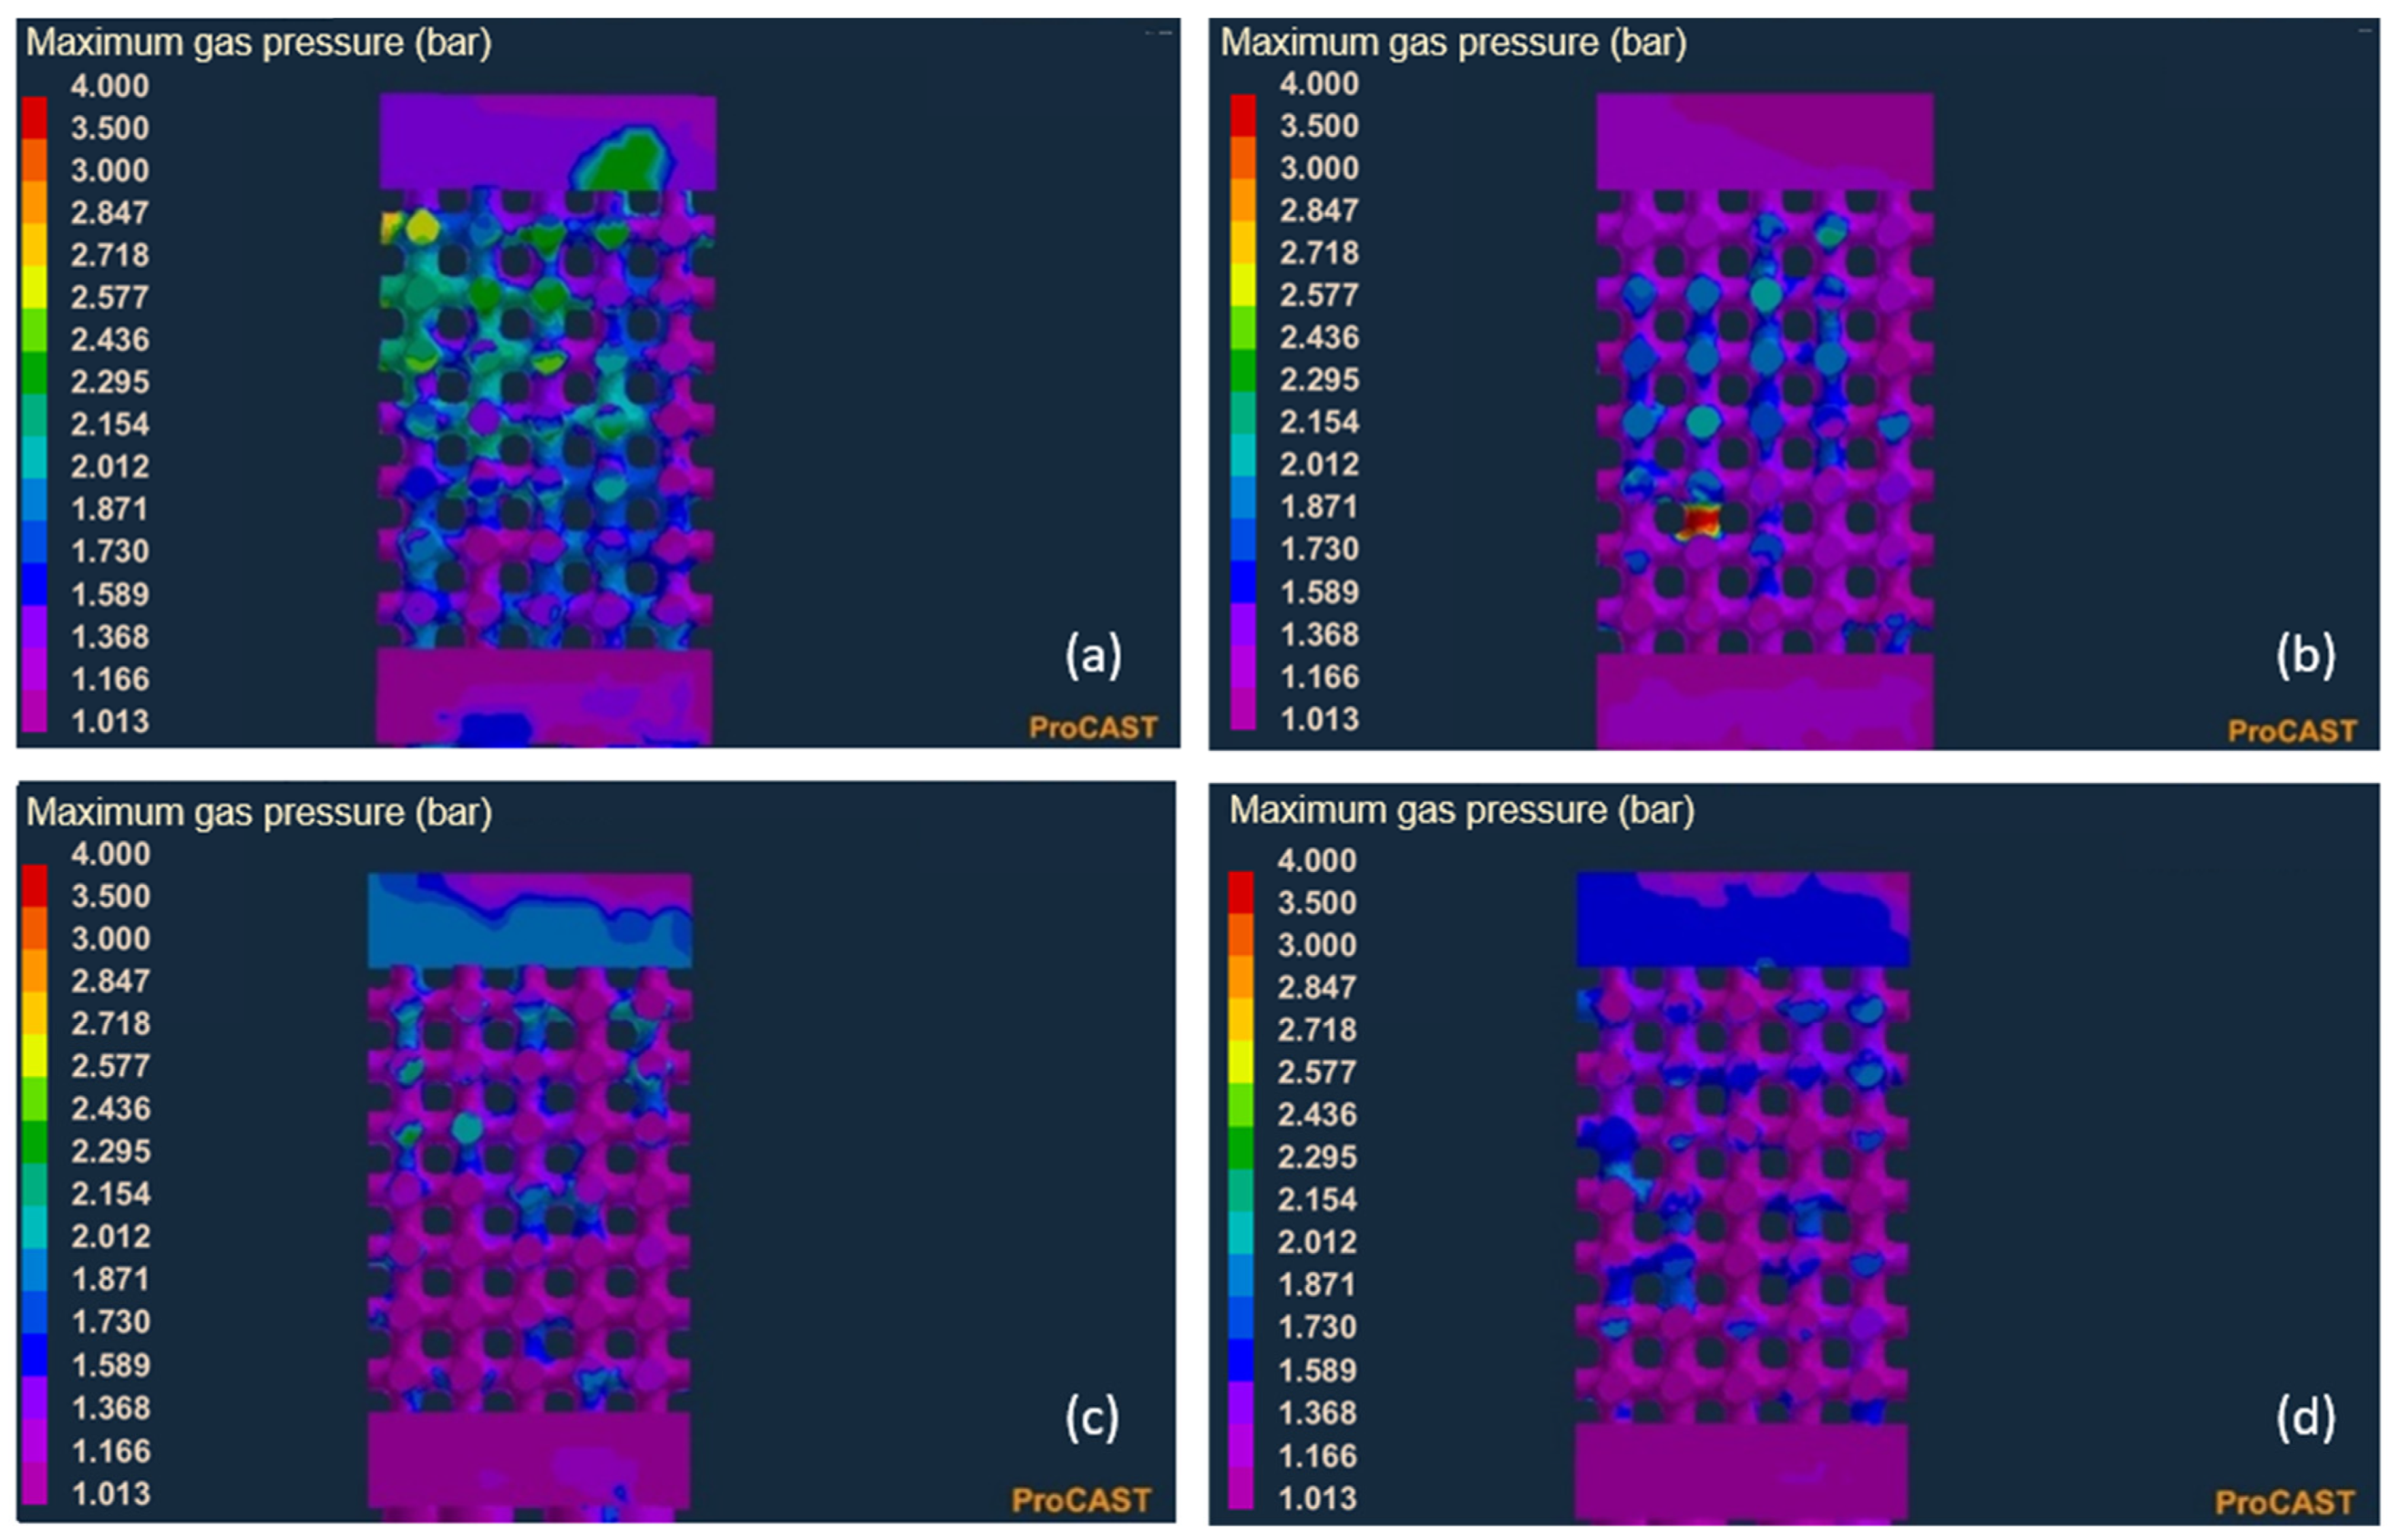
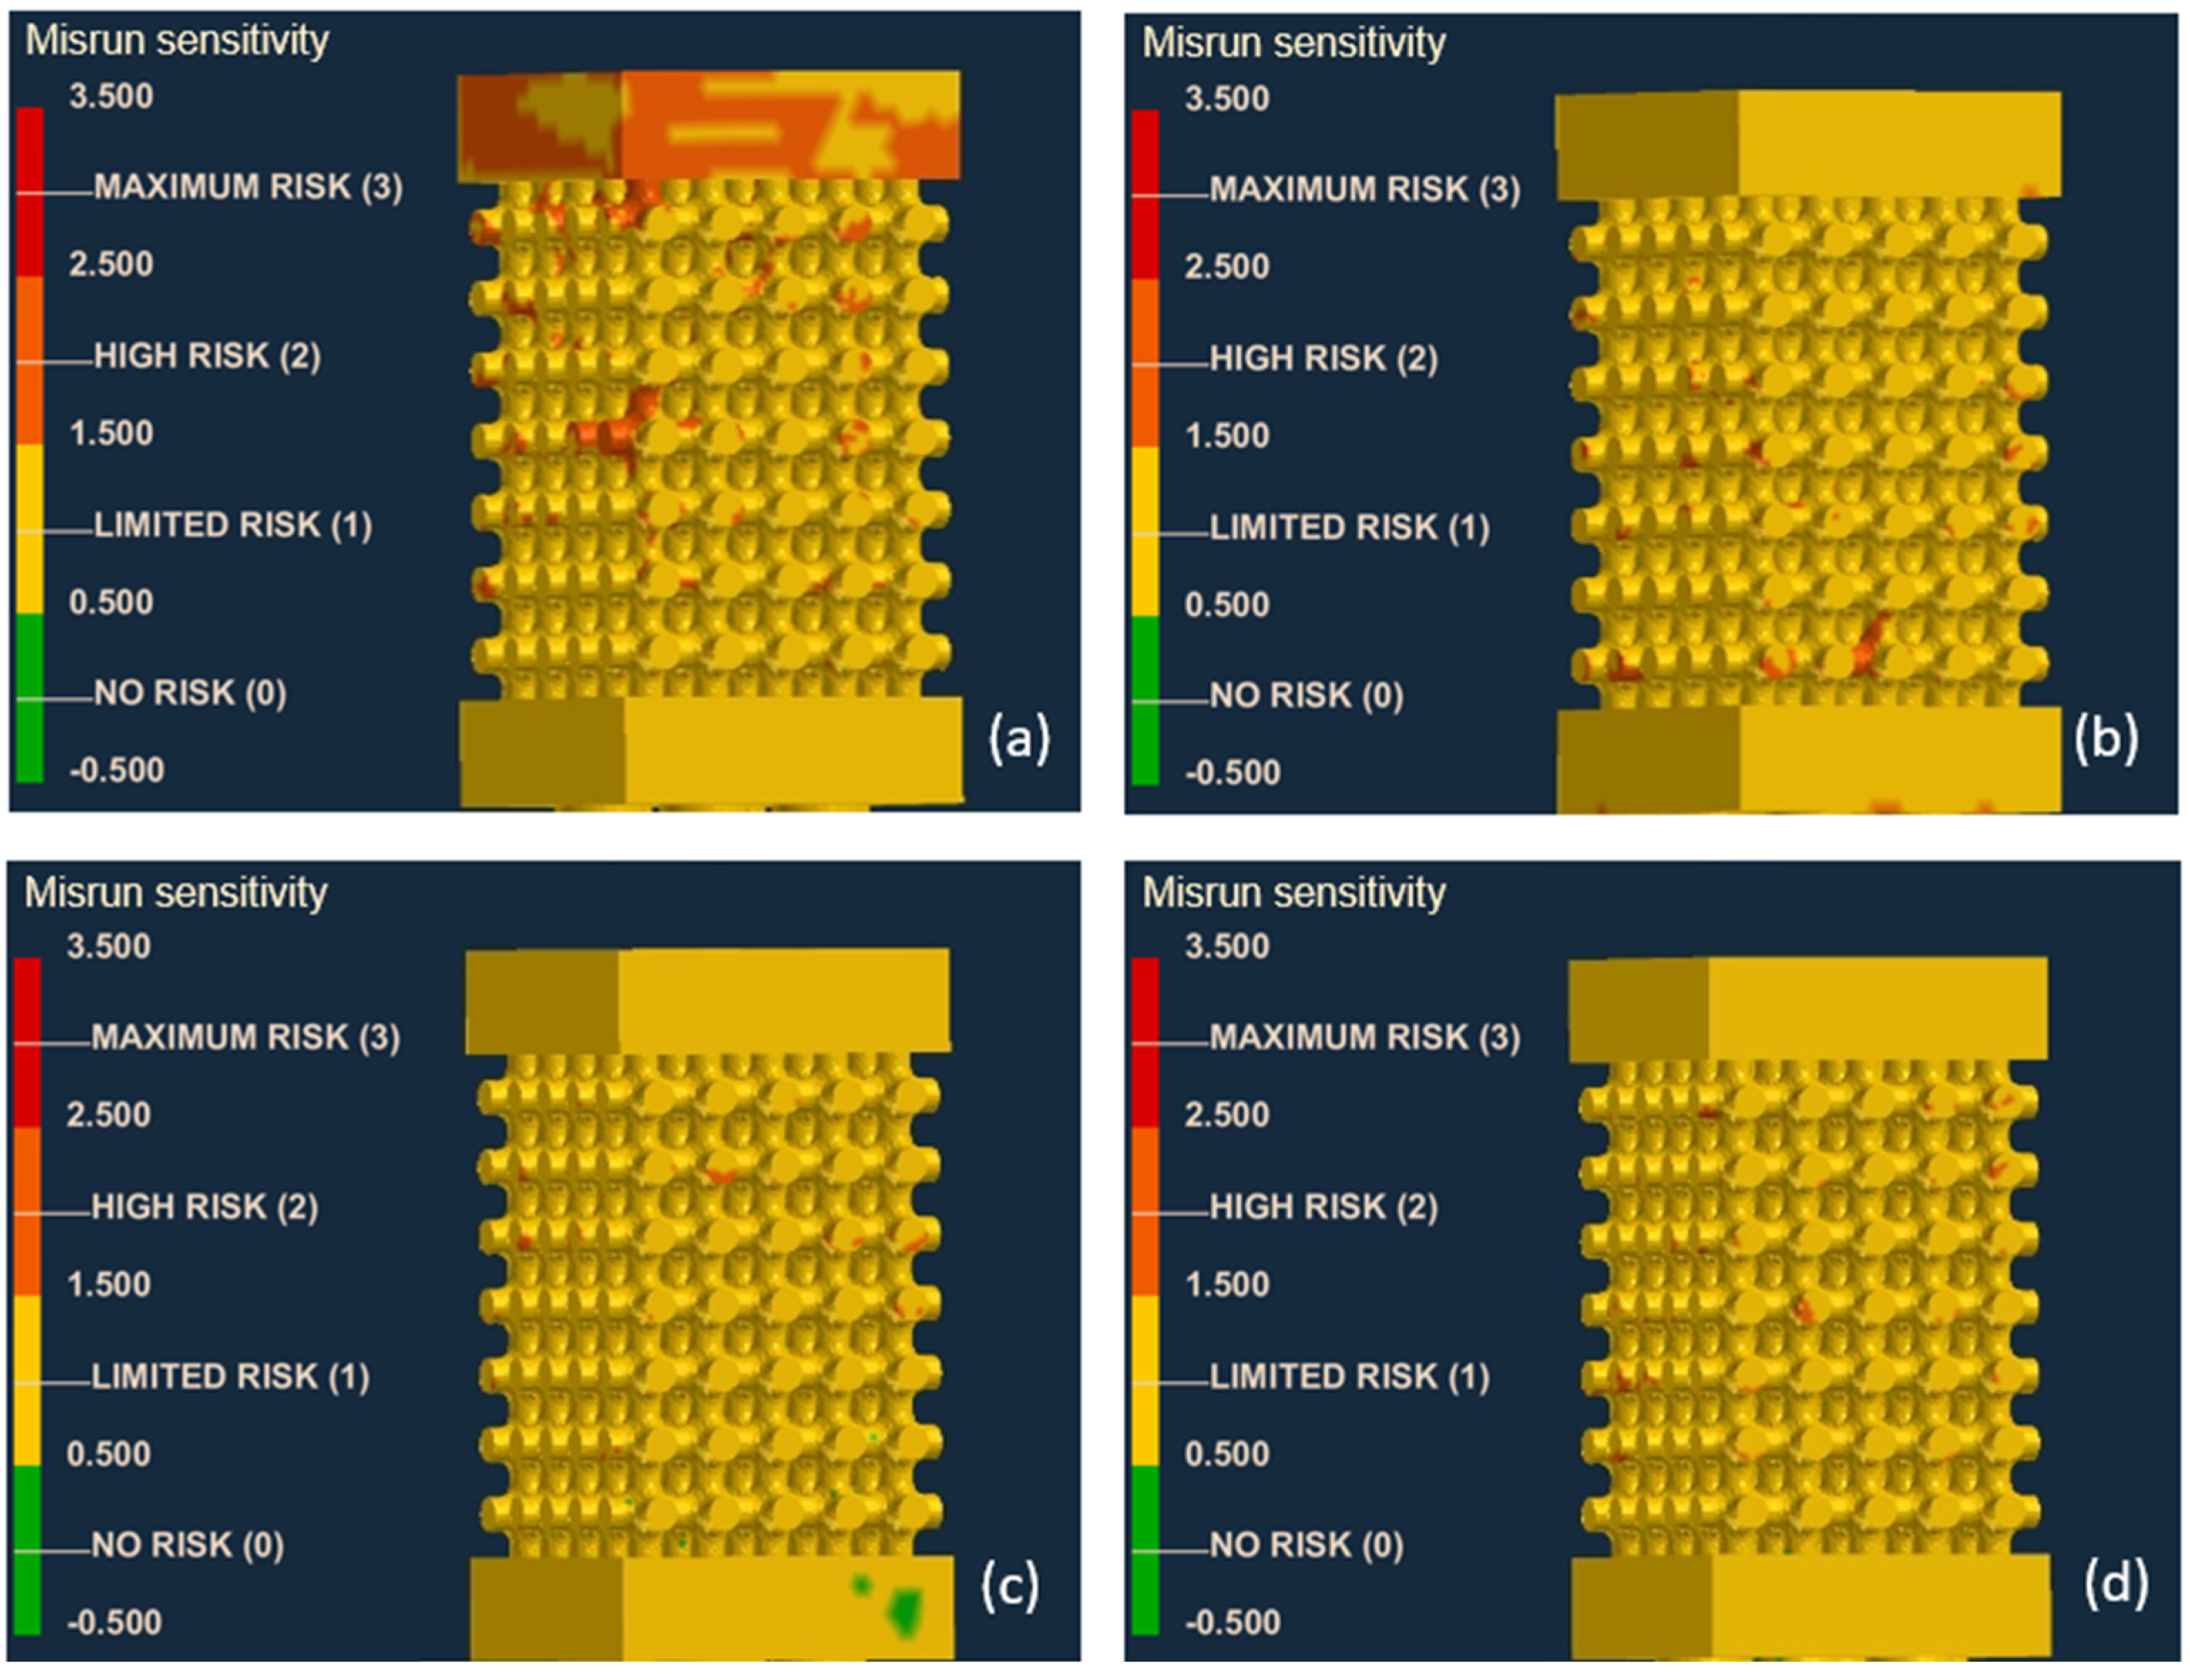
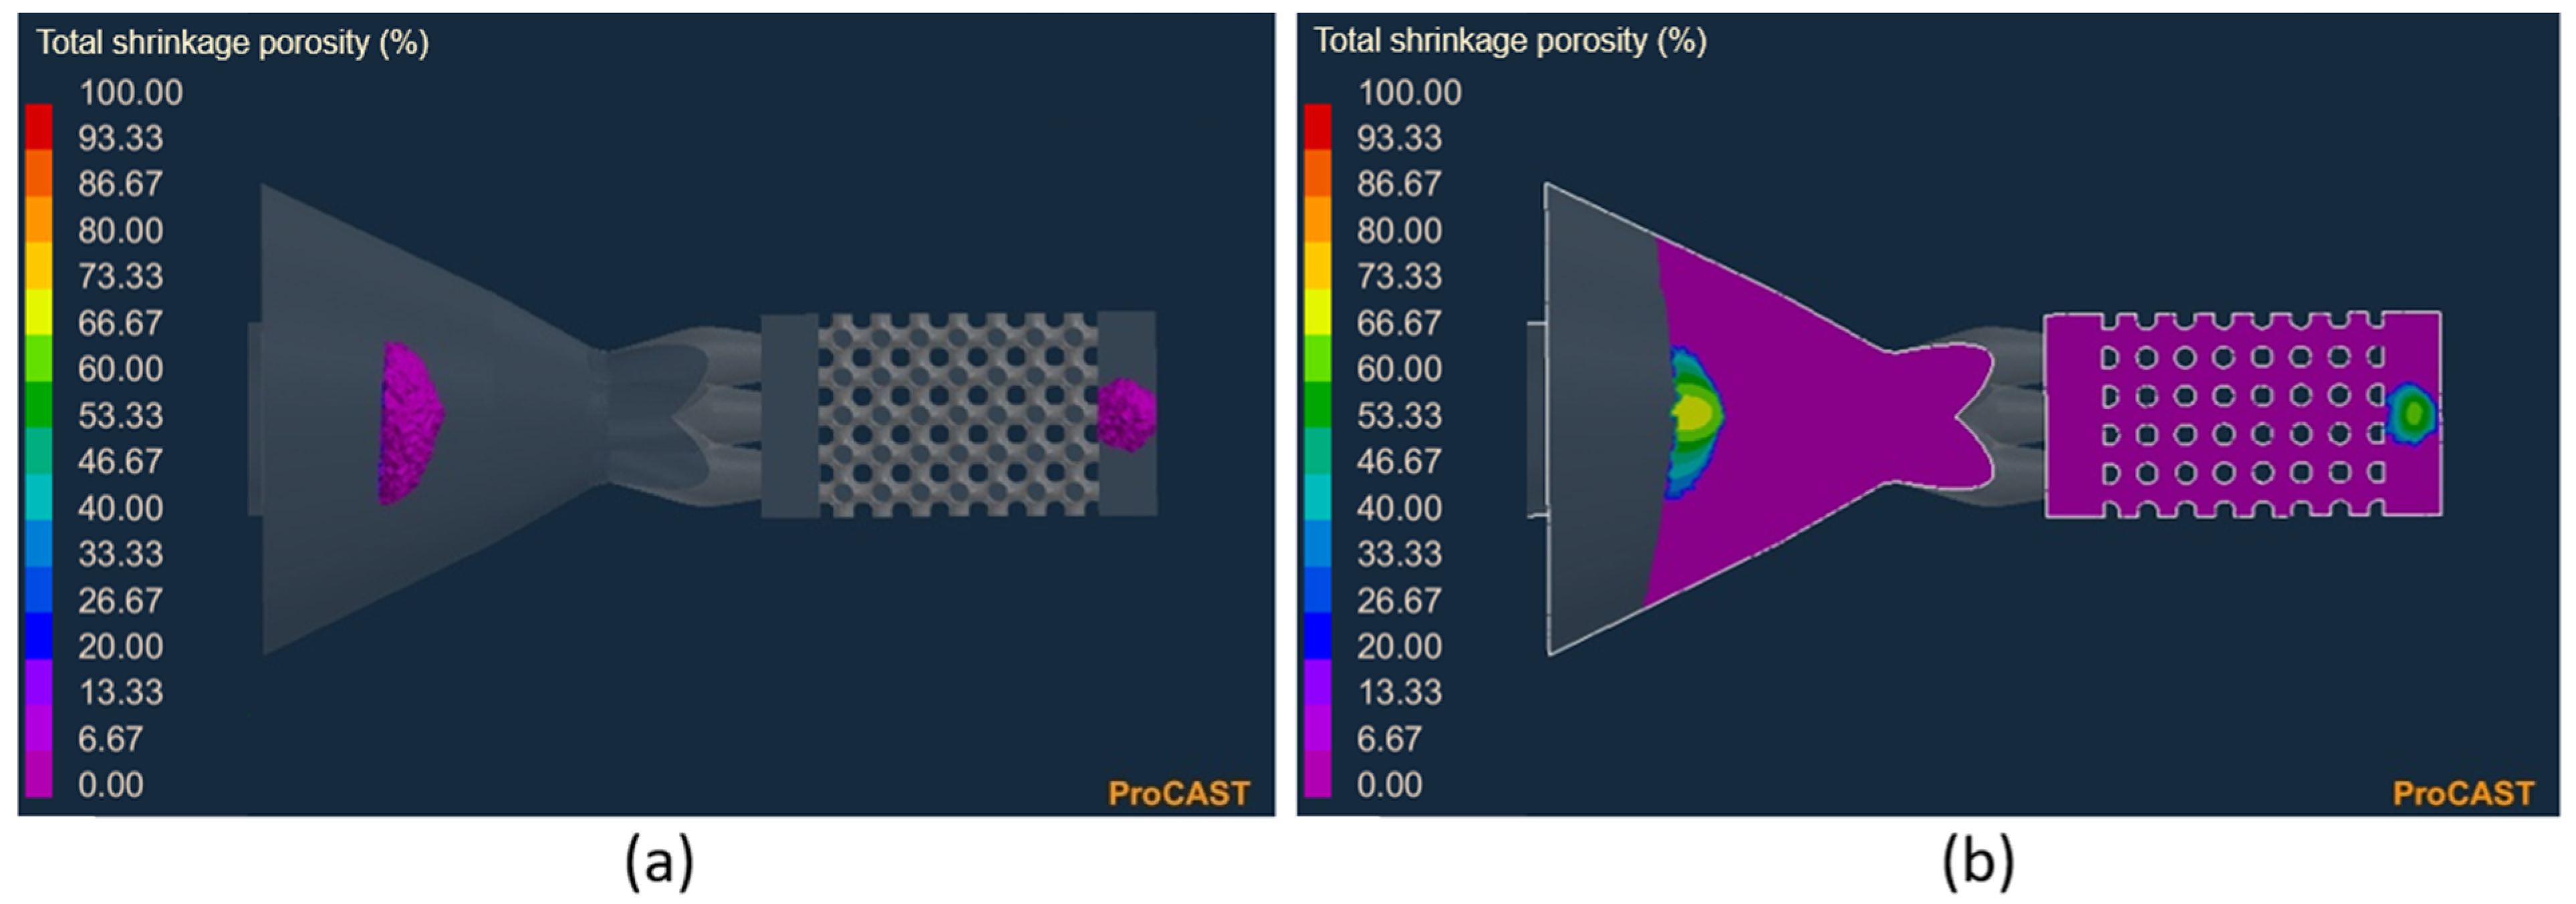
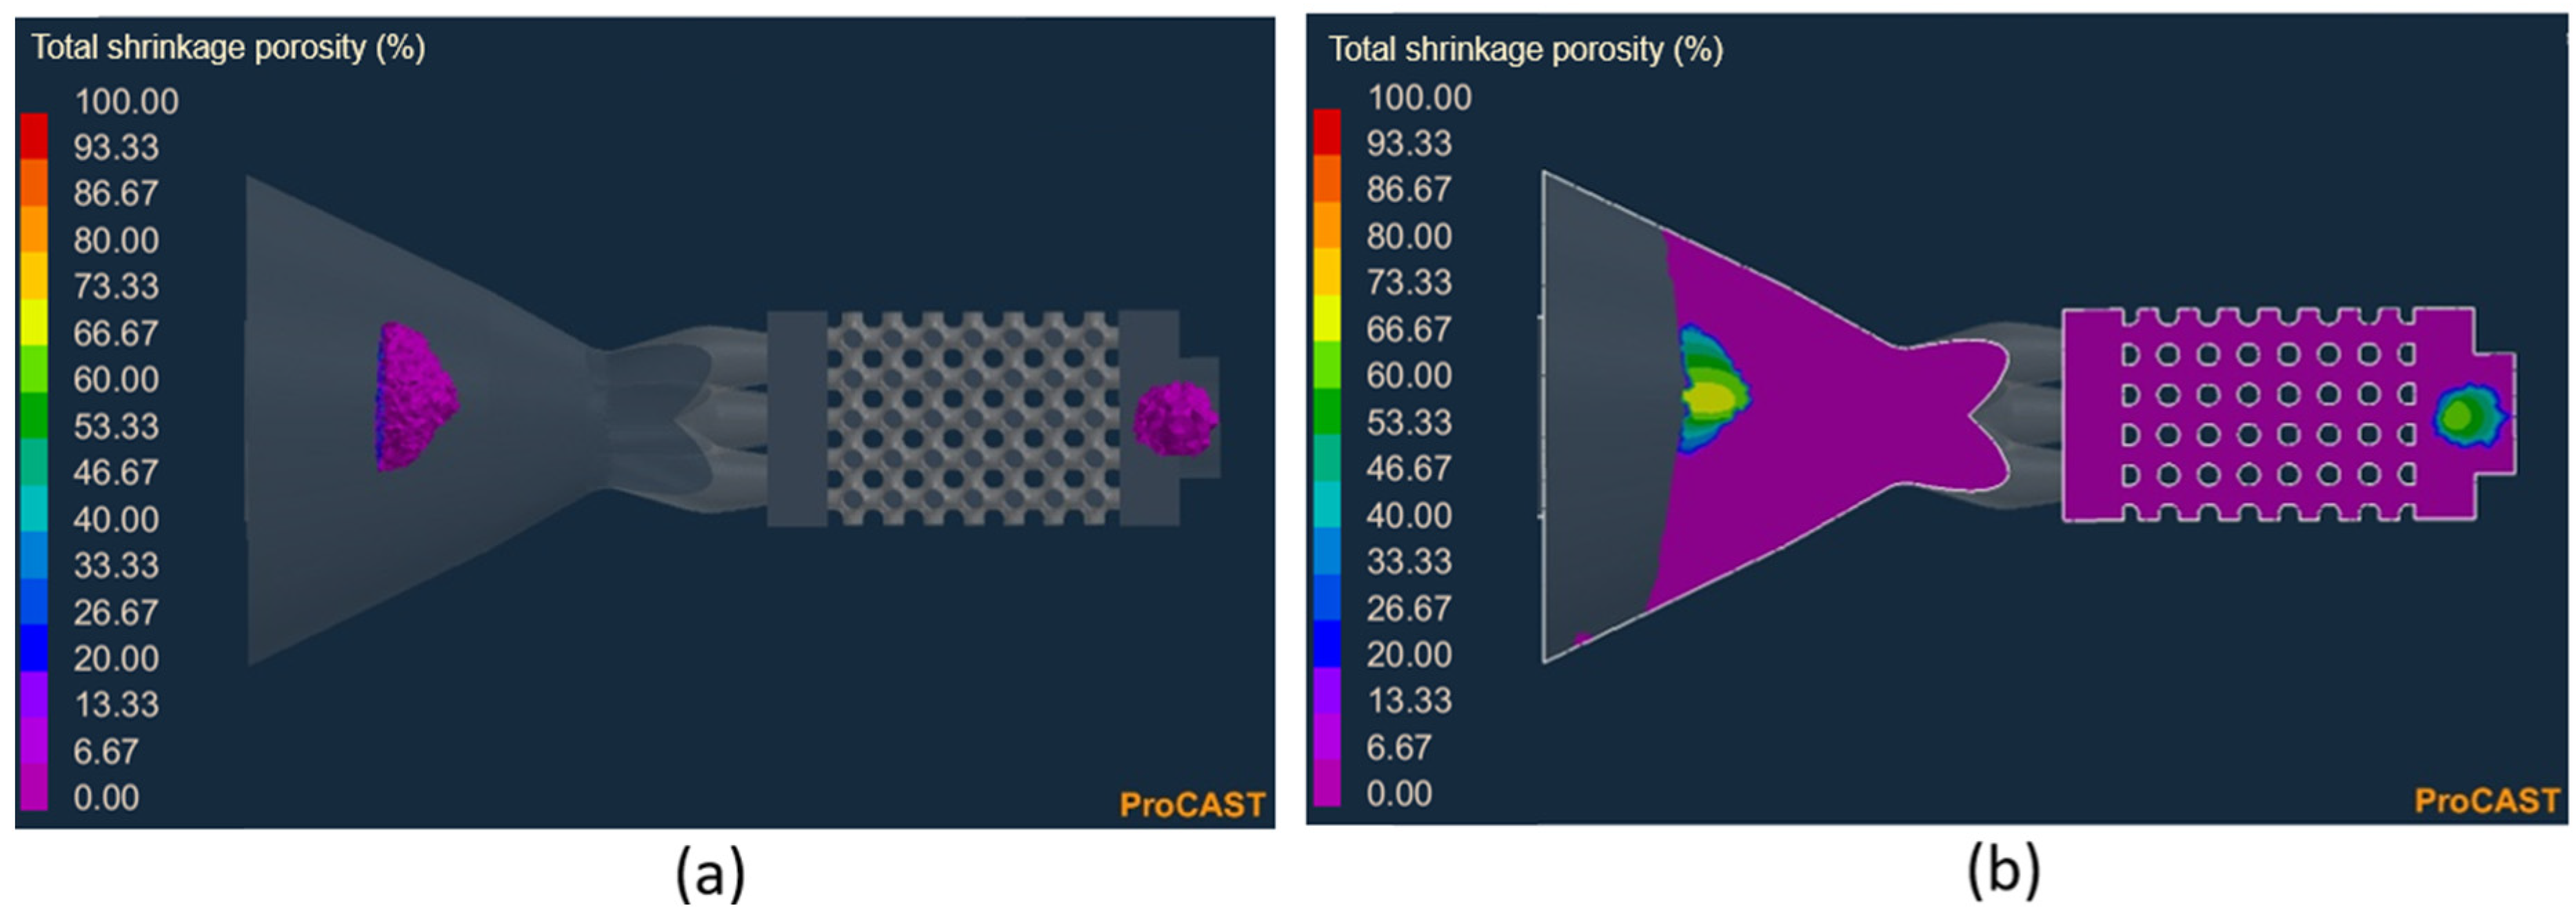
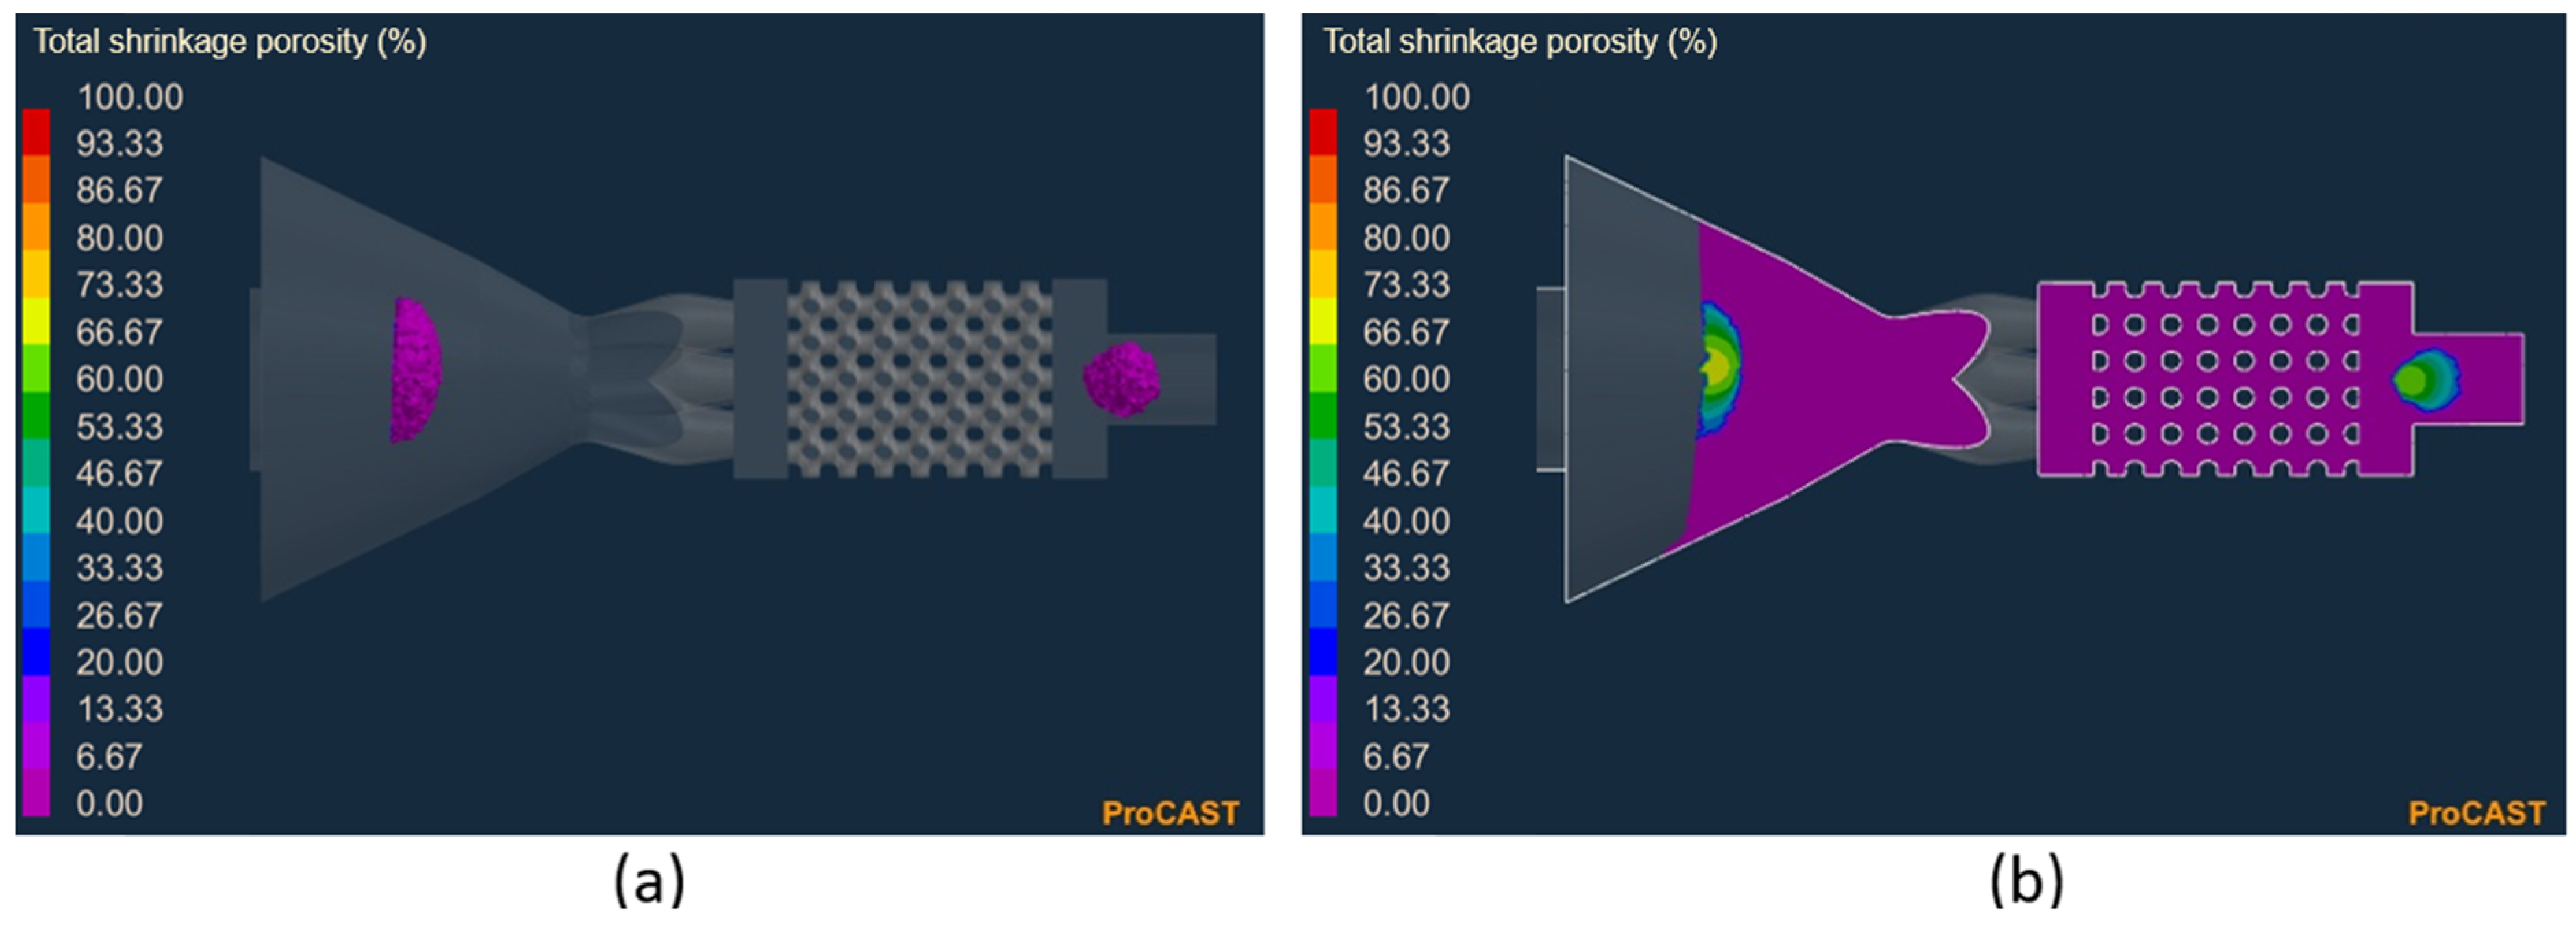
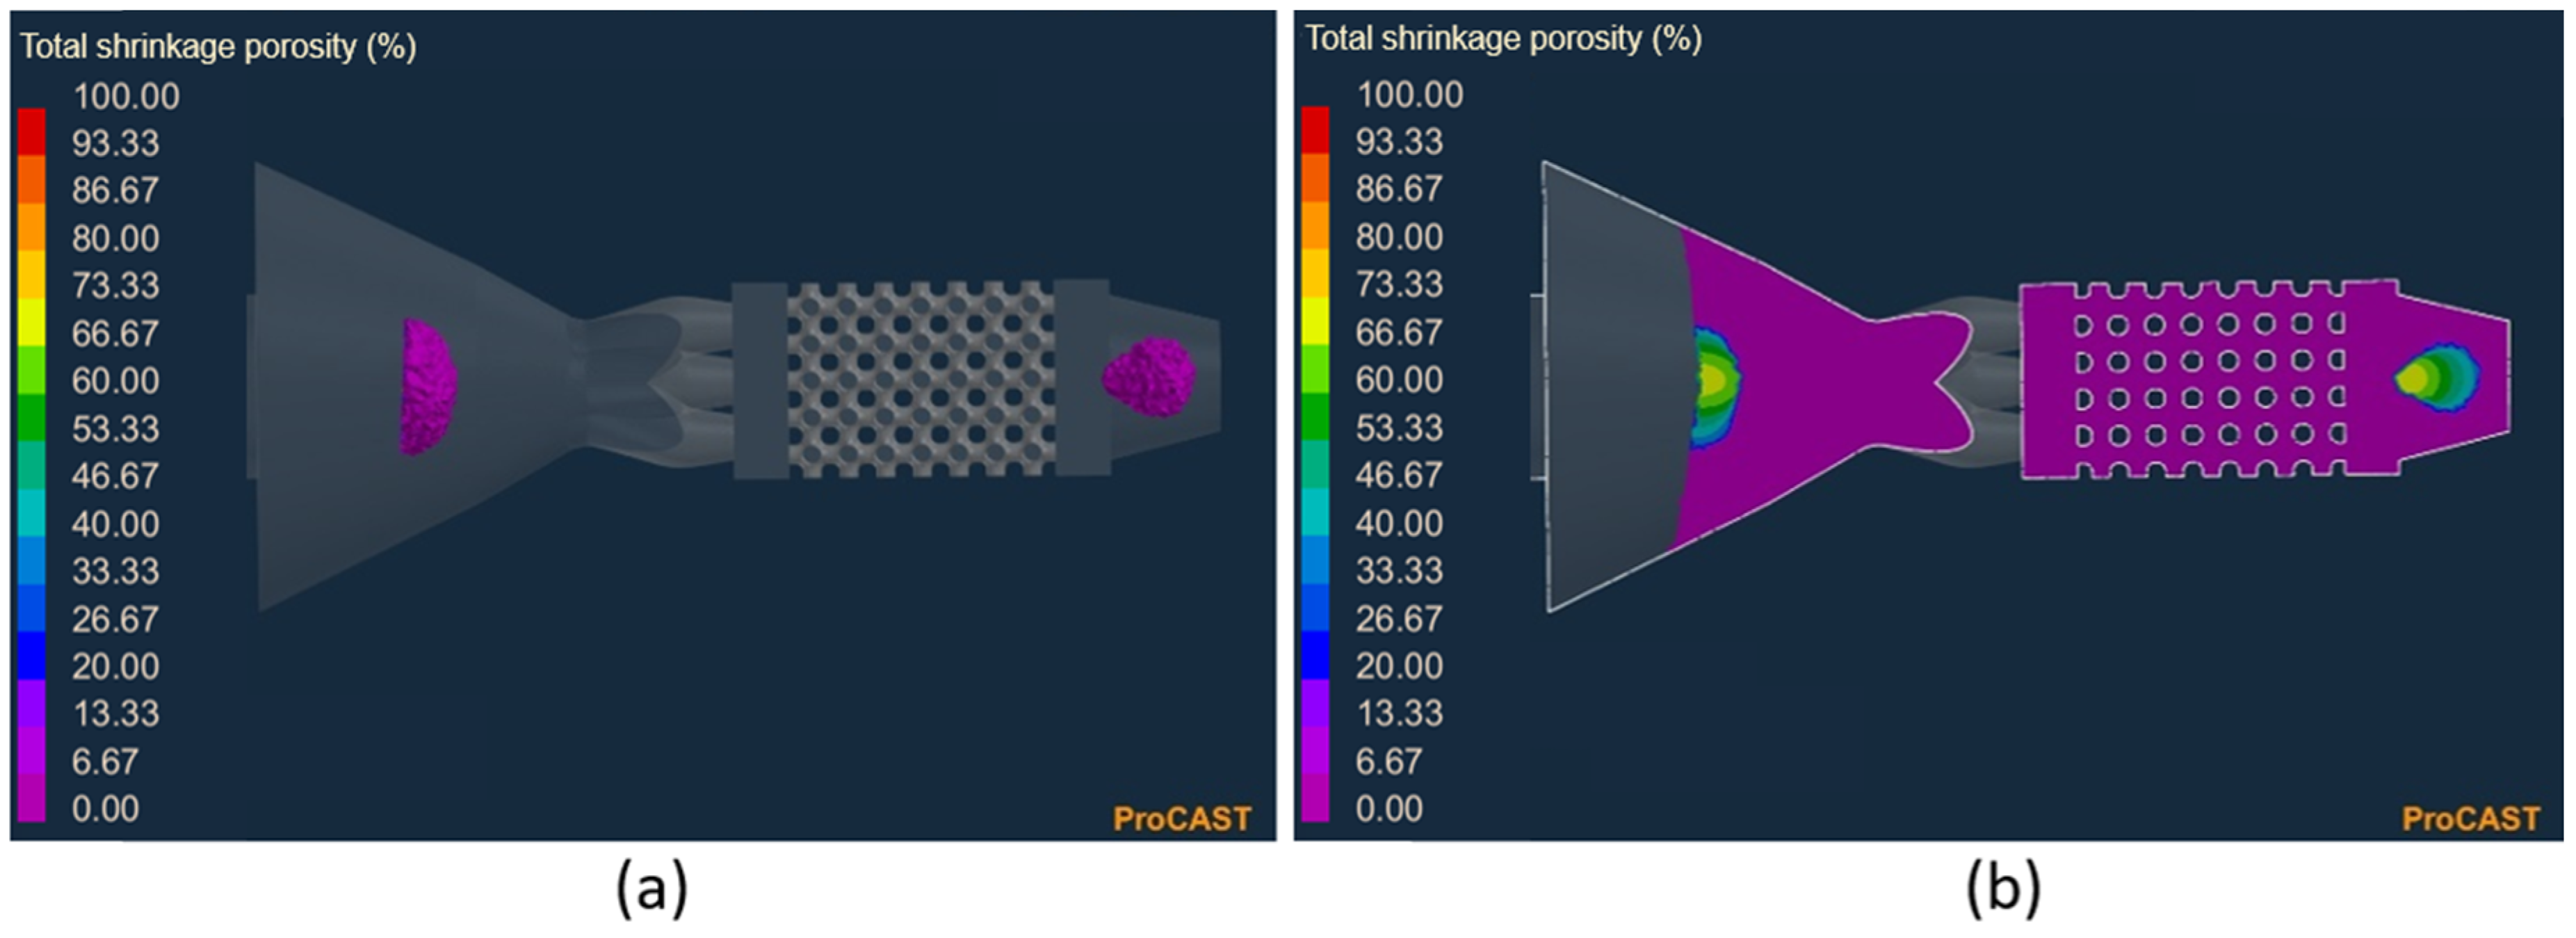
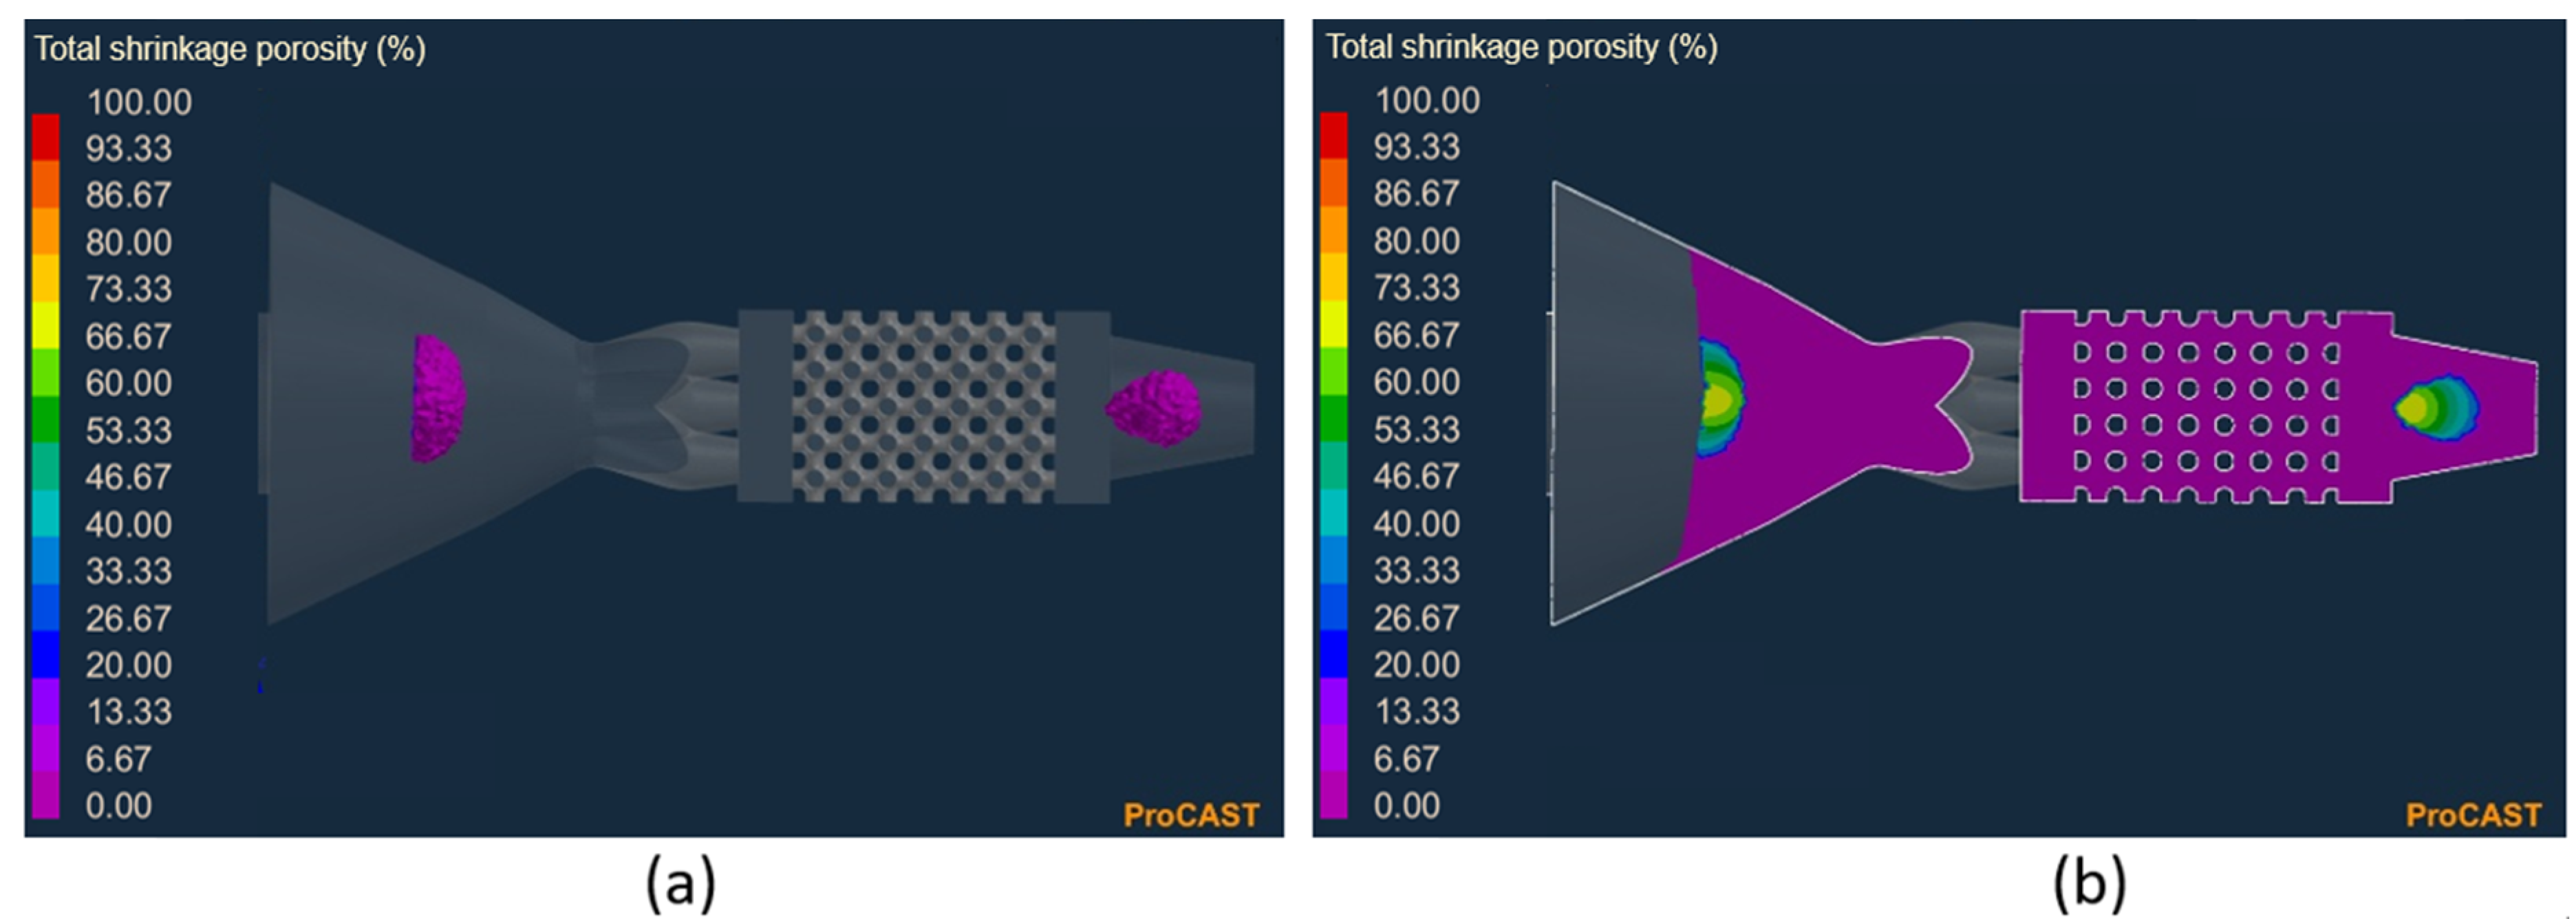
4.3. Shrinkage Porosity Simulation
5. Conclusions
Author Contributions
Funding
Data Availability Statement
Acknowledgments
Conflicts of Interest
References
- Mohammad, J.A.; Amirhesam, A.; Zohreh, S.; Narges, S.M.; Reza, M.; Haluk, K.; Mohammad, E. Shape memory response of cellular lattice structures: Unit cell finite element prediction. Mech. Mater. 2018, 125, 26–34. [Google Scholar] [CrossRef]
- Zhang, Y.; Wang, P.; Xia, Y.; Zhou, P.; Xie, Y.; Xu, S.; Zhang, C. Application of a Shape-Memory Alloy Concentrator in Displaced Patella Fractures: Technique and LongTerm Results. J. Knee Surg. 2016, 30, 166–173. [Google Scholar] [CrossRef]
- Gibson, L.J.; Ashby, M.F. Cellular Solids-Structure and Properties; Cambridge University Press: Cambridge, UK, 1997. [Google Scholar] [CrossRef]
- Ju, J.; Summers, J.D.; Ziegert, J.; Fadel, G. Design of Honeycombs for Modulus and Yield Strain in Shear. Trans. ASME J. Eng. Mater. Technol. 2012, 134, 11–22. [Google Scholar] [CrossRef]
- Tan, H.; Qu, S. Impact of Cellular Materials. In Cellular and Porous Materials in Structures and Processes; Altenbach, H., Öchsner, A., Eds.; CISM International Centre for Mechanical Sciences: Udine, Italy; Springer: Vienna, Austria, 2010; Volume 521. [Google Scholar] [CrossRef]
- Smith, M.; Guan, Z.; Cantwell, W.J. Finite element modelling of the compressive response of lattice structures manufactured using the selective laser melting technique. Int. J. Mech. Sci. 2013, 67, 28–41. [Google Scholar] [CrossRef]
- Yan, C.; Hao, L.; Hussein, A.; Young, P.; Raymont, D. Advanced lightweight 316L stainless steel cellular lattice structures fabricated via selective laser melting. Mater. Des. 2014, 55, 533–541. [Google Scholar] [CrossRef] [Green Version]
- Karamooz Ravari, M.R.; Kadkhodaei, M. A computationally efficient modeling approach for predicting mechanical behavior of cellular lattice structures. J. Mater. Eng. Perform. 2015, 24, 245–252. [Google Scholar] [CrossRef]
- Deshpande, V.S.; Fleck, N.A.; Ashby, M.F. Effective properties of the octet-truss lattice material. J. Mech. Phys. Solids 2001, 49, 1747–1769. [Google Scholar] [CrossRef] [Green Version]
- Zhou, J.; Shrotriya, P.; Soboyejo, W. On the deformation of aluminum lattice block structures: From struts to structures. Mech. Mater. 2004, 36, 723–737. [Google Scholar] [CrossRef]
- Labeas, G.; Sunaric, M. Investigation on the static response and failure process of metallic open lattice cellular structures. Strain 2010, 46, 195–204. [Google Scholar] [CrossRef]
- Hao, L.; Seaman, O.; Felstead, M. Selective laser melting of a stainless steel and hydroxyapatite composite for loadbearing implant development. J. Mater. Process. Technol. 2009, 209, 5793–5801. [Google Scholar] [CrossRef]
- McKown, S.; Shen, Y.; Brookes, W.K.; Sutcliffe, C.J.; Cantwell, W.J.; Langdon, G.S.; Nurick, G.N.; Theobald, M.D. The quasi-static and blast loading response of lattice structures. Int. J. Impact Eng. 2008, 35, 795–810. [Google Scholar] [CrossRef]
- Rao, A.; Srinivasa, A.R.; Reddy, J.N. Design of Shape Memory Alloy (SMA) Actuators; Springer: New York, NY, USA, 2015. [Google Scholar]
- Peairs, D.M.; Park, G.; Inman, D.J. Practical issues of activating self-repairing bolted joints. LMFrt Mater. Struct. 2004, 13, 1414–1423. [Google Scholar] [CrossRef]
- Elahinia, M.; Moghaddam, S.N.; Andani, M.T.; Amerinatanzi, A.; Bimber, B.A.; Hamilton, R.F. Fabrication of NiTi through additive manufacturing: A review. Prog. Mater. Sci. 2016, 83, 630–663. [Google Scholar] [CrossRef] [Green Version]
- Hadi, A.; Elahinia, M.; Qasemi, M.; Shayesteh Moghaddam, N. Modeling and Experiment of a Flexible Module Actuated by Shape Memory Alloy Wire. In Proceedings of the ASME 2014 Conference on Smart Materials, Adaptive Structures and Intelligent Systems, SMASIS 2014, Newport, RI, USA, 8–10 September 2014. [Google Scholar] [CrossRef]
- Hadi, A.; Alipour, K.l.; Kazeminasab, S.; Amerinatanzi, A.; Elahinia, M. Design and Prototyping of a Wearable Assistive Tool for Hand Rehabilitation Using Shape Memory Alloys; American Society of Mechanical Engineers: New York, NY, USA, 2016. [Google Scholar] [CrossRef]
- Amerinatanzi, A.; Shayesteh Moghaddam, N.; Ibrahim, H.; Elahinia, M. Evaluating a NiTi Implant Under Realistic Loads: A Simulation Study; American Society of Mechanical Engineers: New York, NY, USA, 2016. [Google Scholar] [CrossRef]
- Moghaddam, N.S.; Skoracki, R.; Miller, M.; Elahinia, M.; Dean, D. Three Dimensional Printing of Stiffness-tuned, Nitinol Skeletal Fixation Hardware with an Example of Mandibular Segmental Defect Repair. Procedia CIRP 2016, 49, 45–50. [Google Scholar] [CrossRef] [Green Version]
- Banhart, J. Manufacture, characterisation and application of cellular metals and metal foams. Prog. Mater. Sci. 2001, 46, 559–632. [Google Scholar] [CrossRef]
- Mun, J.; Busse, M.; Thurman, J. Multilevel Metal Flow-Fill Analysis of Centrifugal Casting for Indirect Additive Manufacturing of Lattice Structures. In Proceedings of the ASME 2015 International Mechanical Engineering Congress and Exposition, Houston, TX, USA, 15–18 November 2015; Volume 2A: Advanced Manufacturing 2015. [Google Scholar] [CrossRef]
- Oliveira, J.P.; Lalonde, A.D.; Ma, J. Processing parameters in laser powder bed fusion metal additive manufacturing. Mater. Des. 2020, 193, 108762. [Google Scholar] [CrossRef]
- West, B.M.; Capps, N.E.; Urban, J.S.; Pribe, J.D.; Hartwig, T.J.; Lunn, T.D.; Brown, B.; Bristow, D.A.; Landers, R.G.; Kinzel, E.C. Modal analysis of metal additive manufactured parts. Manuf. Lett. 2017, 13, 30–33. [Google Scholar] [CrossRef]
- Kok, Y.; Tan, X.P.; Wang, P.; Nai, M.L.S.; Loh, N.H.; Liu, E.; Tor, S.B. Anisotropy and heterogeneity of microstructure and mechanical properties in metal additive manufacturing: A critical review. Mater. Des. 2018, 139, 565–586. [Google Scholar] [CrossRef]
- Shim, D.S.; Seo, J.Y.; Yoon, H.S.; Lee, K.Y.; Oh, W.J. Additive manufacturing of porous metals using laser melting of Ti6Al4V powder with a foaming agent. Mater. Res. Express 2018, 5, 86518. [Google Scholar] [CrossRef]
- Dressler, A.D.; Jost, E.W.; Miers, J.C. Moore DG, Seepersad CC, Boyce BL (2019) Heterogeneities dominate mechanical performance of additively manufactured metal lattice struts. Addit. Manuf. 2019, 28, 692–703. [Google Scholar] [CrossRef]
- Santo, L.S.; Gupta, S.K.; Bruck, H.A. Simulation of buckling of internal features during selective laser sintering of metals. Addit. Manuf. 2018, 23, 235–245. [Google Scholar] [CrossRef]
- Li, X.; Tan, W. Numerical investigation of effects of nucleation mechanisms on grain structure in metal additive manufacturing. Comput. Mater. Sci. 2018, 153, 159–169. [Google Scholar] [CrossRef]
- Demir, A.G. Micro laser metal wire deposition for additive manufacturing of thin-walled structures. Opt. Lasers Eng. 2018, 100, 9–17. [Google Scholar] [CrossRef]
- McGregor, D.J.; Tawfick, S.; King, W.P. Automated metrology and geometric analysis of additively manufactured lattice structures. Addit. Manuf. 2019, 28, 535–545. [Google Scholar] [CrossRef]
- Herzog, D.; Seyda, V.; Wycisk, E.; Emmelmann, C. Additive manufacturing of metals. Acta Mater. 2016, 117, 371–392. [Google Scholar] [CrossRef]
- Zinovieva, O.; Zinoviev, A.; Ploshikhin, V. Three-dimensional modeling of the microstructure evolution during metal additive manufacturing. Comput. Mater. Sci. 2018, 141, 207–220. [Google Scholar] [CrossRef]
- Carneiro, V.H.; Puga, H.; Meireles, J. Heat treatment as a route to tailor the yield-damping properties in A356 alloys. Mater. Sci. Eng. A 2018, 729, 1–8. [Google Scholar] [CrossRef]
- Carneiro, V.H.; Puga, H. Solution Treatment Enhances Both Static and Damping Properties of Al–Si–Mg alloys. Metall. Mater. Trans. A 2018, 49, 5942–5945. [Google Scholar] [CrossRef]
- Puga, H.; Carneiro, V.H.; Barbosa, J. Effect of grain and secondary phase morphologies in the mechanical and damping behavior of Al7075 alloys. Met. Mater. 2016, 22, 863–871. [Google Scholar] [CrossRef]
- Tang, Y.; Tan, W.K.; Fuh, J.Y.H.; Loh, H.T.; Wong, Y.S.; Thian, S.C.H.; Lu, L. Micro-mould fabrication for a micro-gear via vacuum casting. J. Mater. Process. Technol. 2007, 192–193, 334–339. [Google Scholar] [CrossRef]
- Xue, Y.; Wang, W.; Han, F. Enhanced compressive mechanical properties of aluminum based auxetic lattice structures filled with polymers. Compos. Part B Eng. 2019, 171, 83–191. [Google Scholar] [CrossRef]
- Guo, J.; Samonds, M. Modeling of alloy casting solidification. JOM 2011, 63, 19–28. [Google Scholar] [CrossRef]
- Horr, A.M.; Kronsteiner, J. On Numerical Simulation of Casting in New Foundries: Dynamic Process Simulations. Metals 2020, 10, 886. [Google Scholar] [CrossRef]
- Papanikolaou, M.; Pagone, E.; Jolly, M.; Salonitis, K. Numerical Simulation and Evaluation of Campbell Running and Gating Systems. Metals 2020, 10, 68. [Google Scholar] [CrossRef] [Green Version]
- Scampone, G.; Pirovano, R.; Mascetti, S.; Timelli, G. Experimental and numerical investigations of oxide-related defects in Al alloy gravity die castings. Int. J. Adv. Manuf. Technol. 2021, 117, 1765–1780. [Google Scholar] [CrossRef]
- Chu, H.; Ping, J.; Shaoning, G.; Song, G.; Gaoyang, M.; Chunming, W. Multiphase-field simulation of grain coalescence behavior and its effects on solidification cracking susceptibility during welding of Al-Cu alloys. Mater. Des. 2021, 211, 110146. [Google Scholar] [CrossRef]
- Mark, J.; Laurens, K. Modelling of defects in aluminium cast products. Prog. Mater. Sci. 2022, 123, 100824. [Google Scholar] [CrossRef]
- Santamaría, J.A.; Sertucha, J.; Redondo, A.; Lizarralde, I.; Ochoa de Zabalegui, E.; Rodríguez, P. Towards the Prediction of Tensile Properties in Automotive Cast Parts Manufactured by LPDC with the A356.2 Alloy. Metals 2022, 12, 656. [Google Scholar] [CrossRef]
- Xuan, M.; Chen, M. Optimal Design of the Submerged Entry Nozzle for Thin Slab Continuous Casting Molds. Metals 2021, 11, 1223. [Google Scholar] [CrossRef]
- Zheng, H.; Zhang, Z.; Bai, Y. Numerical Simulation and Experimental Study on Compound Casting of Layered Aluminum Matrix Composite Brake Drum. Materials 2021, 14, 1412. [Google Scholar] [CrossRef]
- Qiang, L.; Peng, G.; Guangxuan, L.; Yang, S.; Wenhui, Y.; Jianping, G.; Xian, L. Simulation Study on the Investment Casting Process of a Low-Cost Titanium Alloy Gearbox based on ProCAST. Adv. Mater. Sci. Eng. 2022, 2022, 4484762. [Google Scholar] [CrossRef]
- Silva, R.; Madureira, R.; Silva, J.; Soares, R.; Reis, A.; Neto, R.; Viana, F.; Emadinia, O.; Silva, R. Numerical Simulation and Defect Identification in the Casting of Co-Cr Alloy. Metals 2022, 12, 351. [Google Scholar] [CrossRef]
- Tan, R.; Liu, W.; Song, B.; Yang, S.-F.; Chen, Y.-F.; Zuo, X.-T.; Huang, Y. Numerical simulation on solidification behavior and structure of 38CrMoAl large round bloom using CAFE model. J. Iron Steel Res. Int. 2023. [Google Scholar] [CrossRef]
- You, L.; Yao, L.; Li, X.; Jia, G.; Lv, G. Numerical simulation and casting process optimization of cast steel node. Int. J. Adv. Manuf. Technol. 2023, 126, 5215–5225. [Google Scholar] [CrossRef]
- Albuquerque, C.E.S.; Grassi, E.N.D.; Araújo, C.J. Castability of Cu-Al-Mn shape memory alloy in a rapid investment asting process: Computational and experimental analysis. Int. J. Adv. Manuf. Technol. 2023; in press. [Google Scholar] [CrossRef]
- Simões, J.B.; Araújo, C.J. Nickel–titanium shape memory alloy mechanical components produced by investment casting. J. Intell. Mater. Syst. Struct. 2018, 29, 3748–3757. [Google Scholar] [CrossRef]
- ESI. ProCast Casting Simulation Suite; ESI Software: Rungis, France, 2019. [Google Scholar]
- Guo, Z.; Saunders, N.; Miodownik, A.P.; Schillé, J.-P.H. Modelling of materials properties and behaviour critical to casting simulation. Mater. Sci. Eng. A 2011, 413–414, 465–469. [Google Scholar] [CrossRef]
- Rappaz, M.; Bellet, M.; Deville, M.; Snyder, R. Numerical Modeling in Materials Science and Engineering; Springer: Berlin/Heidelberg, Germany, 2002; Volume 32. [Google Scholar] [CrossRef]
- ESI. ProCast User Manual e Technical Reference, Version 6.1; ESI Software: Rungis, France, 2007. [Google Scholar]
- Torroba, A.J.; Koeser, O.; Calba, L.; Maestro, L.; Carreno-Morelli, E.; Rahimian, M.; Milenkovic, S.; Sabirov, I.; Llorca, J. Investment casting of nozzle guide vanes from nickel-based superalloys: Part I—Thermal calibration and porosity prediction. Integr. Mater. Manuf. Innov. 2014, 3, 344–368. [Google Scholar] [CrossRef] [Green Version]
- Dantzig, J.A.; Rappaz, M. Solidification; EPFL-Press: Lausanne, Switzerland, 2009. [Google Scholar]
- Launder, B.E.; Spaulding, D.B. The Numerical Computation of Turbulent Flows. Comput. Methods Appl. Mech. Eng. 1974, 3, 269–289. [Google Scholar] [CrossRef]
- Kumar, R.; Madhu, S.; Aravindh, K.; Jayakumar, V.; Bharathiraja, G.; Muniappa, A. Casting design and simulation of gating system in rotary adaptor using procast software for defect minimization. Mater. Today Proc. 2020, 22, 799–805. [Google Scholar] [CrossRef]
- Rajkolhe, R.; Khan, J.G. Defects, Causes and Their Remedies in Casting Process: A Review. Int. J. Res. Advent Technol. 2014, 2, 375–386. Available online: https://ijrat.org/downloads/Vol-2/march-2014/paper%20ID-232014109.pdf (accessed on 12 March 2023).
- Ingle, V.; Sorte, M. Defects, Root Causes in Casting Process and Their Remedies: Review. Vaibhav Ingle. Int. J. Eng. Res. Appl. 2017, 7, 47–54. [Google Scholar] [CrossRef]


| Nozzle Model | Shape | Feed Channels (mm) | |
|---|---|---|---|
| Dinlet | Doutlet | ||
| Original | Spherical (Half sphere with a radius of 6.5 mm) | 3.0 | 2.5 |
| 1 | Conical (Diameter equal to 6.5 mm and height of 6.1 mm) | 3.0 | 2.5 |
| 2 | Cone trunk (Larger base radius 6.5 mm, smaller base radius 2.0 mm and height 8.0 mm) | 3.0 | 2.5 |
| 3 | Cone trunk (Larger base radius 6.5 mm, smaller base radius 2.0 mm and height 8.0 mm) | 6.0 | 2.5 |
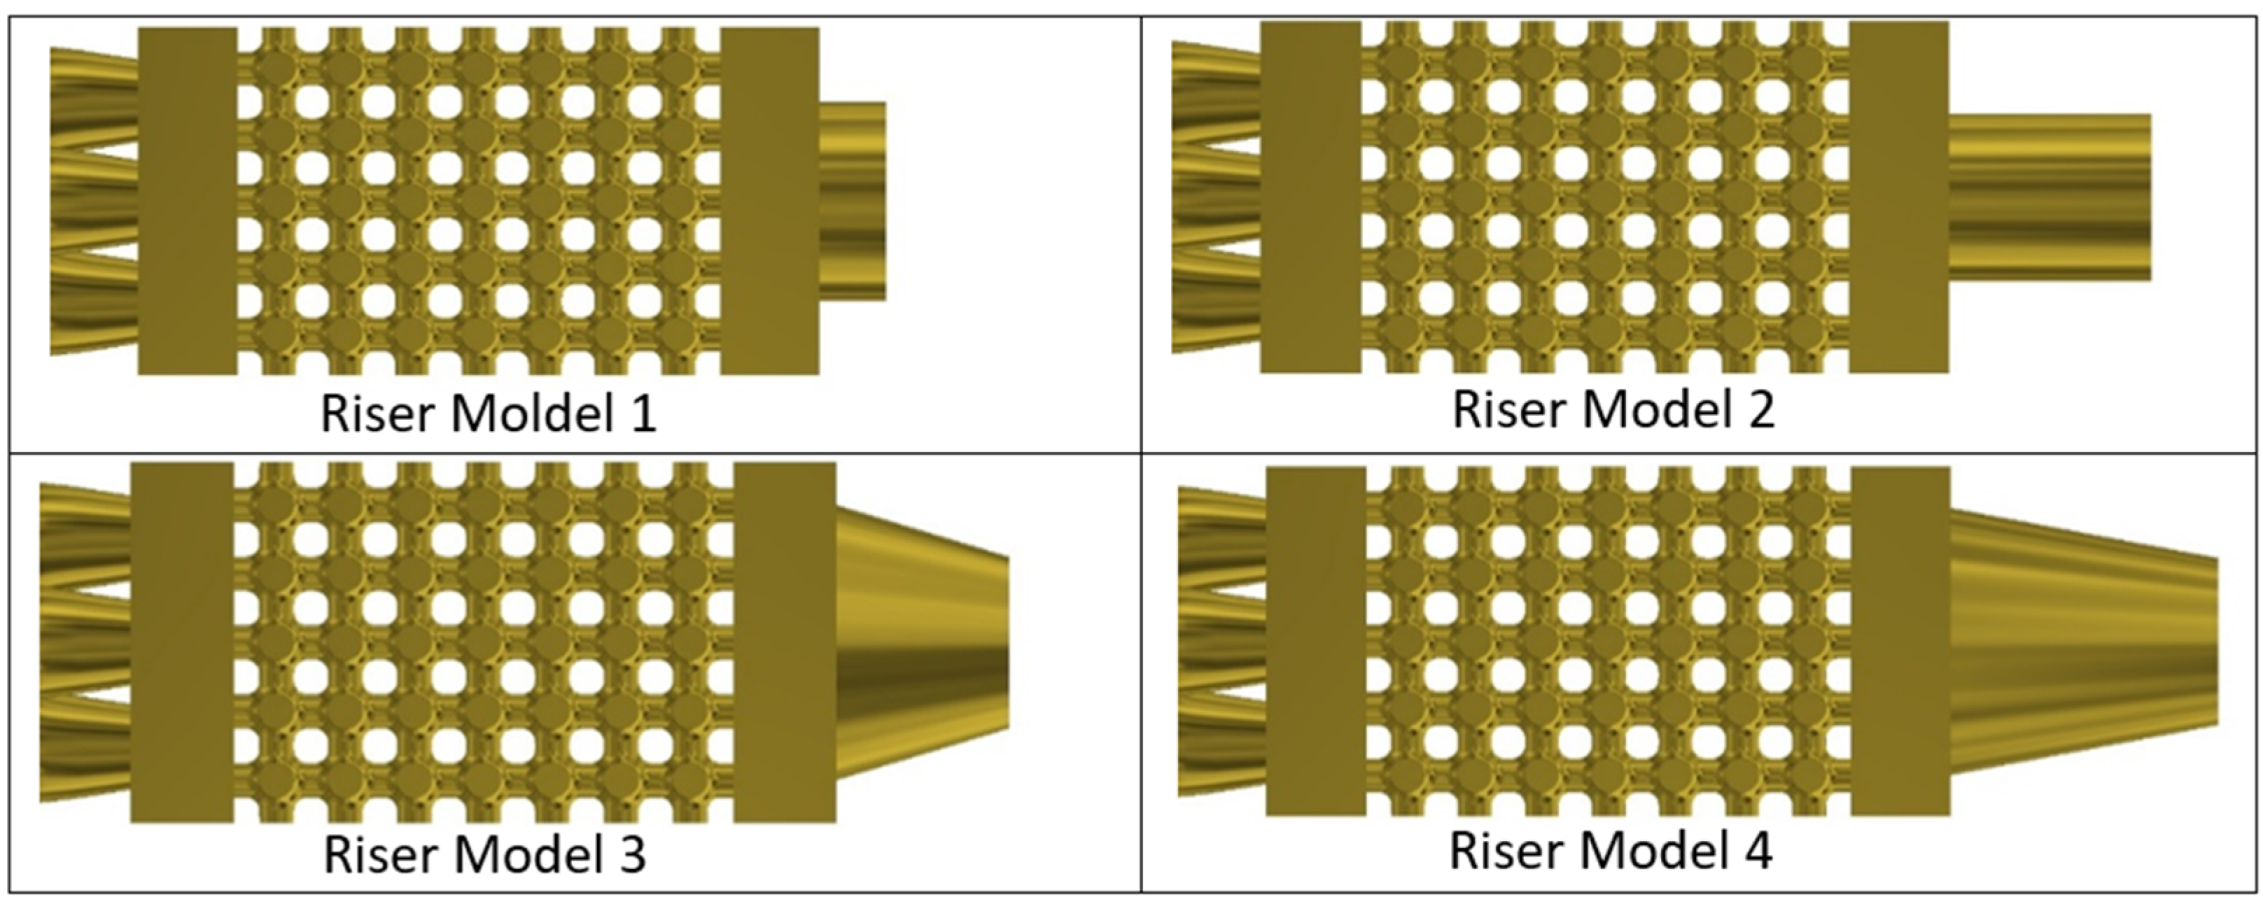
| Riser Model | Dimension |
|---|---|
| 1 | Diameter of 6.0 mm and height of 2.0 mm |
| 2 | Diameter of 6.0 mm and height of 5.0 mm |
| 3 | Smaller diameter of 6.0 mm, larger diameter of 8.0 and height of 5 mm |
| 4 | Smaller diameter of 6.0 mm, larger diameter of 8.0 and height of 8.0 mm |
| Variable | Input Data |
|---|---|
| Cu-based SMA (%wt) SMA | Cu-7.90Al-5.40Mn |
| Mold | Resincast refractory plaster |
| Filling method | Centrifugal |
| Rotation speed (rpm) | 400 |
| Rotation time (s) | 11 |
| Superheat (°C) | 5 |
| Solidus temperature (°C) | 993 (calculated using CompuTherm) |
| Liquidus temperature (°C) | 1038 (calculated using CompuTherm) |
| Mold temperature (°C) | 420 (constant) |
| Temperature outside the mold (°C) | Room temperature |
| Coefficient of heat exchange between the mold and the environment (W/m2·K) | 65 (forced convection) |
| Metal/mold interface heat transfer coefficient (hi in W/m2·K) | 535 |
| Cast alloy mass (g) | 25 |
| Distance between mold inlet and center of rotation (mm) | 120 |
| Evaluated Parameter | Nozzle Model | |||
|---|---|---|---|---|
| Original | Model 1 | Model 2 | Model 3 | |
| Filling time (s) | 0.53 | 0.48 | 0.46 | 0.44 |
| Recirculation in the converging nozzle | Yes | Yes | Yes | No |
| Shrinkage porosity (on the top base) | 58.85% | 61.18% | 61.45% | 62.62% |
Disclaimer/Publisher’s Note: The statements, opinions and data contained in all publications are solely those of the individual author(s) and contributor(s) and not of MDPI and/or the editor(s). MDPI and/or the editor(s) disclaim responsibility for any injury to people or property resulting from any ideas, methods, instructions or products referred to in the content. |
© 2023 by the authors. Licensee MDPI, Basel, Switzerland. This article is an open access article distributed under the terms and conditions of the Creative Commons Attribution (CC BY) license (https://creativecommons.org/licenses/by/4.0/).
Share and Cite
Albuquerque, C.E.S.; Silva, P.C.S.; Grassi, E.N.D.; De Araujo, C.J.; Delgado, J.M.P.Q.; Lima, A.G.B. Optimizing the Gating System for Rapid Investment Casting of Shape Memory Alloys: Computational Numerical Analysis for Defect Minimization in a Simple-Cubic Cell Structure. Metals 2023, 13, 1138. https://doi.org/10.3390/met13061138
Albuquerque CES, Silva PCS, Grassi END, De Araujo CJ, Delgado JMPQ, Lima AGB. Optimizing the Gating System for Rapid Investment Casting of Shape Memory Alloys: Computational Numerical Analysis for Defect Minimization in a Simple-Cubic Cell Structure. Metals. 2023; 13(6):1138. https://doi.org/10.3390/met13061138
Chicago/Turabian StyleAlbuquerque, Carlos E. S., Paulo C. S. Silva, Estephanie N. D. Grassi, Carlos J. De Araujo, João M. P. Q. Delgado, and Antonio G. B. Lima. 2023. "Optimizing the Gating System for Rapid Investment Casting of Shape Memory Alloys: Computational Numerical Analysis for Defect Minimization in a Simple-Cubic Cell Structure" Metals 13, no. 6: 1138. https://doi.org/10.3390/met13061138