

Thermal, Mechanical, and Electrochemical Characterization of Ti50Ni50−XMox Alloys Obtained by Plasma Arc Melting
 , , , , , , , , and
Abstract
:1. Introduction
2. Materials and Methods
2.1. Sample Fabrication
2.2. Sample Preparation
2.3. Alloy Characterization and Chemical Composition
2.4. Corrosion Analysis
3. Results and Discussion
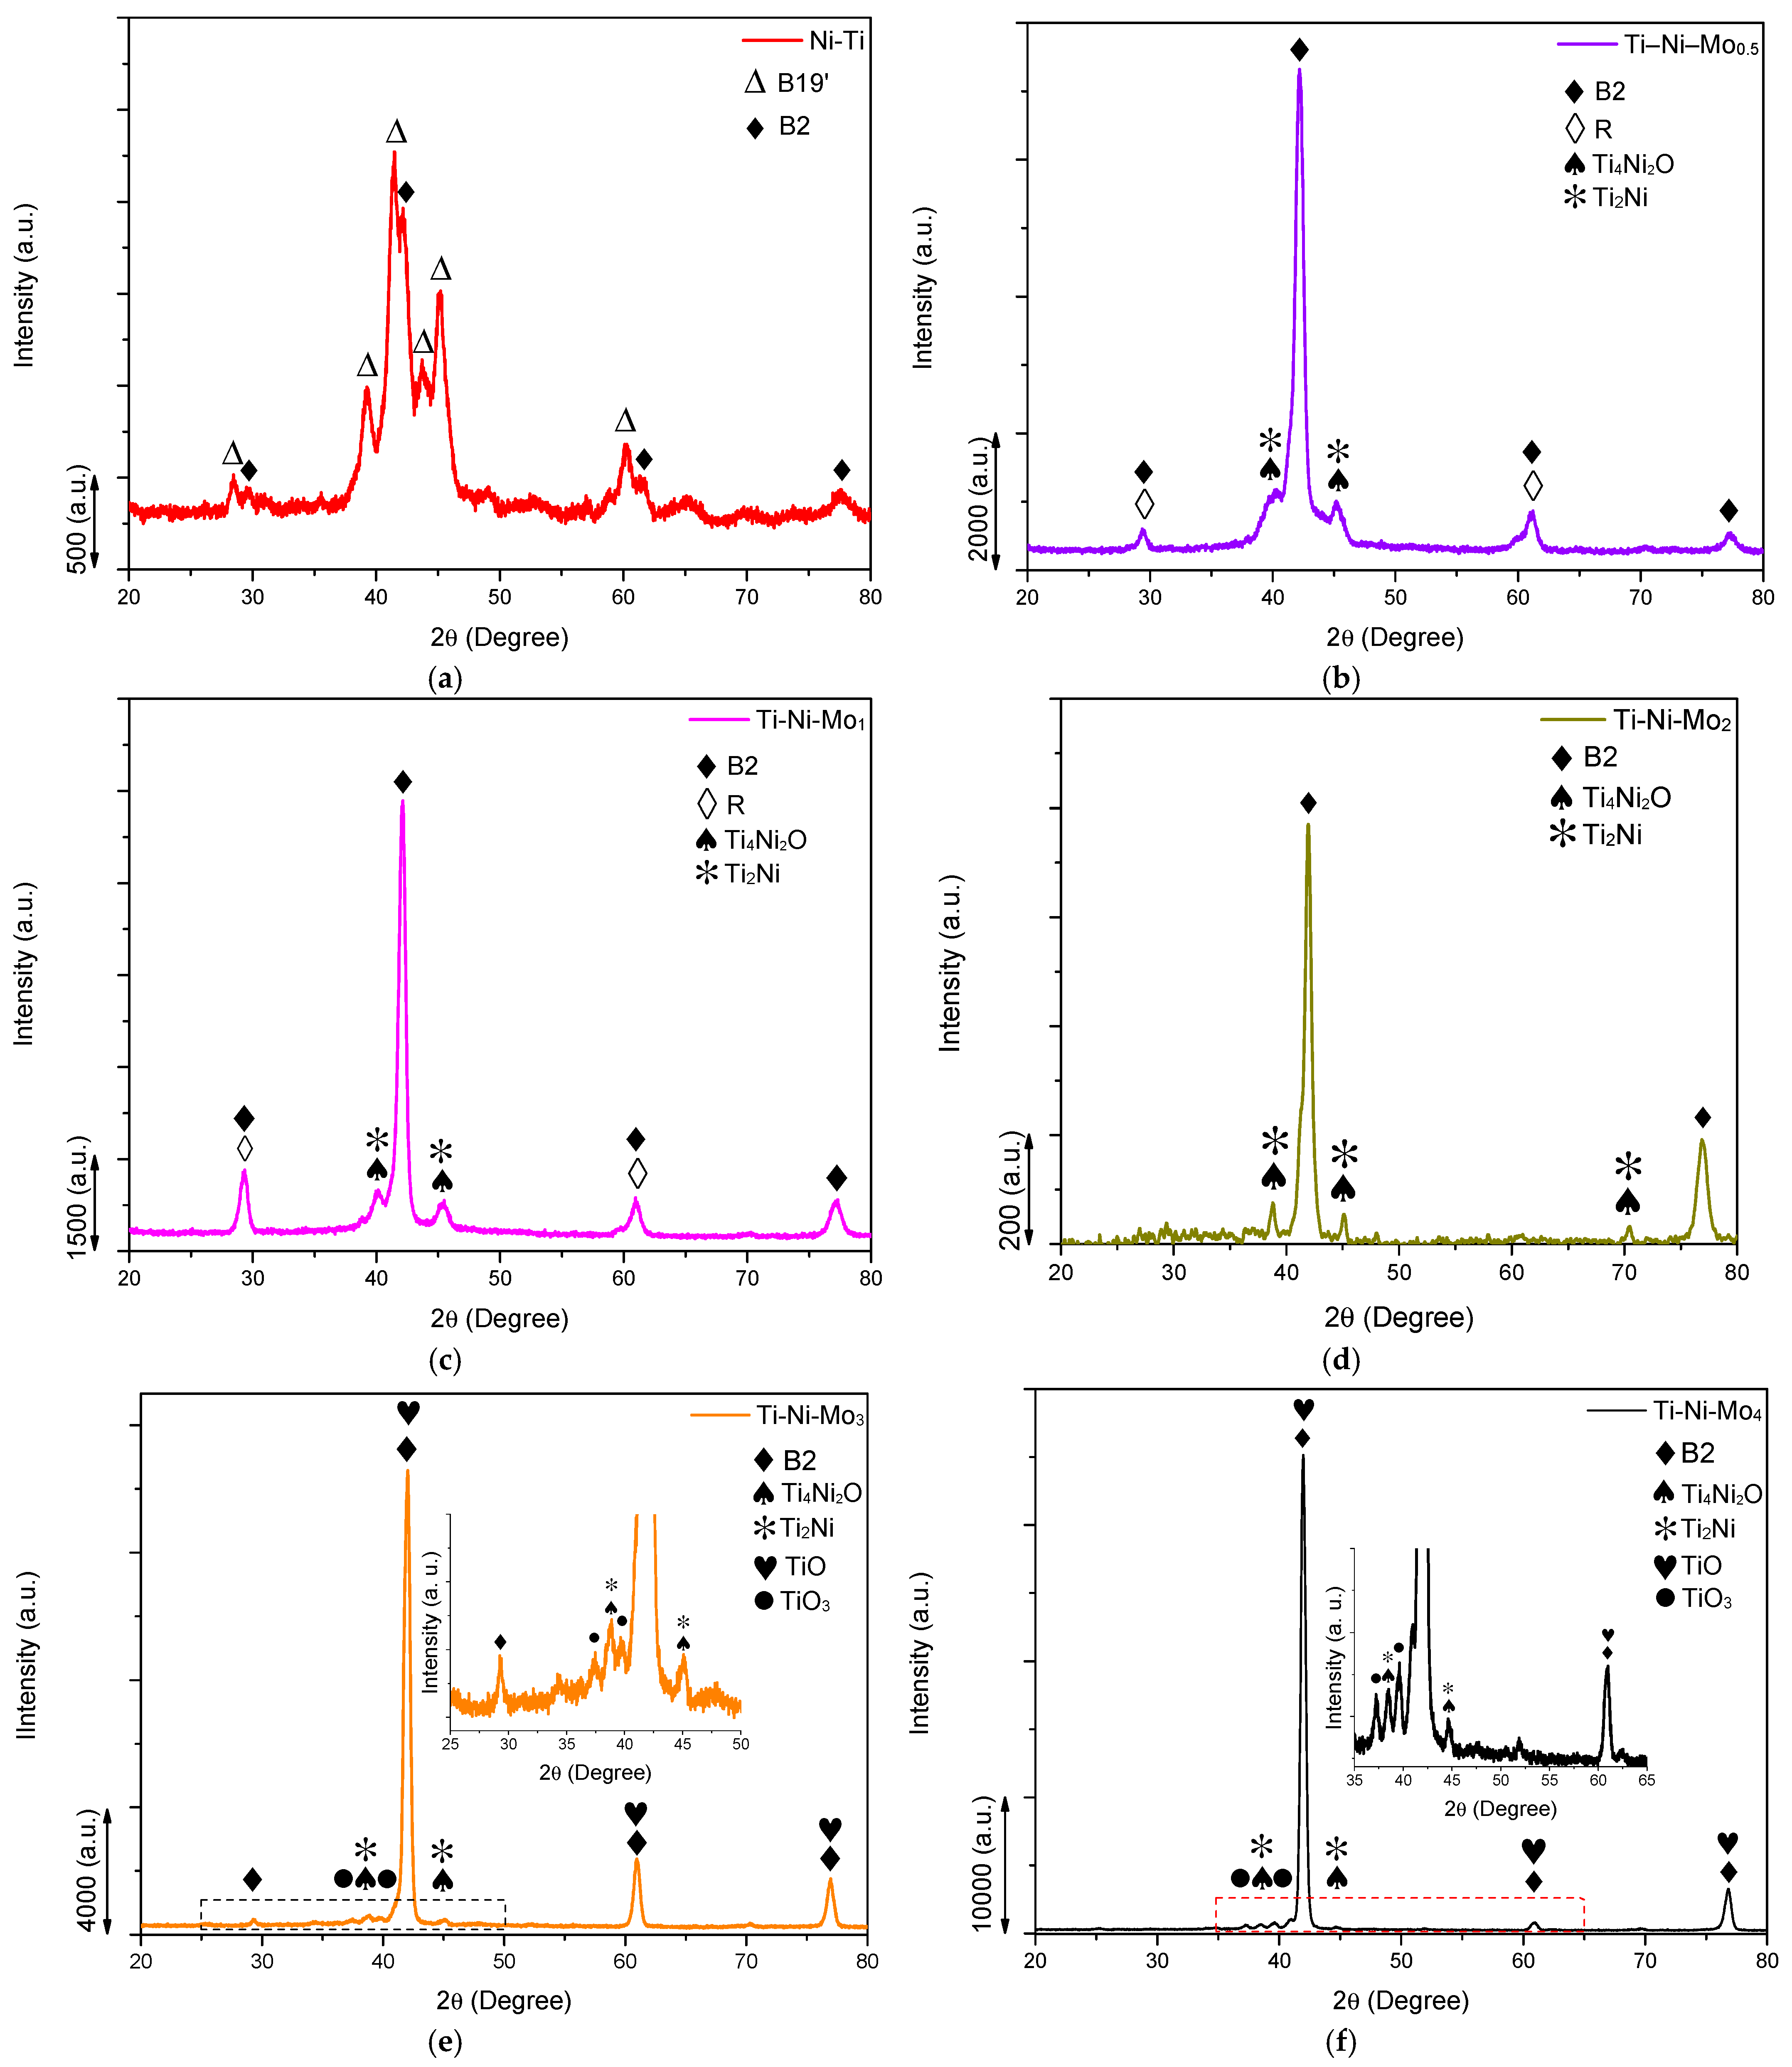
3.1. X-ray Diffraction
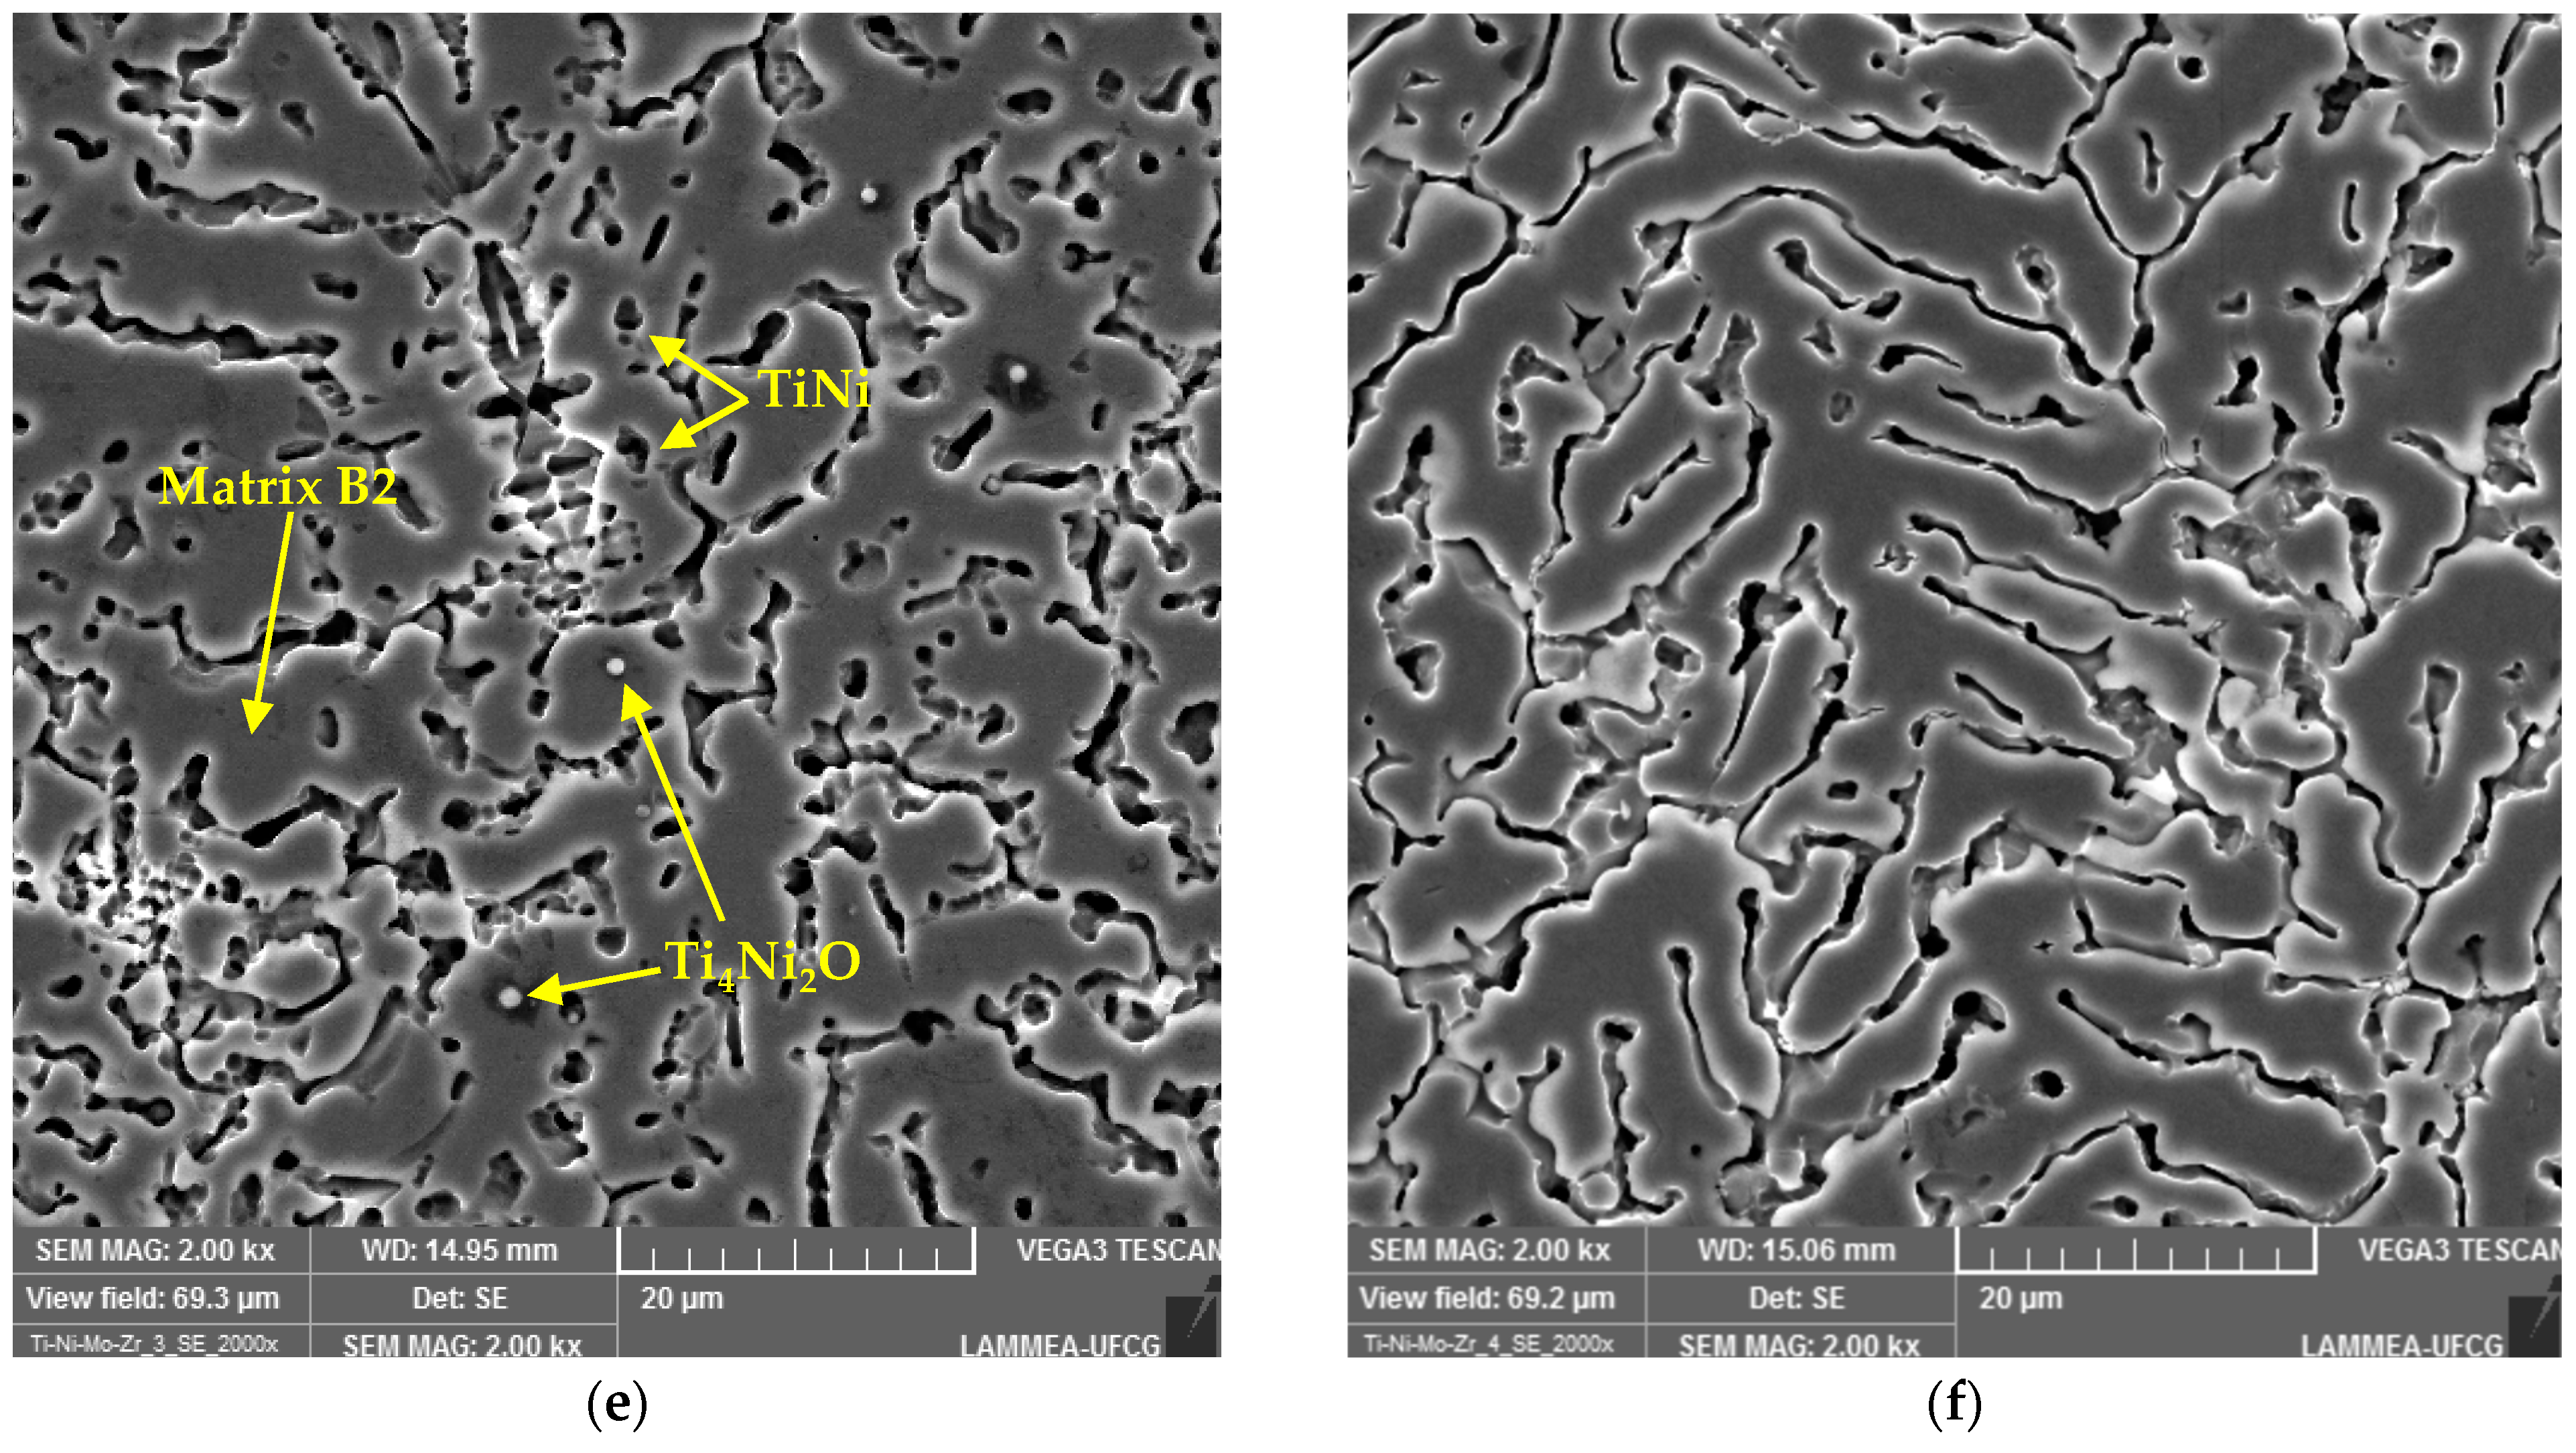
3.2. Scanning Electron Microscopy and Chemical Composition
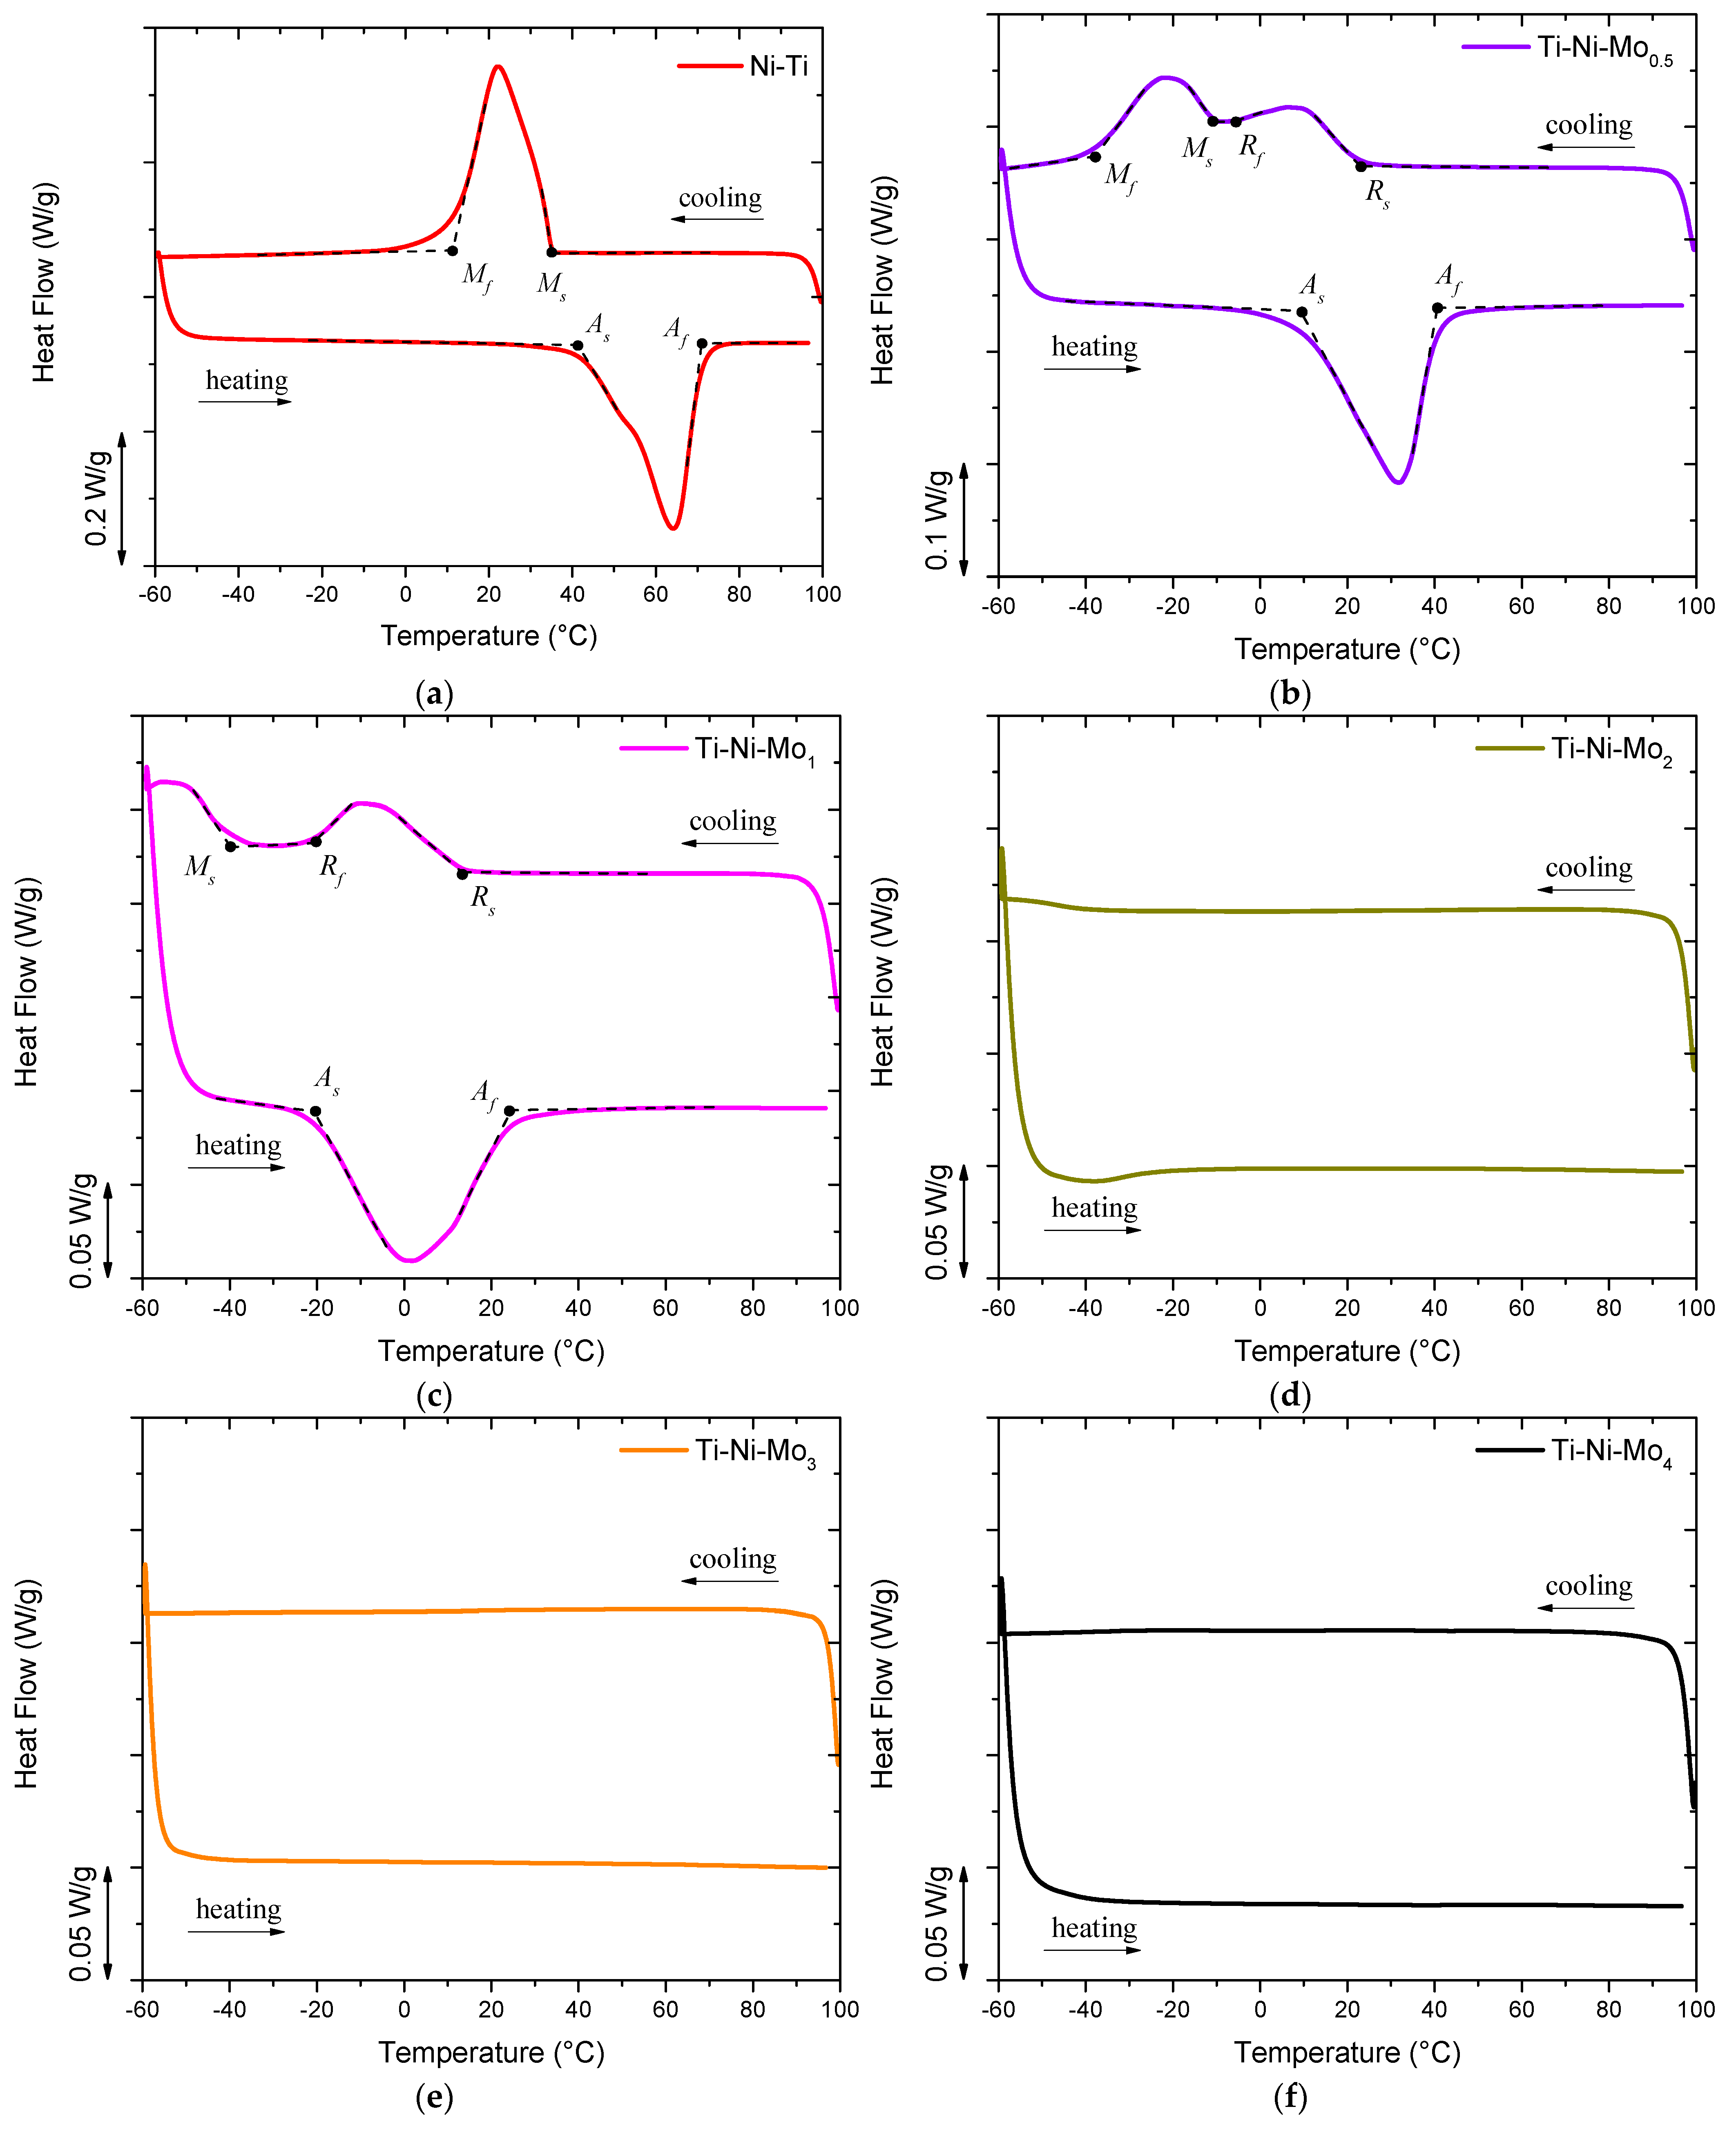
3.3. Transformation Temperatures
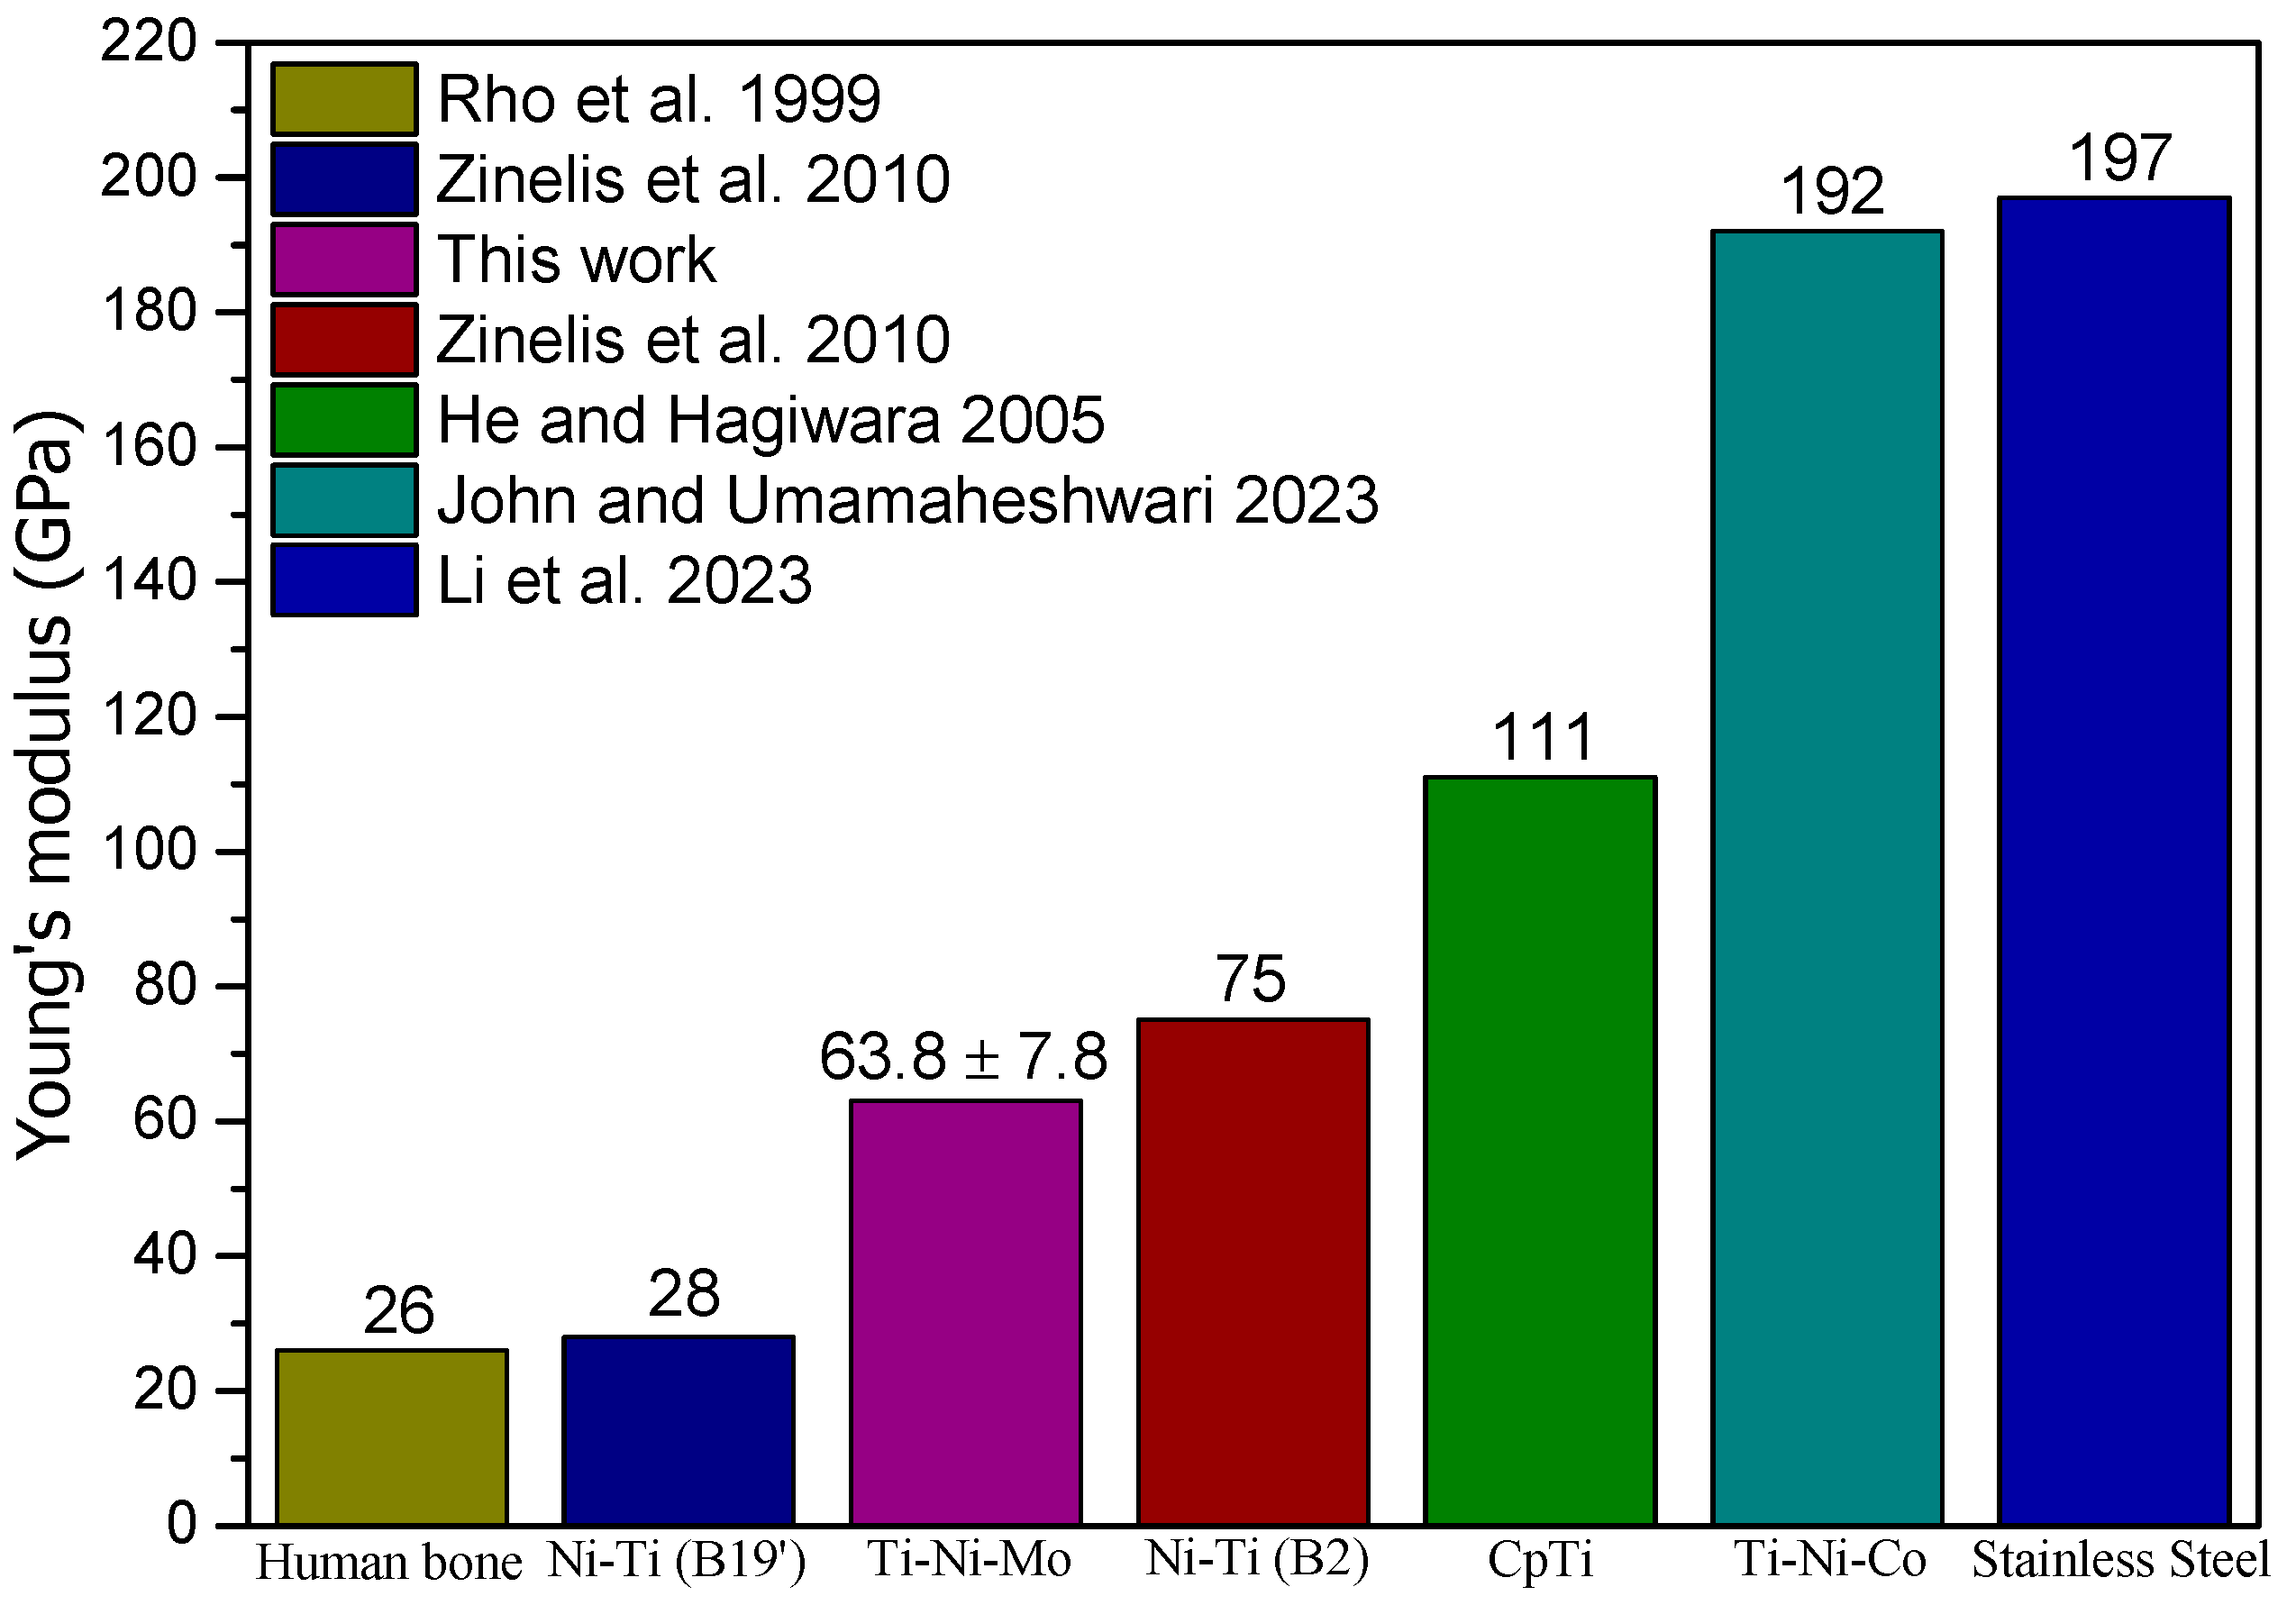
3.4. Microhardness and Modulus of Elasticity
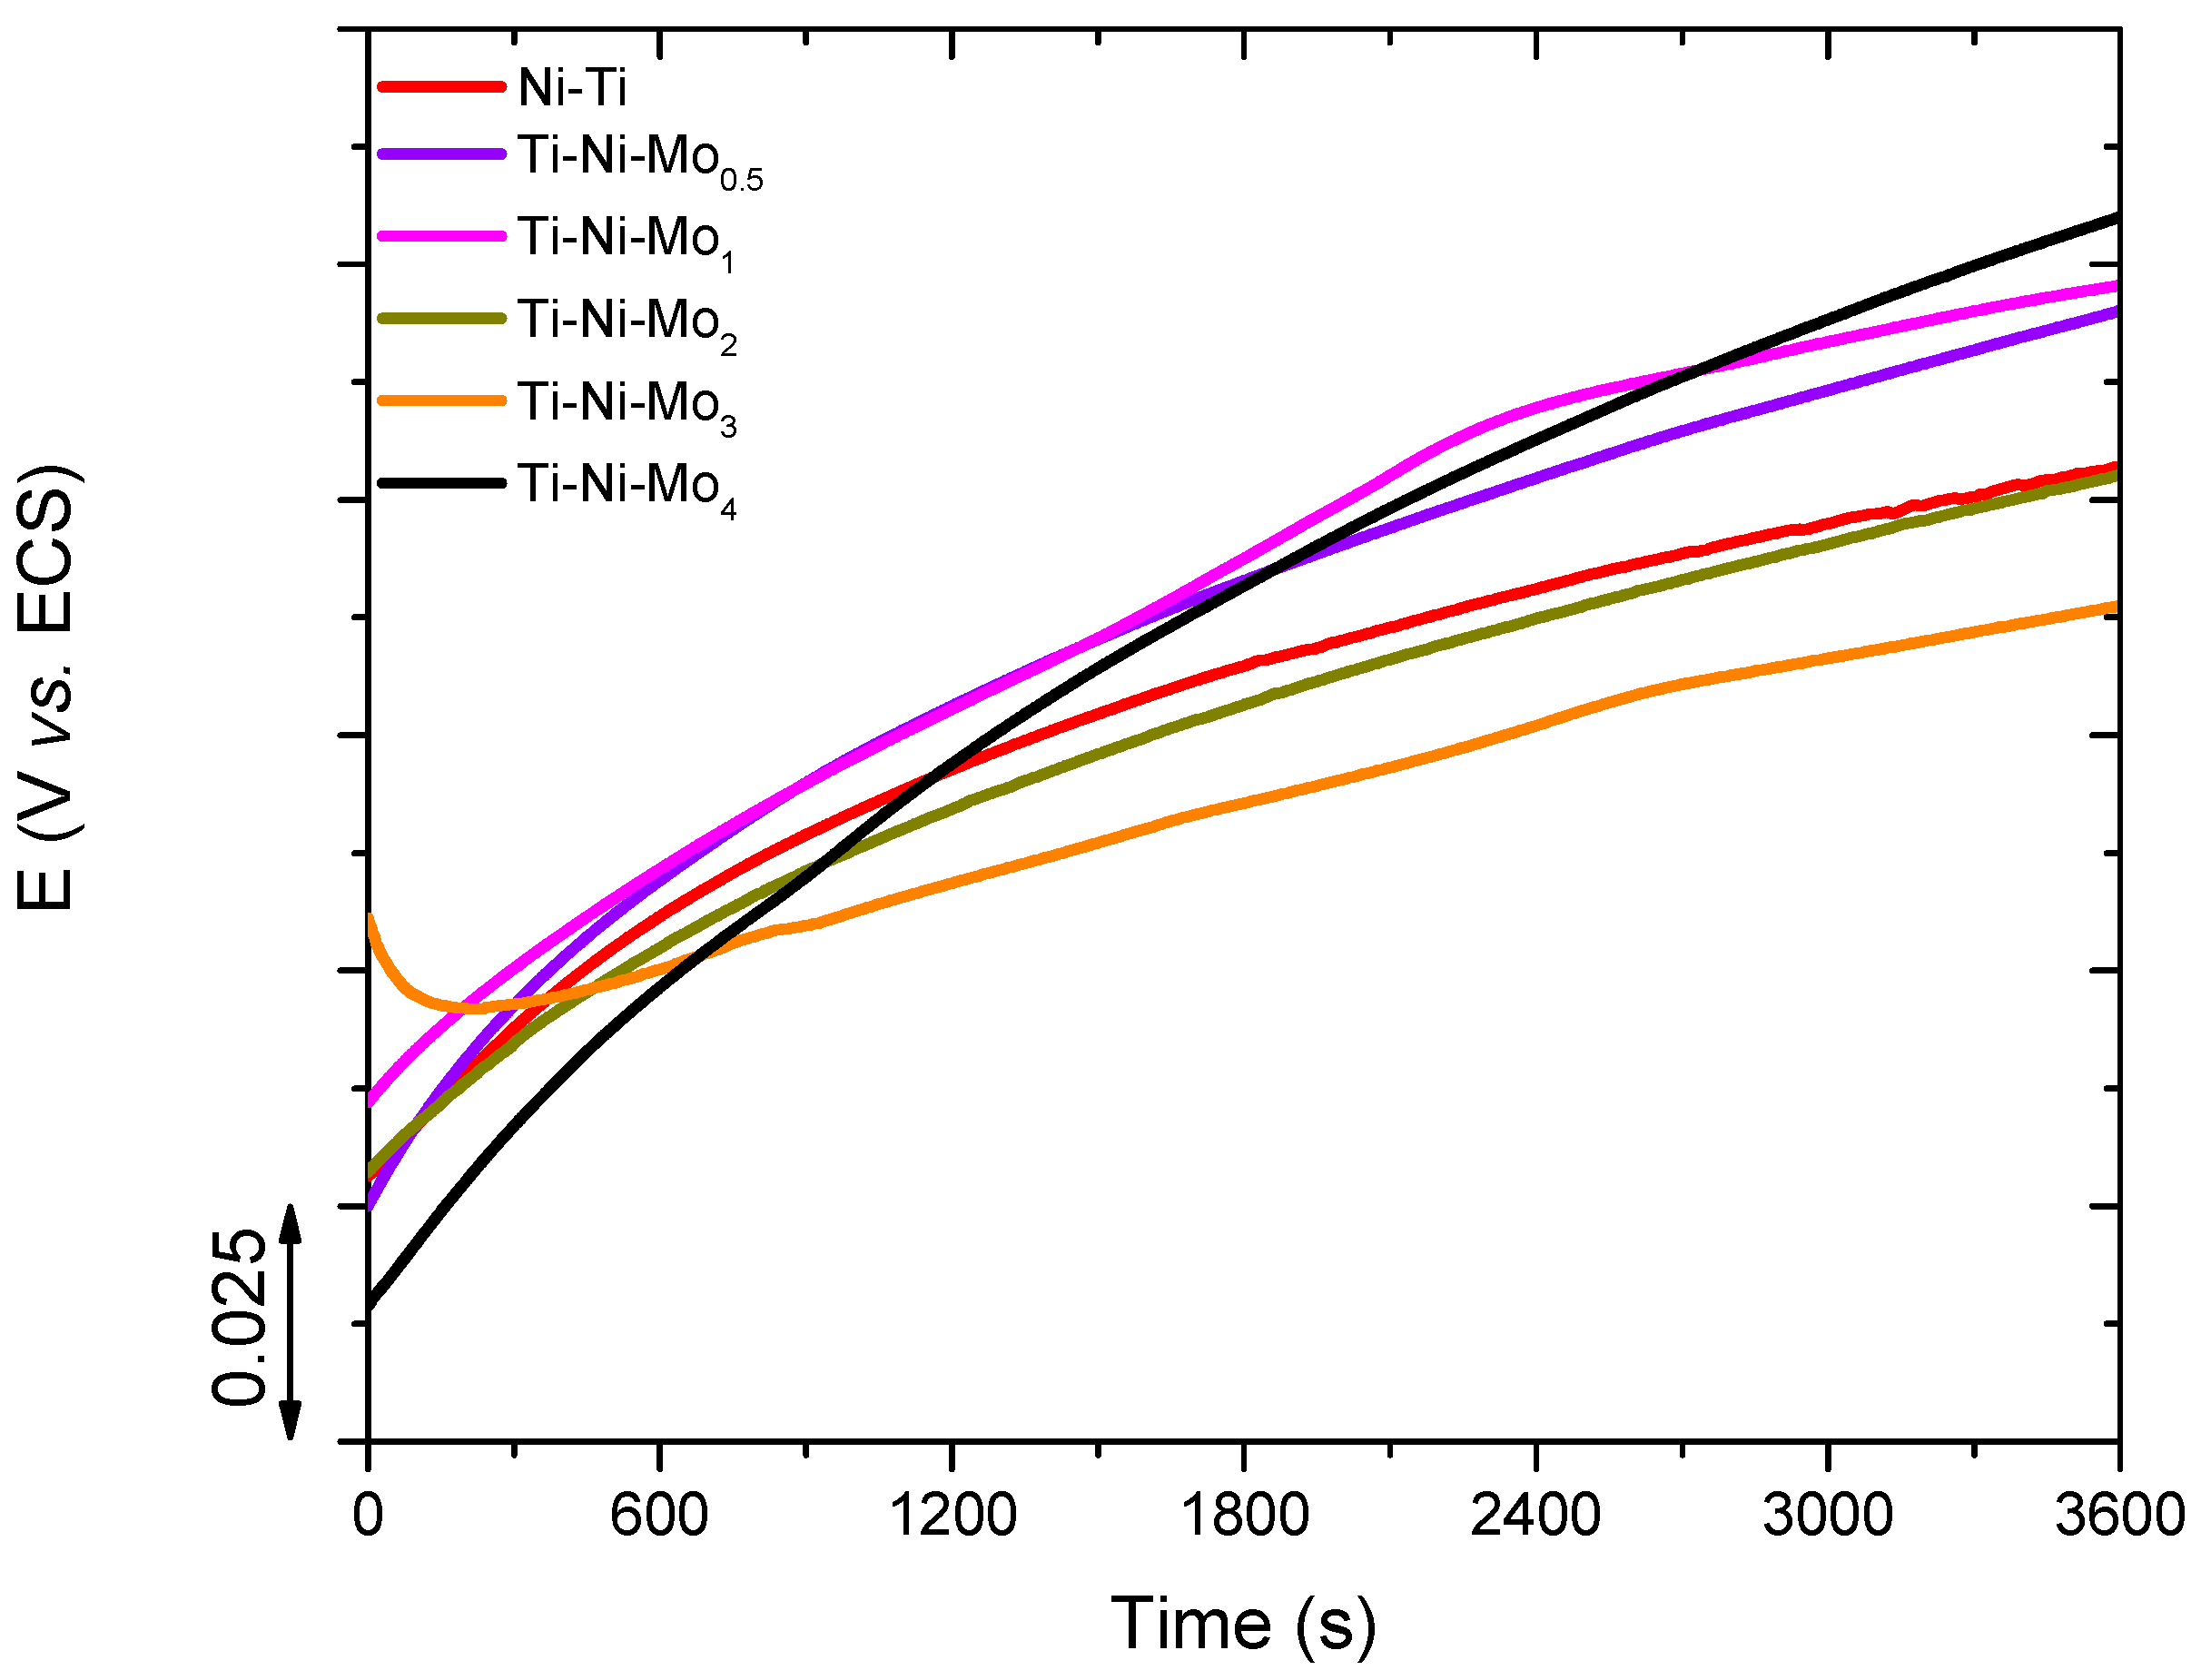
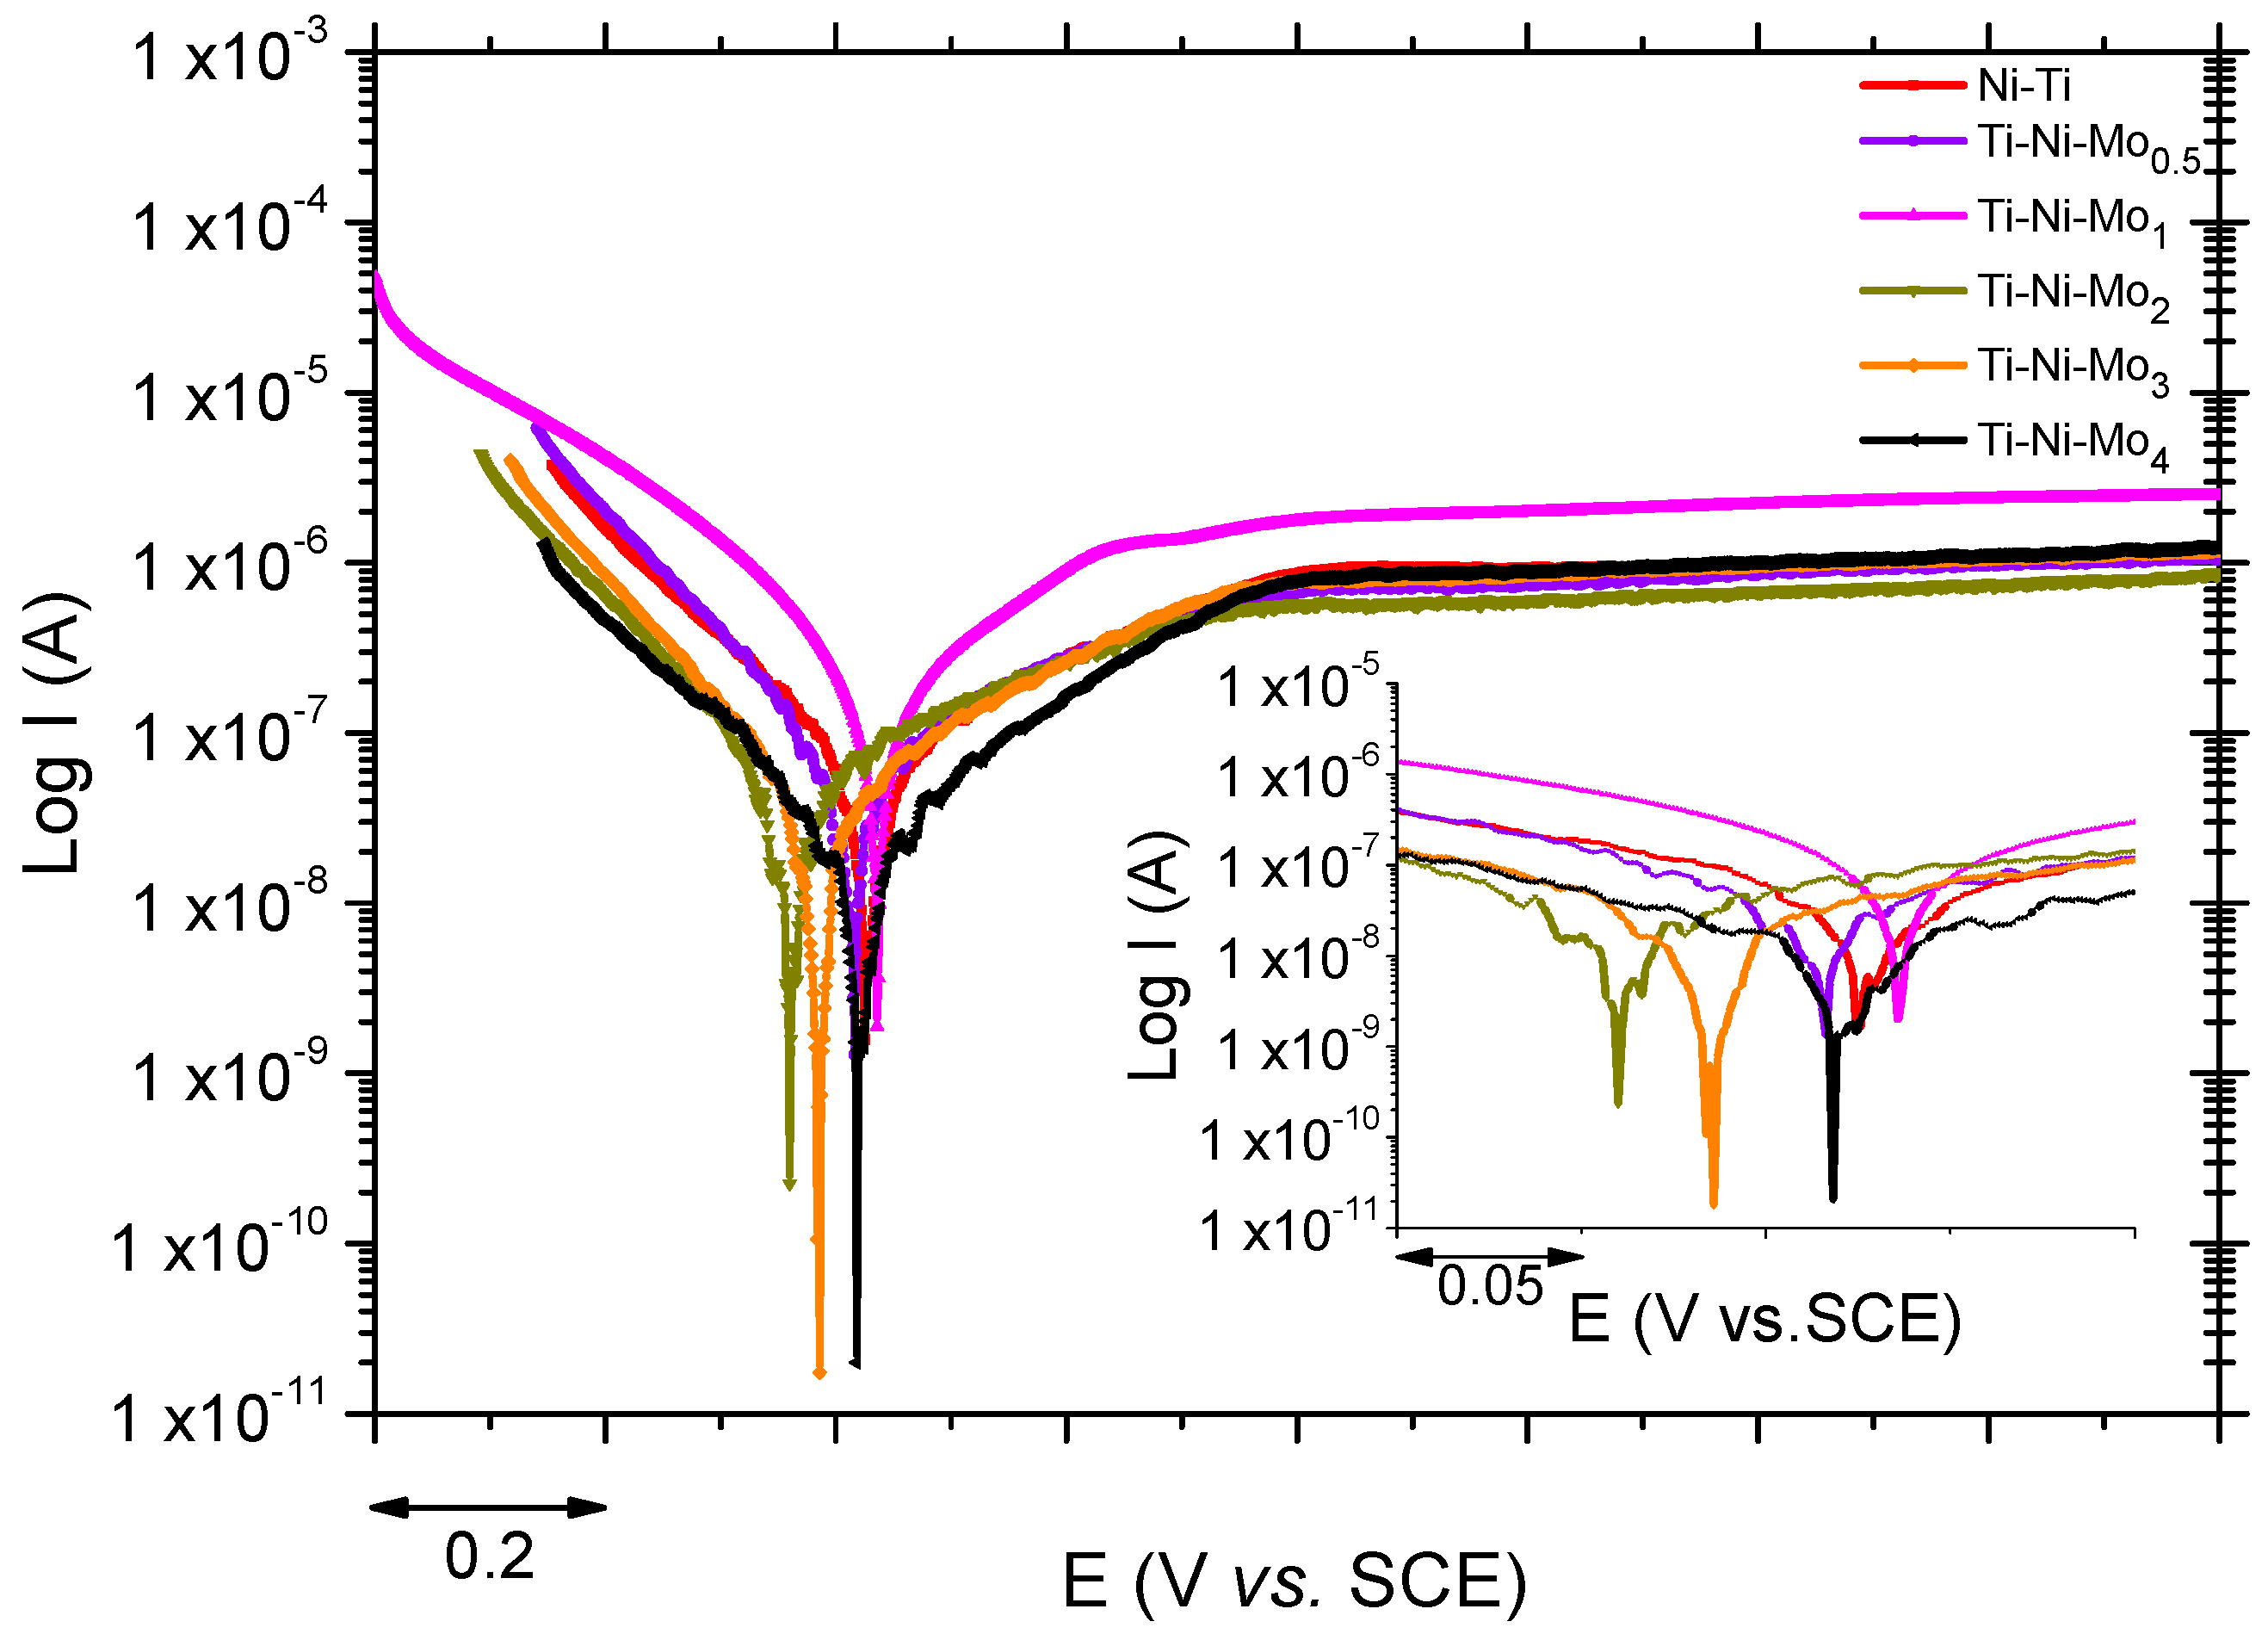
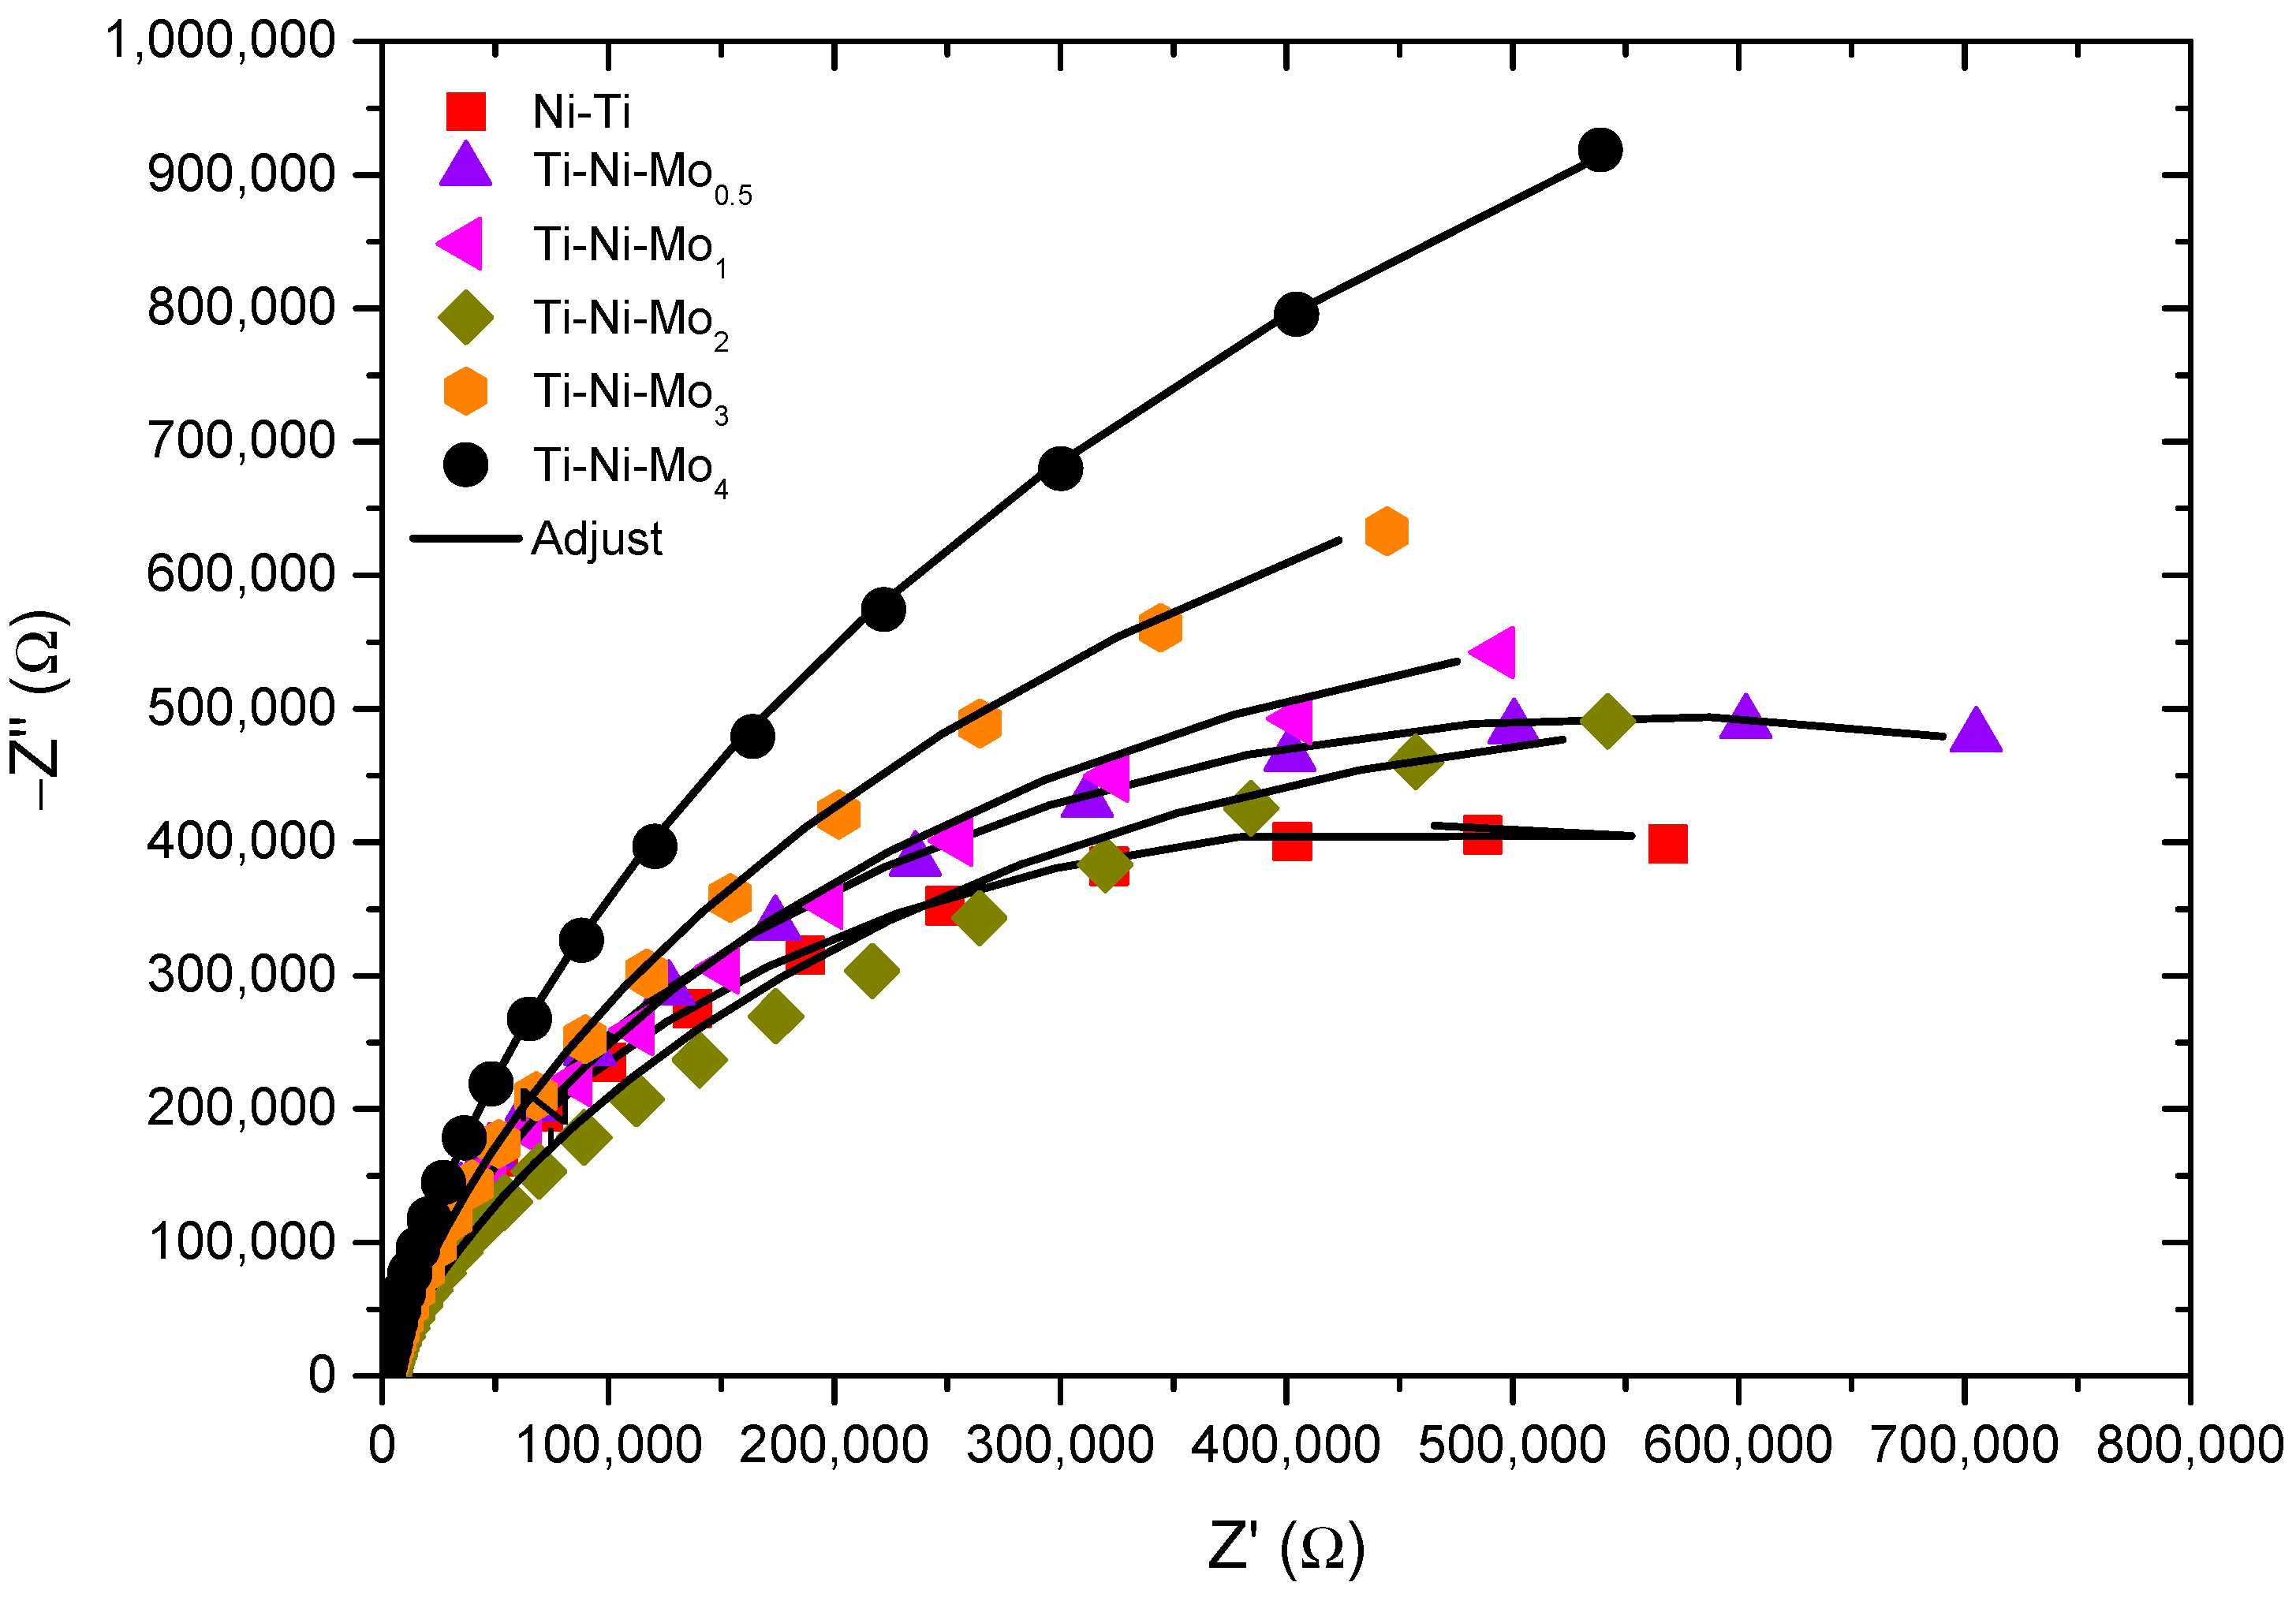
3.5. Corrosion Resistance Evaluation
4. Conclusions
- The addition of Mo in the Ni–Ti binary alloy and the changes in the Mo content in the ternary alloys caused changes in the microstructure, with the formation of different phases, precipitates (TiNi, Ti2Ni), and oxides (Ti4Ni2O, TiO, and TiO3).
- XRD analysis revealed an increase in the stability of the B2 phase when comparing Ni–Ti and Ti–Ni–Mo0.5 alloys. In this analysis, the monoclinic martensite phase (B19’) was identified only for the Ni–Ti sample without molybdenum, suggesting that the change in the chemical composition of the alloy changed its microstructure to the austenite phase (B2).
- The thermal analysis carried out by DSC tests indicated that adding molybdenum in the Ni–Ti alloy caused the appearance of the R-phase, and the increase in the molybdenum content in the alloy caused a shift of the phase transformation peaks to lower temperatures.
- The results referring to microhardness and modulus of elasticity showed that the increase in molybdenum content tended to decrease the hardness and modulus of elasticity.
- Corrosion analysis revealed passivation film formation in all samples, giving these alloys high resistance to corrosion. In addition, it was verified that adding molybdenum to the Ni–Ti alloy increased corrosion resistance.
5. Patents
Author Contributions
Funding
Data Availability Statement
Acknowledgments
Conflicts of Interest
References
- Frost, M.; Jury, A.; Heller, L.; Sedlák, P. Experimentally Validated Constitutive Model for NiTi-Based Shape Memory Alloys Featuring Intermediate R-Phase Transformation: A Case Study of Ni48Ti49Fe3. Mater. Des. 2021, 203, 109593. [Google Scholar] [CrossRef]
- Haskins, J.B.; Malmir, H.; Honrao, S.J.; Sandoval, L.A.; Lawson, J.W. Low-Temperature Mechanical Instabilities Govern High-Temperature Thermodynamics in the Austenite Phase of Shape Memory Alloy Constituents: Ab Initio Simulations of NiTi, NiZr, NiHf, PdTi, and PtTi. Acta Mater. 2021, 212, 116872. [Google Scholar] [CrossRef]
- Choe, H.C.; Kim, J.U.; Park, S.K. Effects of Mo Content on Surface Characteristics of Dental Ni-Ti Alloys. Corros. Sci. Technol. 2023, 22, 64–72. [Google Scholar] [CrossRef]
- Kumar, P.; Waghmare, U.V. First-Principles Phonon-Based Model and Theory of Martensitic Phase Transformation in NiTi Shape Memory Alloy. Materialia 2020, 9, 100602. [Google Scholar] [CrossRef]
- Silva, P.C.S.; Grassi, E.N.D.; Araújo, C.J.; Delgado, J.M.P.Q.; Lima, A.G.B. NiTi SMA Superelastic Micro Cables: Thermomechanical Behavior and Fatigue Life under Dynamic Loadings. Sensors 2022, 22, 8045. [Google Scholar] [CrossRef]
- Alshannag, M.J.; Alqarni, A.S.; Higazey, M.M. Superelastic Nickel–Titanium (NiTi)-Based Smart Alloys for Enhancing the Performance of Concrete Structures. Materials 2023, 16, 4333. [Google Scholar] [CrossRef]
- Montenegro, E.O.S.; Grassi, E.N.D.; Simões, J.B.; Sales da Silva, P.C.; de Araújo, C.J. NiTi Shape Memory Alloy Cellular Meshes: Manufacturing by Investment Casting and Characterization. Smart Mater. Struct. 2020, 29, 125008. [Google Scholar] [CrossRef]
- Da Cruz Gomes, A.A.; Grassi, E.N.D.; Da Silva, P.C.S.; De Araújo, C.J. Mechanical Behavior of a NiTi Superelastic Bone Plate Obtained by Investment Casting Assisted by Additive Manufacturing. Smart Mater. Struct. 2020, 30, 025009. [Google Scholar] [CrossRef]
- de Souza, E.F.; da Silva, P.C.S.; Grassi, E.N.D.; de Araújo, C.J.; de Lima, A.G.B. Critical Frequency of Self-Heating in a Superelastic Ni-Ti Belleville Spring: Experimental Characterization and Numerical Simulation. Sensors 2021, 21, 7140. [Google Scholar] [CrossRef]
- Chaudhari, R.; Kevalramani, A.; Vora, J.; Khanna, S.; Patel, V.K.; Pimenov, D.Y.; Giasin, K. Parametric Optimization and Influence of Near-Dry WEDM Variables on Nitinol Shape Memory Alloy. Micromachines 2022, 13, 1026. [Google Scholar] [CrossRef]
- Yahia, L.L. Yahia Shape Memory Implants; Springer: Berlin, Germany, 2000; ISBN 9783642641183. [Google Scholar]
- Wagner, M.F.X.; Dey, S.R.; Gugel, H.; Frenzel, J.; Somsen, C.; Eggeler, G. Effect of Low-Temperature Precipitation on the Transformation Characteristics of Ni-Rich NiTi Shape Memory Alloys during Thermal Cycling. Intermetallics 2010, 18, 1172–1179. [Google Scholar] [CrossRef]
- Kim, J.I.; Liu, Y.; Miyazaki, S. Ageing-Induced Two-Stage R-Phase Transformation in Ti-50.9 at.% Ni. Acta Mater. 2004, 52, 487–499. [Google Scholar] [CrossRef]
- Saedi, S.; Turabi, A.S.; Andani, M.T.; Haberland, C.; Karaca, H.; Elahinia, M. The Influence of Heat Treatment on the Thermomechanical Response of Ni-Rich NiTi Alloys Manufactured by Selective Laser Melting. J. Alloys Compd. 2016, 677, 204–210. [Google Scholar] [CrossRef]
- Karimzadeh, M.; Aboutalebi, M.R.; Salehi, M.T.; Abbasi, S.M.; Morakabati, M. Effects of Thermomechanical Treatments on the Martensitic Transformation and Critical Stress of Ti-50.2 at.% Ni Alloy. J. Alloys Compd. 2015, 637, 171–177. [Google Scholar] [CrossRef]
- Todoroki, T.; Tamura, H. Effect of Heat Treatment after Cold Working on the Phase Transformation in TiNi Alloy. Trans. Jpn. Inst. Met. 1987, 28, 83–94. [Google Scholar] [CrossRef]
- Nam, T.; Chung, D.; Noh, J.; Lee, H. Phase Transformation Behavior and Wire Drawing Properties of Ti-Ni-Mo Shape Memory Alloys. J. Mater. Sci. 2001, 6, 4181–4188. [Google Scholar] [CrossRef]
- Manjeri, R.M.; Norwich, D.; Sczerzenie, F.; Huang, X.; Long, M.; Ehrlinspiel, M. A Study of Thermo-Mechanically Processed High Stiffness NiTiCo Shape Memory Alloy. J. Mater. Eng. Perform. 2016, 25, 894–900. [Google Scholar] [CrossRef]
- Hsieh, S.F.; Wu, S.K. A Study on the Nickel-Rich Ternary Ti-Ni-Al Shape Memory Alloys. J. Mater. Sci. 1997, 32, 989–996. [Google Scholar] [CrossRef]
- Fukuda, T.; Todai, M.; Kakeshita, T. Isothermal Martensitic Transformation of the R-Phase in a Ti-44Ni-6Fe at.% Alloy. Scr. Mater. 2013, 69, 239–241. [Google Scholar] [CrossRef]
- Xi, R.; Jiang, H.; Li, G.; Zhang, Z.; Zhao, G.; Vanmeensel, K.; Kustov, S.; Van Humbeeck, J.; Wang, X. Effect of Fe Addition on the Microstructure, Transformation Behaviour and Superelasticity of NiTi Alloys Fabricated by Laser Powder Bed Fusion. Virtual Phys. Prototyp. 2023, 18, e2126376. [Google Scholar] [CrossRef]
- Mohammed, S.H.; Aljubouri, A.A.; Mohammed, M.A. The Effect of Cobalt Element Addition on the Characteristics of Equiatomic NiTi Shape Memory Alloy. J. Phys. Conf. Ser. 2020, 1660, 012038. [Google Scholar] [CrossRef]
- Kim, Y.W. Martensitic Transformation Behavior and Mechanical Properties of Highly Porous Ti-Ni-Mo Scaffolds. J. Alloys Compd. 2020, 821, 153220. [Google Scholar] [CrossRef]
- Nam, T.; Chung, D.; Kim, J.; Kang, S. Phase Transformation Behaviors and Shape Memory Characteristics of Ti–Ni–Mo Alloys. Mater. Lett. 2002, 52, 234–239. [Google Scholar] [CrossRef]
- Liu, F.; Ding, Z.; Li, Y.; Xu, H. Phase Transformation Behaviors and Mechanical Properties of TiNiMo Shape Memory Alloys. Intermetallics 2005, 13, 357–360. [Google Scholar] [CrossRef]
- Kim, Y.W. Martensitic Transformation Behaviors of Rapidly Solidified Ti–Ni–Mo Powders. Mater. Res. Bull. 2012, 47, 2956–2960. [Google Scholar] [CrossRef]
- Kim, Y.W.; Jo, B.G.; Young, S.; Nam, T.H. Shape Memory Characteristics of Porous Ti-Ni-Mo Alloys Prepared by Solid State Sintering. Mater. Res. Bull. 2016, 82, 45–49. [Google Scholar] [CrossRef]
- Medeiros, M.A.R.; de Araújo, C.J. Thermal, Microstructural and Elastic Modulus Behavior of Ti50Ni50−xNbx (x = 0–25%at) Shape Memory Alloys Obtained by Plasma Arc Melting. J. Alloys Compd. 2021, 866, 158970. [Google Scholar] [CrossRef]
- ASTM-B600-11R17; Standard Guide for Descaling and Cleaning Titanium and Titanium Alloy Surfaces. Annual Book of ASTM; ASTM International: West Conshohocken, PA, USA, 2017; pp. 1–3.
- de Araújo, C.J.; Gomes, A.A.C.; Silva, J.A.; Cavalcanti, A.J.T.; Reis, R.P.B.; Gonzalez, C.H. Fabrication of Shape Memory Alloys Using the Plasma Skull Push–Pull Process. J. Mater. Process. Technol. 2009, 209, 3657–3664. [Google Scholar] [CrossRef]
- ASTM-E407-99; Standard Practice for Microetching Metals and Alloys. Annual Book of ASTM; ASTM International: West Conshohocken, PA, USA, 2003; pp. 1–15.
- ASTM-F2004-05; Standard Test Method for Transformation Temperature of Nickel-Titanium Alloys by Thermal Analysis. ASTM International: West Conshohocken, PA, USA, 2010; p. 4.
- ASTM-F2129-08; Standard Test Method for Conducting Cyclic Potentiodynamic Polarization Measurements to Determine the Corrosion Susceptibility of Small Implant Devices. ASTM International: West Conshohocken, PA, USA, 2015; p. 9.
- Popov, B.N. Basics of Corrosion Measurements. In Corrosion Engineering; Elsevier: Amsterdam, The Netherlands, 2015; pp. 181–237. ISBN 978-0-444-62722-3. [Google Scholar]
- Ramos, A.P.; de Castro, W.B.; Costa, J.D.; de Santana, R.A.C. Influence of Zirconium Percentage on Microhardness and Corrosion Resistance of Ti50Ni50-XZrx Shape Memory Alloys. Mater. Res. 2019, 22, e20190118. [Google Scholar] [CrossRef]
- Hastuti, K.; Hamzah, E.; Hashim, J. Effect of Ageing Treatment on the Microstructures of Ti-50.7at.%Ni Shape Memory Alloy. Adv. Mater. Res. 2013, 686, 180–191. [Google Scholar] [CrossRef]
- Zhang, D.T.; Guo, B.; Tong, Y.X.; Tian, B.; Li, L.; Zheng, Y.F.; Gunderov, D.V.; Valiev, R.Z. Effect of Annealing Temperature on Martensitic Transformation of Ti49.2Ni50.8 Alloy Processed by Equal Channel Angular Pressing. Trans. Nonferrous Met. Soc. China 2016, 26, 448–455. [Google Scholar] [CrossRef]
- Toro, A.; Zhou, F.; Wu, M.H.; Van Geertruyden, W.; Misiolek, W.Z. Characterization of Non-Metallic Inclusions in Superelastic NiTi Tubes. J. Mater. Eng. Perform. 2009, 18, 448–458. [Google Scholar] [CrossRef]
- Rahim, M.; Frenzel, J.; Frotscher, M.; Pfetzing-Micklich, J.; Steegmüller, R.; Wohlschlögel, M.; Mughrabi, H.; Eggeler, G. Impurity Levels and Fatigue Lives of Pseudoelastic NiTi Shape Memory Alloys. Acta Mater. 2013, 61, 3667–3686. [Google Scholar] [CrossRef]
- Mentz, J.; Frenzel, J.; Wagner, M.F.X.; Neuking, K.; Eggeler, G.; Buchkremer, H.P.; Stöver, D. Powder Metallurgical Processing of NiTi Shape Memory Alloys with Elevated Transformation Temperatures. Mater. Sci. Eng. A 2008, 491, 270–278. [Google Scholar] [CrossRef]
- Kai, W.Y.; Chang, K.C.; Wu, H.F.; Chen, S.W.; Yeh, A.C. Formation Mechanism of Ni2Ti4Ox in NITI Shape Memory Alloy. Materialia 2019, 5, 100194. [Google Scholar] [CrossRef]
- Hsieh, S.F.; Hsue, A.W.J.; Chen, S.L.; Lin, M.H.; Ou, K.L.; Mao, P.L. EDM Surface Characteristics and Shape Recovery Ability of Ti35.5Ni48.5Zr16 and Ni60Al24.5Fe15.5 Ternary Shape Memory Alloys. J. Alloys Compd. 2013, 571, 63–68. [Google Scholar] [CrossRef]
- Swain, B.; Chatterjee, S.; Mohapatra, S.S.; Behera, A. Mechanical Properties Evaluation and Parametric Optimization of Atmospheric Plasma Spray NiTi Coating. J. Mater. Eng. Perform. 2022, 31, 8270–8284. [Google Scholar] [CrossRef]
- Ifeolu Odetola, P.; Popoola, A.P.I.; Ajenifuja, E.; Popoola, O. Effects of Temperature on the Microstructure and Physico-Mechanical Properties of TiNiAl-SiC Composite by Spark Plasma Sintering Technique. Mater. Res. Express 2019, 6, 085802. [Google Scholar] [CrossRef]
- Chan, C.W.; Man, H.C.; Yue, T.M. Effect of Post-Weld Heat-Treatment on the Oxide Film and Corrosion Behaviour of Laser-Welded Shape Memory NiTi Wires. Corros. Sci. 2012, 56, 158–167. [Google Scholar] [CrossRef]
- Rajadurai, M.; Muthuchamy, A.; Annamalai, A.R.; Agrawal, D.K.; Jen, C.P. Effect of Molybdenum (Mo) Addition on Phase Composition, Microstructure, and Mechanical Properties of Pre-Alloyed Ti6al4v Using Spark Plasma Sintering Technique. Molecules 2021, 26, 2894. [Google Scholar] [CrossRef]
- Xu, H.B.; Meng, L.J.; Xu, J.; Li, Y.; Zhao, X.Q. Mechanical Properties and Oxidation Characteristics of TiNiAl(Nb) Intermetallics. Intermetallics 2007, 15, 778–782. [Google Scholar] [CrossRef]
- Marattukalam, J.J.; Balla, V.K.; Das, M.; Bontha, S.; Kalpathy, S.K. Effect of Heat Treatment on Microstructure, Corrosion, and Shape Memory Characteristics of Laser Deposited NiTi Alloy. J. Alloys Compd. 2018, 744, 337–346. [Google Scholar] [CrossRef]
- Gale, W.F.; Totemeier, T.C. Smithells Metals Reference Book; Elsevier: Amsterdam, The Netherlands, 2003; ISBN 0080480969. [Google Scholar]
- Klopotov, A.; Gunther, V.; Marchenko, E.; Baigonakova, G.; Chekalkin, T.; Kim, J.S.; Kang, J.H. Impact of Annealing Temperature on Martensite Transformations and Structure of Quaternary Ti50Ni47.7Mo0.3V2 Alloy. Adv. Mater. Lett. 2016, 8, 122–127. [Google Scholar] [CrossRef]
- Chen, Y.; Jiang, H.C.; Liu, S.W.; Rong, L.J.; Zhao, X.Q. The Effect of Mo Additions to High Damping Ti-Ni-Nb Shape Memory Alloys. Mater. Sci. Eng. A 2009, 512, 26–31. [Google Scholar] [CrossRef]
- Jiang, H.C.; Rong, L.J. Microstructures and Mechanical Properties of Porous Ti51Ni(49-x)Mox Shape Memory Alloys. Mater. Sci. Forum 2007, 546–549, 2127–2132. [Google Scholar] [CrossRef]
- Pan, G.; Cao, Z.; Shi, J.; Wei, M.; Xu, L.; Meng, X. Different Mechanical Response of TiNi Film Induced by the Shape of Indenter during Nanoindentation. Sens. Actuators A Phys. 2014, 217, 75–80. [Google Scholar] [CrossRef]
- Huang, X.; Nohava, J.; Zhang, B.; Ramirez, A.G. Nanoindentation of NiTi Shape Memory Thin Films at Elevated Temperatures. Int. J. Smart Nano Mater. 2011, 2, 39–49. [Google Scholar] [CrossRef]
- Birlik, I.; Ak Azem, N.F.; Toparli, M.; Celik, E.; Koc Delice, T.; Yildirim, S.; Bardakcioglu, O.; Dikici, T. Preparation and Characterization of Ni–TiO2 Nanocomposite Coatings Produced by Electrodeposition Technique. Front. Mater. 2016, 3, 46. [Google Scholar] [CrossRef]
- Ozaki, T.; Matsumoto, H.; Watanabe, S.; Hanada, S. Beta Ti Alloys with Low Young’s Modulus. Mater. Trans. 2004, 45, 2776–2779. [Google Scholar] [CrossRef]
- Zhao, T.; Li, Y.; Xiang, Y.; Zhao, X.; Zhang, T. Surface Characteristics, Nano-Indentation and Corrosion Behavior of Nb Implanted NiTi Alloy. Surf. Coat. Technol. 2011, 205, 4404–4410. [Google Scholar] [CrossRef]
- Shayesteh Moghaddam, N.; Taheri Andani, M.; Amerinatanzi, A.; Haberland, C.; Huff, S.; Miller, M.; Elahinia, M.; Dean, D. Metals for Bone Implants: Safety, Design, and Efficacy. Biomanuf. Rev. 2016, 1, 1. [Google Scholar] [CrossRef]
- Rho, J.Y.; Roy, M.E.; Tsui, T.Y.; Pharr, G.M. Elastic Properties of Microstructural Components of Human Bone Tissue as Measured by Nanoindentation. J. Biomed. Mater. Res. 1999, 45, 48–54. [Google Scholar] [CrossRef]
- Zinelis, S.; Eliades, T.; Eliades, G. A Metallurgical Characterization of Ten Endodontic Ni-Ti Instruments: Assessing the Clinical Relevance of Shape Memory and Superelastic Properties of Ni-Ti Endodontic Instruments. Int. Endod. J. 2010, 43, 125–134. [Google Scholar] [CrossRef] [PubMed]
- He, G.; Hagiwara, M. Bimodal Structured Ti-Base Alloy with Large Elasticity and Low Young’s Modulus. Mater. Sci. Eng. C 2005, 25, 290–295. [Google Scholar] [CrossRef]
- John, R.; Umamaheshwari, M. Ductility Reduction upon Cobalt Substitution in B2 NiTi. Comput. Mater. Sci. 2023, 220, 112049. [Google Scholar] [CrossRef]
- Li, S.; Li, J.; Sun, G.; Deng, D. Modeling of Welding Residual Stress in a Dissimilar Metal Butt-Welded Joint between P92 Ferritic Steel and SUS304 Austenitic Stainless Steel. J. Mater. Res. Technol. 2023, 23, 4938–4954. [Google Scholar] [CrossRef]
- De Oliveira, A.G.; Giacomelli, F.C.; Giacomelli, C.; Spinelli, A. Microstructure and Surface Composition Effects on the Transpassivation of NiTi Wires for Implant Purposes. J. Braz. Chem. Soc. 2005, 16, 131–138. [Google Scholar] [CrossRef]
- Saebnoori, E.; Shahrabi, T.; Sanjabi, S.; Ghaffari, M.; Barber, Z.H. Surface Characteristics and Electrochemical Behaviour of Sputter-Deposited NiTi Thin Film. Philos. Mag. 2015, 95, 1696–1716. [Google Scholar] [CrossRef]
- Li, K.; Li, Y.; Huang, X.; Gibson, D.; Zheng, Y.; Liu, J.; Sun, L.; Fu, Y.Q. Surface Microstructures and Corrosion Resistance of Ni-Ti-Nb Shape Memory Thin Films. Appl. Surf. Sci. 2017, 414, 63–67. [Google Scholar] [CrossRef]
- Mareci, D.; Chelariu, R.; Bolat, G.; Cailean, A.; Grancea, V.; Sutiman, D. Electrochemical Behaviour of Ti Alloys Containing Mo and Ta as β-Stabilizer Elements for Dental Application. Trans. Nonferrous Met. Soc. China 2013, 23, 3829–3836. [Google Scholar] [CrossRef]
- Zhou, Y.L.; Luo, D.M. Corrosion Behavior of Ti-Mo Alloys Cold Rolled and Heat Treated. J. Alloys Compd. 2011, 509, 6267–6272. [Google Scholar] [CrossRef]
- Abdel Hamid, Z.; Hassan, H.B. Influence of Electrodeposition Parameters on the Characteristics of NiMoP Film. Surf. Coat. Technol. 2012, 212, 37–45. [Google Scholar] [CrossRef]
- Wu, Y.; He, H. Electrodeposited Nickel–Iron–Carbon–Molybdenum Film as Efficient Bifunctional Electrocatalyst for Overall Water Splitting in Alkaline Solution. Int. J. Hydrogen Energy 2019, 44, 1336–1344. [Google Scholar] [CrossRef]
- Liu, K.; Zhang, H.; Xiu, M.; Huang, Z.; Huang, H.; Xu, Y.; Zhou, R.; Xiao, H. Microstructure Evolution, Mechanical Properties, and Corrosion Resistance of Hot Rolled and Annealed Ti-Mo-Ni Alloy. Metals 2023, 13, 566. [Google Scholar] [CrossRef]


| Ni–Ti | Ti–Ni–Mo0.5 | Ti–Ni–Mo1 | Ti–Ni–Mo2 | Ti–Ni–Mo3 | Ti–Ni–Mo4 |
|---|---|---|---|---|---|
| Ti50–Ni50 | Ti50–Ni49.5– (0.5 at.% Mo) | Ti50–Ni49– (1 at.% Mo) | Ti50–Ni48– (2 at.% Mo) | Ti50–Ni47– (3 at.% Mo) | Ti50–Ni46– (4 at.% Mo) |
| Reagents | NaCl | KCl | Na2HPO4 | KH2PO4 |
|---|---|---|---|---|
| Concentration (g/L) | 8.0 | 0.2 | 1.15 | 0.2 |
| Alloys | Phases | Ti (at.%) | Ni (at.%) | Mo (at.%) | O (at.%) |
|---|---|---|---|---|---|
| Ni–Ti | B19′ | 52.3 ± 0.1 | 47.7 ± 0.1 | - | |
| Ti–Ni–Mo0.5 | Ti2Ni (Mo) | 67.7 ± 0.03 | 32.1 ± 0.02 | 0.2 ± 0.01 | - |
| Ti4Ni2O (Mo) | 47.0 ± 0.3 | 33.5 ± 1.9 | 2.0 ± 0.4 | 17.5 ± 1.2 | |
| B19′-Matrix | 52.0 ± 0.12 | 47.4 ± 0.1 | 0.55 ± 0.01 | - | |
| Ti–Ni–Mo1 | TiMo + Ni | 51.5 ± 0.5 | 47.9 ± 0.5 | 0.6 ± 0.1 | - |
| B2-Matrix | 51.7 ± 0.05 | 47.1 ± 0.03 | 1.1 ± 0.01 | - | |
| Ti–Ni–Mo2 | Ti | 94.2 ± 4 | 5.7 ± 4 | - | - |
| TiNi | 51.2 ± 0.8 | 48.7 ± 0.8 | - | - | |
| Ti2Ni (Mo) | 62.7 ± 0.2 | 36.3 ± 0.2 | 1.04 ± 0.02 | - | |
| Ti4Ni2O (Mo) | 47 ± 0.3 | 33.5 ± 1.9 | 2.0 ± 0.4 | 17.5 ± 1.2 | |
| B2-Matrix | 51.1 ± 0.3 | 46.7 ± 0.3 | 2.2 ± 0.04 | - | |
| Ti–Ni–Mo3 | TiNi | 52.4 ± 0.3 | 47.6 ± 0.3 | - | - |
| Ti4Ni2O (Mo) | 47 ± 0.3 | 33.5 ± 1.9 | 2.0 ± 0.4 | 17.5 ± 1.2 | |
| B2-Matrix | 50.3 ± 0.8 | 46.2 ± 0.8 | 3.4 ± 0.03 | - | |
| Ti–Ni–Mo4 | B2-Matrix | 50.1 ± 0.2 | 45.5 ± 0.3 | 4.3 ± 0.2 | - |
| Samples | Rs (°C) | Rf (°C) | Ms (°C) | Mf (°C) | As (°C) | Af (°C) | ΔHR (J/g) | ΔHM (J/g) | ΔHA (J/g) |
|---|---|---|---|---|---|---|---|---|---|
| Ni–Ti | - | - | 35.1 | 11.8 | 41.7 | 70.9 | - | 26.2 | 27.2 |
| Ti–Ni–Mo0.5 | 22.2 | −5.6 | −10.9 | −37.7 | 8.8 | 40.5 | 2.9 | 6.2 | 18.9 |
| Ti–Ni–Mo1 | 12.4 | −11.7 | −20.9 | - | −21.7 | 23.9 | 3.7 | - | 15.2 |
| Alloy | Microhardness (HV) | Modulus of Elasticity (GPa) |
|---|---|---|
| Ni–Ti | 494 ± 12 | 71 ± 5 |
| Ti–Ni–Mo0.5 | 461 ± 29 | 74 ± 5 |
| Ti–Ni–Mo1 | 222 ± 18 | 52 ± 2 |
| Ti–Ni–Mo2 | 339 ± 24 | 65 ± 3 |
| Ti–Ni–Mo3 | 294 ± 39 | 65 ± 7 |
| Ti–Ni–Mo4 | 272 ± 17 | 63 ± 5 |
| Alloy | EOCP (V) | ECorr (V) | ICorr (μA) | ba (V/dec) | bc (V/dec) |
|---|---|---|---|---|---|
| Ni–Ti | −0.346 | −0.377 | 32.2 | 0.364 | 0.182 |
| Ti–Ni–Mo0.5 | −0.330 | −0.384 | 27.0 | 0.330 | 0.152 |
| Ti–Ni–Mo1 | −0.327 | −0.363 | 23.9 | 0.172 | 0.281 |
| Ti–Ni–Mo2 | −0.347 | −0.440 | 22.5 | 0.392 | 0.156 |
| Ti–Ni–Mo3 | −0.361 | −0.420 | 16.9 | 0.298 | 0.143 |
| Ti–Ni–Mo4 | −0.320 | −0.378 | 11.3 | 0.246 | 0.196 |
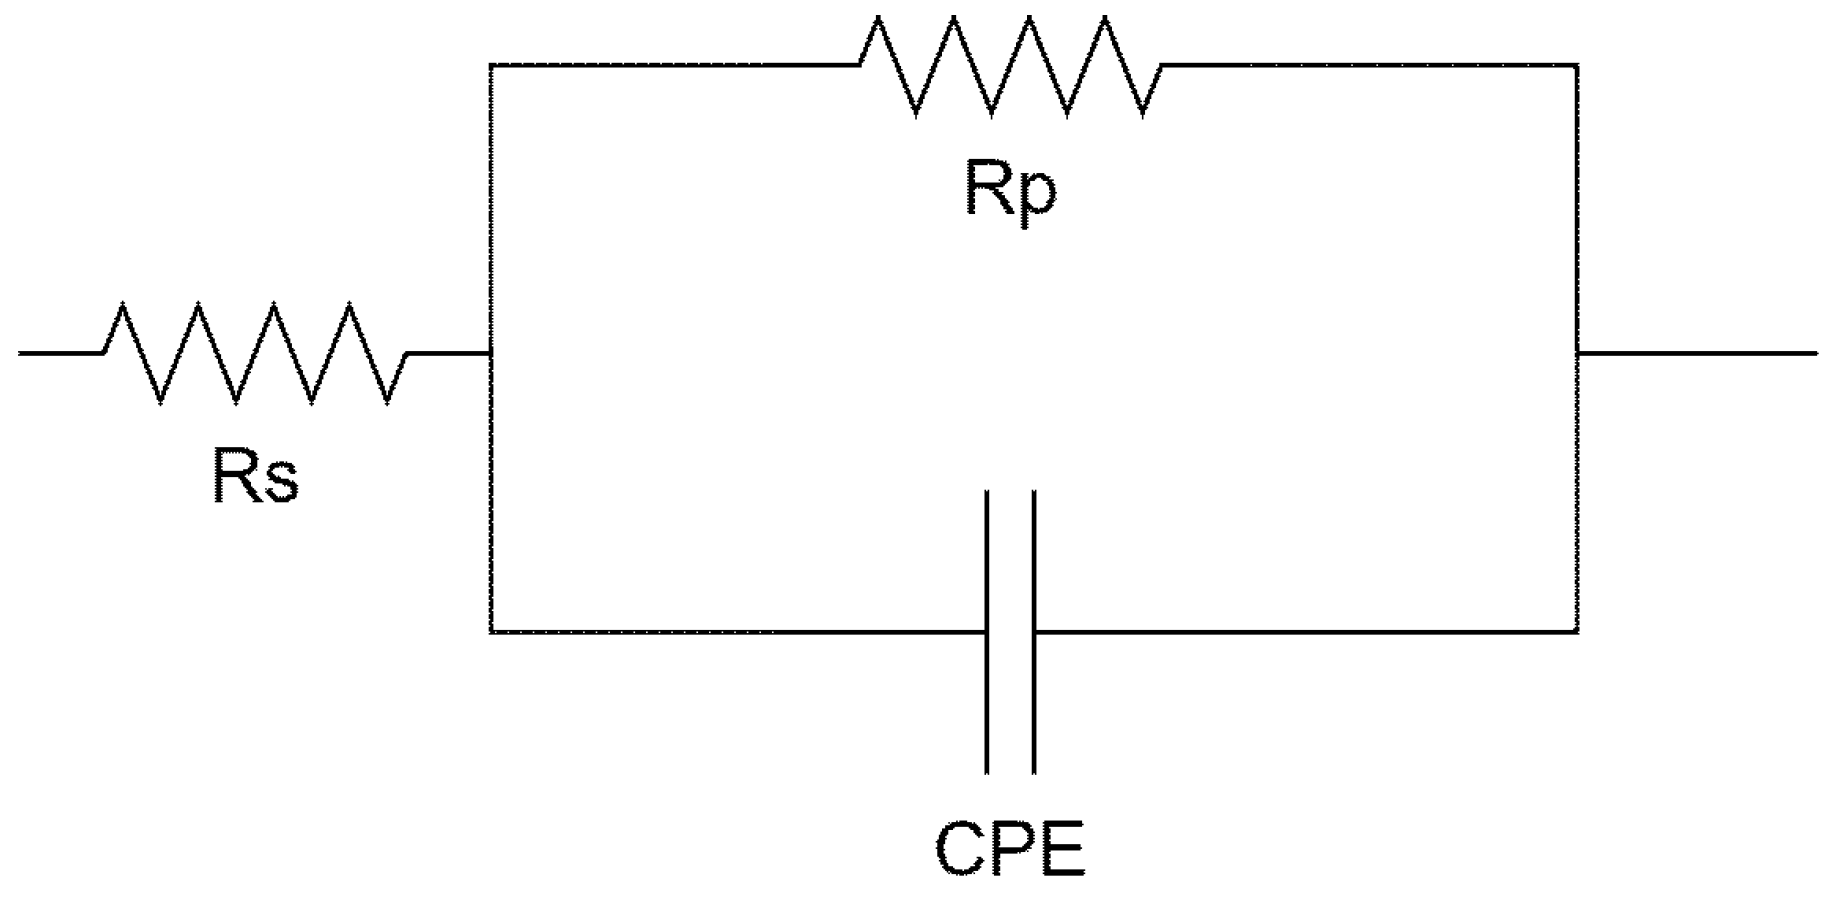
| Liga | Rs (Ω·cm2) | CPE (μF·cm−2) | n | Rp (KΩ·cm2) |
|---|---|---|---|---|
| Ni–Ti | 212 | 4.09 | 0.92 | 936 |
| Ti–Ni–Mo0.5 | 237 | 3.20 | 0.92 | 1120 |
| Ti–Ni–Mo1 | 206 | 2.69 | 0.88 | 1370 |
| Ti–Ni–Mo2 | 289 | 0.97 | 0.83 | 1280 |
| Ti–Ni–Mo3 | 212 | 2.81 | 0.88 | 1880 |
| Ti–Ni–Mo4 | 217 | 3.69 | 0.91 | 2710 |
Disclaimer/Publisher’s Note: The statements, opinions and data contained in all publications are solely those of the individual author(s) and contributor(s) and not of MDPI and/or the editor(s). MDPI and/or the editor(s) disclaim responsibility for any injury to people or property resulting from any ideas, methods, instructions or products referred to in the content. |
© 2023 by the authors. Licensee MDPI, Basel, Switzerland. This article is an open access article distributed under the terms and conditions of the Creative Commons Attribution (CC BY) license (https://creativecommons.org/licenses/by/4.0/).
Share and Cite
Costa, J.D.; Sousa, M.B.; Almeida, A.F.; Oliveira, J.A.M.; Silva, P.C.S.; Alves, J.J.N.; Campos, A.R.N.; Araújo, C.J.; Santana, R.A.C.; Delgado, J.M.P.Q.; et al. Thermal, Mechanical, and Electrochemical Characterization of Ti50Ni50−XMox Alloys Obtained by Plasma Arc Melting. Metals 2023, 13, 1637. https://doi.org/10.3390/met13101637
Costa JD, Sousa MB, Almeida AF, Oliveira JAM, Silva PCS, Alves JJN, Campos ARN, Araújo CJ, Santana RAC, Delgado JMPQ, et al. Thermal, Mechanical, and Electrochemical Characterization of Ti50Ni50−XMox Alloys Obtained by Plasma Arc Melting. Metals. 2023; 13(10):1637. https://doi.org/10.3390/met13101637
Chicago/Turabian StyleCosta, Josiane D., Mikarla B. Sousa, Arthur F. Almeida, José A. M. Oliveira, Paulo C. S. Silva, José J. N. Alves, Ana R. N. Campos, Carlos J. Araújo, Renato A. C. Santana, João M. P. Q. Delgado, and et al. 2023. "Thermal, Mechanical, and Electrochemical Characterization of Ti50Ni50−XMox Alloys Obtained by Plasma Arc Melting" Metals 13, no. 10: 1637. https://doi.org/10.3390/met13101637