1. Introduction
Small incision lenticule extraction (SMILE) was first reported by Sekundo et al. and Shah et al. in 2011 as a safe and effective treatment of myopia and myopic astigmatism [
1,
2]. Compared with other refractive surgery, SMILE is an Integrated surgery that involves the creation of an intra-stromal lenticule and a peripheral incision in one step using a femtosecond laser and manual extraction of the lenticule ultimately. A femtosecond laser can rapidly scan corneal stroma with a pulse frequency of hundreds of kilohertz and a small distance between adjacent pulses. In this way, SMILE surgery can avoid or minimize errors associated with excimer laser ablation, such as stromal hydration [
3], laser fluence [
4,
5,
6], relative humidity, environmental temperature, and so on [
7]. In general, the accuracy and safety of SMILE surgery are not inferior to other excimer laser surgeries [
8,
9]. However, previous studies have reported that there was still a difference between the predicted LT and the achieved LT. Luft et al. [
10] found that the achieved LT was always thinner than the predicted LT, especially with higher myopic correction. Reinstein et al. [
11] also detected a systematic overvalue of central LT of approximately 8 μm.
Nevertheless, the prediction of LT is mainly by referencing the nomogram provided by the VisuMax femtosecond laser system. Several studies suggested nomograms for SMILE to be conducted [
12,
13,
14]. However, they were focused only on the influence of spherical, cylindrical, or lenticule diameter (LD) on the change of LT but ignored the influence of other potential variables. Furthermore, the linear regression analysis was generally used to predict LT in previous studies but with other arithmetics. In addition, the nomogram development for SMILE has not been broadly studied yet.
With the development of artificial intelligence (AI), it has become more and more popular in the medical field [
15]. In ophthalmology, AI has been applied extensively to diagnose ophthalmological diseases, such as cataracts, glaucoma, age-related macular degeneration, and diabetic retinopathy [
16]. Recently, Tong et al. [
17] applied the multi-layer perceptron (MLP) algorithm to train nomogram models for SMILE. However, there was no comparison with the other algorithms in their study, and this study focused more on reducing the postoperative refractive error than the lenticule thickness error. Fang et al. [
18] found that the lenticule thickness predicted by the nomogram exceeds the achieved lenticule thickness by approximately 10%, but it’s just a correction.
It is well known that the residual central corneal thickness (CCT) after SMILE is a significant indication of whether surgery can be performed, and the most crucial point is the accurate prediction of the LT. In order to make the prediction more accurate, we included a large number of patients, and multiple prediction models were trained based on these data. The aim of this study was to explore the variables that affect the LT and use these variables to train AI prediction models, find out the best one by comparison, and then use the validation data to verify it.
2. Materials and Methods
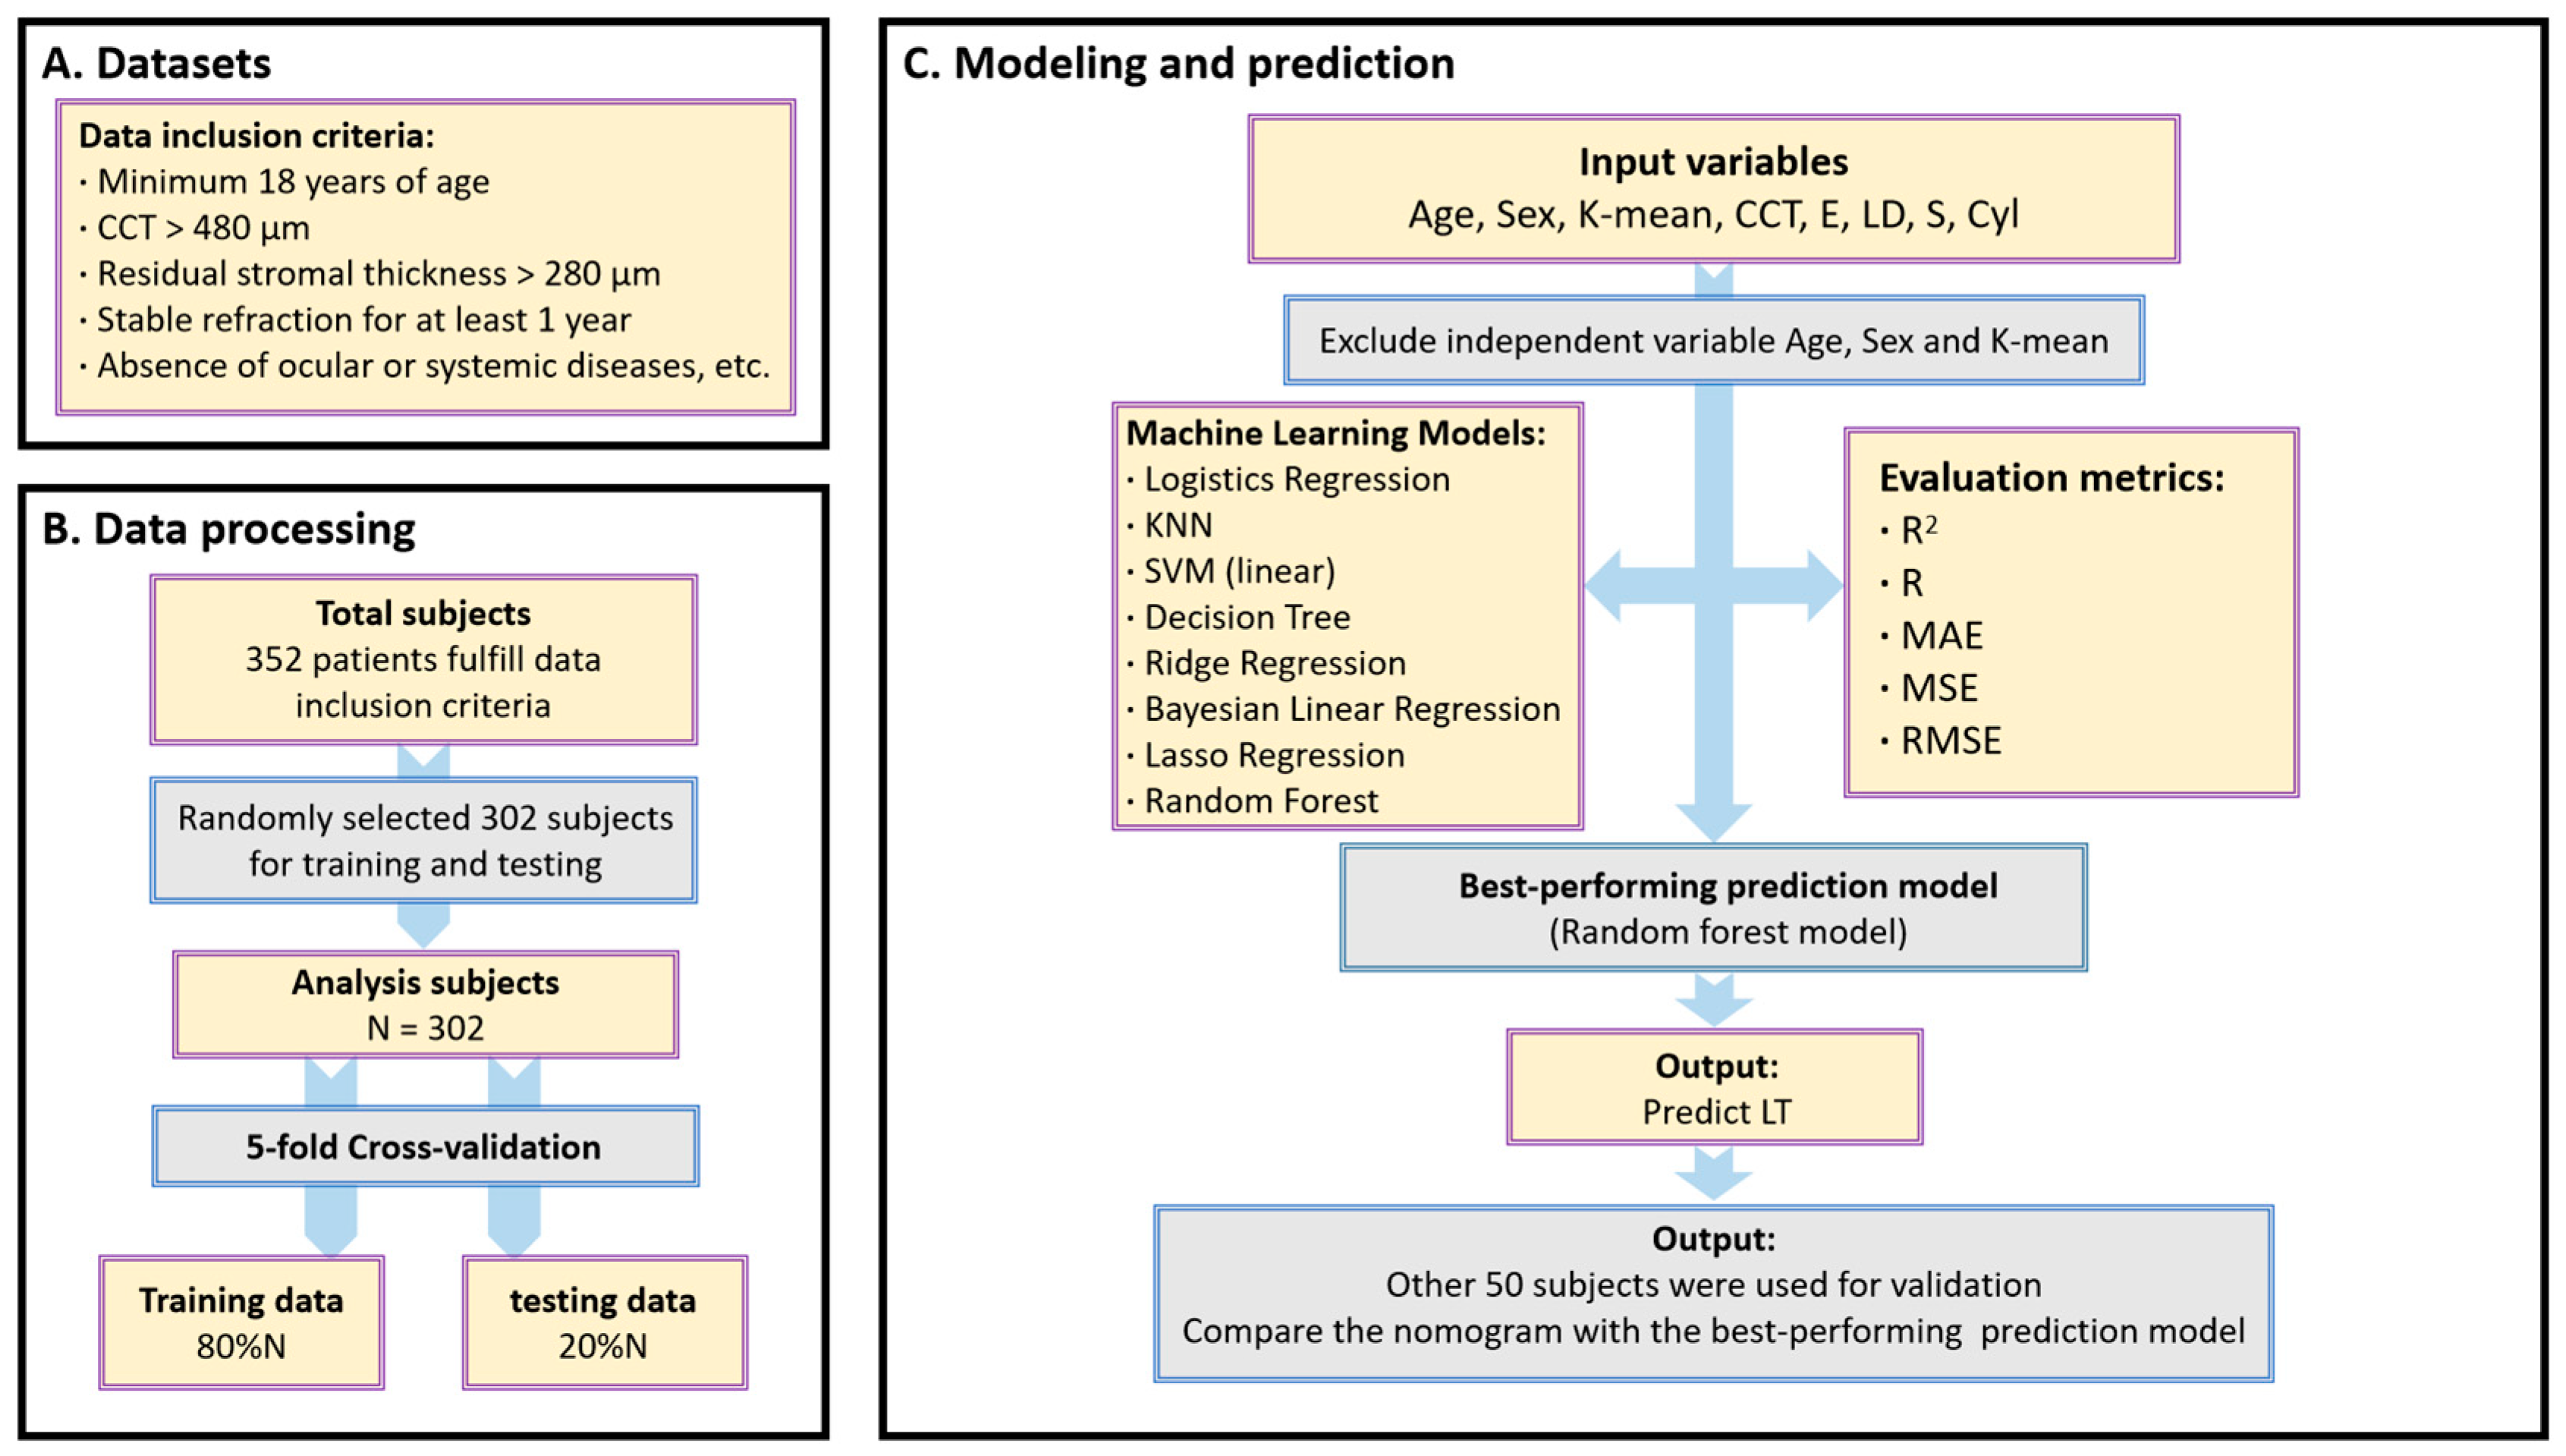
This study included 352 consecutive patients who underwent a SMILE procedure at the Eye Center, the First Affiliated Hospital of Fujian Medical University, from March 2022 to September 2022. This study followed the tenets of the Declaration of Helsinki and was approved by the Ethics Committee of the First Affiliated Hospital of Fujian Medical University. Written informed consent was obtained from the subjects before participating in this study. Inclusion criteria included the following: minimum 18 years of age, minimum central corneal thickness (CCT) of 480 mm, calculated residual stromal thickness greater than 280 mm, stable refraction for at least 1 year, absence of ocular or systemic diseases, and reproductive status of not being pregnant or breastfeeding. Patients who wore soft contact lenses were instructed to stop wearing them for at least 1 week before measurement (
Figure 1).
Each patient underwent an ophthalmologic examination, including diopter of the sphere (S), diopter of the Cylinder (Cyl), intraocular pressure (IOP), slit-lamp examination, scanning laser ophthalmoscope (SLO, Heidelberg Engineering, Heidelberg, Germany), optical biometry (Lenstar LS900, Haag Steit AG, Koeniz, Switzerland) and Pentacam imaging (Oculus Optikgeräte GmbH, Wetzlar, Germany).
2.1. Surgical Procedure
All SMILE procedures were performed by the same surgeon (ZSB) using the VisuMax femtosecond laser system (Carl Zeiss Meditec AG, Jena, Germany) with a 500-kHz repetition rate. All patients went under topical anesthesia (Alcaine; AlconCouvreur n.v., Puurs, Belgium) instilled 2 or 3 times. The laser cut energy index was 155 nJ; the intended cap thickness was 120 μm; the programmed optical zone diameter was between 6.0 and 6.8 mm, and the diameter of the cap was 1 mm larger than the diameter of the lenticule. The optical zone was selected based on the pupil diameter and percent tissue alert (PTA). After the creation of the lenticule, an incision of approximately 2 mm in length was created at the 11 o’clock position for lenticule extraction. After surgery, one drop of dexamethasone steroid (Tobradex; Alcon Laboratories, Fort Worth, TX) was placed in each eye. A recommended nomogram from VisuMax femtosecond laser system was implemented for all subjects to predict LT.
2.2. Postoperative Treatment
Patients were instructed to wear plastic shields for 7 nights. The standard postoperative treatment was levofloxacin eye drops (Cravit; Santen Pharmaceutical Co., Ltd., Osaka, Japan) 4 times a day after surgery for 7 days, fluorometholone eye drops (Santen Pharmaceutical Co., Ltd., Osaka, Japan) at 0.1% 4 times a day for 2 weeks, and preservative-free artificial tears 4 times a day for a month. The patients were followed up at 1 day, 1 week and 1 month, and 3 months; the optometry, visual acuity, and IOP were examined at each visit. Pentacam scanning was performed at the 1-day, 1-month, and 3-month postoperative visits.
2.3. Achieved LT Calculation
The achieved LT data were calculated by comparing the pre- and postoperative examinations with Pentacam software. The rotating Pentacam Scheimpflug camera measures corneal thickness normal to the anterior surface tangent [
19]. The pachymetry values were provided at 3 points [
20], including the corneal vertex, pupil center, and the thinnest point. During the examination, the automatic release mode was used [
21]. In this study, the intended treatment center was the corneal vertex. Since the position of the thinnest point of the cornea varies greatly from person to person, the corneal vertex and pupil center were selected as the two locations to calculate the achieved LT.
2.4. Surgical Refractive Correction
According to the preoperative examination of the computer optometry, mydriatic optometry, and comprehensive optometry design, the expected correction refraction, included S, Cyl, and LD, and they were input into the VisuMax femtosecond laser system; the surgical correction was performed according to these data.
2.5. Statistical Analysis
According to the preoperative examination of the computer optometry, mydriatic optometry, and comprehensive optometry design, the expected correction refraction, included S, Cyl, and LD, and they were input into the VisuMax femtosecond laser system; the surgical correction was performed according to these data.
In our study, only one eye for each patient was randomly selected and included for statistical analysis to ensure that the measurements from the eyes could be treated independently [
22]. In this study, to build the prediction model, the input variables were age (in years), sex (“1” represents male, while “2” represents female), mean K reading of anterior corneal surface (K-mean, in diopters), LD (in mm), preoperative CCT (in μm), axial length (AL, in mm), the eccentricity of the anterior corneal surface (E), S (in diopter) and Cyl (in diopter), and the target output was the predicted LT (in μm). The
E is calculated using the following formula, where the
Q is the
Q value on the anterior surface of the cornea:
Eight types of supervised machine learning models were implemented in our study based on Logistics Regression Model, K-Nearest Neighbor (KNN) model, Support Vector Machine (SVM) regression models, Decision Tree Regression, Ridge Regression (l2 regularization), Bayesian Linear Regression, Lasso Regression (l1 regularization), and Random Forest model. Then, a 5-fold cross-validation [
23] scheme randomly divided all data into 5 groups, including 4 groups (80%) used as training data and one group (20%) used as validation data. This process was repeated 5 times so that all data were validated by this model, which allowed better prediction of the overall sample and prevented overfitting. During the fitting process, AL was finally excluded from our final model because it could lead to the problem of collinearity and render the final model unsolvable. Furthermore, including AL did not yield better results. Thus, the final model used to estimate
LT was as follows:
To verify the efficacy of the machine learning models, a multiple linear regression model was also created [
24,
25]. Pearson correlation analyses among all the variables. The performance of the machine-learning prediction algorithms developed from the training data was assessed using the testing data by calculating the R
2 value, R value, mean absolute error (MAE), mean squared error (MSE), and root mean square error (RMSE), the best performance model compared with the nomogram from VisuMax femtosecond laser system using validation data by paired
t-tests. All statistical analyses were performed using the PyCharm (Edition 2020.1.2 x64) embedded by the Python (Python Software Foundation) software (Version 3.8) under the Windows 10 system, and the level of statistical significance was set at
p < 0.05.
3. Results
In total, 189 males (53.69%) and 163 females (46.31%) were included in this study. The average age of all subjects was 22.87 ± 5.92 years. The mean S was −5.75 ± 2.15 D and ranged from −1.5 D to −10.00 D. The mean Cyl was −0.96 ± 0.74 D and ranged from 0 to −3.75 D. The detailed information is provided in
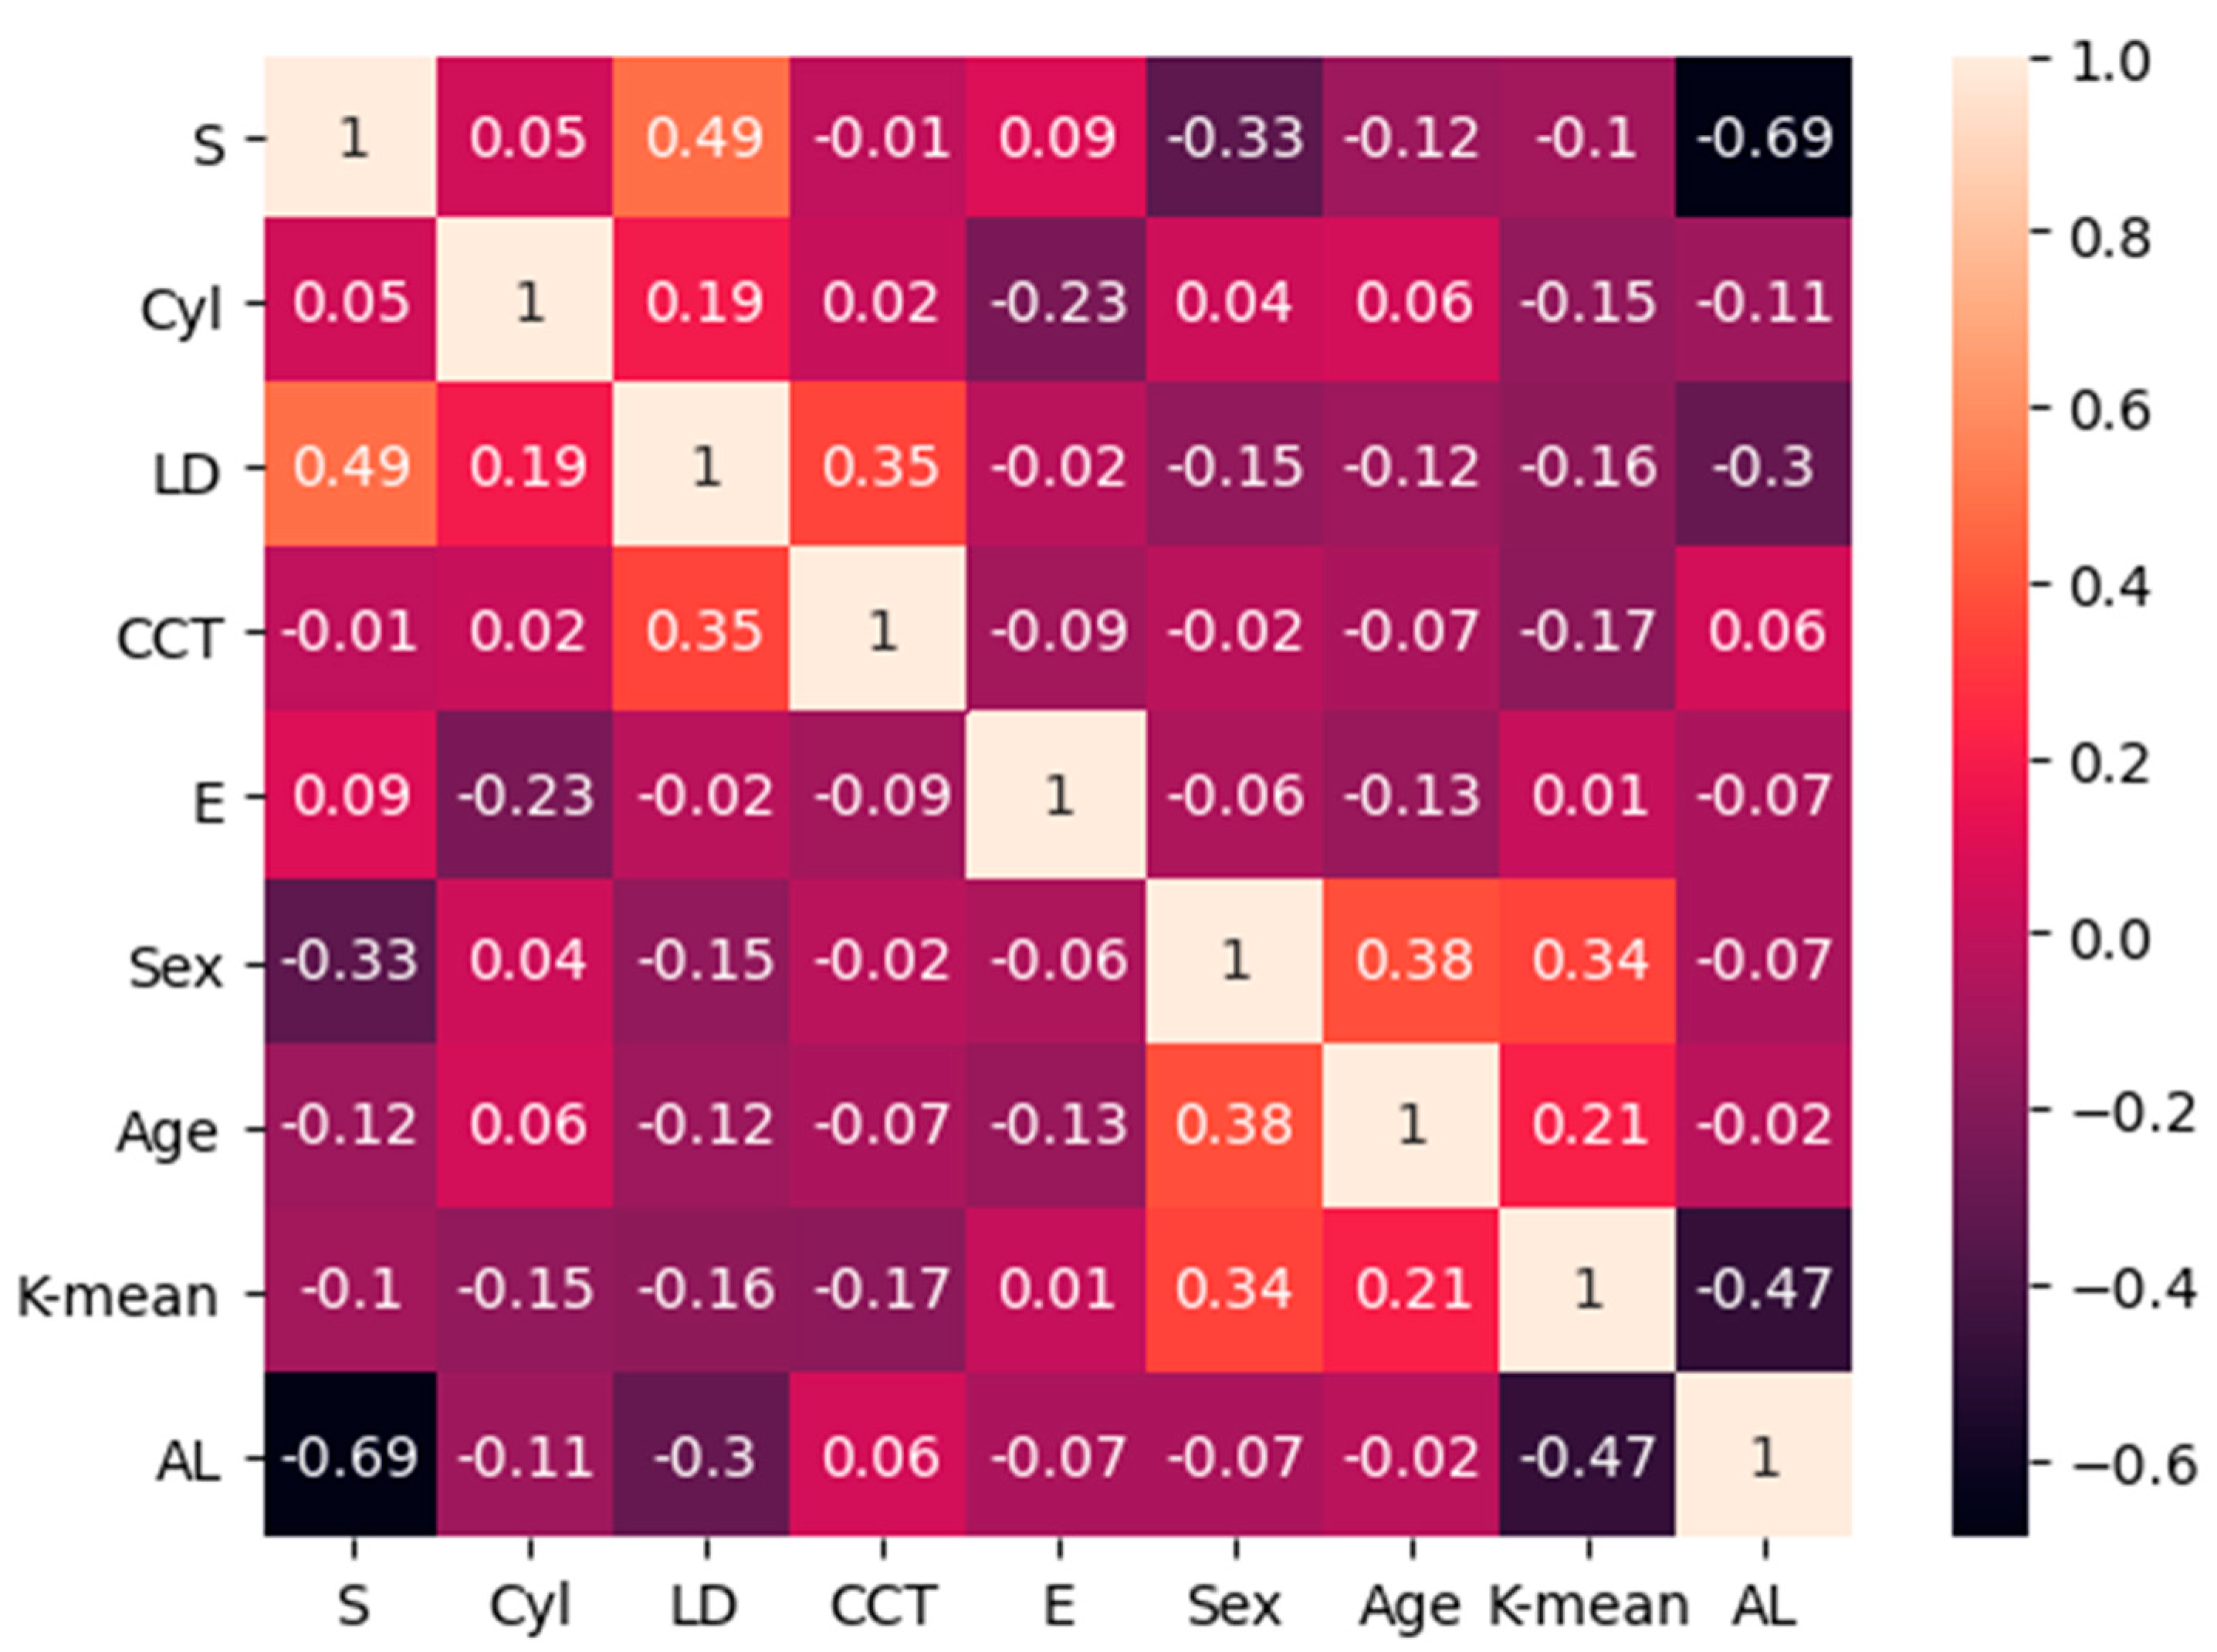
Table 1. Via Pearson correlation analyses among all variables included in the study, we found that there was a high linear correlation between the AL and the S (r = 0.69), a medium linear correlation between AL and K-mean (r = −0.47), and a medium linear correlation between S and LD (r = −0.49); the others showed weak or no correlation; the detailed information is provided in
Figure 2. The AL was finally excluded because it could lead to the problem of collinearity. We randomly selected 302 subjects for training and testing data of the machine learning model, and the other 50 subjects were used for validation data. Significant correlations were found between several input variables and
LT, but age, sex, and K-mean were not. The R
2 value of the multiple linear regression model was 0.87, as determined by the following equation:
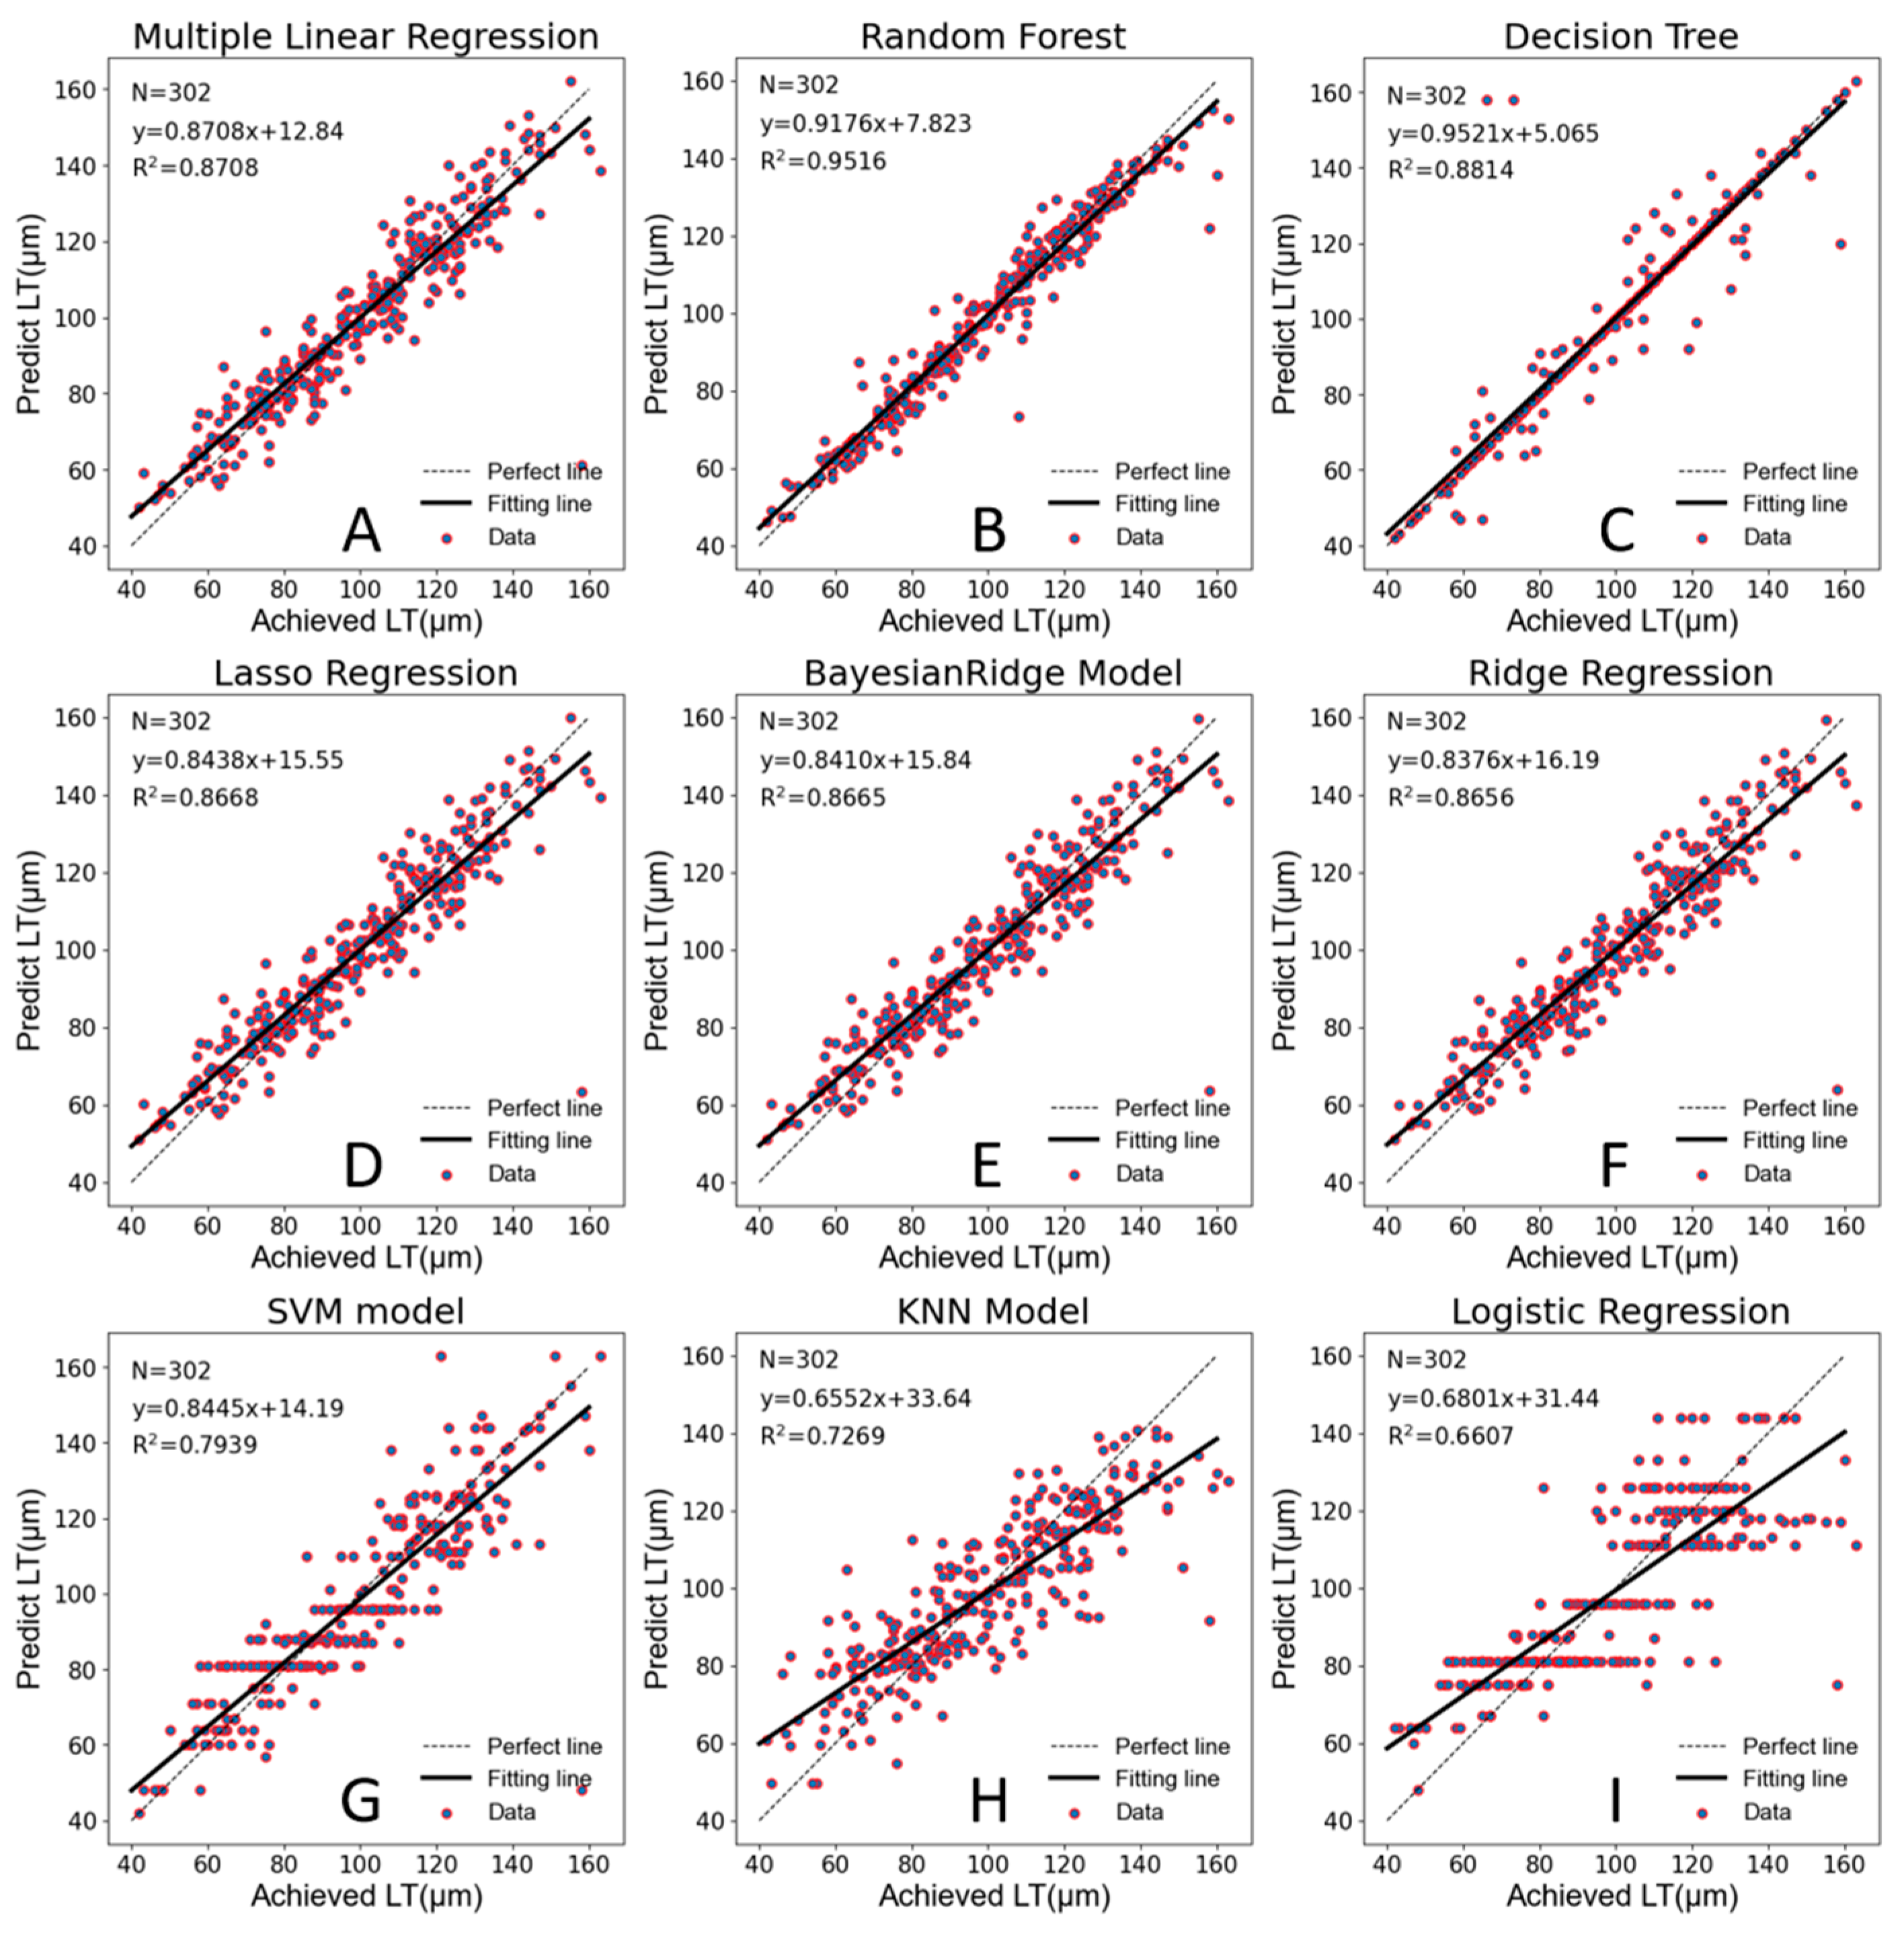
Table 2 shows the performance results of eight machine learning models and the multiple linear regression model using 302 subjects. The results show that three machine learning models had a worse predictive ability than the multiple linear regression model; according to R
2, the half of machine learning models had a similar predictive ability to the multiple linear regression model and only the Random Forest model achieved significantly better performance. According to
Table 2, Random Forest performs optimally in four indicators.
In this study, in order to visualize the prediction effect and prediction accuracy of each model, we conducted robust linear regression analysis with the achieved LT as the abscissa and the predicted LT as the ordinate. As shown in
Figure 3, the Random Forest model has the highest prediction accuracy (R
2 = 0.9516), and most scatter plots fall along the perfect correlation regression line. The Decision Tree Regression appeared to have great prediction accuracy on the surface, but it actually had serious overfitting. The five-fold cross-validation also confirmed that this model lacked a serious generalization ability.
3.1. Model Variables
A total of eight variables were included in the multiple linear regression model. As is known to all [
12,
13,
14], S, Cyl, and LD are the main factors affecting LT, which were the most important variables for predicting LT according to the nomogram from VisuMax femtosecond laser system. In this study, we accidentally found that CCT and E were also significantly correlated with LT, while the other three variables (age, sex, and K-mean) showed no significant correlation, which was eliminated in the prediction model. As shown in
Table 3, CCT was positively correlated with LT, while E was negatively correlated with LT.
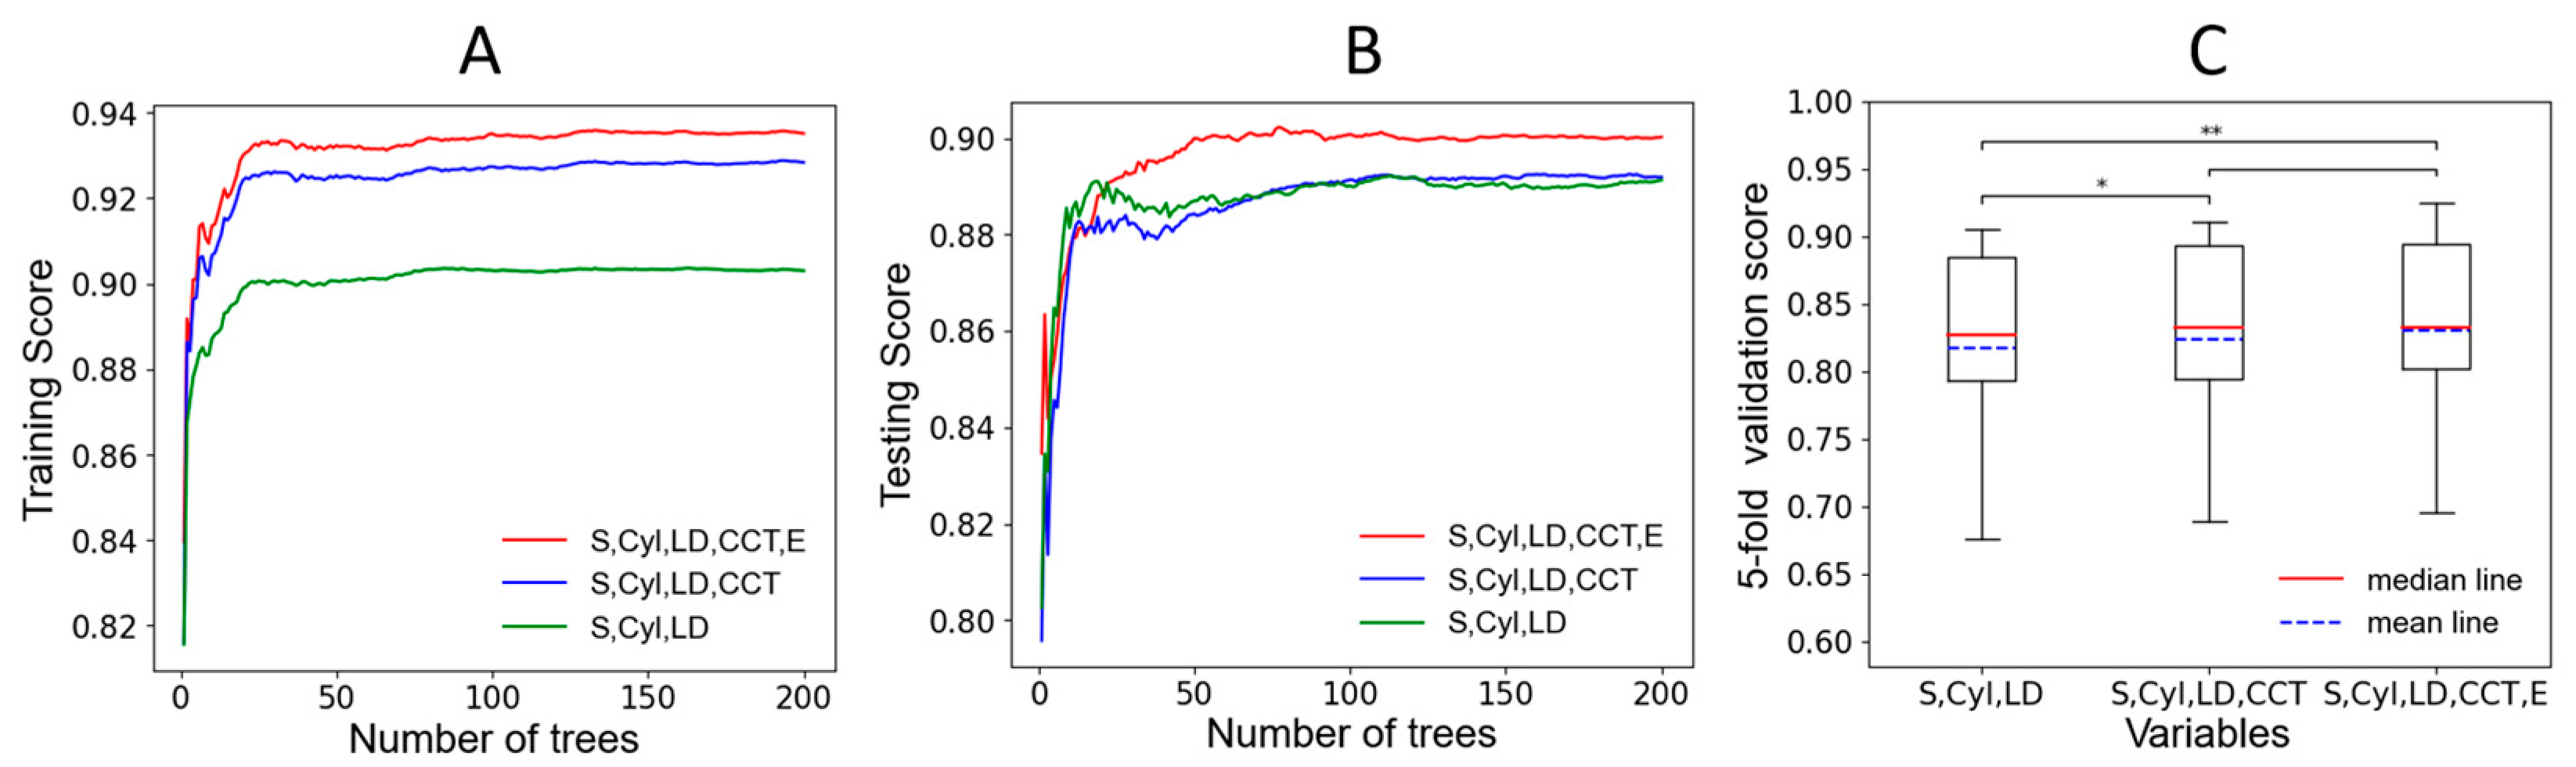
To further explore the importance of CCT and E in machine learning models, we selected the best-performing Random Forest model for validation. We included three variables (S, Cyl, LD), four variables (S, Cyl, LD, CCT), and five variables (S, Cyl, LD, CCT, E) into the model, respectively, and observed the performance of the model in the training data and testing data. As shown in
Figure 4A,B, the abscissa is the number of trees in the Random Forest model (the more trees, the more stable the model), and the ordinate is the score of the training or testing data; we can find that including CCT and E to the Random Forest model will improve the accuracy of the model in training and testing data. Then we used five-fold cross-validation to verify the accuracy of the three stable Random Forest models and tested them by paired
t-tests (
Figure 4C). There were significant differences between three variables (S, Cyl, LD) and four variables (S, Cyl, LD, CCT) (
p < 0.05), and there were extremely significant differences between three variables (S, Cyl, LD) and five variables (S, Cyl, LD, CCT, E) (
p < 0.01).
3.2. Prediction Results
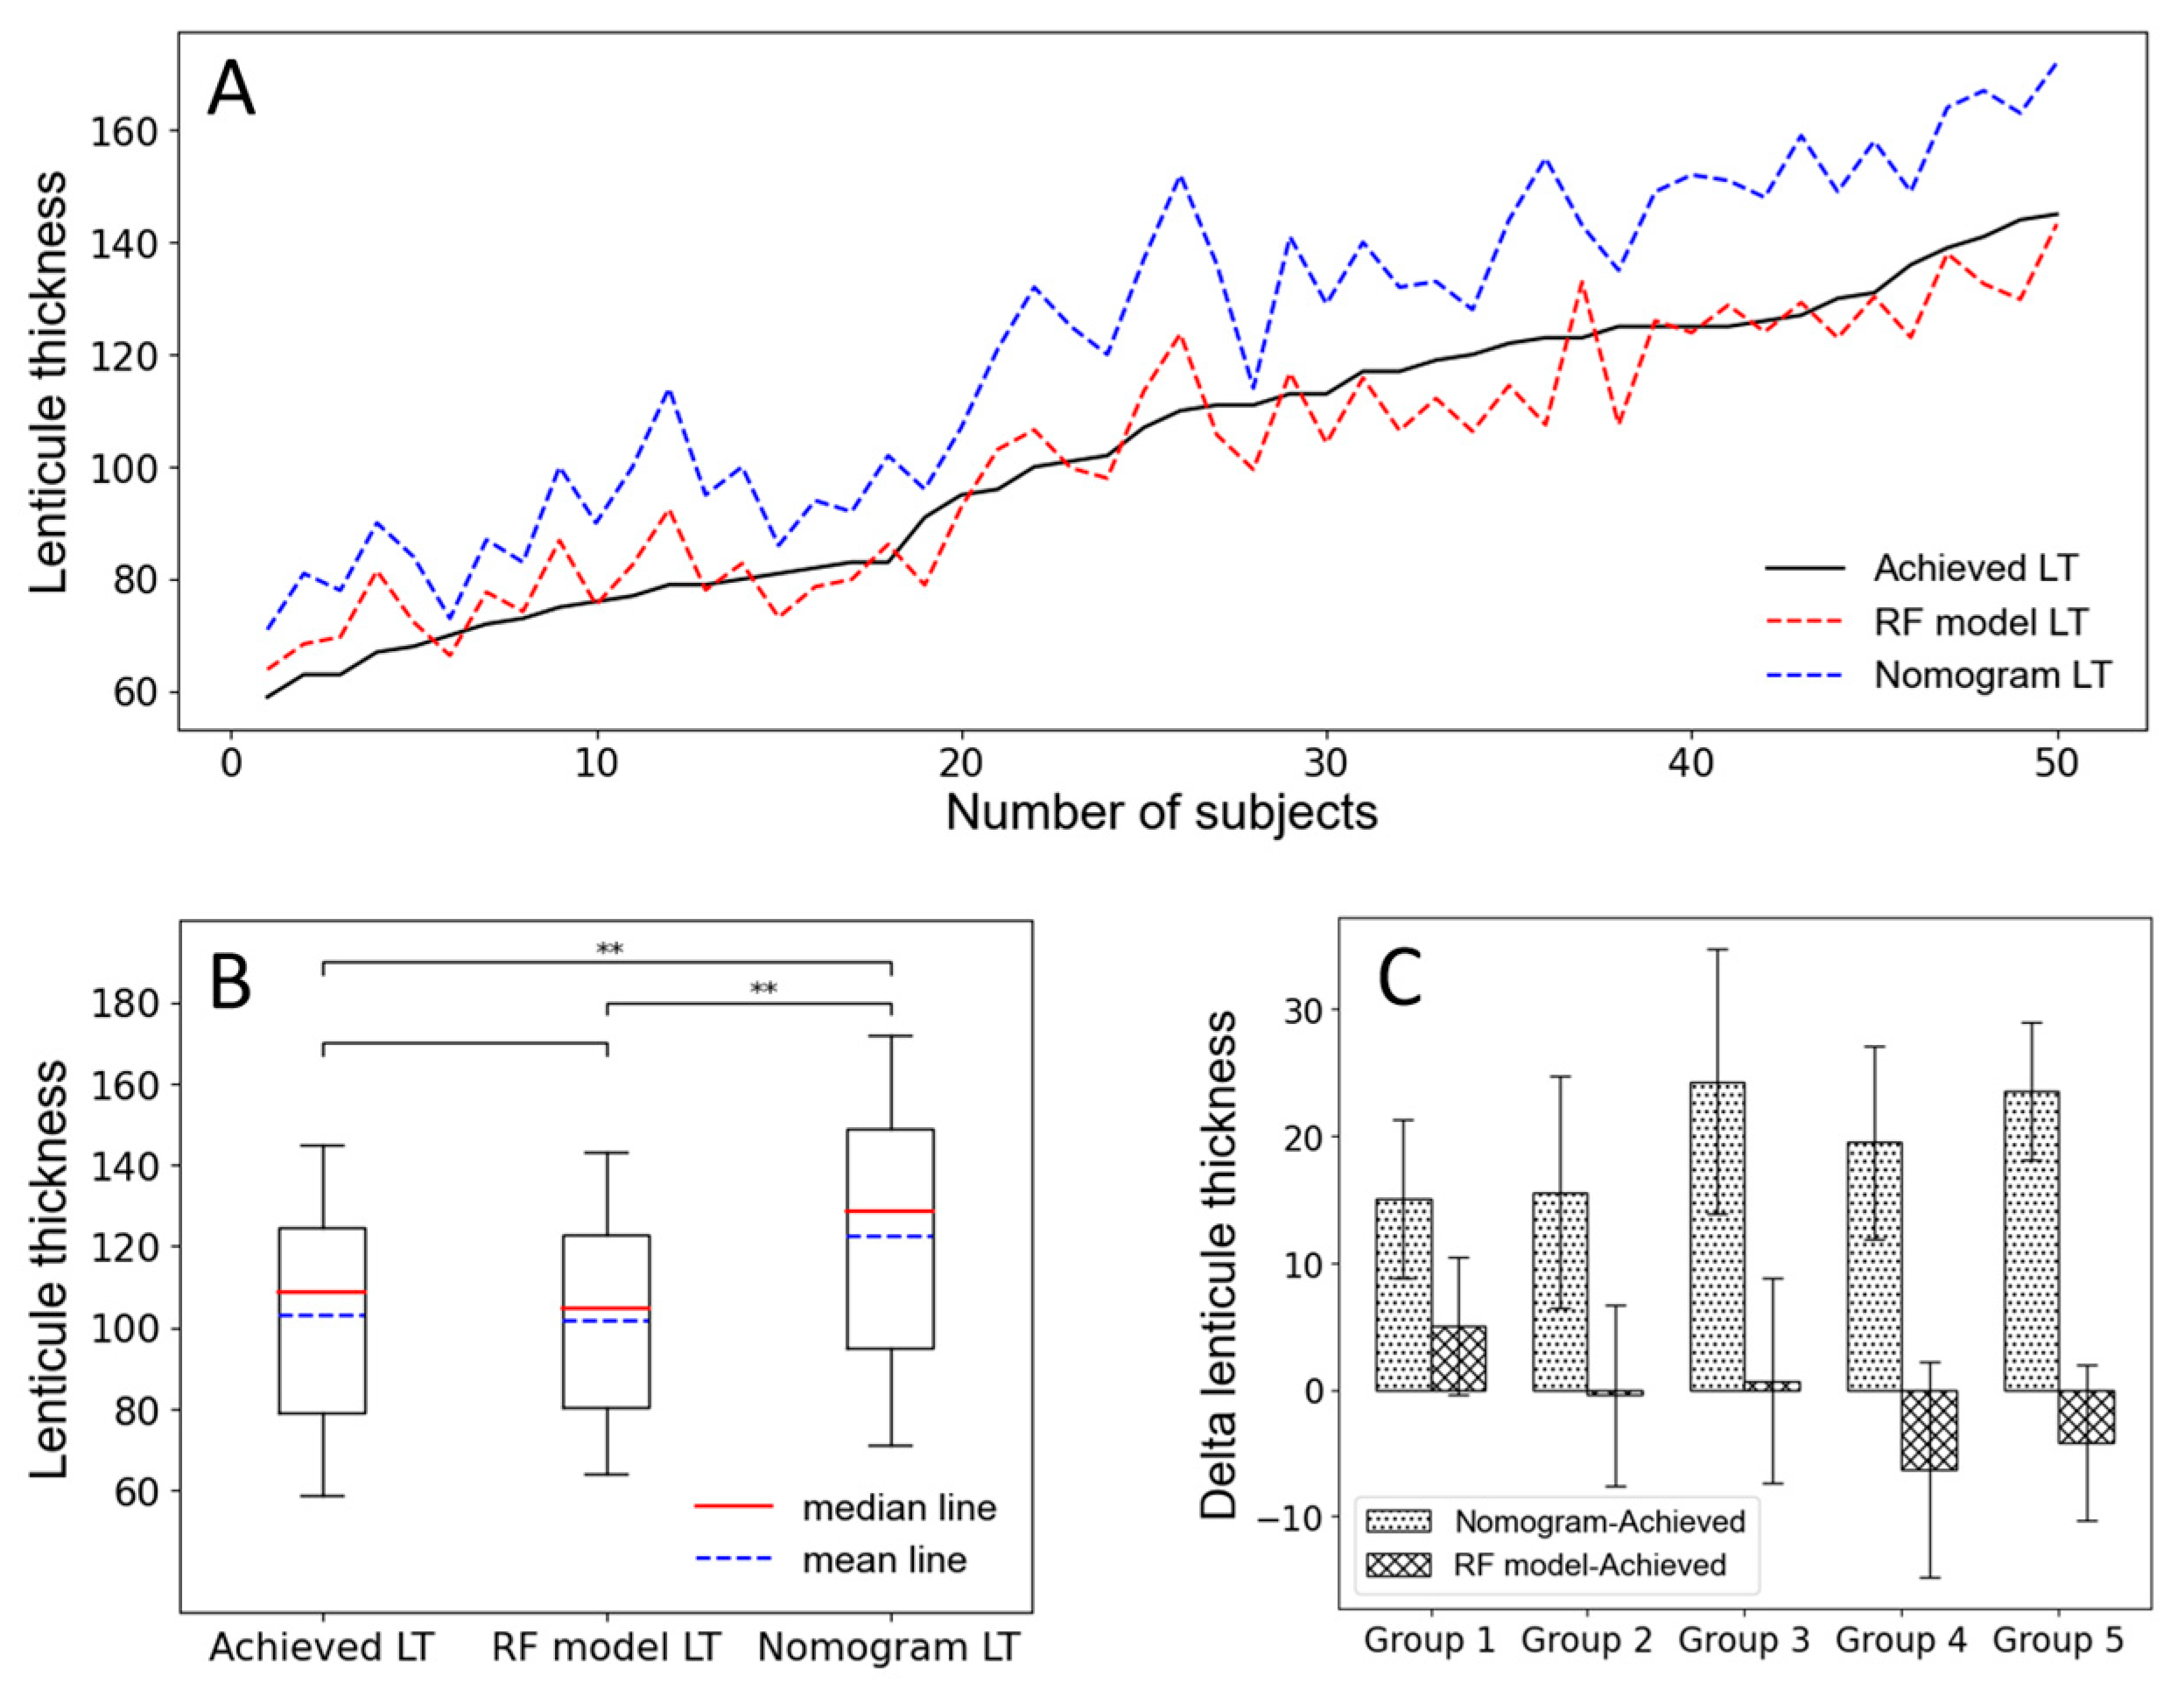
In this study, we collected 50 subjects as the verification data. The 50 subjects were independent of the training and testing data, which could more truly evaluate the accuracy of the model’s prediction. As
Figure 5A shows, we arranged the 50 subjects according to the achieved LT value from low to high as abscissa can find that the predicted LT by the Random Forest model is very close to the achieved LT, while the nomogram from VisuMax femtosecond laser system is often overestimated, which is similar to previous studies [
10,
19,
26]. Then, we took a paired
t-test on the achieved LT and the predicted LT by the Random Forest model, as
Figure 5B shows, and found that there was no significant difference between them (
p > 0.05), indicating that the Random Forest model had excellent predictive accuracy. Correspondingly, there is an extremely significant difference between achieved LT and predicted LT by the nomogram (
p < 0.01). The 50 subjects were divided into five groups according to the achieved LT from low to high, with 10 subjects in each group, to observe the estimated deviations (Delta) of achieved LT by nomogram and Random Forest model. As
Figure 5C shows, we found that for the nomogram, the higher value of the achieved AL, the greater overestimation, while the Random Forest model is on the contrary. We converted the overestimate or underestimate values to percentages (the details are shown in
Table 4) and found that the nomogram was overestimated by 19.59%, on average.
4. Discussion
Myopia is the most common cause of vision loss, with an uncorrected refractive error being the leading ocular disorder, causing visual impairment worldwide [
27]. Now a global public health burden [
28,
29], myopia has become significantly more prevalent across East Asia [
30,
31]. In order to realize higher visual quality and get rid of the shackles of glasses, more and more people choose refractive surgery to correct refractive errors [
32]. SMILE, as a relatively new procedure, is gaining more popularity, especially after its FDA approval for myopia in 2016 and for astigmatism in 2018. In SMILE surgery, the refractive error is corrected by the intrastromal lenticule extraction, so the accuracy of the estimate LT is one of the key points of the SMILE procedure. In the current clinical work, we always reference the nomogram from VisuMax femtosecond laser system to predict the postoperative residual CCT in most cases and take this as the standard to judge whether the refractive error can be fully corrected. However, after a period of clinical practice, we found that the nomogram always overestimated the LT, resulting in an underestimation of the residual CCT. According to this standard, for some patients who could have been fully corrected for refractive error, in order to retain enough residual CCT, we often choose to undercorrect, which has a certain impact on the uncorrected visual acuity and satisfaction of patients. In previous studies, some researchers have also found that the nomogram was not accurate. Liang et al. [
13] suggested adding an 11% correction of SE to the nomogram for SMILE surgery; Zhou et al. [
26] adjusted the mean treated SE up to −6.30 ± 2.00 D when the mean preoperative SE was −5.96 ± 1.97 D in SMILE surgery; Fang et al. [
18] found that the proportion of overestimation of lenticule thickness in predicted value is 11.9% for ultrasound and about 15% for Pentacam. However, previous studies were only limited to studying the overestimation rate of nomogram and obtained a more accurate estimate value by reducing a certain proportion of nomogram; few studies had constructed a model to predict LT from the major factors affecting LT. Therefore, our study focuses on exploring the major factors that affect LT and predict LT by multiple linear regression and various machine learning models to finally obtain an optimal prediction model.
The precise prediction of LT was according to biometric parameters, including age, sex, CCT, LD, K-mean, E, S, Cyl, and AL. During the study, we gradually excluded the effects of AL, age, sex, and K-mean on LT by Pearson correlation analysis and multiple linear regression models and accidentally found that E and CCT had significant effects on LT, which had not been mentioned in previous studies. With the development of AI, machine learning has been widely used in the medical field. We applied machine learning to predict LT and found that the accuracy of the Random Forest model in predicting LT was higher than that of the multiple linear regression model, and further confirmed the significance of CCT and E in the prediction of the model. Despite the small sample in this study, we found high accuracy of LT prediction using the multiple linear regression model and some machine learning models.
Then, we selected 50 subjects as the validation data to verify the prediction accuracy of the model. It was found that the nomogram tended to overestimate the value of LT, with an average overestimate of 19.59%, while the Random Forest model had a much higher prediction accuracy, with an average underestimate of −0.15%. It was good news for some patients with high refractive errors but thin CCT because they could get correction as much as possible, which is of great significance for the improvement of visual quality and satisfaction of patients after surgery. However, the Random Forest model also has its limitations; it tends to overestimate when LT is thin and tends to underestimate when LT is thick, which may cause postoperative residual CCT shortage caused by long-term complications, such as corneal expansion [
32]. Therefore, we need to further expand the amount of data to improve the accuracy of our model prediction in the future, and longer follow-up would be needed to better understand the changes rule of residual CCT and its impact on the corneal health after SMILE surgery in the meantime.
5. Conclusions
The results of this study validate the reliability of machine learning models in accurately predicting LT in SMILE surgery and screen out the best-performing Random Forest model. In addition, we found two factors significantly affecting the prediction of LT; they are preoperative CCT and anterior corneal surface eccentricity (E), respectively. Furthermore, the nomogram from VisuMax femtosecond laser system significantly overestimates the achieved LT, while based on the Random Forest model, we are able to obtain closer prediction results to the achieved LT.
Author Contributions
Conceptualization, H.W. and S.Z.; methodology, H.W.; software, H.W.; validation, H.W.; formal analysis, H.W.; investigation, S.T.; resources, S.T.; data curation, X.Z. and Y.C.; writing—original draft preparation, H.W.; writing—review and editing, S.Z.; visualization, H.W.; supervision, Y.Z.; project administration, Y.Z.; funding acquisition, H.W. All authors have read and agreed to the published version of the manuscript.
Funding
This research was funded by the Natural Science Foundation of Fujian Province, grant number [2021J05150]. The APC was funded by the Natural Science Foundation of Fujian Province.
Institutional Review Board Statement
The study was conducted in accordance with the Declaration of Helsinki and approved by the Institutional Review Board (or Ethics Committee) of Ethics Committee of The First Affiliated Hospital of Fujian Medical University’s approved study protocol (IRB No.[2015] 084-1).
Informed Consent Statement
Informed consent was obtained from all subjects involved in the study. Written informed consent has been obtained from the patient(s) to publish this paper if applicable.
Data Availability Statement
The datasets used and/or analyzed during the current study are available from the corresponding author upon reasonable request.
Conflicts of Interest
The authors declare no conflict of interest.
References
- Sekundo, W.; Kunert, K.S.; Blum, M. Small incision corneal refractive surgery using the small incision lenticule extraction (SMILE) procedure for the correction of myopia and myopic astigmatism: Results of a 6 month prospective study. Br. J. Ophthalmol. 2010, 95, 335–339. [Google Scholar] [CrossRef] [PubMed]
- Shah, R.; Shah, S.; Sengupta, S. Results of small incision lenticule extraction: Allin-one femtosecond laser refractive surgery. J. Cataract Refract. Surg. 2011, 37, 127–137. [Google Scholar] [CrossRef] [PubMed]
- Dougherty, P.J.; Wellish, K.L.; Maloney, R.K. Excimer Laser Ablation Rate and Corneal Hydration. Am. J. Ophthalmol. 1994, 118, 169–176. [Google Scholar] [CrossRef]
- Seiler, T.; Kriegerowski, M.; Schnoy, N.; Bende, T. Ablation rate of human corneal epithelium and Bowman’s layer with the ex-cimer laser (193 nm). Refract. Corneal Surg. 1990, 6, 99–102. [Google Scholar] [CrossRef] [PubMed]
- Mrochen, M.; Seiler, T. Influence of Corneal Curvature on Calculation of Ablation Patterns Used in Photorefractive Laser Surgery. J. Refract. Surg. 2001, 17, S584–S587. [Google Scholar] [CrossRef]
- Arba-Mosquera, S.; de Ortueta, D. Geometrical analysis of the loss of ablation efficiency at non-normal incidence. Opt. Express. 2008, 16, 3877–3895. [Google Scholar] [CrossRef]
- Schena, E.; Silvestri, S.; Franzesi, G.T.; Cupo, G.; Carito, P.; Ghinelli, E. Theoretical model and design of a device to reduce the influ-ence of environmental factors on refractive surgery outcomes. Conf. Proc. IEEE Eng. Med. Biol. Soc. 2006, 1, 343–346. [Google Scholar]
- Ang, M.; Farook, M.; Htoon, H.M.; Mehta, J.S. Randomized Clinical Trial Comparing Femtosecond LASIK and Small-Incision Len-ticule Extraction. Ophthalmology 2020, 127, 724–730. [Google Scholar] [CrossRef]
- Lietman, T.M.; Oldenburg, C.E.; O’Brien, K.S. Noninferiority: It’s All in the Margins. Ophthalmology 2020, 127, 711–712. [Google Scholar] [CrossRef]
- Luft, N.; Priglinger, S.G.; Ring, M.H.; Mayer, W.J.; Mursch-Edlmayr, A.S.; Kreutzer, T.C.; Bolz, M.; Dirisamer, M. Stromal remodeling and lenticule thick-ness accuracy in small-incision lenticule extraction: One-year results. J. Cataract Refract. Surg. 2017, 43, 812–818. [Google Scholar] [CrossRef]
- Reinstein, D.Z.; Archer, T.J.; Gobbe, M. Lenticule Thickness Readout for Small Incision Lenticule Extraction Compared to Artemis Three-Dimensional Very High-Frequency Digital Ultrasound Stromal Measurements. J. Refract. Surg. 2014, 30, 304–309. [Google Scholar] [CrossRef] [PubMed]
- Mosquera, S.A.; Ortueta, D.D.; Verma, S. The art of nomogram. Eye Vis. 2018, 5, 2. [Google Scholar] [CrossRef] [PubMed] [Green Version]
- Liang, G.; Chen, X.; Zha, X.; Zhang, F. A Nomogram to Improve Predictability of Small-Incision Lenticule Extraction Surgery. Experiment 2017, 23, 5168–5175. [Google Scholar] [CrossRef] [PubMed] [Green Version]
- Wang, M.; Zhang, Y.; Wu, W.; Young, J.A.; Hatch, K.M.; Ii, R.P.; Elze, T.; Wang, Y. Predicting Refractive Outcome of Small Incision Lenticule Extraction for Myopia Using Corneal Properties. Transl. Vis. Sci. Technol. 2018, 7, 11. [Google Scholar] [CrossRef] [Green Version]
- Evans, R.S. Electronic health records: Then, now, and in the future. Yearb. Med. Inform. 2016, 25, S48–S61. [Google Scholar] [CrossRef]
- Lu, W.; Tong, Y.; Yu, Y.; Xing, Y.; Chen, C.; Shen, Y. Applications of artifcial intelligence in ophthalmology: General overview. J. Ophthalmol. 2018, 11, 1555. [Google Scholar]
- Cui, T.; Wang, Y.; Ji, S.; Li, Y.; Hao, W.; Zou, H.; Jhanji, V. Applying Machine Learning Techniques in Nomogram Prediction and Analysis for SMILE Treatment. Am. J. Ophthalmol. 2020, 210, 71–77. [Google Scholar] [CrossRef]
- Wu, F.; Yin, H.; Chen, X.; Yang, Y. Investigation of predictability and influence factors of the achieved lenticule thick-ness in small incision lenticule extraction. BMC Ophthalmol. 2020, 20, 1–9. [Google Scholar] [CrossRef] [Green Version]
- Villavicencio, O.; Belin, M.W.; Ambrósio, R.; Steinmueller, A. Corneal pachymetry: New ways to look at an old measurement. J. Cataract Refract. Surg. 2014, 40, 695–701. [Google Scholar] [CrossRef]
- Zhao, Y.; Li, M.; Zhao, J.; Knorz, M.C.; Sun, L.; Tian, M.; Zhou, X. Posterior Corneal Elevation after Small Incision Lenticule Extraction for Moderate and High Myopia. PLoS ONE 2016, 11, e0148370. [Google Scholar] [CrossRef] [Green Version]
- Savini, G.; Cummings, A.B.; Balducci, N.; Barboni, P.; Huang, J.; Lombardo, M.; Serrao, S.; Ducoli, P. Agreement between Predicted and Measured Ablation Depth After Femtosecond Laser-Assisted LASIK for Myopia. J. Refract. Surg. 2016, 32, 164–170. [Google Scholar] [CrossRef] [PubMed]
- Katz, J.; Zeger, S.; Liang, K.Y. Appropriate statistical methods to account for similarities in binary outcomes between fellow eyes. Investig. Opthalmol. Vis. Sci. 1994, 35, 2461–2465. [Google Scholar]
- Kohavi, R. A study of cross-validation and bootstrap for accuracy estimation and model selection. Ijcai 1995, 14, 1137–1145. [Google Scholar]
- Peduzzi, P.; Concato, J.; Kemper, E.; Holford, T.R.; Feinstein, A.R. A simulation study of the number of events per variable in logistic regression analysis. J. Clin. Epidemiol. 1996, 49, 1373–1379. [Google Scholar] [CrossRef]
- Harrell, F.E., Jr. Regression Modeling Strategies; With Applications to Linear Models, Logistic Regression, and Survival Analysis; Springer: New York, NY, USA, 2001. [Google Scholar]
- Zhou, J.; Zhang, Y.; Li, M.; Sun, L.; Zhou, X.-T. Predictability of the Achieved Lenticule Thickness in Small Incision Len-ticule Extraction for Myopia Correction. Eye Contact Lens Sci. Clin. Pract. 2018, 44 (Suppl. S2), S410–S413. [Google Scholar] [CrossRef]
- Wang, Y.-M.; Lu, S.-Y.; Zhang, X.-J.; Chen, L.-J.; Pang, C.-P.; Yam, J.C. Myopia Genetics and Heredity. Children 2022, 9, 382. [Google Scholar] [CrossRef]
- Dolgin, E. The myopia boom. Nature 2015, 519, 276–278. [Google Scholar] [CrossRef] [Green Version]
- Vitale, S.; Cotch, M.F.; Sperduto, R.D. Prevalence of Visual Impairment in the United States. JAMA 2006, 295, 2158–2163. [Google Scholar] [CrossRef] [Green Version]
- Morgan, I.G. What Public Policies Should Be Developed to Deal with the Epidemic of Myopia? Optom. Vis. Sci. 2016, 93, 1058–1060. [Google Scholar] [CrossRef]
- Morgan, I.G.; Ohno-Matsui, K.; Saw, S.-M. Myopia. Lancet 2012, 379, 1739–1748. [Google Scholar] [CrossRef]
- Moshirfar, M.; Tukan, A.N.; Bundogji, N.; Liu, H.Y.; McCabe, S.E.; Ronquillo, Y.C.; Hoopes, P.C. Ectasia After Corneal Refractive Surgery: A Systematic Review. Ophthalmol. Ther. 2021, 10, 753–776. [Google Scholar] [CrossRef] [PubMed]
| Disclaimer/Publisher’s Note: The statements, opinions and data contained in all publications are solely those of the individual author(s) and contributor(s) and not of MDPI and/or the editor(s). MDPI and/or the editor(s) disclaim responsibility for any injury to people or property resulting from any ideas, methods, instructions or products referred to in the content. |
© 2023 by the authors. Licensee MDPI, Basel, Switzerland. This article is an open access article distributed under the terms and conditions of the Creative Commons Attribution (CC BY) license (https://creativecommons.org/licenses/by/4.0/).


