Article

Predictive Risk Factors of Nonalcoholic Fatty Liver Disease in a Lean Chinese Population

Department of Gastroenterology, The First Affiliated Hospital of Soochow University, Suzhou 215000, China
*
Author to whom correspondence should be addressed.
J. Pers. Med. 2022, 12(12), 1958; https://doi.org/10.3390/jpm12121958
Submission received: 15 October 2022 / Revised: 20 November 2022 / Accepted: 25 November 2022 / Published: 26 November 2022
(This article belongs to the Special Issue Towards Personalized Medicine for Chronic Liver Disease)

Abstract

:
Background: Although nonalcoholic fatty liver disease (NAFLD) is related to obesity, it may also affect lean individuals. Recent data suggest that lean NAFLD patients can develop the whole spectrum of NASH. However, the NAFLD predictive model for lean populations remains lacking. Methods: A total of 5037 lean individuals were included in this study, and the data were separated for training and validation. The logistic regression method was used, and a nomogram, a type of prediction model, was constructed according to the logistic regression analysis and the significant clinical factors. The performance of this model was evaluated based on its discrimination, calibration, and clinical utility. Results: The individuals were divided into the training (n = 4068) or validation (n = 969) cohorts at a ratio of 8 to 2. The overall prevalence of NAFLD in the lean cohort was 6.43%. The nomogram was constructed based on seven predictors: alanine aminotransferase, total cholesterol, triglycerides, low-density lipoprotein cholesterol, creatinine, uric acid, and hemoglobin A1C. The model based on these factors showed good predictive accuracy in the training set and in the internal validation set, with areas under the curve (AUCs) of 0.870 and 0.887, respectively. The calibration curves and decision curve analysis (DCA) displayed good clinical utility. Conclusion: the nomogram model provides a simple and reliable ability to predict the risk of NAFLD in lean subjects. The model can predict lean NAFLD and can help physicians screen and identify lean subjects at a high risk of NAFLD.

1. Introduction

Nonalcoholic fatty liver disease (NAFLD) is the most common liver disease in industrialized countries and is an emerging issue in East Asia. NAFLD is characterized by the accumulation of fat in more than 5% of the hepatocyte and is not associated with alcohol consumption [1]. NAFLD is a disease that covers a wide spectrum, ranging from simple steatosis to nonalcoholic steatohepatitis (NASH), NASH-related liver fibrosis, cirrhosis, and hepatocellular carcinoma [2,3,4,5]. NAFLD is indirectly associated with an increase in metabolic syndrome, which also includes abdominal obesity, insulin resistance, elevated blood pressure, altered fasting glucose, and dyslipidemia [6,7]. In addition, NAFLD has been found to be closely related to many extrahepatic comorbidities such as colorectal adenoma, cardiovascular disease, type 2 diabetes mellitus, chronic kidney disease, and neurological system diseases.
While the prevalence of NAFLD is higher in subjects with obesity, NAFLD can also be found in individuals who are not obese or are lean, which is commonly the case in Asians [8]. The subset of NAFLD individuals with BMI < 25 kg/m2 is termed “non-obese NAFLD” [9], but the definition of “lean NAFLD” varies with different BMI cut-off points among races. In Asian populations, lean NAFLD is often used to refer to patients whose BMI is below 23 kg/m2 [10,11]. Some studies demonstrated that one fifth of all NAFLD patients are individuals who are not obese. Recently, an epidemiological study reported that the prevalence of non-obese or lean NAFLD increased dramatically among East Asian populations. A Taiwanese study showed a prevalence of 12.7% for NAFLD in individuals who are non-obese [12]. Additionally, a Korean study revealed a prevalence of 23.4% in non-obese adults during a health checkup [13].
Epidemiological studies on NAFLD have been conducted in populations of people with obesity; however, much less is known about NAFLD in individuals who are lean. Despite lean subjects with NAFLD having milder metabolic abnormalities (e.g., dyslipidemia, insulin resistance, hypertension, and diabetes), they can develop the whole spectrum of NASH including steatosis, lobular inflammation, hepatocyte ballooning, and/or fibrosis [14]. To improve the management and prevention of this disease, obtaining a useful predictive tool for lean populations is important to realize the factors associated with lean NAFLD. Nomograms have been widely used in developing predictive models of disease. This study aims to construct and validate a nomogram to detect NAFLD in the lean Chinese population.

2. Method

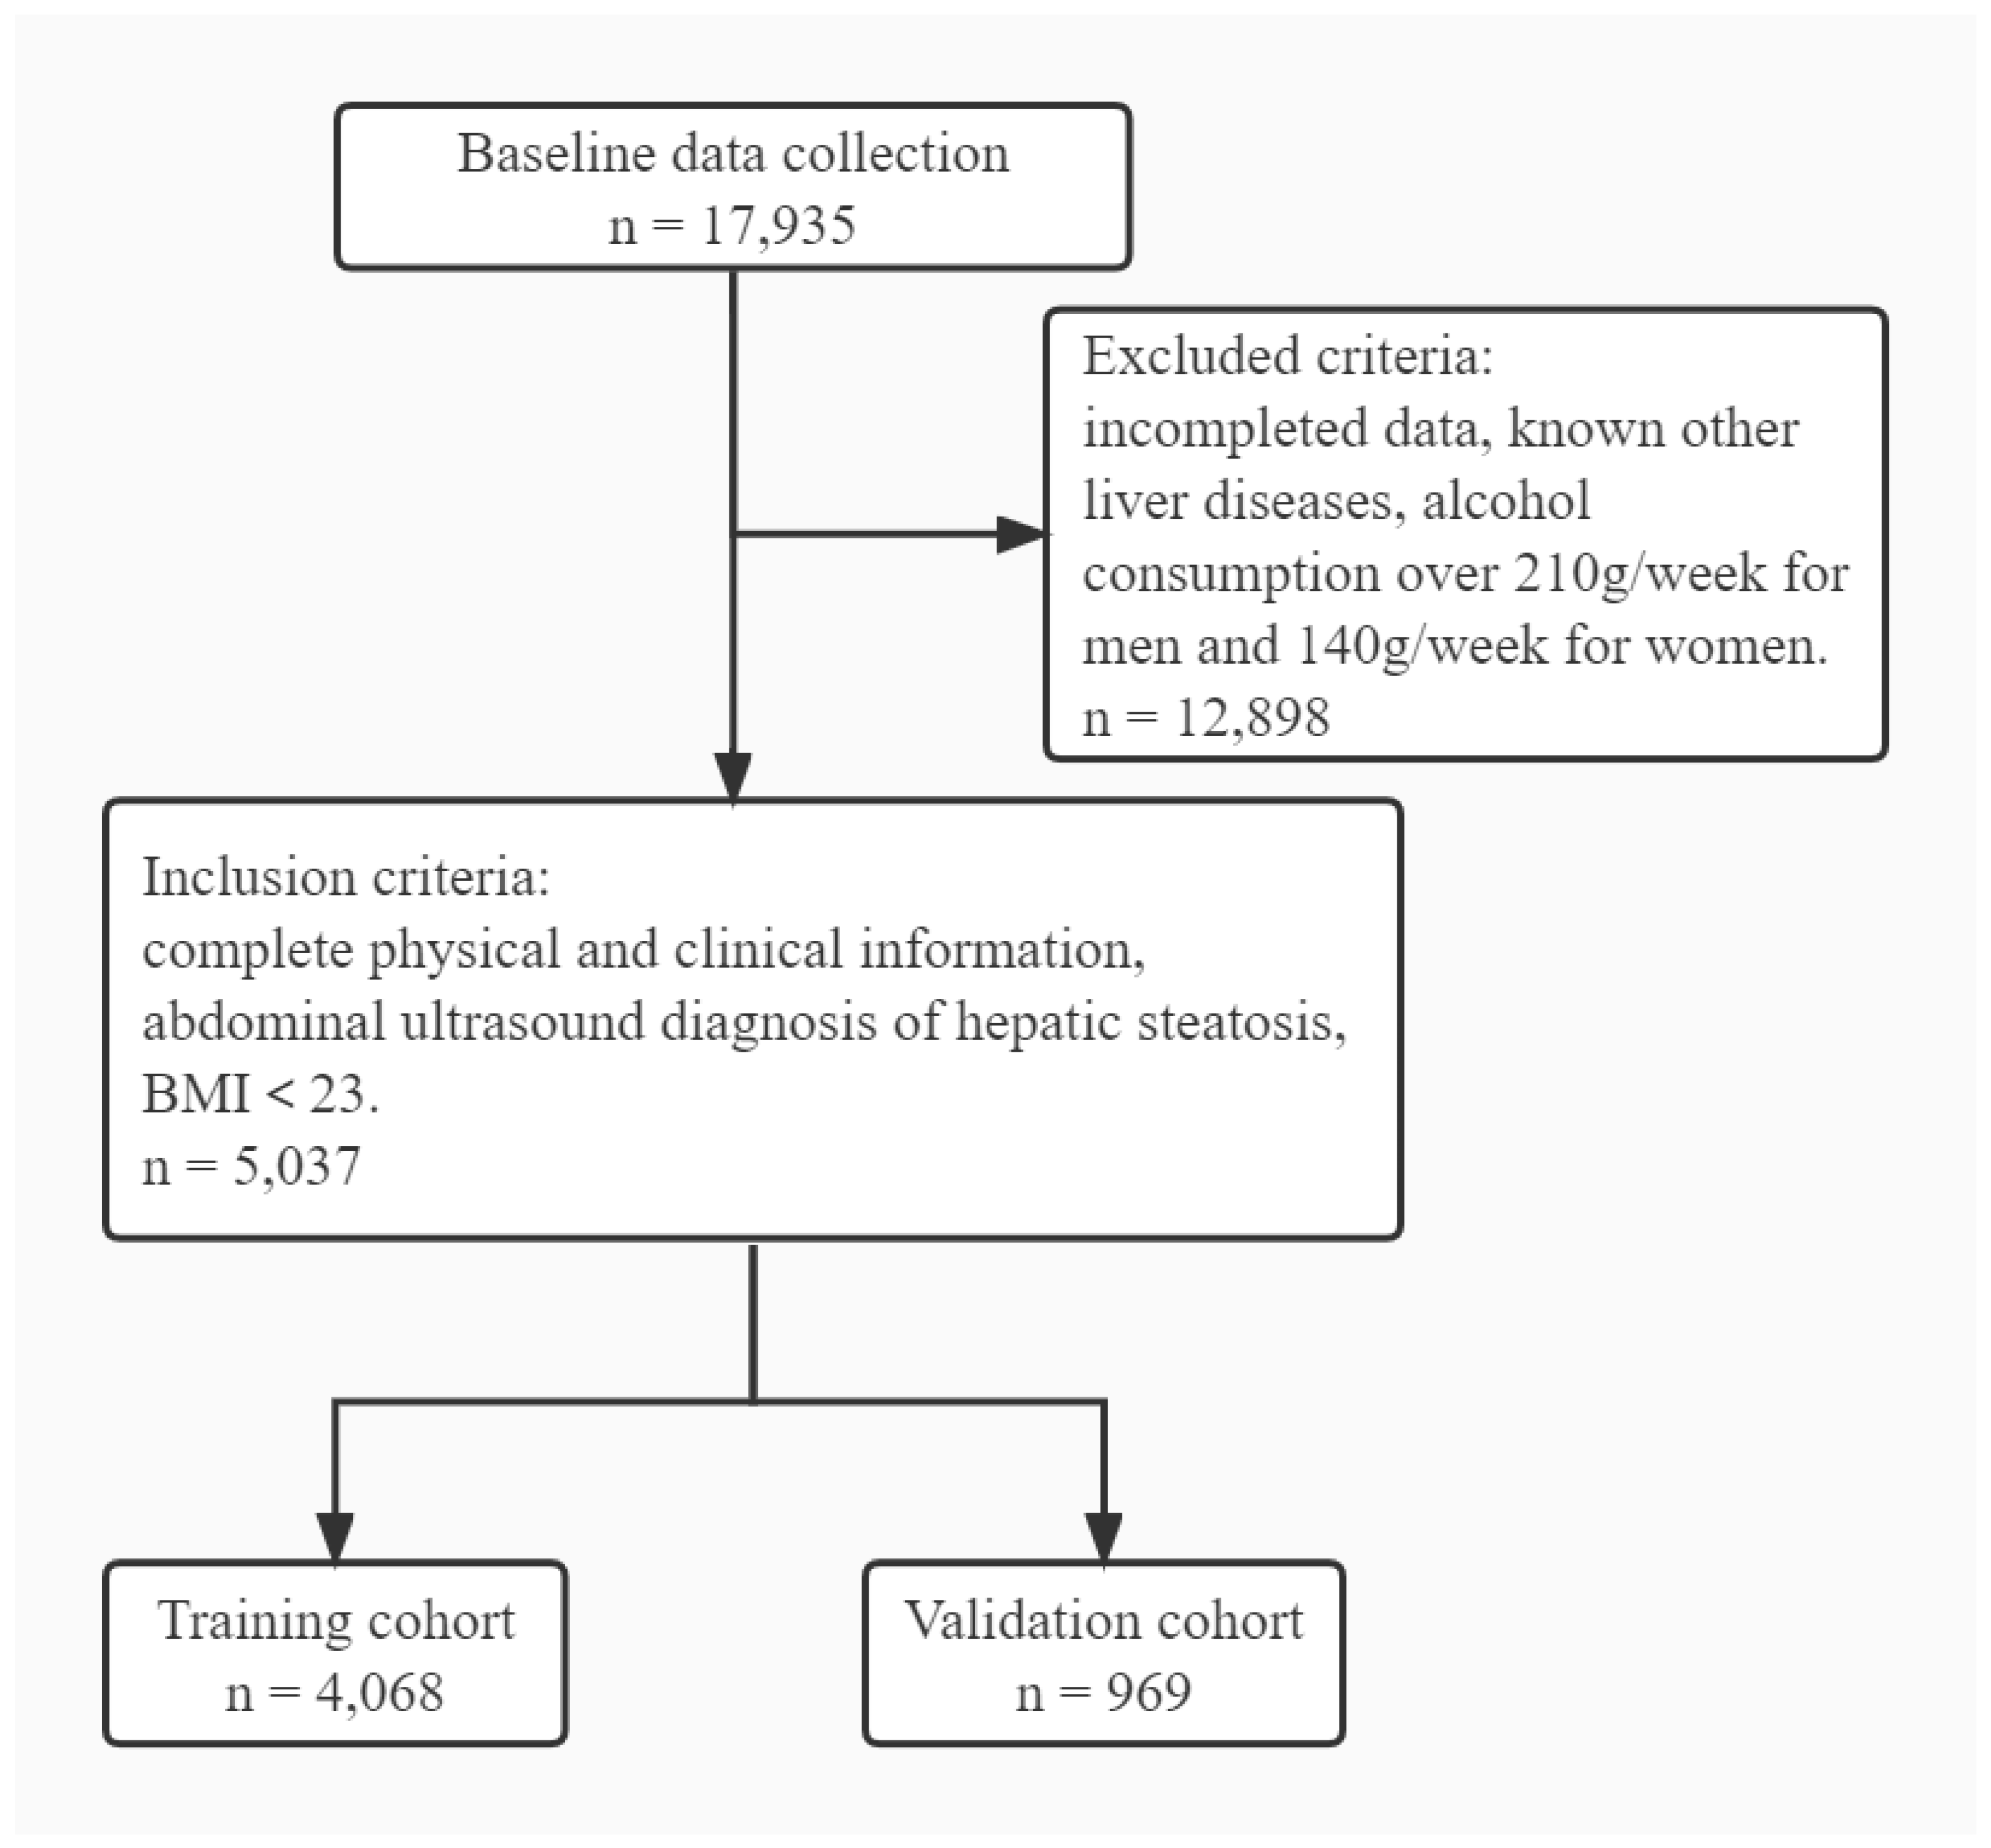
2.1. Study Population

A cross-sectional study was conducted on adults who presented NAFLD during a health checkup at the First Affiliated Hospital of Soochow University from January 2022 to June 2022, and the protocol was approved by the Ethics Committee of the First Affiliated Hospital of Soochow University (approval number: 2022-232).
Patients with NAFLD were diagnosed based on the presence of hepatic steatosis in their abdominal ultrasonography findings, confirmed by multiple professional radiologists. For a diagnosis of steatosis to be made from the ultrasounds, criteria such as the detection of liver brightness; contrast between the liver and the kidney; and the appearance of the liver parenchyma, intrahepatic vessels, and diaphragm had to be met. Steatosis of a fatty liver can be categorized as mild steatosis (fat content over 5%) or moderate–severe (fat content over 20–30%) (Figure 1) [15]. The population in this study included both mild and moderate–severe steatosis groups based on their abdominal ultrasound but excluded cirrhosis and secondary causes of fatty liver diseases, especially chronic liver disease (such as viral hepatitis or autoimmune hepatitis) or alcohol consumption (>210 g/week in men and >140 g/week in women) [16]. In addition, subjects who did not have data relating to abdominal imaging findings or had a body mass index (BMI) of ≥23 kg/m2 were excluded from the study.

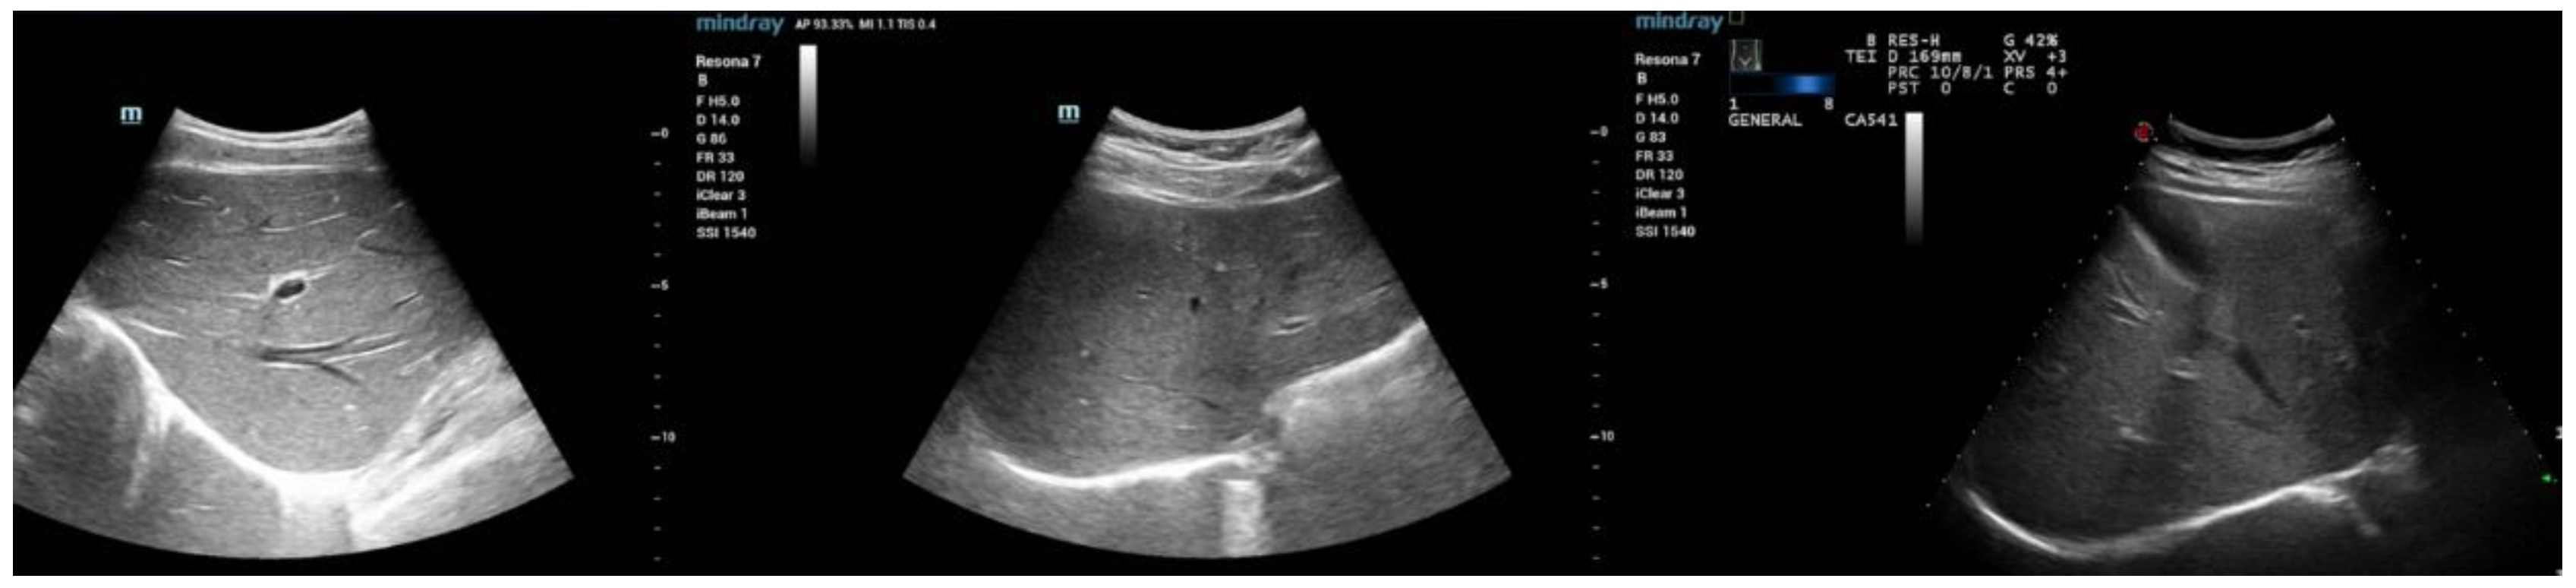
2.2. Clinical Assessment

Clinical data including blood pressure, sex, and date of birth were recorded. The blood samples used to assess for biochemical function and used in the blood routine tests were collected after fasting for 8 h. Biomedical parameters including fasting serum glucose, albumin, total bilirubin, direct bilirubin, indirect bilirubin, gamma-glutamyltransferase (GGT), alkaline phosphatase alanine (ALP), aminotransferase (ALT), aspartate transaminase (AST), total proteins, total cholesterol, triglycerides, high-density lipoprotein (HDL), low-density lipoprotein (LDL), creatinine, urea, urea acid (UA), and hemoglobin A1C (HbA1c) were obtained. Hematological indicators including white blood cell (WBC), red blood cell (RBC), platelet, lymphocytes, monocytes, and neutrophils were measured. In total, 28 routine clinical and laboratory parameters were collected. The flowchart of the study is shown in Figure 2.

2.3. Statistical Analysis

Continuous data were presented as means with standard deviations, while categorical variables were shown as frequencies with percentages. A univariate logistic regression analysis combined with a multivariate logistic regression analysis (backward elimination) was performed to select the optimal predictive factors. The univariate and multivariate analyses were explored to identify the predictive variables strongly associated with lean NAFLD. The features were presented as odds ratio (OR) and 95% confidence intervals (95% CI). A value of p < 0.05 was considered statistically significant. All statistical analyses and graphic plotting were performed in R software (version 4.1.0, R Foundation for Statistical Computing, Vienna, Austria) (http://www.R-project.org (accessed on 20 November 2022).

2.4. Establishment and Evaluation of the Nomogram

To build the nomogram, the dataset was divided into training and validation sets randomly at a ratio of 8:2 and the variables were compared. A model predicting NAFLD in a lean population was constructed according to the logistic regression analysis, and the significant clinical factors were used to construct the nomogram. The performance of the nomogram was assessed in terms of calibration and discrimination, identified using a calibration curve and a receiver operating characteristic (ROC) curve, respectively [17,18].

3. Results

3.1. Demographic and Clinical Characteristics of Patients

The overall characteristics of patients are presented in Table 1. The overall prevalence of NAFLD in the lean cohort was 6.43%. Additionally, 252 and 72 individuals developing NAFLD were included in the training and validation sets, respectively. The total number of patients, 5037, were randomly split into the training and validation cohorts at a ratio of 8 to 2 (n = 4068 in the training set and n = 969 in the validation set). Of the subjects in the NAFLD group, 42.3% were male, with a median age of 48 years. Patients with NAFLD were typically older and had higher values in the lipid and renal metabolic panels.

3.2. Selection of Predictive Factors

A univariate logistic regression analysis identified 26 variables as potential risk factors: age, sex, WBC, RBC, platelet, lymphocytes, monocytes, neutrophils, systolic blood pressure (SBP), diastolic blood pressure (DBP), glucose, HbA1c, urea, creatinine, UA, total protein, albumin, indirect bilirubin, GGT, ALP, total cholesterol, triglycerides, HDL, LDL, ALT, and AST. Factors that significantly affected lean NAFLD in the univariate analysis were included in a multivariate analysis, which demonstrated that sex, age, RBC, platelet, ALT, total cholesterol, triglycerides, LDL, creatinine, UA, and HbA1c were independent predictive factors associated with the presence of NAFLD in lean individuals (Table 2). The features were presented as OR and 95% CI, and a p value < 0.05 was considered statistically significant.

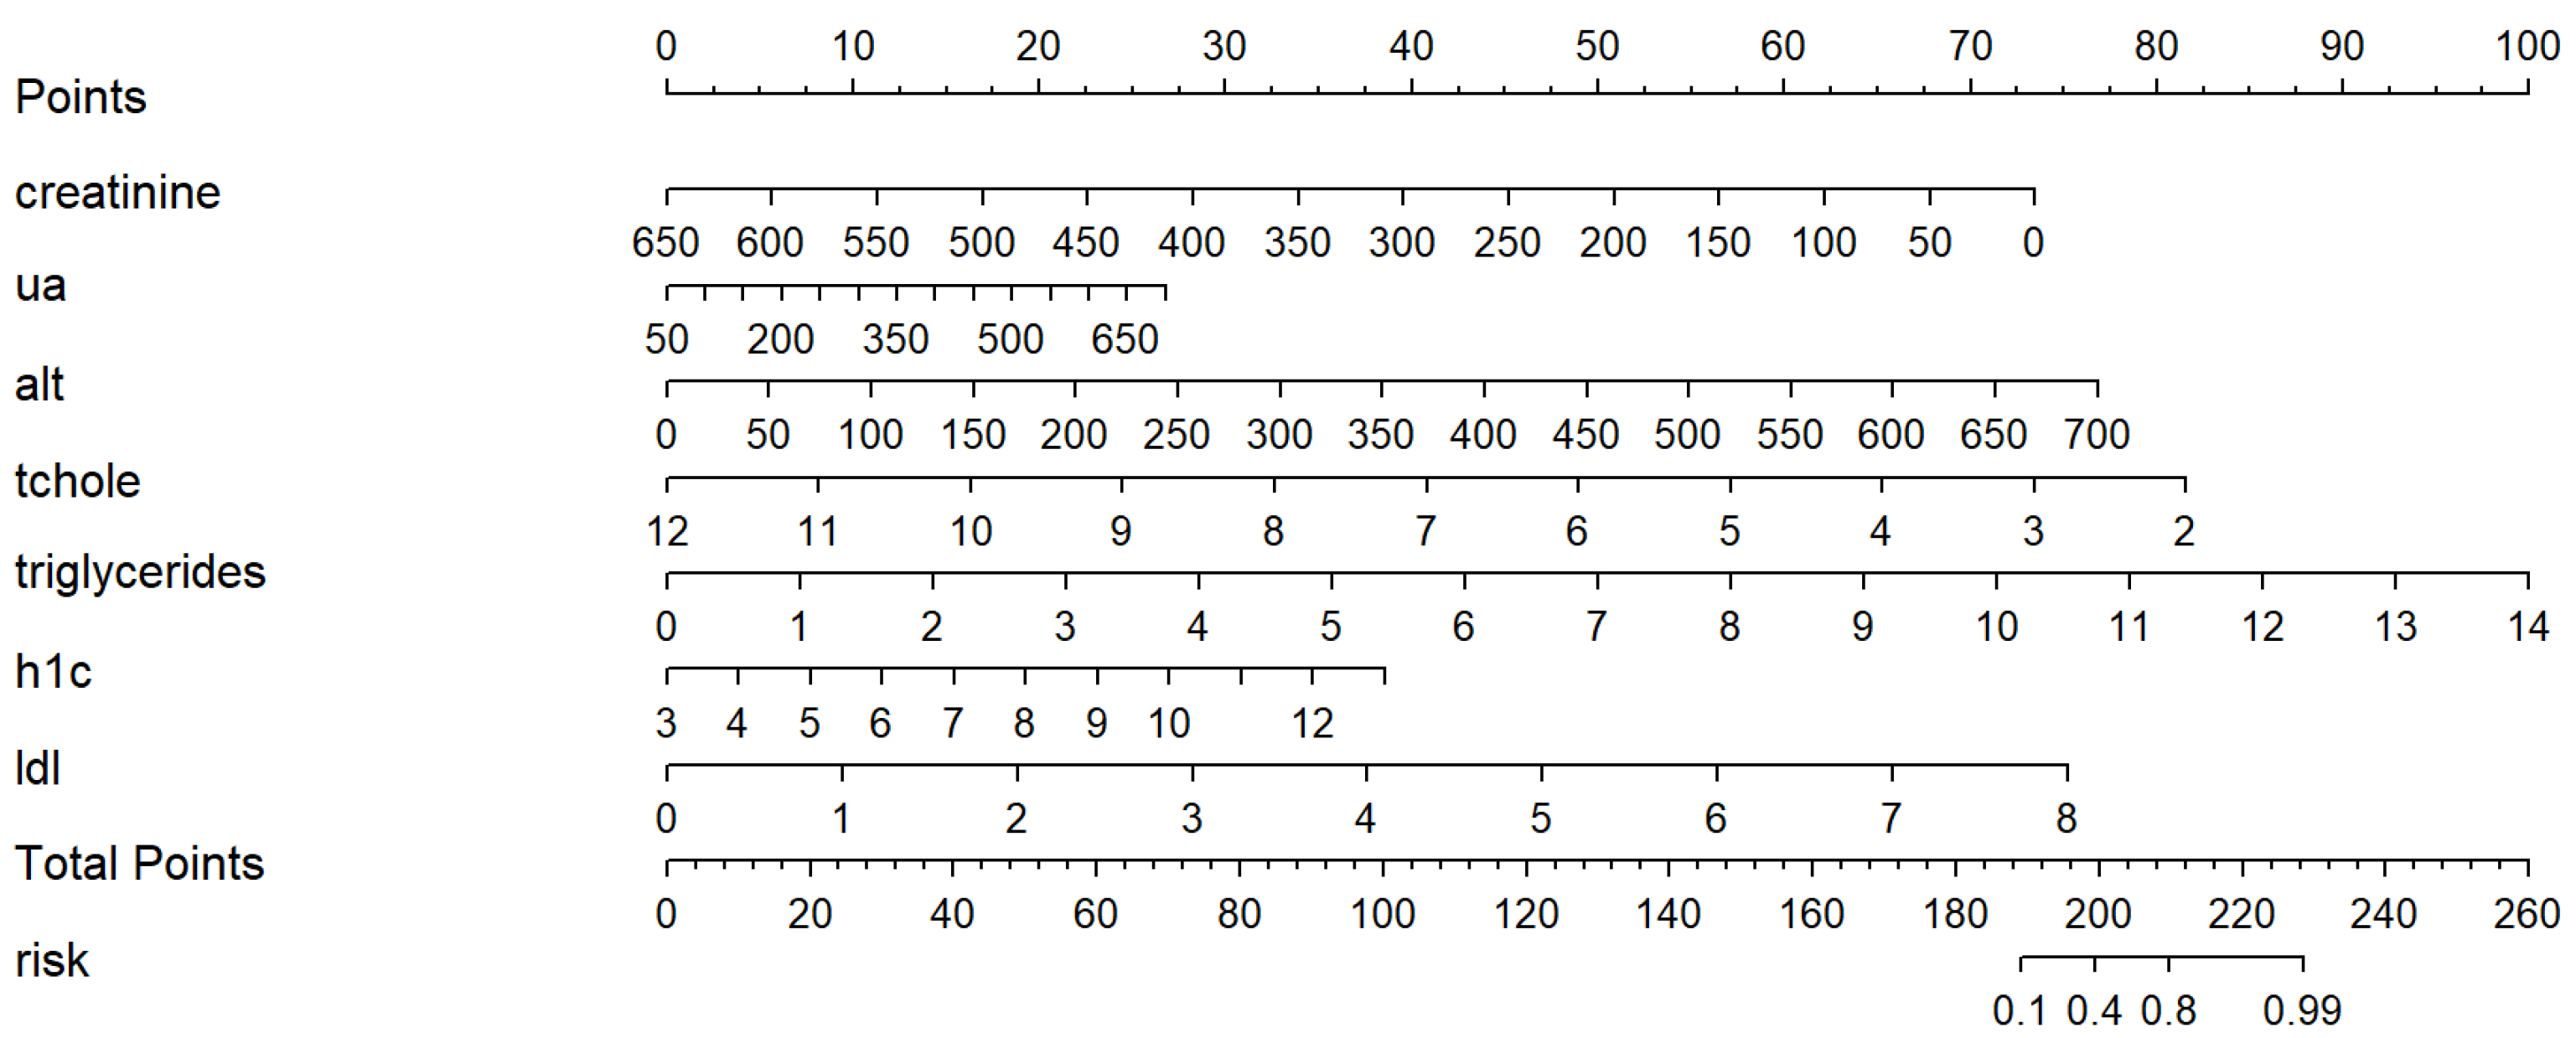
3.3. Development of Nomogram

Eleven variables were selected in the multivariate logistic regression analysis: age, gender, RBC, platelet, ALT, total cholesterol, triglycerides, LDL, creatinine, UA, and HbA1c. To develop a simple-to-use nomogram, the predictive variables were selected according to the logistic regression analysis findings and clinical application. Compared with other factors, age, sex, RBC, and platelet carried less weight in the overall model and obtained small scores on the risk score panel for its respective categories. Consequently, the nomogram was constructed by incorporating nine predictors, including ALT, total cholesterol, triglycerides, LDL, creatinine, UA, and HbA1c. Each factor was scored using the top points scale, and the overall points were added to the lowest total points scale to obtain the NAFLD risk for the evaluated individual.

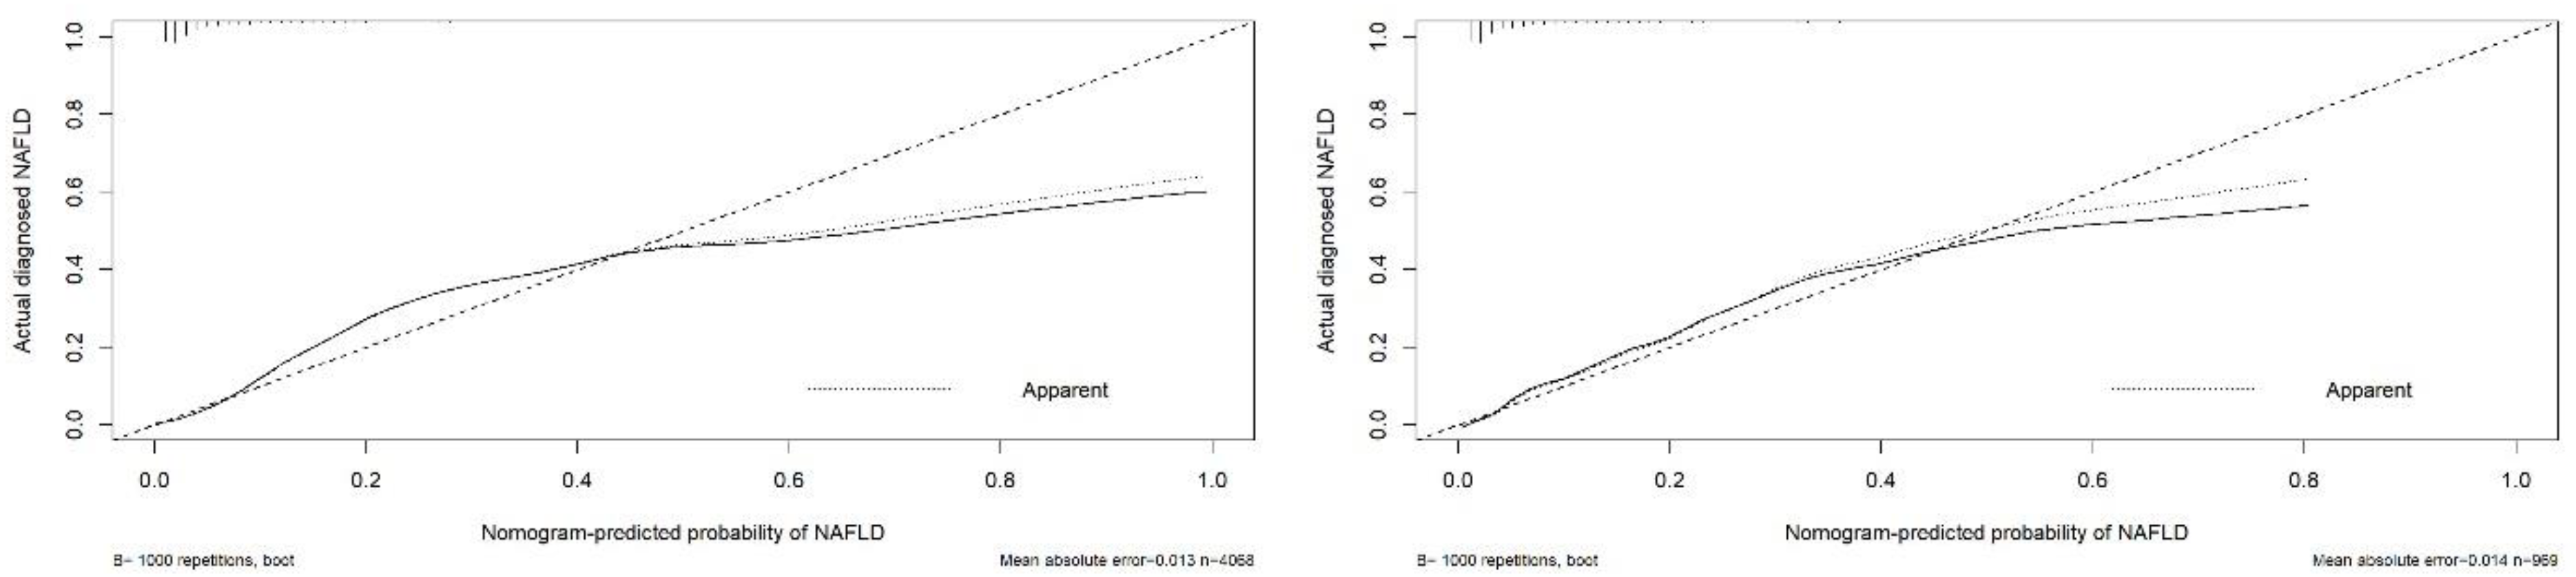
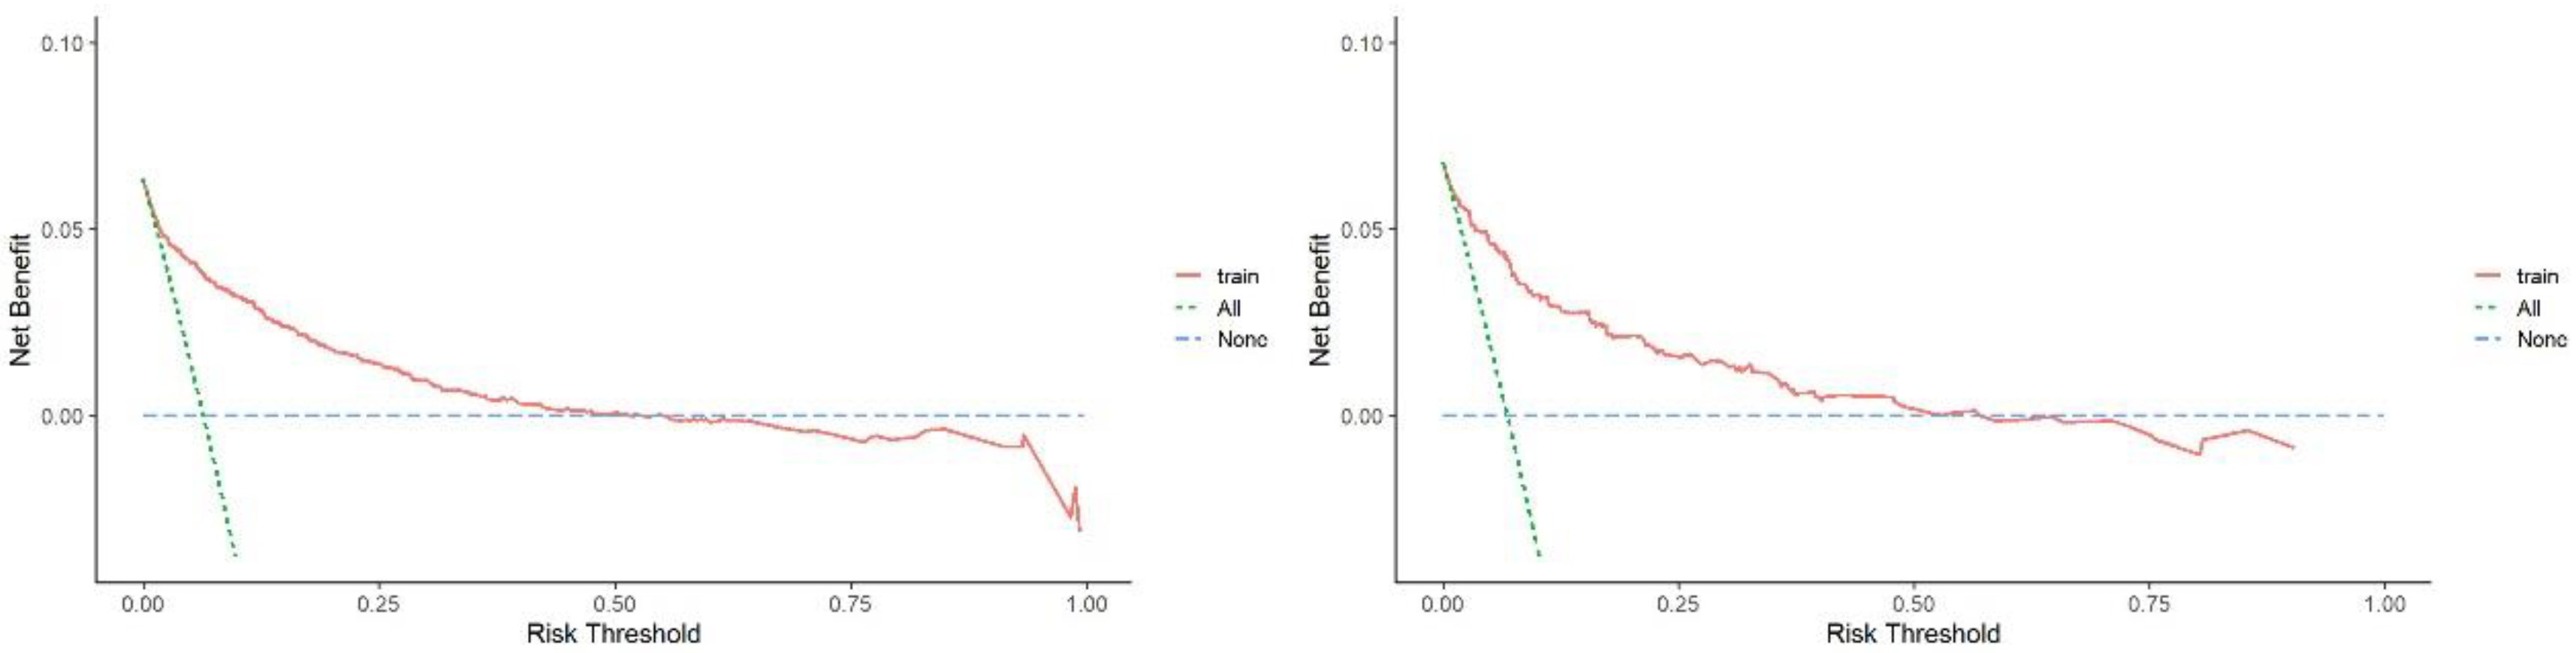
3.4. Evaluations of the Nomogram Performance

Evaluations of the nomogram’s validity were conducted on its discrimination, calibration, and clinical utility by plotting an ROC curve, a calibration curve, and a DCA curve. As is shown in Figure 3, in the training cohort, the area under the curve (AUC) of the nomogram was 0.870. In the internal validation cohort, the AUC was 0.887. These results indicate that the nomogram was efficient in distinguishing between subjects with NAFLD and non-NAFLD in a lean population (Figure 4). The calibration of the prediction model was evaluated, and a calibration curve was obtained (Figure 5). The decision curve analysis showed good clinical value and a wide range of benefits (Figure 6).

4. Discussion

In recent decades, with the changes in lifestyle and diet in China, the burden of NAFLD has increased. Previous models predicted that China will see the greatest growth in NAFLD prevalence compared with the rest of the world in 2030 [19]. Although NAFLD is strongly observed in individuals with overweight or obesity, type 2 diabetes, or metabolic syndromes, almost 20% of patients with NAFLD are estimated to have lean or nonobese body habitus [20]. Clinically, most NAFLD in lean patients is diagnosed incidentally during imaging examinations for other medical illnesses [21]. Developing a simple and practical predictive tool is critical for screening individuals in the lean population who have a potential risk of NAFLD, especially in routine annual physical examinations when abdominal ultrasounds are not ordered. In this study, a convenient and practical nomogram was developed and validated to detect NAFLD in lean subjects. Seven parameters were included in the nomogram: ALT, total cholesterol, triglycerides, LDL, creatinine, UA, and HbA1c. These parameters make the nomogram an objective and easy-to-use predictive tool for screening patients for lean NAFLD and may help contribute to a better clinical diagnosis and early prevention.
Dyslipidemia is a well-known metabolic feature in NAFLD. Our study found that increased levels of cholesterol, triglycerides, and LDL are risk factors in lean NAFLD. Experimental and clinical evidence suggested that an increase in intrahepatic cholesterol might be related to NAFLD progression and that the accumulation of cholesterol in the liver was a possible pathological mechanism of NASH development [22,23,24]. In the current study, dyslipidemia, especially hypertriglyceridemia is a vital factor for NAFLD development, progression and regression and is associated with NAFLD in lean subjects [12,25]. Hypertriglyceridemia and hepato-steatosis are generally believed to result from an increase in FFA. Studies have reported that lean NAFLD subjects had more visceral adiposity, which leads to a high level of FFA in the liver and exacerbates hepatic triglyceride accumulation [26]. During the pathophysiological process of hyperglyceridemia, the peripheral adipose tissue increase lipolysis and the hepatocytes increase the uptake of FFA [27]. In addition, hypertriglyceridemia can stimulate de novo lipogenesis and decrease FFA oxidation in the liver, which have significant influence on hepatic steatosis [28]. In line with our study results, previous studies reported that hyperglyceridemia is an independent parameter contributing to the development of NAFLD in lean individuals [11]. Khalid’s team from Saudi Arabia revealed that cholesterol and LDL were correlated with lean fatty liver in patients as well, especially among female individuals [29]. ALT is an indicator of liver injury with high sensitivity and specificity, and studies revealed that elevated ALT was a manifestation of NAFLD. Wang et al. found that ALT was demonstrated to be an independent risk factor in NAFLD and was even higher among female subjects in the lean group compared with those in the overweight/obese groups [30,31]. Conversely, not all the NASH patients had elevated ALT, and one fourth of patients with NAFLD have a normal value of ALT [32,33].
The results indicated that HbA1c was markedly increased by the presence of NAFLD in lean subjects and, thus, is a risk factor, and this increase provides a possible pathological link with metabolic irregularities and insulin resistance. The current study revealed that insulin resistance plays a vital role in the pathogenesis of NAFLD in subjects who are lean and in those who are obese, regardless of metabolic syndrome. The possible mechanism of insulin resistance in NAFLD is that increased hepatic insulin and impaired glucose are involved in hepatic de novo lipogenesis, which activate sterol regulatory element-binding protein 1c (SREBP-1c) and carbohydrate response element-binding protein (ChREBP), respectively. These processes contribute to hepatic free fatty acids (FFA) accumulation, which plays a major role in NAFLD pathogenesis [34,35,36,37,38,39].
Moreover, UA and creatinine are significant risk factors in the lean NAFLD group. A disturbance in UA has been reported to possibly be responsible for an impairment in lipid metabolism and insulin resistance through the NLRP3 inflammasome. In the liver, UA was regulated by the oxidative stress process in mitochondria, and a high level of UA in hepatocytes might lead to an enhancement of lipid superoxide, which exacerbates hepatic steatosis [40,41]. The reduction in creatinine associated with NAFLD might be due to sarcopenia, which means low skeletal muscle mass and reduced function. Studies have reported that skeletal muscle mass was lower in lean patients with NAFLD, compared with that in subjects who are obese. Recent studies found that insulin resistance, mitochondrial dysfunction, and chronic low-grade inflammation were recognized as important causative factors for sarcopenia in NAFLD [42,43,44,45,46].
In the study, we developed a nomogram using a large sample to diagnose the general lean population for NAFLD, and the model showed good discrimination, calibration, and clinical utility. However, the potential limitations of our study should also be mentioned. First, patients with NAFLD were diagnosed based on hepatic ultrasound examination, which does not provide a severity score without a biopsy examination and omits the liver fat content. Second, some clinical variables such as waist circumference and lifestyle information were not included, resulting in a possible selection bias. Third, we did not collect patients’ medication information; some medications could affect liver function, such as station, which might protect the liver from steatosis [47]. Lastly, this nomogram was constructed with single-center data and was not validated by an external hospital. Thus, multicentric investigations are still needed.
In conclusion, in this study, we constructed a nomogram based on seven predictors—ALT, total cholesterol, triglycerides, LDL, creatinine, UA, and HbA1c—associated with NAFLD in lean individuals. This nomogram can be deployed as a simple tool that would help physicians in screening and identifying lean subjects at high risk of NAFLD.

Author Contributions

Each author participated sufficiently in this work to take public responsibility for the content. L.L. contributed to the design of the study and wrote the first draft of the manuscript. X.S. contributed to data collection, and analysis. J.G. and C.X. contributed to results’ interpretation. X.L. critically appraised and revised the manuscript. All authors have read and agreed to the published version of the manuscript.

Funding

This study was supported by the National Natural Science Foundation of China (Number: 81900508), the science and technology plan of Suzhou city (Number: SKY2021038).

Institutional Review Board Statement

This study was approved by the Ethics Committee of the First Affiliated Hospital of Soochow University (Number: 2022-232).

Informed Consent Statement

Informed consent was obtained from all subjects involved in the study.

Data Availability Statement

Not applicable.

Conflicts of Interest

The authors declare no conflict of interest.

References

  1. Fouad, Y.; Waked, I.; Bollipo, S.; Gomaa, A.; Ajlouni, Y.; Attia, D. What’s in a name? Renaming ‘NAFLD’ to ‘MAFLD’. Liver Int. 2020, 40, 1254–1261. [Google Scholar] [CrossRef] [PubMed] [Green Version]
  2. Diehl, A.M.; Day, C. Cause, Pathogenesis, and Treatment of Nonalcoholic Steatohepatitis. N. Engl. J. Med. 2017, 377, 2063–2072. [Google Scholar] [CrossRef] [PubMed]
  3. Gariani, K.; Jornayvaz, F.R. Pathophysiology of NASH in endocrine diseases. Endocr. Connect. 2021, 10, R52–R65. [Google Scholar] [CrossRef]
  4. Brown, G.T.; Kleiner, D.E. Histopathology of nonalcoholic fatty liver disease and nonalcoholic steatohepatitis. Metabolism 2016, 65, 1080–1086. [Google Scholar] [CrossRef] [Green Version]
  5. Nalbantoglu, I.L.; Brunt, E.M. Role of liver biopsy in nonalcoholic fatty liver disease. World J. Gastroenterol. 2014, 20, 9026–9037. [Google Scholar] [CrossRef]
  6. Ciardullo, S.; Perseghin, G. Prevalence of elevated liver stiffness in patients with type 1 and type 2 diabetes: A systematic review and meta-analysis. Diabetes Res. Clin. Pract. 2022, 190, 109981. [Google Scholar] [CrossRef]
  7. Ciardullo, S.; Monti, T.; Perseghin, G. High Prevalence of Advanced Liver Fibrosis Assessed by Transient Elastography among U.S. Adults with Type 2 Diabetes. Diabetes. Care. 2021, 44, 519–525. [Google Scholar] [CrossRef] [PubMed]
  8. Das, K.; Das, K.; Mukherjee, P.S.; Ghosh, A.; Ghosh, S.; Mridha, A.R.; Dhibar, T.; Bhattacharya, B.; Bhattacharya, D.; Manna, B.; et al. Nonobese population in a developing country has a high prevalence of nonalcoholic fatty liver and significant liver disease. Hepatology 2010, 51, 1593–1602. [Google Scholar] [CrossRef]
  9. Younes, R.; Govaere, O.; Petta, S.; Miele, L.; Tiniakos, D.; Burt, A.; David, E.; Vecchio, F.M.; Maggioni, M.; Cabibi, D.; et al. Caucasian lean subjects with non-alcoholic fatty liver disease share long-term prognosis of non-lean: Time for reappraisal of BMI-driven approach? Gut 2022, 71, 382–390. [Google Scholar] [CrossRef]
  10. Niriella, M.A.; Kasturiratne, A.; Pathmeswaran, A.; De Silva, S.T.; Perera, K.R.; Subasinghe, S.; Kodisinghe, S.K.; Piyaratna, T.; Vithiya, K.; Dassanayaka, A.S.; et al. Lean non-alcoholic fatty liver disease (lean NAFLD): Characteristics, metabolic outcomes and risk factors from a 7-year prospective, community cohort study from Sri Lanka. Hepatol. Int. 2019, 13, 314–322. [Google Scholar] [CrossRef]
  11. Leung, J.C.; Loong, T.C.; Wei, J.L.; Wong, G.L.; Chan, A.W.; Choi, P.C.; Shu, S.S.; Chim, A.M.; Chan, H.L.; Wong, V.W. Histological severity and clinical outcomes of nonalcoholic fatty liver disease in nonobese patients. Hepatology 2017, 65, 54–64. [Google Scholar] [CrossRef] [PubMed]
  12. Chen, C.H.; Huang, M.H.; Yang, J.C.; Nien, C.K.; Yang, C.C.; Yeh, Y.H.; Yueh, S.K. Prevalence and risk factors of nonalcoholic fatty liver disease in an adult population of taiwan: Metabolic significance of nonalcoholic fatty liver disease in nonobese adults. J. Clin. Gastroenterol. 2006, 40, 745–752. [Google Scholar] [CrossRef] [PubMed]
  13. Kim, H.J.; Kim, H.J.; Lee, K.E.; Kim, D.J.; Kim, S.K.; Ahn, C.W.; Lim, S.K.; Kim, K.R.; Lee, H.C.; Huh, K.B.; et al. Metabolic significance of nonalcoholic fatty liver disease in nonobese, nondiabetic adults. Arch. Intern. Med. 2004, 164, 2169–2175. [Google Scholar] [CrossRef] [Green Version]
  14. Younes, R.; Bugianesi, E. NASH in Lean Individuals. Semin. Liver. Dis. 2019, 39, 86–95. [Google Scholar] [CrossRef] [PubMed] [Green Version]
  15. Ferraioli, G.; Soares Monteiro, L.B. Ultrasound-based techniques for the diagnosis of liver steatosis. World J. Gastroenterol. 2019, 25, 6053–6062. [Google Scholar] [CrossRef] [PubMed]
  16. Lin, S.; Huang, J.; Wang, M.; Kumar, R.; Liu, Y.; Liu, S.; Wu, Y.; Wang, X.; Zhu, Y. Comparison of MAFLD and NAFLD diagnostic criteria in real world. Liver Int. 2020, 40, 2082–2089. [Google Scholar] [CrossRef] [PubMed]
  17. Zhang, Z.; Rousson, V.; Lee, W.C.; Ferdynus, C.; Chen, M.; Qian, X.; Guo, Y. Decision curve analysis: A technical note. Ann. Transl. Med. 2018, 6, 308. [Google Scholar] [CrossRef] [PubMed]
  18. Vickers, A.J.; van Calster, B.; Steyerberg, E.W. A simple, step-by-step guide to interpreting decision curve analysis. Diagn. Progn. Res. 2019, 3, 18. [Google Scholar] [CrossRef] [Green Version]
  19. Estes, C.; Anstee, Q.M.; Arias-Loste, M.T.; Bantel, H.; Bellentani, S.; Caballeria, J.; Colombo, M.; Craxi, A.; Crespo, J.; Day, C.P.; et al. Modeling NAFLD disease burden in China, France, Germany, Italy, Japan, Spain, United Kingdom, and United States for the period 2016–2030. J. Hepatol. 2018, 69, 896–904. [Google Scholar] [CrossRef] [PubMed]
  20. Long, M.T.; Noureddin, M.; Lim, J.K. AGA Clinical Practice Update: Diagnosis and Management of Nonalcoholic Fatty Liver Disease in Lean Individuals: Expert Review. Gastroenterology 2022, 163, 764–774.e761. [Google Scholar] [CrossRef] [PubMed]
  21. Bertot, L.C.; Jeffrey, G.P.; Wallace, M.; MacQuillan, G.; Garas, G.; Ching, H.L.; Adams, L.A. Nonalcoholic fatty liver disease-related cirrhosis is commonly unrecognized and associated with hepatocellular carcinoma. Hepatol. Commun. 2017, 1, 53–60. [Google Scholar] [CrossRef] [Green Version]
  22. Musso, G.; Gambino, R.; Cassader, M. Cholesterol metabolism and the pathogenesis of non-alcoholic steatohepatitis. Prog. Lipid. Res. 2013, 52, 175–191. [Google Scholar] [CrossRef] [PubMed] [Green Version]
  23. Tomita, K.; Teratani, T.; Suzuki, T.; Shimizu, M.; Sato, H.; Narimatsu, K.; Okada, Y.; Kurihara, C.; Irie, R.; Yokoyama, H.; et al. Free cholesterol accumulation in hepatic stellate cells: Mechanism of liver fibrosis aggravation in nonalcoholic steatohepatitis in mice. Hepatology 2014, 59, 154–169. [Google Scholar] [CrossRef] [PubMed]
  24. Ioannou, G.N.; Haigh, W.G.; Thorning, D.; Savard, C. Hepatic cholesterol crystals and crown-like structures distinguish NASH from simple steatosis. J. Lipid. Res. 2013, 54, 1326–1334. [Google Scholar] [CrossRef] [PubMed] [Green Version]
  25. Vendhan, R.; Amutha, A.; Anjana, R.M.; Unnikrishnan, R.; Deepa, M.; Mohan, V. Comparison of characteristics between nonobese and overweight/obese subjects with nonalcoholic fatty liver disease in a South Indian population. Diabetes Technol. Ther. 2014, 16, 48–55. [Google Scholar] [CrossRef] [PubMed]
  26. Gonzalez-Cantero, J.; Martin-Rodriguez, J.L.; Gonzalez-Cantero, A.; Arrebola, J.P.; Gonzalez-Calvin, J.L. Insulin resistance in lean and overweight non-diabetic Caucasian adults: Study of its relationship with liver triglyceride content, waist circumference and BMI. PLoS ONE 2018, 13, e0192663. [Google Scholar] [CrossRef] [PubMed]
  27. Donnelly, K.L.; Smith, C.I.; Schwarzenberg, S.J.; Jessurun, J.; Boldt, M.D.; Parks, E.J. Sources of fatty acids stored in liver and secreted via lipoproteins in patients with nonalcoholic fatty liver disease. J. Clin. Invest 2005, 115, 1343–1351. [Google Scholar] [CrossRef] [PubMed] [Green Version]
  28. Fabbrini, E.; Sullivan, S.; Klein, S. Obesity and nonalcoholic fatty liver disease: Biochemical, metabolic, and clinical implications. Hepatology 2010, 51, 679–689. [Google Scholar] [CrossRef] [PubMed] [Green Version]
  29. Alsuhaibani, K.A.; Althunayyan, F.S.; Alsudays, A.M.; Alharbi, A.A.; Aljarallah, B.M. Nonalcoholic fatty liver disease in lean and obese patients in Saudi patients from a single center. J. Family Med. Prim. Care. 2021, 10, 3381–3386. [Google Scholar] [CrossRef] [PubMed]
  30. Akyuz, U.; Yesil, A.; Yilmaz, Y. Characterization of lean patients with nonalcoholic fatty liver disease: Potential role of high hemoglobin levels. Scand. J. Gastroenterol. 2015, 50, 341–346. [Google Scholar] [CrossRef] [PubMed]
  31. Wang, W.; Ren, J.; Zhou, W.; Huang, J.; Wu, G.; Yang, F.; Yuan, S.; Fang, J.; Liu, J.; Jin, Y.; et al. Lean non-alcoholic fatty liver disease (Lean-NAFLD) and the development of metabolic syndrome: A retrospective study. Sci. Rep. 2022, 12, 10977. [Google Scholar] [CrossRef] [PubMed]
  32. Ma, X.; Liu, S.; Zhang, J.; Dong, M.; Wang, Y.; Wang, M.; Xin, Y. Proportion of NAFLD patients with normal ALT value in overall NAFLD patients: A systematic review and meta-analysis. BMC Gastroenterol. 2020, 20, 10. [Google Scholar] [CrossRef] [PubMed] [Green Version]
  33. Verma, S.; Jensen, D.; Hart, J.; Mohanty, S.R. Predictive value of ALT levels for non-alcoholic steatohepatitis (NASH) and advanced fibrosis in non-alcoholic fatty liver disease (NAFLD). Liver. Int. 2013, 33, 1398–1405. [Google Scholar] [CrossRef]
  34. Shimomura, I.; Bashmakov, Y.; Ikemoto, S.; Horton, J.D.; Brown, M.S.; Goldstein, J.L. Insulin selectively increases SREBP-1c mRNA in the livers of rats with streptozotocin-induced diabetes. Proc. Natl. Acad. Sci. USA 1999, 96, 13656–13661. [Google Scholar] [CrossRef] [PubMed] [Green Version]
  35. Yamashita, H.; Takenoshita, M.; Sakurai, M.; Bruick, R.K.; Henzel, W.J.; Shillinglaw, W.; Arnot, D.; Uyeda, K. A glucose-responsive transcription factor that regulates carbohydrate metabolism in the liver. Proc. Natl. Acad. Sci. USA 2001, 98, 9116–9121. [Google Scholar] [CrossRef] [PubMed] [Green Version]
  36. Stoeckman, A.K.; Towle, H.C. The role of SREBP-1c in nutritional regulation of lipogenic enzyme gene expression. J. Biol. Chem. 2002, 277, 27029–27035. [Google Scholar] [CrossRef] [PubMed] [Green Version]
  37. Foretz, M.; Guichard, C.; Ferré, P.; Foufelle, F. Sterol regulatory element binding protein-1c is a major mediator of insulin action on the hepatic expression of glucokinase and lipogenesis-related genes. Proc. Natl. Acad. Sci. USA 1999, 96, 12737–12742. [Google Scholar] [CrossRef] [PubMed] [Green Version]
  38. Smith, G.I.; Shankaran, M.; Yoshino, M.; Schweitzer, G.G.; Chondronikola, M.; Beals, J.W.; Okunade, A.L.; Patterson, B.W.; Nyangau, E.; Field, T.; et al. Insulin resistance drives hepatic de novo lipogenesis in nonalcoholic fatty liver disease. J. Clin. Invest 2020, 130, 1453–1460. [Google Scholar] [CrossRef] [PubMed]
  39. Kuchay, M.S.; Martínez-Montoro, J.I.; Choudhary, N.S.; Fernández-García, J.C.; Ramos-Molina, B. Non-Alcoholic Fatty Liver Disease in Lean and Non-Obese Individuals: Current and Future Challenges. Biomedicines 2021, 9, 1346. [Google Scholar] [CrossRef] [PubMed]
  40. Lanaspa, M.A.; Sanchez-Lozada, L.G.; Choi, Y.J.; Cicerchi, C.; Kanbay, M.; Roncal-Jimenez, C.A.; Ishimoto, T.; Li, N.; Marek, G.; Duranay, M.; et al. Uric acid induces hepatic steatosis by generation of mitochondrial oxidative stress: Potential role in fructose-dependent and -independent fatty liver. J. Biol. Chem. 2012, 287, 40732–40744. [Google Scholar] [CrossRef] [PubMed]
  41. Wan, X.; Xu, C.; Lin, Y.; Lu, C.; Li, D.; Sang, J.; He, H.; Liu, X.; Li, Y.; Yu, C. Uric acid regulates hepatic steatosis and insulin resistance through the NLRP3 inflammasome-dependent mechanism. J. Hepatol. 2016, 64, 925–932. [Google Scholar] [CrossRef] [PubMed]
  42. Shida, T.; Oshida, N.; Suzuki, H.; Okada, K.; Watahiki, T.; Oh, S.; Kim, T.; Isobe, T.; Okamoto, Y.; Ariizumi, S.I.; et al. Clinical and anthropometric characteristics of non-obese non-alcoholic fatty liver disease subjects in Japan. Hepatol. Res. 2020, 50, 1032–1046. [Google Scholar] [CrossRef] [PubMed]
  43. Tobari, M.; Hashimoto, E.; Taniai, M.; Ikarashi, Y.; Kodama, K.; Kogiso, T.; Tokushige, K.; Takayoshi, N.; Hashimoto, N. Characteristics of non-alcoholic steatohepatitis among lean patients in Japan: Not uncommon and not always benign. J. Gastroenterol. Hepatol. 2019, 34, 1404–1410. [Google Scholar] [CrossRef] [PubMed]
  44. Beyer, I.; Mets, T.; Bautmans, I. Chronic low-grade inflammation and age-related sarcopenia. Curr. Opin. Clin. Nutr. Metab. Care. 2012, 15, 12–22. [Google Scholar] [CrossRef]
  45. Abbatecola, A.M.; Paolisso, G.; Fattoretti, P.; Evans, W.J.; Fiore, V.; Dicioccio, L.; Lattanzio, F. Discovering pathways of sarcopenia in older adults: A role for insulin resistance on mitochondria dysfunction. J. Nutr. Health Aging. 2011, 15, 890–895. [Google Scholar] [CrossRef] [PubMed]
  46. Hong, H.C.; Hwang, S.Y.; Choi, H.Y.; Yoo, H.J.; Seo, J.A.; Kim, S.G.; Kim, N.H.; Baik, S.H.; Choi, D.S.; Choi, K.M. Relationship between sarcopenia and nonalcoholic fatty liver disease: The Korean Sarcopenic Obesity Study. Hepatology 2014, 59, 1772–1778. [Google Scholar] [CrossRef] [PubMed]
  47. Ciardullo, S.; Perseghin, G. Statin use is associated with lower prevalence of advanced liver fibrosis in patients with type 2 diabetes. Metabolism 2021, 121, 154752. [Google Scholar] [CrossRef] [PubMed]
Figure 1. The left abdominal image shows a normal liver without steatosis. The middle image shows mild steatosis in a liver. The right image shows moderate–severe steatosis in a liver.
Jpm 12 01958 g001
Figure 2. Flowchart of the study. A total of 17,935 individuals were initially collected at baseline, and 12,898 individuals were excluded due to incomplete data. The remaining 5037 subjects were randomly assigned to the training cohort (n = 4068) or validation cohort (n = 969) at a ratio of 8:2.
Jpm 12 01958 g002
Figure 3. ROC curve of the predictive model and in the training cohort (left) and validation cohort (right).
Jpm 12 01958 g003
Figure 4. Nomogram for predicting NAFLD in the lean Chinese population. Each variable for the individuals was scored by the top points scale, and then, the points for each variable were added. Finally, personalized risk of NAFLD was obtained according to the bottom total points scale. NAFLD, nonalcoholic fatty liver disease; ua, uric acid; alt, alanine aminotransferase; tchole, total cholesterol; h1c, hemoglobin A1c; ldl, low-density lipoprotein cholesterol.
Jpm 12 01958 g004
Figure 5. Calibration curve of the predictive model in the training cohort (left) and validation cohort (right). The X-axis represents the predicted risk of NAFLD in a lean population. The Y-axis represents the actual occurrence rate of NAFLD in a lean population.
Jpm 12 01958 g005
Figure 6. DCA of the predictive model in the training cohort (left) and validation cohort (right). The green line represents the net benefit if all patients receive treatment. The red line represents a net benefit of 0 if all patients do not receive treatment. The red solid curve above the green and blue lines represents the added net benefit if the model is used compared with either the treat-all or treat-none strategies.
Jpm 12 01958 g006
Table 1. The clinical characteristics of the study population.
Variables Training Dataset (n = 4068)Validation Dataset (n = 969)
GroupNon-NAFLDNAFLDp-ValueNon-NAFLDNAFLDp-Value
Sex (%)Male2714 (71.2)104 (40.3)<0.001632 (70.0)33 (50.0)<0.001
Female1096 (28.8)154 (59.7) 271 (30.0)33 (50.0)
Age (Years) (mean (SD)) 40.00 (13.00)48.00 (13.00)<0.00140.00 (12.00)48.00 (13.00)<0.001
SBP (mmHg) (mean (SD)) 119.00 (16.00)128.00 (19.00)<0.001119.00 (16.00)126.00 (14.00)<0.001
DBP (mmHg) (mean (SD)) 72.00 (10.00)77.00 (10.00)<0.00172.00 (10.00)77.00 (8.00)<0.001
Urea (mmol/L) (mean (SD)) 4.80 (1.31)5.01 (1.19)0.0124.79 (1.24)4.88 (1.11)<0.001
Cr (mmol/L) (mean (SD)) 59.17 (17.05)63.68 (14.08)<0.00159.05 (20.90)62.00 (12.03)<0.001
UA (mmol/L) (mean (SD)) 300.40 (71.74)366.35 (76.41)<0.001299.82 (71.51)347.69 (72.24)<0.001
TP (g/L) (mean (SD)) 72.26 (3.57)73.48 (3.64)<0.00172.40 (3.55)73.68 (3.56)0.003
Albumin (g/L) (mean (SD)) 45.16 (2.39)45.55 (2.59)0.01245.26 (2.46)45.59 (2.25)0.279
TB (μmol/L) (mean (SD)) 15.17 (5.76)15.08 (5.28)0.81115.11 (5.86)14.10 (5.26)0.151
DiB (μmol/L) (mean (SD)) 4.26 (1.72)4.15 (1.60)0.2964.24 (1.77)3.75 (1.38)0.02
IndiB (μmol/L) (mean (SD)) 10.90 (4.22)10.93 (3.90)0.92110.87 (4.33)10.35 (4.03)0.32
ALT (U/L) (mean (SD)) 14.53 (9.58)26.10 (20.39)<0.00115.24 (23.46)24.13 (12.06)0.001
AST (U/L) (mean (SD)) 19.17 (6.12)22.62 (8.58)<0.00119.49 (13.06)21.28 (5.59)0.247
GGT (U/L) (mean (SD)) 16.46 (17.28)35.15 (52.91)<0.00117.45 (34.62)34.63 (24.76)<0.001
ALP (U/L) (mean (SD)) 56.87 (18.01)69.51 (19.55)<0.00157.07 (19.94)68.12 (16.70)<0.001
TCh (mmol/L) (mean (SD)) 4.75 (0.84)5.01 (0.88)<0.0014.77 (0.87)5.03 (0.89)0.017
TG (mmol/L) (mean (SD)) 1.03 (0.57)1.91 (1.28)<0.0011.04 (0.54)1.93 (0.88)<0.001
HDL (mmol/L) (mean (SD)) 1.52 (0.35)1.23 (0.28)<0.0011.50 (0.35)1.24 (0.26)<0.001
LDL (mmol/L) (mean (SD)) 2.74 (0.76)3.08 (0.81)<0.0012.78 (0.78)3.10 (0.82)0.001
WBC (×109/L) (mean (SD)) 5.72 (1.37)6.36 (1.50)<0.0015.73 (1.38)6.53 (1.27)<0.001
RBC (×109/L) (mean (SD)) 4.57 (0.44)4.86 (0.46)<0.0014.56 (0.44)4.93 (0.45)<0.001
PLT (×109/L) (mean (SD)) 231.55 (55.65)241.08 (61.24)0.009233.15 (53.29)240.47 (61.14)0.262
L (×109/L) (mean (SD)) 1.98 (0.54)2.12 (0.63)<0.0012.00 (0.56)2.22 (0.53)0.002
M (×109/L) (mean (SD)) 0.38 (0.12)0.43 (0.13)<0.0010.38 (0.12)0.43 (0.13)0.002
N (×109/L) (mean (SD)) 3.20 (1.04)3.62 (1.14)<0.0013.19 (1.06)3.69 (0.97)<0.001
glucose (mmol/L) (mean (SD)) 5.04 (0.69)5.74 (1.66)<0.0015.04 (0.68)5.62 (1.32)<0.001
HbA1C (mg/dL) (mean (SD)) 5.58 (0.47)6.04 (0.91)<0.0015.58 (0.48)5.99 (0.67)<0.001
ALP, alkaline phosphatase; DBP, diastolic blood pressure; DiB, direct bilirubin; GGT, gamma-glutamyl transferase; HbA1C, hemoglobin HbA1c; HDL, high-density lipoprotein; IndiB, indirect bilirublin; L, lymphocyte; LDL, low-density lipoprotein; M, monocytes; N, neutrophil; SBP, systolic blood pressure; TB, total bilirublin; TCh, total cholesterol; TG, total triglycerides; TP, total protein.
Table 2. The results of the logistic regression analysis for NAFLD in lean individuals.
VariablesUnivariate AnalysisMultivariate Analysis
OR [95% CI]p ValueOR [95% CI]p Value
Age (Years)1.037 [1.029, 1.044]<0.0011.039 [1.025, 1.052]0.000
Sex (male vs. female)3.341 [2.659, 4.208]<0.001
SBP (mmHg)1.028 [1.022, 1.034]<0.0010.999 [.0987, 1.011]0.852
DBP (mmHg)1.050 [1.038, 1.060]<0.0011.013 [.0995, 1.031]0.164
Urea (mmol/L)1.097 [1.017, 1.178]<0.0010.911 [0.807, 1.029]0.134
Cr (mmol/L)1.006 [1.002, 1.011]<0.0010.975 [0.962, 0.988]0.000
UA (mmol/L)1.010 [1.008, 1.011]<0.0011.007 [1.004, 1.009]0.000
TP (g/L)1.099 [1.065, 1.134]<0.0011.025 [0.980, 1.073]0.281
Albumin (g/L)1.067 [1.018, 1,118]<0.0011.049 [0.977, 1.127]0.187
DiB (μmol/L)0.929 [0.864, 0.996]<0.0010.994 [0.907, 1.089]0.902
ALT (U/L)1.037 [1.030, 1.045]<0.0011.056 [1.038, 1.074]0.000
AST (U/L)1.032 [1.018, 1.046]<0.0010.923 [0.895, 0.951]0.000
GGT (U/L)1.019 [1.015, 1.023]<0.0011.003 [0.997, 1.009]0.341
ALP (U/L)1.025 [1.020, 1.030]<0.0011.004 [0.998, 1.011]0.214
TCh (mmol/L)1.376 [1.219, 1.549]<0.0010.309 [0.175, 0.545]0.000
TG (mmol/L)3.413 [2.963, 3.946]<0.0012.670 [2.027, 3.516]0.000
HDL (mmol/L)0.043 [0.028, 0.068]<0.0010.774 [0.344, 1.739]0.535
LDL (mmol/L)1.632 [1.435, 1.854]<0.0013.484 [2.051, 5.918]0.000
WBC (×109/L)1.357 [1.263, 1.458]<0.0010.005 [0.000, 16.971]0.199
RBC (×109/L)4.108 [3.242, 5.214]<0.0011.821 [1.163, 2.849]0.009
PLT (×109/L)1.003 [1.001, 1.004]<0.0011.004 [1.002, 1.007]0.000
L (×109/L)1.579 [1.316, 1.891]<0.00123.829 [0.062, 92.046]0.194
M (×109/L)14.358 [6.467, 41.533]<0.00112.613 [0.028, 56.740]0.260
N (×109/L)1.396 [1.273, 1.527]<0.00123.973 [0.063, 91,755]0.193
glucose (mmol/L)1.786 [1.611, 1.986]<0.0011.067 [0.890, 1.279]0.484
HbA1C (mg/dL)2.477 [2.110, 2.927]<0.0011.428 [1.096, 1.861]0.008
TB (μmol/L)0.991 [0.970, 1.010]0.373--
IndiB (μmol/L)0.995 [0.967, 1.021]0.700--
ALP, alkaline phosphatase; DBP, diastolic blood pressure; DiB, direct bilirubin; GGT, gamma-glutamyl transferase; HbA1C, hemoglobin HbA1c; HDL, high-density lipoprotein; IndiB, indirect bilirublin; L, lymphocyte; LDL, low-density lipoprotein; M, monocytes; N, neutrophil; SBP, systolic blood pressure; TB, total bilirublin; TCh, total cholesterol; TG, total triglycerides; TP, total protein.
Publisher’s Note: MDPI stays neutral with regard to jurisdictional claims in published maps and institutional affiliations.

