

Development and Validation of Machine Learning Models to Classify Artery Stenosis for Automated Generating Ultrasound Report
 ,
,  ,
,  and
and
Abstract
:1. Introduction
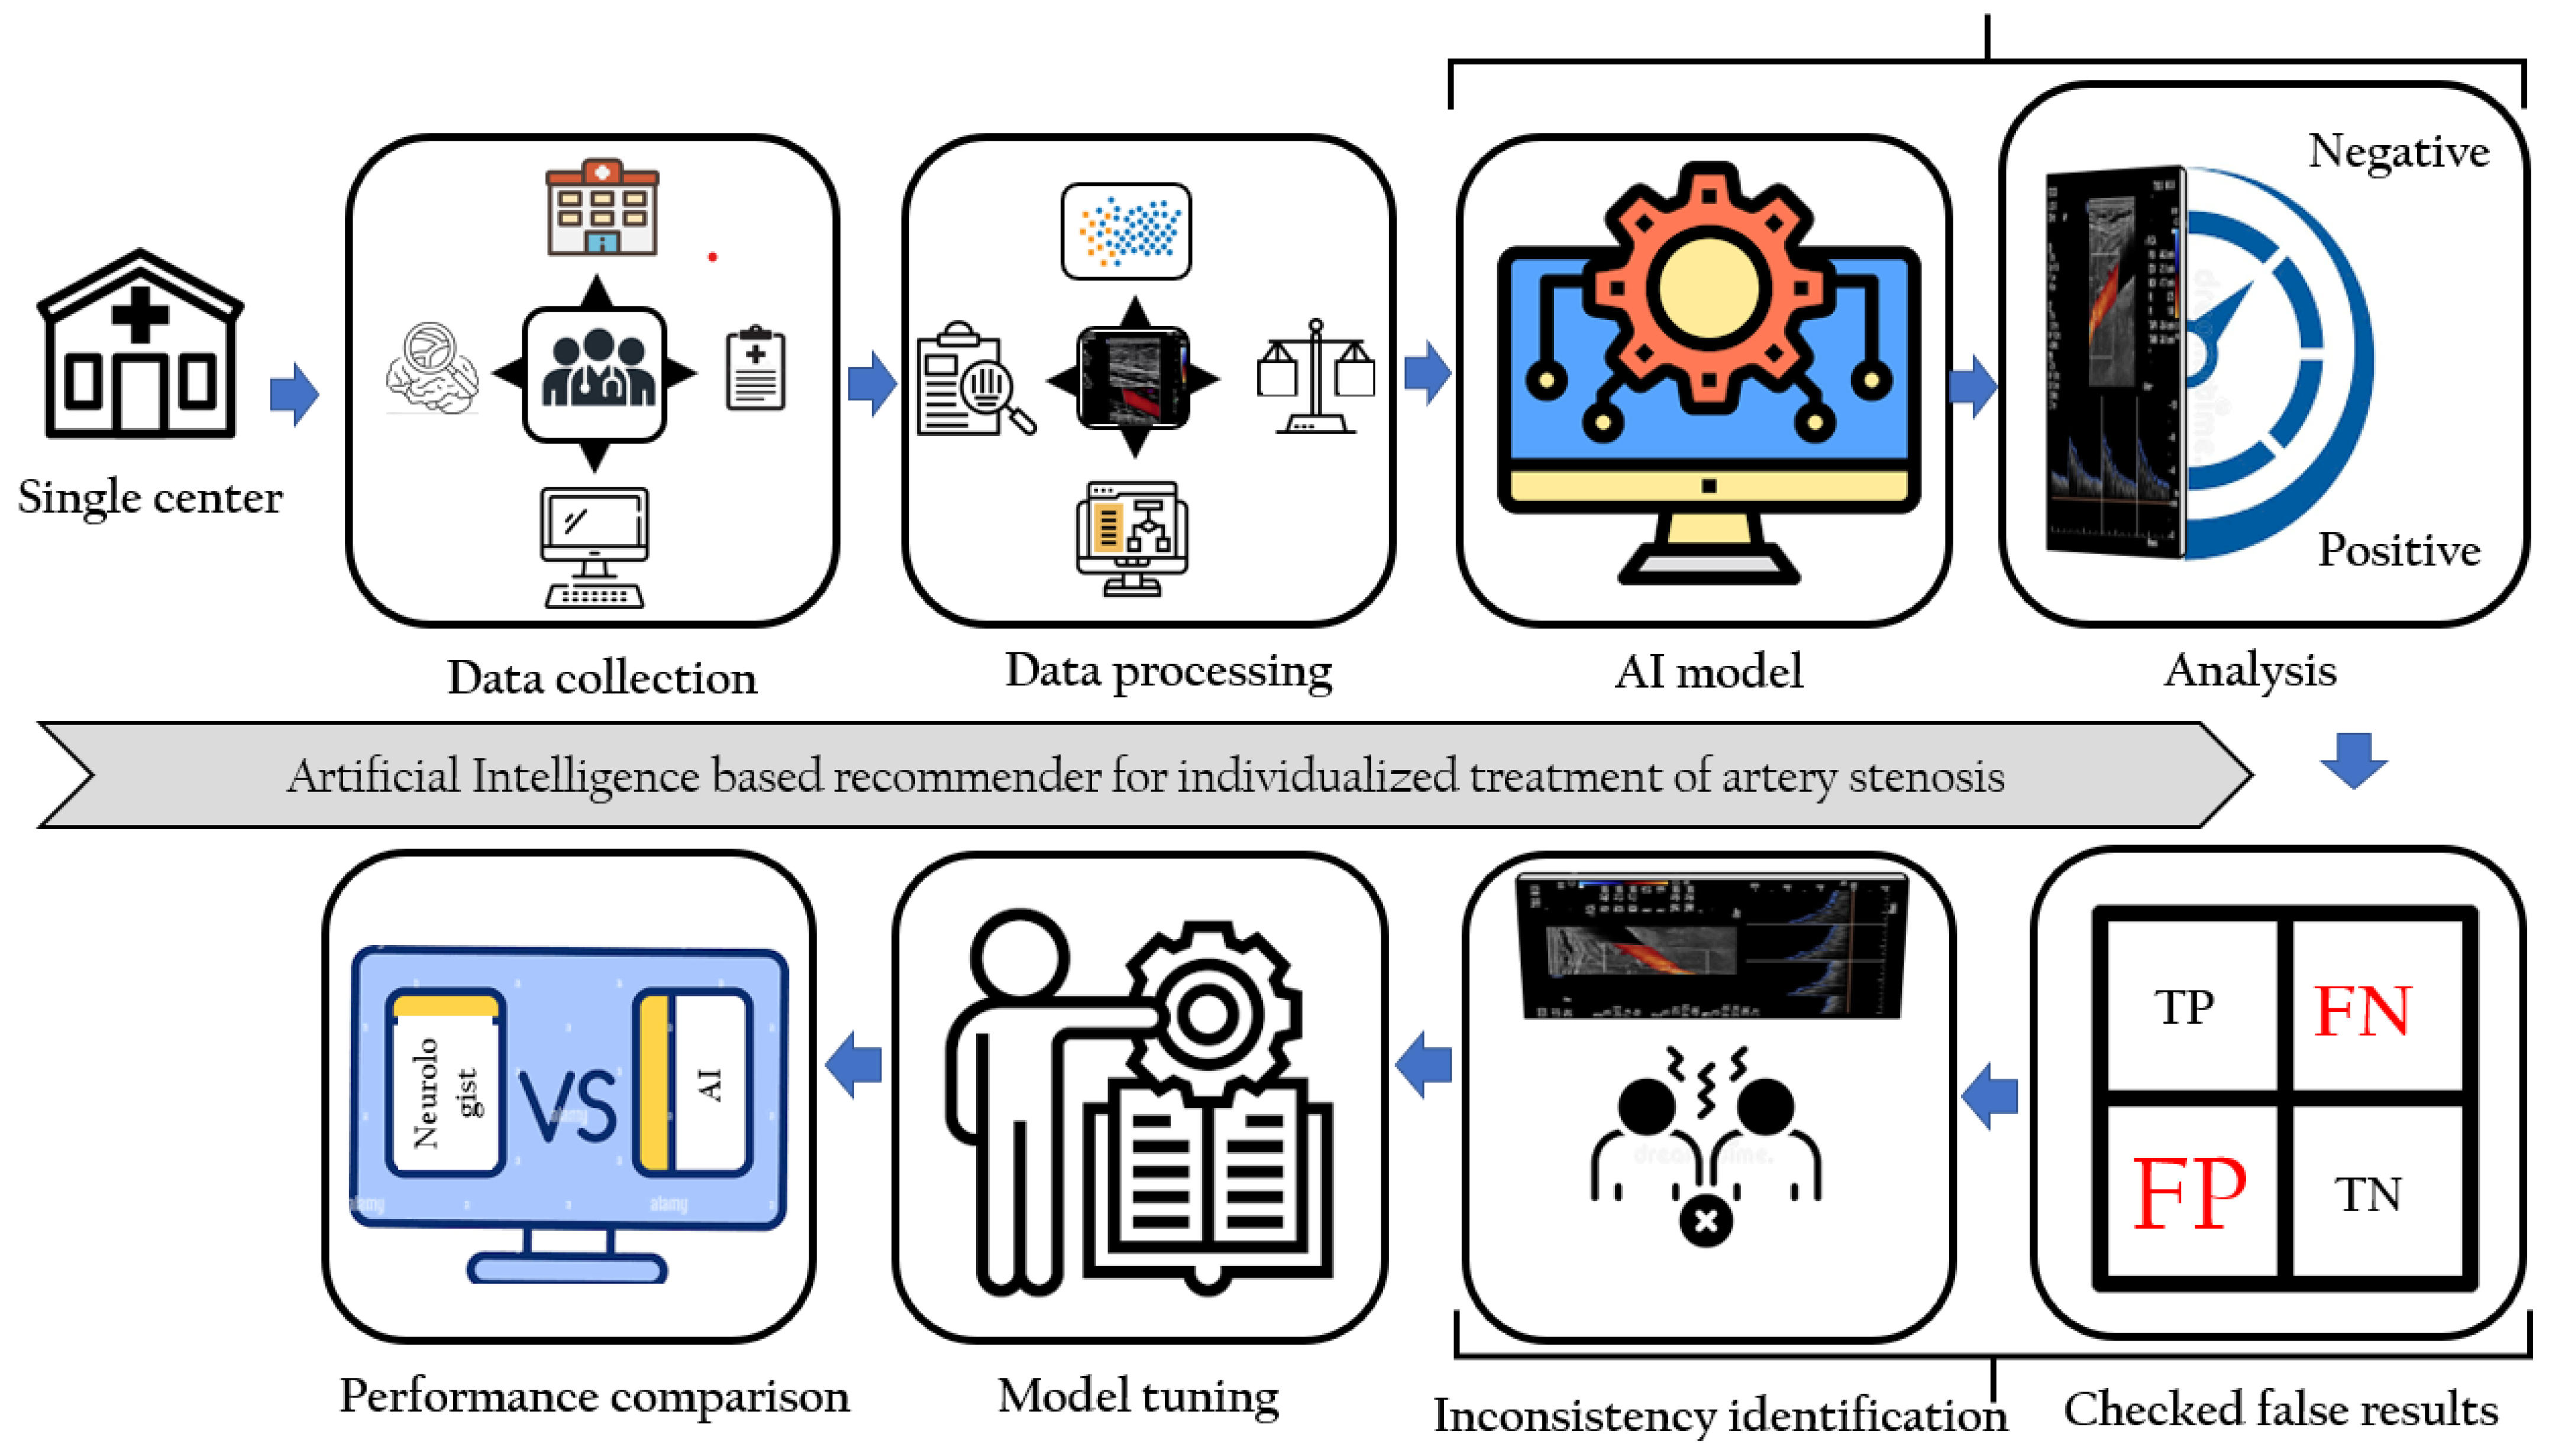
2. Methods
2.1. Data Collection
2.2. Variables Collection
2.3. Handling Imbalanced Dataset
2.4. Statistical Analysis
3. Results
3.1. Patient Selection
3.2. Patient Distribution
3.3. Important Predictors of ECCD
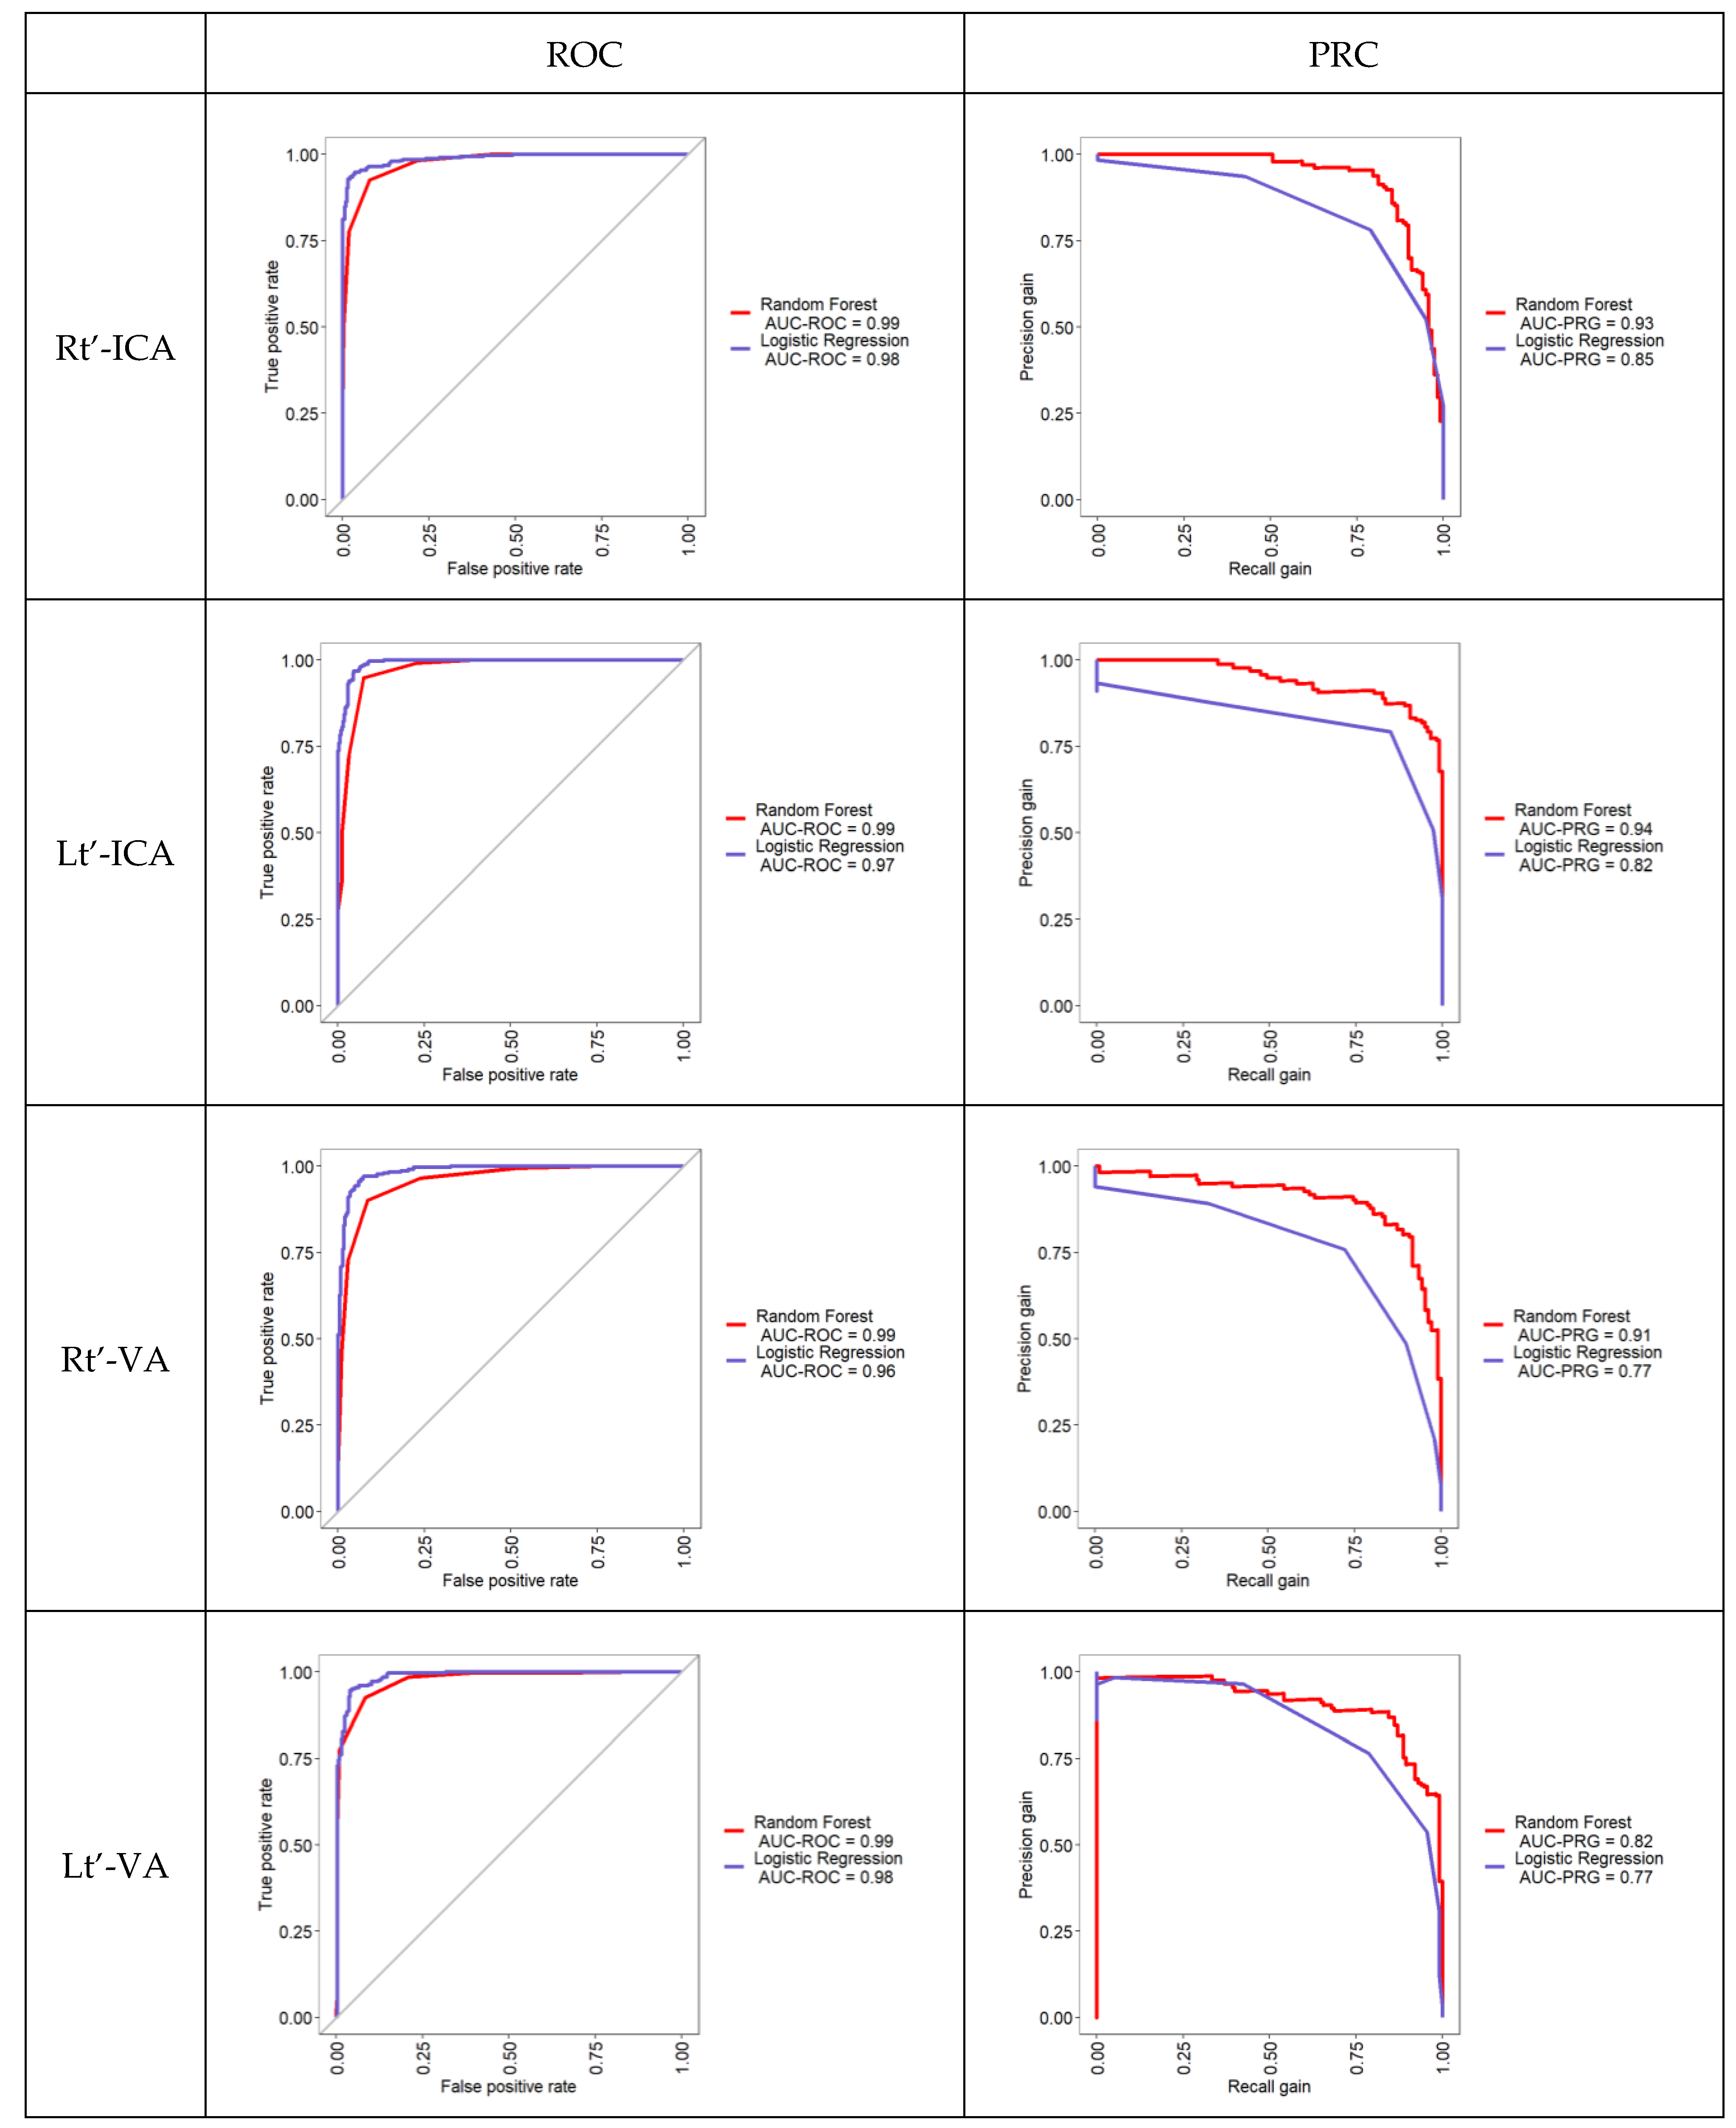
3.4. Performance of Machine Learning Models to Predict Stenosis in ECCD
3.5. Important Predictors of TCD
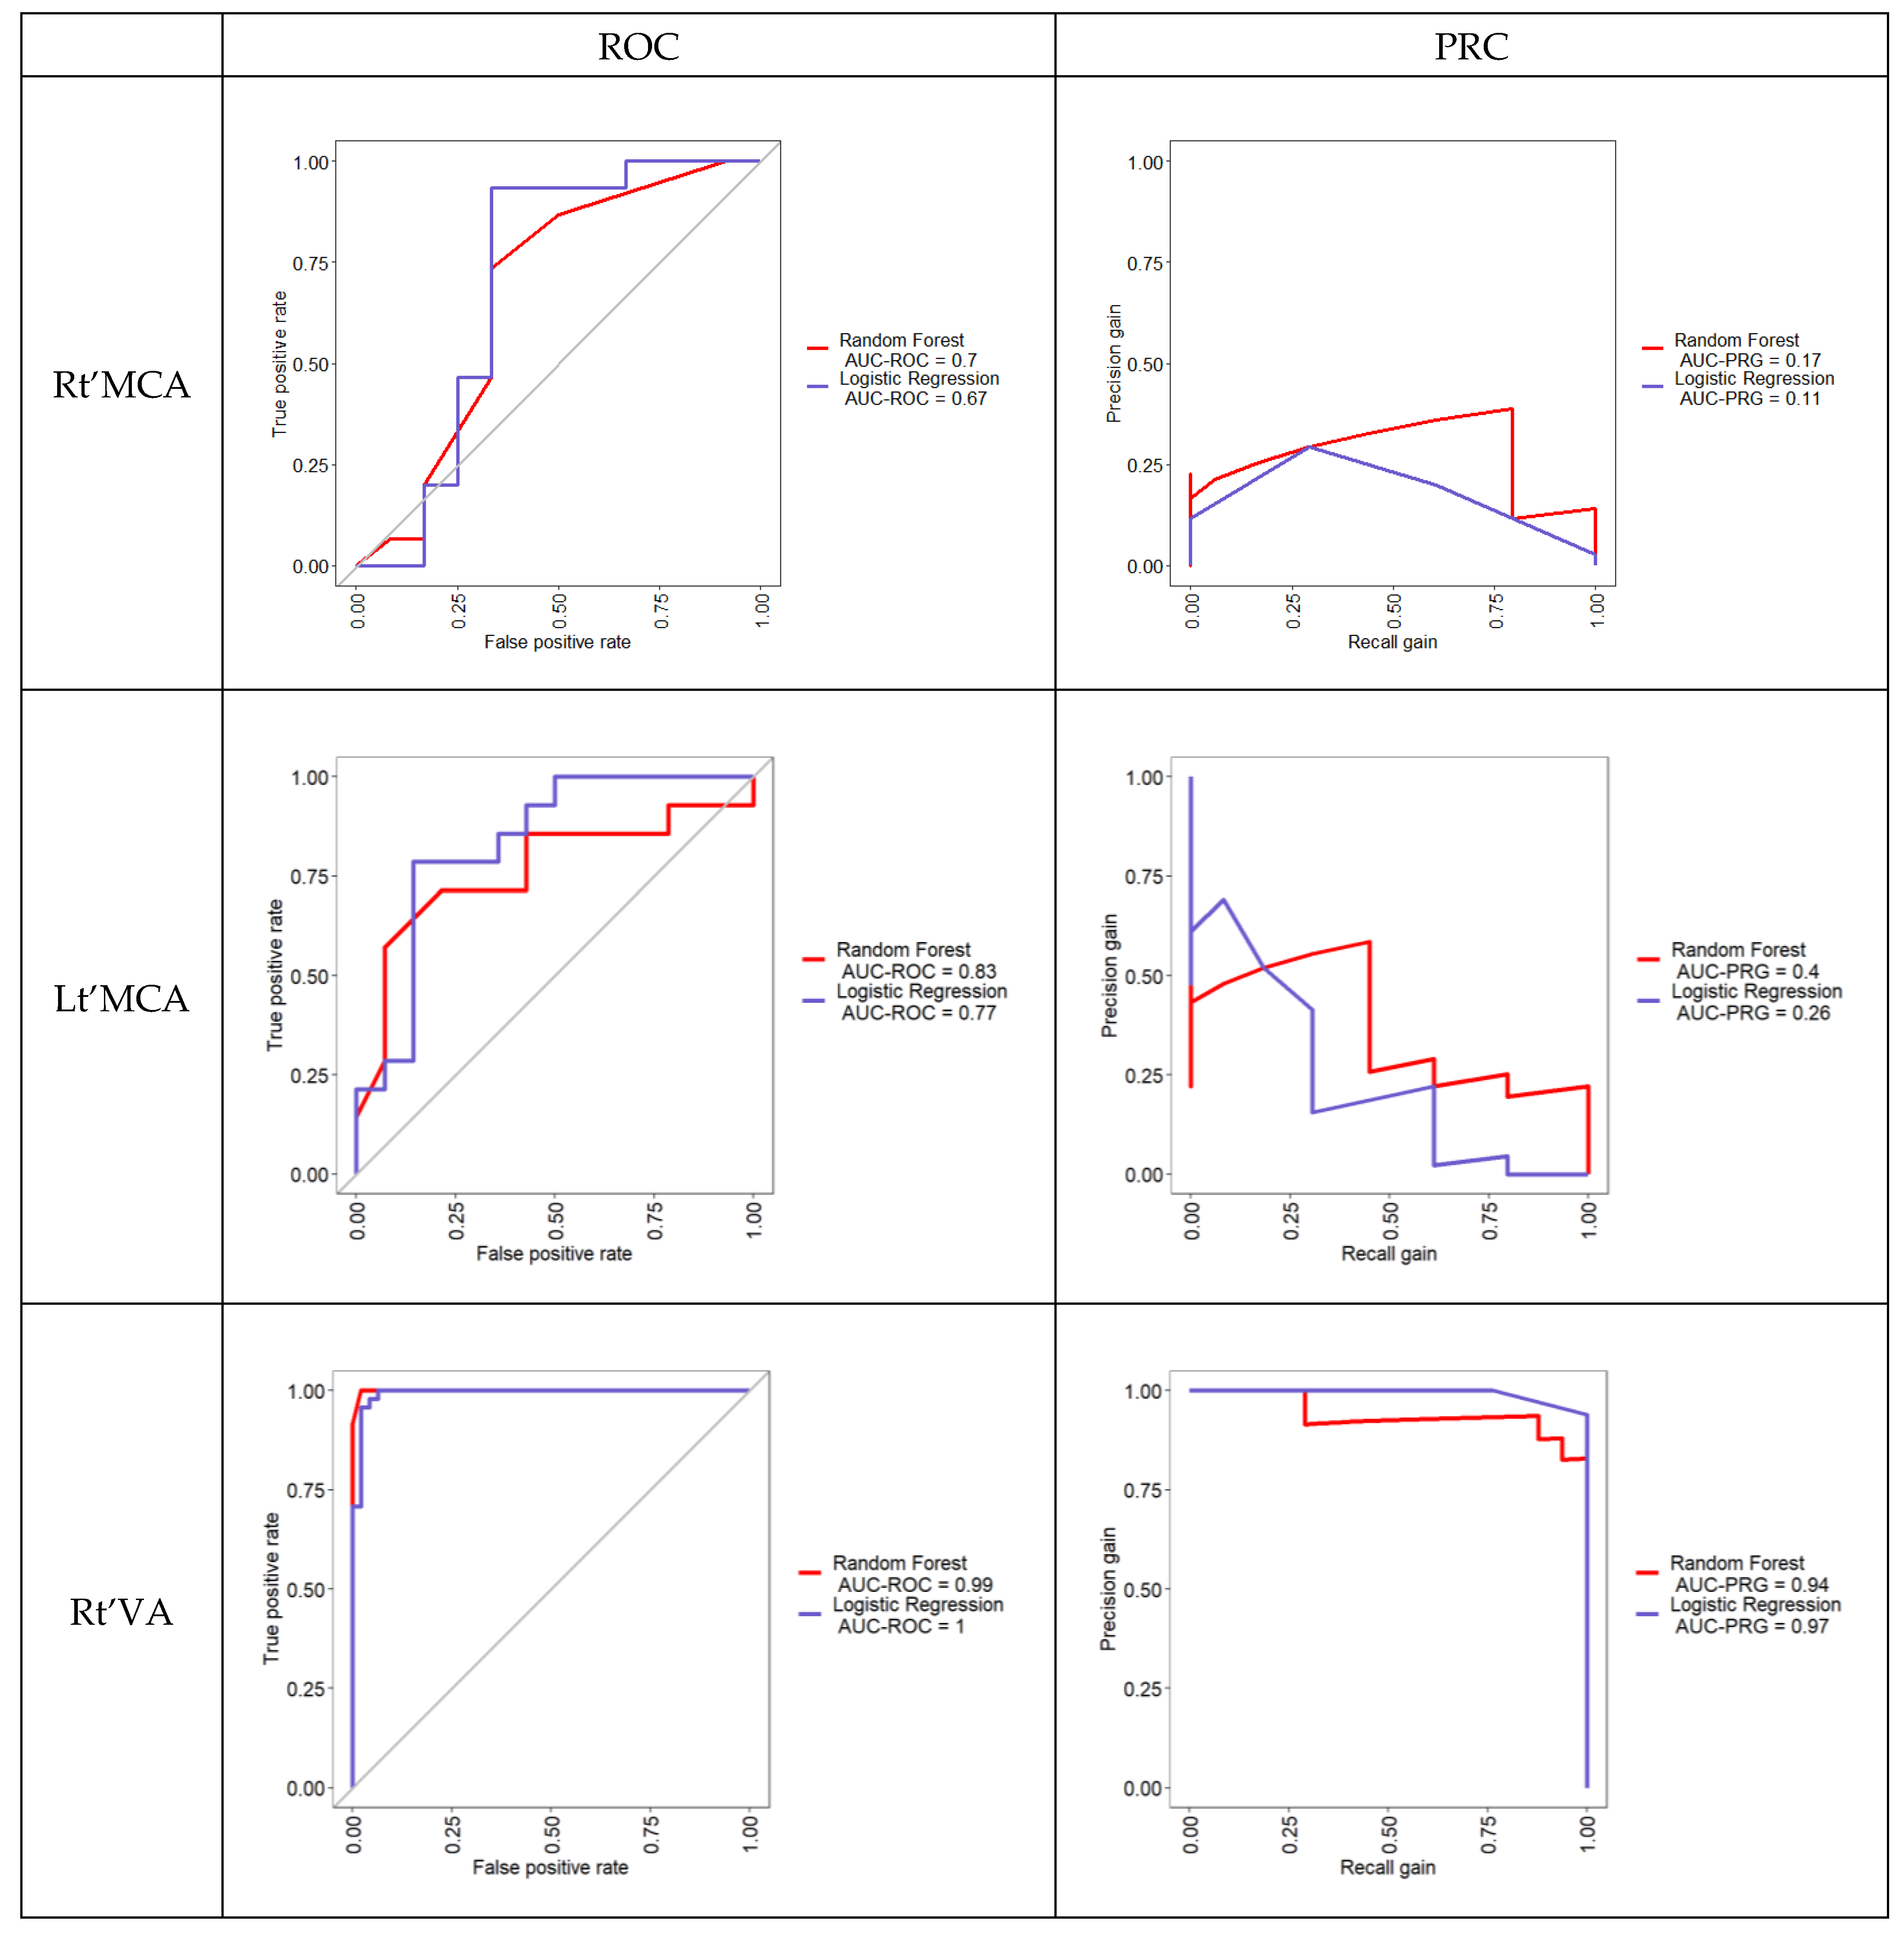
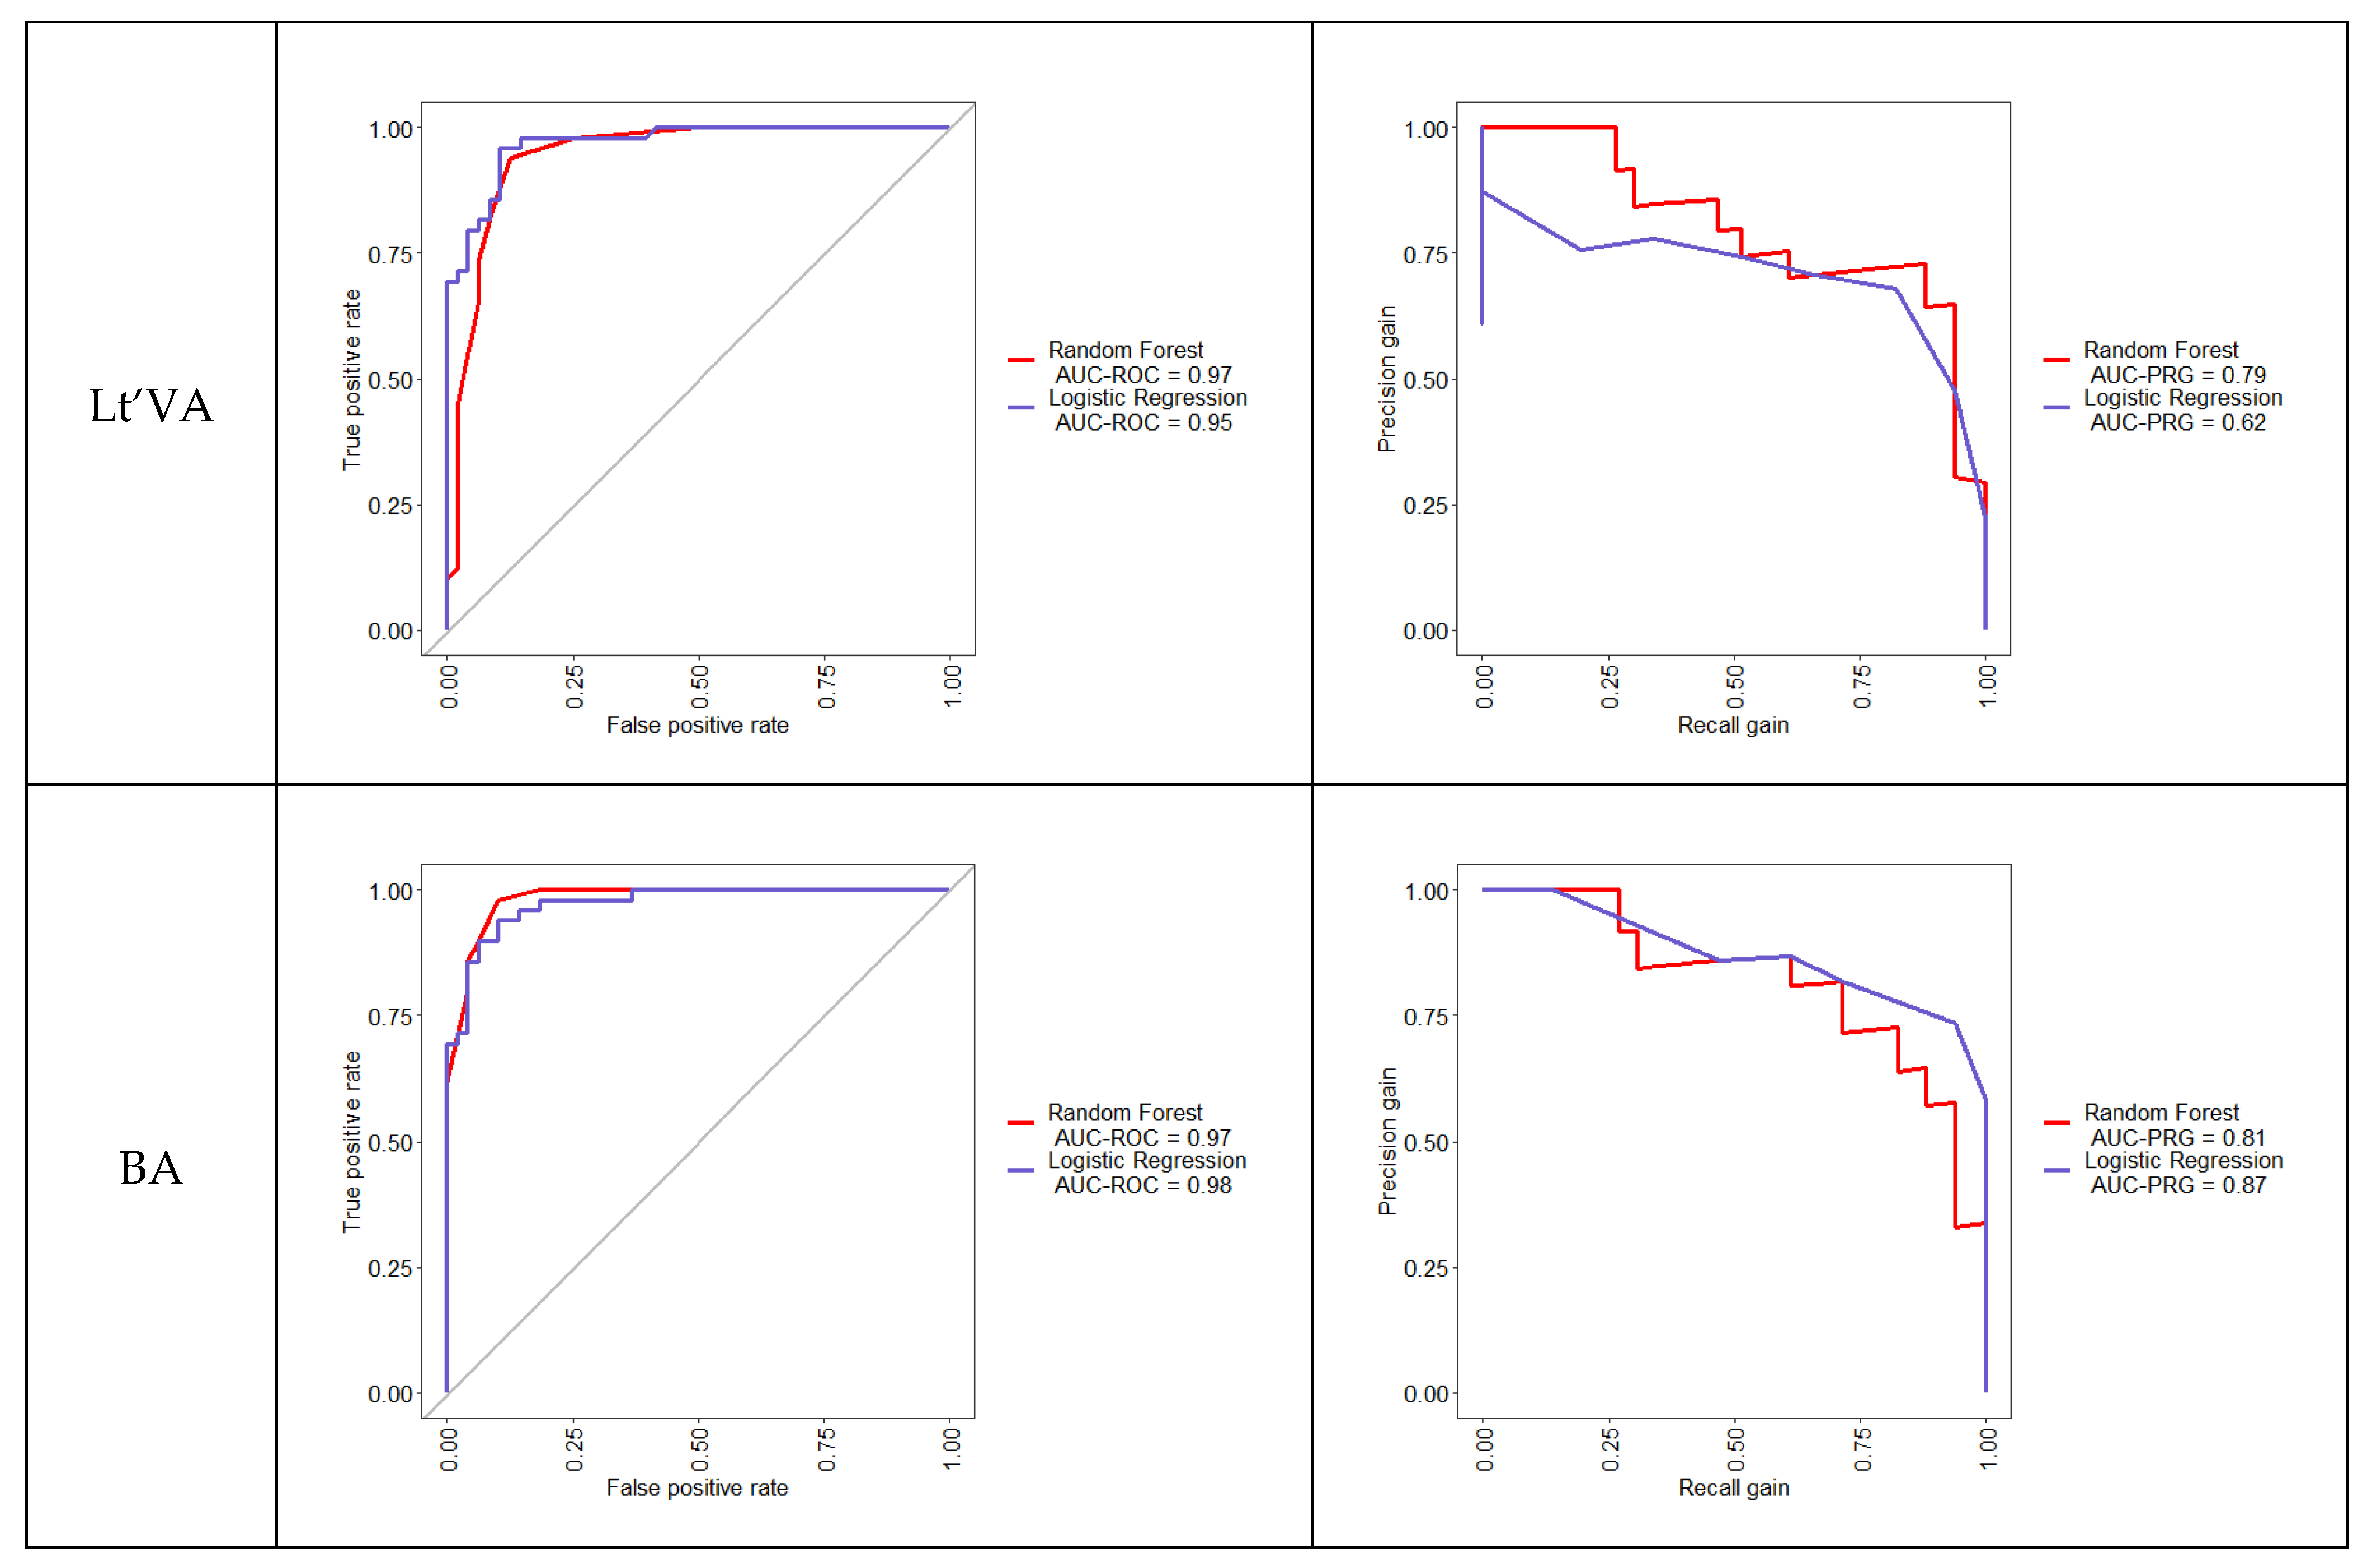
3.6. Performance of AI Models to Predict Stenosis in TCD
3.7. Manual Evaluation of Inconsistency
4. Discussion
Limitation
5. Conclusions
Author Contributions
Funding
Institutional Review Board Statement
Informed Consent Statement
Data Availability Statement
Conflicts of Interest
References
- Lindsay, M.P.; Norrving, B.; Sacco, R.L.; Brainin, M.; Hacke, W.; Martins, S.; Pandian, J.; Feigin, V. World Stroke Organization (WSO): Global Stroke Fact Sheet 2019. Int. J. Stroke 2019, 14, 806–817. [Google Scholar] [CrossRef] [PubMed]
- Fonseca, A.C.; Merwick, A.; Dennis, M.; Ferrari, J.; Ferro, J.M.; Kelly, P.; Lal, A.; Ois, A.; Olivot, J.M.; Purroy, F. European Stroke Organisation (ESO) guidelines on management of transient ischaemic attack. Eur. Stroke J. 2021, 6, CLXIII–CLXXXVI. [Google Scholar] [CrossRef] [PubMed]
- Siket, M.S.; Edlow, J. Transient ischemic attack: An evidence-based update. Emerg. Med. Pract. 2012, 15, 1–26. [Google Scholar] [PubMed]
- Rothwell, P.M.; Warlow, C.P. Timing of TIAs preceding stroke: Time window for prevention is very short. Neurology 2005, 64, 817–820. [Google Scholar] [CrossRef] [PubMed]
- Hankey, G.J.; Warlow, C.P. Treatment and secondary prevention of stroke: Evidence, costs, and effects on individuals and populations. Lancet 1999, 354, 1457–1463. [Google Scholar] [CrossRef]
- Coutts, S.B. Diagnosis and management of transient ischemic attack. Contin. Lifelong Learn. Neurol. 2017, 23, 82. [Google Scholar] [CrossRef]
- Jump, M.A.; Spalding, M.C.; Jenkins, J.; Franz, R.W. Accuracy of Duplex Ultrasonography in Estimation of Severity of Peripheral Vascular Disease. Int. J. Angiol. 2013, 22, 155–158. [Google Scholar] [CrossRef] [Green Version]
- Gilliland, T.J.; Gensollen, V. Review of the protocols used for assessment of DUS and VCU in Europe–Perspectives. In Sustainable Use of Genetic Diversity in Forage and Turf Breeding; Springer: Berlin/Heidelberg, Germany, 2010; pp. 261–275. [Google Scholar]
- Kording, F.; Yamamura, J.; De Sousa, M.T.; Ruprecht, C.; Hedström, E.; Aletras, A.H.; Grant, P.E.; Powell, A.J.; Fehrs, K.; Adam, G.; et al. Dynamic fetal cardiovascular magnetic resonance imaging using Doppler ultrasound gating. J. Cardiovasc. Magn. Reson. 2018, 20, 1–10. [Google Scholar] [CrossRef]
- Murray, C.S.G.; Nahar, T.; Kalashyan, H.; Becher, H.; Nanda, N.C. Ultrasound assessment of carotid arteries: Current concepts, methodologies, diagnostic criteria, and technological advancements. Echocardiography 2018, 35, 2079–2091. [Google Scholar] [CrossRef]
- Winzer, S.; Rickmann, H.; Kitzler, H.; Abramyuk, A.; Krogias, C.; Strohm, H.; Barlinn, J.; Pallesen, L.-P.; Siepmann, T.; Arnold, S.; et al. Ultrasonography Grading of Internal Carotid Artery Disease: Multiparametric German Society of Ultrasound in Medicine (DEGUM) versus Society of Radiologists in Ultrasound (SRU) Consensus Criteria. Ultraschall Med. Eur. J. Ultrasound 2021. [Google Scholar] [CrossRef]
- Alexandrov, A.V.; Sloan, M.A.; Wong, K.S.L.; Douville, C.; Razumovsky, A.Y.; Koroshetz, W.J.; Kaps, M.; Tegeler, C.H.; for the American Society of Neuroimaging Practice Guidelines Committee. Practice Standards for Transcranial Doppler Ultrasound: Part I-Test Performance. J. Neuroimaging 2007, 17, 11–18. [Google Scholar] [CrossRef] [PubMed]
- Sharma, V.; Tsivgoulis, G.; Lao, A.Y.; Malkoff, M.D.; Alexandrov, A.V. Noninvasive Detection of Diffuse Intracranial Disease. Stroke 2007, 38, 3175–3181. [Google Scholar] [CrossRef] [PubMed] [Green Version]
- Grant, E.G.; Benson, C.B.; Moneta, G.L.; Alexandrov, A.V.; Baker, J.D.; Bluth, E.I.; Carroll, B.A.; Eliasziw, M.; Gocke, J.; Hertzberg, B.S.; et al. Carotid Artery Stenosis: Gray-Scale and Doppler US Diagnosis—Society of Radiologists in Ultrasound Consensus Conference. Radiology 2003, 229, 340–346. [Google Scholar] [CrossRef] [PubMed]
- Sutton, R.T.; Pincock, D.; Baumgart, D.C.; Sadowski, D.C.; Fedorak, R.N.; Kroeker, K.I. An overview of clinical decision support systems: Benefits, risks, and strategies for success. NPJ Digit. Med. 2020, 3, 17. [Google Scholar] [CrossRef] [PubMed] [Green Version]
- Rodziewicz, T.L.; Houseman, B.; Hipskind, J.E. Medical Error Reduction and Prevention; StatPearls: Tampa, FL, USA, 2022. [Google Scholar]
- Lee, E.-J.; Kim, Y.-H.; Kim, N.; Kang, D.-W. Deep into the Brain: Artificial Intelligence in Stroke Imaging. J. Stroke 2017, 19, 277–285. [Google Scholar] [CrossRef] [PubMed] [Green Version]
- Mouridsen, K.; Thurner, P.; Zaharchuk, G. Artificial Intelligence Applications in Stroke. Stroke 2020, 51, 2573–2579. [Google Scholar] [CrossRef]
- Valdueza, J.M.; Schreiber, S.J.; Roehl, J.-E.; Conolly, F.; Klingebiel, R. Neurosonology and Neuroimaging of Stroke. Aktuel Neurol. 2017, 44, 346–347. [Google Scholar] [CrossRef]
- Csiba, L.; Baracchini, C. Manual of Neurosonology; Cambridge University Press: Cambridge, UK, 2016. [Google Scholar]
- Chawla, N.V.; Bowyer, K.W.; Hall, L.O.; Kegelmeyer, W.P. SMOTE: Synthetic minority over-sampling technique. J. Artif. Intell. Res. 2002, 16, 321–357. [Google Scholar] [CrossRef]
- Yazici, B.; Erdoğmuş, B.; Tugay, A. Cerebral blood flow measurements of the extracranial carotid and vertebral arteries with Doppler ultrasonography in healthy adults. Diagn. Interv. Radiol. 2005, 11, 195–198. [Google Scholar]
- Santos, T.; Veloso, M.; Barros, P. Neurovascular ultrasound in emergency settings: Diagnostic and therapeutic aspects. J. Neurol. Disord. Stroke 2017, 64, 1100. [Google Scholar]
- Pan, Y.; Wan, W.; Xiang, M.; Guan, Y. Transcranial Doppler Ultrasonography as a Diagnostic Tool for Cerebrovascular Disorders. Front. Hum. Neurosci. 2022, 16, 841809. [Google Scholar] [CrossRef] [PubMed]
- Kang, M.K.; Nam, K.-W.; Shin, J.H.; Kwon, H.-M.; Lee, Y.-S. Cardiovascular risk scores in asymptomatic carotid stenosis: A validation study with ultrasonographic parameters. PLoS ONE 2022, 17, e0265732. [Google Scholar] [CrossRef]
- Kim, A.H.; Augustin, G.; Shevitz, A.; Kim, H.; Trivonovich, M.R.; Powell, A.R.; Kumins, N.; Tarr, R.; Kashyap, V.S. Carotid Consensus Panel duplex criteria can replace modified University of Washington criteria without affecting accuracy. Vasc. Med. 2018, 23, 126–133. [Google Scholar] [CrossRef] [PubMed] [Green Version]
- Bai, C.H.; Chen, J.R.; Chiu, H.C.; Pan, W.H. Lower blood flow velocity, higher resistance index, and larger diameter of extracranial carotid arteries are associated with ischemic stroke independently of carotid atherosclerosis and cardiovascular risk factors. J. Clin. Ultrasound 2007, 35, 322–330. [Google Scholar] [CrossRef]
- Makwana, M.B.; Mistri, A.; Patel, V.J. Physiological assessment of common carotid artery resistive index to evaluate different risk factors for the development of cerebrovascular stroke. Int. J. Basic Appl. Physiol. 2017, 6, 60–66. [Google Scholar]
- Welch, H.J.; Murphy, M.C.; Raftery, K.B.; Jewell, E.R. Carotid Duplex with Contralateral Disease: The Influence of Vertebral Artery Blood Flow. Ann. Vasc. Surg. 2000, 14, 82–88. [Google Scholar] [CrossRef]
- Kwater, A.; Gąsowski, J.; Gryglewska, B.; Wizner, B.; Grodzicki, T. Is blood flow in the middle cerebral artery determined by systemic arterial stiffness? Blood Press. 2009, 18, 130–134. [Google Scholar] [CrossRef] [PubMed]
- Intersocietal Accreditation Commission. IAC Standards and Guidelines for Vascular Testing Accreditation. 2019. Available online: https://www.intersocietal.org/vascular/standards/IACVascularTestingStandards2019.pdf (accessed on 15 May 2022).


| Item | Root Cause | ECCD | TCD | Total |
|---|---|---|---|---|
| 1 | Incomplete report | 2 | 0 | 2 |
| 2 | Misplacement of category | 13 | 1 | 14 |
| 3 | Detect values are different with report comments | 5 | 0 | 5 |
| Total | 20 | 1 | 21 | |
| Characteristics | Female (n = 228) | Male (n = 235) |
|---|---|---|
| Age (mean ± SD, range, yrs.) | 63.0 ± 14.5 (18–96) | 63.9 ± 14.1 (19–99) |
| Site of evaluation (no. of patients (%)) | ||
| Rt’-ICA | 227 (99.6) | 232 (98.7) |
| Lt’-ICA | 227 (99.6) | 232 (98.7) |
| Rt’-VA | 228 (100.0) | 230 (97.9) |
| Lt’-VA | 227 (99.6) | 231 (98.3) |
| VA Total Flow | 228 (100.0) | 227 (96.6) |
| Aberrant hemodynamics (no. of patients (%)) | ||
| Rt’-ICA | 3 (1.3) | 10 (4.3) |
| Lt’-ICA | 2 (0.9) | 13 (5.5) |
| Rt’-VA | 10 (4.4) | 22 (9.4) |
| Lt’-VA | 9 (3.9) | 12 (5.1) |
| VA Total Flow | 26 (11.4) | 36 (15.3) |
| Characteristics | Female (n = 42) | Male (n = 33) |
|---|---|---|
| Age (mean ± SD, range, yr.) | 64.7 ± 13.3 (39–96) | 69.7 ± 13.9 (39–95) |
| Site of evaluation (no. of patients (%)) | ||
| Rt’-MCA | 12 (28.6) | 22 (66.7) |
| Lt’-MCA | 10 (23.8) | 22 (66.7) |
| Rt’-VA | 42 (100.0) | 33 (100.0) |
| Lt’-VA | 42 (100.0) | 33 (100.0) |
| BA | 42 (100.0) | 32 (97.0) |
| Aberrant hemodynamics (no. of patients (%)) | ||
| Rt’-MCA | 4 (33.3) | 12 (54.5) |
| Lt’-MCA | 3 (30.0) | 12 (54.5) |
| Rt’-VA | 7 (16.7) | 8 (24.2) |
| Lt’-VA | 6 (14.3) | 3 (9.1) |
| BA | 5 (11.9) | 4 (12.5) |
| Random Forest | Predictors | Mean Decrease Gini |
|---|---|---|
| Rt’-ICA | Gender | 13.44 |
| Age | 80.74 | |
| PSV | 77.85 | |
| RI | 49.57 | |
| Lt’-ICA | Gender | 3.12 |
| Age | 61.84 | |
| PSV | 86.56 | |
| RI | 69.23 | |
| Rt’-VA | Gender | 1.44 |
| Age | 35.16 | |
| Diameter | 30.17 | |
| RI | 60.02 | |
| Flow rate | 75.95 | |
| Lt’-VA | Gender | 1.15 |
| Age | 30.28 | |
| Diameter | 30.04 | |
| RI | 89.89 | |
| Flow rate | 60.92 | |
| Total VA | Gender | 0.55 |
| Age | 8.21 | |
| Rt’-diameter | 18.95 | |
| Rt’-RI | 7.52 | |
| Lt’-diameter | 12.30 | |
| Lt’-RI | 10.53 | |
| Total Flow rate | 114.22 |
| Specific Side/Artery | Model Performance | Accuracy | Sensitivity | Specificity | PPV | NPV |
|---|---|---|---|---|---|---|
| Rt’-ICA | RF | 0.96 | 1.00 | 0.96 | 0.33 | 1.00 |
| LR | 0.87 | 1.00 | 0.87 | 0.14 | 1.00 | |
| Lt’-ICA | RF | 0.87 | 0.33 | 0.89 | 0.09 | 0.98 |
| LR | 0.89 | 0.33 | 0.91 | 0.11 | 0.98 | |
| Rt’-VA | RF | 0.85 | 0.67 | 0.86 | 0.25 | 0.97 |
| LR | 0.82 | 0.67 | 0.83 | 0.21 | 0.97 | |
| Lt’-VA | RF | 0.88 | 1.00 | 0.88 | 0.27 | 1.00 |
| LR | 0.85 | 1.00 | 0.84 | 0.22 | 1.00 | |
| Total VA | RF | 1.00 | 1.00 | 1.00 | 1.00 | 1.00 |
| LR | 0.99 | 0.92 | 1.00 | 1.00 | 0.99 |
| Random Forest | Predictors | Mean Decrease Gini |
|---|---|---|
| Rt’-MCA | Gender | 0.18 |
| Age | 0.94 | |
| Dist. M1 PSV | 1.13 | |
| Dist. M1 PI | 1.48 | |
| Prox. M1 PSV | 1.55 | |
| Prox. M1 PI | 1.20 | |
| M2 PSV | 1.19 | |
| M2 PI | 1.03 | |
| Lt’-MCA | Gender | 0.17 |
| Age | 0.77 | |
| Dist. M1 PSV | 2.18 | |
| Dist. M1 PI | 0.77 | |
| Prox. M1 PSV | 1.06 | |
| Prox. M1 PI | 1.40 | |
| M2 PSV | 1.16 | |
| M2 PI | 1.29 | |
| Rt’-VA | Gender | 0.21 |
| Age | 3.00 | |
| PSV | 8.41 | |
| PI | 18.69 | |
| Lt’-VA | Gender | 0.44 |
| Age | 8.35 | |
| PSV | 6.21 | |
| PI | 15.82 | |
| BA | Gender | 0.47 |
| Age | 6.07 | |
| PSV | 6.27 | |
| PI | 17.99 |
| Specific Side/Artery | Model Performance | Accuracy | Sensitivity | Specificity | PPV | NPV |
|---|---|---|---|---|---|---|
| Rt’-MCA | RF | 0.86 | 1.00 | 0.75 | 0.75 | 1.00 |
| LR | 0.71 | 1.00 | 0.50 | 0.60 | 1.00 | |
| Lt’-MCA | RF | 0.67 | 1.00 | 0.33 | 0.60 | 1.00 |
| LR | 0.67 | 1.00 | 0.33 | 0.60 | 1.00 | |
| Rt’-VA | RF | 0.60 | 0.33 | 0.67 | 0.20 | 0.80 |
| LR | 0.60 | 0.33 | 0.67 | 0.20 | 0.80 | |
| Lt’-VA | RF | 0.73 | 0.50 | 0.77 | 0.25 | 0.91 |
| LR | 0.53 | 0.50 | 0.54 | 0.14 | 0.88 | |
| BA | RF | 0.80 | 0.50 | 0.85 | 0.33 | 0.92 |
| LR | 0.87 | 1.00 | 0.85 | 0.50 | 1.00 |
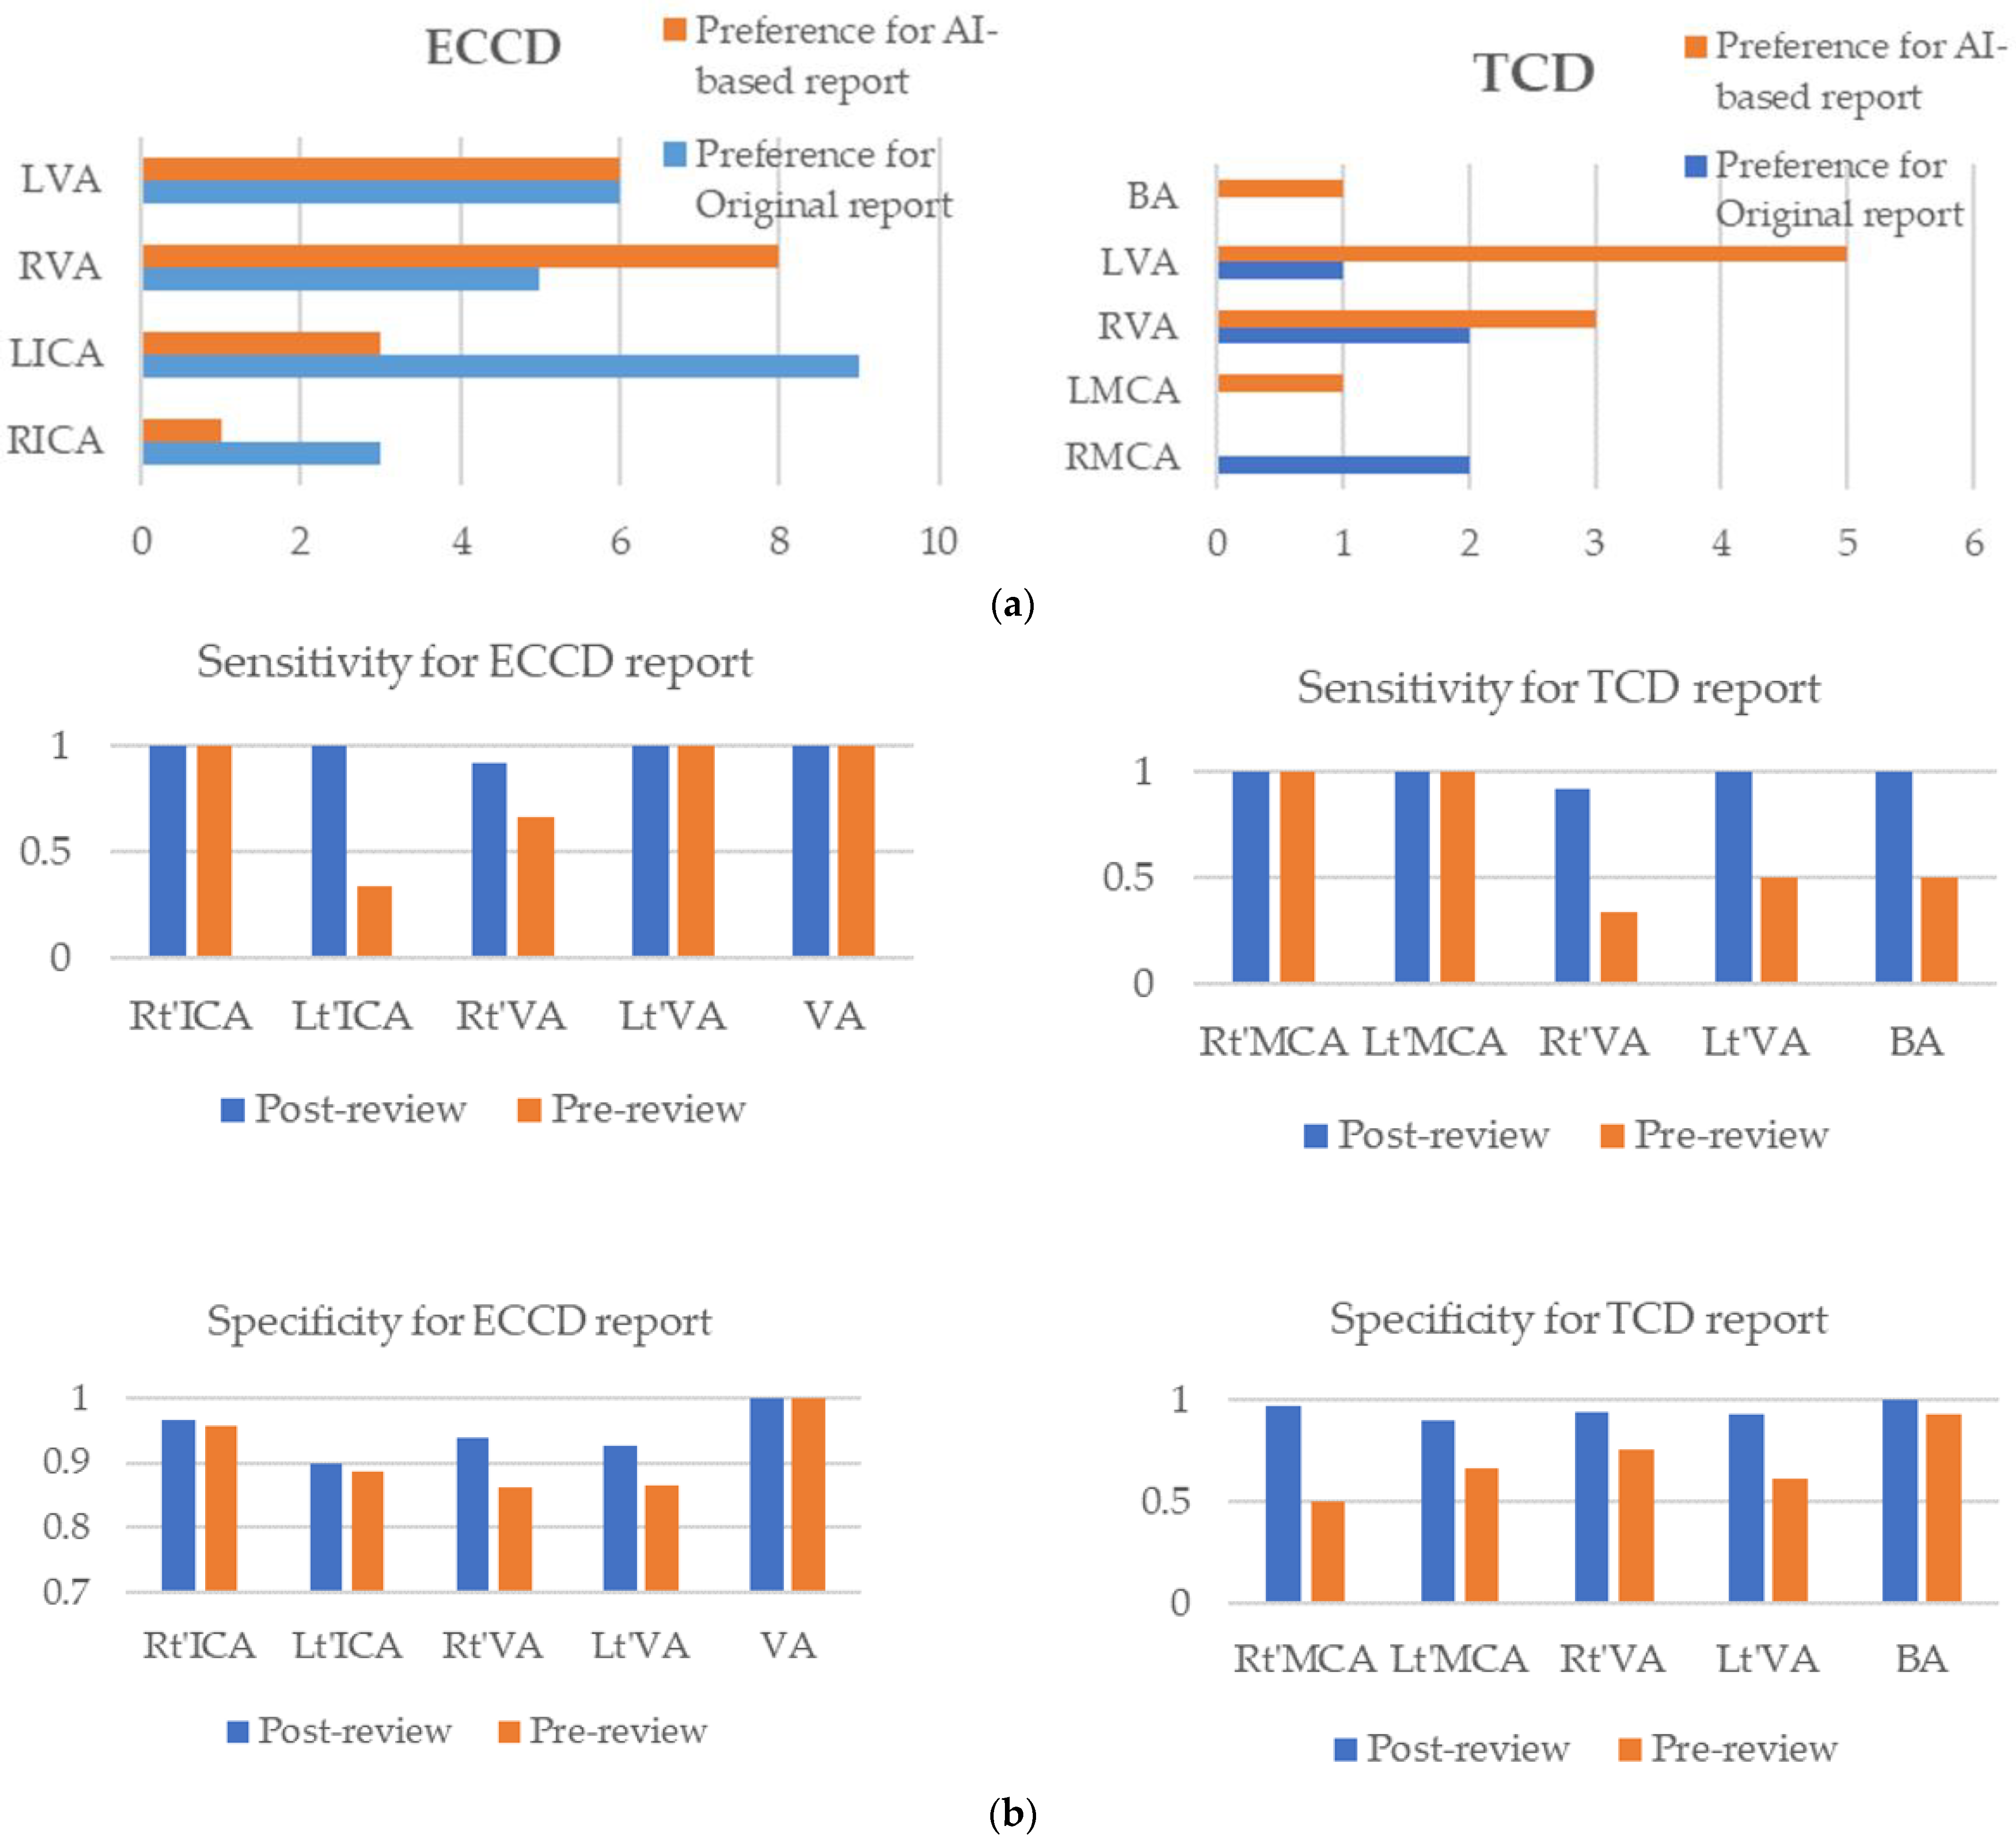
| Exam. | Specific Side/Artery | Inconsistent Cases | # of Preference for Original Report | # of Preference for Machine Learning-Based Report |
|---|---|---|---|---|
| ECCD | Rt’-ICA | 4 | 3 | 1 |
| Lt’-ICA | 12 | 9 | 3 | |
| Rt’-VA | 13 | 5 | 8 | |
| Lt’-VA | 12 | 6 | 6 | |
| Total VA | 0 | 0 | 0 | |
| TCD | Rt’-MCA | 2 | 2 | 0 |
| Lt’-MCA | 1 | 0 | 1 | |
| Rt’-VA | 5 | 2 | 3 | |
| Lt’-VA | 6 | 1 | 5 | |
| BA | 1 | 0 | 1 |
Publisher’s Note: MDPI stays neutral with regard to jurisdictional claims in published maps and institutional affiliations. |
© 2022 by the authors. Licensee MDPI, Basel, Switzerland. This article is an open access article distributed under the terms and conditions of the Creative Commons Attribution (CC BY) license (https://creativecommons.org/licenses/by/4.0/).
Share and Cite
Yeh, C.-Y.; Lee, H.-H.; Islam, M.M.; Chien, C.-H.; Atique, S.; Chan, L.; Lin, M.-C. Development and Validation of Machine Learning Models to Classify Artery Stenosis for Automated Generating Ultrasound Report. Diagnostics 2022, 12, 3047. https://doi.org/10.3390/diagnostics12123047
Yeh C-Y, Lee H-H, Islam MM, Chien C-H, Atique S, Chan L, Lin M-C. Development and Validation of Machine Learning Models to Classify Artery Stenosis for Automated Generating Ultrasound Report. Diagnostics. 2022; 12(12):3047. https://doi.org/10.3390/diagnostics12123047
Chicago/Turabian StyleYeh, Chih-Yang, Hsun-Hua Lee, Md. Mohaimenul Islam, Chiu-Hui Chien, Suleman Atique, Lung Chan, and Ming-Chin Lin. 2022. "Development and Validation of Machine Learning Models to Classify Artery Stenosis for Automated Generating Ultrasound Report" Diagnostics 12, no. 12: 3047. https://doi.org/10.3390/diagnostics12123047