
A Framework for Lung and Colon Cancer Diagnosis via Lightweight Deep Learning Models and Transformation Methods


Abstract
:1. Introduction
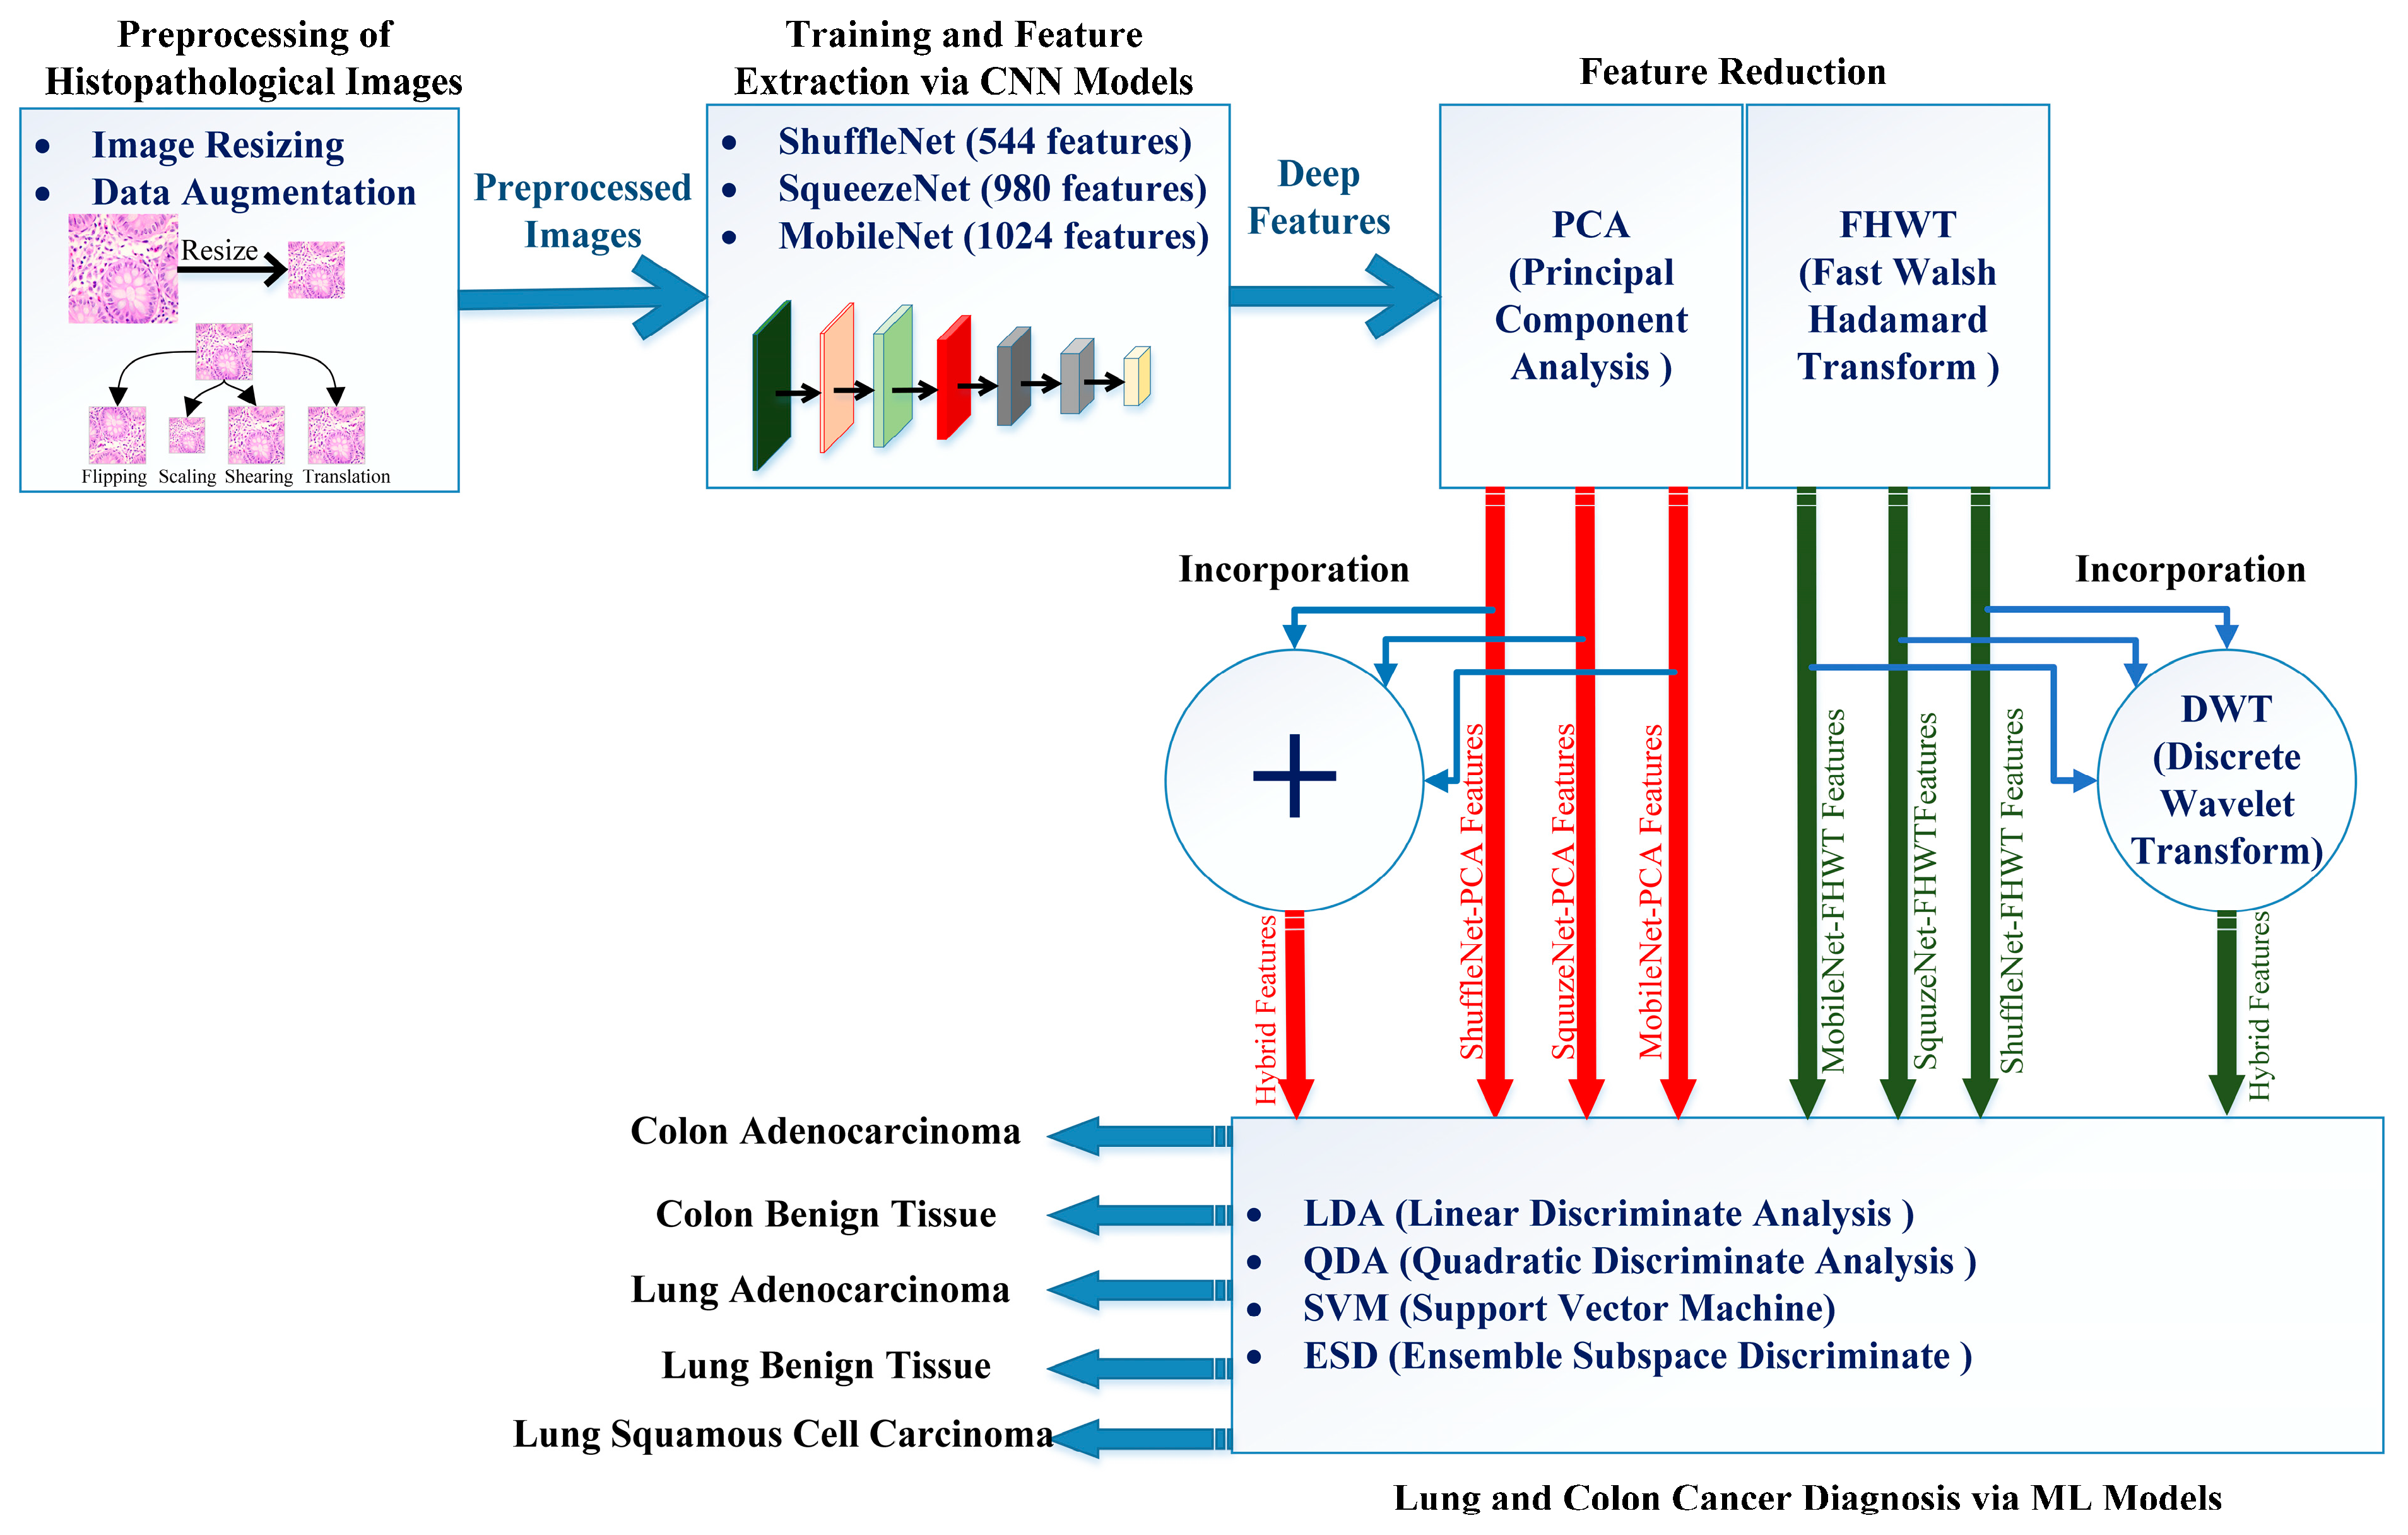
- The proposed framework depends on lightweight deep learning models, including ShuffleNet, MobileNet, and SqueezeNet, in contrast to many of the earlier studies based on heavy deep learning models such as VGG.
- The majority of related studies relies on individual deep learning models for performing the diagnosis; nevertheless, the proposed framework utilizes three deep learning models of various structures.
- Most previous studies used spatial deep features extracted from the last pooling layer of the deep learning models directly to train machine learning classifiers, which may have huge dimensions and thus increase the complexity and duration of the classification process; however, the proposed framework employs two feature reduction approaches to diminish their dimension, including PCA and FHWT.
- The reduced sets of features generated after FHWT provides the spatial–frequency demonstration of the features, not only spatial information such as with previous methods.
- The proposed framework integrates the privileges of distinct architectures of three deep learning models by first merging the reduced features obtained using PCA for the three deep learning models.
- Furthermore, the three reduced sets of features produced after FHWT for ShuffleNet, MobileNet, and SqueezeNet are merged using DWT, which offers the time–frequency representations of the features of lung and colon cancer, resulting in spatial–time–frequency representations, which usually improves diagnostic performance and further lowers the features dimension.
2. Literature Survey
3. Materials and Methods
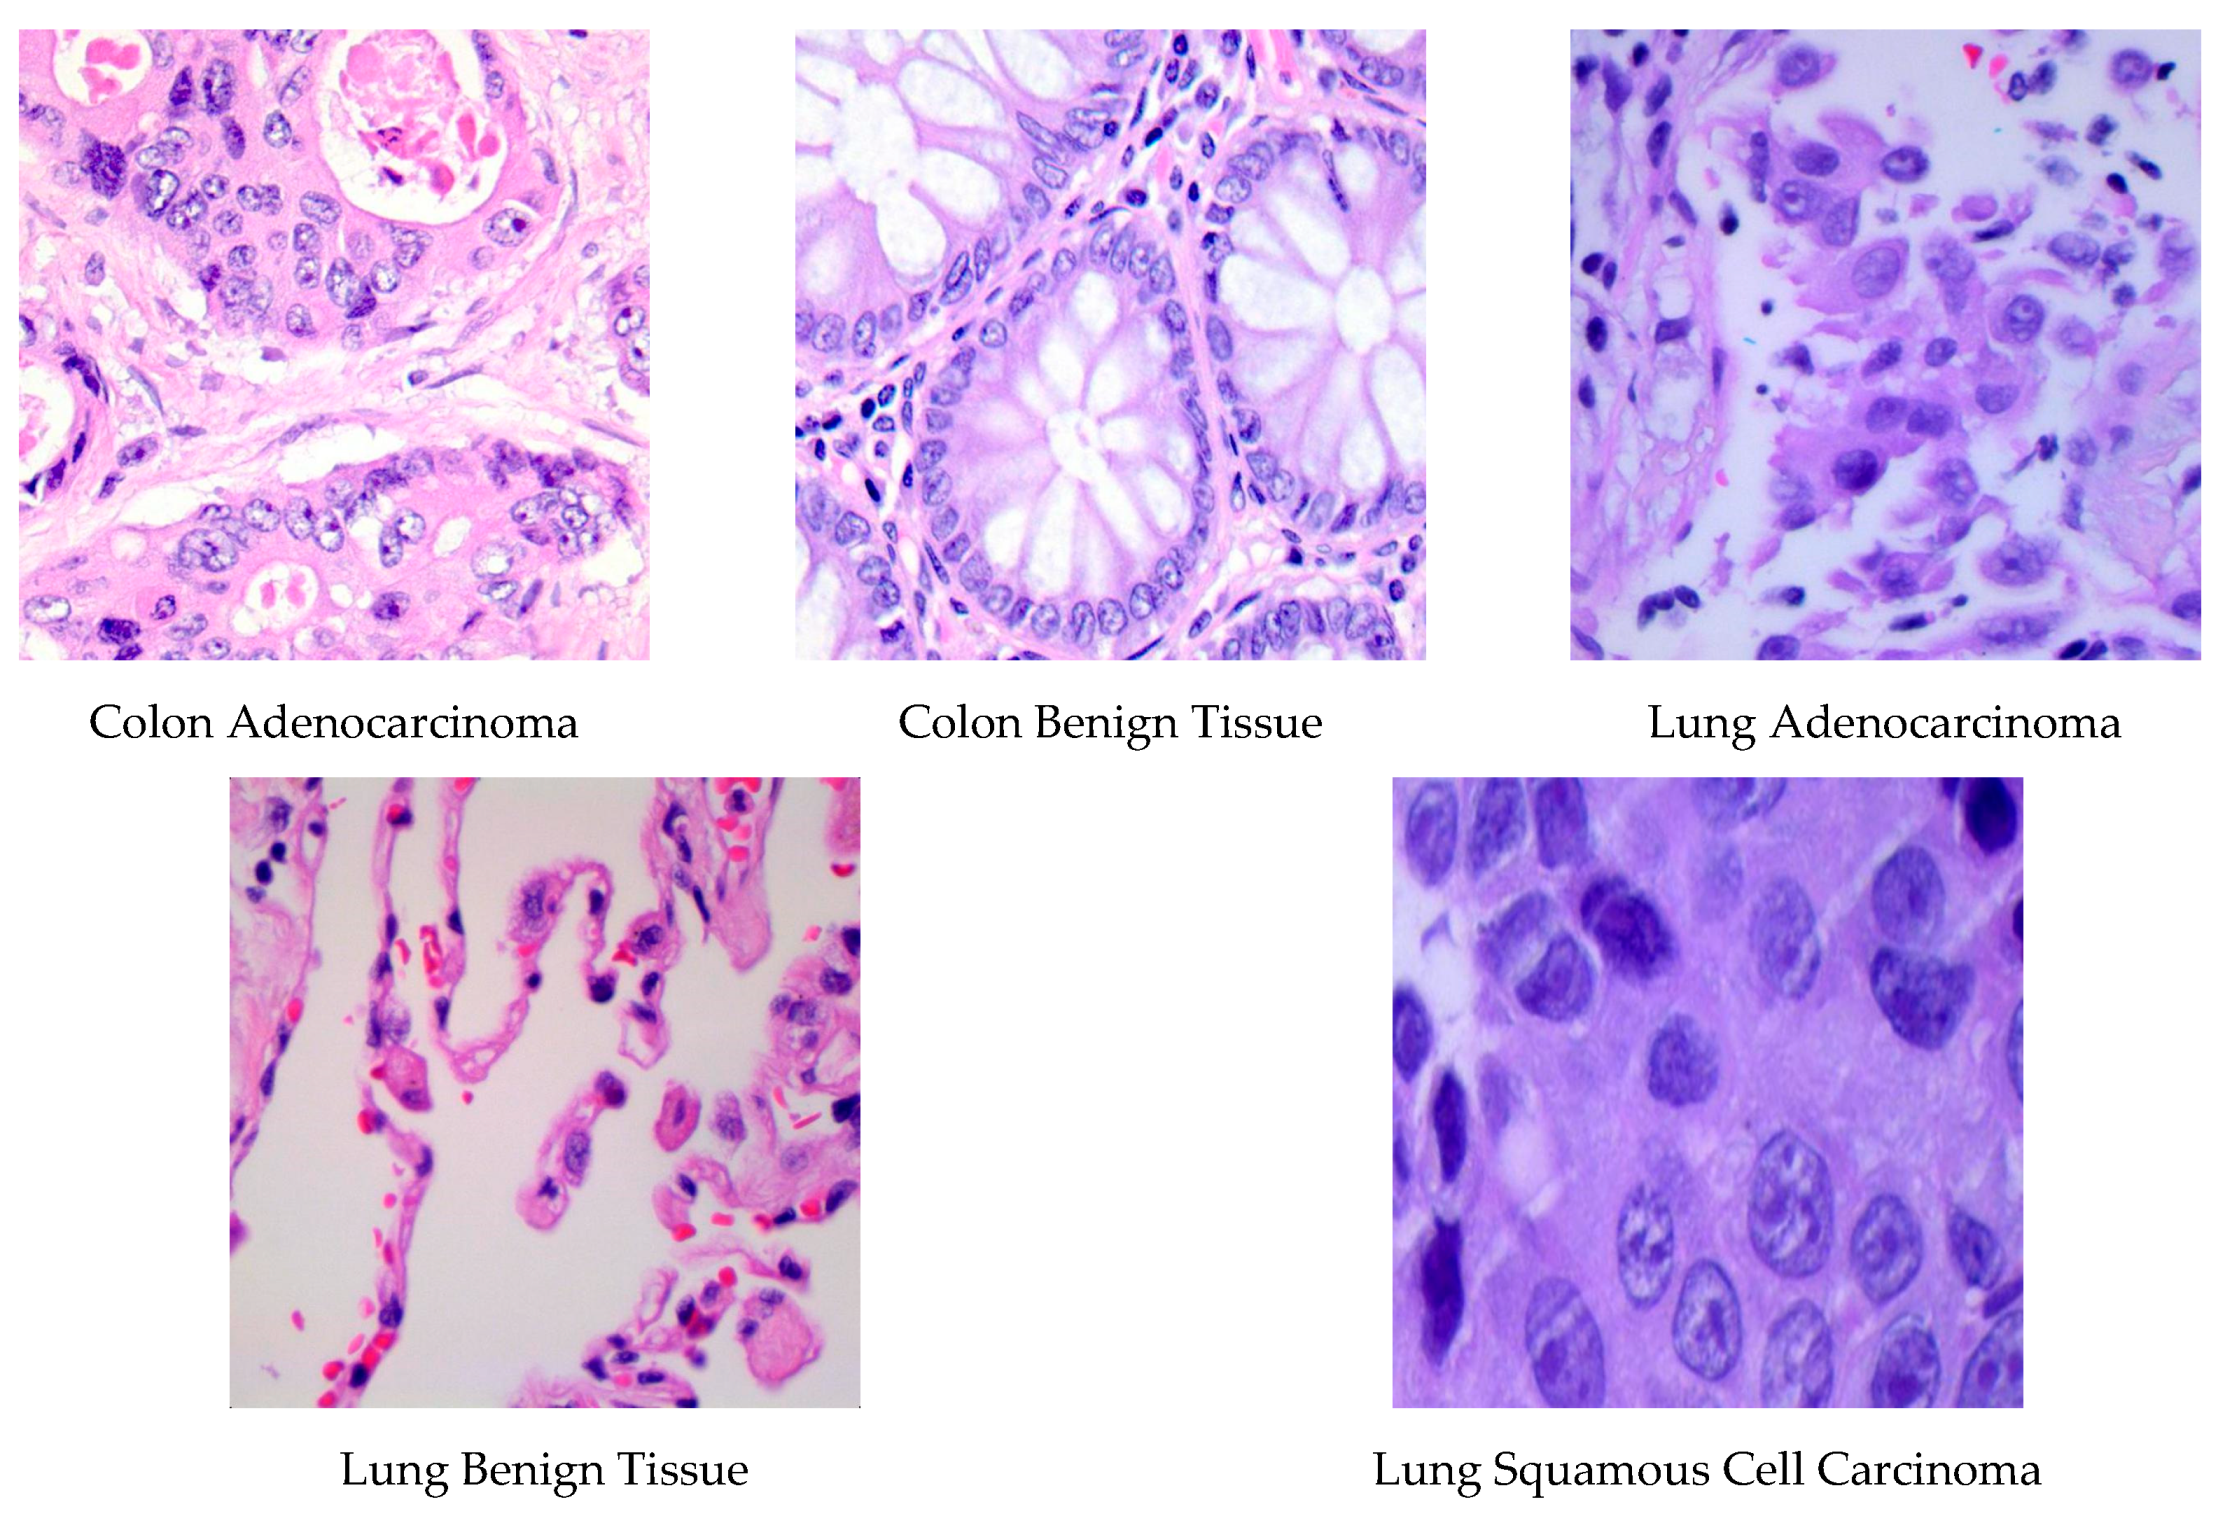
3.1. LC25000 Dataset
3.2. Feature Transformation Approaches
3.2.1. Discrete Wavelet Transform
3.2.2. Principal Component Analysis
3.2.3. Fast Walsh–Hadamard Transform
3.3. Proposed Framework
3.3.1. Preprocessing of Histopathological Images
3.3.2. Deep Learning Models Training and Feature Extraction
3.3.3. Feature Reduction and Incorporation
3.3.4. Lung and Colon Cancer Diagnosis
4. Performance Measures and CNNs’ Parameters Setting
4.1. Performance Measures
4.2. CNN’s Parameters Setting
5. Results
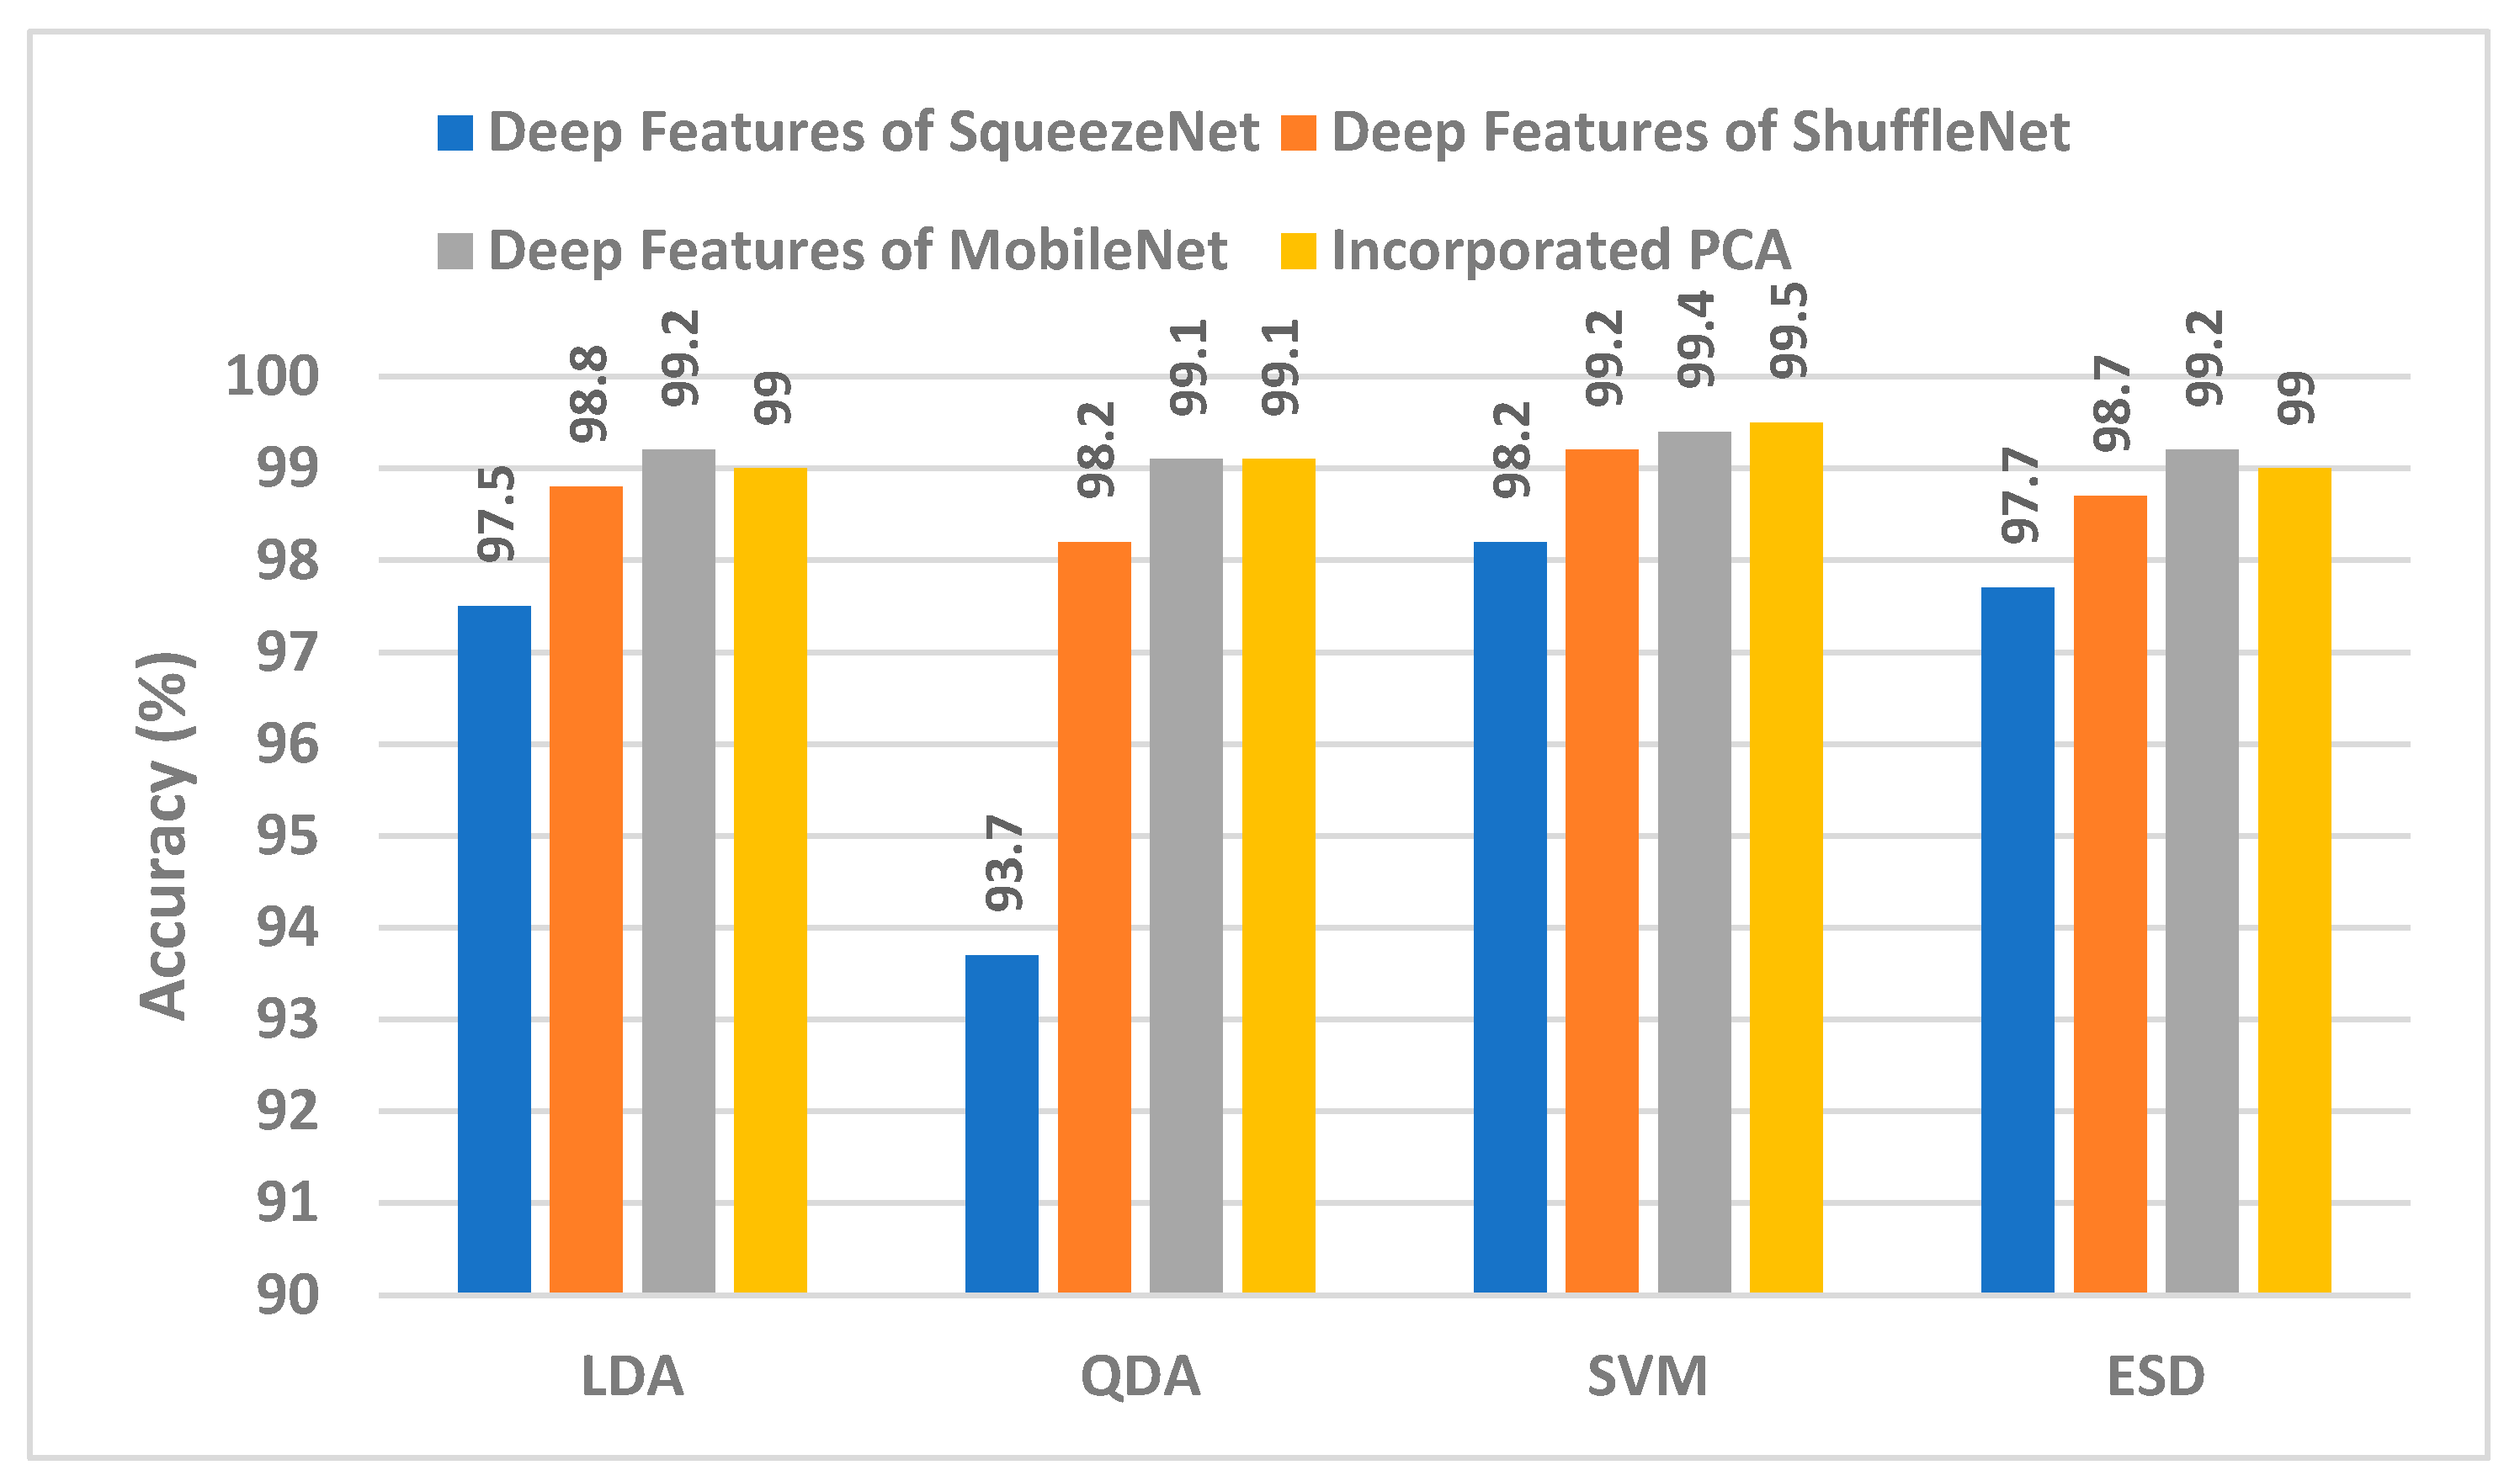
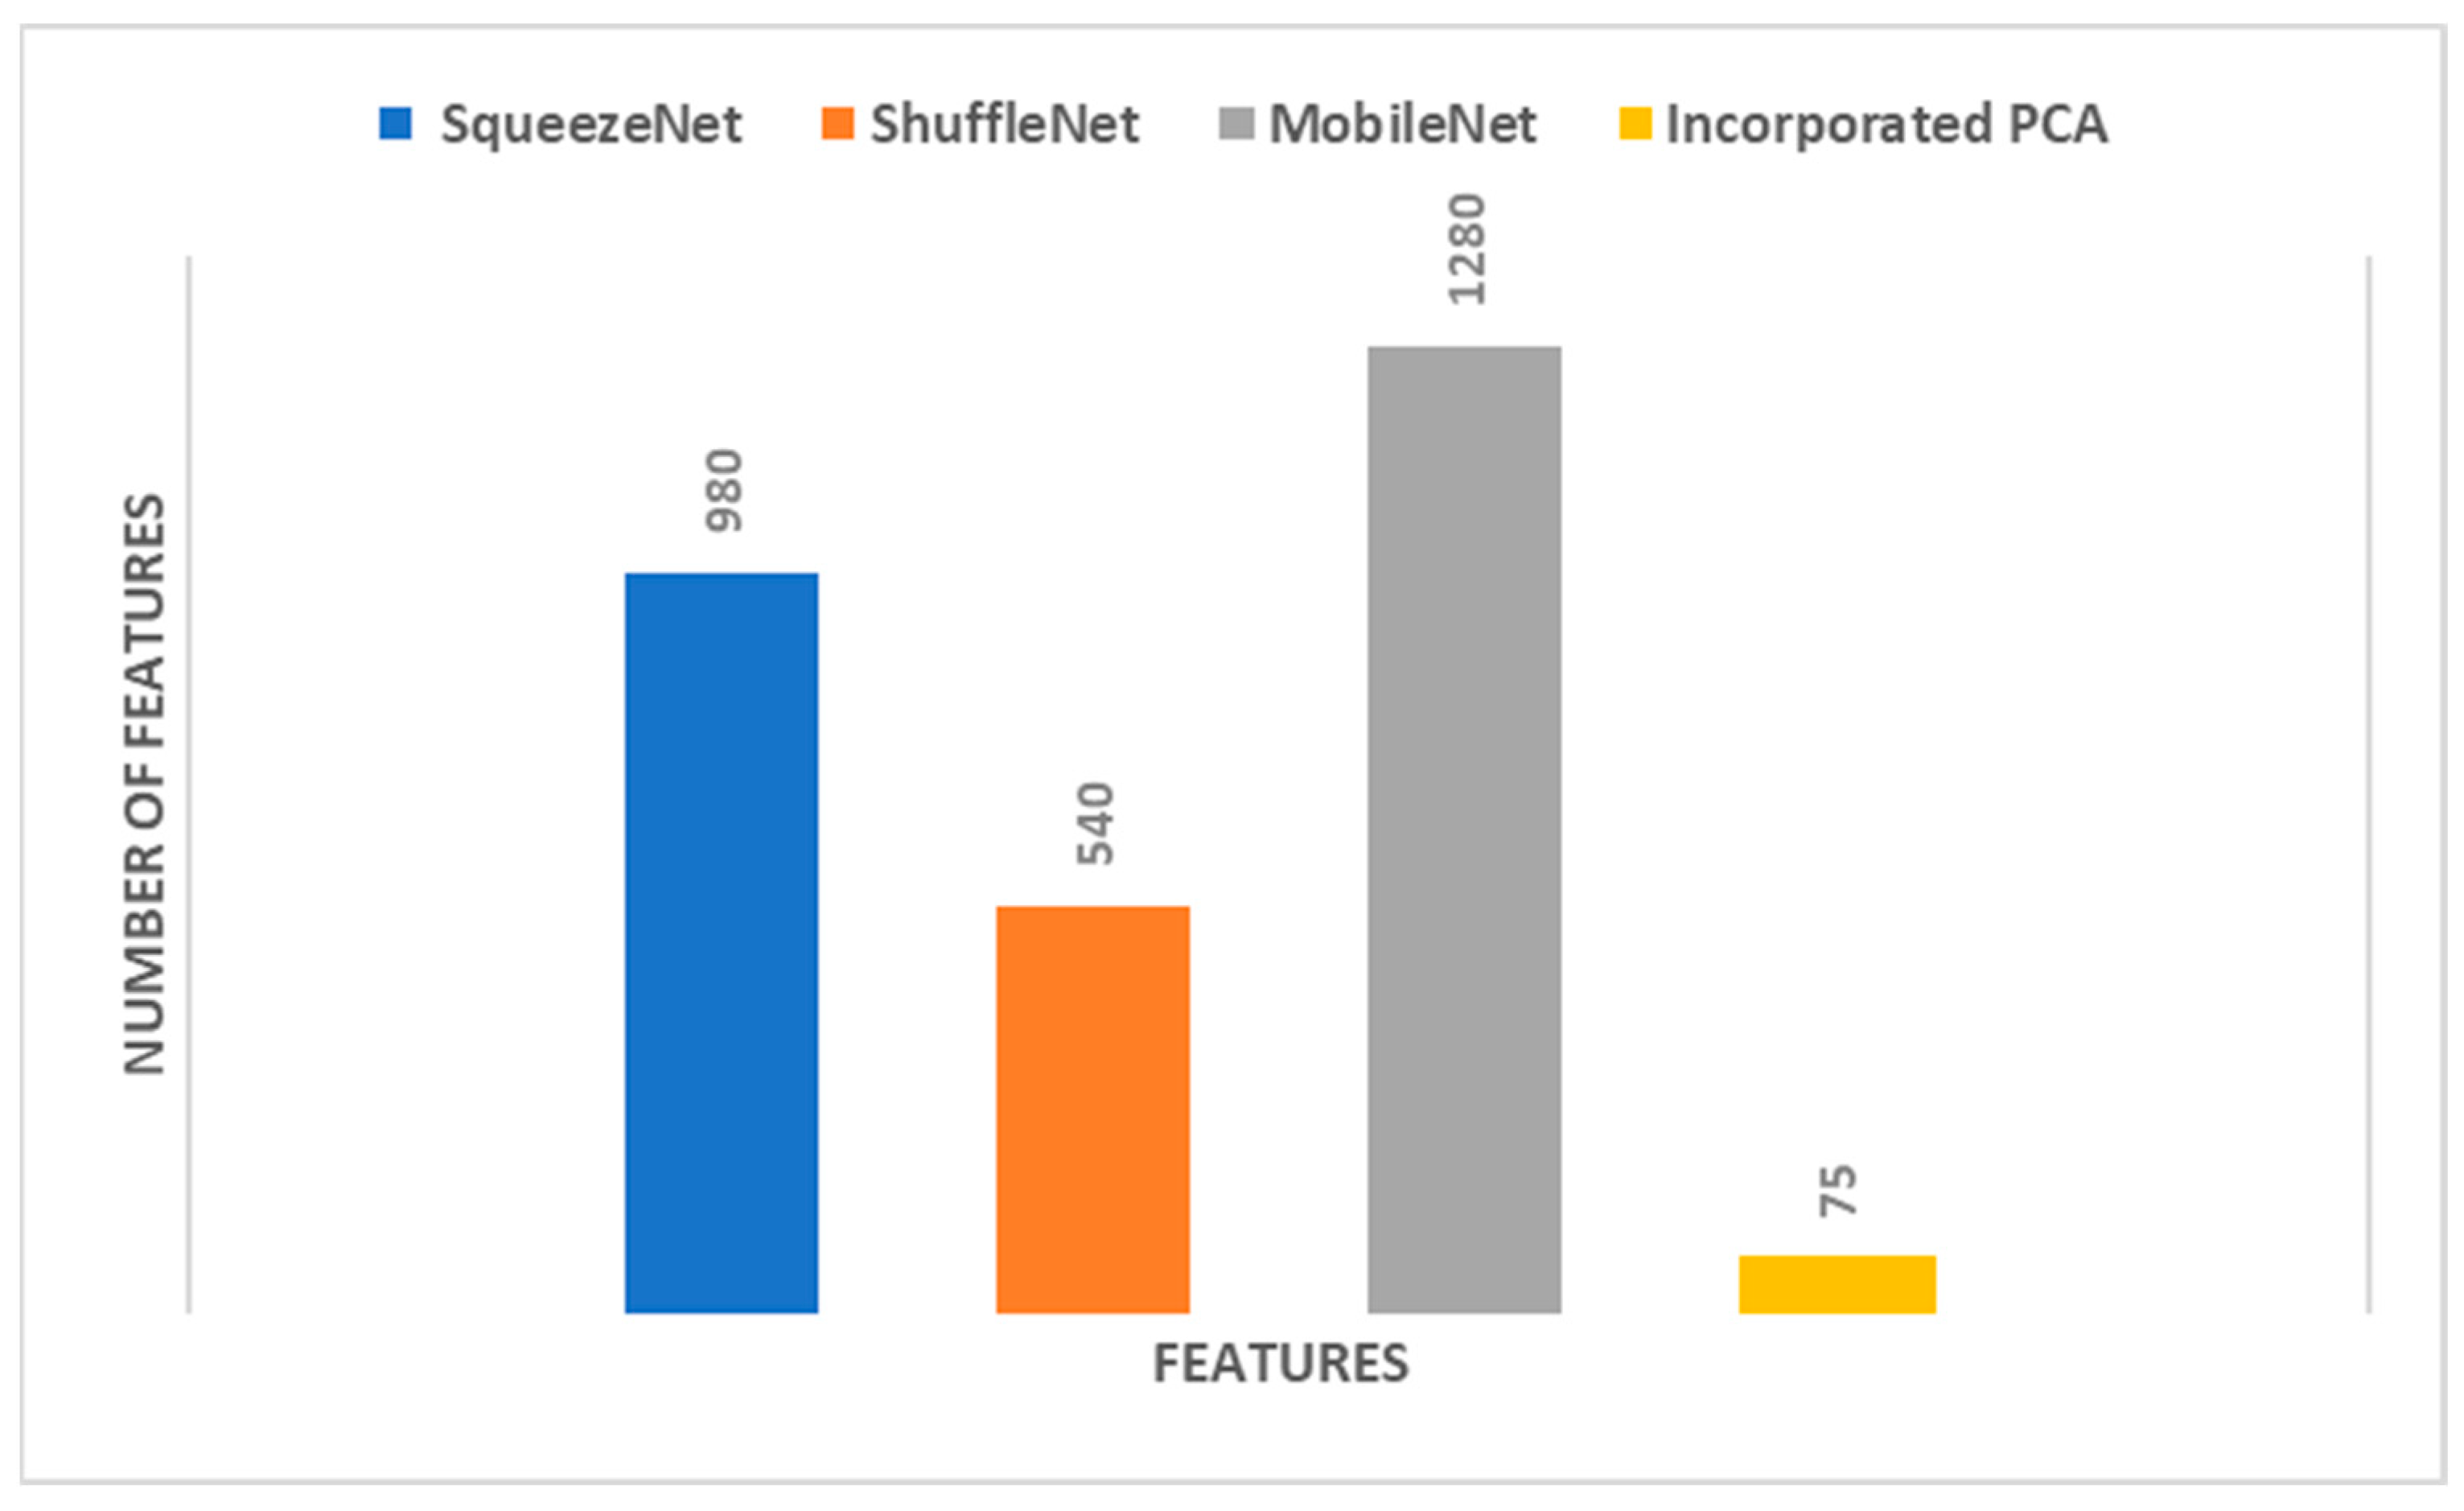
5.1. Results of PCA
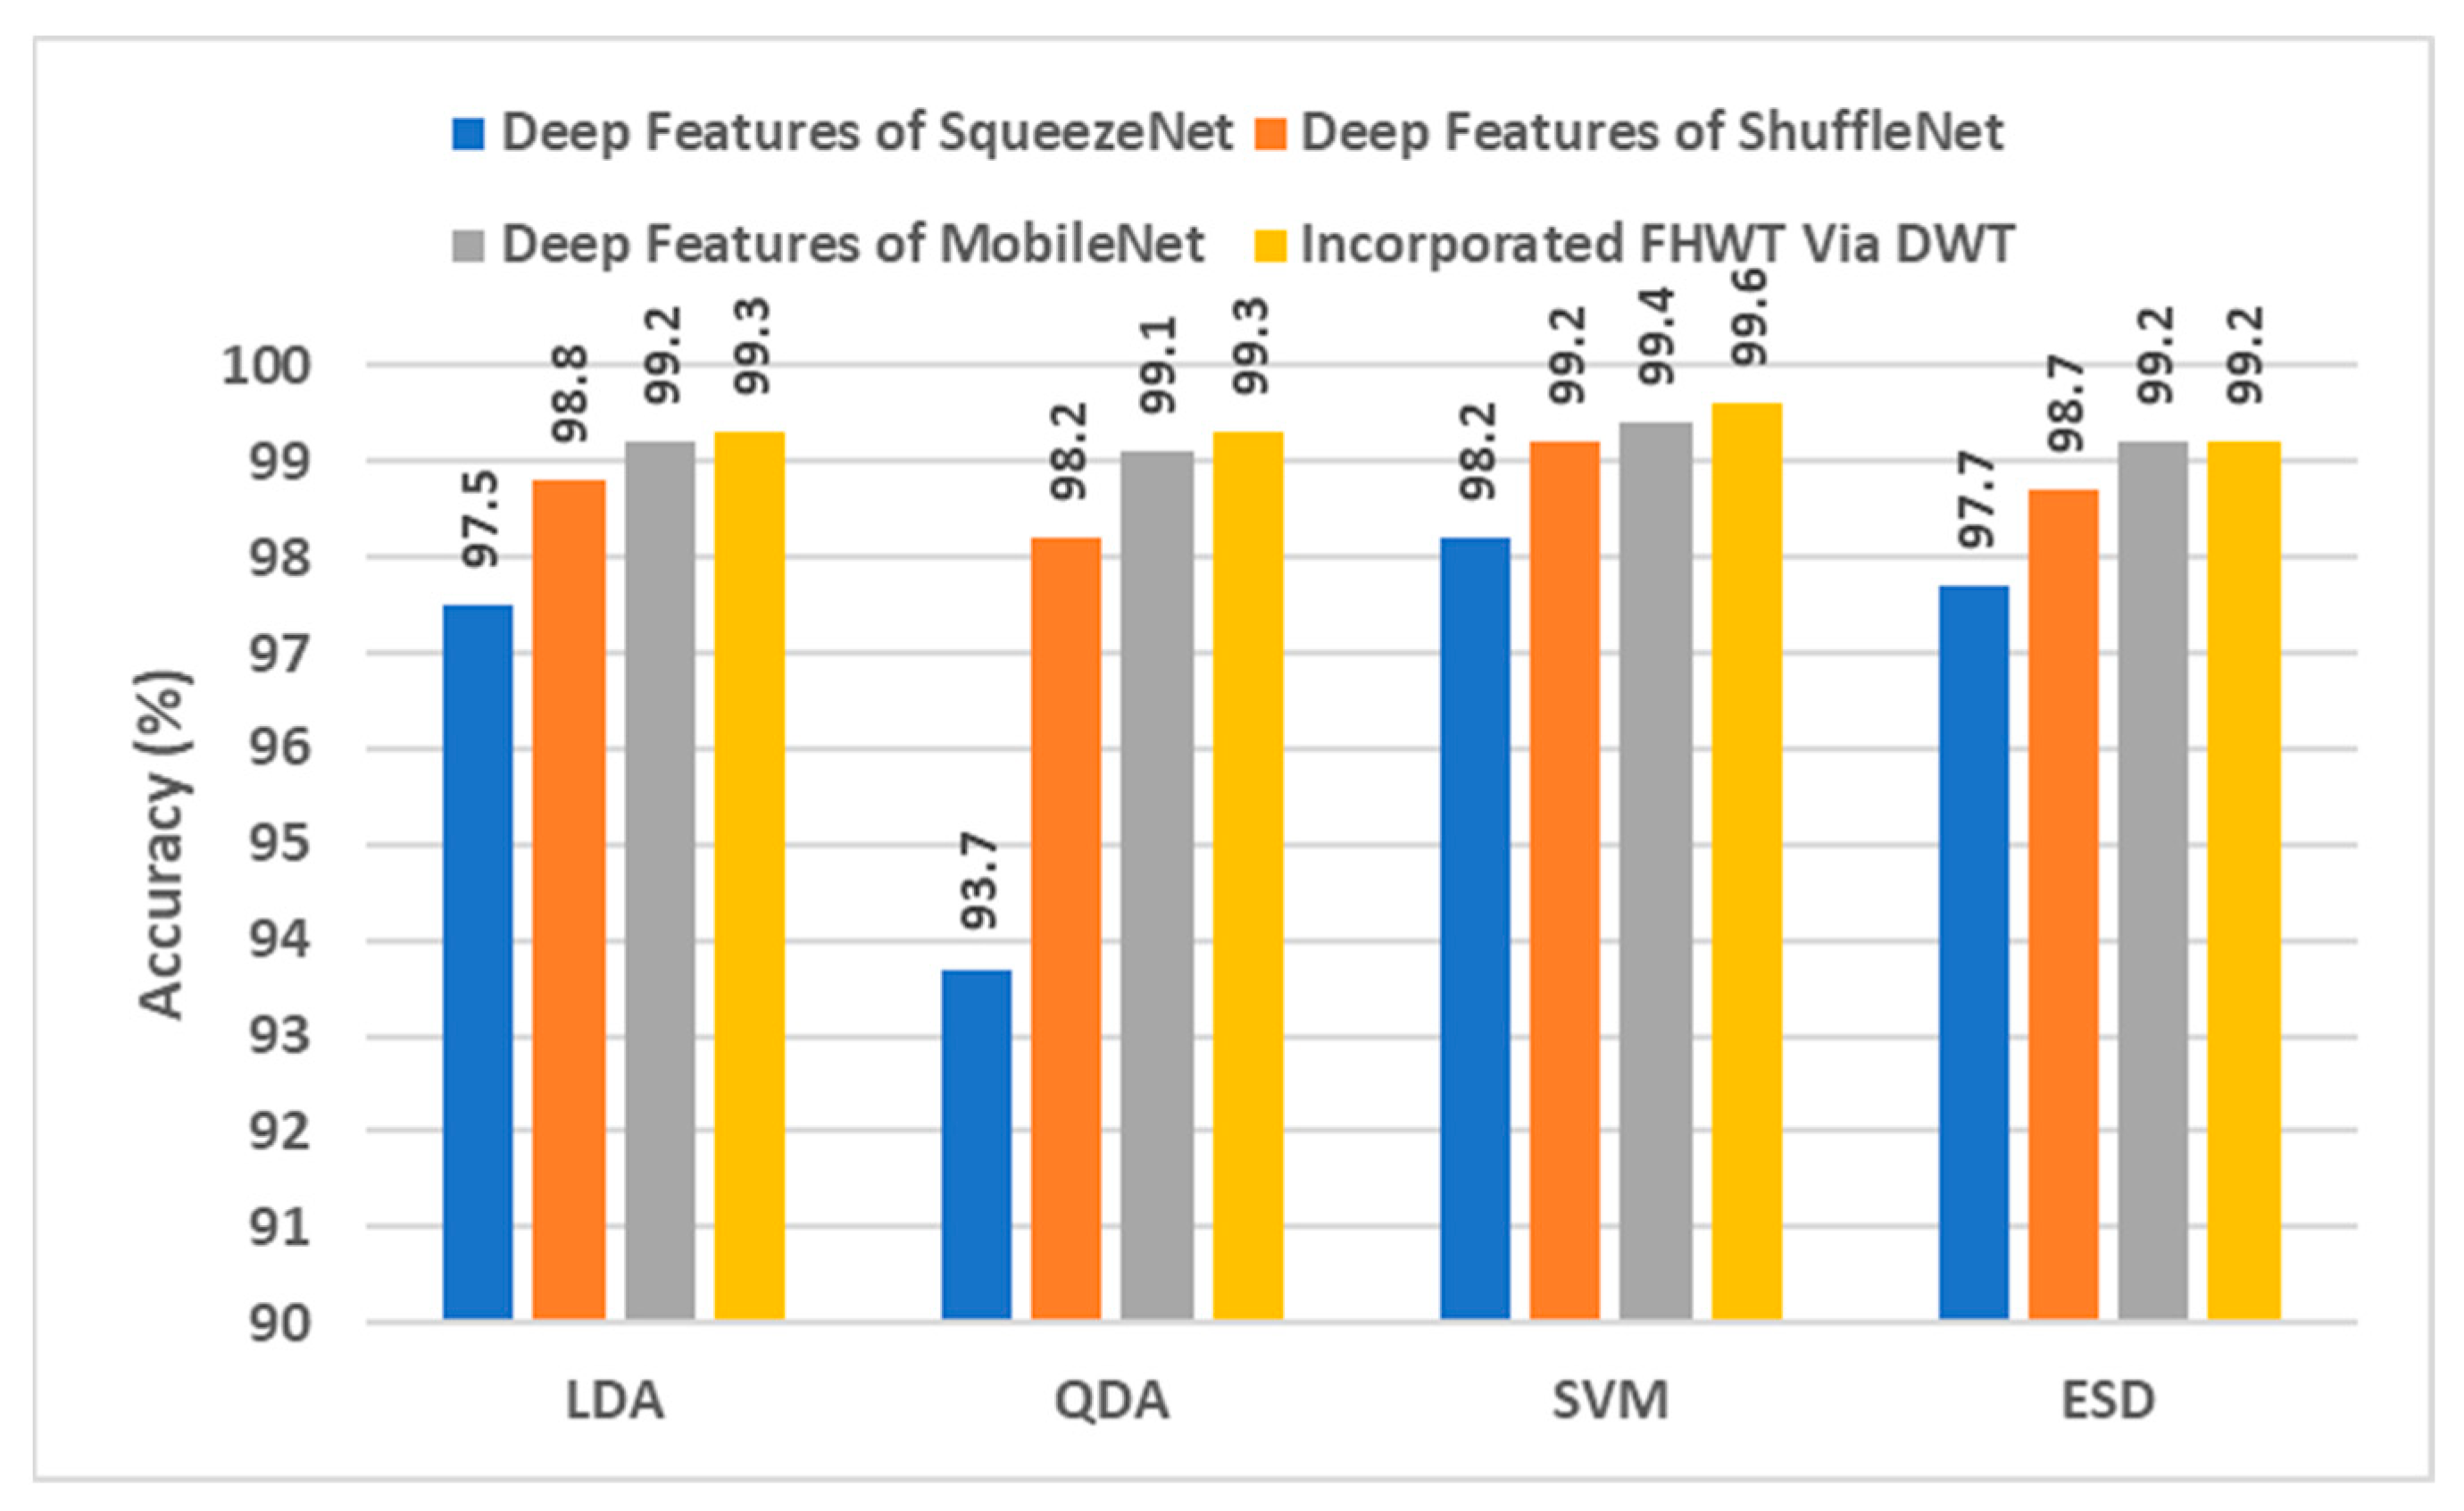
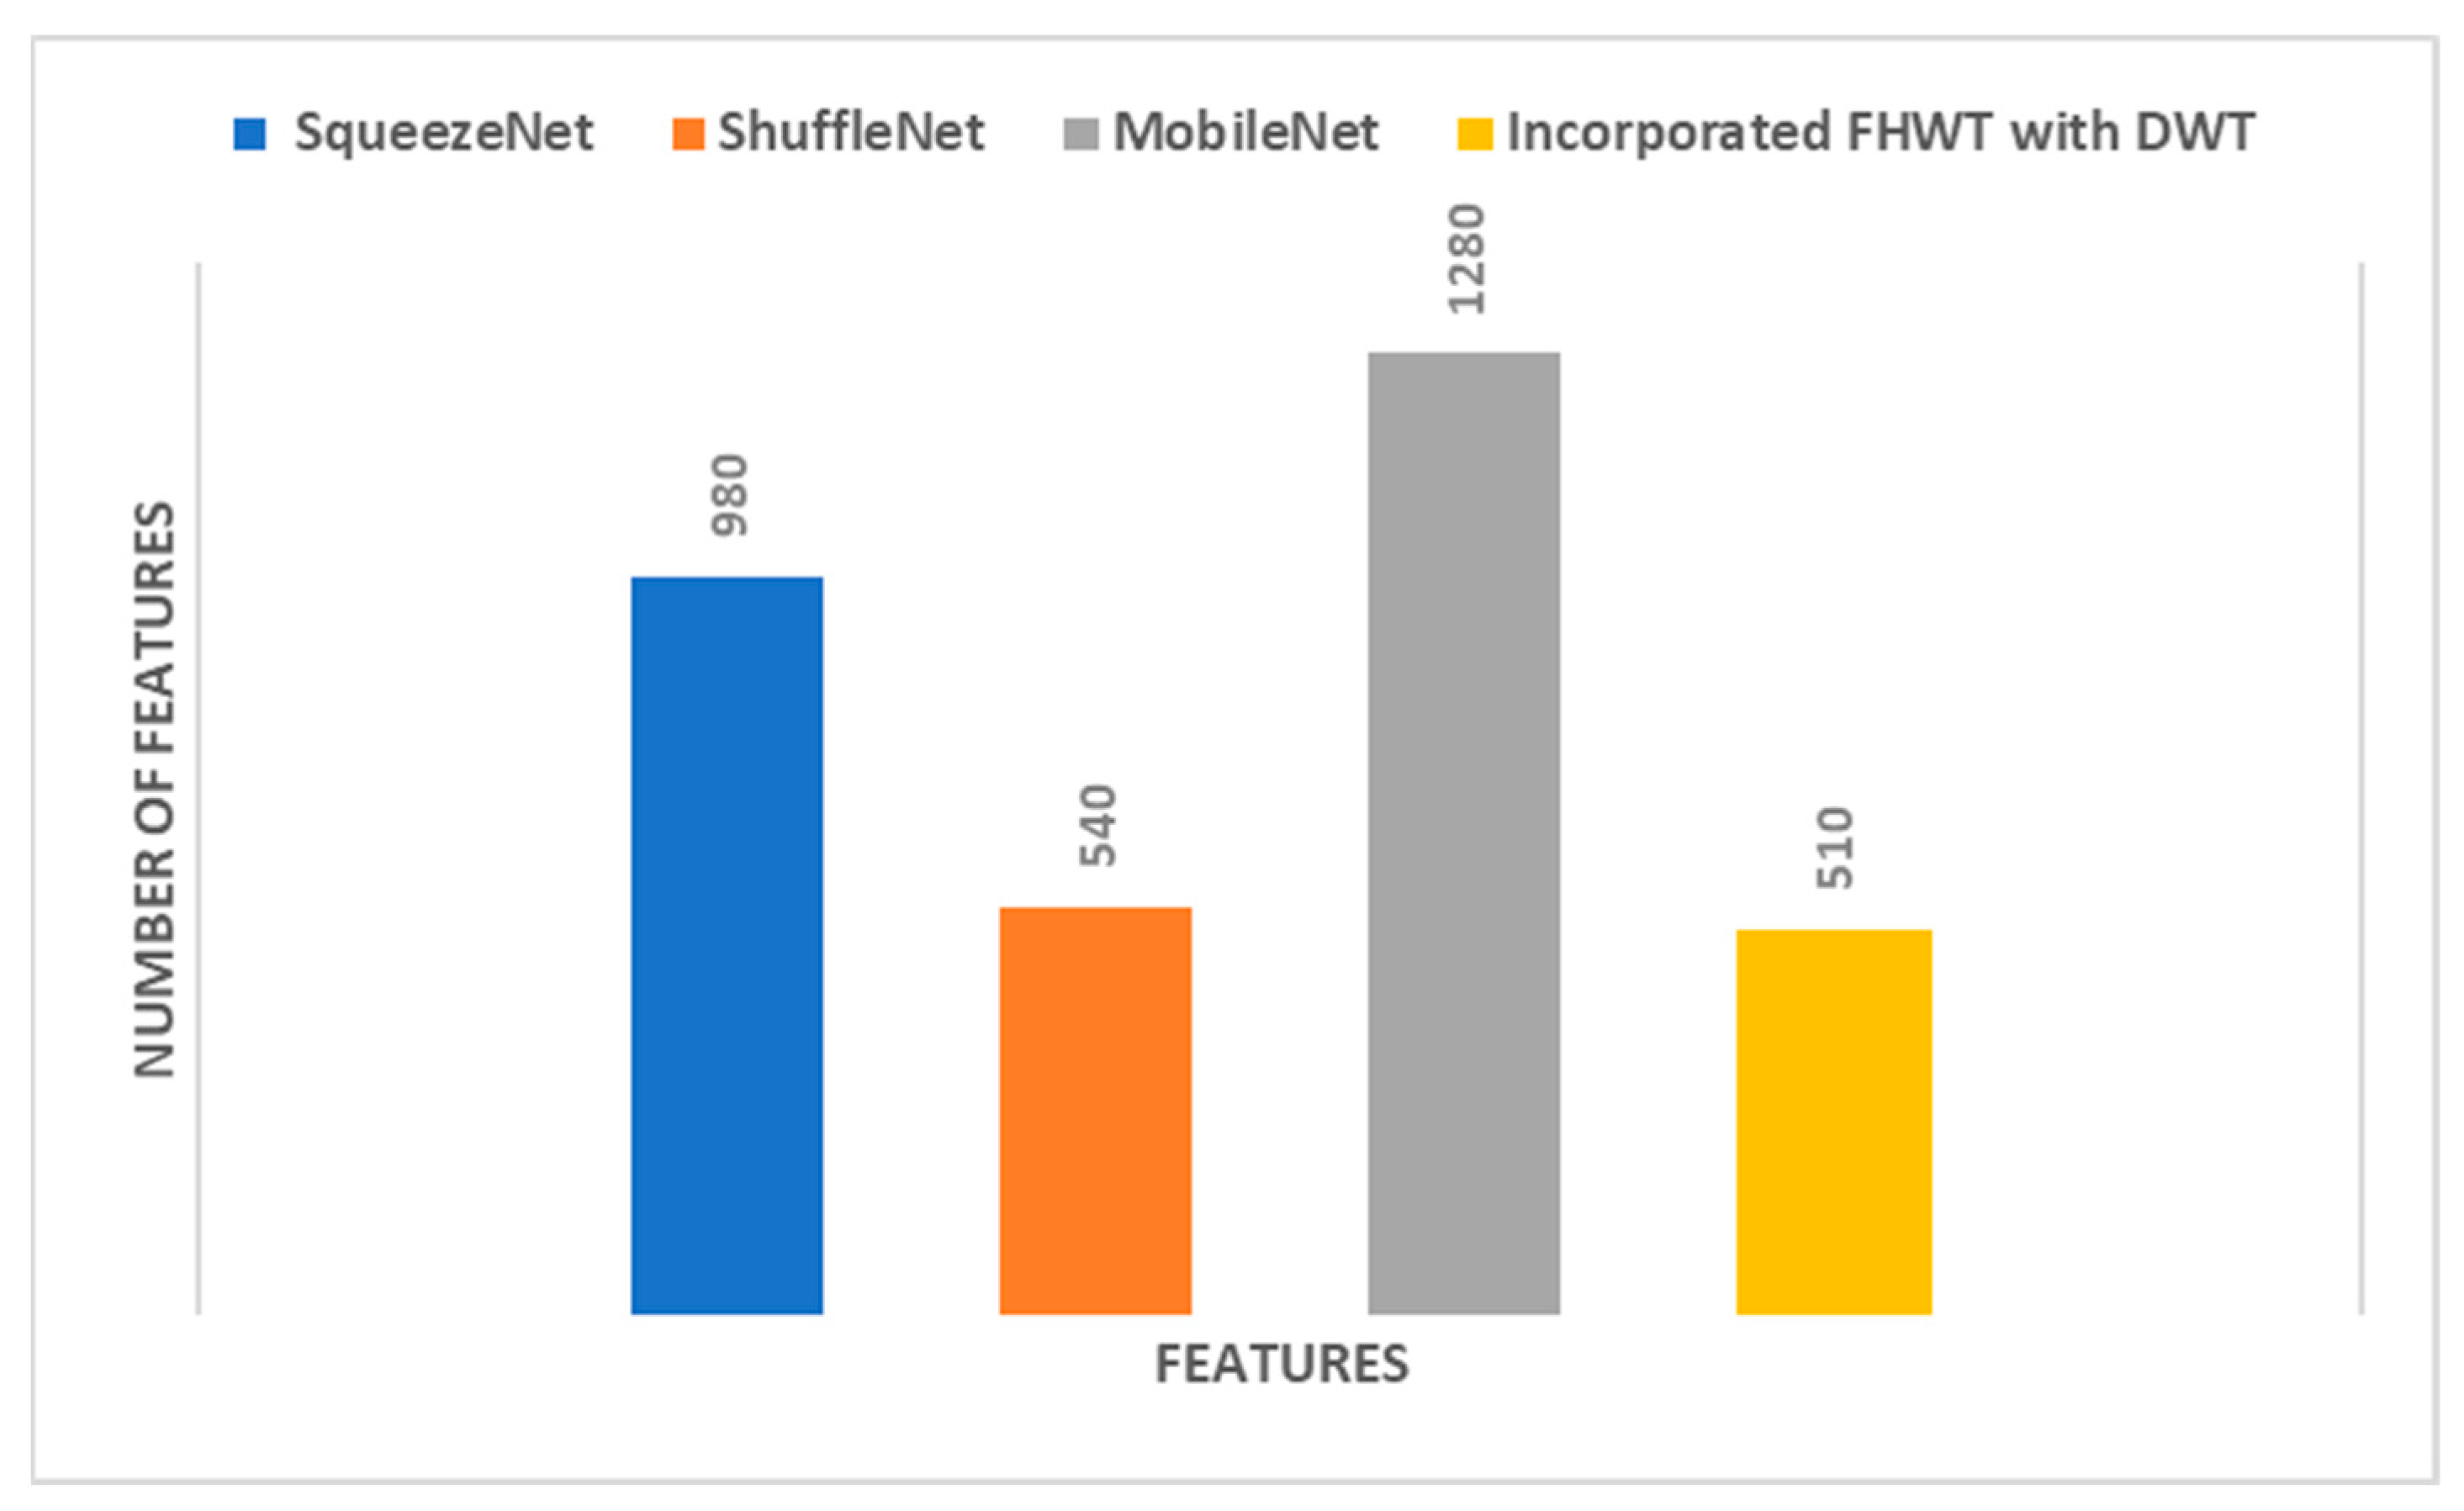
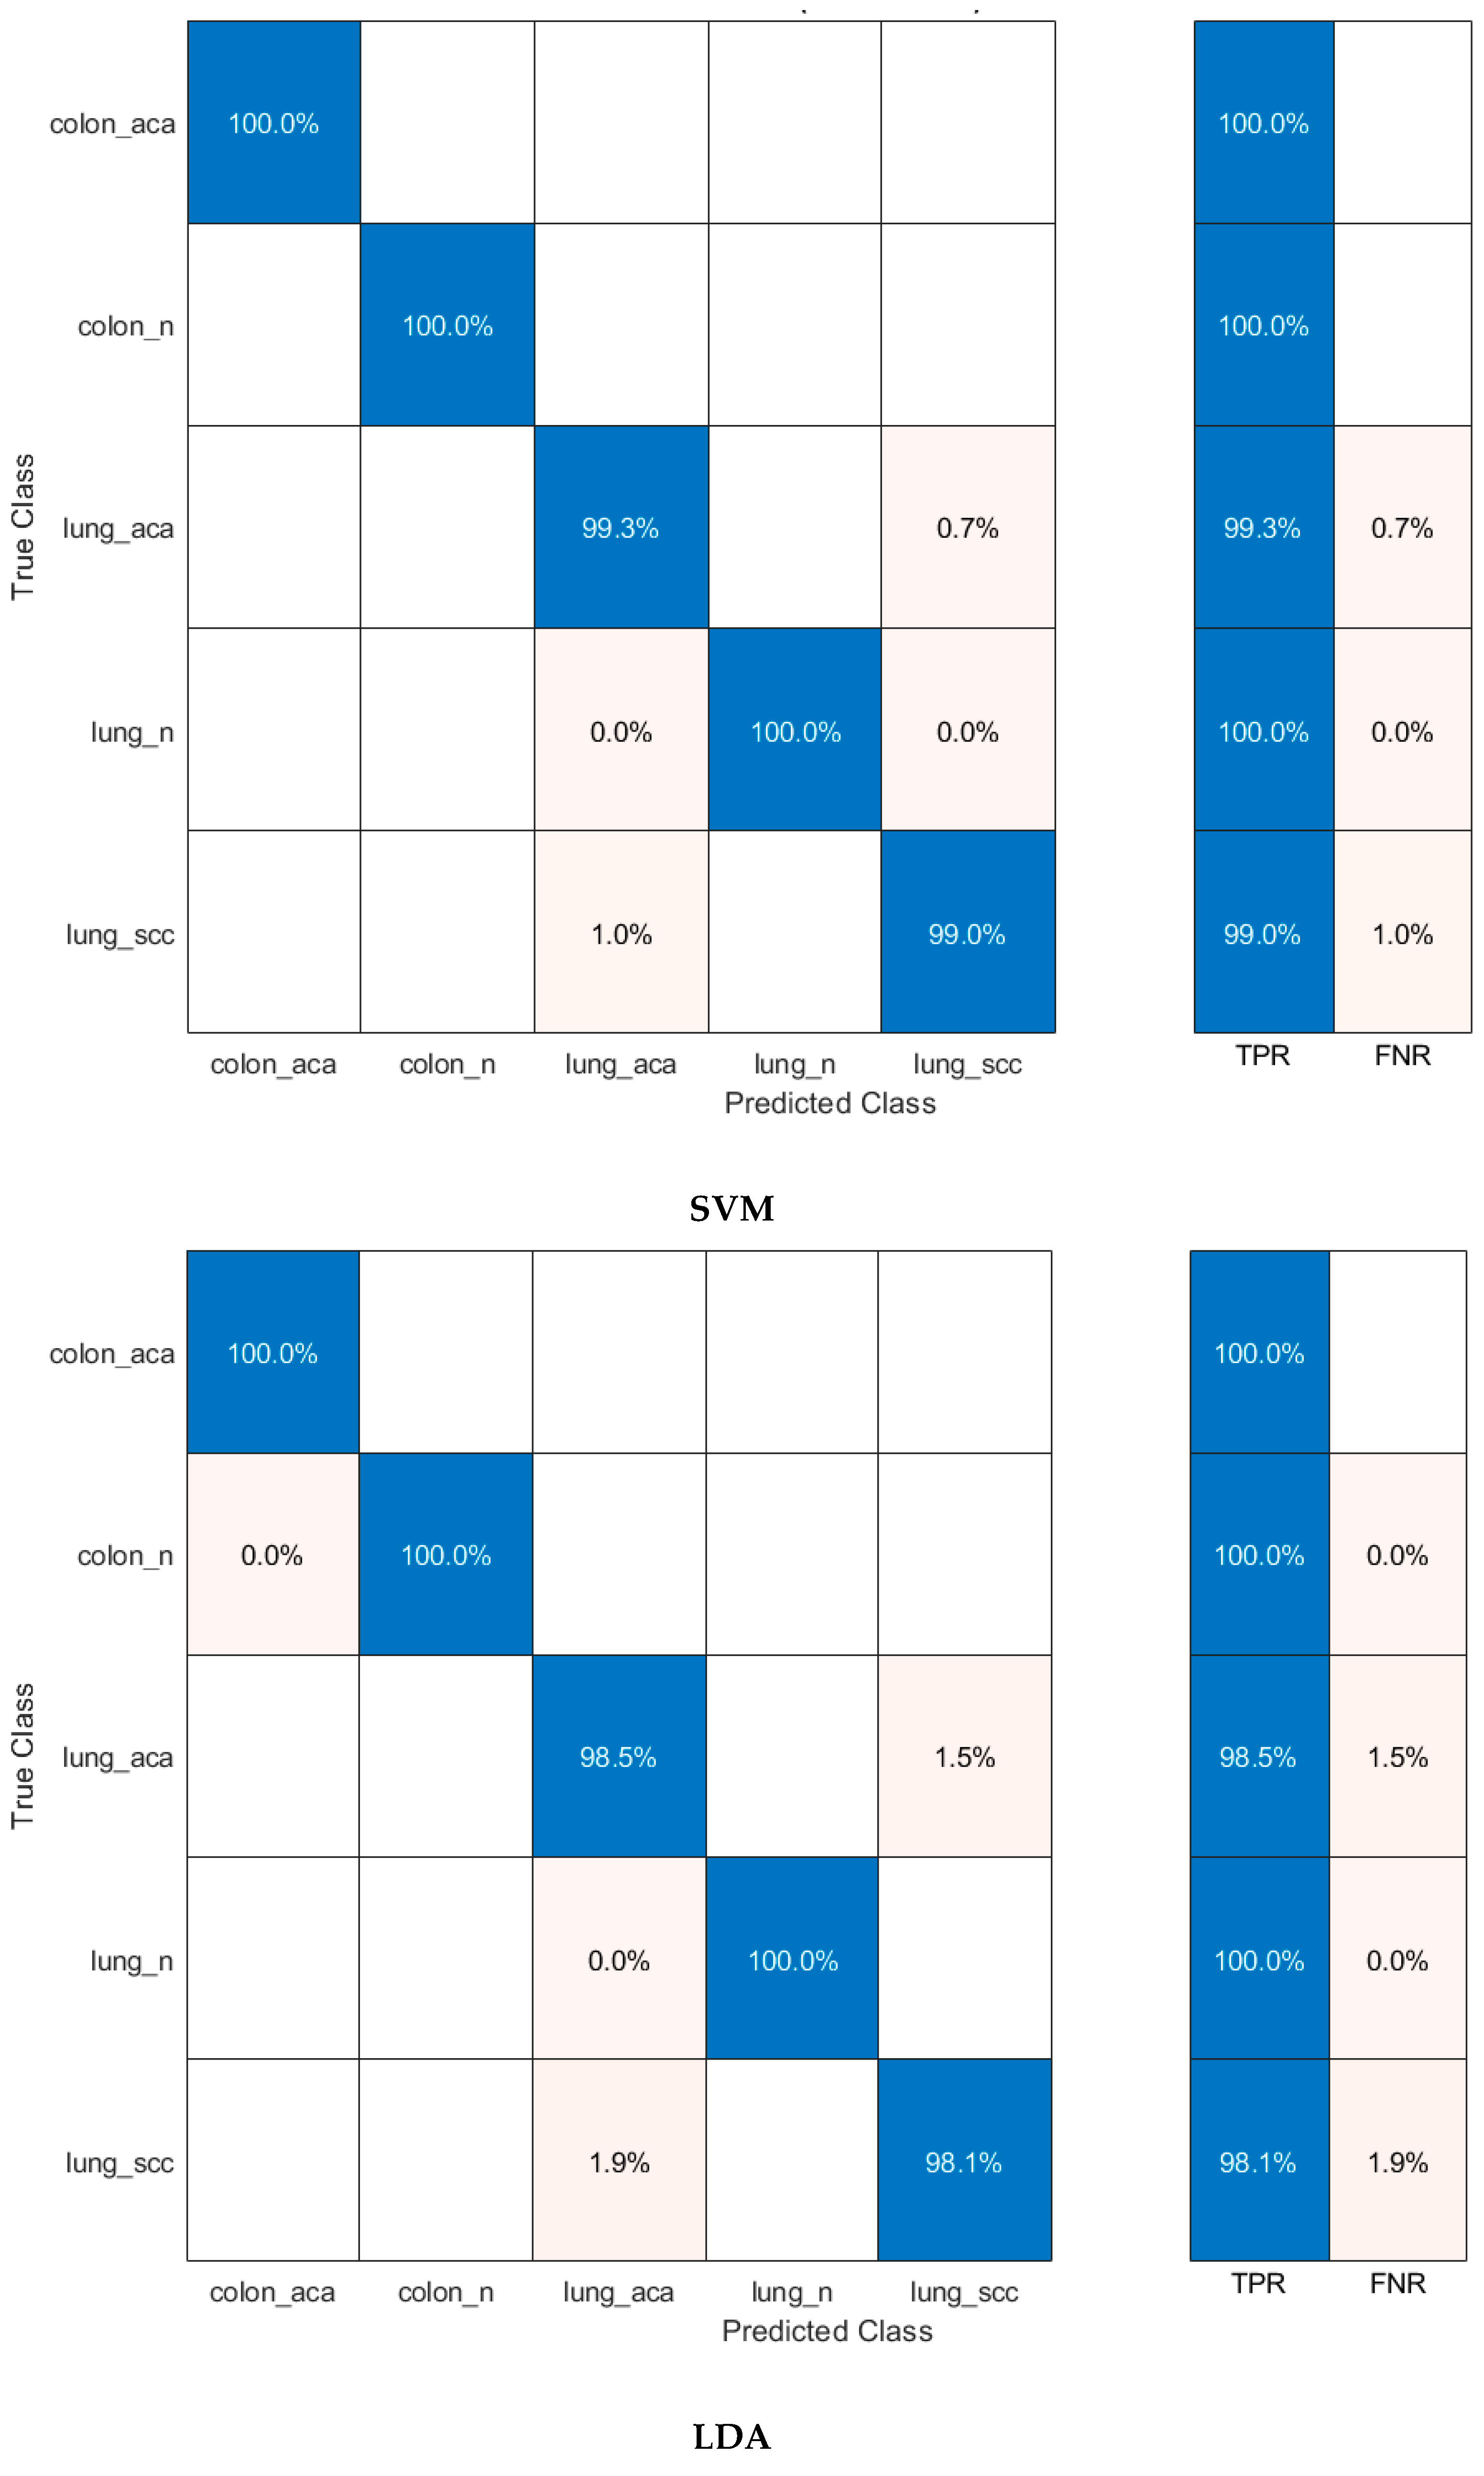
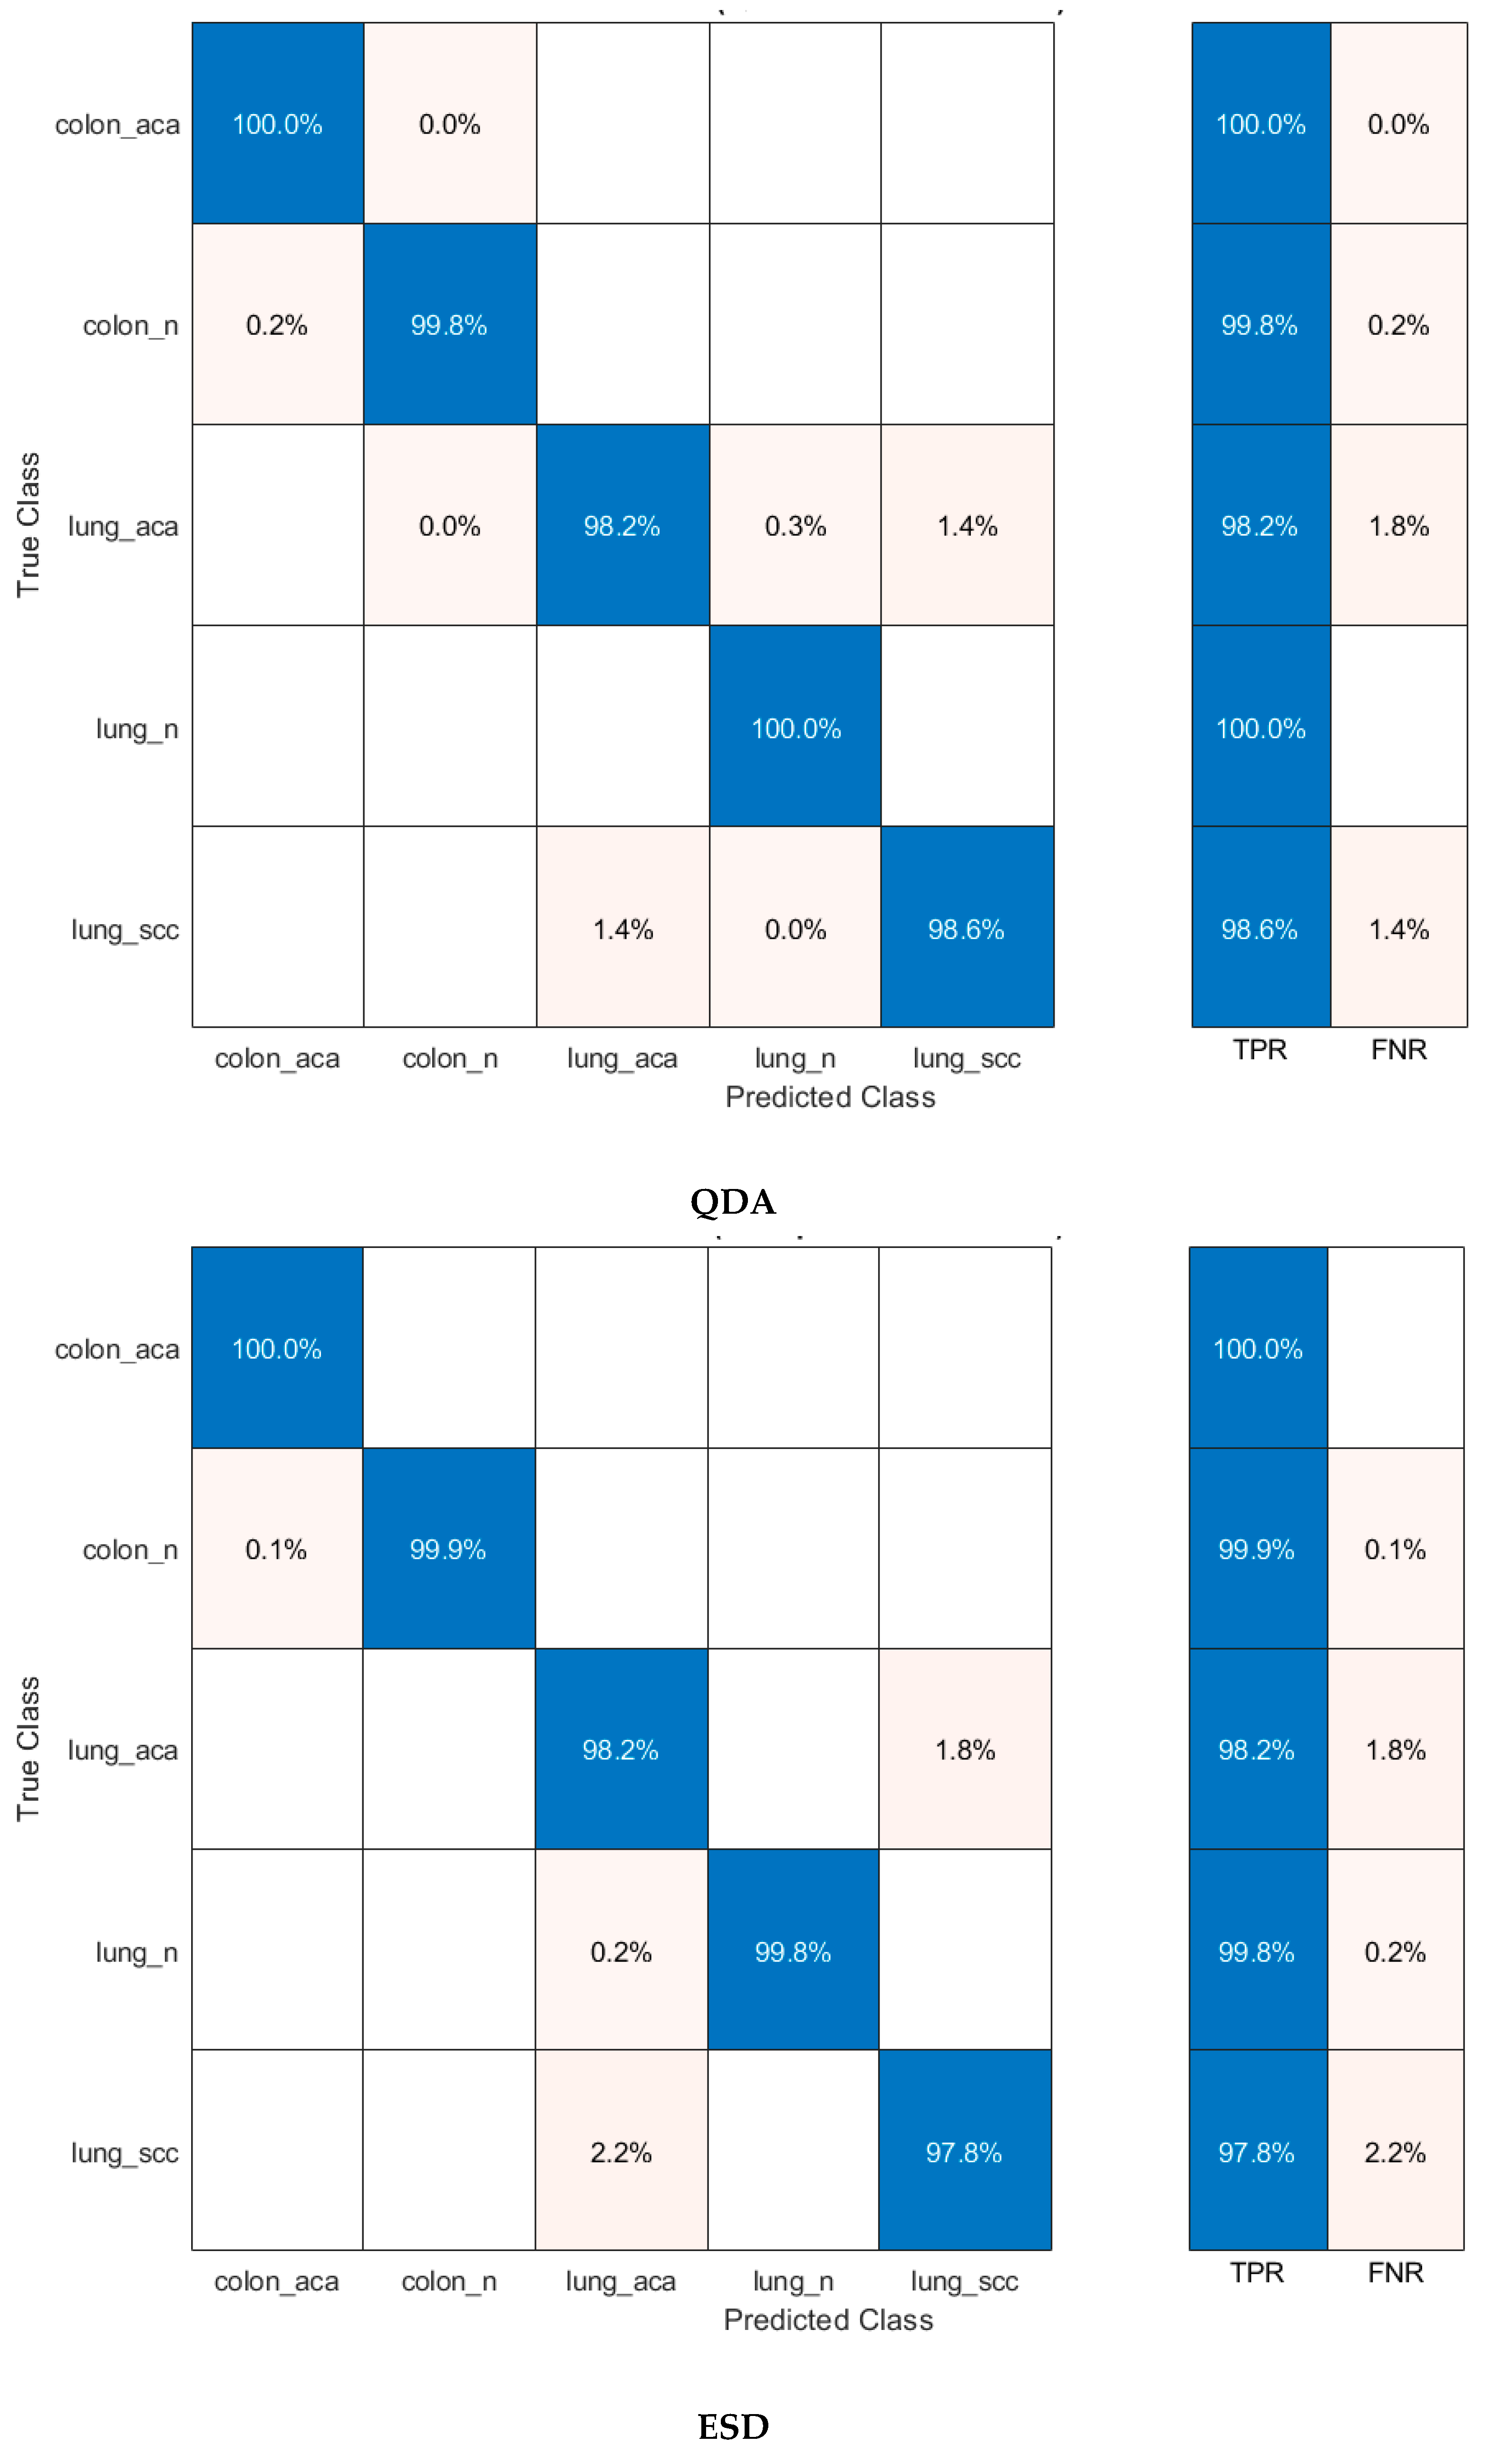
5.2. Results of FWHT
5.3. Comparison with the Literature
6. Discussion
7. Conclusions
Author Contributions
Funding
Institutional Review Board Statement
Informed Consent Statement
Data Availability Statement
Conflicts of Interest
References
- Sung, H.; Ferlay, J.; Siegel, R.L.; Laversanne, M.; Soerjomataram, I.; Jemal, A.; Bray, F. Global cancer statistics 2020: GLOBOCAN estimates of incidence and mortality worldwide for 36 cancers in 185 countries. CA Cancer J. Clin. 2021, 71, 209–249. [Google Scholar] [CrossRef] [PubMed]
- World Health Organization (WHO). Global Health Estimates: Life Expectancy and Leading Causes of Death and Disability. Available online: https://www.who.int/data/gho/data/themes/mortality-and-global-health-estimates/ghe-leading-causes-of-death (accessed on 17 October 2022).
- International Agency for Research on Cancer. Available online: https://www.iarc.who.int (accessed on 15 October 2022).
- Yadav, A.R.; Mohite, S.K. Cancer-A silent killer: An overview. Asian J. Pharm. Res. 2020, 10, 213–216. [Google Scholar] [CrossRef]
- Rl, S.; KD, M.; Jemal, A. Cancer statistics, 2020. CA Cancer J Clin 2020, 70, 7–30. [Google Scholar]
- World Health Organization (WHO). Cancer. Available online: https://www.who.int/news-room/fact-sheets/detail/cancer (accessed on 17 October 2022).
- Kurishima, K.; Miyazaki, K.; Watanabe, H.; Shiozawa, T.; Ishikawa, H.; Satoh, H.; Hizawa, N. Lung cancer patients with synchronous colon cancer. Mol. Clin. Oncol. 2018, 8, 137–140. [Google Scholar] [CrossRef] [PubMed] [Green Version]
- Kumar, N.; Sharma, M.; Singh, V.P.; Madan, C.; Mehandia, S. An empirical study of handcrafted and dense feature extraction techniques for lung and colon cancer classification from histopathological images. Biomed. Signal Process. Control 2022, 75, 103596. [Google Scholar] [CrossRef]
- Masud, M.; Sikder, N.; Nahid, A.-A.; Bairagi, A.K.; AlZain, M.A. A Machine Learning Approach to Diagnosing Lung and Colon Cancer Using a Deep Learning-Based Classification Framework. Sensors 2021, 21, 748. [Google Scholar] [CrossRef]
- ud din, N.M.; Dar, R.A.; Rasool, M.; Assad, A. Breast cancer detection using deep learning: Datasets, methods, and challenges ahead. Comput. Biol. Med. 2022, 149, 106073. [Google Scholar] [CrossRef]
- Wang, Y.; Coudray, N.; Zhao, Y.; Li, F.; Hu, C.; Zhang, Y.-Z.; Imoto, S.; Tsirigos, A.; Webb, G.I.; Daly, R.J. HEAL: An automated deep learning framework for cancer histopathology image analysis. Bioinformatics 2021, 37, 4291–4295. [Google Scholar] [CrossRef]
- Kumar, M.A.; Ram, P.G.; Suseendhar, P.; Sangeetha, R. An Efficient Cancer Detection Using Machine Learning Algorithm. NVEO-Nat. Volatiles Essent. OILS J.|NVEO 2021, 8, 6416–6425. [Google Scholar]
- Aslan, M.F.; Sabanci, K.; Ropelewska, E. A CNN-Based Solution for Breast Cancer Detection With Blood Analysis Data: Numeric to Image. In Proceedings of the 2021 29th Signal Processing and Communications Applications Conference (SIU), Istanbul, Turkey, 9–11 June 2021; pp. 1–4. [Google Scholar]
- Taspinar, Y.S.; Cinar, I.; Koklu, M. Classification by a stacking model using CNN features for COVID-19 infection diagnosis. J. X-ray Sci. Technol. 2022, 30, 73–88. [Google Scholar] [CrossRef]
- Hamida, A.B.; Devanne, M.; Weber, J.; Truntzer, C.; Derangère, V.; Ghiringhelli, F.; Forestier, G.; Wemmert, C. Deep learning for colon cancer histopathological images analysis. Comput. Biol. Med. 2021, 136, 104730. [Google Scholar] [CrossRef] [PubMed]
- Attallah, O. An effective mental stress state detection and evaluation system using minimum number of frontal brain electrodes. Diagnostics 2020, 10, 292. [Google Scholar] [CrossRef] [PubMed]
- Karthikesalingam, A.; Attallah, O.; Ma, X.; Bahia, S.S.; Thompson, L.; Vidal-Diez, A.; Choke, E.C.; Bown, M.J.; Sayers, R.D.; Thompson, M.M. An artificial neural network stratifies the risks of Reintervention and mortality after endovascular aneurysm repair; a retrospective observational study. PLoS ONE 2015, 10, e0129024. [Google Scholar] [CrossRef] [PubMed]
- Attallah, O.; Karthikesalingam, A.; Holt, P.J.; Thompson, M.M.; Sayers, R.; Bown, M.J.; Choke, E.C.; Ma, X. Using multiple classifiers for predicting the risk of endovascular aortic aneurysm repair re-intervention through hybrid feature selection. Proc. Inst. Mech. Eng. Part H J. Eng. Med. 2017, 231, 1048–1063. [Google Scholar] [CrossRef] [PubMed]
- Attallah, O.; Karthikesalingam, A.; Holt, P.J.; Thompson, M.M.; Sayers, R.; Bown, M.J.; Choke, E.C.; Ma, X. Feature selection through validation and un-censoring of endovascular repair survival data for predicting the risk of re-intervention. BMC Med. Inform. Decis. Mak. 2017, 17, 115. [Google Scholar] [CrossRef] [Green Version]
- Attallah, O.; Sharkas, M.A.; Gadelkarim, H. Fetal brain abnormality classification from MRI images of different gestational age. Brain Sci. 2019, 9, 231. [Google Scholar] [CrossRef] [Green Version]
- Ozkan, I.A.; Koklu, M. Skin lesion classification using machine learning algorithms. Int. J. Intell. Syst. Appl. Eng. 2017, 5, 285–289. [Google Scholar] [CrossRef] [Green Version]
- Aslan, M.F.; Ceylan, M.; Durdu, A. Segmentation of retinal blood vessel using gabor filter and extreme learning machines. In Proceedings of the 2018 International Conference on Artificial Intelligence and Data Processing (IDAP), Malatya, Turkey, 28–30 September 2018; pp. 1–5. [Google Scholar]
- Ayman, A.; Attalah, O.; Shaban, H. An efficient human activity recognition framework based on wearable imu wrist sensors. In Proceedings of the 2019 IEEE International Conference on Imaging Systems and Techniques (IST), Abu Dhabi, United Arab Emirates, 9–10 December 2019; pp. 1–5. [Google Scholar]
- Attallah, O.; Abougharbia, J.; Tamazin, M.; Nasser, A.A. A BCI system based on motor imagery for assisting people with motor deficiencies in the limbs. Brain Sci. 2020, 10, 864. [Google Scholar] [CrossRef]
- Aslan, M.F.; Sabanci, K.; Durdu, A. A CNN-based novel solution for determining the survival status of heart failure patients with clinical record data: Numeric to image. Biomed. Signal Process. Control 2021, 68, 102716. [Google Scholar] [CrossRef]
- Anwar, S.M.; Majid, M.; Qayyum, A.; Awais, M.; Alnowami, M.; Khan, M.K. Medical image analysis using convolutional neural networks: A review. J. Med. Syst. 2018, 42, 226. [Google Scholar] [CrossRef] [Green Version]
- Krizhevsky, A.; Sutskever, I.; Hinton, G.E. Imagenet classification with deep convolutional neural networks. Adv. Neural Inf. Processing Syst. 2012, 25, 1097–1105. [Google Scholar] [CrossRef] [Green Version]
- Iandola, F.N.; Han, S.; Moskewicz, M.W.; Ashraf, K.; Dally, W.J.; Keutzer, K. SqueezeNet: AlexNet-level accuracy with 50x fewer parameters and <0.5 MB model size. arXiv 2016, arXiv:1602.07360. [Google Scholar]
- He, K.; Zhang, X.; Ren, S.; Sun, J. Deep residual learning for image recognition. In Proceedings of the IEEE Conference on Computer Vision and Pattern Recognition, Las Vegas, NV, USA, 27–30 June 2016; pp. 770–778. [Google Scholar]
- Zhang, X.; Zhou, X.; Lin, M.; Sun, J. Shufflenet: An extremely efficient convolutional neural network for mobile devices. In Proceedings of the IEEE Conference on Computer Vision and Pattern Recognition, Salt Lake City, UT, USA, 18–22 June 2018; pp. 6848–6856. [Google Scholar]
- Simonyan, K.; Zisserman, A. Very deep convolutional networks for large-scale image recognition. arXiv 2014, arXiv:1409.1556. [Google Scholar]
- Howard, A.G.; Zhu, M.; Chen, B.; Kalenichenko, D.; Wang, W.; Weyand, T.; Andreetto, M.; Adam, H. Mobilenets: Efficient convolutional neural networks for mobile vision applications. arXiv 2017, arXiv:1704.04861. [Google Scholar]
- Szegedy, C.; Liu, W.; Jia, Y.; Sermanet, P.; Reed, S.; Anguelov, D.; Erhan, D.; Vanhoucke, V.; Rabinovich, A. Going deeper with convolutions. In Proceedings of the IEEE Conference on Computer Vision and Pattern Recognition, Boston, MA, USA, 7–12 June 2015; pp. 1–9. [Google Scholar]
- Attallah, O.; Ragab, D.A. Auto-MyIn: Automatic diagnosis of myocardial infarction via multiple GLCMs, CNNs, and SVMs. Biomed. Signal Process. Control 2023, 80, 104273. [Google Scholar] [CrossRef]
- Attallah, O. ECG-BiCoNet: An ECG-based pipeline for COVID-19 diagnosis using Bi-Layers of deep features integration. Comput. Biol. Med. 2022, 142, 105210. [Google Scholar] [CrossRef]
- Attallah, O. An Intelligent ECG-Based Tool for Diagnosing COVID-19 via Ensemble Deep Learning Techniques. Biosensors 2022, 12, 299. [Google Scholar] [CrossRef]
- Attallah, O.; Samir, A. A wavelet-based deep learning pipeline for efficient COVID-19 diagnosis via CT slices. Appl. Soft Comput. 2022, 128, 109401. [Google Scholar] [CrossRef]
- Attallah, O. A computer-aided diagnostic framework for coronavirus diagnosis using texture-based radiomics images. Digit. Health 2022, 8, 20552076221092543. [Google Scholar] [CrossRef]
- Attallah, O. Deep Learning-Based CAD System for COVID-19 Diagnosis via Spectral-Temporal Images. In Proceedings of the 12th International Conference on Information Communication and Management, London, UK, 13–15 July 2022; pp. 25–33. [Google Scholar]
- Attallah, O. CoMB-Deep: Composite Deep Learning-Based Pipeline for Classifying Childhood Medulloblastoma and Its Classes. Front. Neuroinform. 2021, 15, 663592. [Google Scholar] [CrossRef]
- Attallah, O. MB-AI-His: Histopathological diagnosis of pediatric medulloblastoma and its subtypes via AI. Diagnostics 2021, 11, 359. [Google Scholar] [CrossRef]
- Attallah, O.; Zaghlool, S. AI-Based Pipeline for Classifying Pediatric Medulloblastoma Using Histopathological and Textural Images. Life 2022, 12, 232. [Google Scholar] [CrossRef] [PubMed]
- Attallah, O.; Anwar, F.; Ghanem, N.M.; Ismail, M.A. Histo-CADx: Duo cascaded fusion stages for breast cancer diagnosis from histopathological images. PeerJ Comput. Sci. 2021, 7, e493. [Google Scholar] [CrossRef] [PubMed]
- Ghanem, N.M.; Attallah, O.; Anwar, F.; Ismail, M.A. AUTO-BREAST: A fully automated pipeline for breast cancer diagnosis using AI technology. In Artificial Intelligence in Cancer Diagnosis and Prognosis, Volume 2: Breast and bladder cancer; IOP Publishing: Bristol, UK, 2022. [Google Scholar]
- Aslan, M.F.; Celik, Y.; Sabancı, K.; Durdu, A. Breast cancer diagnosis by different machine learning methods using blood analysis data. Int. J. Intell. Syst. Appl. Eng. 2018, 6, 289–293. [Google Scholar] [CrossRef]
- Attallah, O. A deep learning-based diagnostic tool for identifying various diseases via facial images. Digit. Health 2022, 8, 20552076221124432. [Google Scholar] [CrossRef] [PubMed]
- Attallah, O. DIAROP: Automated Deep Learning-Based Diagnostic Tool for Retinopathy of Prematurity. Diagnostics 2021, 11, 2034. [Google Scholar] [CrossRef]
- Alzubaidi, L.; Zhang, J.; Humaidi, A.J.; Al-Dujaili, A.; Duan, Y.; Al-Shamma, O.; Santamaría, J.; Fadhel, M.A.; Al-Amidie, M.; Farhan, L. Review of deep learning: Concepts, CNN architectures, challenges, applications, future directions. J. Big Data 2021, 8, 53. [Google Scholar] [CrossRef]
- Xu, Q.; Zhang, M.; Gu, Z.; Pan, G. Overfitting remedy by sparsifying regularization on fully-connected layers of CNNs. Neurocomputing 2019, 328, 69–74. [Google Scholar] [CrossRef]
- Anowar, F.; Sadaoui, S.; Selim, B. Conceptual and empirical comparison of dimensionality reduction algorithms (PCA, KPCA, LDA, MDS, SVD, LLE, ISOMAP, LE, ICA, t-SNE). Comput. Sci. Rev. 2021, 40, 100378. [Google Scholar] [CrossRef]
- Naz, J.; Sharif, M.; Raza, M.; Shah, J.H.; Yasmin, M.; Kadry, S.; Vimal, S. Recognizing Gastrointestinal Malignancies on WCE and CCE Images by an Ensemble of Deep and Handcrafted Features with Entropy and PCA Based Features Optimization. Neural Process. Lett. 2021. [Google Scholar] [CrossRef]
- Garg, I.; Panda, P.; Roy, K. A Low Effort Approach to Structured CNN Design Using PCA. IEEE Access 2020, 8, 1347–1360. [Google Scholar] [CrossRef]
- Talukder, M.A.; Islam, M.M.; Uddin, M.A.; Akhter, A.; Hasan, K.F.; Moni, M.A. Machine learning-based lung and colon cancer detection using deep feature extraction and ensemble learning. Expert Syst. Appl. 2022, 205, 117695. [Google Scholar] [CrossRef]
- Mangal, S.; Chaurasia, A.; Khajanchi, A. Convolution neural networks for diagnosing colon and lung cancer histopathological images. arXiv 2020, arXiv:2009.03878. [Google Scholar]
- Hatuwal, B.K.; Thapa, H.C. Lung cancer detection using convolutional neural network on histopathological images. Int. J. Comput. Trends Technol 2020, 68, 21–24. [Google Scholar] [CrossRef]
- Ali, M.; Ali, R. Multi-input dual-stream capsule network for improved lung and colon cancer classification. Diagnostics 2021, 11, 1485. [Google Scholar] [CrossRef]
- Hasan, I.; Ali, S.; Rahman, H.; Islam, K. Automated Detection and Characterization of Colon Cancer with Deep Convolutional Neural Networks. J. Healthc. Eng. 2022, 2022, 5269913. [Google Scholar] [CrossRef]
- Bukhari, S.U.K.; Syed, A.; Bokhari, S.K.A.; Hussain, S.S.; Armaghan, S.U.; Shah, S.S.H. The histological diagnosis of colonic adenocarcinoma by applying partial self supervised learning. MedRxiv 2020. [Google Scholar] [CrossRef]
- Borkowski, A.A.; Bui, M.M.; Thomas, L.B.; Wilson, C.P.; DeLand, L.A.; Mastorides, S.M. Lung and colon cancer histopathological image dataset (lc25000). arXiv 2019, arXiv:1912.12142. [Google Scholar]
- Jha, D.; Kim, J.-I.; Choi, M.-R.; Kwon, G.-R. Pathological Brain Detection Using Weiner Filtering, 2D-Discrete Wavelet Transform, Probabilistic PCA, and Random Subspace Ensemble Classifier. Comput. Intell. Neurosci. 2017, 2017, 4205141. [Google Scholar] [CrossRef] [Green Version]
- Sabanci, K.; Aslan, M.F.; Durdu, A. Bread and durum wheat classification using wavelet based image fusion. J. Sci. Food Agric. 2020, 100, 5577–5585. [Google Scholar] [CrossRef]
- Nahiduzzaman, M.; Goni, M.O.F.; Anower, M.S.; Islam, M.R.; Ahsan, M.; Haider, J.; Gurusamy, S.; Hassan, R.; Islam, M.R. A Novel Method for Multivariant Pneumonia Classification Based on Hybrid CNN-PCA Based Feature Extraction Using Extreme Learning Machine with CXR Images. IEEE Access 2021, 9, 147512–147526. [Google Scholar] [CrossRef]
- Azam, F.; Rizvi, A.; Khan, W.Z.; Aalsalem, M.Y.; Yu, H.; Zikria, Y.B. Aircraft Classification Based on PCA and Feature Fusion Techniques in Convolutional Neural Network. IEEE Access 2021, 9, 161683–161694. [Google Scholar] [CrossRef]
- Samee, N.A.; Alhussan, A.A.; Ghoneim, V.F.; Atteia, G.; Alkanhel, R.; Al-antari, M.A.; Kadah, Y.M. A Hybrid Deep Transfer Learning of CNN-Based LR-PCA for Breast Lesion Diagnosis via Medical Breast Mammograms. Sensors 2022, 22, 4938. [Google Scholar] [CrossRef] [PubMed]
- Prabha, K.; Sam, I.S. A novel blind color image watermarking based on Walsh Hadamard Transform. Multimed. Tools Appl. 2020, 79, 6845–6869. [Google Scholar] [CrossRef]
- Meenakshi, K.; Rao, C.S.; Prasad, K.S. A robust watermarking scheme based Walsh-Hadamard transform and SVD using ZIG ZAG scanning. In Proceedings of the 2014 International Conference on Information Technology, Bhubaneswar, India, 22–24 December 2014; pp. 167–172. [Google Scholar]
- Lakshmi, P.G.G.; Domnic, S. Walsh–Hadamard Transform Kernel-Based Feature Vector for Shot Boundary Detection. IEEE Trans. Image Process. 2014, 23, 5187–5197. [Google Scholar] [CrossRef] [PubMed]
- Shorten, C.; Khoshgoftaar, T.M. A survey on image data augmentation for deep learning. J. Big Data 2019, 6, 60. [Google Scholar] [CrossRef]
- Guo, L.; Lei, Y.; Xing, S.; Yan, T.; Li, N. Deep convolutional transfer learning network: A new method for intelligent fault diagnosis of machines with unlabeled data. IEEE Trans. Ind. Electron. 2018, 66, 7316–7325. [Google Scholar] [CrossRef]
- Aslan, M.F. A robust semantic lung segmentation study for CNN-based COVID-19 diagnosis. Chemom. Intell. Lab. Syst. 2022, 231, 104695. [Google Scholar] [CrossRef]


| SqueezeNet | ||||
|---|---|---|---|---|
| Features | LDA | QDA | Linear SVM | ESD |
| PCA = 5 | 93.4 | 96.6 | 97.2 | 93.0 |
| PCA = 10 | 96.0 | 96.7 | 97.7 | 94.5 |
| PCA = 15 | 97.5 | 96.7 | 98.1 | 96.8 |
| PCA = 20 | 97.5 | 96.4 | 98.1 | 96.7 |
| PCA = 25 | 97.5 | 96.1 | 98.1 | 96.9 |
| PCA = 30 | 97.6 | 96.0 | 98.1 | 96.9 |
| ShuffleNet | ||||
| PCA = 5 | 92.8 | 96.8 | 97.4 | 91.7 |
| PCA = 10 | 95.4 | 97.7 | 98.2 | 93.4 |
| PCA = 15 | 96.4 | 97.8 | 98.5 | 94.8 |
| PCA = 20 | 97.1 | 97.8 | 98.7 | 95.5 |
| PCA = 25 | 97.1 | 97.8 | 98.7 | 95.5 |
| PCA = 30 | 97.7 | 97.9 | 98.8 | 96.6 |
| MobileNet | ||||
| PCA = 5 | 97.4 | 98.5 | 98.7 | 97.5 |
| PCA = 10 | 98.1 | 98.6 | 99.0 | 97.9 |
| PCA = 15 | 97.9 | 98.7 | 99.1 | 97.8 |
| PCA = 20 | 98.3 | 98.8 | 99.1 | 98.1 |
| PCA = 25 | 98.3 | 98.9 | 99.2 | 98.1 |
| PCA = 30 | 98.4 | 98.9 | 99.2 | 98.3 |
| Model | Sensitivity | Specificity | Precision | F1-Score | MCC |
|---|---|---|---|---|---|
| LDA | 0.991 | 0.998 | 0.991 | 0.991 | 0.988 |
| QDA | 0.991 | 0.998 | 0.991 | 0.991 | 0.989 |
| Linear SVM | 0.996 | 0.999 | 0.996 | 0.996 | 0.994 |
| ESD | 0.989 | 0.997 | 0.990 | 0.989 | 0.987 |
| SqueezeNet | ||||
|---|---|---|---|---|
| Features | LDA | QDA | Linear SVM | ESD |
| 50 | 97.7 | 95.3 | 98.0 | 97.6 |
| 40 | 97.8 | 96.5 | 98.1 | 97.6 |
| 30 | 97.8 | 96.9 | 98.1 | 97.6 |
| 20 | 97.8 | 97.5 | 98.2 | 97.6 |
| 10 | 97.8 | 97.7 | 98.2 | 97.6 |
| ShuffleNet | ||||
| 500 | 98.4 | 93.3 | 99.0 | 98.3 |
| 400 | 98.2 | 92.9 | 99.0 | 98.1 |
| 300 | 97.8 | 92.4 | 98.8 | 97.8 |
| 200 | 97.4 | 91.3 | 98.6 | 97.2 |
| 100 | 94.4 | 89.2 | 97.3 | 94.1 |
| MobileNet | ||||
| 500 | 98.7 | 97.1 | 99.2 | 98.7 |
| 400 | 98.5 | 97.0 | 99.2 | 98.5 |
| 300 | 98.4 | 96.8 | 99.1 | 98.3 |
| 200 | 97.8 | 96.2 | 98.8 | 97.8 |
| 100 | 96.8 | 94.3 | 98.1 | 96.7 |
| Model | Sensitivity | Specificity | Precision | F1-Score | MCC |
|---|---|---|---|---|---|
| LDA | 0.993 | 0.998 | 0.993 | 0.993 | 0.991 |
| QDA | 0.993 | 0.998 | 0.993 | 0.993 | 0.991 |
| Linear SVM | 0.996 | 0.999 | 0.996 | 0.996 | 0.995 |
| ESD | 0.992 | 0.997 | 0.992 | 0.992 | 0.989 |
| Authors | Method | Accuracy (%) |
|---|---|---|
| Masud, Sikder, Nahid, Bairagi, and AlZain [9] | CNN + 2D Fourier transform and 2D wavelet transform | 96.33 |
| Hasan, Ali, Rahman, and Islam [57] | CNN + PCA | 99.80 |
| Kumar, Sharma, Singh, Madan, and Mehandia [8] | DenseNet121 + Random Forest | 98.60 |
| Talukder, Islam, Uddin, Akhter, Hasan, and Moni [53] | Deep feature extraction + Ensemble learning | 99.05 |
| Bukhari, Syed, Bokhari, Hussain, Armaghan, and Shah [58] | ResNet50 | 93.13 |
| Mangal, Chaurasia, and Khajanchi [54] | CNN | 97.00 |
| Hatuwal and Thapa [55] | CNN | 97.20 |
| Ali and Ali [56] | Capsule network model | 99.58 |
| Proposed method | PCA + CNN + SVM | 99.5 |
| FHWT + CNN + SVM | 99.6 |
Publisher’s Note: MDPI stays neutral with regard to jurisdictional claims in published maps and institutional affiliations. |
© 2022 by the authors. Licensee MDPI, Basel, Switzerland. This article is an open access article distributed under the terms and conditions of the Creative Commons Attribution (CC BY) license (https://creativecommons.org/licenses/by/4.0/).
Share and Cite
Attallah, O.; Aslan, M.F.; Sabanci, K. A Framework for Lung and Colon Cancer Diagnosis via Lightweight Deep Learning Models and Transformation Methods. Diagnostics 2022, 12, 2926. https://doi.org/10.3390/diagnostics12122926
Attallah O, Aslan MF, Sabanci K. A Framework for Lung and Colon Cancer Diagnosis via Lightweight Deep Learning Models and Transformation Methods. Diagnostics. 2022; 12(12):2926. https://doi.org/10.3390/diagnostics12122926
Chicago/Turabian StyleAttallah, Omneya, Muhammet Fatih Aslan, and Kadir Sabanci. 2022. "A Framework for Lung and Colon Cancer Diagnosis via Lightweight Deep Learning Models and Transformation Methods" Diagnostics 12, no. 12: 2926. https://doi.org/10.3390/diagnostics12122926