

Evaluating the Performance of Deep Learning Frameworks for Malaria Parasite Detection Using Microscopic Images of Peripheral Blood Smears
 ,
,
Abstract
:1. Introduction
2. Materials and Methods
2.1. Data
2.2. Data Preprocessing
2.3. Deep Learning
2.4. Transfer Learning
2.4.1. VGG16
2.4.2. ResNet50
2.4.3. InceptionV3
2.5. Evaluation Metrics
2.5.1. Accuracy
2.5.2. Precision
2.5.3. Sensitivity
2.5.4. F1 Score
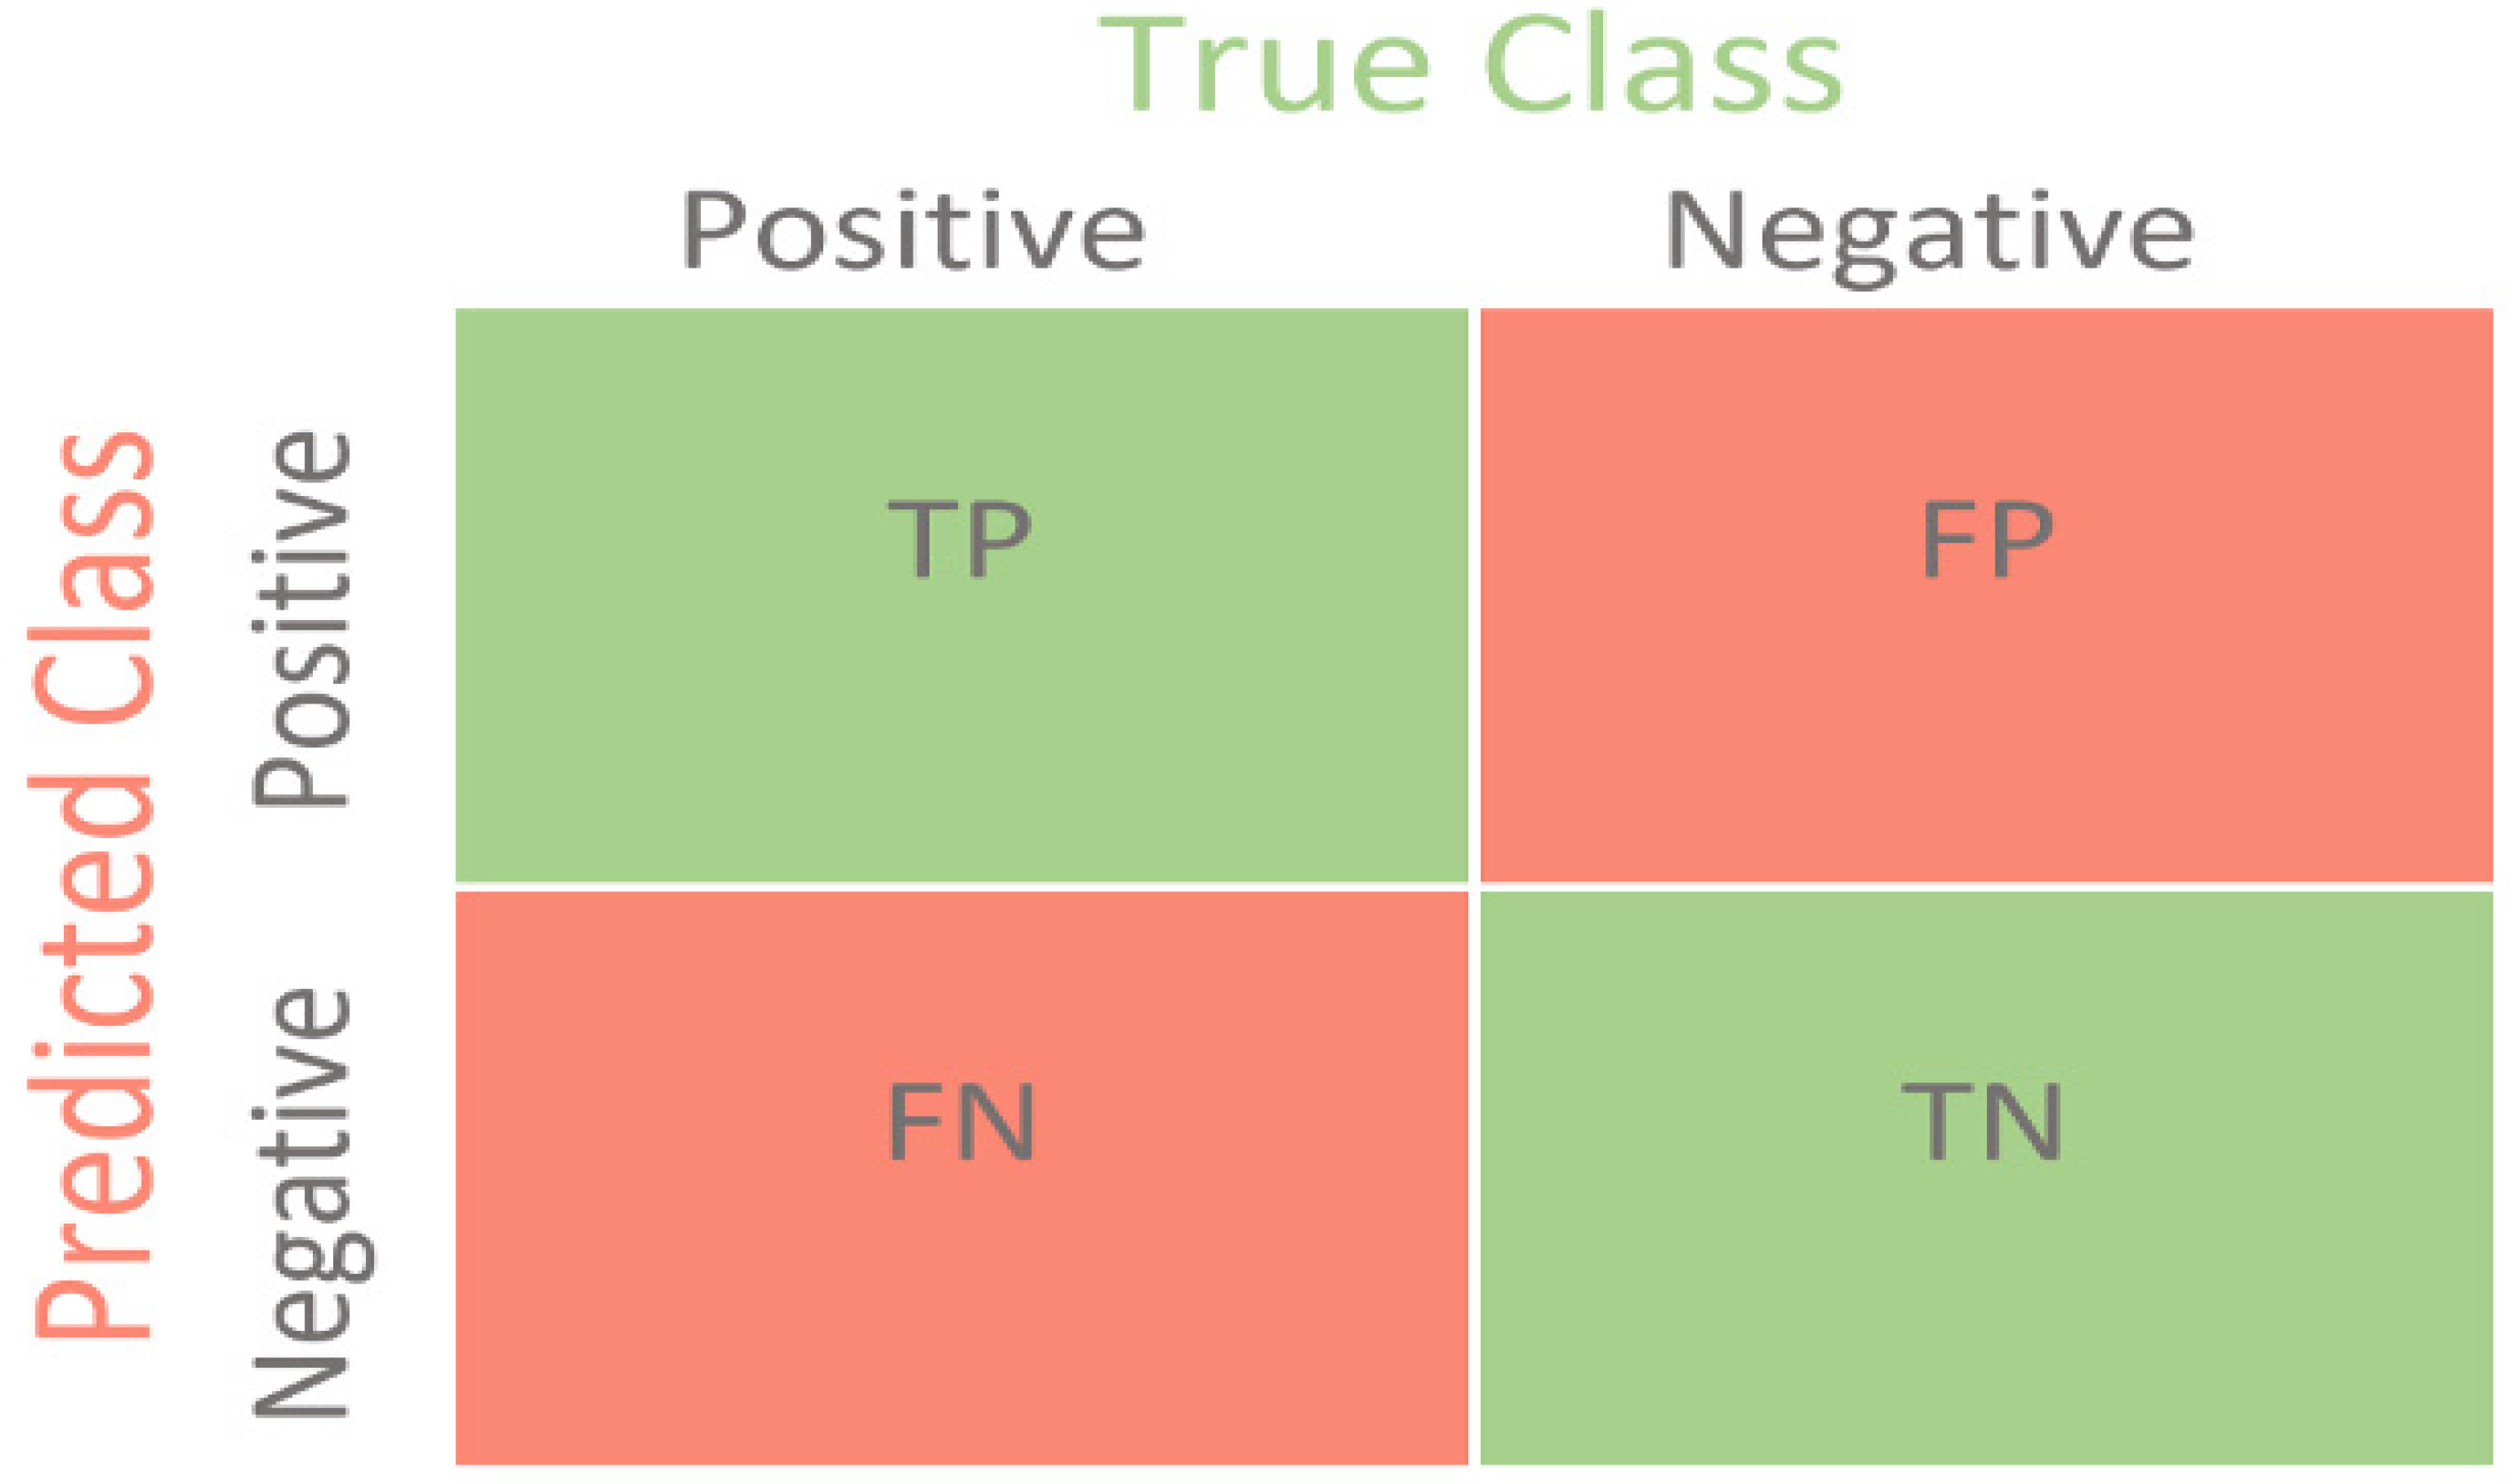
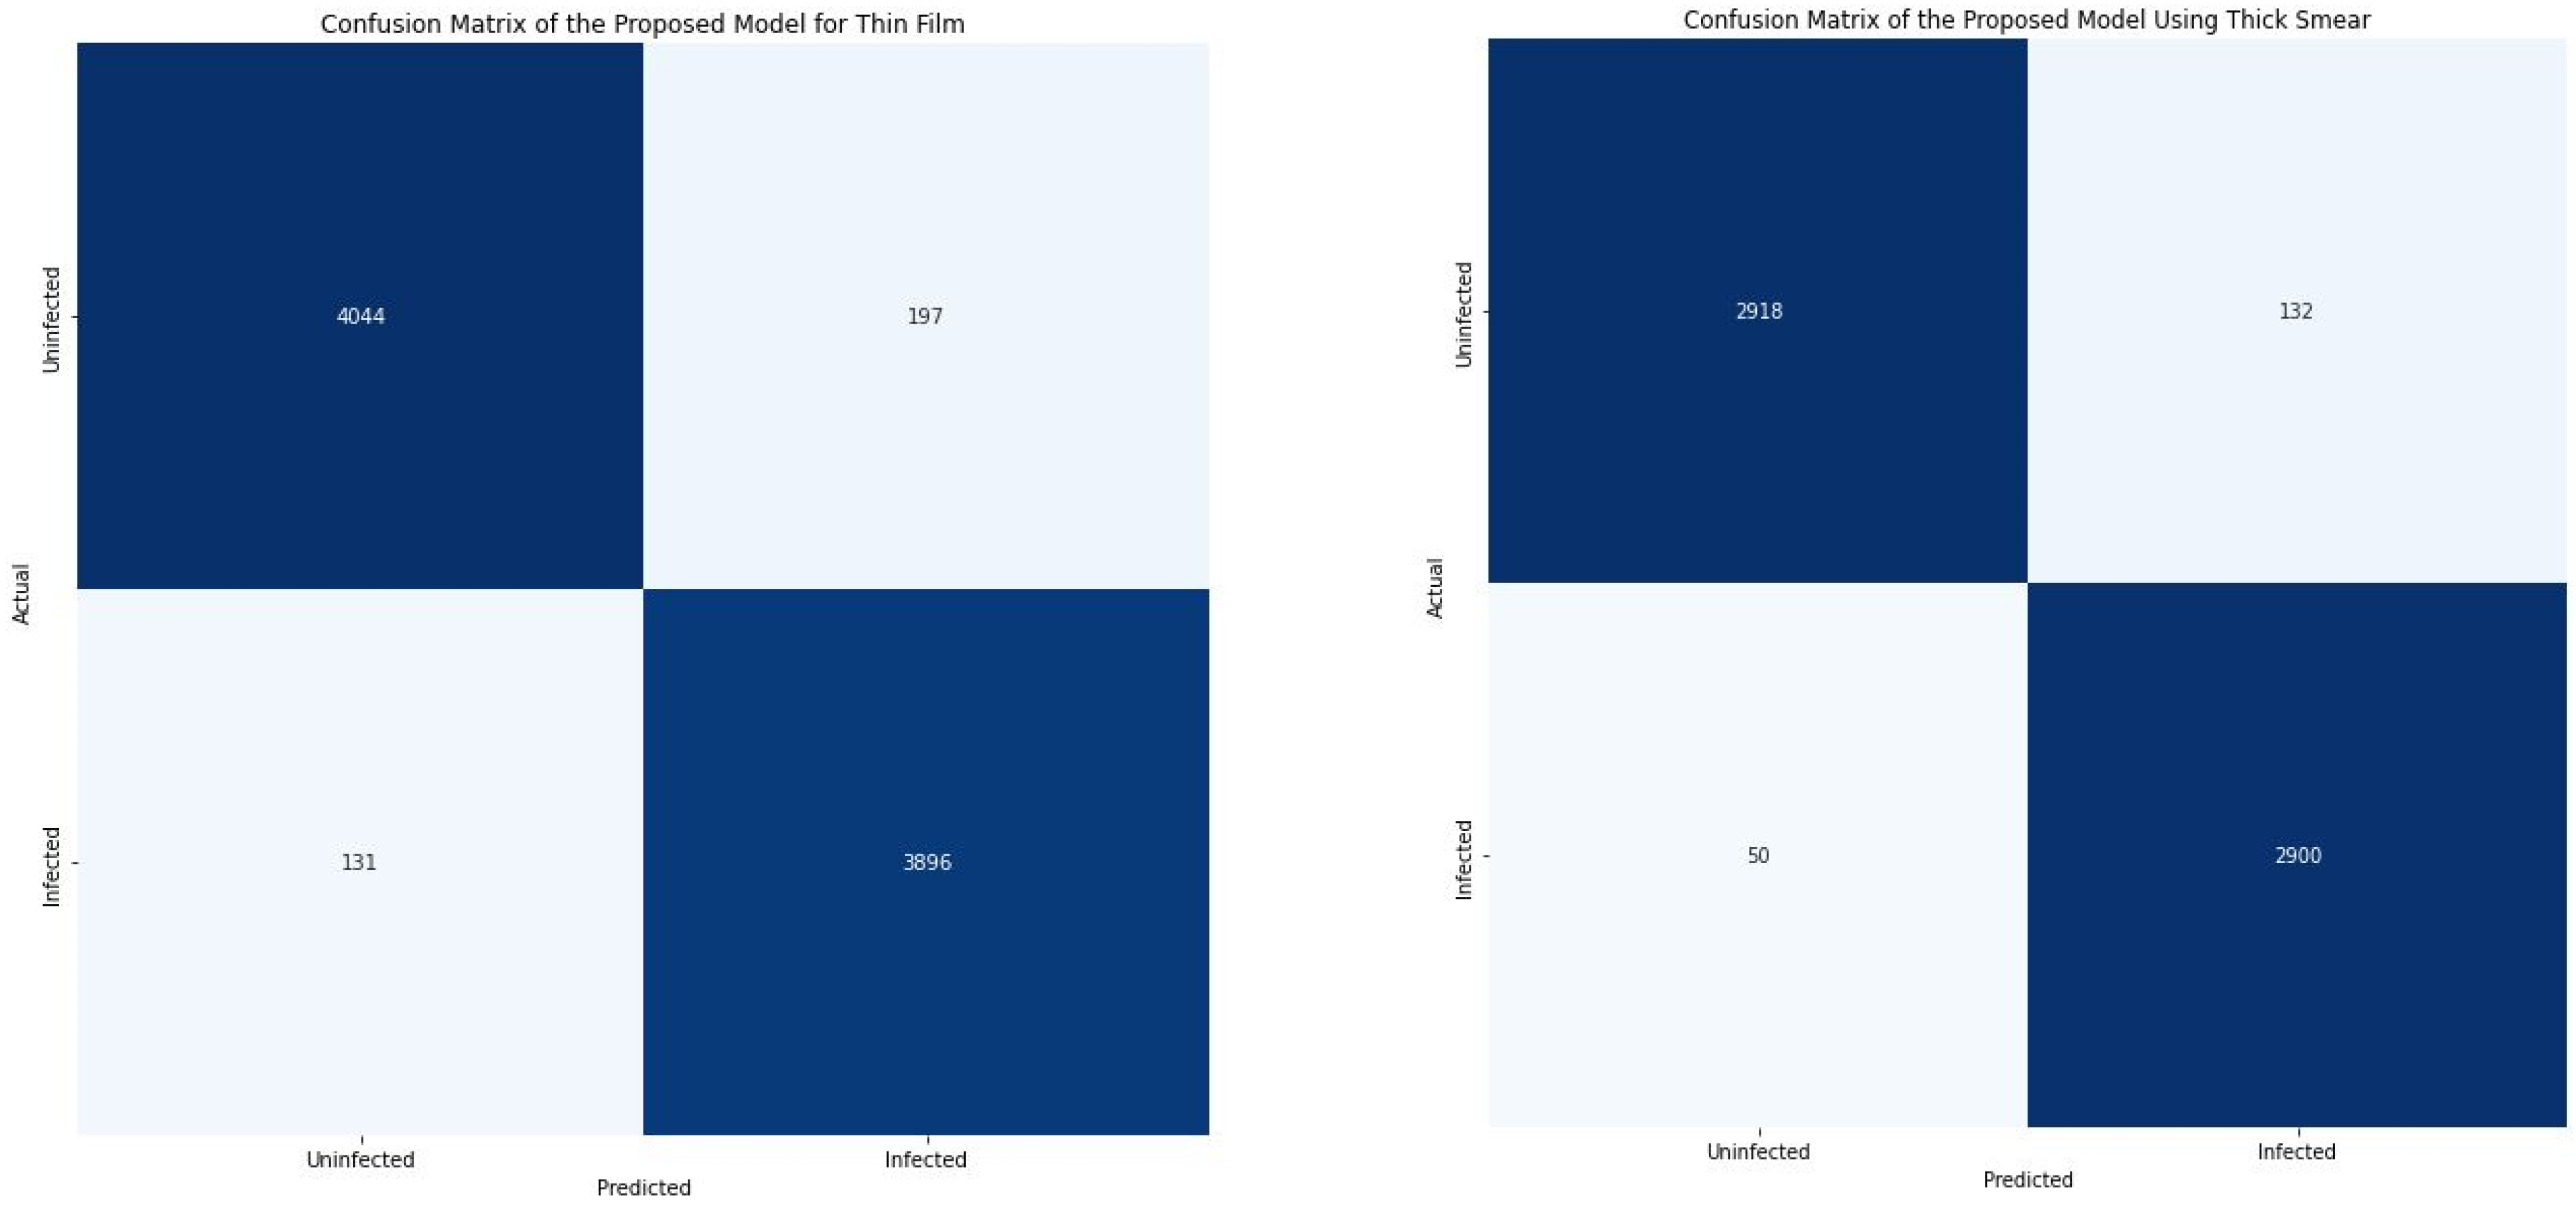
2.5.5. Confusion Matrix
- True Negative (TN): It refers to the number of times the model correctly classifies the infected images as infected.
- True Negative (TN): It refers to the number of times the model correctly classifies the uninfected images as uninfected.
- False Positive (FP): It refers to the number of times the model incorrectly classifies the uninfected images as infected.
- False Negative (FN): It refers to the number of times the model incorrectly classifies the infected images as uninfected.
2.6. Model Training and Validation
3. Results and Discussion
4. Conclusions
Author Contributions
Funding
Data Availability Statement
Conflicts of Interest
References
- Biology. 2022. Available online: https://www.cdc.gov/ (accessed on 14 October 2022).
- Malaria. Available online: https://www.who.int/health-topics/malaria (accessed on 14 October 2022).
- The Disease What Is Malaria? Available online: https://www.cdc.gov/malaria/about/faqs.html (accessed on 14 October 2022).
- Poostchi, M.; Silamut, K.; Maude, R.; Jaeger, S.; Thoma, G. Image Analysis And Machine Learning for Detecting Malaria. Transl. Res. 2018, 194, 36–55. [Google Scholar] [CrossRef] [PubMed] [Green Version]
- Orish, V.; Boakye-Yiadom, E.; Ansah, E.K.; Alhassan, R.K.; Duedu, K.; Awuku, Y.A.; Owusu-Agyei, S.; Gyapong, J.O. Is Malaria Immunity a Possible Protection against Severe Symptoms and Outcomes of COVID-19? Ghana Med. J. 2021, 55, 56–63. [Google Scholar] [CrossRef] [PubMed]
- White, N. Antimalarial Drug Resistance. J. Clin. Investig. 2004, 113, 1084–1092. [Google Scholar] [CrossRef] [PubMed]
- Maqsood, A.; Farid, M.; Khan, M.; Grzegorzek, M. Deep Malaria Parasite Detection in Thin Blood Smear Microscopic Images. Appl. Sci. 2021, 11, 2284. [Google Scholar] [CrossRef]
- Yang, F.; Poostchi, M.; Yu, H.; Zhou, Z.; Silamut, K.; Yu, J.; Maude, R.; Jaeger, S.; Antani, S. Deep Learning for Smartphone-Based Malaria Parasite Detection in Thick Blood Smears. IEEE J. Biomed. Health Inform. 2020, 24, 1427–1438. [Google Scholar] [CrossRef] [PubMed]
- WHO Calls for Reinvigorated Action to Fight Malaria. Available online: https://www.who.int/news/item/30-11-2020-who-calls-for-reinvigorated-action-to-fight-malaria (accessed on 14 October 2022).
- The “World Malaria Report 2019” at a Glance. Available online: https://www.who.int/news-room/feature-stories/detail/world-malaria-report-2019 (accessed on 14 October 2022).
- Kassim, Y.; Yang, F.; Yu, H.; Maude, R.; Jaeger, S. Diagnosing Malaria Patients with Plasmodium Falciparum and Vivax Using Deep Learning for Thick Smear Images. Diagnostics 2021, 11, 1994. [Google Scholar] [CrossRef] [PubMed]
- Dye-Braumuller, K.; Kanyangarara, M. Malaria in The USA: How Vulnerable Are We to Future Outbreaks? Curr. Trop. Med. Rep. 2021, 8, 43–51. [Google Scholar] [CrossRef] [PubMed]
- Boualam, M.; Pradines, B.; Drancourt, M.; Barbieri, R. Malaria in Europe: A Historical Perspective. Front. Med. 2021, 8, 691095. [Google Scholar] [CrossRef] [PubMed]
- Roser, M.; Ritchie, H. Malaria. Available online: https://ourworldindata.org/malaria (accessed on 14 October 2022).
- Ozsahin, I.; Sekeroglu, B.; Musa, M.; Mustapha, M.; Uzun Ozsahin, D. Review on Diagnosis of COVID-19 from Chest CT Images Using Artificial Intelligence. Comput. Math. Methods Med. 2020, 2020, 9756518. [Google Scholar] [CrossRef] [PubMed]
- Rajaraman, S.; Silamut, K.; Hossain, M.; Ersoy, I.; Maude, R.; Jaeger, S.; Thoma, G.; Antani, S. Understanding the Learned Behavior of Customized Convolutional Neural Networks toward Malaria Parasite Detection in Thin Blood Smear Images. J. Med. Imaging 2018, 5, 034501. [Google Scholar] [CrossRef] [PubMed]
- Rajaraman, S.; Antani, S.; Poostchi, M.; Silamut, K.; Hossain, M.; Maude, R.; Jaeger, S.; Thoma, G. Pre-Trained Convolutional Neural Networks as Feature Extractors toward Improved Malaria Parasite Detection in Thin Blood Smear Images. PeerJ 2018, 6, e4568. [Google Scholar] [CrossRef] [PubMed] [Green Version]
- Kassim, Y.; Palaniappan, K.; Yang, F.; Poostchi, M.; Palaniappan, N.; Maude, R.; Antani, S.; Jaeger, S. Clustering-Based Dual Deep Learning Architecture for Detecting Red Blood Cells in Malaria Diagnostic Smears. IEEE J. Biomed. Health Inform. 2021, 25, 1735–1746. [Google Scholar] [CrossRef] [PubMed]
- NLM. Available online: https://lhncbc.nlm.nih.gov/LHC-research/LHC-projects/image-processing/malaria-datasheet.html (accessed on 14 October 2022).
- Zhang, C.; Jiang, H.; Jiang, H.; Xi, H.; Chen, B.; Liu, Y.; Juhas, M.; Li, J.; Zhang, Y. Deep Learning for Microscopic Examination of Protozoan Parasites. Comput. Struct. Biotechnol. J. 2022, 20, 1036–1043. [Google Scholar] [CrossRef] [PubMed]
- Ozsahin, D.; Taiwo Mustapha, M.; Mubarak, A.; Said Ameen, Z.; Uzun, B. Impact of Feature Scaling on Machine Learning Models for The Diagnosis of Diabetes. In Proceedings of the 2022 International Conference on Artificial Intelligence in Everything (AIE), Lefkosa, Cyprus, 2–4 August 2022. [Google Scholar]
- Uzun Ozsahin, D.; Taiwo Mustapha, M.; Saleh Mubarak, A.; Said Ameen, Z.; Uzun, B. Impact of Outliers and Dimensionality Reduction on the Performance of Predictive Models for Medical Disease Diagnosis. In Proceedings of the 2022 International Conference on Artificial Intelligence in Everything (AIE), Lefkosa, Cyprus, 2–4 August 2022. [Google Scholar]
- Kumar, V. Convolutional Neural Networks. Available online: https://towardsdatascience.com/convolutional-neural-networks-f62dd896a856 (accessed on 14 October 2022).
- Yamashita, R.; Nishio, M.; Do, R.; Togashi, K. Convolutional Neural Networks: An Overview and Application in Radiology. Insights Imaging 2018, 9, 611–629. [Google Scholar] [CrossRef] [PubMed] [Green Version]
- Dubey, S.; Singh, S.; Chaudhuri, B. Activation Functions in Deep Learning: A Comprehensive Survey and Benchmark. Neurocomputing 2022, 503, 92–108. [Google Scholar] [CrossRef]
- Huilgol, P. Top 4 Pre-Trained Models for Image Classification|with Python Code. Available online: https://www.analyticsvidhya.com/blog/2020/08/top-4-pre-trained-models-for-image-classification-with-python-code/ (accessed on 14 October 2022).
- Feng, V. An Overview of ResNet and Its Variants. Available online: https://towardsdatascience.com/an-overview-of-resnet-and-its-variants-5281e2f56035 (accessed on 14 October 2022).
- Kurama, V. A Guide to ResNet, Inception v3, and SqueezeNet|Paperspace Blog. Available online: https://blog.paperspace.com/popular-deep-learning-architectures-resnet-inceptionv3-squeezenet/ (accessed on 14 October 2022).
- Mustapha, M.; Ozsahin, D.; Ozsahin, I.; Uzun, B. Breast Cancer Screening Based on Supervised Learning and Multi-Criteria Decision-Making. Diagnostics 2022, 12, 1326. [Google Scholar] [CrossRef] [PubMed]
- Mohajon, J. Confusion Matrix for Your Multi-Class Machine Learning Model. Available online: https://towardsdatascience.com/confusion-matrix-for-your-multi-class-machine-learning-model-ff9aa3bf7826 (accessed on 14 October 2022).


| Thin Smear | Thick Smear | |
|---|---|---|
| P. falciparum patients | 148 | 150 |
| P. vivax patients | 171 | 150 |
| Uninfected patients | 45 | 50 |
| Hardware/Software/Libraries | Setting | |
|---|---|---|
| 1 | Windows | Windows 10 Pro |
| 2 | Random access memory (RAM) | 64.0 GB |
| 3 | Graphics processing unit (GPU) | NVIDIA GeForce RTX 3070 |
| 4 | Operating system | 64 bit operating system x64-based processor. |
| 5 | Processor | 11th Gen Intel (R) Core (TM) i7-11700KF @3.60GHz 3.60 GHz. |
| 6 | Storage Space: | 1 TB*1 |
| 7 | Programming language | Python |
| 8 | Frameworks/Libraries | TensorFlow, Keras, NumPy, Pandas, Pathlib, matplotlib, seaborn, and SkLearn |
| Precision % | Sensitivity % | F1 Score % | Accuracy % | |||||
|---|---|---|---|---|---|---|---|---|
| Thin Smear | Thick Smear | Thin Smear | Thick Smear | Thin Smear | Thick Smear | Thin Smear | Thick Smear | |
| Infected | 95.00% | 96.00% | 97.00% | 98.00% | 96.00% | 97.00% | 96.03% | 96.97% |
| Uninfected | 97.00% | 98.00% | 95.00% | 96.00% | 96.00% | 97.00% | ||
| Weighted Average | 96.00% | 97.00% | 96.00% | 97.00% | 96.00% | 97.00% | ||
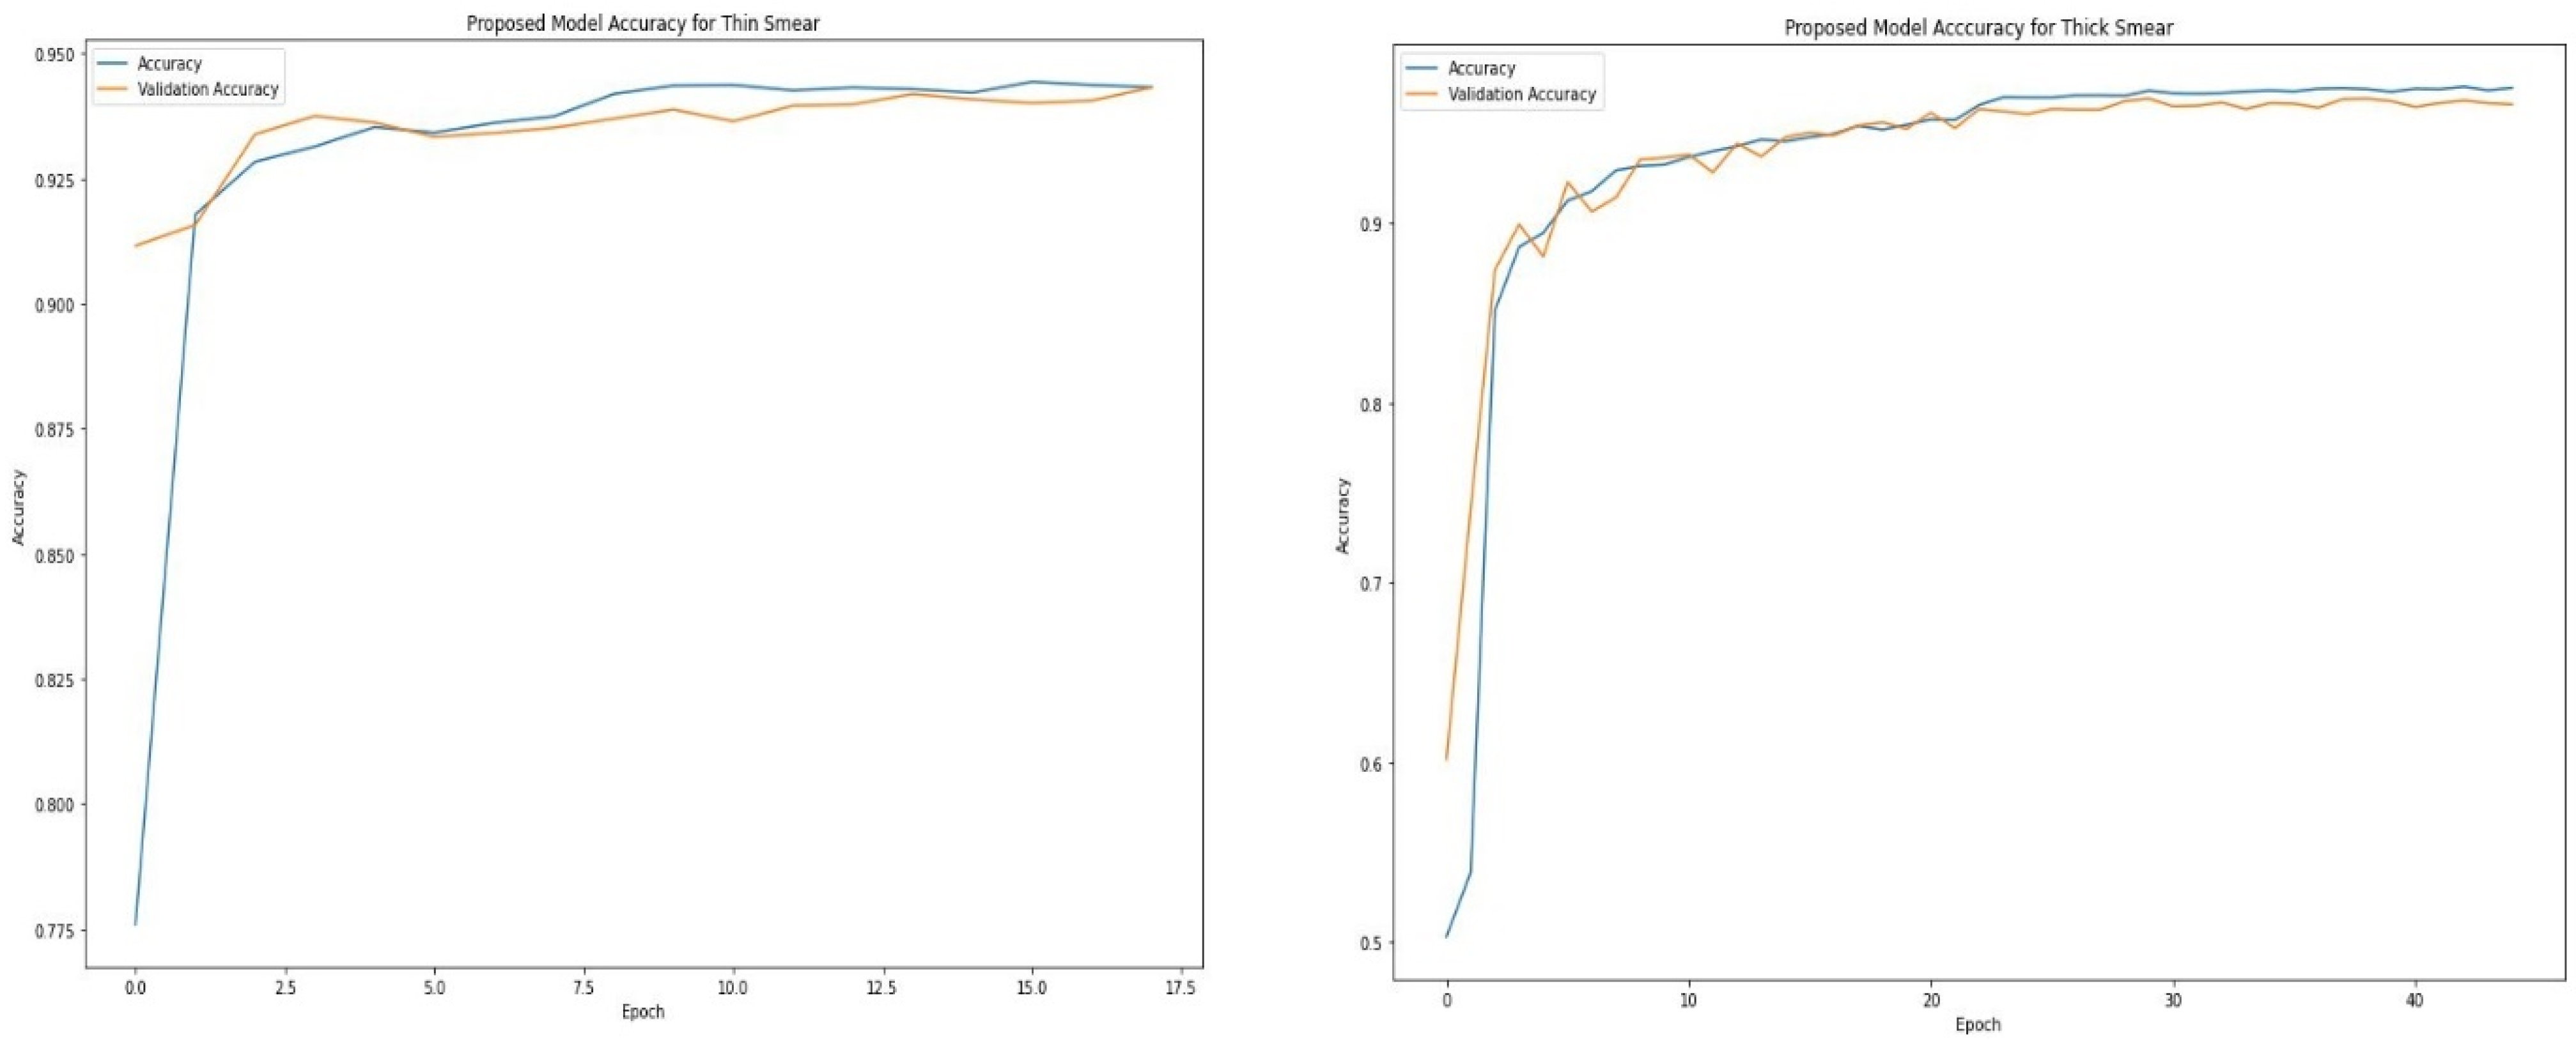
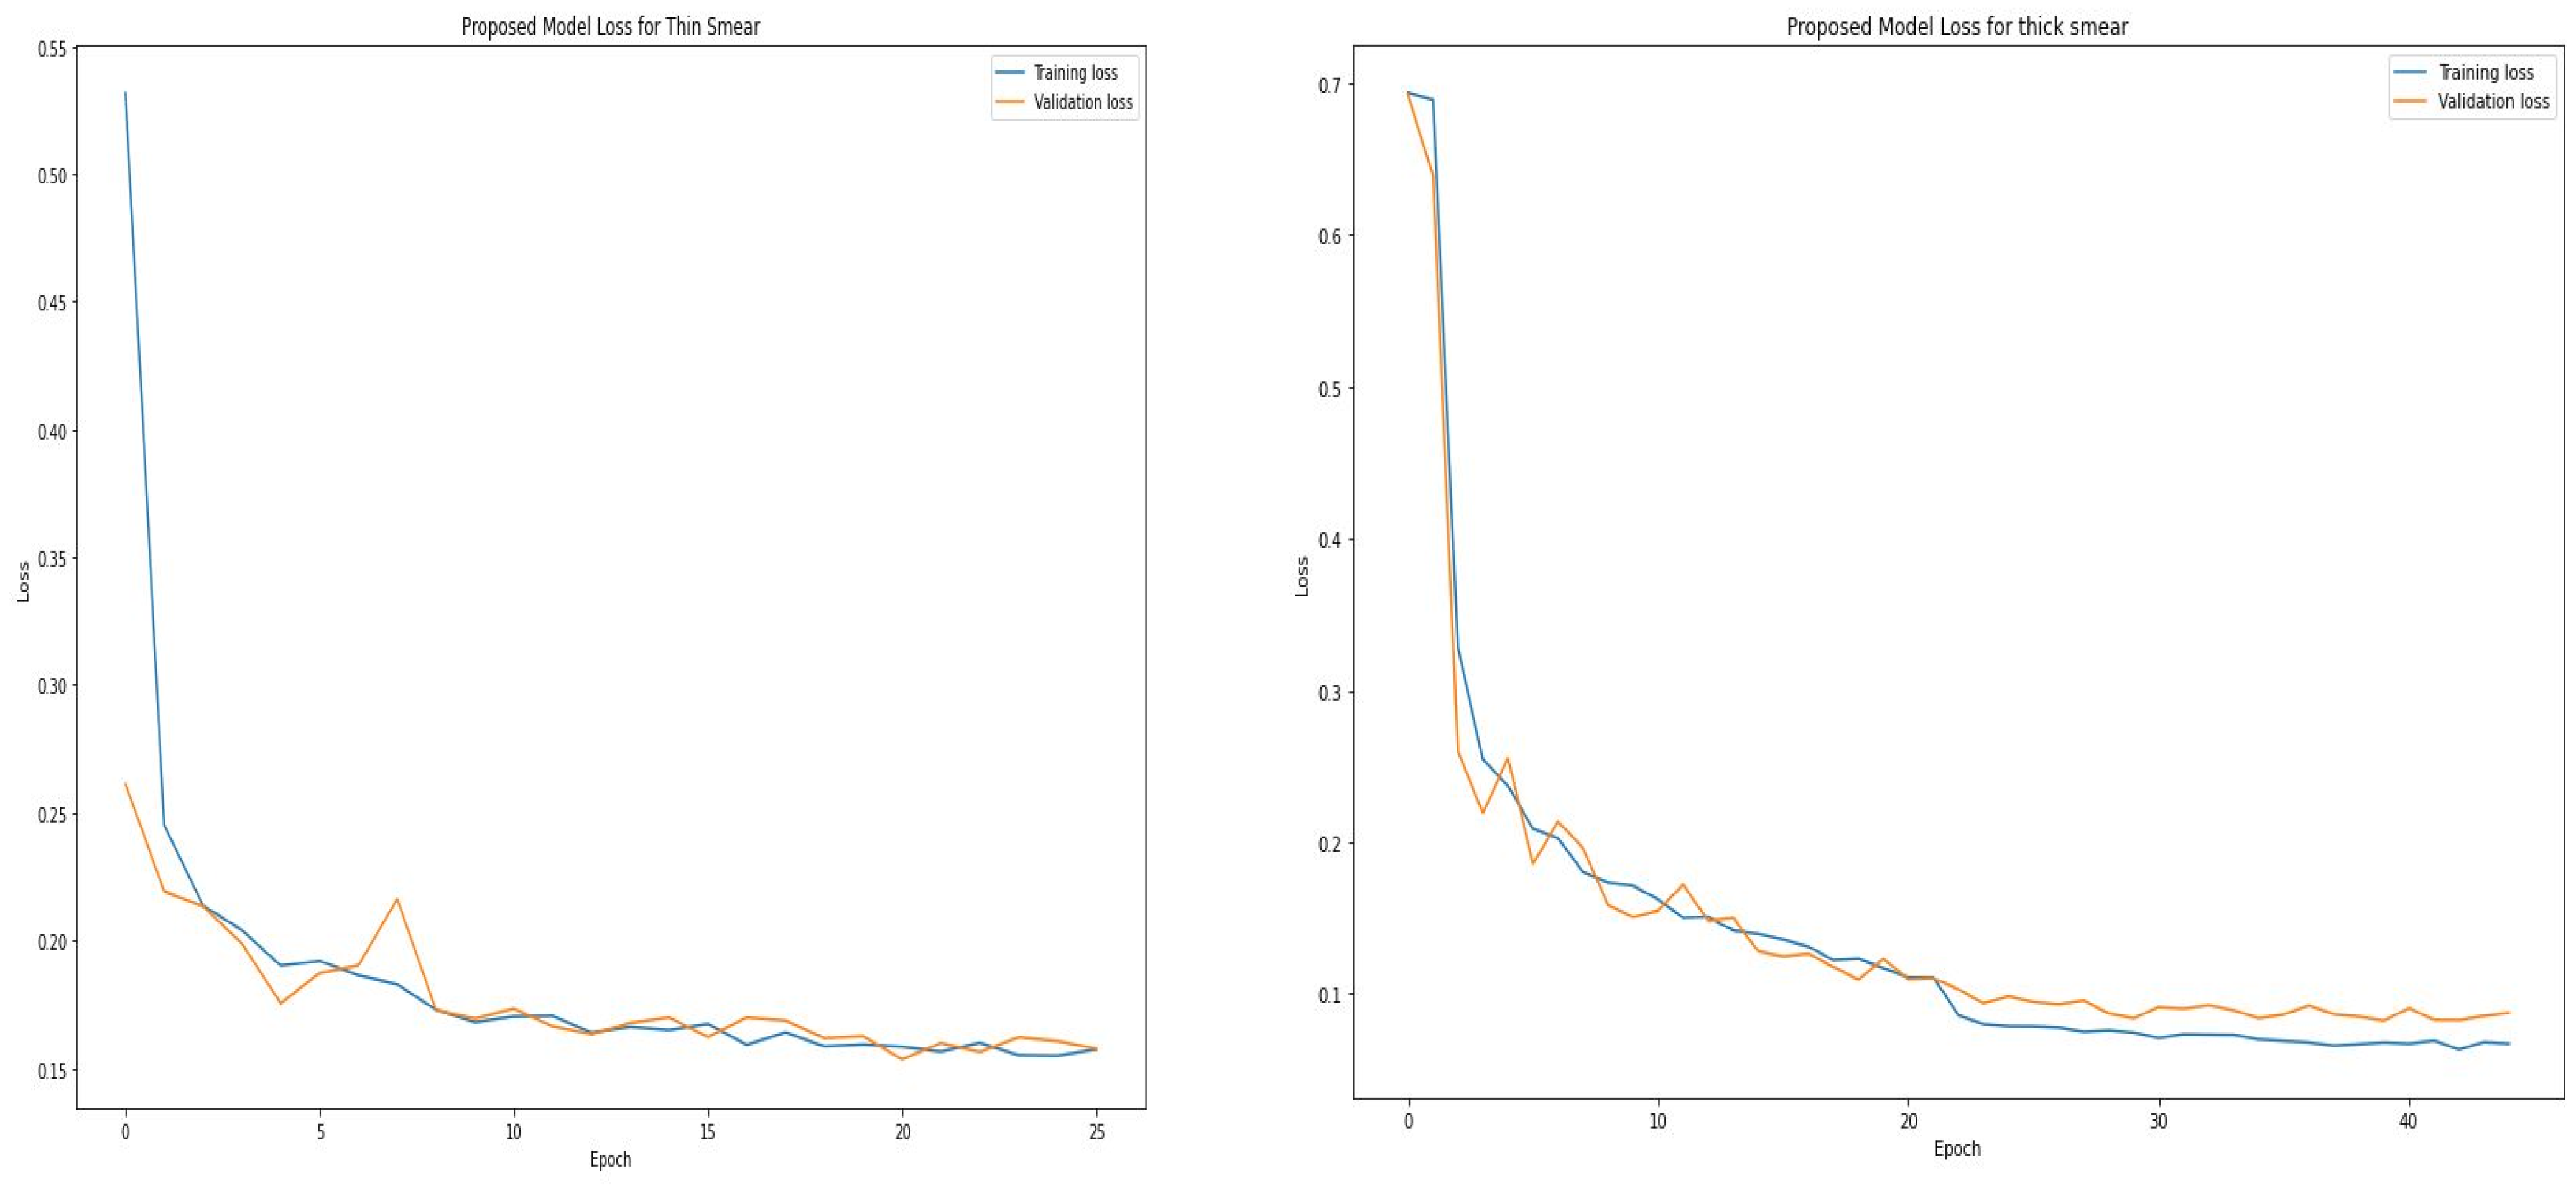
| Epoch | Accuracy | Loss |
|---|---|---|
| 1 | 82.19% | 0.3945 |
| 6 | 93.49% | 0.1958 |
| 11 | 94.01% | 0.1714 |
| 16 | 94.43% | 0.1609 |
| 21 | 94.28% | 0.1570 |
| 26 | 94.50% | 0.1506 |
| Epoch | Accuracy | Loss |
|---|---|---|
| 1 | 50.30% | 0.6936 |
| 5 | 89.46% | 0.2372 |
| 10 | 93.25% | 0.1714 |
| 15 | 94.55% | 0.1397 |
| 20 | 95.47% | 0.1171 |
| 25 | 96.98% | 0.0788 |
| 30 | 97.37% | 0.0746 |
| 35 | 97.38% | 0.0702 |
| 40 | 97.31% | 0.0702 |
| 45 | 97.54% | 0.0673 |
| Class | Precision % | Sensitivity % | F1 Score % | TP | FP | FN | TN | Accuracy % | Loss | ||||||||||
|---|---|---|---|---|---|---|---|---|---|---|---|---|---|---|---|---|---|---|---|
| Thin | Thick | Thin | Thick | Thin | Thick | Thin | Thick | Thin | Thick | Thin | Thick | Thin | Thick | Thin | Thick | Thin | Thick | ||
| Proposed Model | Inf. | 95.00 | 96.00 | 97.00 | 98.00 | 96.00 | 97.00 | 4044 | 2918 | 197 | 132 | 131 | 50 | 3896 | 2900 | 96.03 | 96.97 | 0.12 | 0.08 |
| Uninf. | 97.00 | 98.00 | 95.00 | 96.00 | 96.00 | 97.00 | |||||||||||||
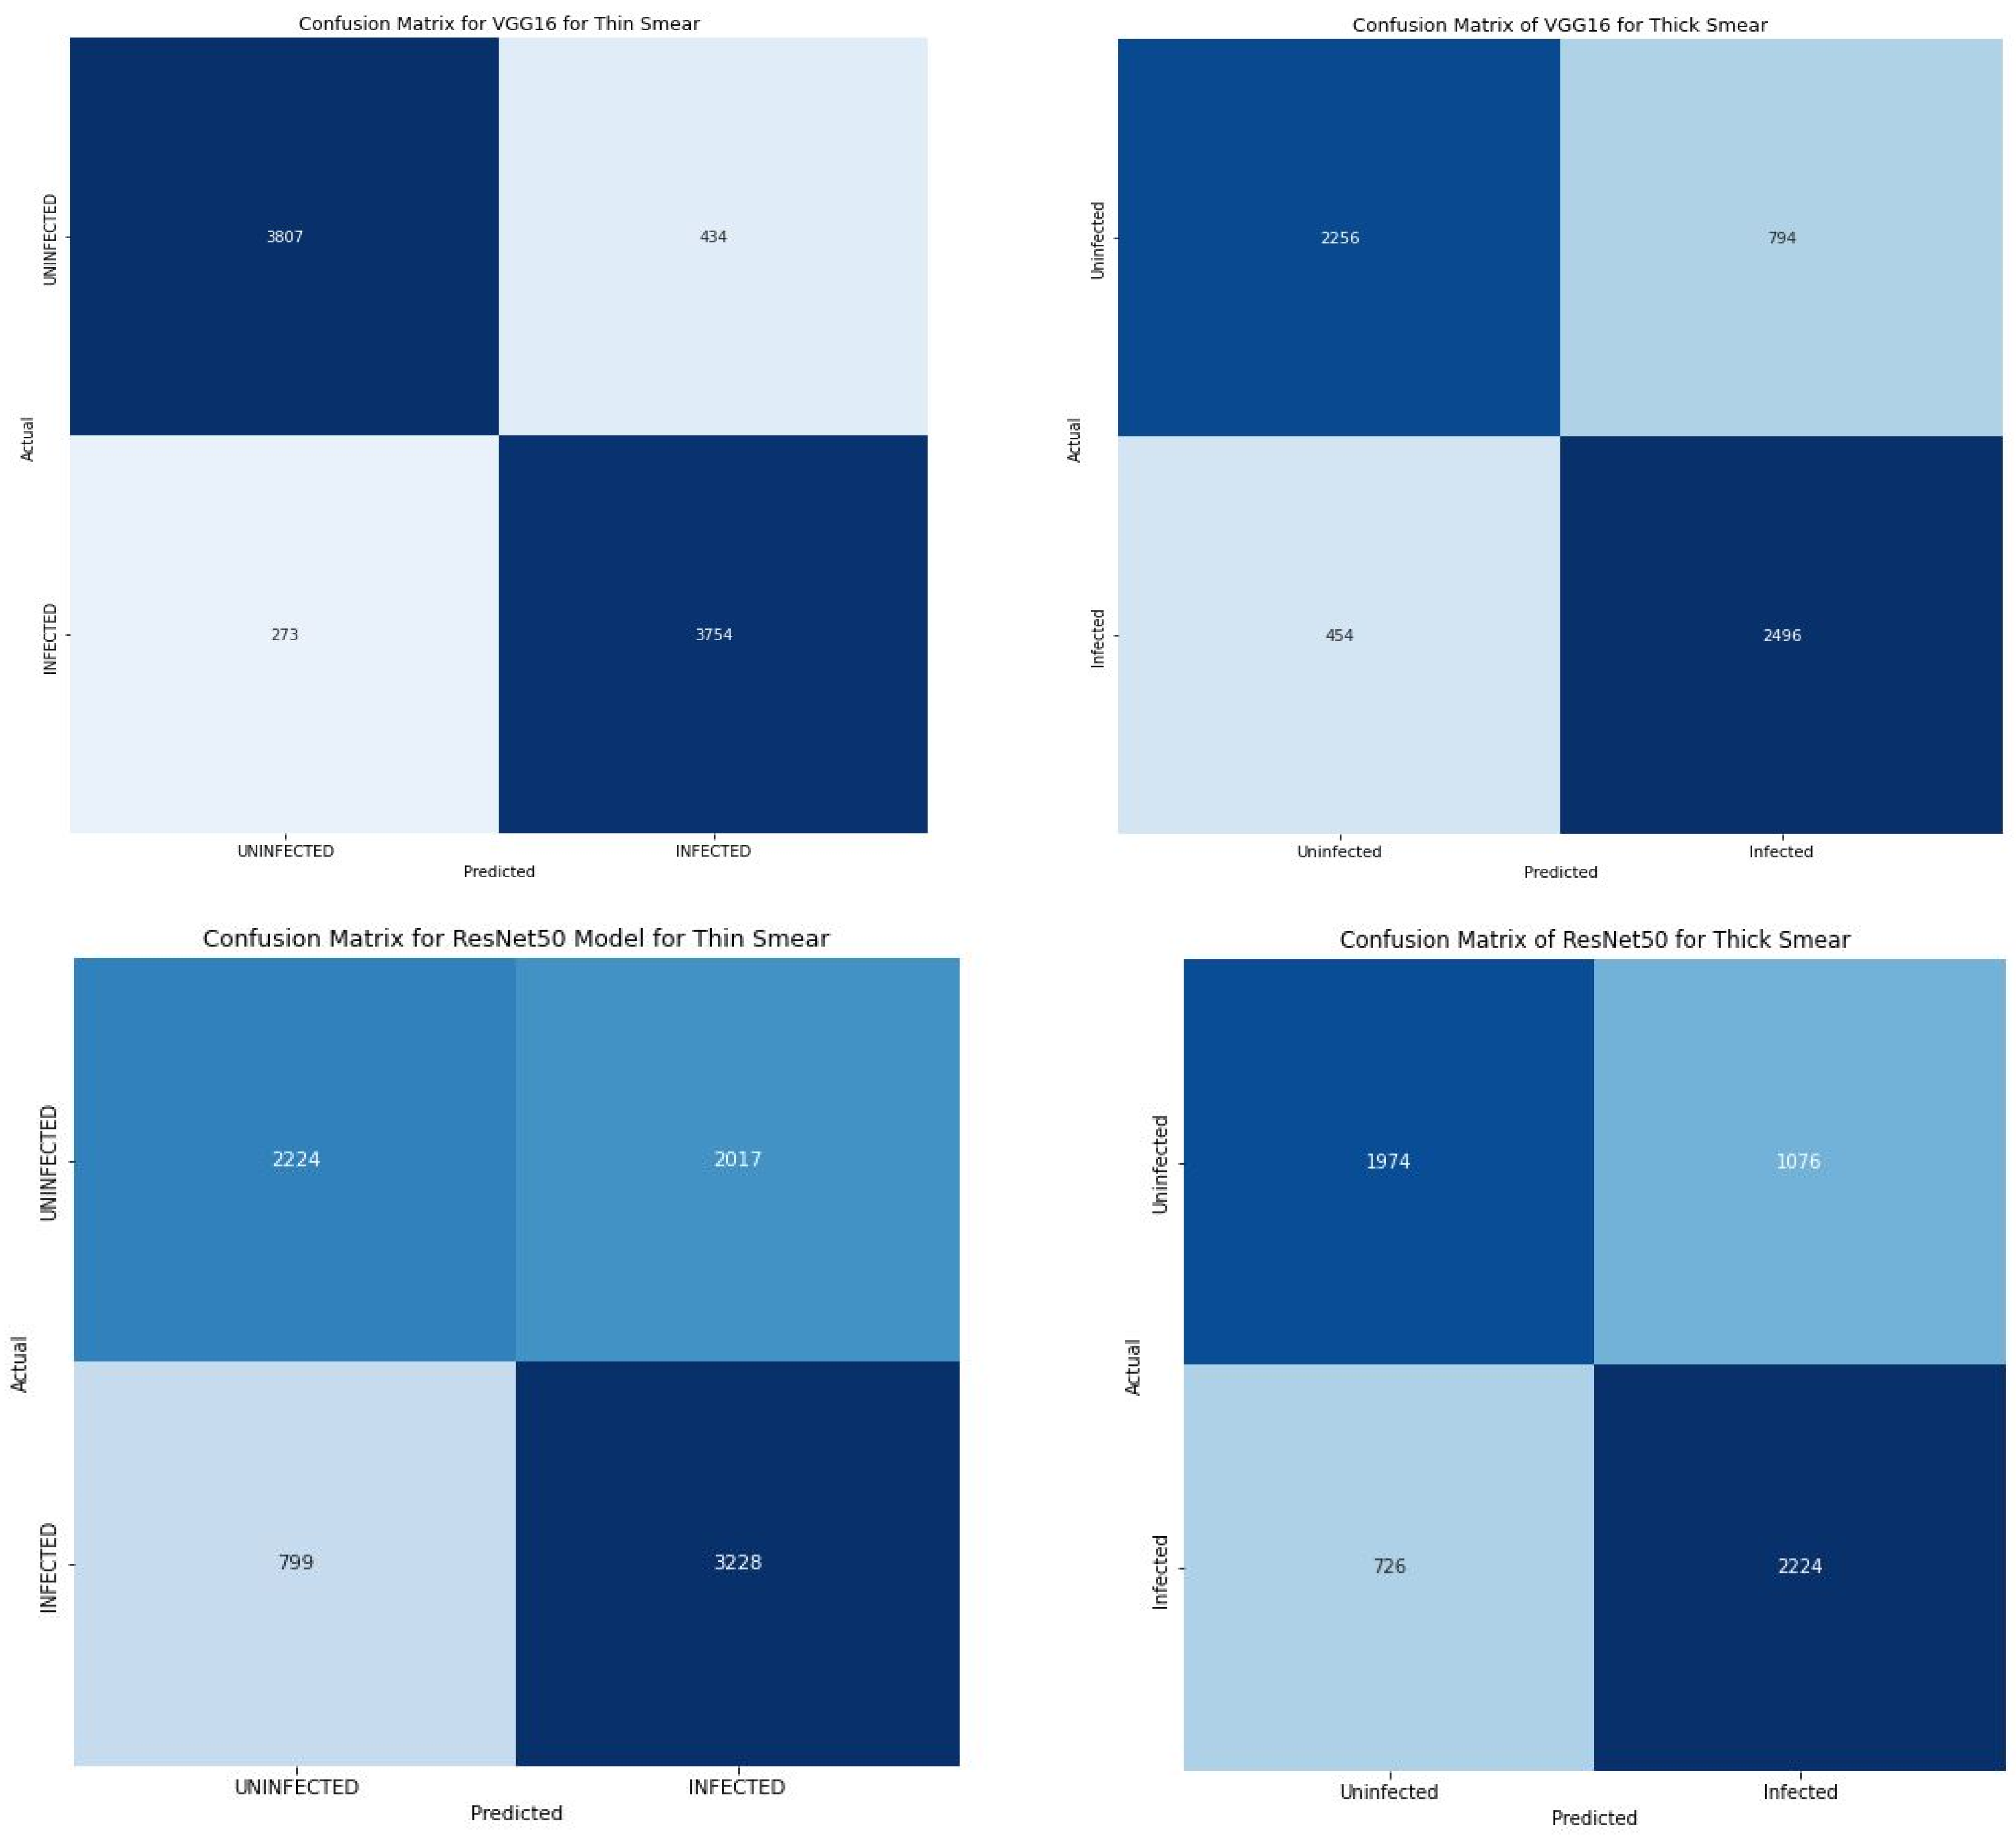
| VGG16 | Inf. | 76.00 | 90.00 | 85.00 | 93.00 | 80.00 | 91.00 | 3807 | 2256 | 434 | 794 | 273 | 454 | 3754 | 2496 | 91.45 | 79.20 | 0.21 | 0.45 |
| Uninf. | 83.00 | 93.00 | 74.00 | 90.00 | 78.00 | 92.00 | |||||||||||||
| ResNet50 | Inf. | 62.00 | 67.00 | 80.00 | 75.00 | 70.00 | 71.00 | 2224 | 1974 | 2017 | 1076 | 799 | 726 | 3228 | 2224 | 65.94 | 69.97 | 0.62 | 0.57 |
| Uninf. | 74.00 | 73.00 | 52.00 | 65.00 | 61.00 | 69.00 | |||||||||||||
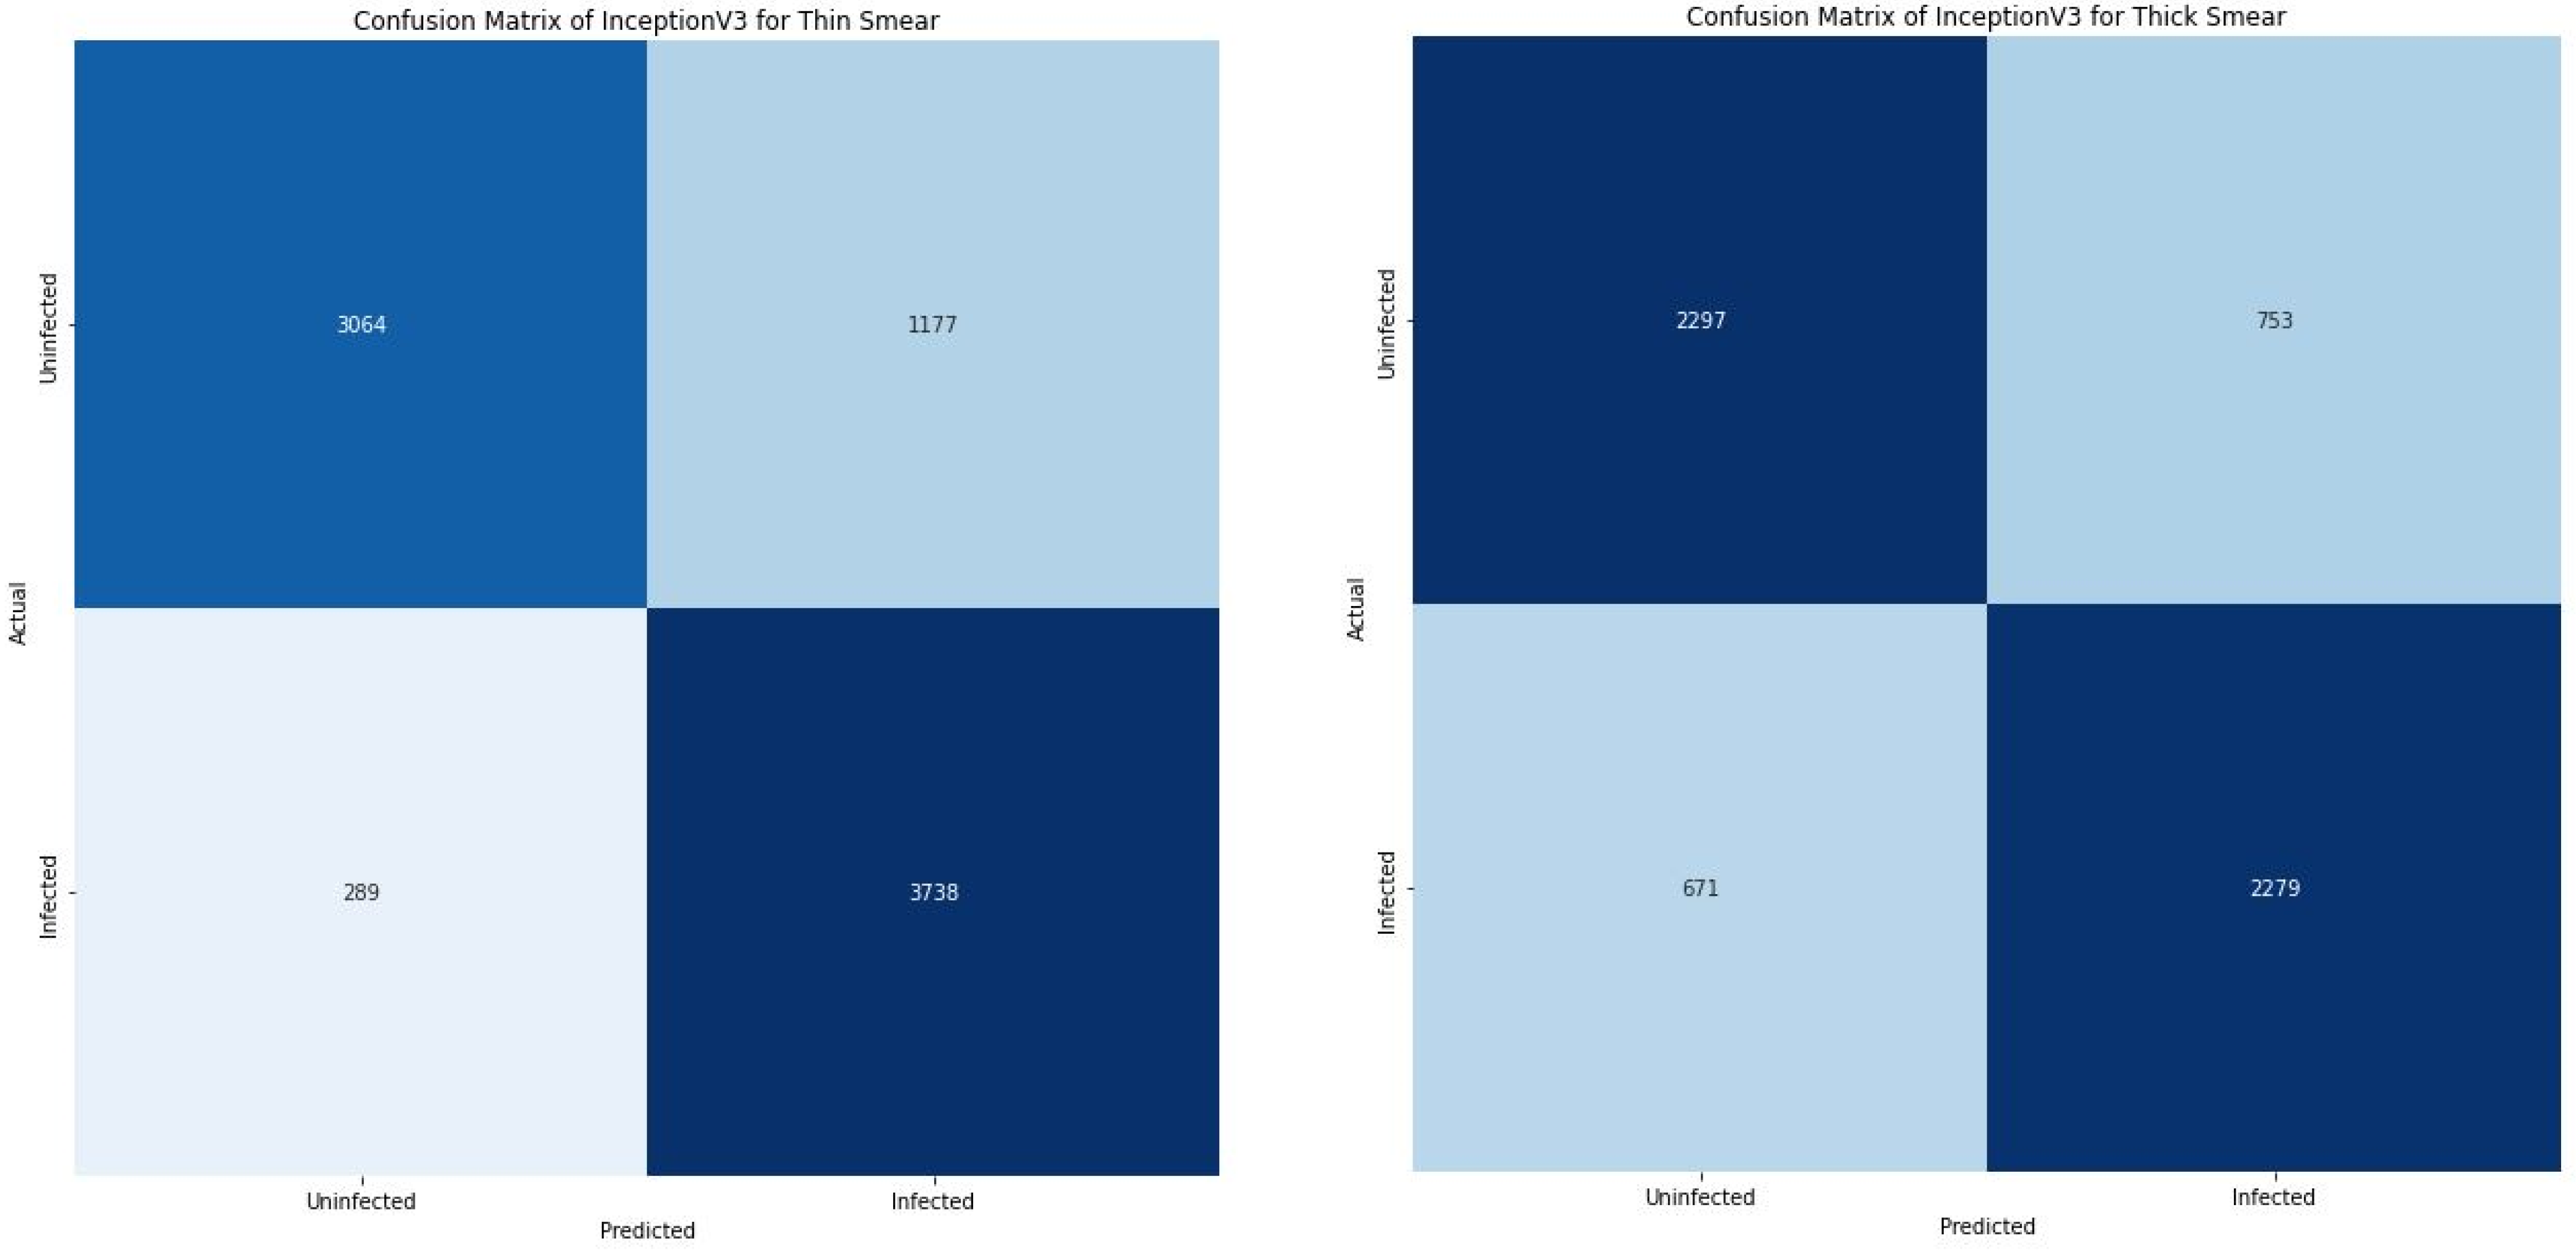
| InceptionV3 | Inf. | 75.00 | 76.00 | 77.00 | 93.00 | 76.00 | 84.00 | 3064 | 2297 | 1177 | 753 | 289 | 671 | 3738 | 2279 | 82.27 | 76.27 | 0.39 | 0.48 |
| Uninf. | 77.00 | 91.00 | 75.00 | 72.00 | 76.00 | 81.00 | |||||||||||||
Publisher’s Note: MDPI stays neutral with regard to jurisdictional claims in published maps and institutional affiliations. |
© 2022 by the authors. Licensee MDPI, Basel, Switzerland. This article is an open access article distributed under the terms and conditions of the Creative Commons Attribution (CC BY) license (https://creativecommons.org/licenses/by/4.0/).
Share and Cite
Uzun Ozsahin, D.; Mustapha, M.T.; Bartholomew Duwa, B.; Ozsahin, I. Evaluating the Performance of Deep Learning Frameworks for Malaria Parasite Detection Using Microscopic Images of Peripheral Blood Smears. Diagnostics 2022, 12, 2702. https://doi.org/10.3390/diagnostics12112702
Uzun Ozsahin D, Mustapha MT, Bartholomew Duwa B, Ozsahin I. Evaluating the Performance of Deep Learning Frameworks for Malaria Parasite Detection Using Microscopic Images of Peripheral Blood Smears. Diagnostics. 2022; 12(11):2702. https://doi.org/10.3390/diagnostics12112702
Chicago/Turabian StyleUzun Ozsahin, Dilber, Mubarak Taiwo Mustapha, Basil Bartholomew Duwa, and Ilker Ozsahin. 2022. "Evaluating the Performance of Deep Learning Frameworks for Malaria Parasite Detection Using Microscopic Images of Peripheral Blood Smears" Diagnostics 12, no. 11: 2702. https://doi.org/10.3390/diagnostics12112702