
RNN and BiLSTM Fusion for Accurate Automatic Epileptic Seizure Diagnosis Using EEG Signals
 , , , and
Abstract
:1. Introduction
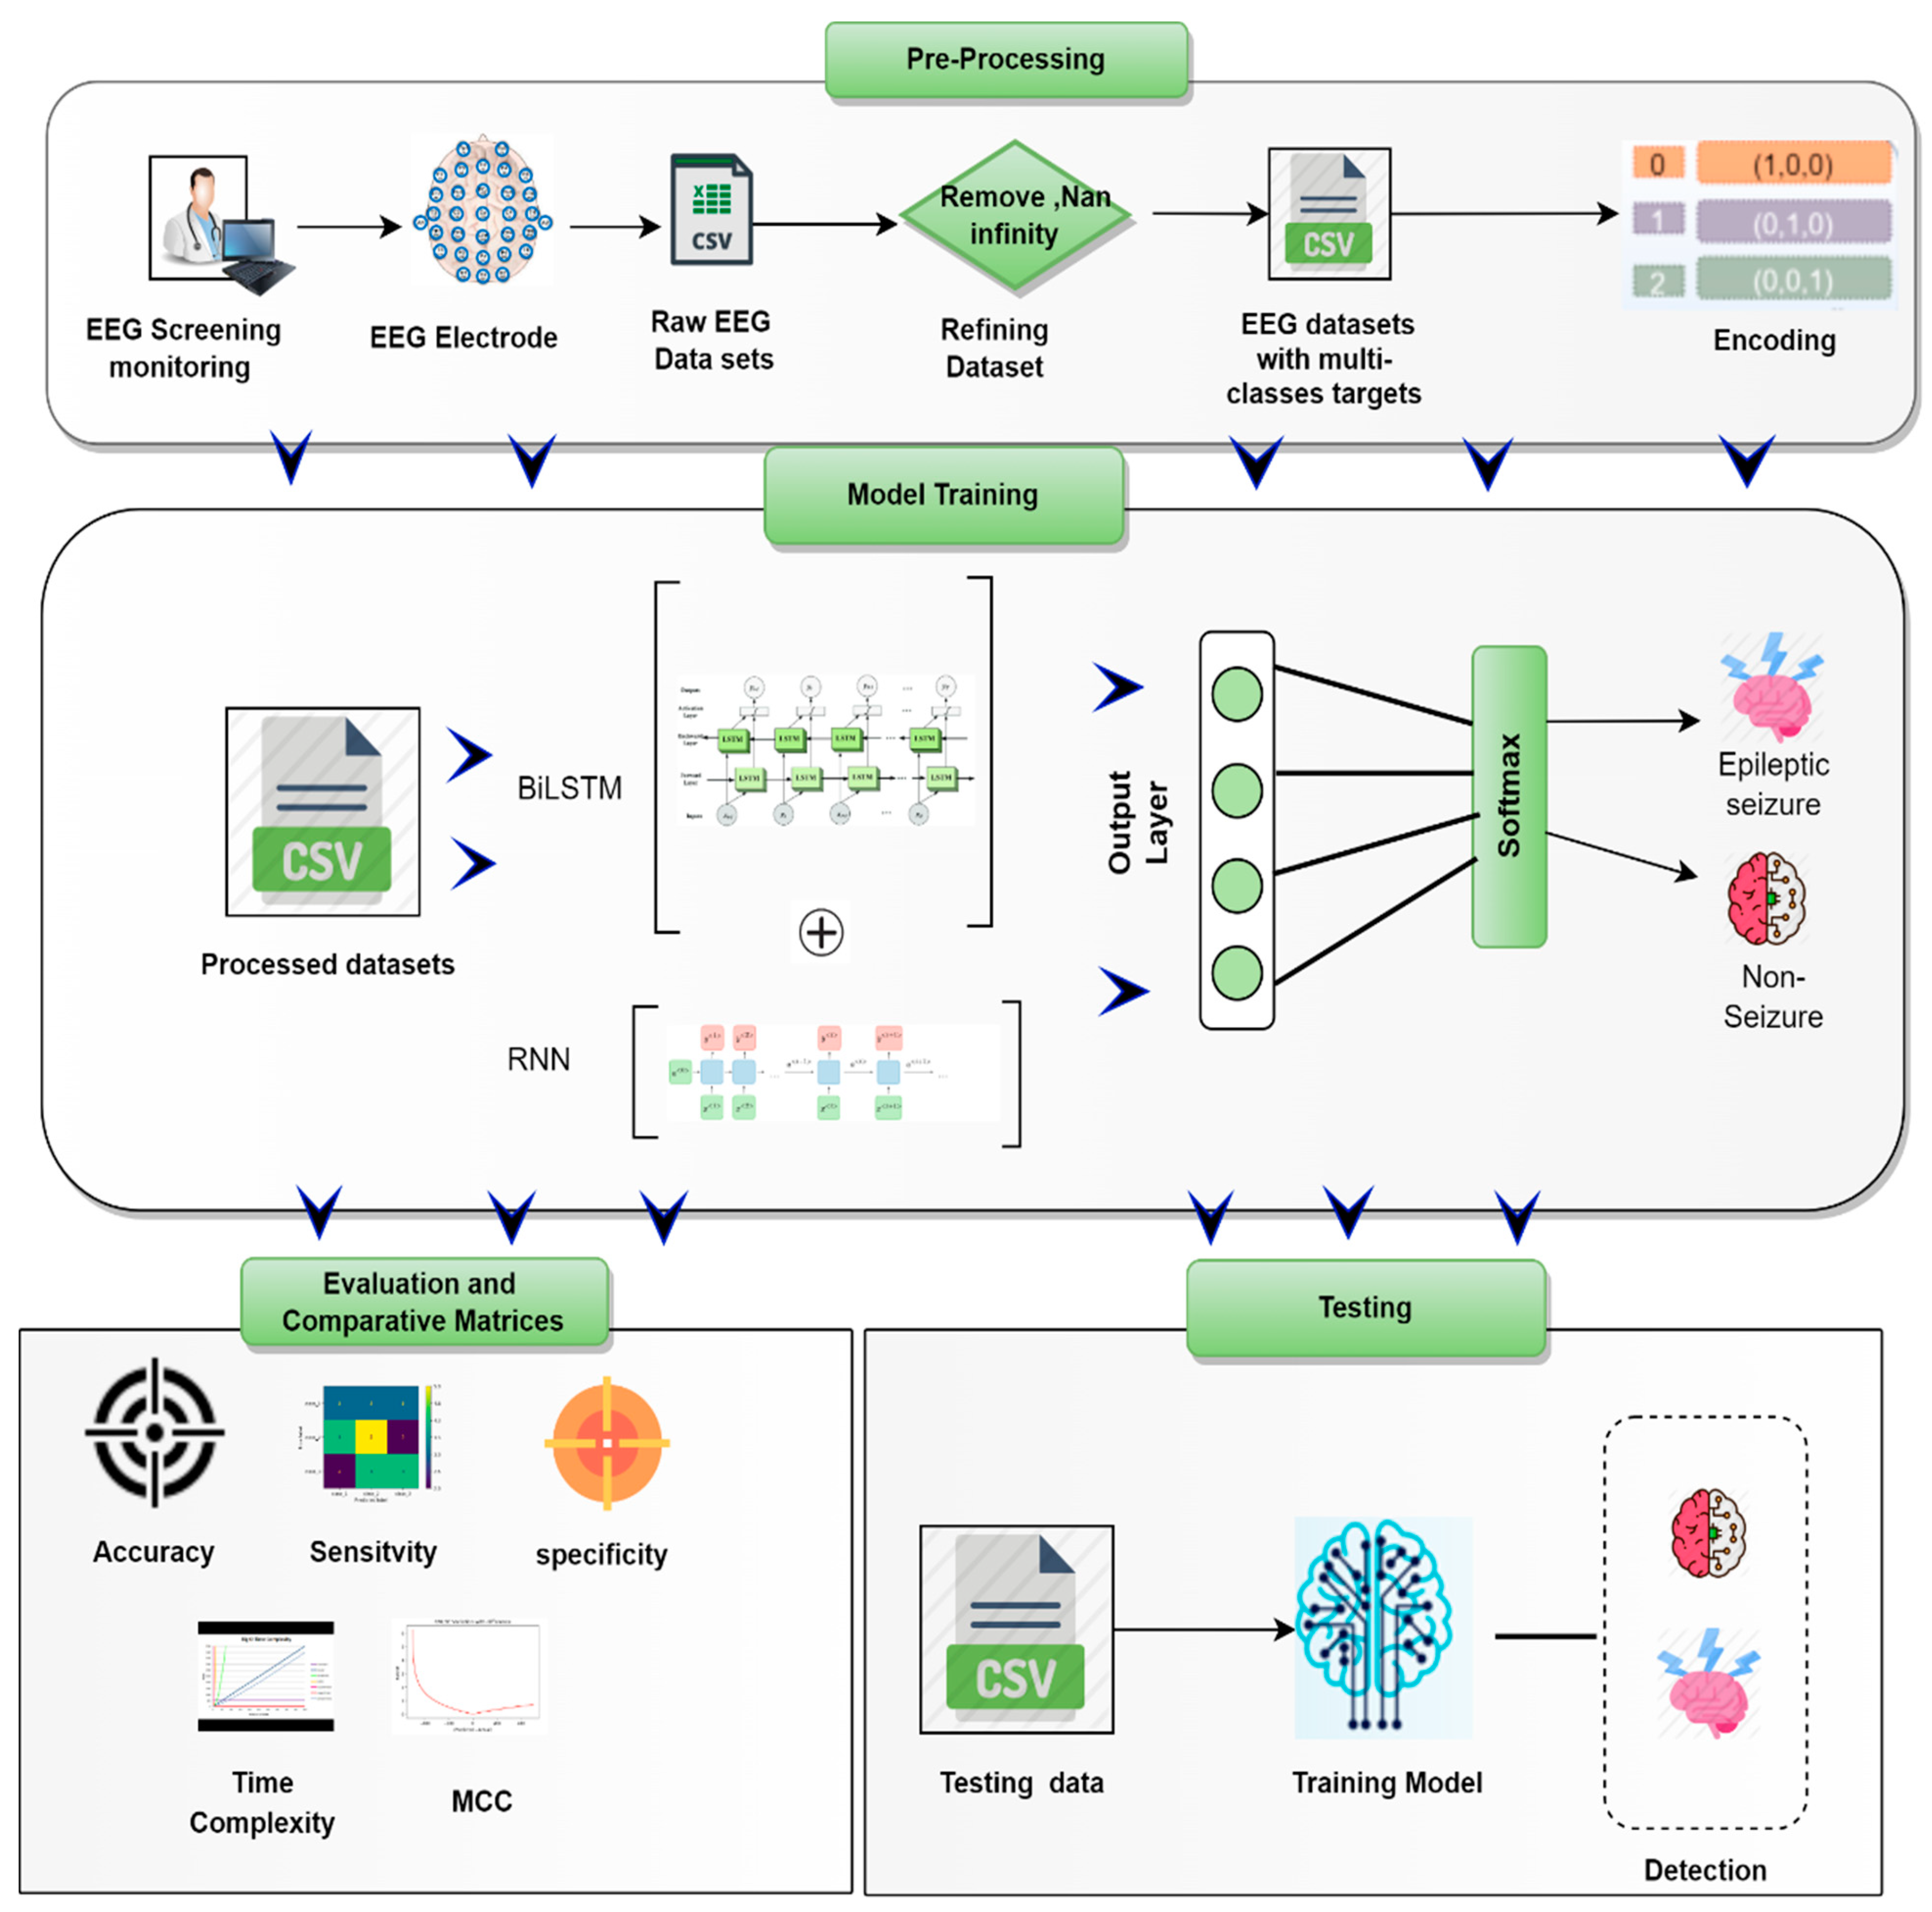
- A hybrid of recurrent neural networks (RNNs) and bi-directional long short-term memories (BiLSTM) is proposed for the purpose of automatically identifying epileptic seizures through the processing of EEG signals.
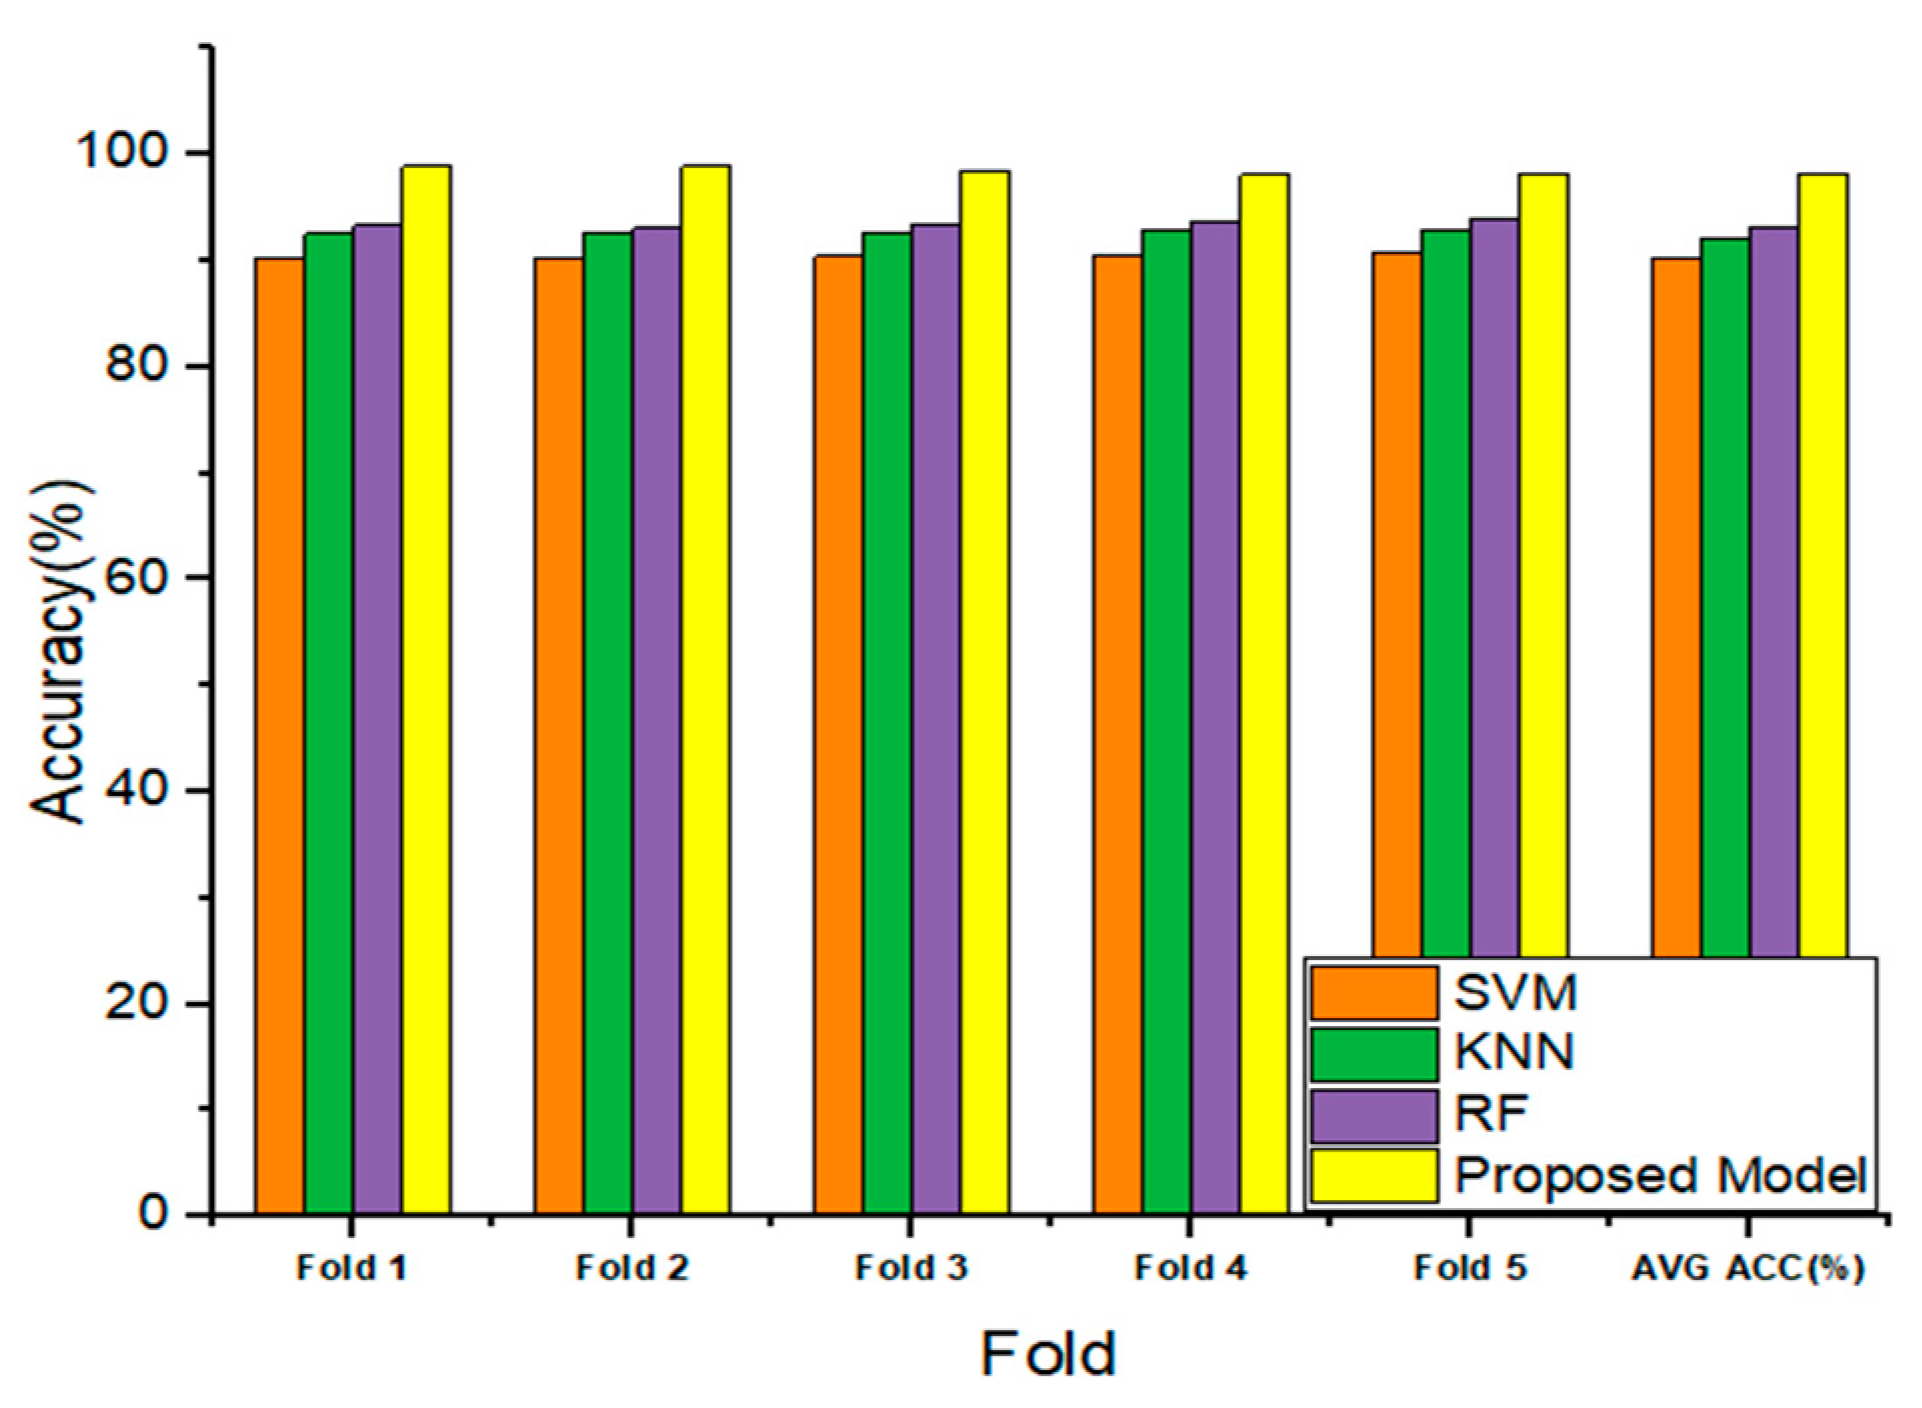
- The efficacy of the newly developed model is validated by conducting a complete comparison to the existing state-of-the-art learning models.
- The recommended method provides a number of advantages, including shorter periods of time needed for detection, a reduced proportion of false positive results, increased sensitivity, and increased specificity.
2. Literature Review
3. Materials and Methods
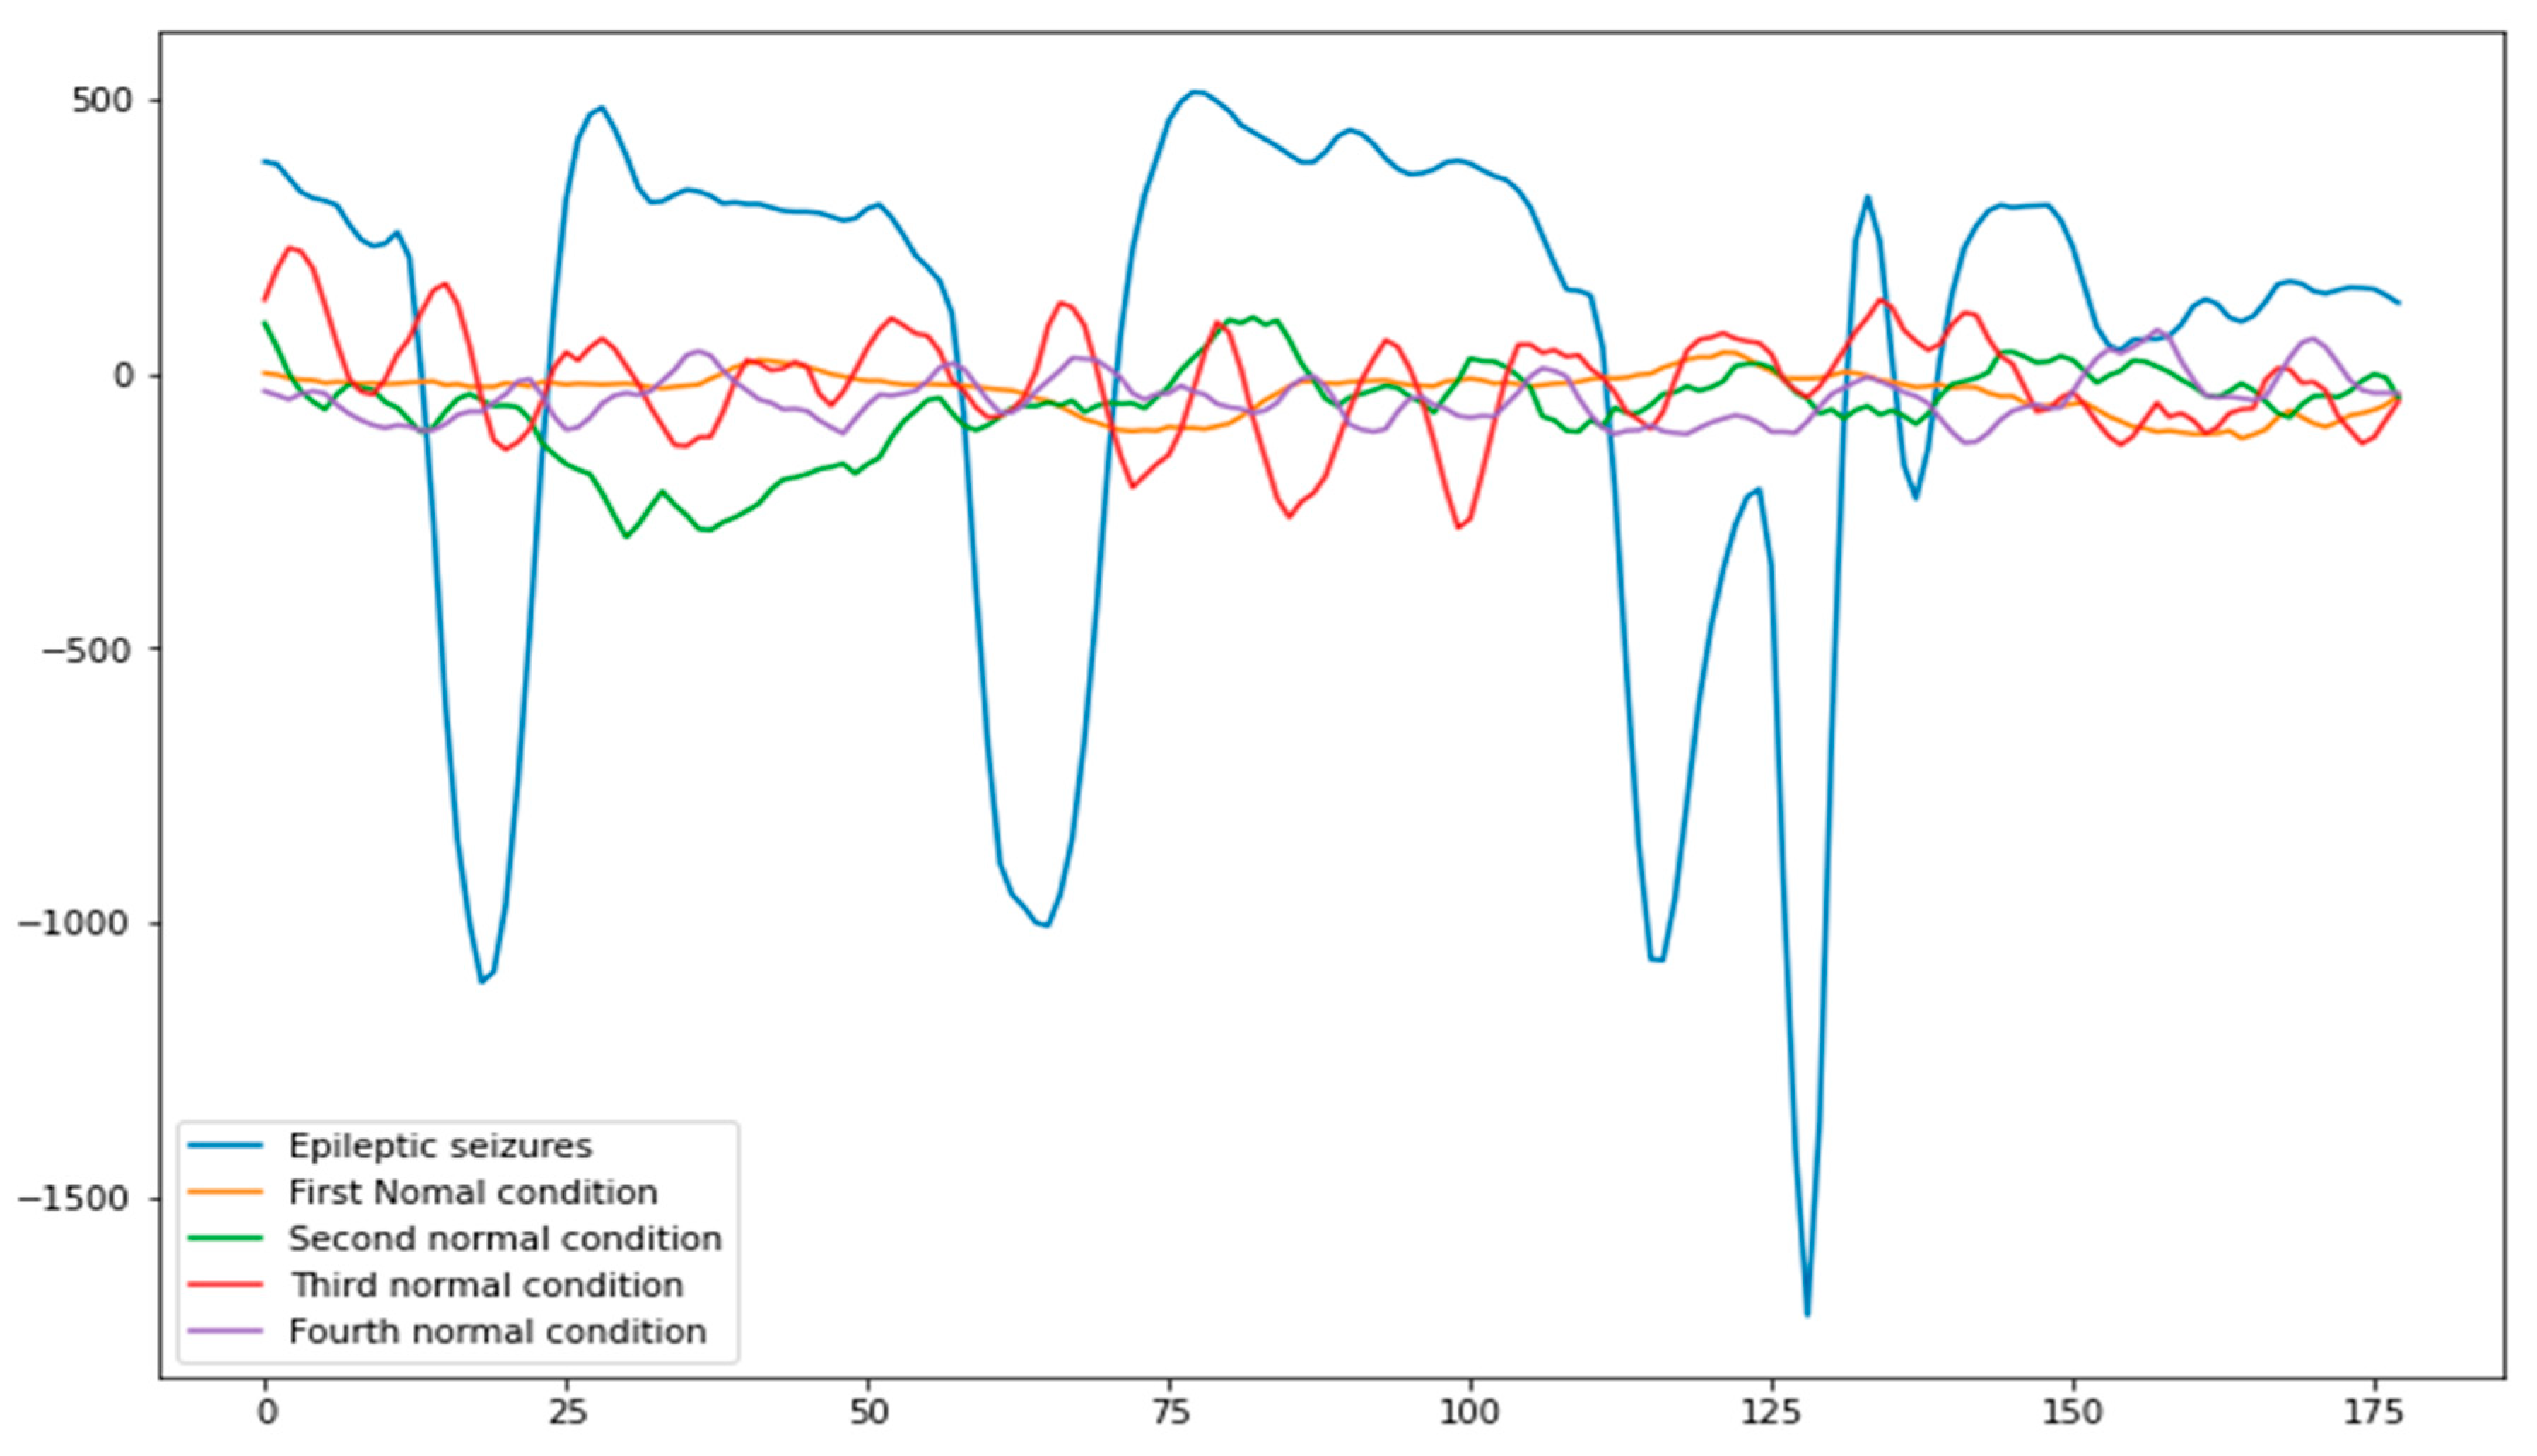
3.1. Data Collection and Preprocessing
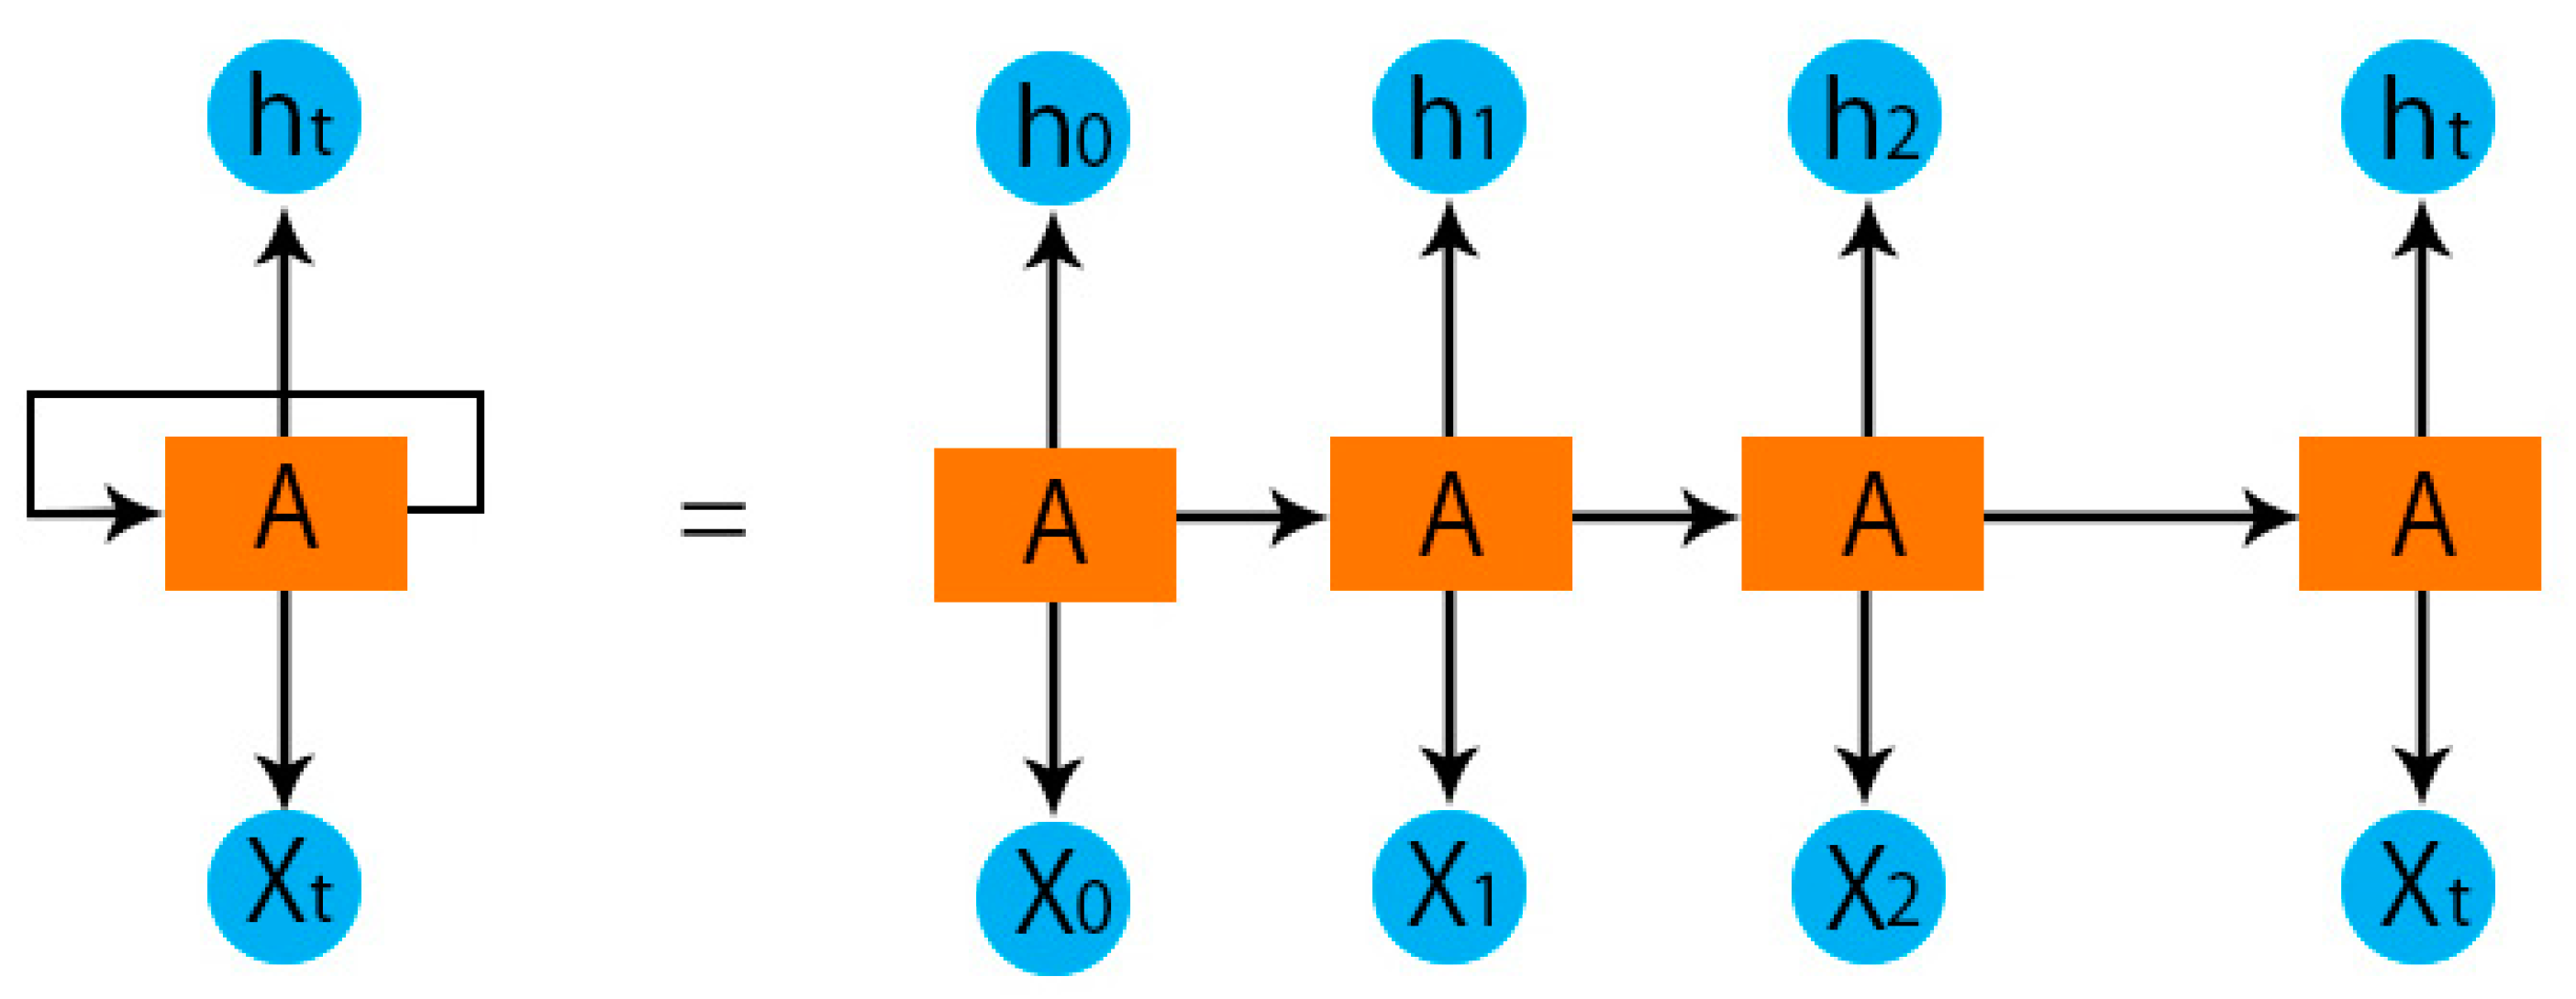
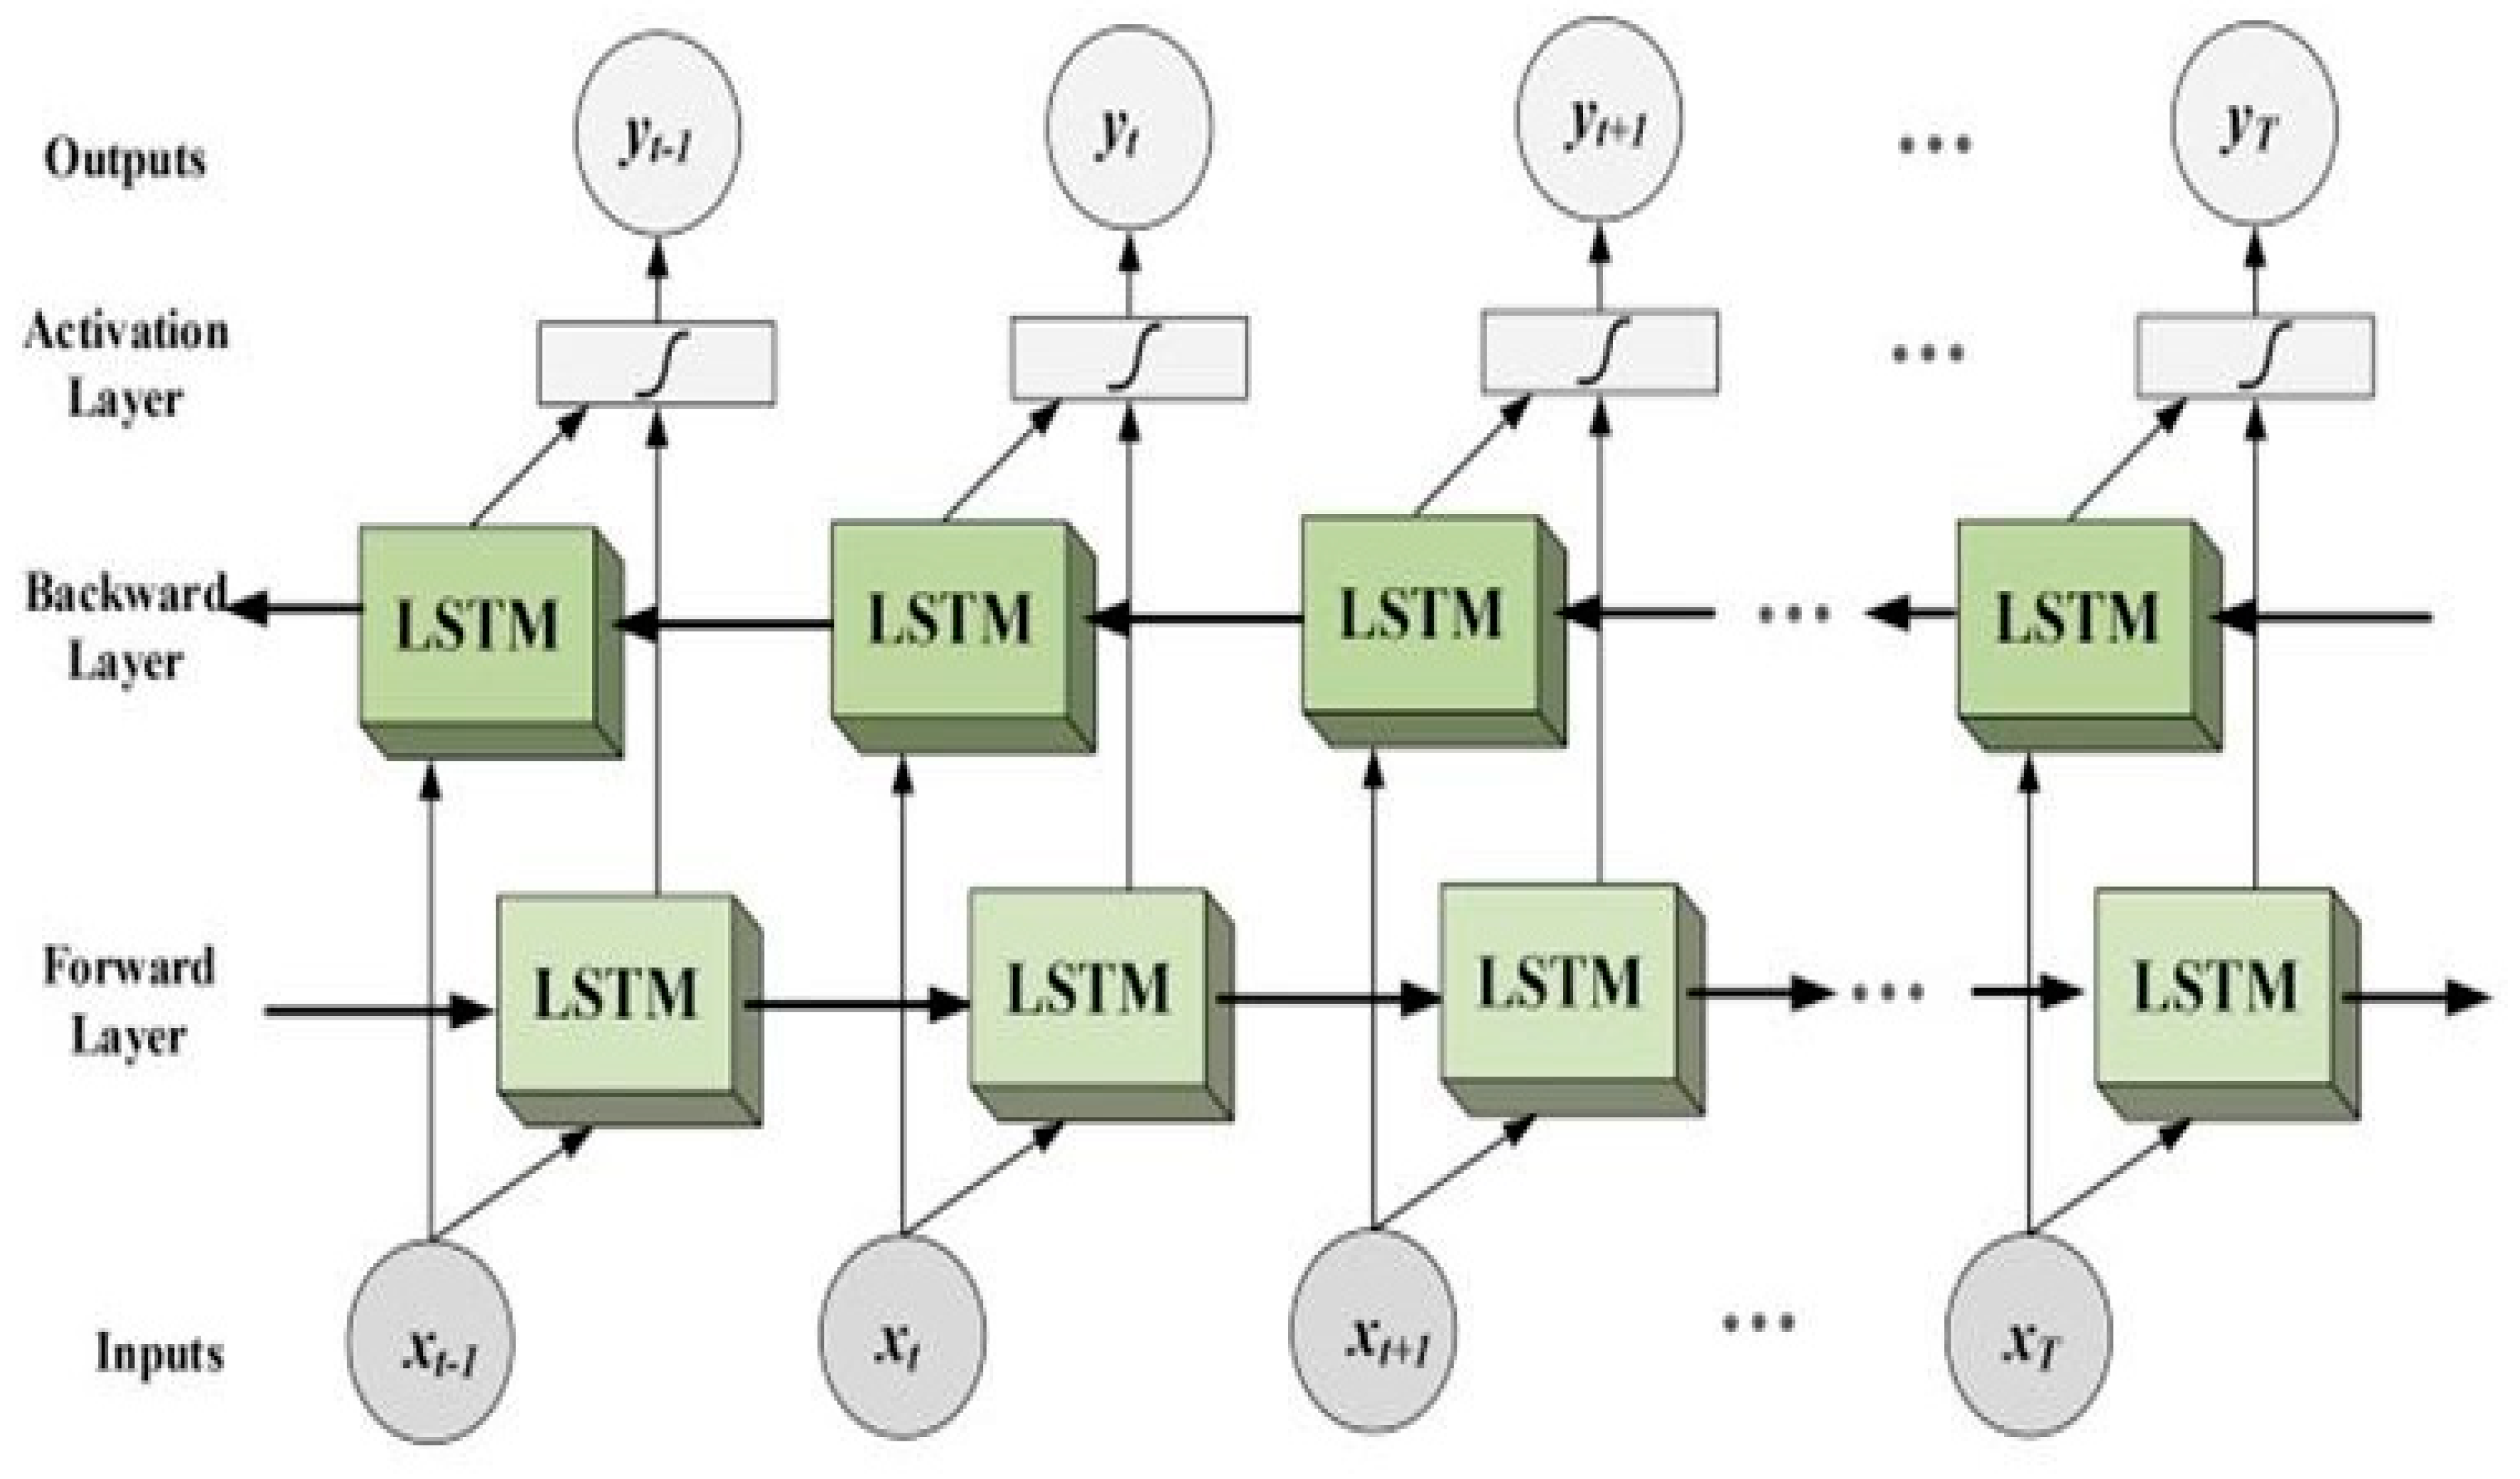
3.2. The Proposed RNN-BiLSTM Learning Model
3.3. Model Training and Testing
4. Results and Discussion
5. Comparing the Proposed Model to Traditional ML Models
6. Comparing the Performance of the Proposed Model to State-of-the-Art
7. Conclusions
Author Contributions
Funding
Institutional Review Board Statement
Informed Consent Statement
Data Availability Statement
Acknowledgments
Conflicts of Interest
References
- Vaurio, L.; Karantzoulis, S.; Barr, W.B. The Impact of Epilepsy on Quality of Life. In Changes in the Brain: Impact on Daily Life; Springer: New York, NY, USA, 2016; pp. 167–187. ISBN 9780387981888. [Google Scholar]
- Ahmad, I.; Wang, X.; Zhu, M.; Wang, C.; Pi, Y.; Khan, J.A.; Khan, S.; Samuel, O.W.; Chen, S.; Li, G. EEG-Based Epileptic Seizure Detection via Machine/Deep Learning Approaches: A Systematic Review. Comput. Intell. Neurosci. 2022, 2022, 6486570. [Google Scholar] [CrossRef] [PubMed]
- Hirtz, D.; Thurman, D.J.; Gwinn-Hardy, K.; Mohamed, M.; Chaudhuri, A.R.; Zalutsky, R. How Common Are the “Common” Neurologic Disorders? Neurology 2007, 68, 326–337. [Google Scholar] [CrossRef] [PubMed]
- Carney, P.R.; Myers, S.; Geyer, J.D. Seizure Prediction: Methods. Epilepsy Behav. 2011, 22, S94. [Google Scholar] [CrossRef] [PubMed] [Green Version]
- Mahmoodian, N.; Boese, A.; Friebe, M.; Haddadnia, J. Epileptic Seizure Detection Using Cross-Bispectrum of Electroencephalogram Signal. Seizure 2019, 66, 4–11. [Google Scholar] [CrossRef] [Green Version]
- Hilal, A.M.; Albraikan, A.A.; Dhahbi, S.; Nour, M.K.; Mohamed, A.; Motwakel, A.; Zamani, A.S.; Rizwanullah, M. Intelligent Epileptic Seizure Detection and Classification Model Using Optimal Deep Canonical Sparse Autoencoder. Biology 2022, 11, 1220. [Google Scholar] [CrossRef] [PubMed]
- Firpi, H.; Goodman, E.D.; Echauz, J. Epileptic Seizure Detection Using Genetically Programmed Artificial Features. IEEE Trans. Biomed. Eng. 2007, 54, 212–224. [Google Scholar] [CrossRef]
- Kerr, M.P. The Impact of Epilepsy on Patients’ Lives. Acta Neurol. Scand 2012, 126, 1–9. [Google Scholar] [CrossRef] [PubMed]
- Auriel, E.; Landov, H.; Blatt, I.; Theitler, J.; Gandelman-Marton, R.; Chistik, V.; Margolin, N.; Gross, B.; Parmet, Y.; Andelman, F.; et al. Quality of Life in Seizure-Free Patients with Epilepsy on Monotherapy. Epilepsy Behav. 2009, 14, 130–133. [Google Scholar] [CrossRef] [PubMed]
- Liu, C.L.; Xiao, B.; Hsaio, W.H.; Tseng, V.S. Epileptic Seizure Prediction with Multi-View Convolutional Neural Networks. IEEE Access 2019, 7, 170352–170361. [Google Scholar] [CrossRef]
- Lehnertz, K.; Mormann, F.; Kreuz, T.; Andrzejak, R.G.; Rieke, C.; David, P.; Elger, C.E. Seizure Prediction by Nonlinear EEG Analysis. IEEE Eng. Med. Biol. Mag. 2003, 22, 57–63. [Google Scholar] [CrossRef] [PubMed]
- Daoud, H.; Bayoumi, M.A. Efficient Epileptic Seizure Prediction Based on Deep Learning. IEEE Trans. Biomed. Circuits Syst. 2019, 13, 804–813. [Google Scholar] [CrossRef] [PubMed]
- Islam, M.S.; El-Hajj, A.M.; Alawieh, H.; Dawy, Z.; Abbas, N.; El-Imad, J. EEG Mobility Artifact Removal for Ambulatory Epileptic Seizure Prediction Applications. Biomed. Signal Process. Control 2020, 55, 101638. [Google Scholar] [CrossRef]
- Zheng, T.; Luo, W. An Improved Squirrel Search Algorithm for Optimization. Complexity 2019, 2019, 6291968. [Google Scholar] [CrossRef]
- Shoeibi, A.; Ghassemi, N.; Alizadehsani, R.; Rouhani, M.; Hosseini-Nejad, H.; Khosravi, A.; Panahiazar, M.; Nahavandi, S. A Comprehensive Comparison of Handcrafted Features and Convolutional Autoencoders for Epileptic Seizures Detection in EEG Signals. Expert Syst. Appl. 2021, 163, 113788. [Google Scholar] [CrossRef]
- Da Silva Lourenço, C.; Tjepkema-Cloostermans, M.C.; van Putten, M.J.A.M. Machine Learning for Detection of Interictal Epileptiform Discharges. Clin. Neurophysiol. 2021, 132, 1433–1443. [Google Scholar] [CrossRef] [PubMed]
- Sharma, G.; Parashar, A.; Joshi, A.M. DepHNN: A Novel Hybrid Neural Network for Electroencephalogram (EEG)-Based Screening of Depression. Biomed. Signal Process. Control 2021, 66, 102393. [Google Scholar] [CrossRef]
- Ahmad, I.; Ullah, I.; Khan, W.U.; Rehman, A.U.; Adrees, M.S.; Saleem, M.Q.; Cheikhrouhou, O.; Hamam, H.; Shafiq, M. Efficient algorithms for E-healthcare to solve multiobject fuse detection problem. J. Healthc. Eng. 2021, 2021, 9500304. [Google Scholar] [CrossRef]
- Ma, M.; Cheng, Y.; Wei, X.; Chen, Z.; Zhou, Y. Research on Epileptic EEG Recognition Based on Improved Residual Networks of 1-D CNN and IndRNN. BMC Med. Inform. Decis. Mak. 2021, 21, 100. [Google Scholar] [CrossRef] [PubMed]
- Ahmad, S.; Ullah, T.; Ahmad, I.; L-Sharabi, A.A.; Ullah, K.; Khan, R.A.; Rasheed, S.; Ullah, I.; Uddin, M.N.; Ali, M.S. A novel hybrid deep learning model for metastatic cancer detection. Comput. Intell. Neurosci. 2022, 2022, 8141530. [Google Scholar] [CrossRef] [PubMed]
- Choi, W.; Kim, M.-J.; Yum, M.-S.; Jeong, D.-H. Deep Convolutional Gated Recurrent Unit Combined with Attention Mechanism to Classify Pre-Ictal from Interictal EEG with Minimized Number of Channels. J. Pers. Med. 2022, 12, 763. [Google Scholar] [CrossRef]
- Wang, X.; Ahmad, I.; Javeed, D.; Zaidi, S.A.; Alotaibi, F.M.; Ghoneim, M.E.; Daradkeh, Y.I.; Asghar, J.; Eldin, E.T. Intelligent Hybrid Deep Learning Model for Breast Cancer Detection. Electronics 2022, 11, 2767. [Google Scholar] [CrossRef]
- Nagabushanam, P.; Thomas George, S.; Radha, S. EEG Signal Classification Using LSTM and Improved Neural Network Algorithms. Soft Comput. 2020, 24, 9981–10003. [Google Scholar] [CrossRef]
- Ahmad, I.; Liu, Y.; Javeed, D.; Ahmad, S. A decision-making technique for solving order allocation problem using a genetic algorithm. In IOP Conference Series: Materials Science and Engineering; IOP Publishing: Bristol, UK, 2020; Volume 853. [Google Scholar]
- Vidyaratne, L.; Glandon, A.; Alam, M.; Iftekharuddin, K.M. Deep Recurrent Neural Network for Seizure Detection. In Proceedings of the International Joint Conference on Neural Networks, Vancouver, BC, Canada, 24–29 July 2016; pp. 1202–1207. [Google Scholar]
- Najafi, T.; Jaafar, R.; Remli, R.; Wan Zaidi, W.A. A Classification Model of EEG Signals Based on RNN-LSTM for Diagnosing Focal and Generalized Epilepsy. Sensors 2022, 22, 7269. [Google Scholar] [CrossRef] [PubMed]
- Xie, S.; Krishnan, S. Wavelet-Based Sparse Functional Linear Model with Applications to EEGs Seizure Detection and Epilepsy Diagnosis. Med. Biol. Eng. Comput. 2013, 51, 49–60. [Google Scholar] [CrossRef]
- Chen, G. Automatic EEG Seizure Detection Using Dual-Tree Complex Wavelet-Fourier Features. Expert Syst. Appl. 2014, 41, 2391–2394. [Google Scholar] [CrossRef]
- Chen, L.L.; Zhang, J.; Zou, J.Z.; Zhao, C.J.; Wang, G.S. A Framework on Wavelet-Based Nonlinear Features and Extreme Learning Machine for Epileptic Seizure Detection. Biomed. Signal Process. Control 2014, 10, 1–10. [Google Scholar] [CrossRef]
- Faust, O.; Acharya, U.R.; Adeli, H.; Adeli, A. Wavelet-Based EEG Processing for Computer-Aided Seizure Detection and Epilepsy Diagnosis. Seizure 2015, 26, 56–64. [Google Scholar] [CrossRef] [PubMed] [Green Version]
- Affes, A.; Mdhaffar, A.; Triki, C.; Jmaiel, M.; Freisleben, B. A Convolutional Gated Recurrent Neural Network for Epileptic Seizure Prediction. In Proceedings of the Lecture Notes in Computer Science (Including Subseries Lecture Notes in Artificial Intelligence and Lecture Notes in Bioinformatics), New York, NY, USA, 14–16 October 2019; Springer: Berlin/Heidelberg, Germany, 2019; Volume 11862 LNCS, pp. 85–96. [Google Scholar]
- Raghu, S.; Sriraam, N.; Temel, Y.; Rao, S.V.; Kubben, P.L. EEG Based Multi-Class Seizure Type Classification Using Convolutional Neural Network and Transfer Learning. Neural Netw. 2020, 124, 202–212. [Google Scholar] [CrossRef] [PubMed]
- Mursalin, M.; Islam, S.S.; Noman, M.K.; Al-Jumaily, A.A. Epileptic Seizure Classification Using Statistical Sampling and a Novel Feature Selection Algorithm. arXiv 2019, arXiv:1902.09962. [Google Scholar]
- Yao, X.; Cheng, Q.; Zhang, G.-Q. A Novel Independent RNN Approach to Classification of Seizures against Non-Seizures. arXiv 2019, arXiv:1903.09326. [Google Scholar]
- Siami-Namini, S.; Tavakoli, N.; Namin, A.S. The Performance of LSTM and BiLSTM in Forecasting Time Series. In Proceedings of the Proceedings—2019 IEEE International Conference on Big Data, Los Angeles, CA, USA, 9–12 December 2019; pp. 3285–3292. [Google Scholar]
- Aziz Sharfuddin, A.; Nafis Tihami, M.; Saiful Islam, M. A Deep Recurrent Neural Network with BiLSTM Model for Sentiment Classification. In Proceedings of the 2018 International Conference on Bangla Speech and Language Processing, ICBSLP 2018, Sylhet, Bangladesh, 21–22 September 2018. [Google Scholar]
- Andrzejak, R.G.; Lehnertz, K.; Mormann, F.; Rieke, C.; David, P.; Elger, C.E. Indications of Nonlinear Deterministic and Finite-Dimensional Structures in Time Series of Brain Electrical Activity: Dependence on Recording Region and Brain State. Phys. Rev. E 2001, 64, 061907. [Google Scholar] [CrossRef] [PubMed] [Green Version]
- Cho, K.; van Merrienboer, B.; Gulcehre, C.; Bahdanau, D.; Bougares, F.; Schwenk, H.; Bengio, Y. Learning Phrase Representations Using RNN Encoder-Decoder for Statistical Machine Translation. arXiv 2014, arXiv:1406.1078. [Google Scholar]
- Gers, F.A.; Schraudolph, N.N.; Schmidhuber, J. Learning Precise Timing with LSTM Recurrent Networks. J. Mach. Learn. Res. 2002, 3, 115–143. [Google Scholar]
- Pearlmutter, B.A. Learning State Space Trajectories in Recurrent Neural Networks. Neural Comput. 1989, 1, 263–269. [Google Scholar] [CrossRef]
- Yu, Y.; Si, X.; Hu, C.; Zhang, J. A Review of Recurrent Neural Networks: Lstm Cells and Network Architectures. Neural Comput. 2019, 31, 1235–1270. [Google Scholar] [CrossRef] [PubMed]
- Gers, F.A.; Schmidhuber, J.; Cummins, F. Learning to Forget: Continual Prediction with LSTM. Neural Comput. 2000, 12, 2451–2471. [Google Scholar] [CrossRef] [PubMed]
- Graves, A.; Schmidhuber, J. Framewise Phoneme Classification with Bidirectional LSTM and Other Neural Network Architectures. Neural Netw. 2005, 18, 602–610. [Google Scholar] [CrossRef]
- Khan, U.; Khan, S.; Rizwan, A.; Atteia, G.; Jamjoom, M.M.; Samee, N.A. Aggression Detection in Social Media from Textual Data Using Deep Learning Models. Appl. Sci. 2022, 12, 5083. [Google Scholar] [CrossRef]
- Sun, T.; Yang, C.; Han, K.; Ma, W.; Zhang, F. Bidirectional Spatial–Temporal Network for Traffic Prediction with Multisource Data. Transp. Res. Rec. 2020, 2674, 78–89. [Google Scholar] [CrossRef]
- Emmert-Streib, F.; Moutari, S.; Dehmer, M. A Comprehensive Survey of Error Measures for Evaluating Binary Decision Making in Data Science. Wiley Interdiscip. Rev. Data Min. Knowl. Discov. 2019, 9, e1303. [Google Scholar] [CrossRef] [Green Version]
- Baldi, P.; Brunak, S.; Chauvin, Y.; Andersen, C.A.F.; Nielsen, H. Assessing the Accuracy of Prediction Algorithms for Classification: An Overview. Bioinformatics 2000, 16, 412–424. [Google Scholar] [CrossRef] [PubMed] [Green Version]
- Matthews, B.W. Comparison of the Predicted and Observed Secondary Structure of T4 Phage Lysozyme. Biochim. Et Biophys. Acta (BBA)-Protein Struct. 1975, 405, 442–451. [Google Scholar] [CrossRef]
- Chicco, D.; Tötsch, N.; Jurman, G. The Matthews Correlation Coefficient (Mcc) Is More Reliable than Balanced Accuracy, Bookmaker Informedness, and Markedness in Two-Class Confusion Matrix Evaluation. BioData Min. 2021, 14, 13. [Google Scholar] [CrossRef] [PubMed]
- Hanley, J.A.; McNeil, B.J. The Meaning and Use of the Area under a Receiver Operating Characteristic (ROC) Curve. Radiology 1982, 143, 29–36. [Google Scholar] [CrossRef] [PubMed]
- Chen, X.; Robinson, D.G.; Storey, J.D. The Functional False Discovery Rate with Applications to Genomics. Biostatistics 2021, 22, 68–81. [Google Scholar] [CrossRef] [PubMed] [Green Version]
- Farcomeni, A. A Review of Modern Multiple Hypothesis Testing, with Particular Attention to the False Discovery Proportion. Stat. Methods Med. Res. 2008, 17, 347–388. [Google Scholar] [CrossRef] [PubMed]
- Genovese, C.R.; Wasserman, L. Exceedance Control of the False Discovery Proportion. J. Am. Stat. Assoc. 2006, 101, 1408–1417. [Google Scholar] [CrossRef]
- Iverson, G.L. Negative Predictive Power. In Encyclopedia of Clinical Neuropsychology; Springer: New York, NY, USA, 2011; pp. 1720–1722. [Google Scholar]
- Atteia, G.E.; Mengash, H.A.; Samee, N.A. Evaluation of Using Parametric and Non-Parametric Machine Learning Algorithms for Covid-19 Forecasting. Int. J. Adv. Comput. Sci. Appl. 2021, 12, 647–657. [Google Scholar] [CrossRef]
- Alhussan, A.; Abdel Samee, N.; Ghoneim, V.; Kadah, Y. Evaluating Deep and Statistical Machine Learning Models in the Classification of Breast Cancer from Digital Mammograms. (IJACSA) Int. J. Adv. Comput. Sci. Appl. 2021, 12, 304–313. [Google Scholar] [CrossRef]
- Samee, N.A.; Atteia, G.; Meshoul, S.; Al-Antari, M.A.; Kadah, Y.M. Deep Learning Cascaded Feature Selection Framework for Breast Cancer Classification: Hybrid CNN with Univariate-Based Approach. Mathematics 2022, 10, 3631. [Google Scholar] [CrossRef]
- Samee, N.A.; Alhussan, A.A.; Ghoneim, V.F.; Atteia, G.; Alkanhel, R.; Al-antari, M.A.; Kadah, Y.M. A Hybrid Deep Transfer Learning of CNN-Based LR-PCA for Breast Lesion Diagnosis via Medical Breast Mammograms. Sensors 2022, 22, 4938. [Google Scholar] [CrossRef] [PubMed]
- Atteia, G.; Samee, N.A.; El-Kenawy, E.-S.M.; Ibrahim, A. CNN-Hyperparameter Optimization for Diabetic Maculopathy Diagnosis in Optical Coherence Tomography and Fundus Retinography. Mathematics 2022, 10, 3274. [Google Scholar] [CrossRef]


| Class Description | No. of Samples | Class Labels | Binary Classification Samples |
|---|---|---|---|
| seizure | 2300 | 1 | 2300 |
| First normal (Before seizure the signal of the patient)- | 2300 | 0 | 9200 |
| Second normal (Healthy brain EEG recorded data)- | 2300 | - | - |
| Third normal—Eyes closed have no seizure | 2300 | - | - |
| Fourth normal—Eyes opened have no-seizure | 2300 | - | - |
| Layers | Other Parameters | Value |
|---|---|---|
| RNN layer | Batch size = 100 Epochs = 100 Learning rate = 0.01 ADAM | Hidden 100 Units |
| BiLSTM | Hidden 200 Units | |
| FC layer | 2 FC layers- | |
| SoftMax | Cross entropy | |
| Classification Layer |
| Classifier | Learning Parameters |
|---|---|
| SVM | Kernel function = Sigmoid Kernel Function |
| KNN | K = 5 |
| RF | n-estimators = 10 |
| Publication | Method | EEG Class | Dataset | Acc (%) | Sens (%) | Spec (%) |
|---|---|---|---|---|---|---|
| Yao et al. [34] | Independent RNN | binary | CHB-MIT | 87% | 87.3% | 86.7% |
| Raghu et al. [32] | Transfer learning and CNN | 8 classes | Temple University Hospital EEG signals | 88.3% | - | - |
| Choi et al. [21] | hybrid model (1D CNN and GRU) | binary | Asan Medical Center Children’s Hospital | 82.86 % | 80% | - |
| Najafi et al. [2]. | hybrid RNN and LSTM | binary | HCTM hospital’s EEG data | 96.1% | 96.8% | 97.4% |
| Hilal et al. [6] | Deep Clinical Sparse Autoencoder | binary | UCI-Epileptic | 98.67%. | 99.19% | 99.2% |
| Mursalin et al. [33] | Hybrid metaheuristic Feature selection, and traditional ML-based classifiers | binary | UCI-Epileptic | 98.7% | - | - |
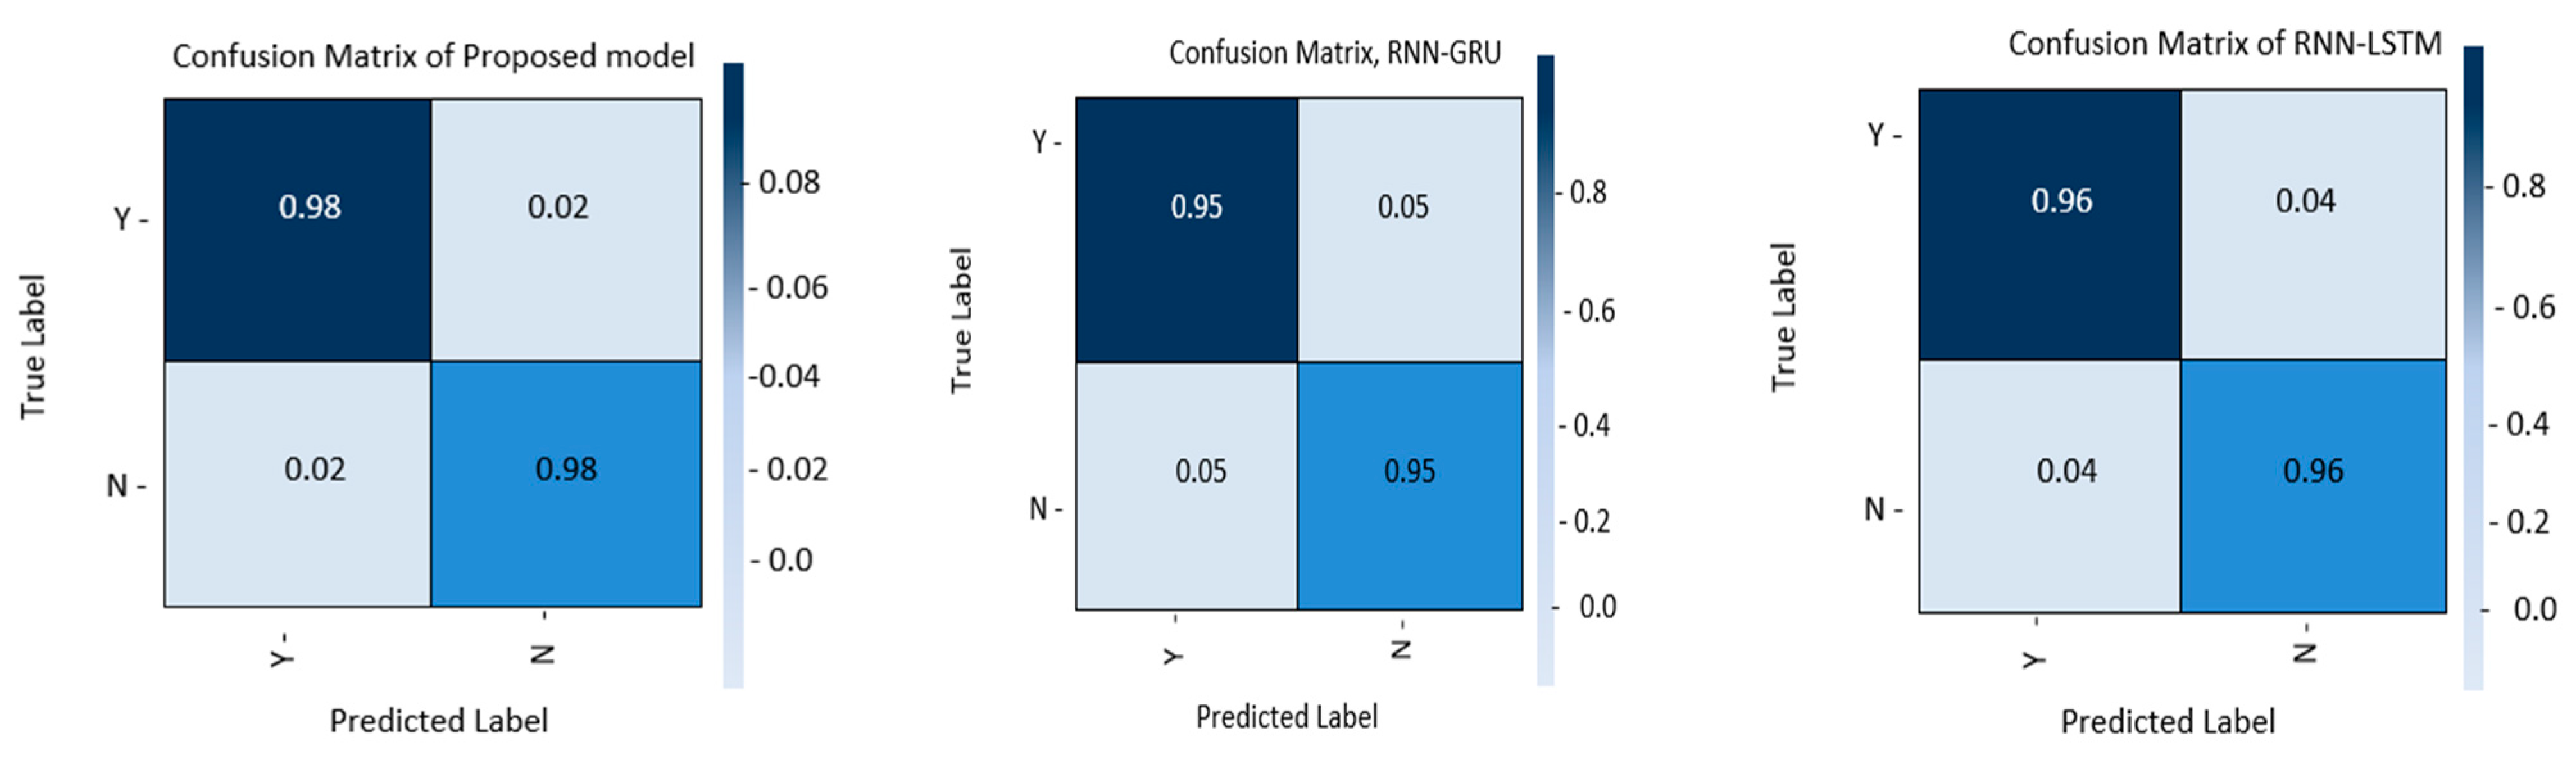
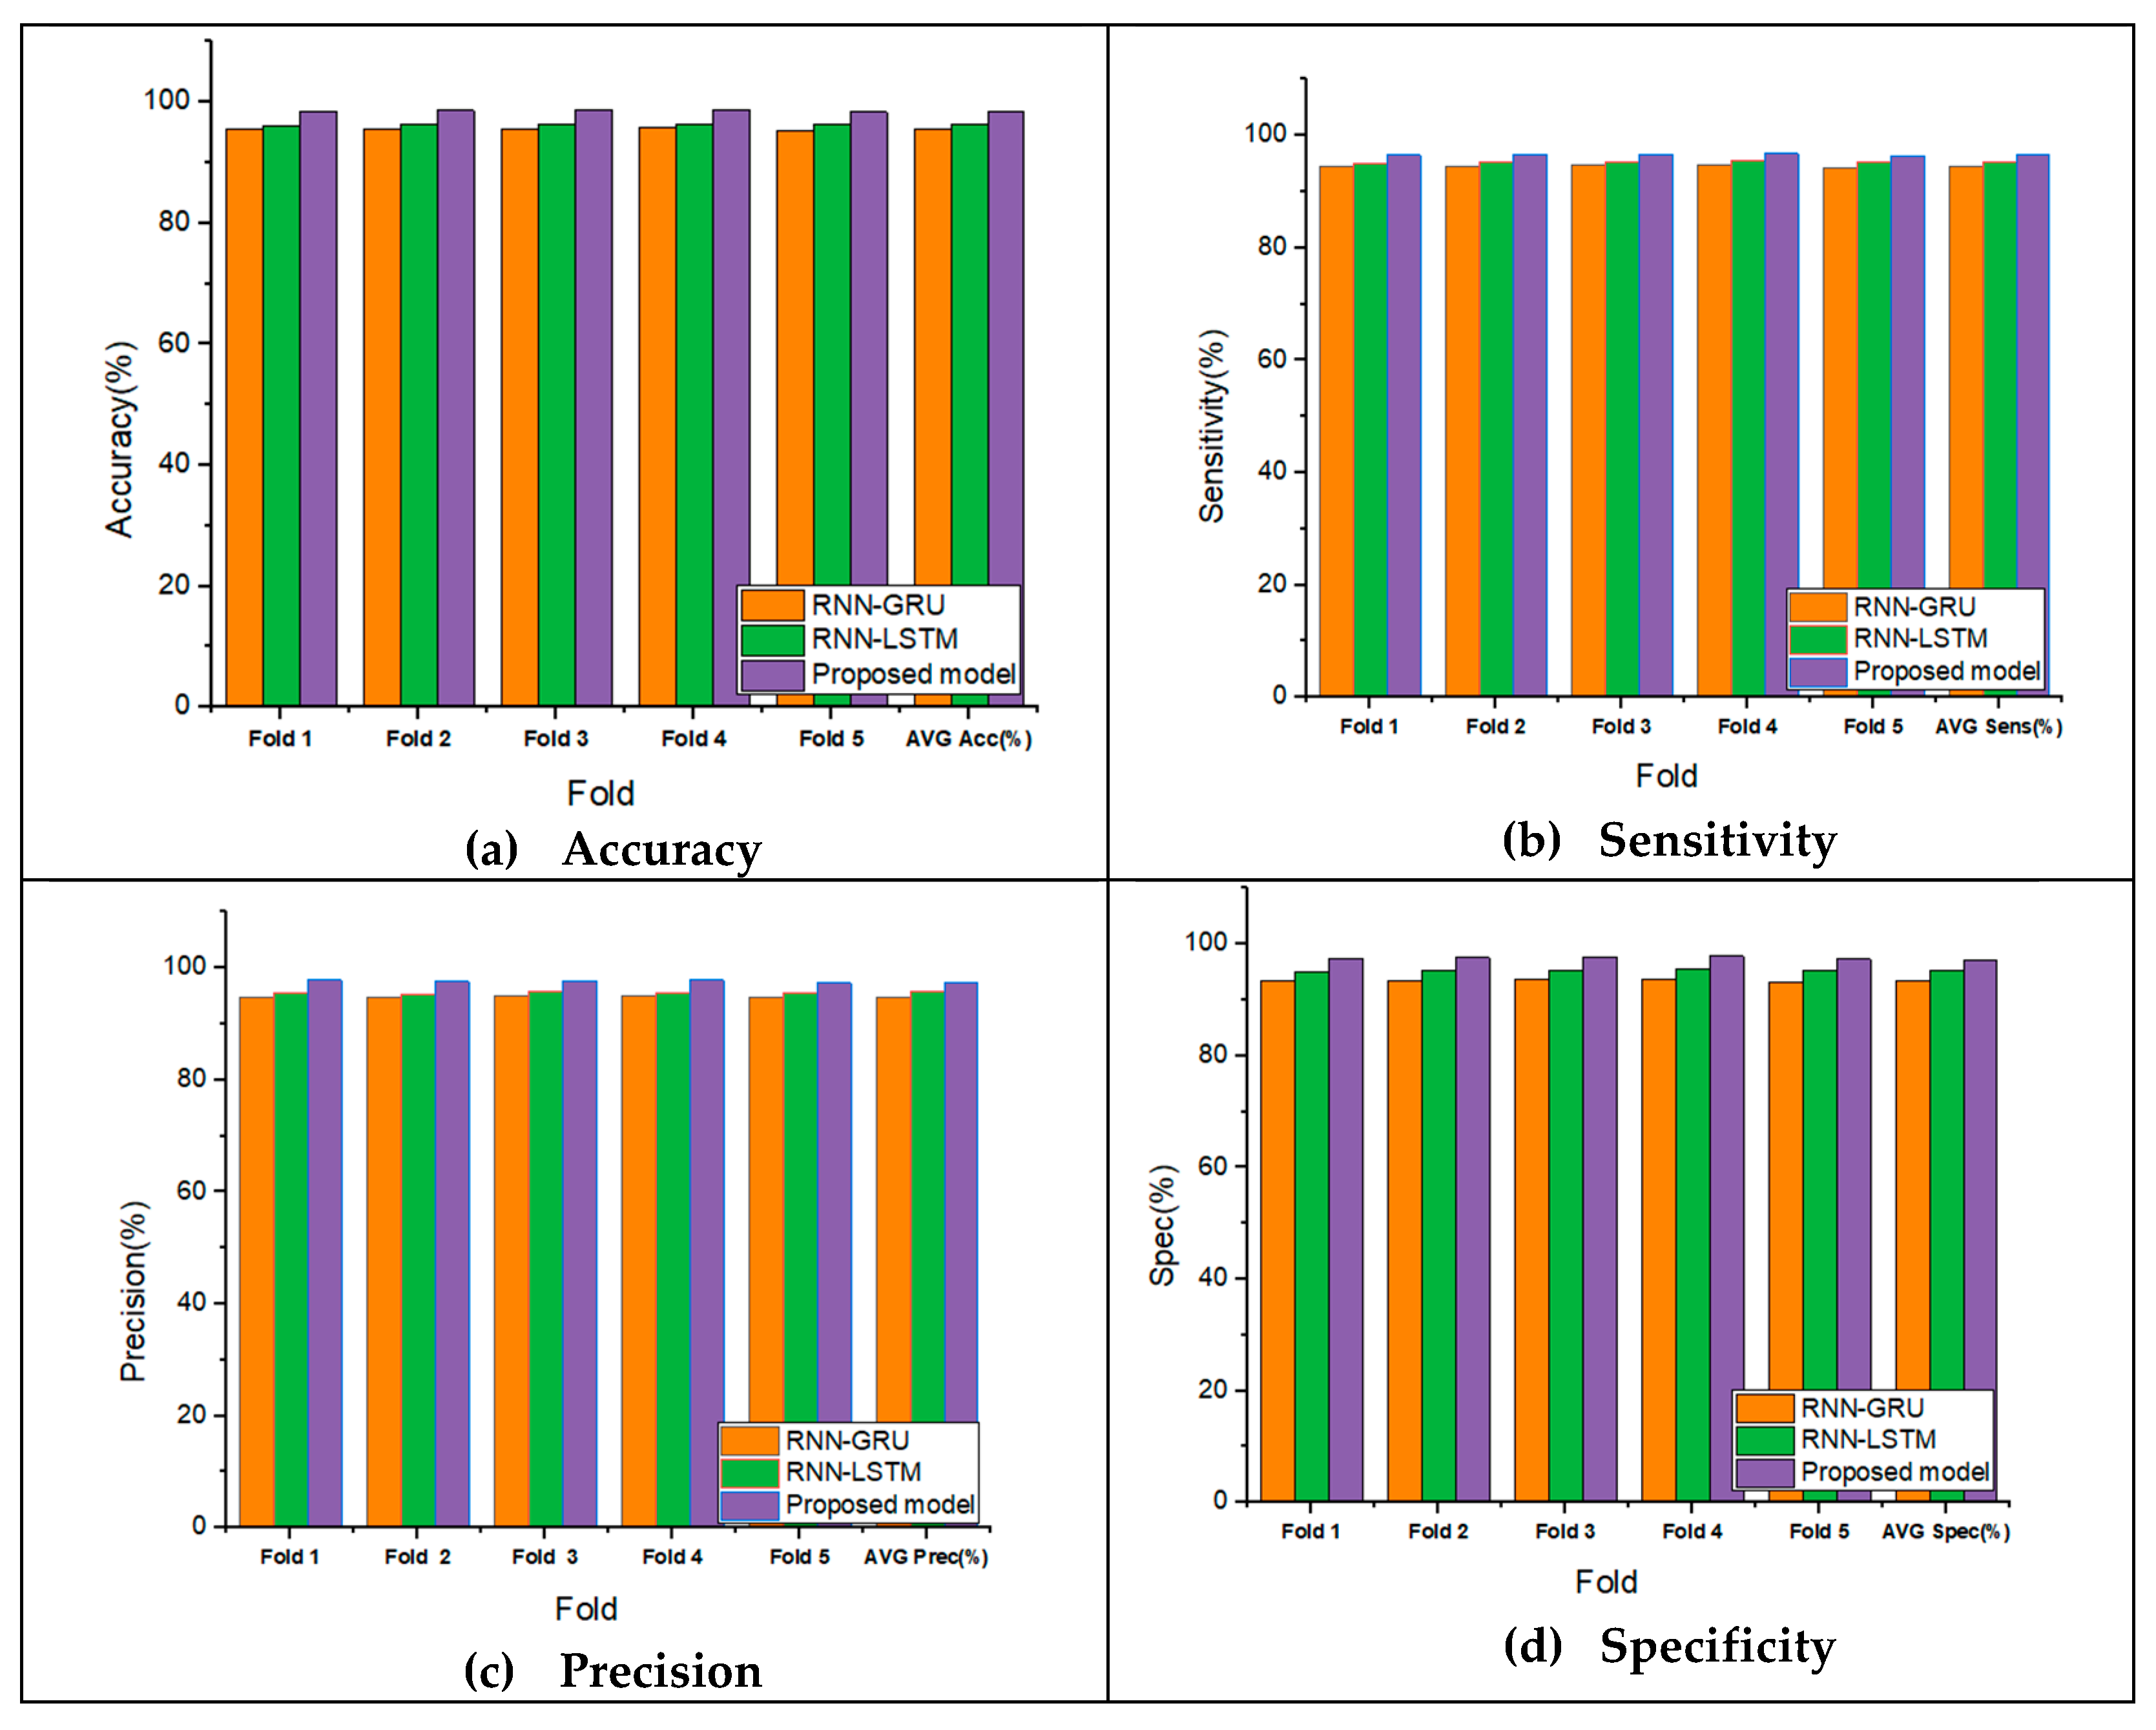
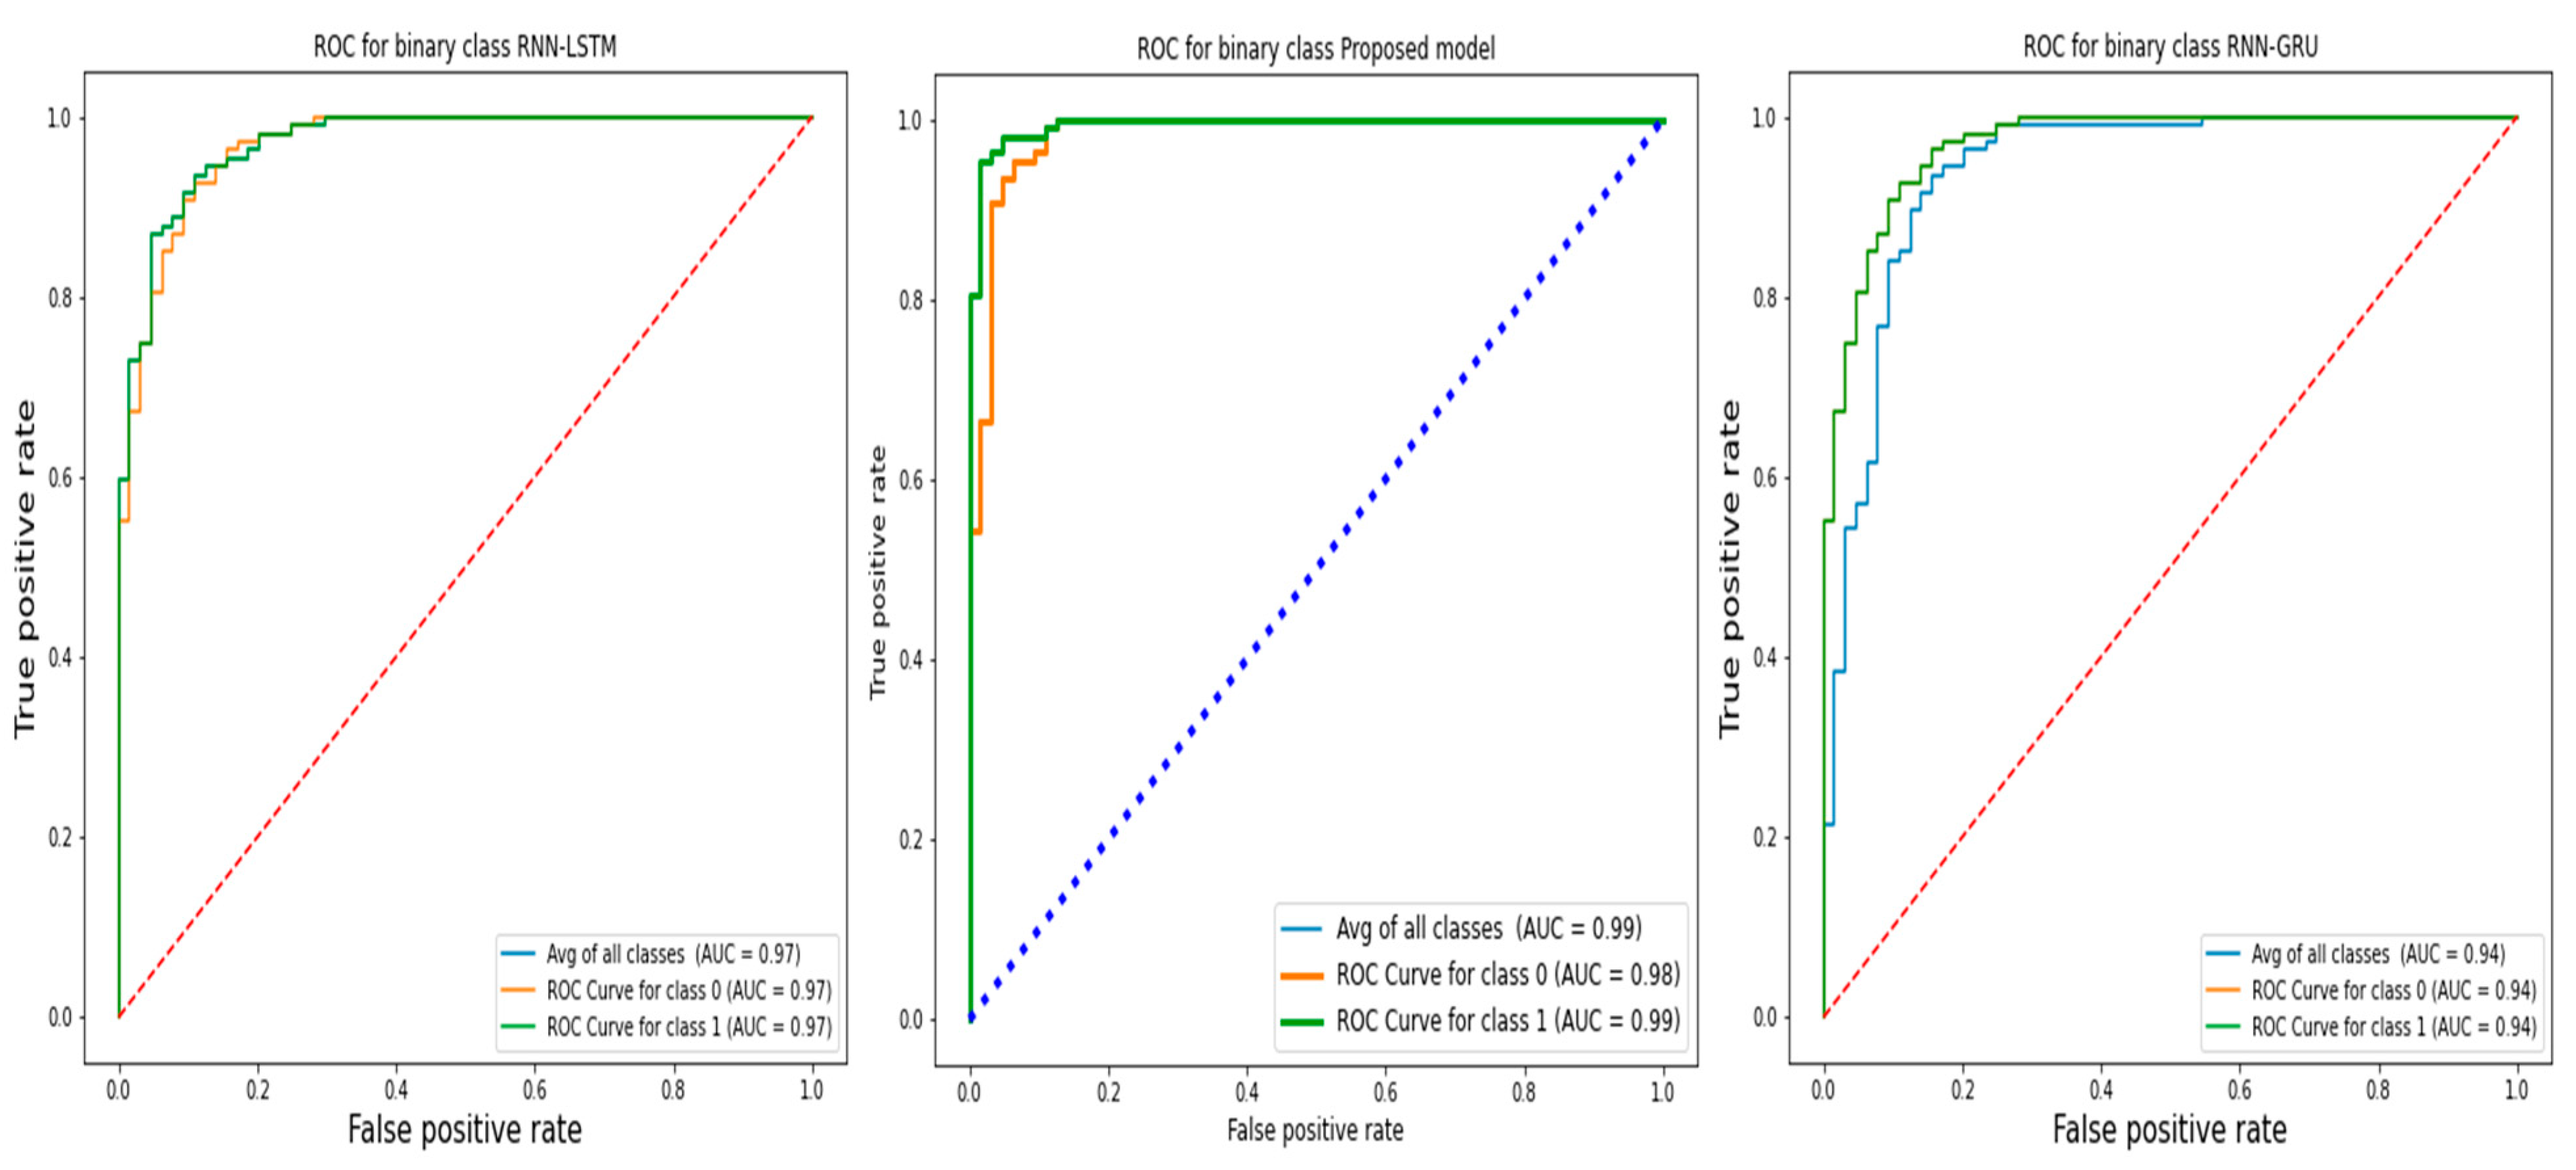
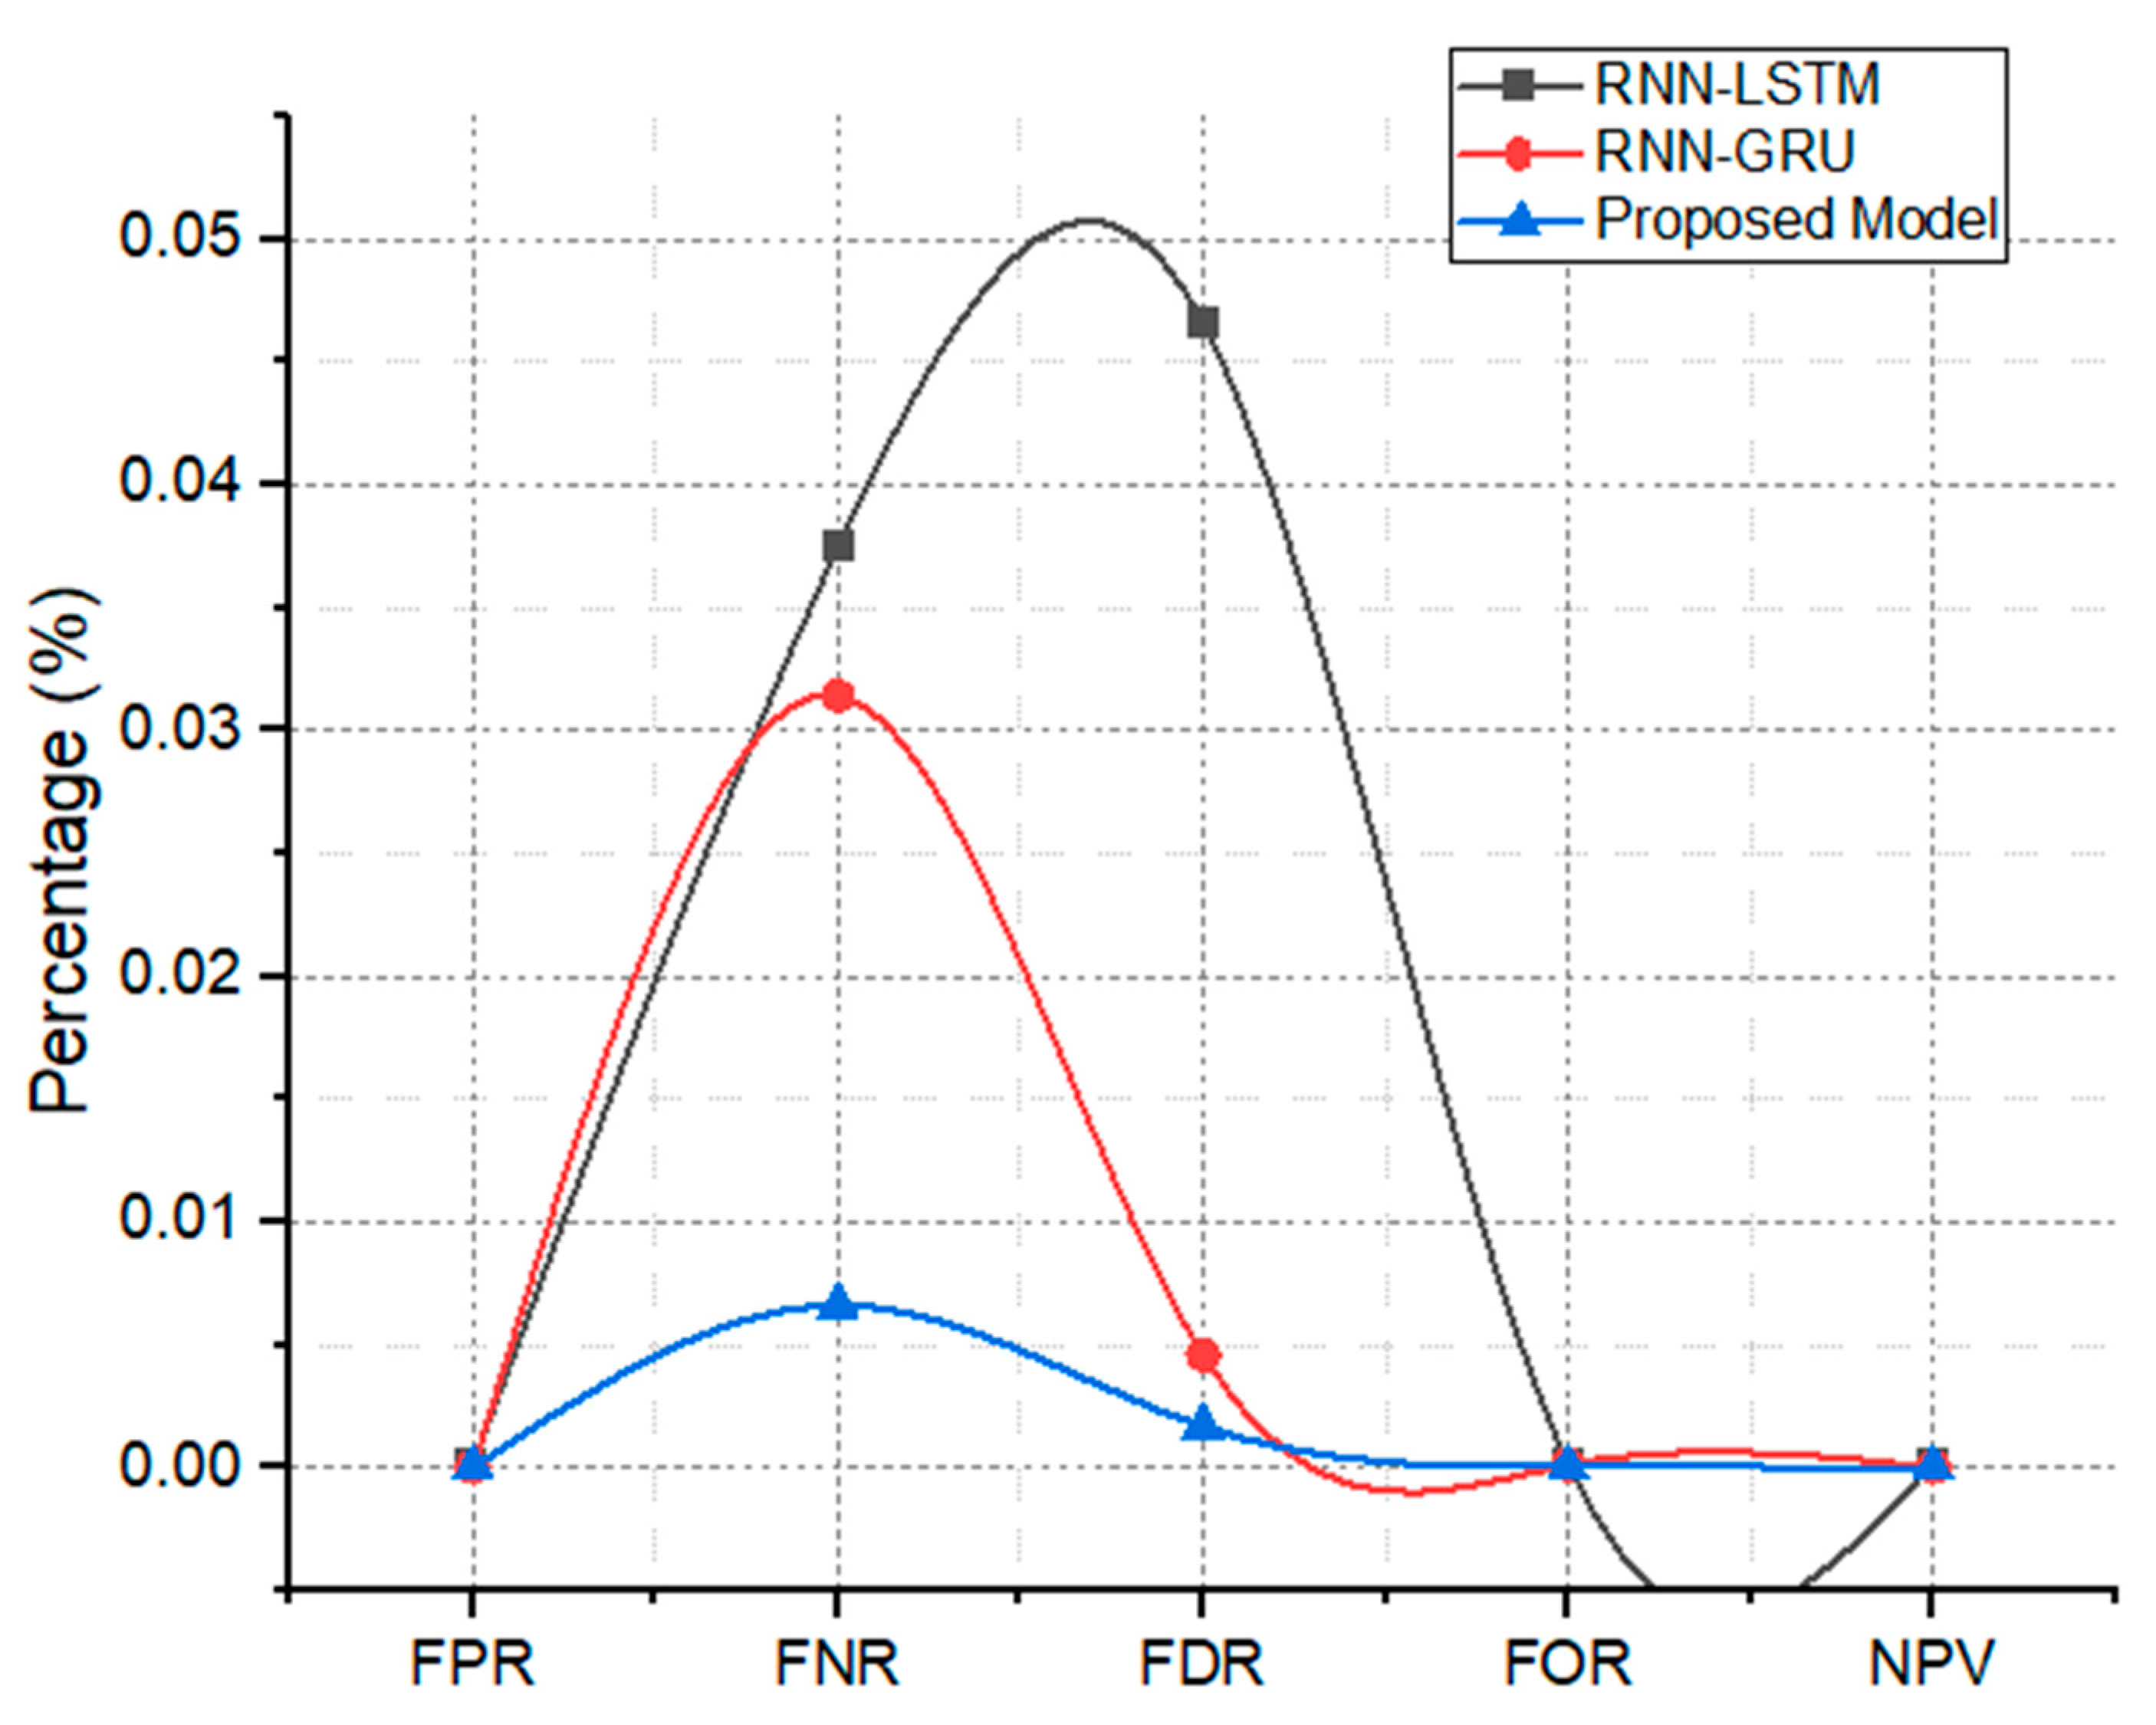
| Proposed model | Hybrid RNN-BiLSTM model | binary | UCI-Epileptic | 98.4% | 98.30% | 98.10% |
Publisher’s Note: MDPI stays neutral with regard to jurisdictional claims in published maps and institutional affiliations. |
© 2022 by the authors. Licensee MDPI, Basel, Switzerland. This article is an open access article distributed under the terms and conditions of the Creative Commons Attribution (CC BY) license (https://creativecommons.org/licenses/by/4.0/).
Share and Cite
Samee, N.A.; Mahmoud, N.F.; Aldhahri, E.A.; Rafiq, A.; Muthanna, M.S.A.; Ahmad, I. RNN and BiLSTM Fusion for Accurate Automatic Epileptic Seizure Diagnosis Using EEG Signals. Life 2022, 12, 1946. https://doi.org/10.3390/life12121946
Samee NA, Mahmoud NF, Aldhahri EA, Rafiq A, Muthanna MSA, Ahmad I. RNN and BiLSTM Fusion for Accurate Automatic Epileptic Seizure Diagnosis Using EEG Signals. Life. 2022; 12(12):1946. https://doi.org/10.3390/life12121946
Chicago/Turabian StyleSamee, Nagwan Abdel, Noha F. Mahmoud, Eman A. Aldhahri, Ahsan Rafiq, Mohammed Saleh Ali Muthanna, and Ijaz Ahmad. 2022. "RNN and BiLSTM Fusion for Accurate Automatic Epileptic Seizure Diagnosis Using EEG Signals" Life 12, no. 12: 1946. https://doi.org/10.3390/life12121946