Article

Effects of Different Hard Finishing Processes on Gear Excitation

Gear Research Centre (FZG), Department of Mechanical Engineering, Technical University of Munich, D-85748 Garching bei München, Germany
*
Author to whom correspondence should be addressed.
Machines 2021, 9(8), 169; https://doi.org/10.3390/machines9080169
Submission received: 28 June 2021 / Revised: 30 July 2021 / Accepted: 11 August 2021 / Published: 16 August 2021
(This article belongs to the Special Issue Structural Health Monitoring for Mechanical Systems)

Abstract

:
Gearboxes are essential in mechanical drive trains for power transmission. A low noise emission and thus an optimized excitation behavior is a substantial design objective for many applications in terms of comfort and operational safety. There exist numerous processes for manufacturing gears, which all show different properties in relation to the process variables and, therefore, differences in the resulting accuracy and quality of the gear flank. In this paper, the influence of three different manufacturing processes for hard finishing—continuous generating grinding, polish grinding and gear skiving—on the surface structure of gear flanks and the excitation behavior is investigated experimentally and analyzed by the application force level. A tactile scanning of the gear flanks determines the flank surface structure and the deviations from the desired geometry. A torsional acceleration measurement during speed ramp-ups at different load levels is used to analyze the excitation of the gears. The results show only a minor influence of the surface structure on the application force level. The excitation behavior is dominated by the influence of the flank modification and its deviation from the design values.

1. Introduction

1.1. Motivation

For the efficient operation of a gear pair, the quality, geometrical accuracy and the shape of the gear tooth profile is essential. In regard to the performance of gears the surface structure of a gear flank is crucial. The flank microstructure influences power losses, load-carrying capacities and the noise behavior of gears. In particular, clearly visible structures, e.g., feeding marks, may have an impact on excitation behavior. Therefore, the different manufacturing processes affect gear noise differently [1].
For gear finishing, several processes are available, such as continuous generating grinding, polish grinding or gear skiving. Continuous generating grinding and polish grinding use the same machine kinematics compared to those of a worm drive. Gear skiving can be considered as a combination of both gear shaping and gear hobbing [2]. Due to the different kinematics, defined and undefined tool edges and tool materials, the resulting surface structure differs among these finishing processes. Research indicates that on a small scale, the traces of the tooling from the manufacturing process have an impact on gear noise [3]. Studies tackling this impact are rare, especially studies also considering gear skiving.
A common approach to assess the noise from a gearbox is to measure the excitation of the gear stage. Generally, a measurement of the acceleration or of structure-borne noise as well as the transmission error under load is used. The dynamic test rig of the Gear Research Centre (FZG) is equipped with state-of-the-art sensors and measurement equipment in order to characterize the influence of different gear finishing processes on the noise and vibration behavior.

1.2. Objective and Approach

The objective of the present study is to analyze the microstructure and the microgeometry of the flank surface resulting from the different manufacturing processes—continuous generating grinding, polish grinding and gear skiving. The effects on gear excitation of the different manufacturing processes is discussed using the application force level L A , F [3].
The state of the art focuses on the different manufacturing processes, NVH analysis of gears and the effects of the gears’ manufacturing processes on gear excitation. For the experimental study, one general gear design is manufactured by continuous generating grinding, polish grinding and gear skiving. A thorough measurement of the manufactured gears reveals the deviations from the manufacturing process. The particular surface structures of the different manufacturing processes are analyzed. The effects of the different structures on NVH are analyzed by experiments using the dynamic test rig of the FZG and compared by the application force level L A , F . After the discussion, the present study is concluded.

1.3. State of the Art

Continuous generating grinding is an established process with a geometrically undefined cutting edge used for the hard finishing of gears. The used grinding wheel is shaped as a worm gear. Graf [4] states a mean roughness value of R a =   0.4   μ m for continuous generating grinding. The pitch speed and the axial feed-rate is small compared to the cutting speed [5]. Therefore, the processing traces mainly appear in the transverse direction of the gear.
Polish grinding is a final machining sequence after continuous generating grinding. Polish grinding mainly removes the roughness peaks, while the workpiece remains clamped on the part holder. For this manufacturing process a tool with two different sections is used. One section of the tool is the vitrified-bonded grinding wheel for the grinding operations, and the other section is resin-bonded for polishing. Graf [4] states a mean roughness value of R a =   0.15   μ m for polish grinding. Polish grinding further reduces the surface roughness of ground gears. The manufacturing process also rounds off the edges of the face width.
The axis of the tool and the workpiece in the gear skiving process cross each other. The skiving kinematics is similar to the kinematics of crossed-axis helical gears. Skiving cutters have a shape that is similar to the shape of a gear. The crossed axis lead to a spiral motion. The superimposed generating and spiral motion cause the cutting edges of the tool to slide along the tooth flanks of the workpiece and remove the material over the full face width [6]. The superimposed generating and spiral motion lead to diagonal processing traces [7,8]. Thus, the gears manufactured by gear skiving have a particular surface structure.
Gearbox noise emission is mainly due to the excitation and vibration behavior in the gear mesh. The main influencing factors are the time-varying tooth stiffness, the deviations in the tooth flank contour from the ideal involute due to machining errors or tooth flank modifications, the deformation of the shaft-bearing system, the deformation of the teeth and the associated increase in contact ratio under load, as well as the roughness and surface structure of the tooth flank [3]. Several possibilities to determine experimentally the excitation behavior of gearboxes exist [3,9]. Structure-borne noise and torsional acceleration measurements are well suited for including the overall dynamic behavior of the drive system into the measurement. Evaluating the data and calculating a single characteristic value, such as the application force level L A , F [3], enables a simple and clear comparison of different gear variants.
It is challenging to evaluate the effect of the manufacturing process on noise behaviour. In 1965, a systematic analysis of the noise behavior of gears that were manufactured in different ways was published. The analysis by Winter included 340 gears. Elevators rated the noise behaviour of the different gear pairs [10].
The impact of ripples on noise are analyzed by Gravel [11]. A software describes ripples in a deviation curve, which is based on the results of an individual error test [12]. In a simulation of the cutting process Gravel calculates and represents the deviations as a gear measurement report. The simulation includes hobbing and generating grinding and it is also possible to derive a 3D topography. The results of the simulation and measurement are compared.
Standard modifications and periodic flank modifications allow low noise. Amplitudes in a sub-micrometer range and less are necessary for pure waveform modifications [13]. The manufacturing process also influences gear noise. The effects of periodic deviations, which result from the traces of the tooling, in the tooth flank on noise cannot be evaluated on the basis of gear tooth quality [3]. Waveform modifications that are based on periodic modiciations are derived by Kohn et al. [14]. These waveform modifications enable low noise without conflicting a high load-carrying capacity.

2. Materials and Methods

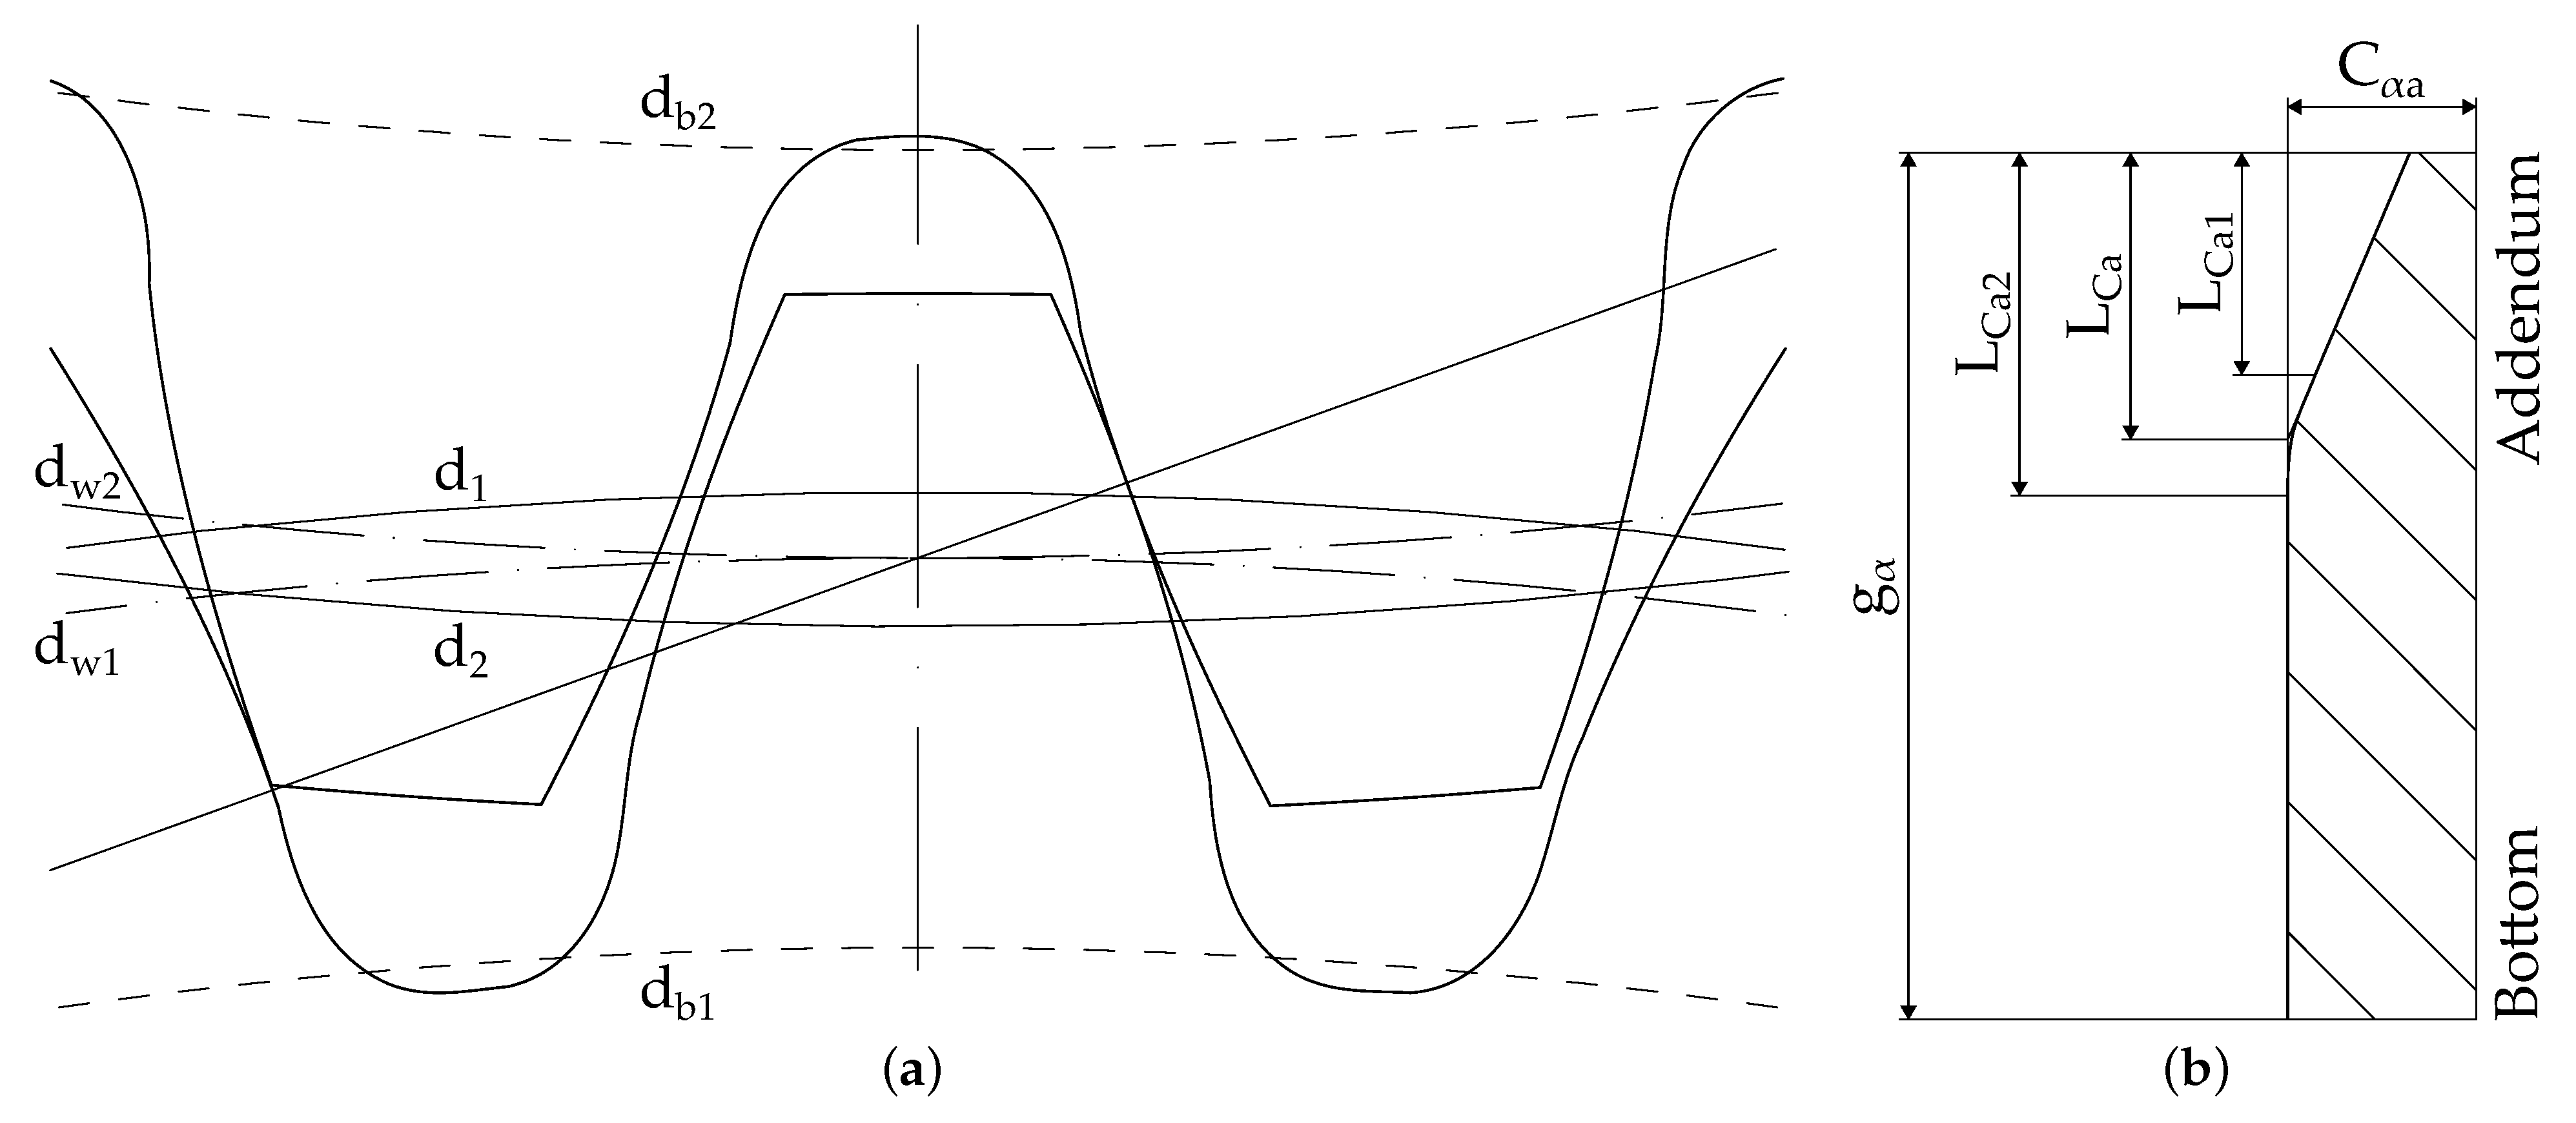
2.1. Gear Design Used in the Experiment

Table 1 shows the main parameters of the gear pair used for the experiment. The dynamic test rig of the FZG defines the center distance of the gear pair. The similar number of teeth ensures a low gear mesh resonance frequency and thereby allows test conditions including the gear main resonance area. The chosen face width results in an integer overlap ratio, which is a bit higher than 1. This results in a theoretical low excitation level (see [3]).
STplus, a program by the Research Association for Drive Technology (FVA), calculates the gear parameters and the load capacity. The profile is modified by tip relief, which is mainly linear in relation to tip relief roll length L Ca . The transition is rounded parabolically. Using tip relief avoids mesh interference at the beginning and ending of the mesh due to the tooth bending under load. Thus, the gear is less sensitive to deviations and deformations. The effects of the parabolic transition on the transmission error are small. The right and left flank have the same tip relief. Table 2 shows the parameters of the tip relief. Figure 1 shows the macro- und micro geometry of the gear pair used in the experiment.
The FVA-program Dynamic Tooth Force Program (DZP) analyzes the NVH performance of gear pairs. Figure 2 shows the peak-to-peak transmission error under load for the designed gear calculated with DZP. The minimium of the peak-to-peak transmission error of the gear pair with modification occurs at 600 N m , which is the design torque of this modification.

2.2. Manufacturing of the Test Gears

The material of the test gears is 16MnCr5. After rough cutting, the gears are case hardened. The hard finishing of the test gears is performed at Reishauer AG in Switzerland. On the one hand, the established methods continuous generating grinding and polish grinding are used. The skived gears, on the other hand, are finished on a test rig used for preproduction analysis. Three gear pairs are manufactured for each manufacturing method. An additional gear pair is manufactured by gear skiving with half of the axial feed of the three other skived gears.
For continuous generating grinding and polish grinding, the Reishauer RZ 260 continuous generating gear grinding machine is used [15]. The polish grinding pass is deactivated for the continuous generating ground gears. The grinding section of the tool is an A80 G8 (rigid vitrified bonded, 80-grit) and the polishing section an EK800 (elastic-resin bonded, 800-grit) [16]. The dimensions of the grinding wheel are 275 × 160 × 160 m m ( d a × b × d i ). The number of starts on the grinding worm gear is 4. The cutting speed v c is 75 m s−1. The infeed for polishing is 10 μ m .
For skiving, an experimental setup is used. The tool is a carrier with a single tooth cutter for experimental setup. The machine is a test carrier with four axes. The cutting speed v c is 120 m min−1 with an axial feed of 0.1   m in relation to the tooth gap.
Table 3 gives an overview of the test gear pairs. The label of each gear starts with A to D, followed by the manufacturing process. “gen” denotes continuous generating grinding, while “pol” or “ski” denote polish grinding or gear skiving. The label is concluded by “Pi” or “Wh” for pinion and wheel. Later in this study, the left flank is labeled “L” and the right flank is labeled “R”. A subscript (e.g., 1) denotes the number of the tooth.

2.3. Documentation of the Test Gears

Extensive measurements document the microgeometry of the flank surface from the manufactured gears. Tactile scanning is performed on a Klingelnberg P40 precision measuring centre [17]. The diameter of the measuring probe is 1 m m . Every tooth is measured including the left and right flank. Each measurement includes 40 profile and 1 lead measurement. Each trace consists of 480 evaluation points.
The measurements show the deviations from the theoretical involute. In the section of the unmodified involute the desired geometry is equal to a measurement without deviations. In the section of the tip relief the desired geometry is recorded as a deviation. In order to show the deviations from manufacturing, the desired geometry is deducted from the profile measurements. The left hand side in Figure 3 shows a result of a profile measurement and the desired geometry including the tip relief. The deviation from the desired geometry is equal to the deviation from the involute in the unmodified section. In the section of the tip relief, the deviation from the desired geometry differs from the deviation from the involute. In Figure 3 the resulting deviations at two diamters are labeled by Δ 1 and Δ 2 .
The measurements are also used in the analysis of regular wavy deviations. Figure 4 shows the deviations from the desired geometry and a wavy compensation curve. Δ a is the distance of the largest deviation. Δ t is the corresponding depth. The distance corresponds to the wavelength and the depth corresponds to the amplitude of a wave.
In order to compare the microgeometry of the flank surface relatively, the median of the deviations in a single flank Δ ˜ is deduced from the measurement (see the right side in Figure 3). For all flanks the median of a single flank is, therefore, equal to 0.
The measured deviations are also visualized three-dimensionally. For the three-dimensional visualization, the profile lines are aligned with the lead measurement. The distance of the last profile measurements at the edges of the gear is 0.55   m m . The three-dimensional visualization helps in the interpretation of the form of the deviations in one chosen flank of a gear. In addition to the actual deviations, the median for each measured point on the gear flanks is also shown (see Figure 5 for visualization methods).
For a quick overview of the whole measurement, the deviation is shown in the form of box plots. Due to the chosen method, the median is equal to 0. The lower and upper quartile limit the box. A total of 50% of the measured points on the gear flank are within this box. The whiskers indicate 2.5 % and 97.5 % of the measured points. Values outside of the whiskers are not plotted. Figure 5 shows an exemplary box plot. The box plot covers data of 40 profile measurements per flank with 480 data points per profile for all the gear’s teeth.
Roughness measurements for each manufacturing method complement the topography measurements. A Hommel T8000 measuring system [18] is used for the roughness measurement in profile direction. The probe is an Etamic TK 100. A Gauss (M1) digital filter with a cut-off of 0.25   m m according to EN ISO 11562 [19] is used. The traverse length is 2.5   m m . The measurement speed is 0.5   m m s−1. A fifth grade polynomial is used as a compensating curve with half pre- and post-travel.

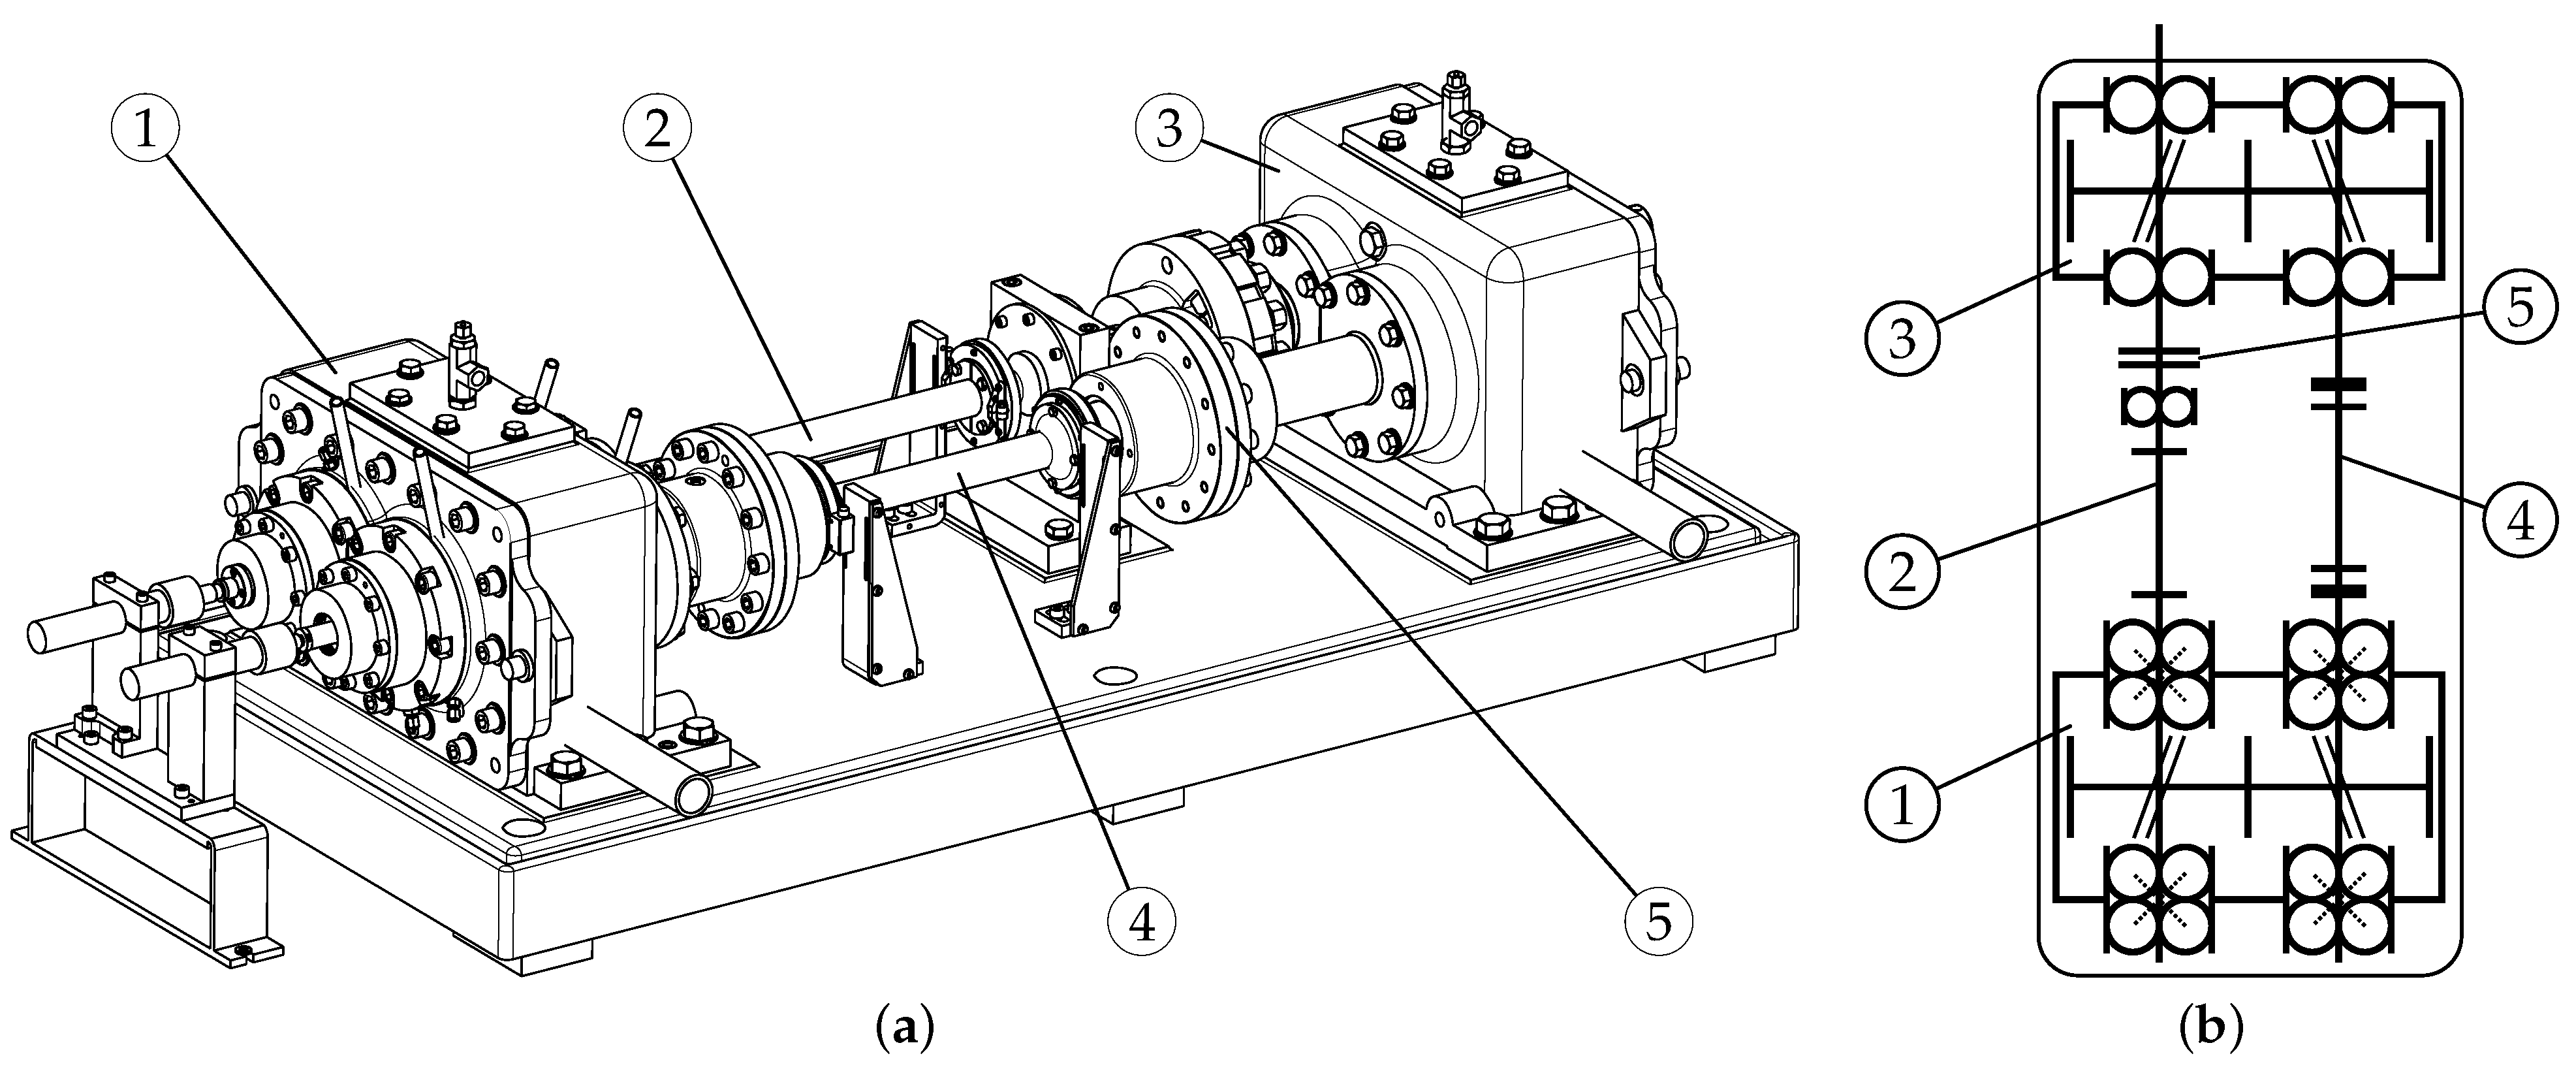
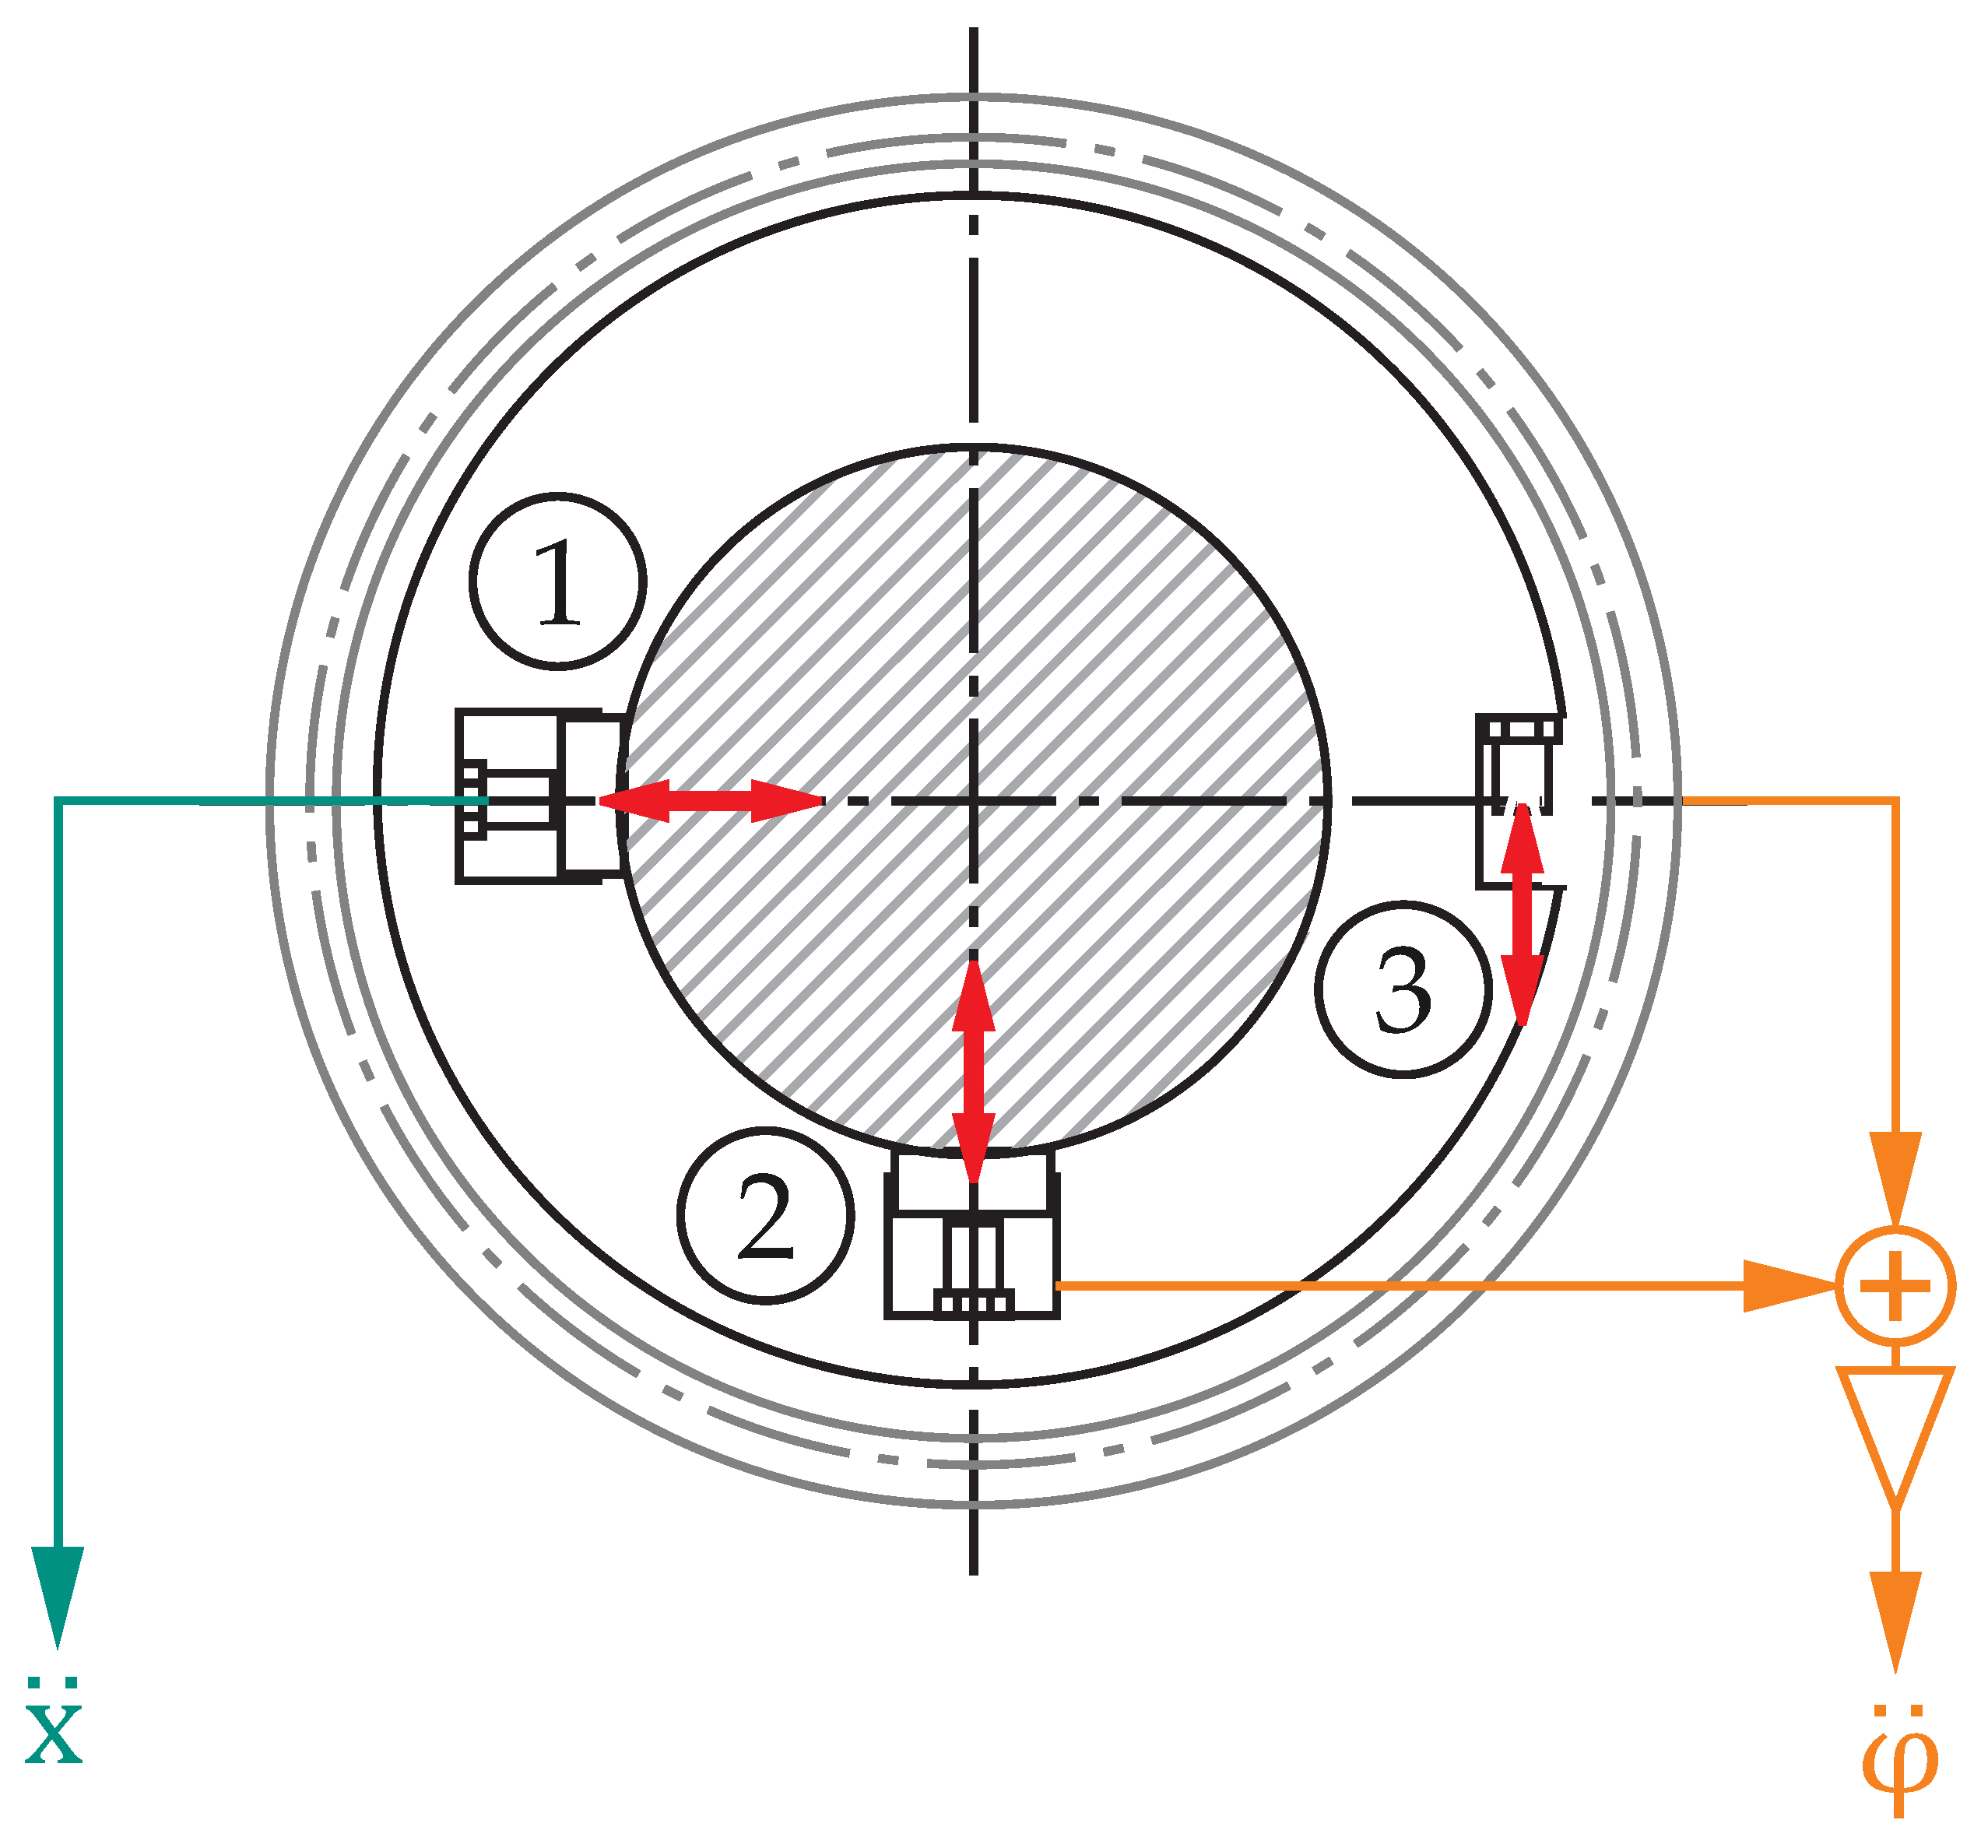
2.4. Design and Sensors of the Dynamic Test Rig

The experiments to analyze the effects of the surface structures of the different manufacturing processes on noise are performed on the dynamic test rig of the FZG with a standard center distance of 140 m m . The desired gear geometry is identical for all test gear pairs. Differences in noise mainly result from the different manufacturing methods continuous generating grinding, polish grinding and gear skiving.
The dynamic test rig uses the back-to-back (mechanical power circulating) working principle and is shown in Figure 6. Two identical gearboxes, the test and drive gearbox, are connected together by two shafts. One shaft is divided by a loading clutch. The load is applied under static conditions by opening the loading clutch and twisting both shaft ends elastically against each other. The exact torque is controlled by a lever with adjusted weights. The main and auxiliary drive motors are connected to the pinion shaft. Due to the mechanical power circulating working principle, the motor only compensates the power losses (gear mesh, bearings, sealings, etc.).
The design of the FZG dynamic test rig aims at a low inertance in order to be able to determine the excitation of the gear meshing very precisely. The connecting shafts between the test and drive gearbox are designed to be particularly torsionally soft. The drive gearbox has an integer overlap ratio to minimize the influence on the measurement at the test gearbox. The gears are mounted onto the shafts by taper press fits. The precise centric fit results in high running accuracy and smooth running. In the test gearbox, both shafts are supported by tapered roller bearings matched in an X arrangement. This extremely rigid, symmetrical and backlash-free bearing arrangement allows the gear axes to be positioned as parallel as possible up to the nominal load. This minimizes the influence of assembly deviations and of the additional test rig components on the measurement results. In addition, the oil management and temperature monitoring ensures a high reproducibility of the measurements [3,14,20].
Torsional acceleration is measured by piezo-electric acceleration sensors. The sensors are mounted on a measurement disc which is directly screwed to the pinion wheel to minimize the influence of the transfer path. The sensor arrangement is shown in Figure 7. Combining the signals of the radial and tangential sensors mathematically (see also [9]) makes it possible to measure the torsional acceleration φ ¨ of the gear wheel [3,14,21]. The data transmission from the rotating shaft to the data acquisition system is carried out with a mercury rotary transmitter from MAGTROL type MT-8/A [22]. The acceleration measurement is performed at a sample rate of 102 k Hz to capture the mesh frequency and its higher harmonics and avoid aliasing.

2.5. Test Procedure and Evaluation

The experiments are performed according to the same scheme for all tested gear pairs. A 15-minute running-in sequence at a load of 400 N m and a pinion speed of 1500 min−1 smooths the flanks of the new gear pairs before the first test run. This is followed by the torsional acceleration measurements for the 6 load levels.
The acceleration measurements are performed during continuous speed ramp-ups at different load levels. First the test rig is loaded under static conditions with the lever and adjusted weights according to the required torque level (see Section 2.4). In the next step, the main drive is used to accelerate the test rig with a constant acceleration rate of 51 min−1 s−1 to a maximum pinion speed of 5050 min−1. According to the method for determining the eigenfrequency of a gear pair by Heider [3], the gear stage is operated in the subcritical speed range of the gear stage. Thus, influences of the gear mesh resonance can be neglected. During the speed ramp-up, the torsional acceleration is measured and recorded continuously. The six load stages (see Table 4) cover the load range for which the microgeometry is optimized. Lubricant is supplied by injection lubrication with FVA3A at a 50 °C oil inlet temperature.
The test data evaluation of the torsional acceleration measurement is performed with the characteristic values main program developed in [23,24]. The recorded acceleration data (time domain) is transformed into the frequency domain by using a FFT. A Campbell-diagram for each speed ramp-up is created using 380 discrete speed steps and a Hanning-windowing. The order resolution Δ ord is 0.5 . The maximum shaft order ord n 1 at the pinion is 220. The frequency resolution Δ f is 20 Hz up to a frequency of 10,000 Hz. Figure 8 is an example for such a Campbell-diagram, which shows the relevant operating range for the application force level.
For a clear comparison of the influence of the different manufacturing processes on gear excitation, the application force level L A , F is used. In the present study, the application force level L A , F is calculated based on the measured torsional acceleration. The application force level L A , F is a single characteristic value which represents the measured data (torsional acceleration) of an area of the Campbell-diagram. This area is defined by certain rotational speed ( n min and n max ), order ( ord min and ord max ) and frequency ( f min and f max ) limits. These limits are marked in Figure 8 as red lines. The limits are chosen in respect to the relevant operating range and thus the dynamic behavior of the gear stage is included.
The application force level L A , F is calculated according to Equation (1). In Equation (1) F bez is a reference force, which is defined as F bez =   10 6   N . The amplitude of the averaged and operating range weighted order spectrum F ¯ ord in Equation (1) is calculated according to Equation (2). The application force level is
L A , F = 10 log 1 F bez 2 ord = ord min ord max F ¯ ord 2 d B .
The first factor in Equation (2) creates the average of the measured torsional acceleration amplitudes F i of the same order ord but different speeds i. It is then weighted with the ratio of the width of the relevant speed band to the width of the total speed band (see second factor in Equation (2)). n min ( ord ) and n max ( ord ) denote the maximum and minimum speed, respectively, at the given order ord . The amplitude of the averaged and operating range weighted order spectrum is
F ¯ ord = i = n min ( ord ) n max ( ord ) F i ( ord ) n max ( ord ) n min ( ord ) · n max ( ord ) n min ( ord ) n max n min .
In this study, the limits in Table 5 are used to define the relevant operating range for the evaluation of the application force level L A , F (see also Figure 8). With the given order limits, the mesh order and its first three higher harmonics are assessed and included in the application force level L A , F .

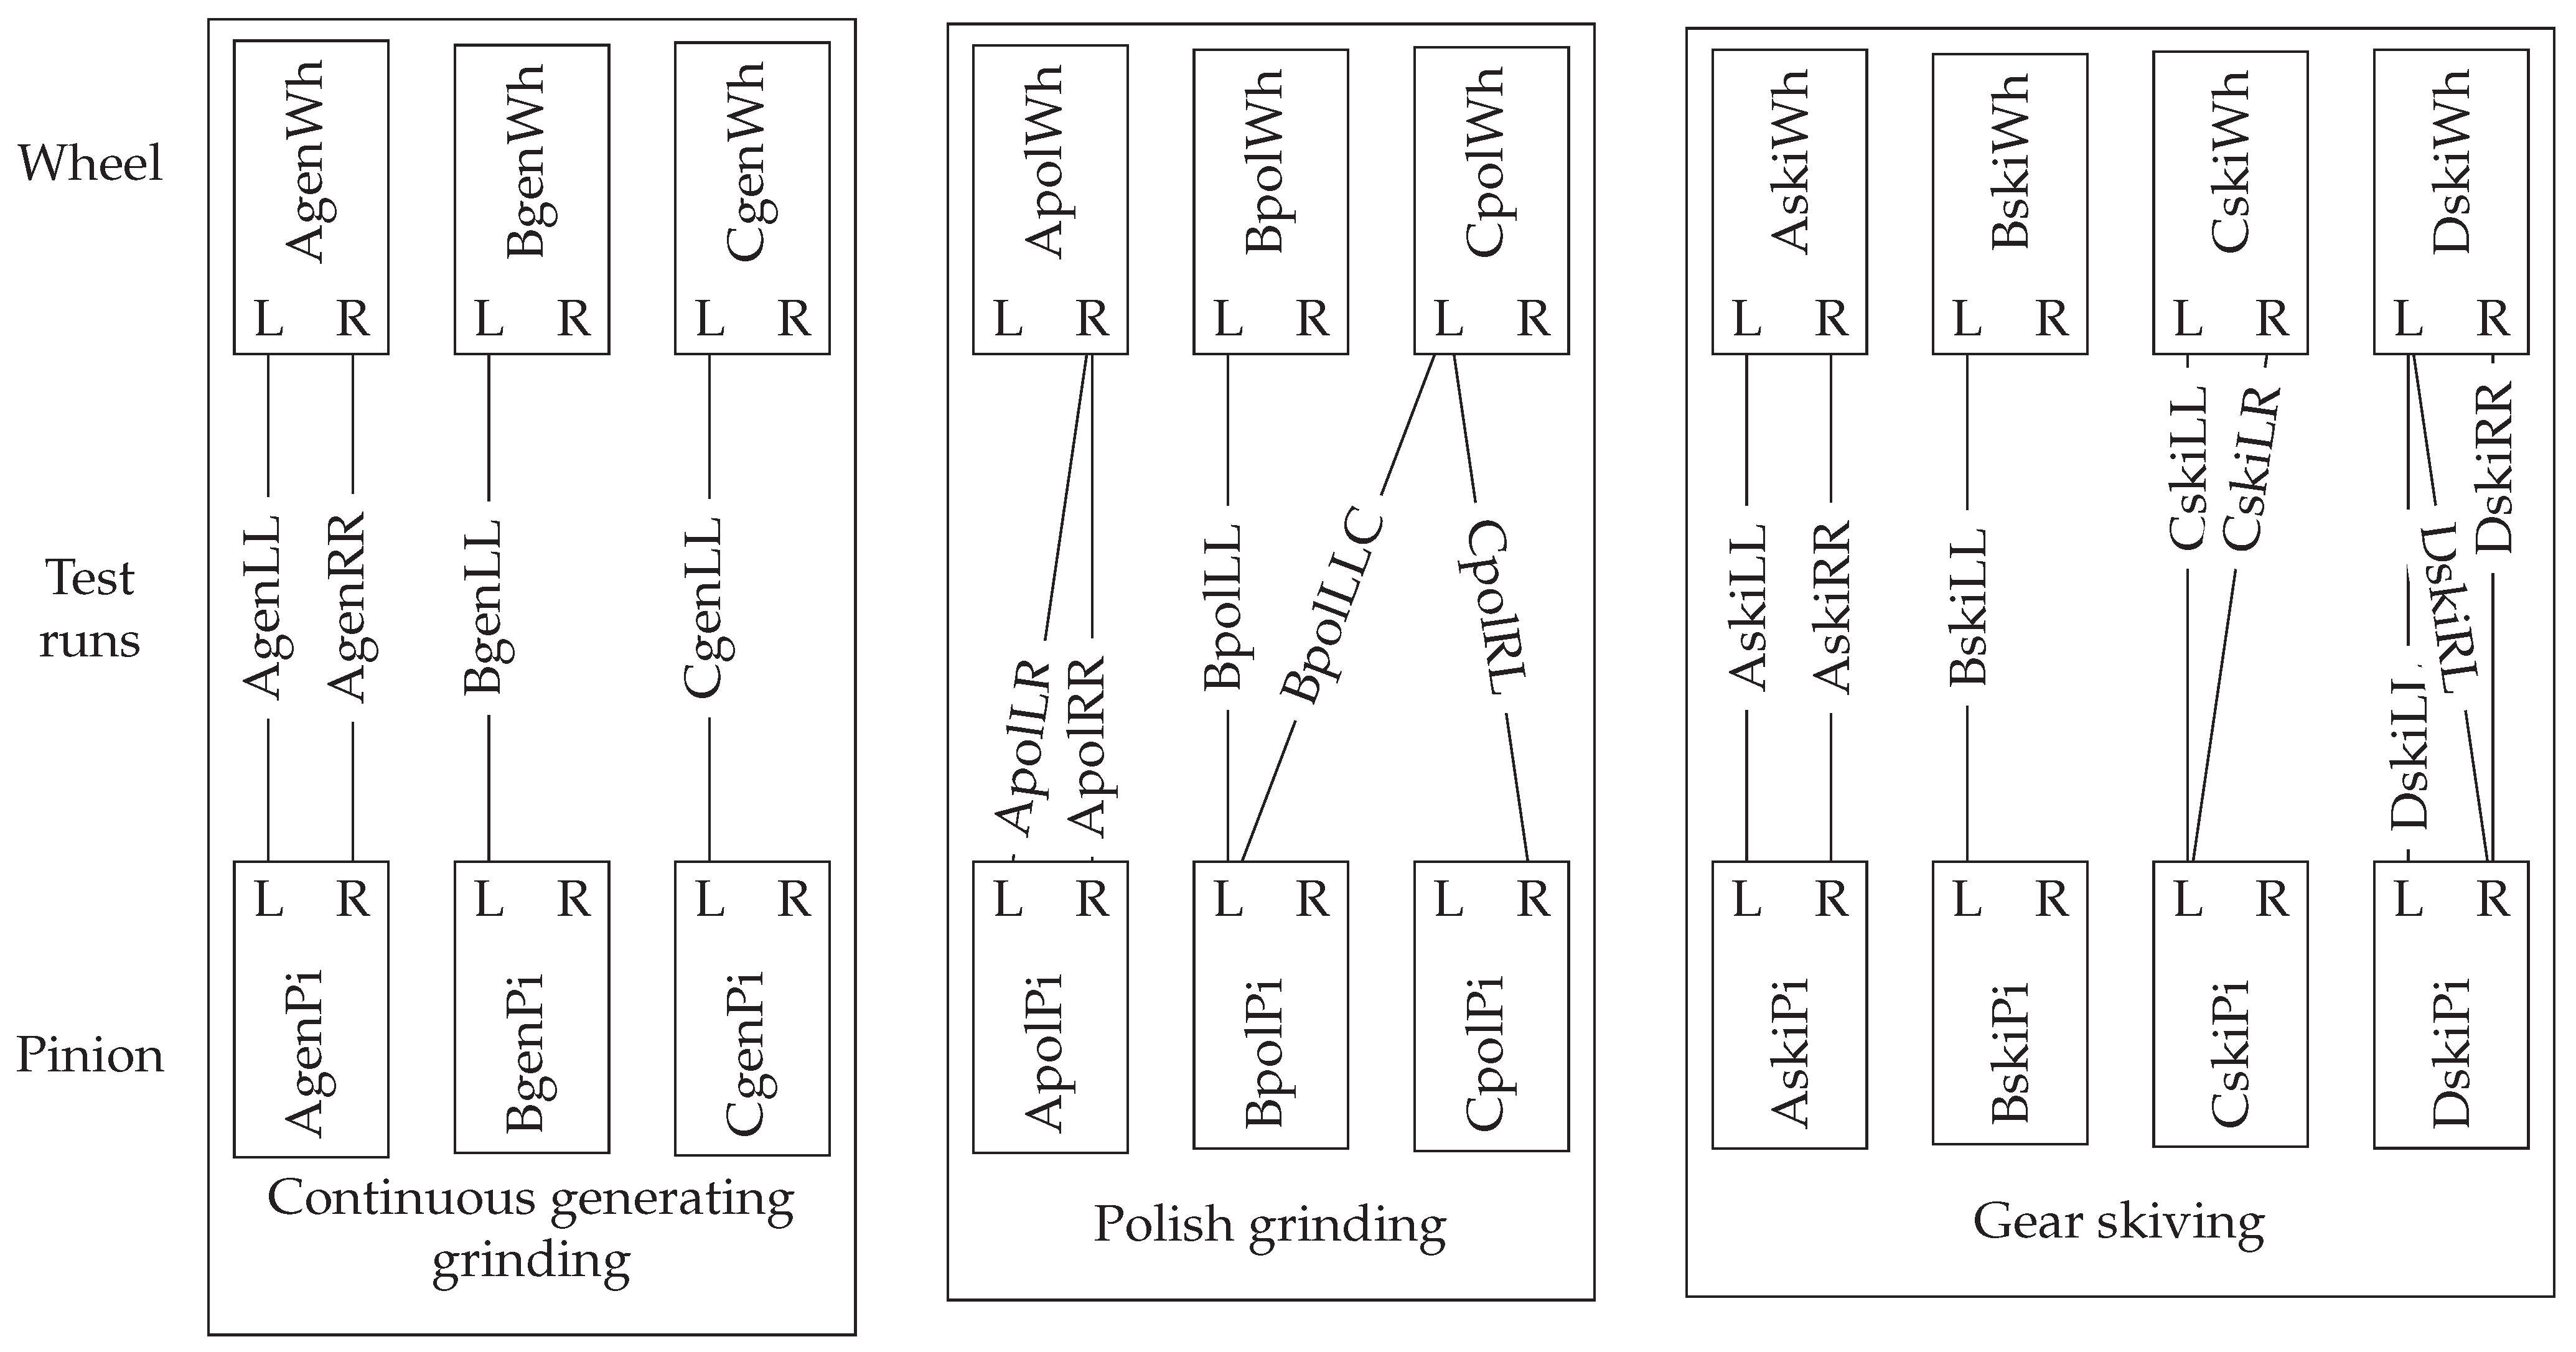
2.6. Experimental Program

The experiment on the dynamic test rig covers 17 gear pairs. The test gear pairs are divided into eight gear pairs using gear skiving, five using gear polishing and four using continuous gear grinding. The left and right flanks of the gear can be used as active flanks in the test runs to increase the number of available variants. The manufactured gears are divided into pairs for the test runs. Flanks which show the smallest deviations from the desired geometry are mainly used in the experiment. Figure 9 gives an overview of the used gear flanks in the test runs. Here, it is shown which flanks of which pinion and wheel are paired during the experiments.

3. Results

3.1. Flank Roughness

Table 6 gives the results of the flank roughness measurements for one gear for each manufacturing method. After manufacturing the R a -surface grade according to DIN 3969 [25] is equal to 2 for the polish ground, 3 for both skived and 4 for the continuous generating ground gear.

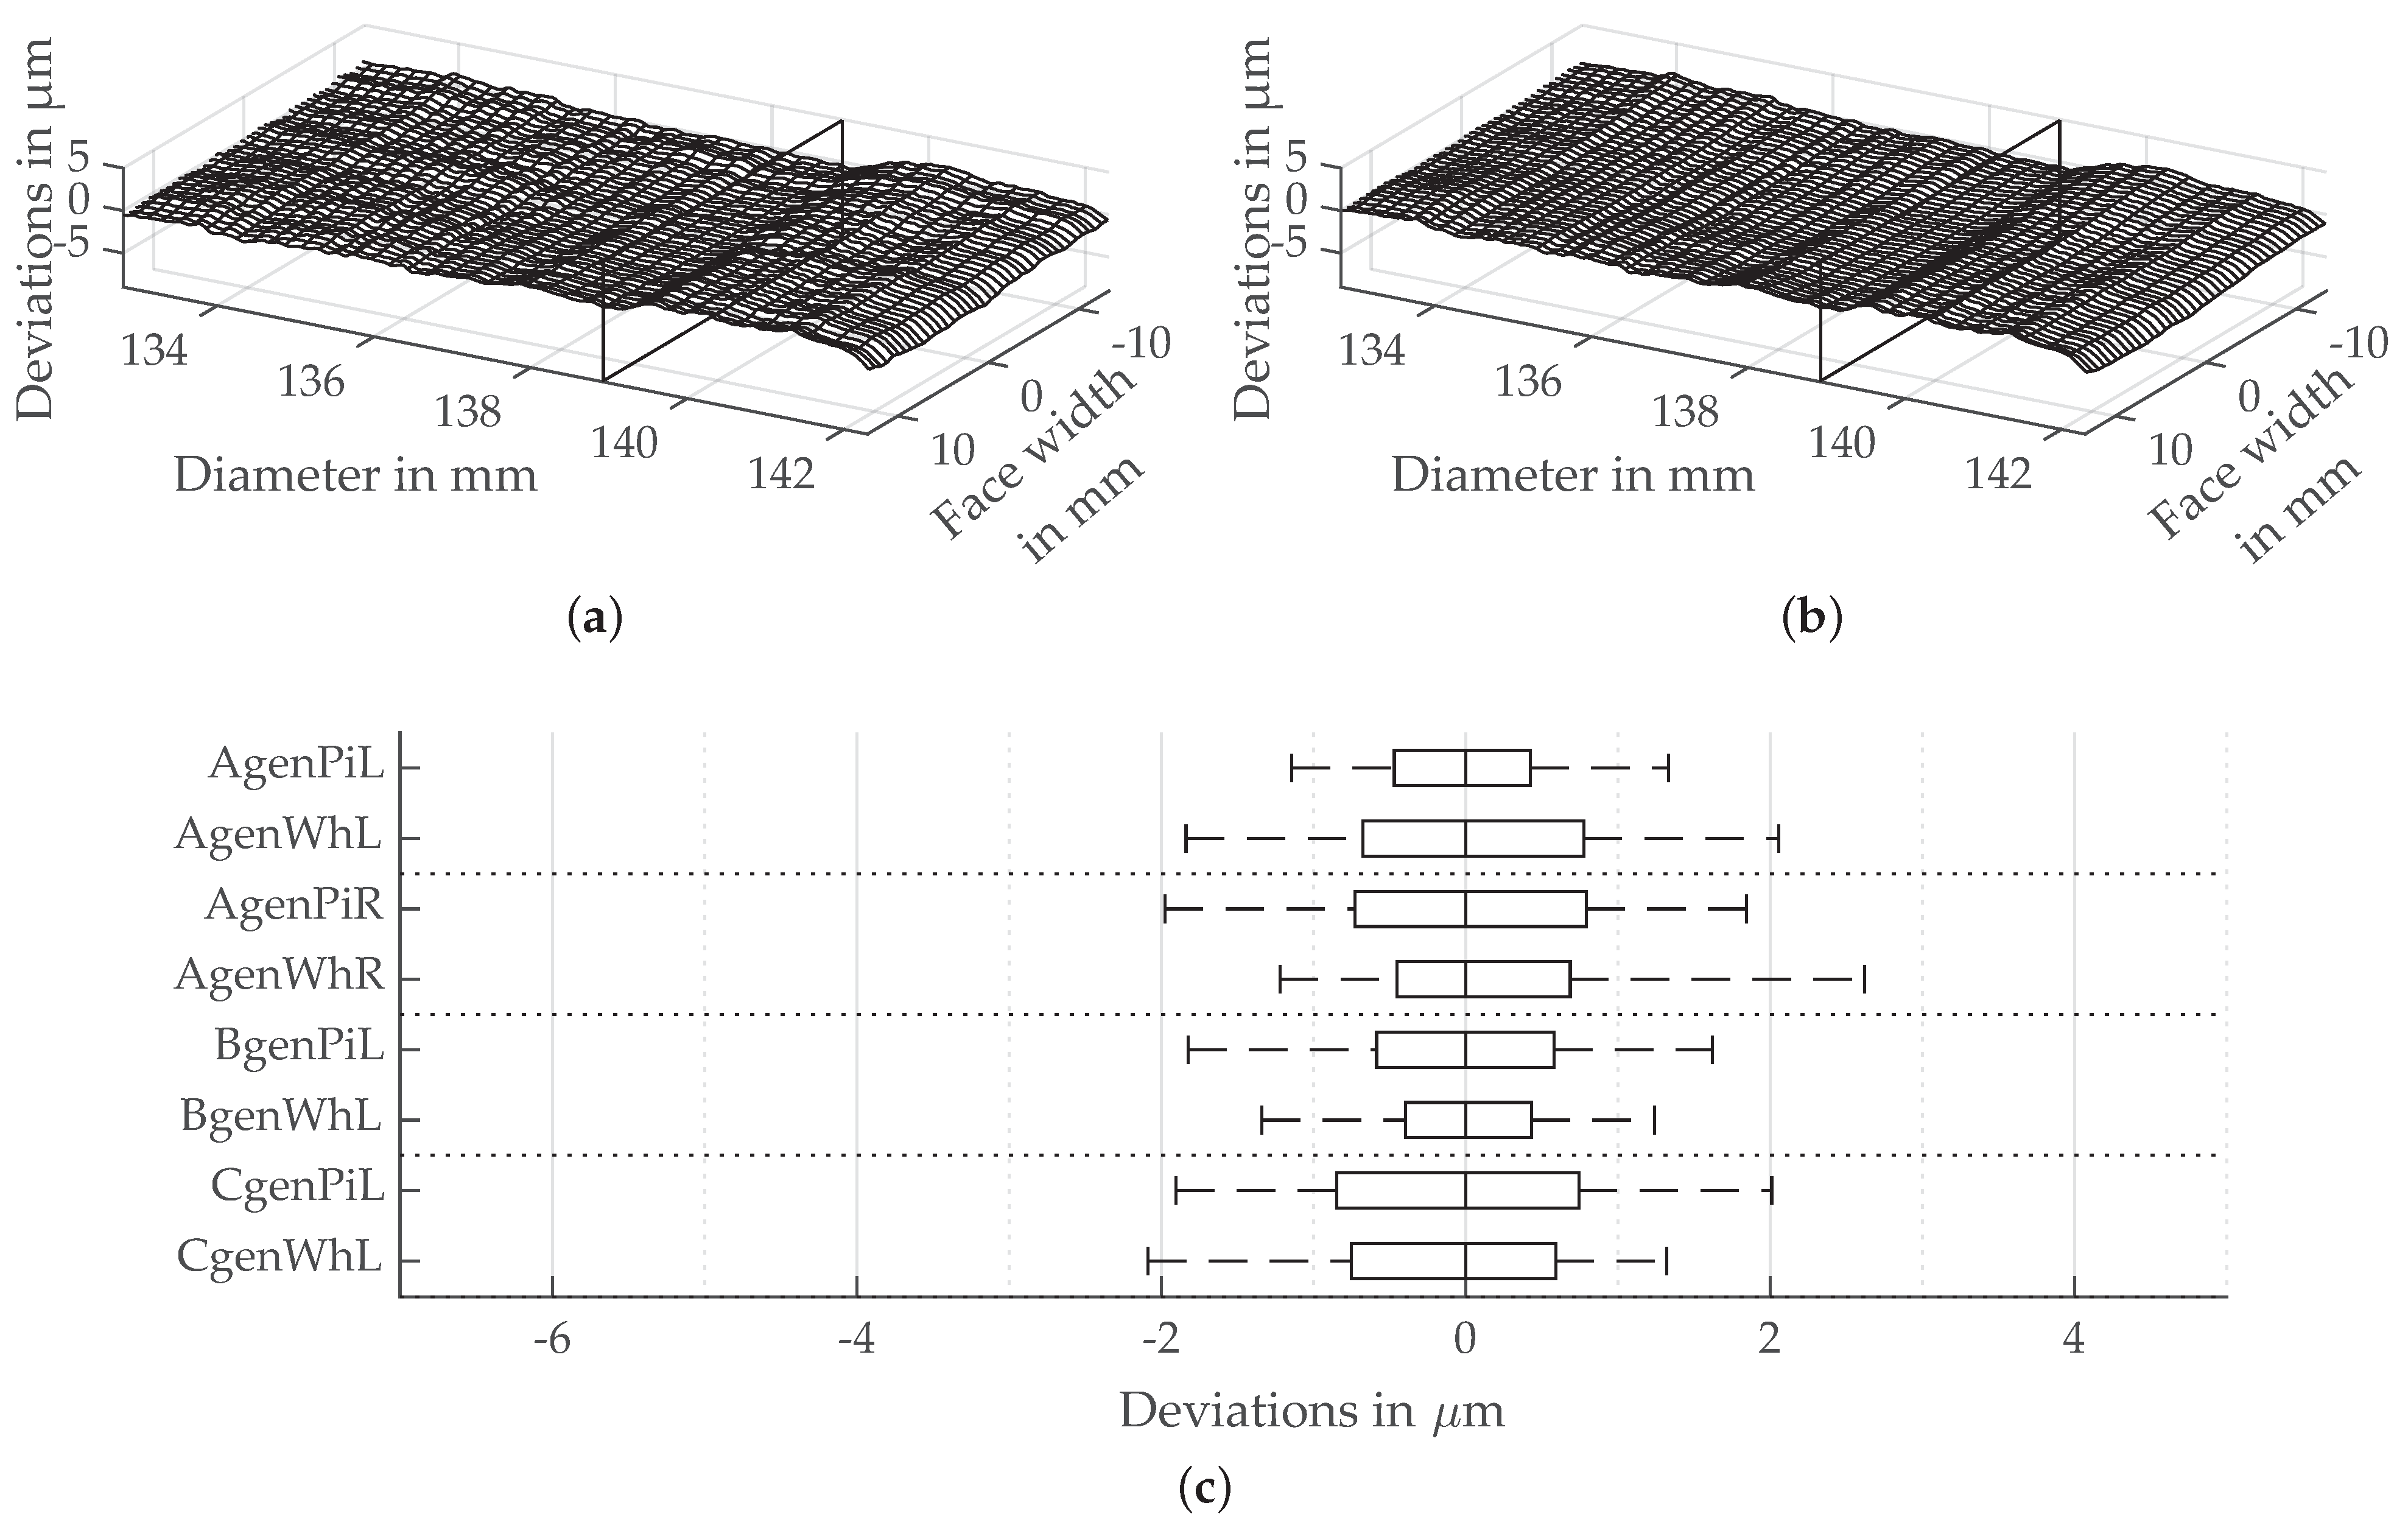
3.2. Flank Surface Structure Resulting from Continuous Generating Grinding

The surface structure and microgeometry of the gears manufactured by continuous generating grinding are very close to the desired geometry. Figure 10 shows the flank surface geometry of the gear AgenPiL at tooth nr. 34 and the median of all deviations on the left flank of this gear. In the profile direction the distance of the largest regular deviation (see Figure 4 for an explanation of the terms distance and depth) is in the range of 6 m m . The depth of this deviation is in the range of 0.5   μ m . Further regular deviations in the profile direction are in the range of a tenth of a micrometer. The tip relief is manufactured quite exactly. In the lead direction the distance of the largest regular deviation is around 22 m m . The depth of this deviation is about 0.3   μ m . Further regular deviations in the lead direction are smaller than 0.1   μ m .
The median of all deviations on the left flank of AgenPiL shows only small deviations compared to tooth nr. 34. The flank surface seems marginally smoother.
The absolute value of all the deviations in 50% of the measured flank points for continuous generating grinding is within the range of 0.3   μ m to 0.9   μ m . The absolute deviations in 95% of the measured flank points are smaller than 2.6   μ m .

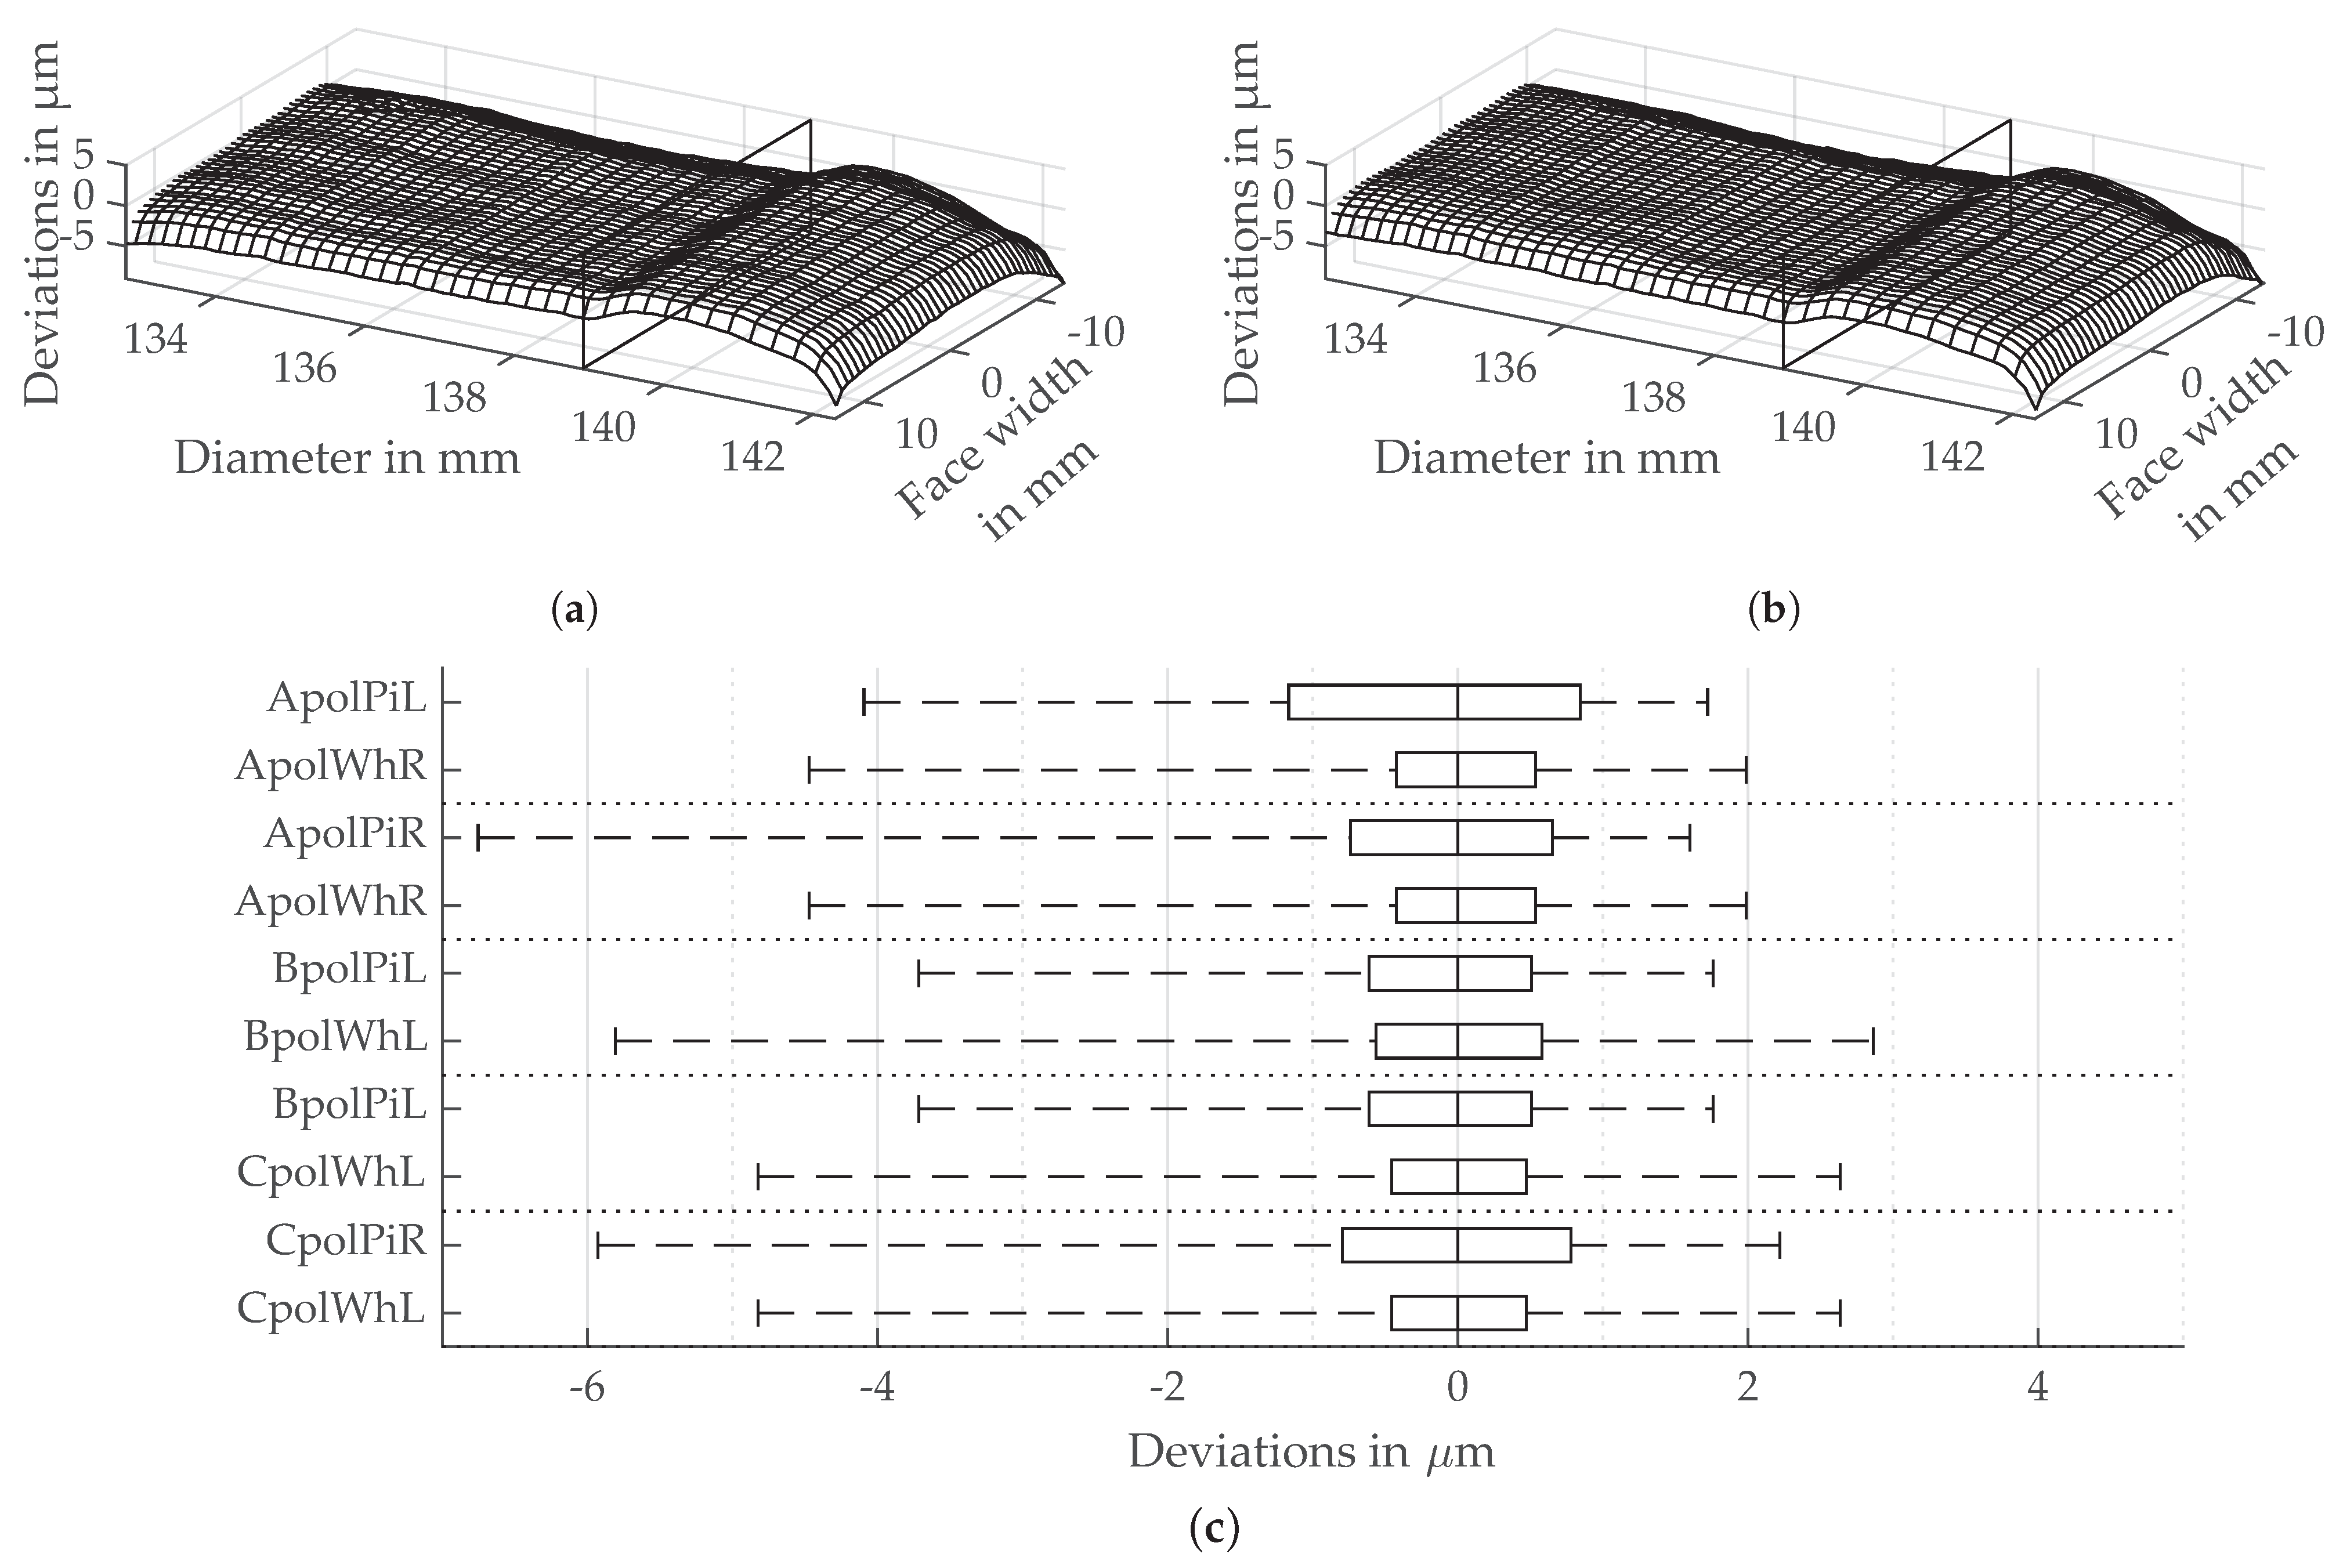
3.3. Flank Surface Structure Resulting from Polish Grinding

A large part of the flank surface of the gears manufactured by polish grinding matches the desired geometry very well. The involute helicoids without the tip relief and without the edges of the face width match the desired geometry quite exactly. Figure 11 shows the flank surface structure of the gear BpolPiL at tooth nr. 17 and the median of all deviations in the left flank of this gear. In the profile direction the distance of the largest regular deviation is in the range of 6 m m . The depth of this deviation is smaller than a micrometer. Further regular deviations in the profile direction are smaller than 0.5   μ m with a distance in a range of about 4 m m . The beginning of the tip relief is shifted to a larger diameter compared to the desired geometry. In the lead direction, the distance of the largest regular deviation is around 14 m m . The depth of this deviation is about 0.4   μ m . Further regular deviations in the lead direction are smaller than 0.1   μ m . The lead shows characteristics of a longitudinal end relief. The length of the flank line end relief is in the range of 2 m m to 5 m m . The amount of the end relief is approximately 7 μ m . The flank surface is very smooth.
The median of all deviations on the left flank of BpolPiL nearly matches the deviations in tooth nr. 34.
The absolute value of all the deviations in 50% of the measured flank points for polish grinding is within the range of 0.4   μ m to 1.2   μ m . The absolute deviations in 95% of the measured flank points are smaller than 6.8   μ m . In case the evaluation of the flank points is limited to the involute helicoid and the edges of the face width are neglected, 50% of this selection is in the range of 0.3   μ m to 0.9   μ m . Furthermore, the maximum deviation of 95% of the measured points on the flank for this selection is only 1.7   μ m .

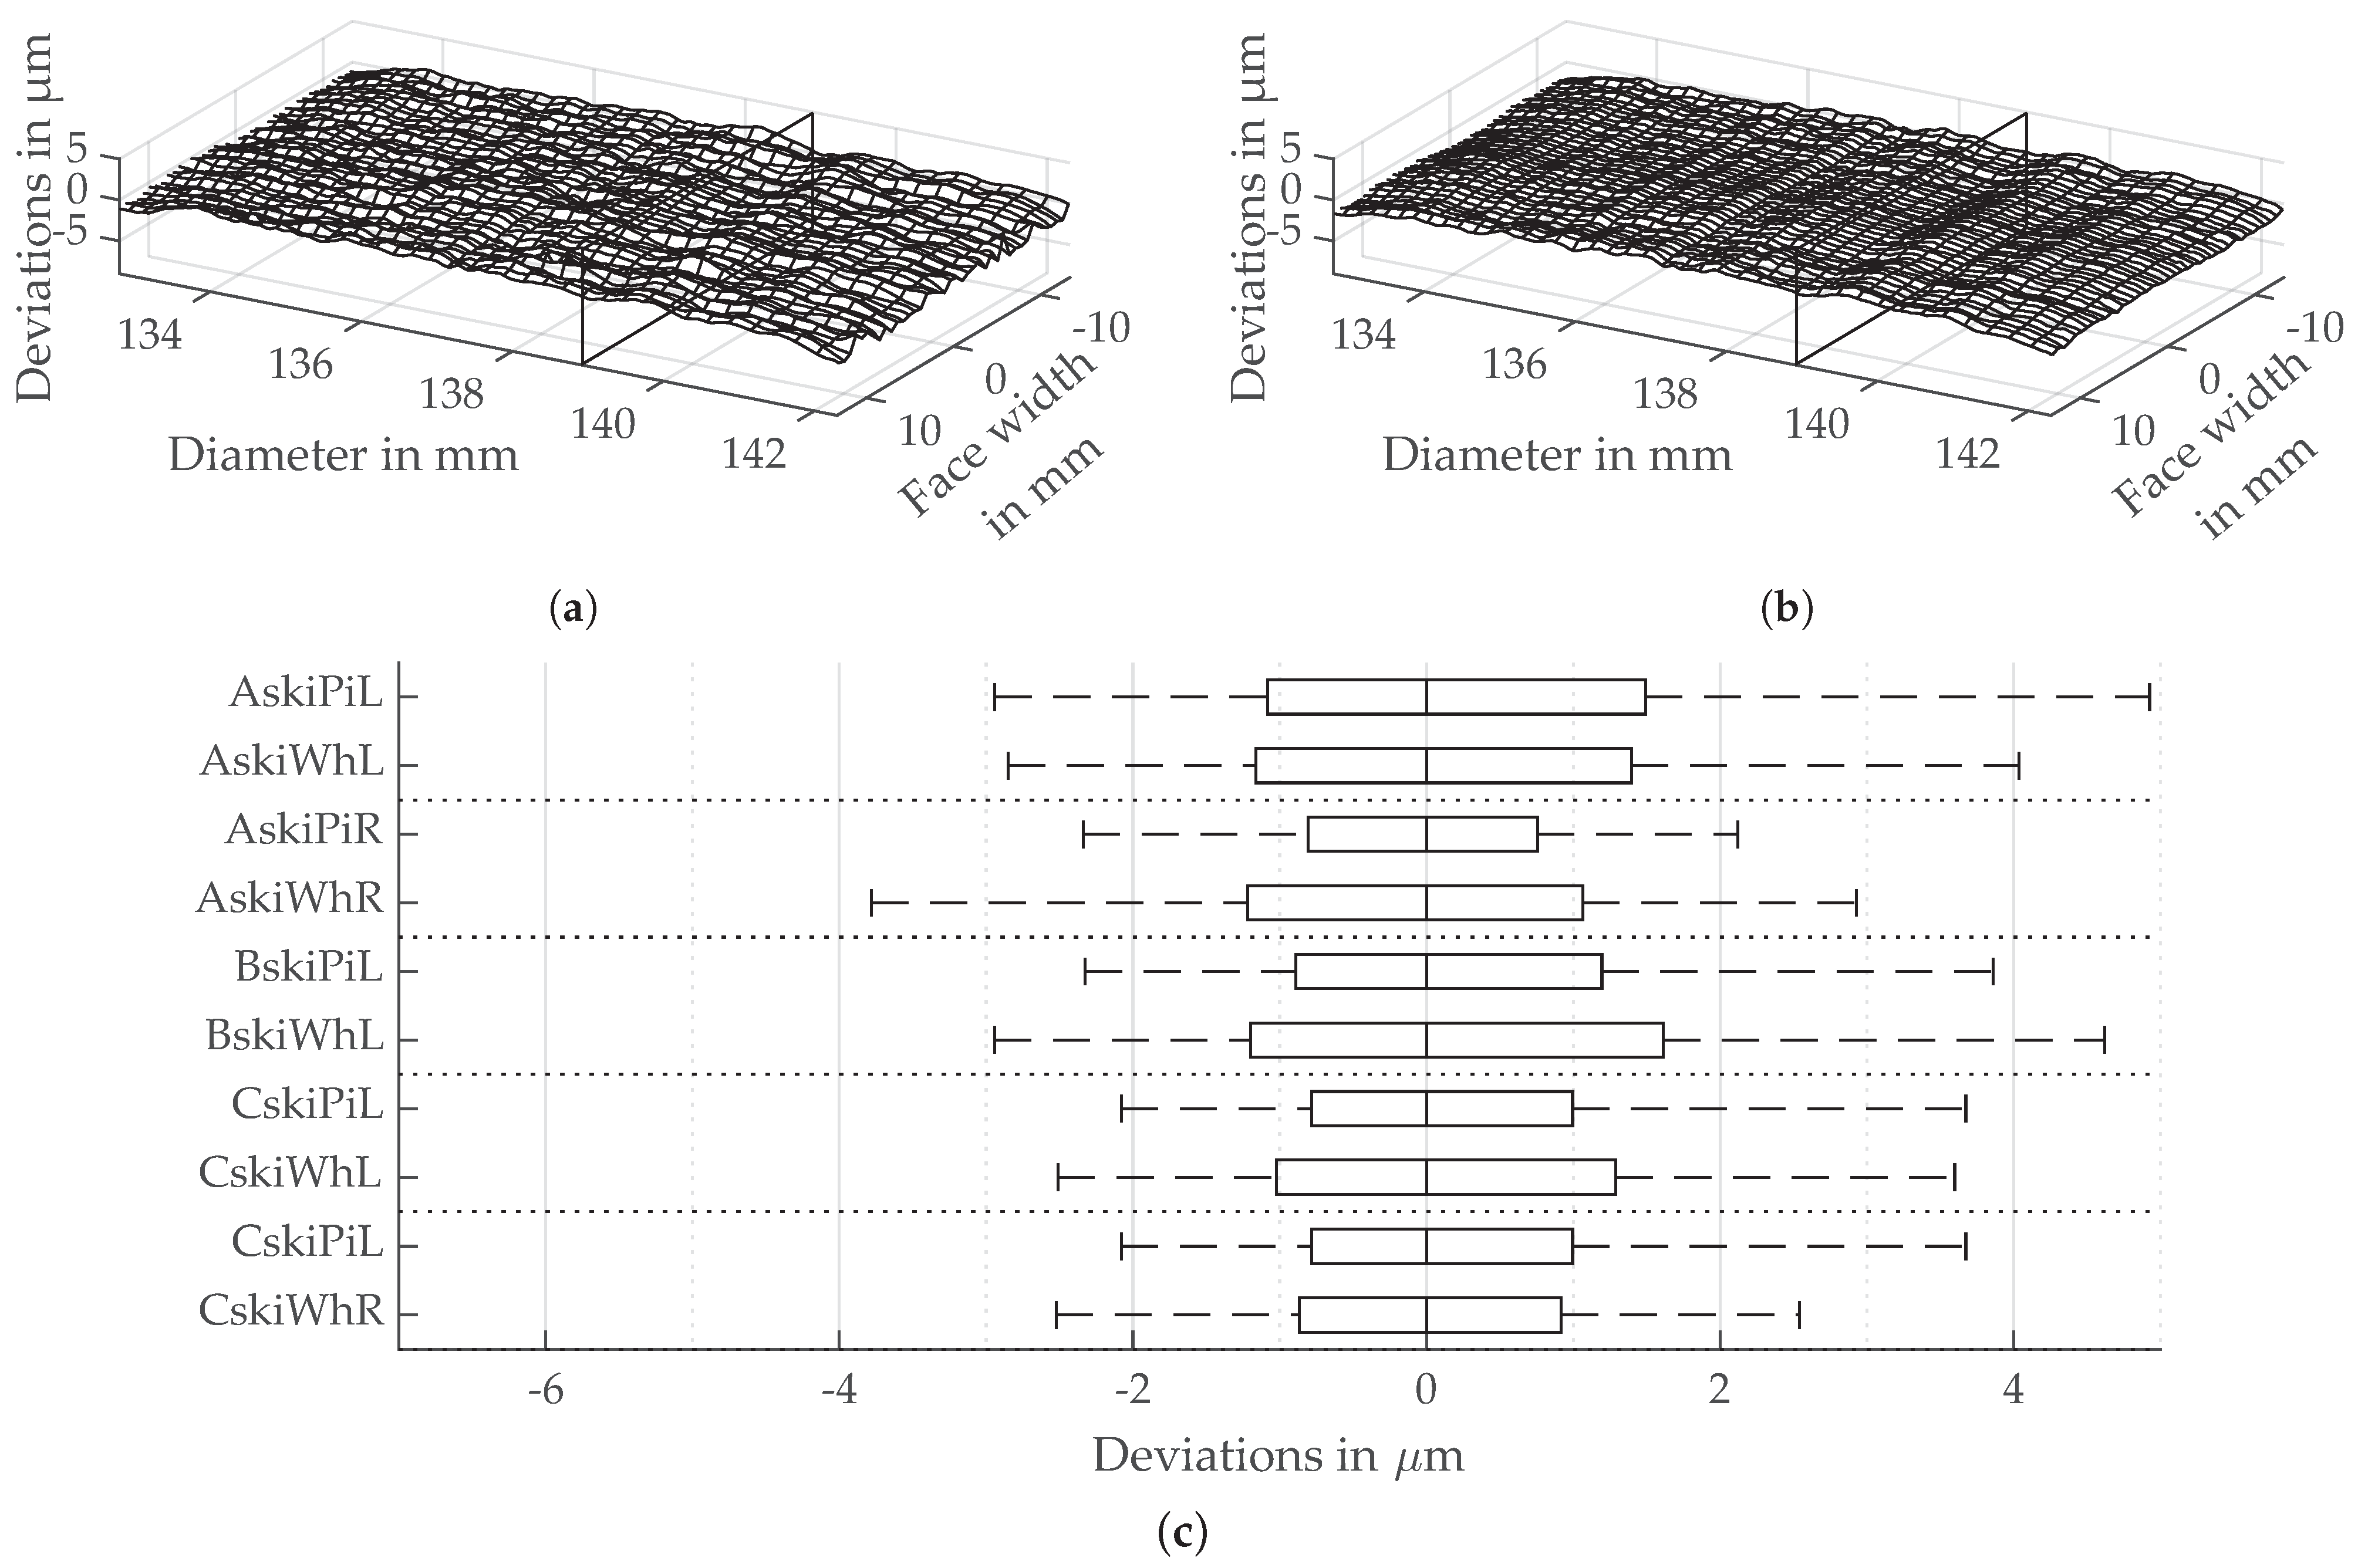
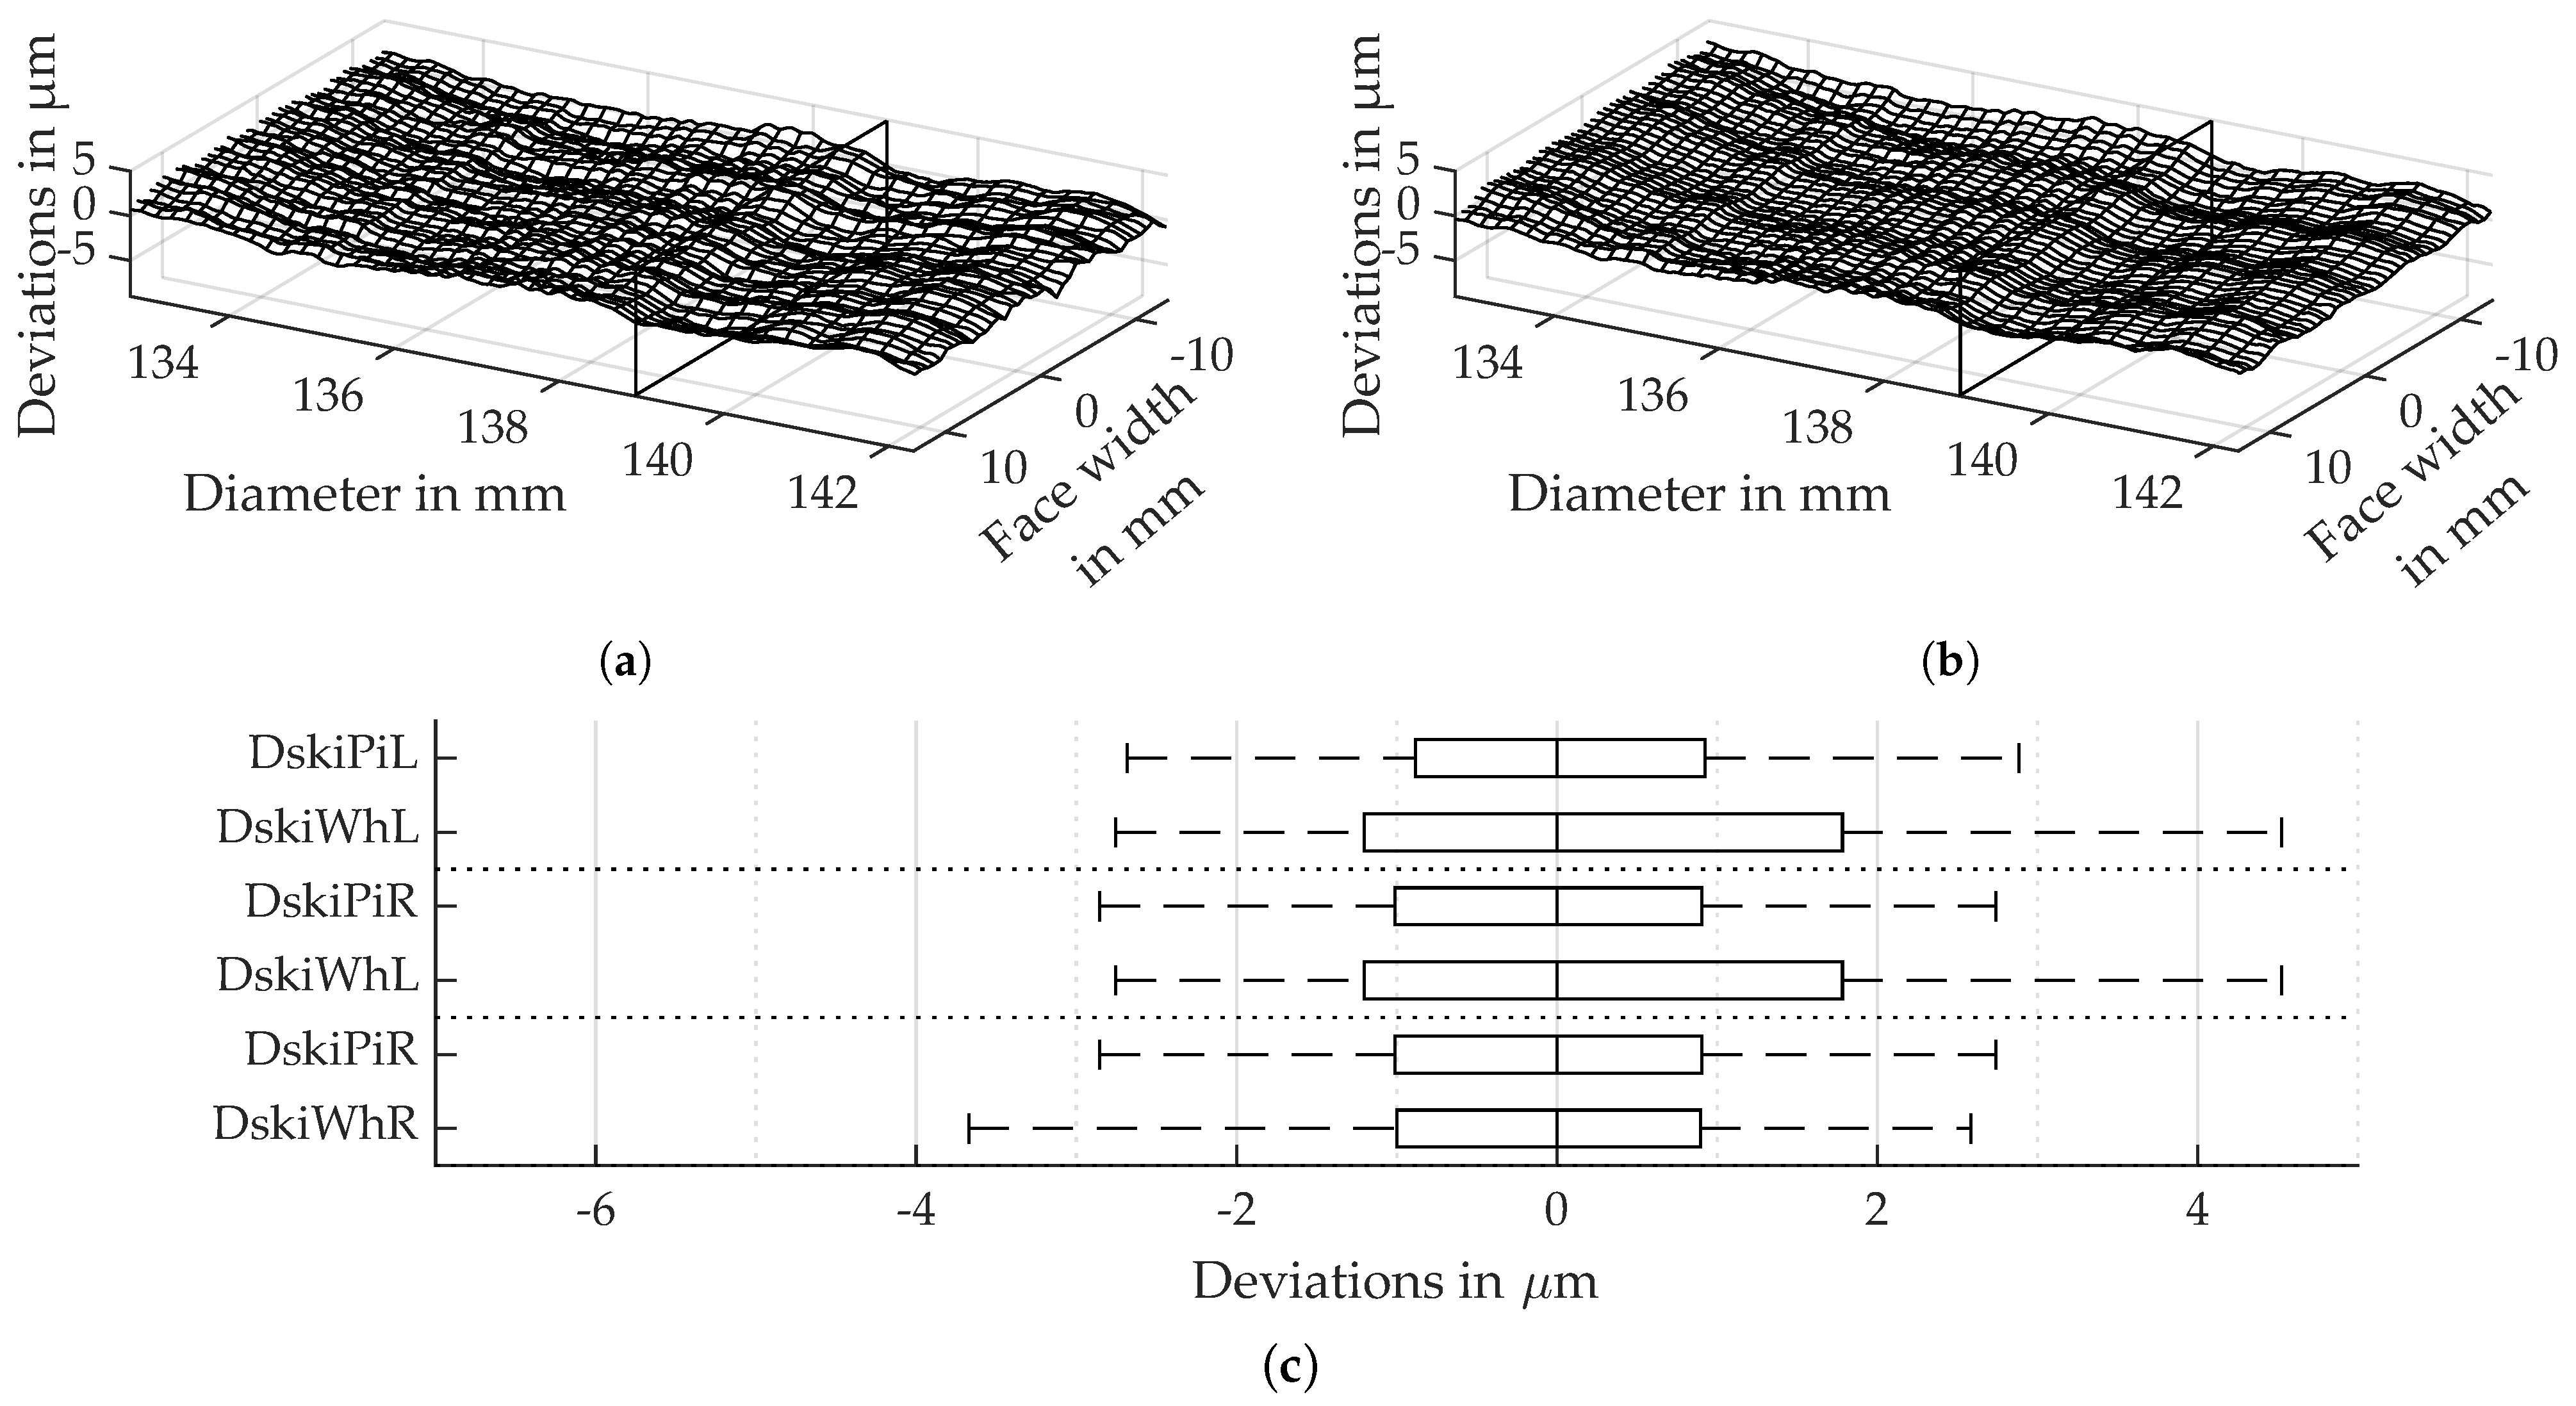
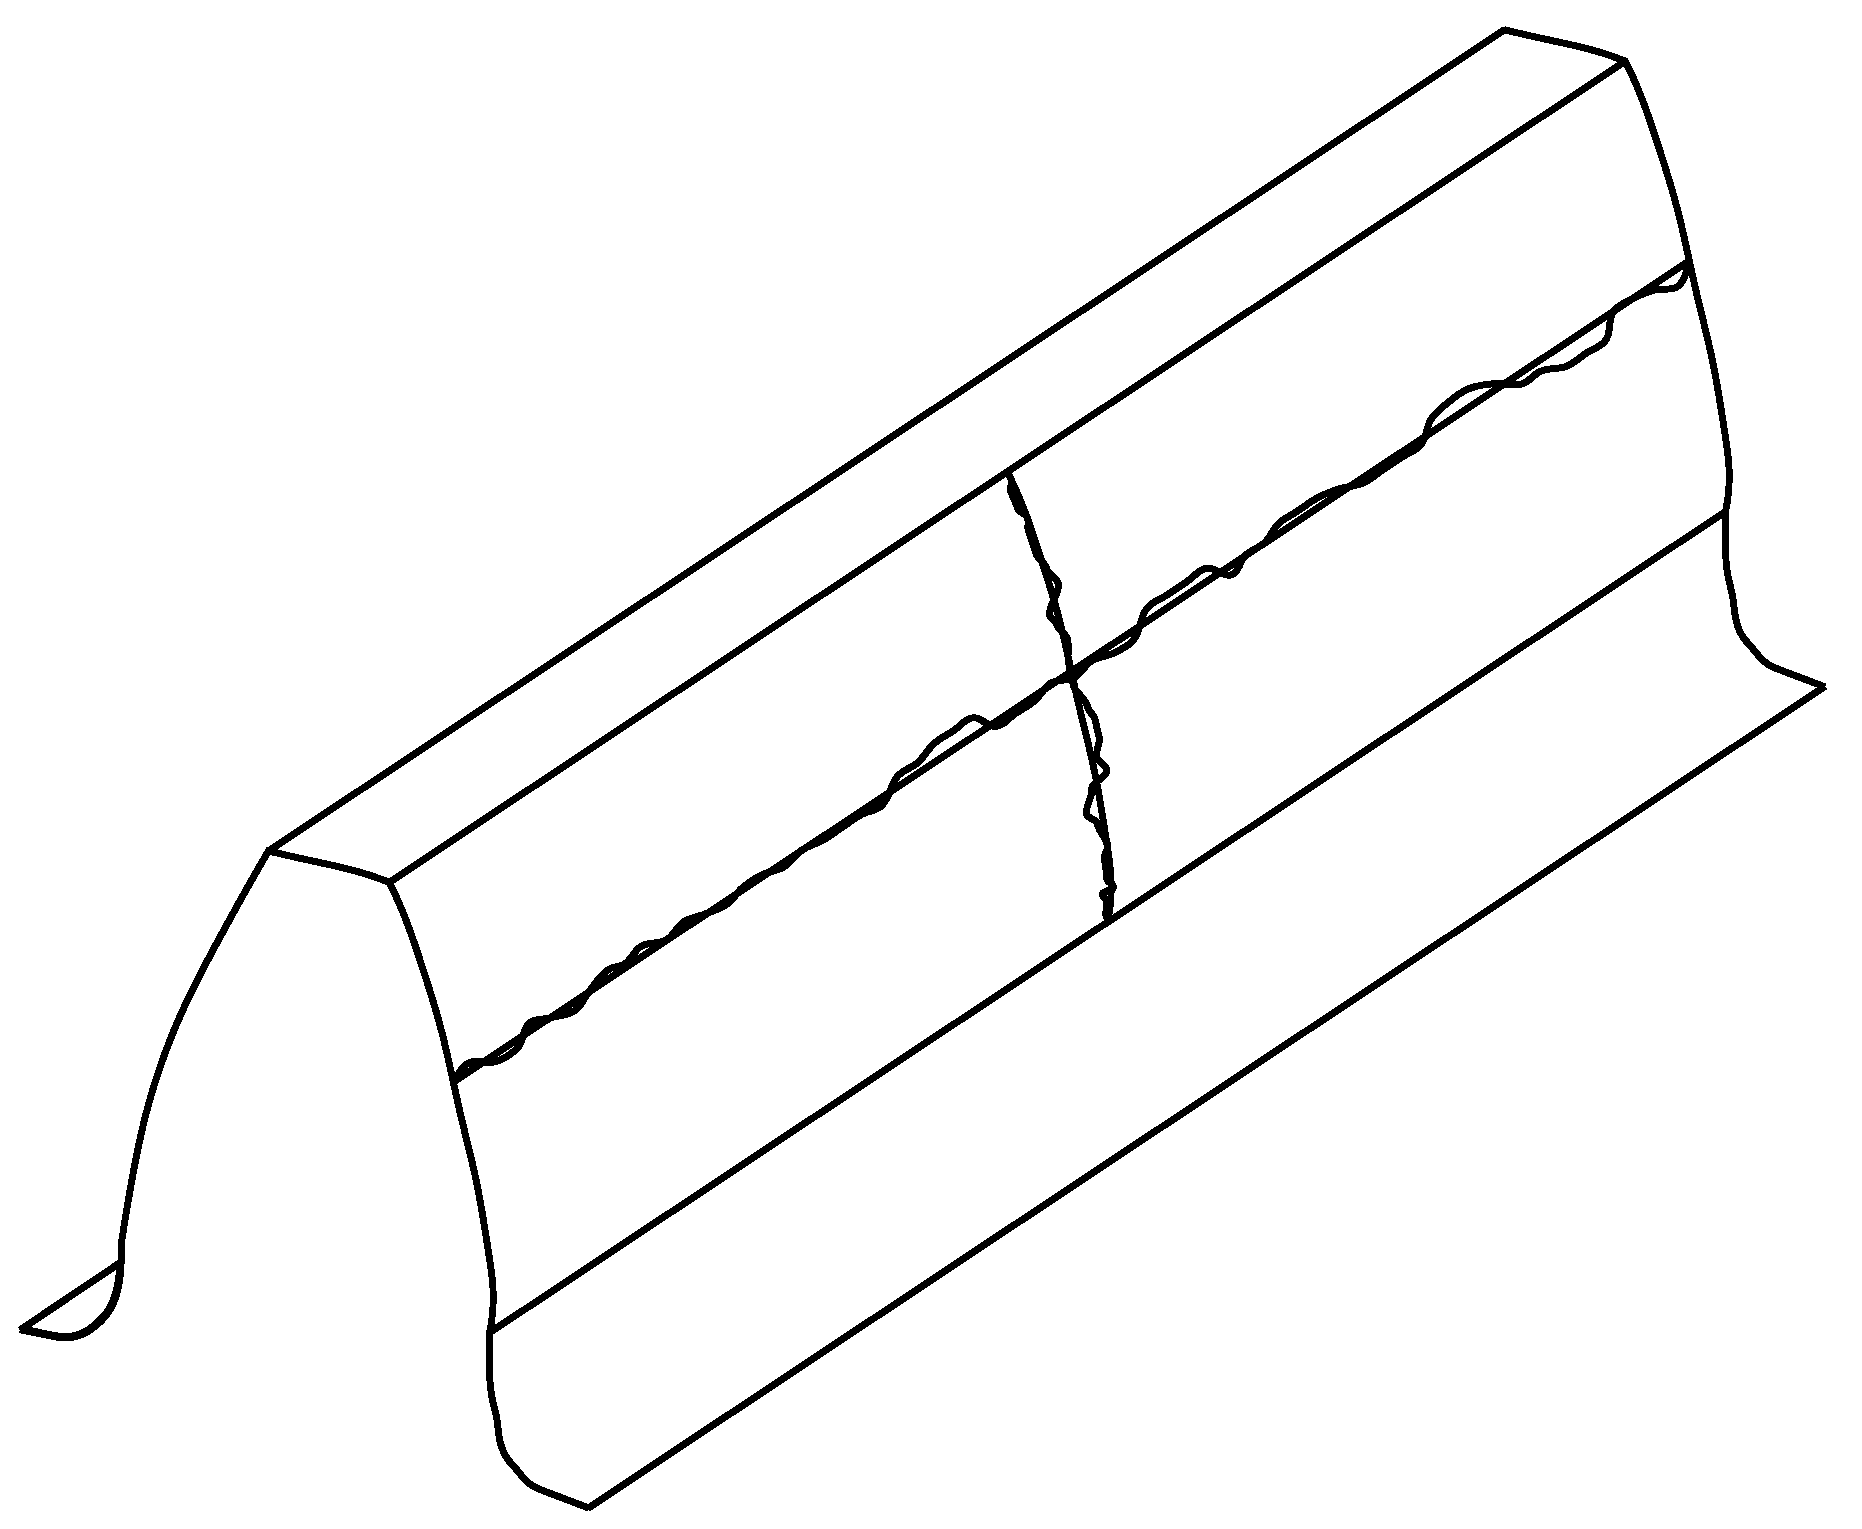
3.4. Flank Surface Structure Resulting from Gear Skiving

The flanks of the gears manufactured by gear skiving are largely consistent with the desired geometry. Figure 12 shows the flank surface structure of the gear AskiPiR at tooth nr. 11 and the median of all deviations on the left flank of this gear. In the profile direction the distance of the largest regular deviation is smaller than 2 m m . The depth of this deviation is in the range of 0.3   μ m . Further regular deviations in the profile direction are in the range of 0.2   μ m . The tip relief is manufactured very exactly. In the lead direction the distance of the largest regular deviation is around 15 m m . The depth of this deviation is about 0.3   μ m . Further regular deviations in the lead direction are in the range of a tenth of a micrometer. At one face edge, the deviations are larger.
The median of all deviations on the left flank of AskiPiR is clearly smoother than the deviations in tooth nr. 11 in Figure 12.
The absolute value of all the deviations in 50% of the measured flank points for gear skiving is within the range of 0.7   μ m to 1.6   μ m . The absolute deviations in 95% of the measured flank points are smaller than 5 μ m . The gear AskiPiR has the smallest deviations compared to the other gears manufactured by gear skiving.

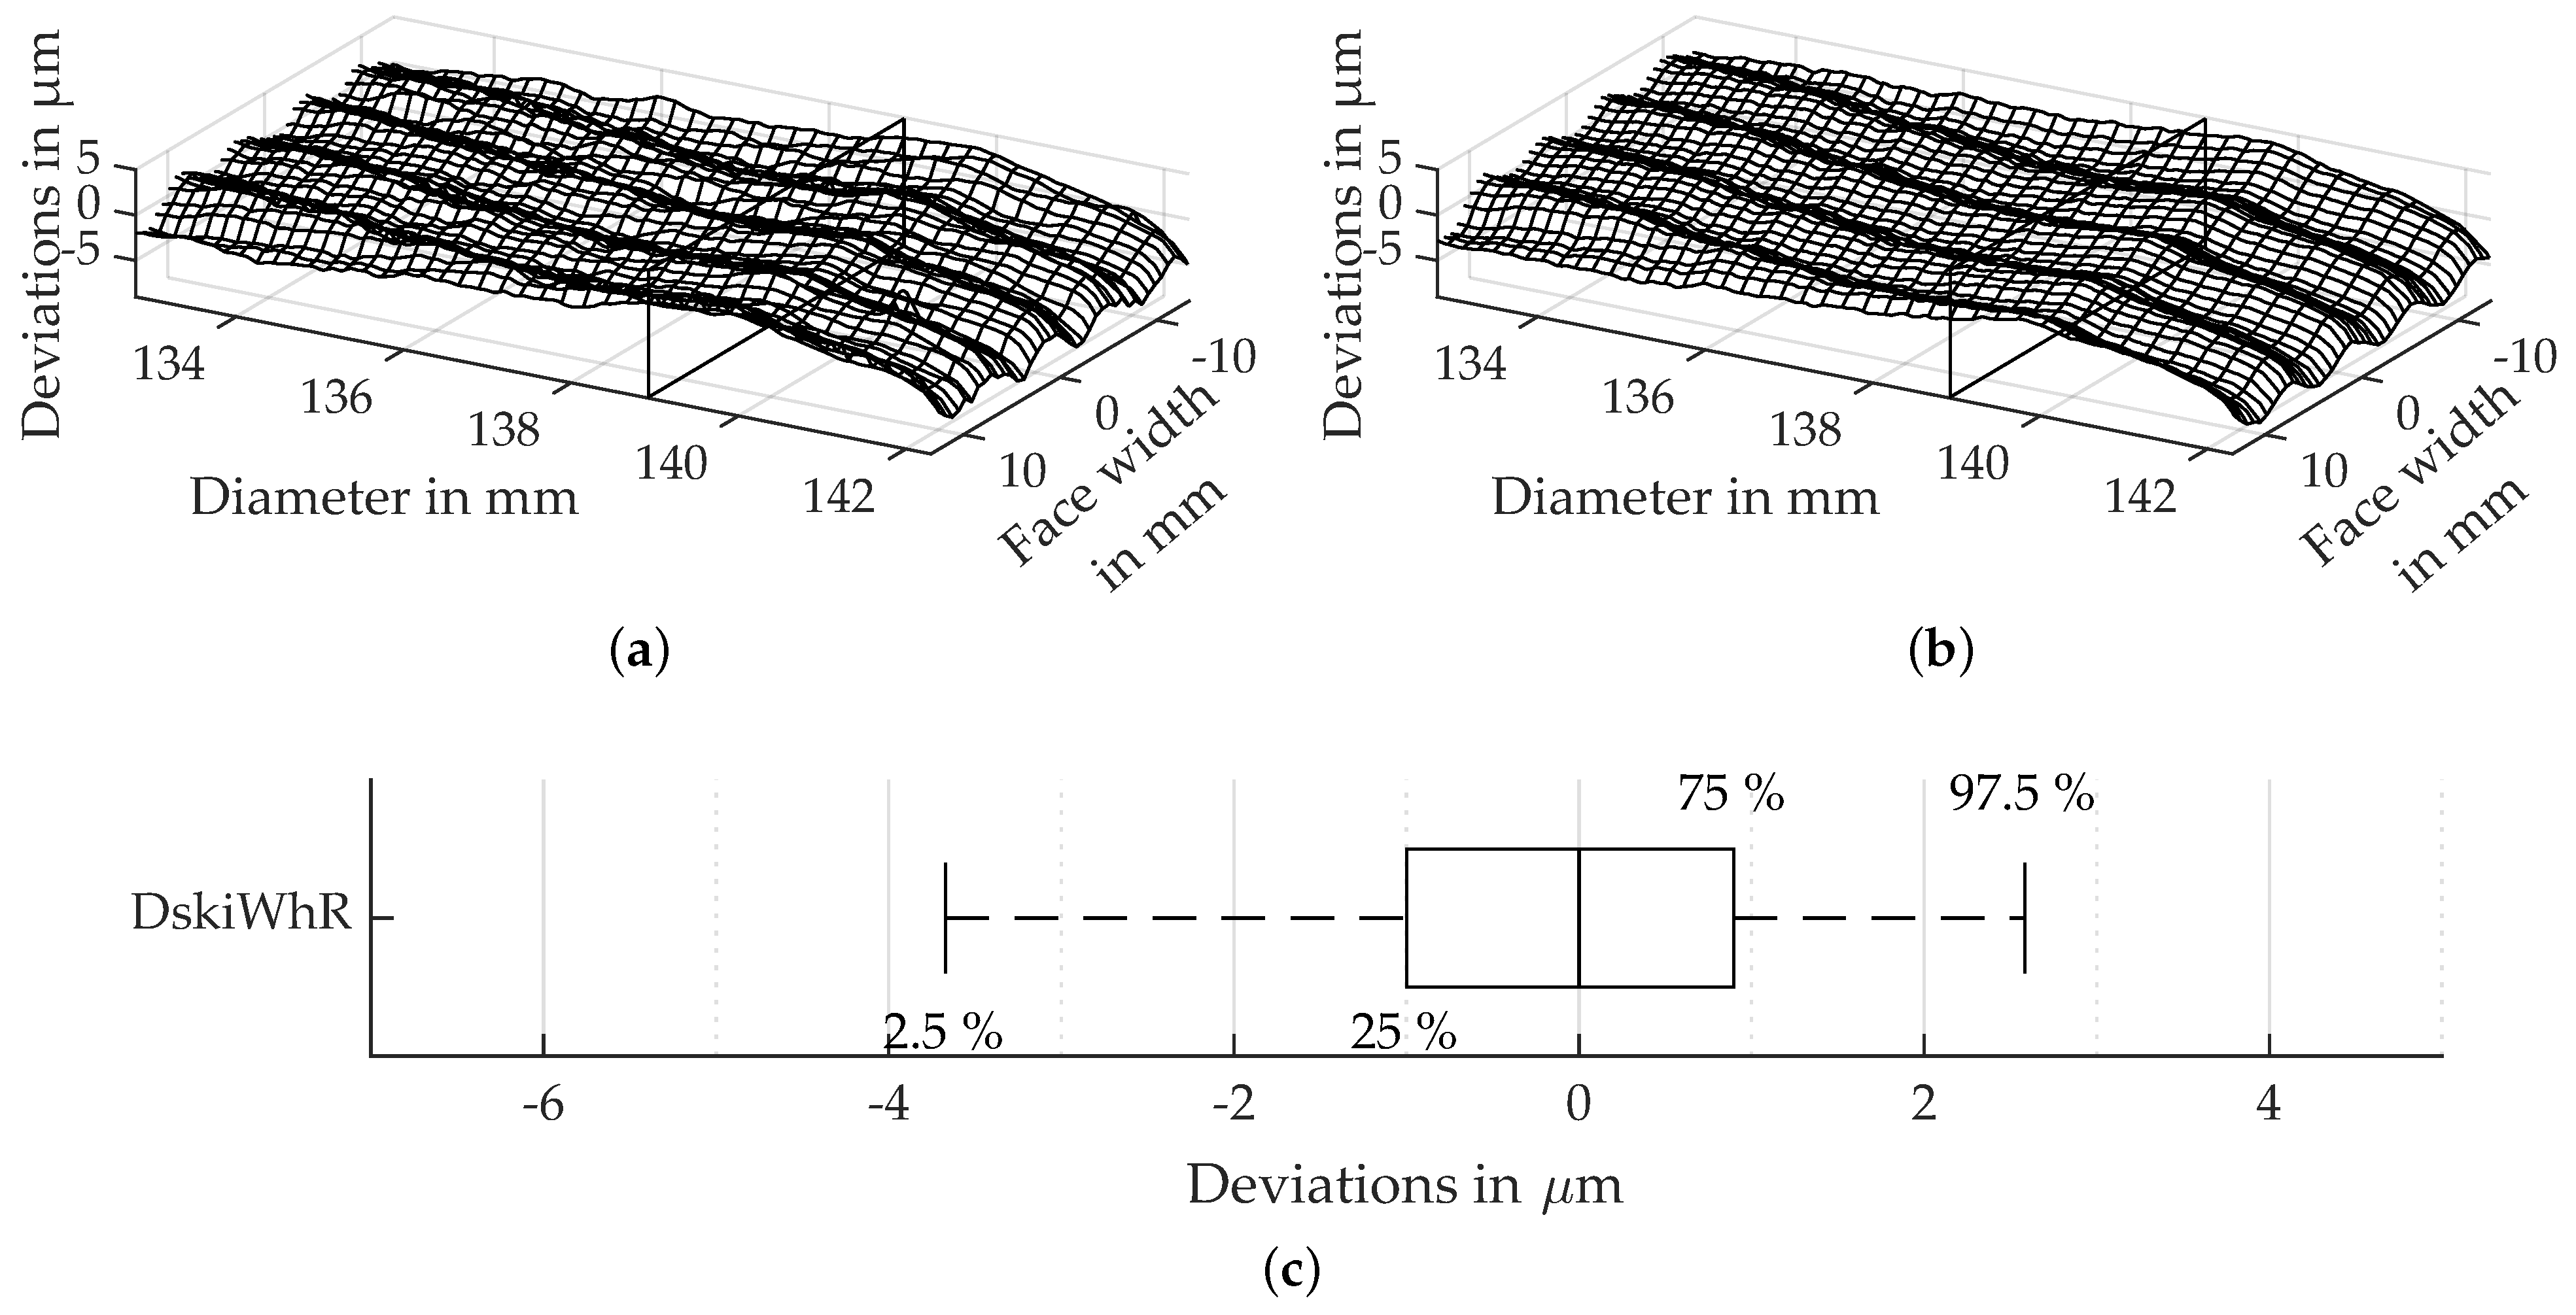
3.5. Flank Surface Structure Resulting from Gear Skiving-Half Axial Feed

The surface structure of the gears manufactured by gear skiving with half ot the axial feed compared to the other gears manufactured by gear skiving are largely consistent with the desired geometry. Figure 13 shows the flank surface structure of the gear DskiPiL at tooth nr. 10 and the median of all deviations on the left flank of this gear. In the profile direction, the distance of the largest regular deviation is smaller than 4 m m . The depth of this deviation is in the range of 0.7   μ m . Further regular deviations in the profile direction are in the range of 0.4   μ m and 0.2   μ m . Towards the root diameter the deviations increase to about 2 μ m . The tip relief is well manufactured. In the lead direction, the distance of the largest regular deviation is around 6.5   m m . The depth of this deviation is about 0.4   μ m . Further regular deviations in the lead direction are smaller than 0.2   μ m . At one of the face edges there are higher deviations.
The median of all deviations on the left flank of DskiPiL shows larger deviations analogous to tooth nr. 10. The flank surface in the profile and lead direction is clearly smoother. The median shows regular deviations in the profile as well as in lead direction.
The absolute value of all the deviations in 50% of the measured flank points for gear skiving with half of the axial feed is within the range of 0.8   μ m to 1.8   μ m . The absolute deviations in 95% of the measured flank points are smaller than 4.6   μ m .

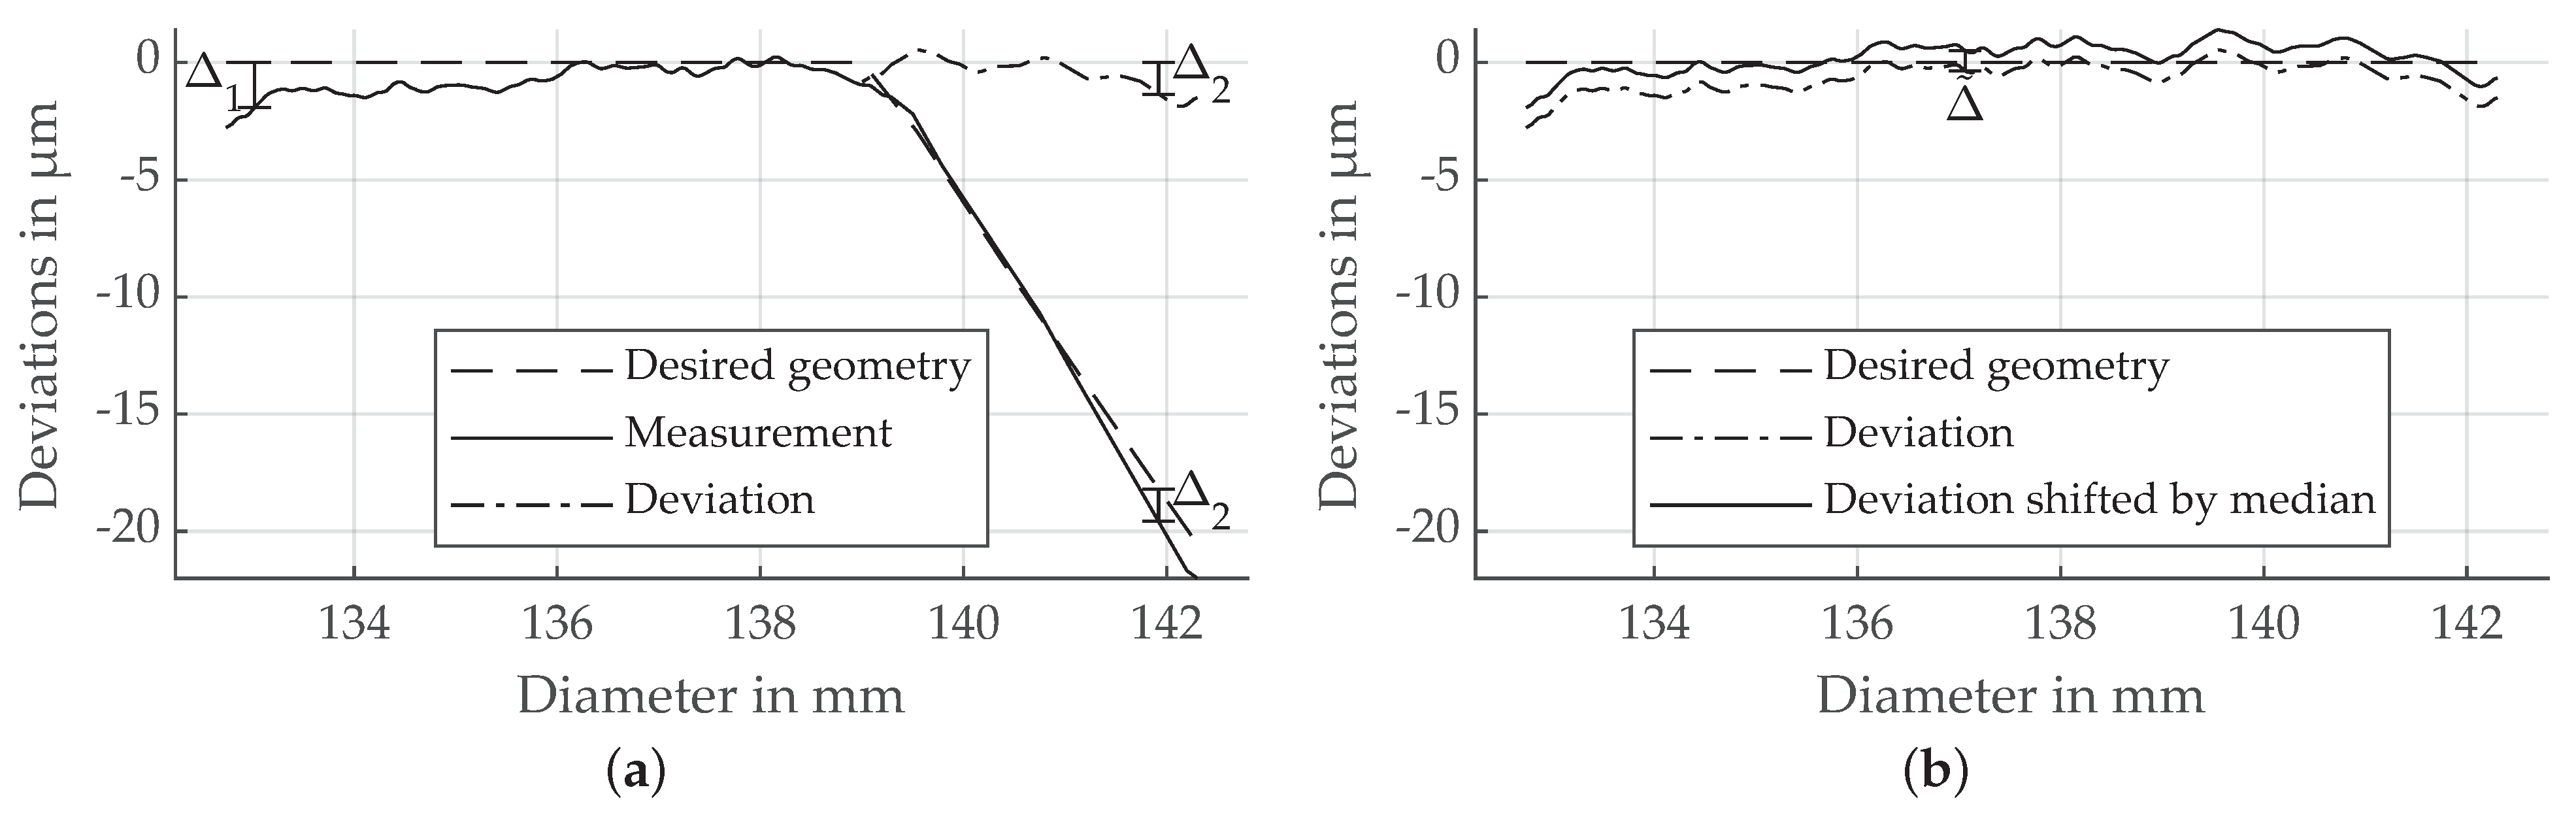
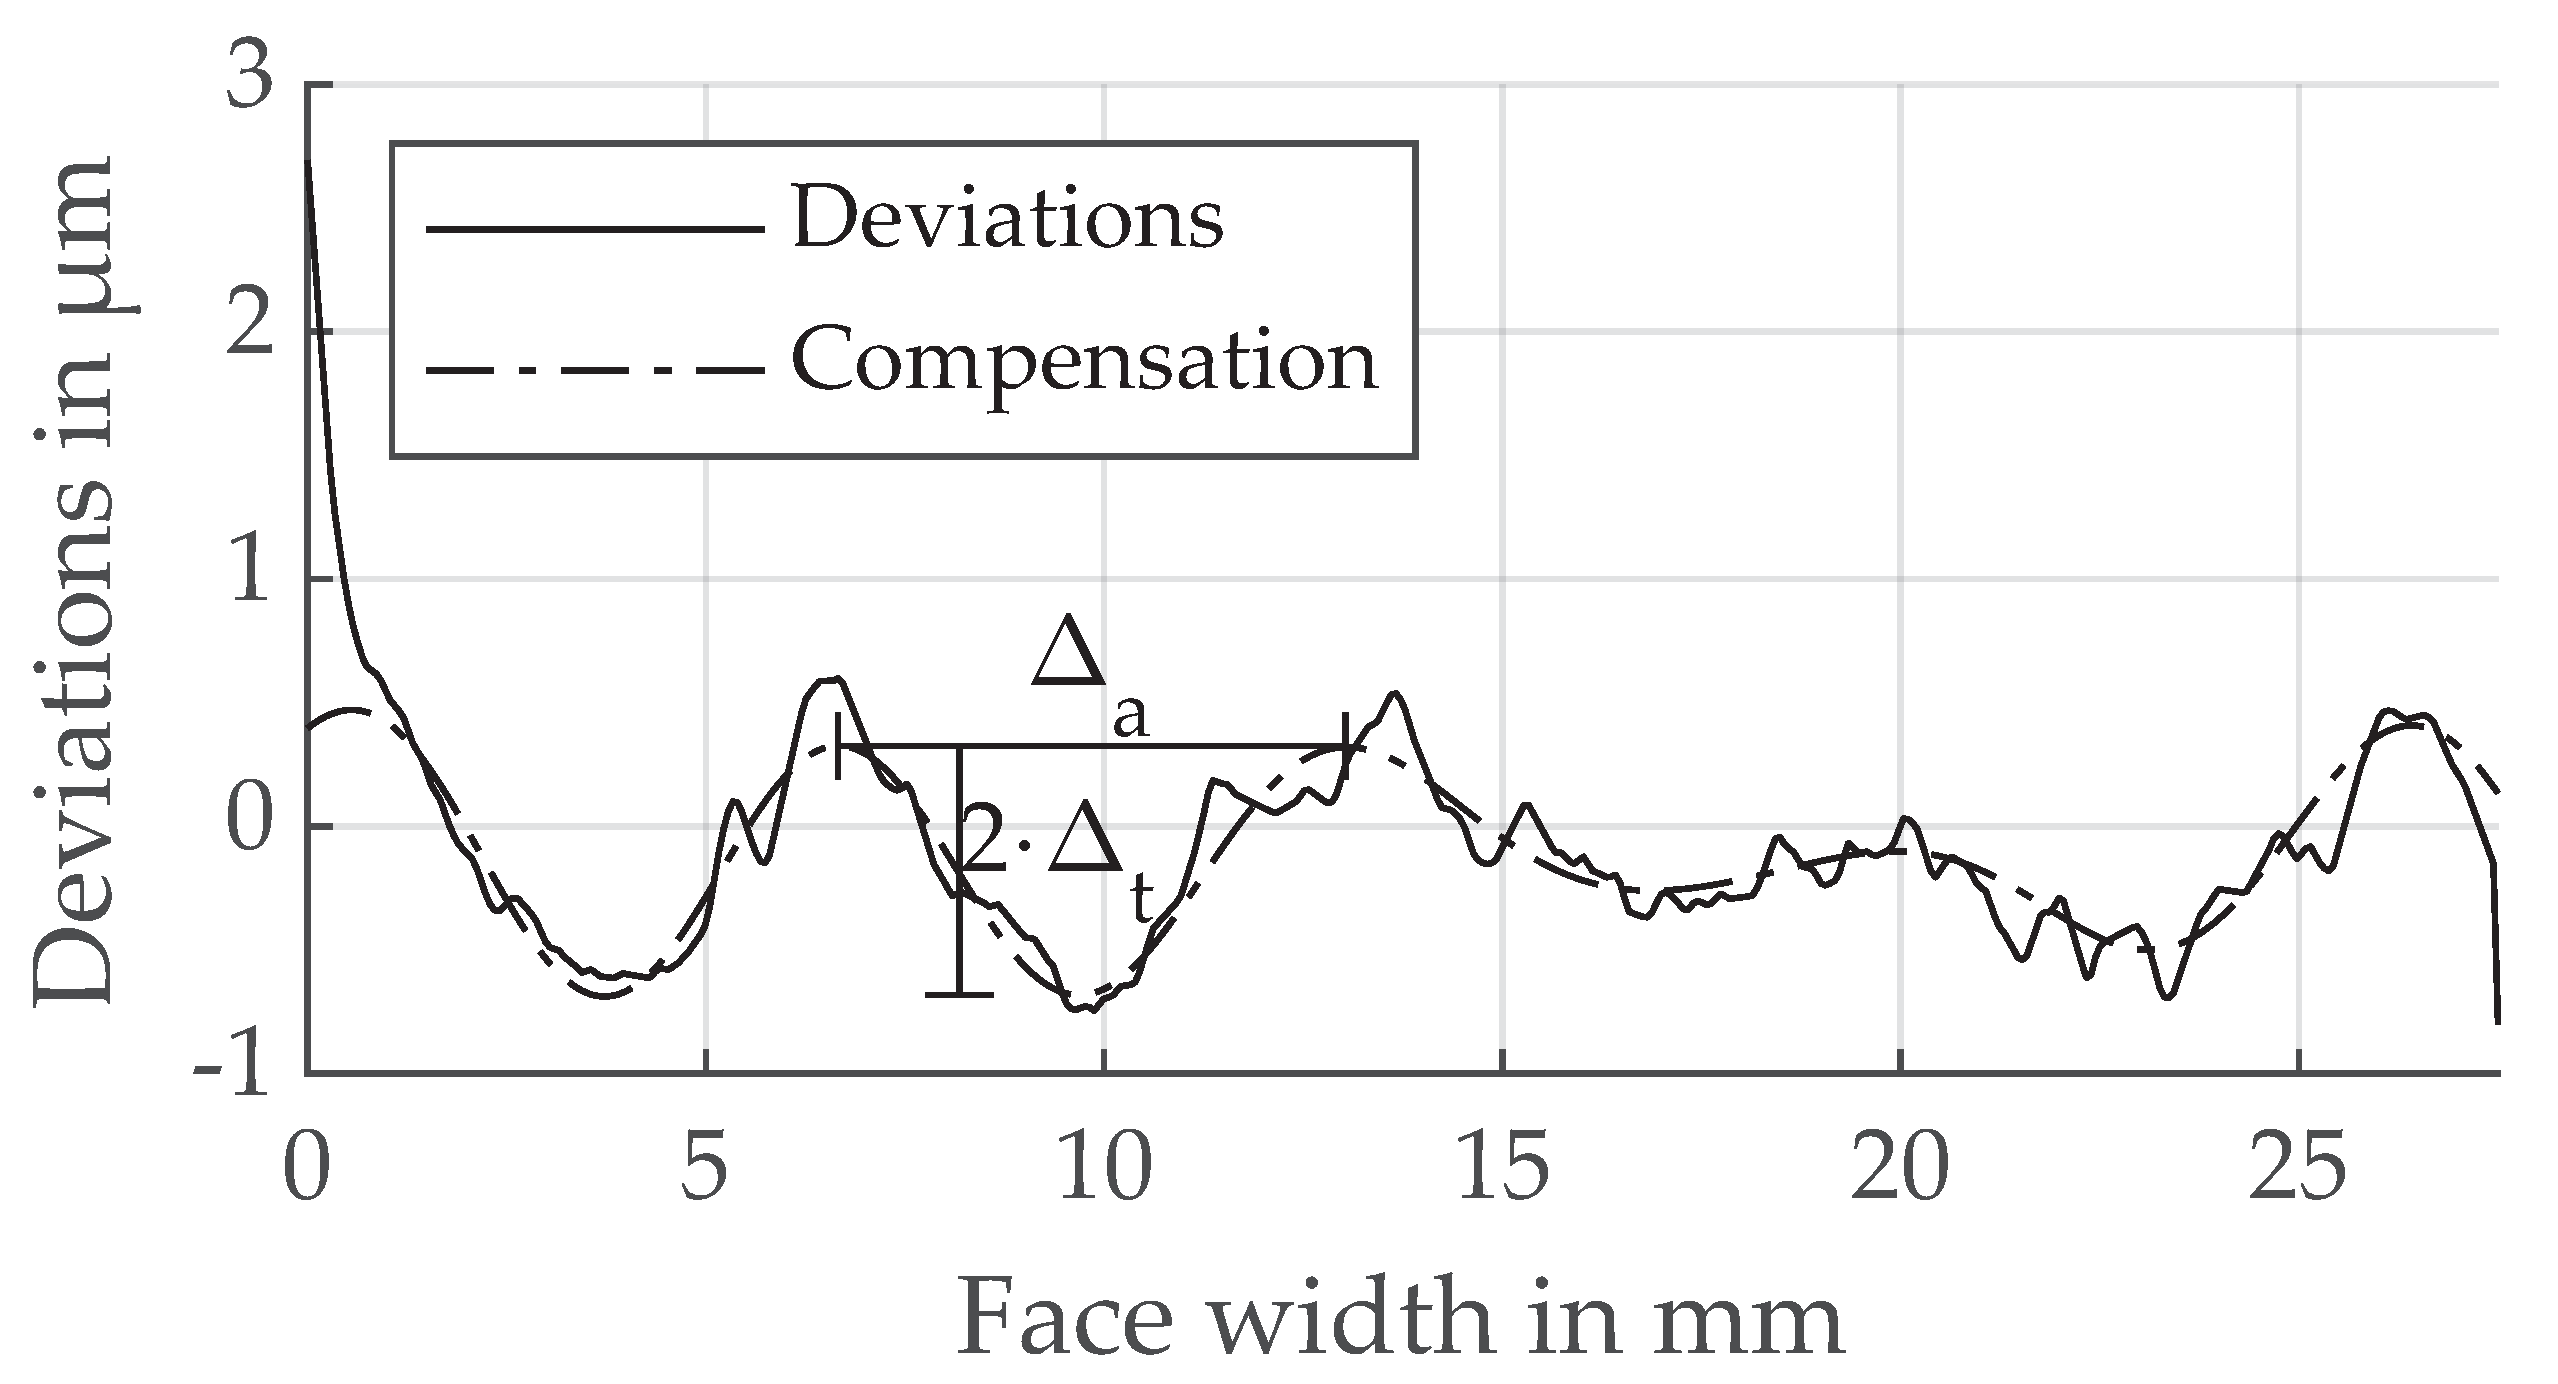
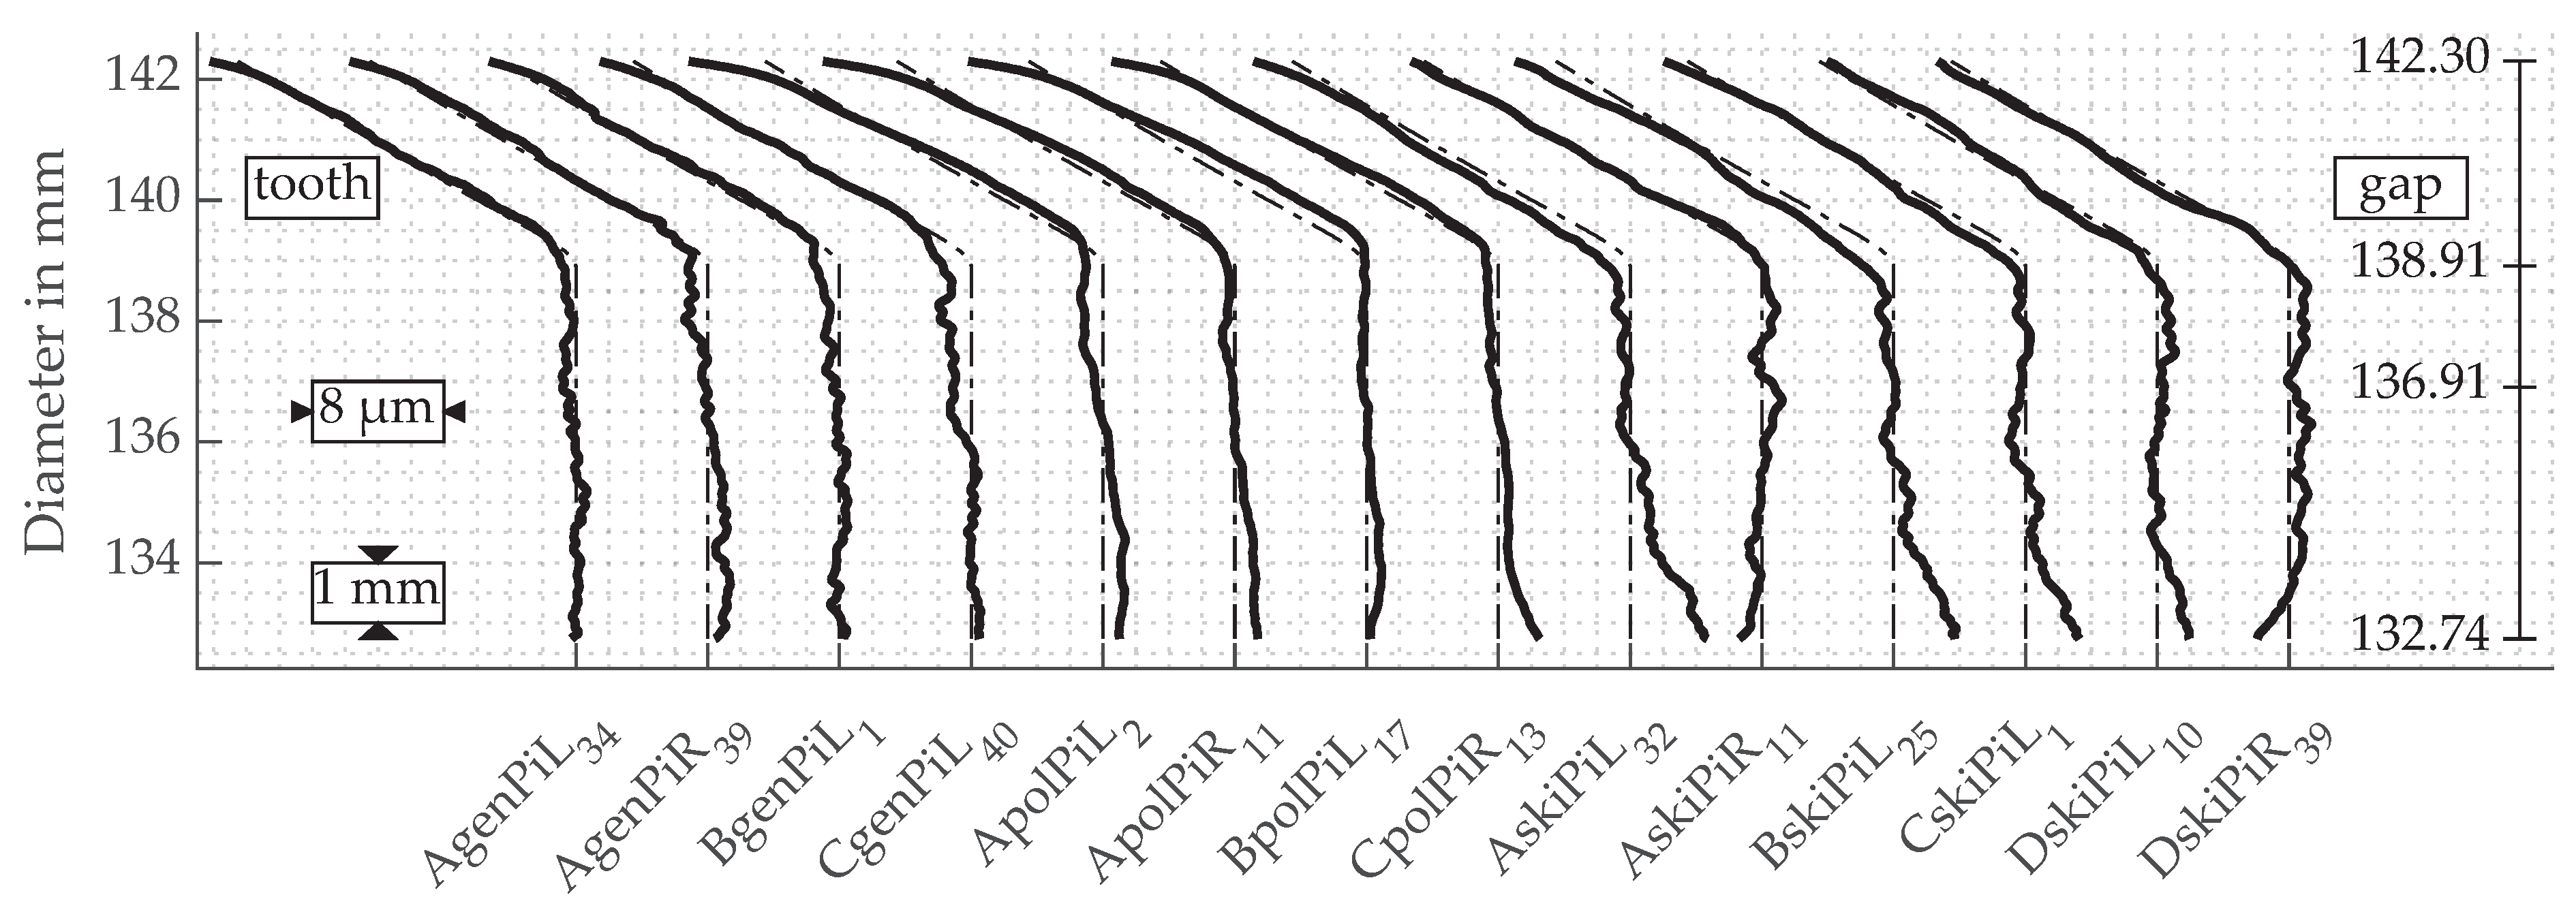
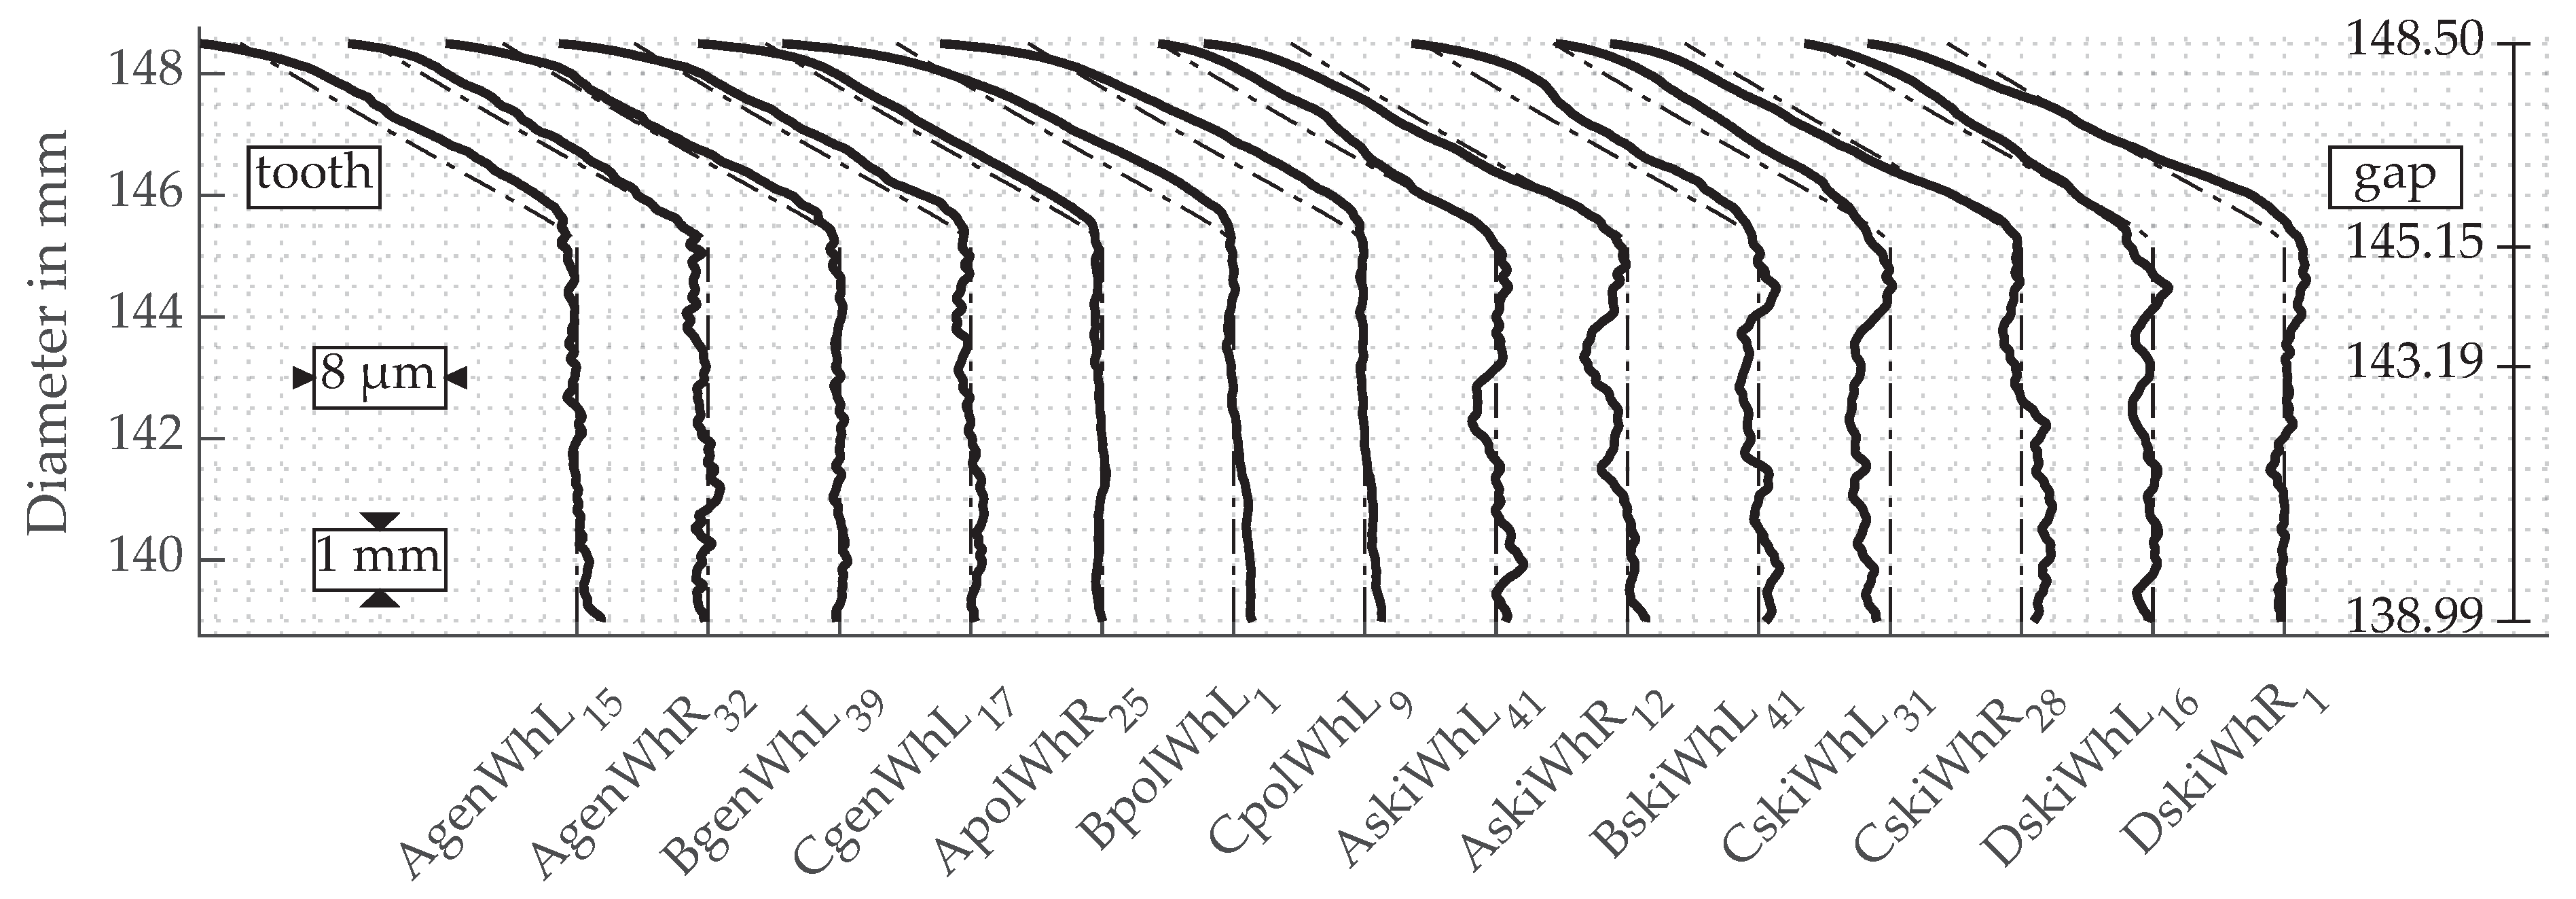
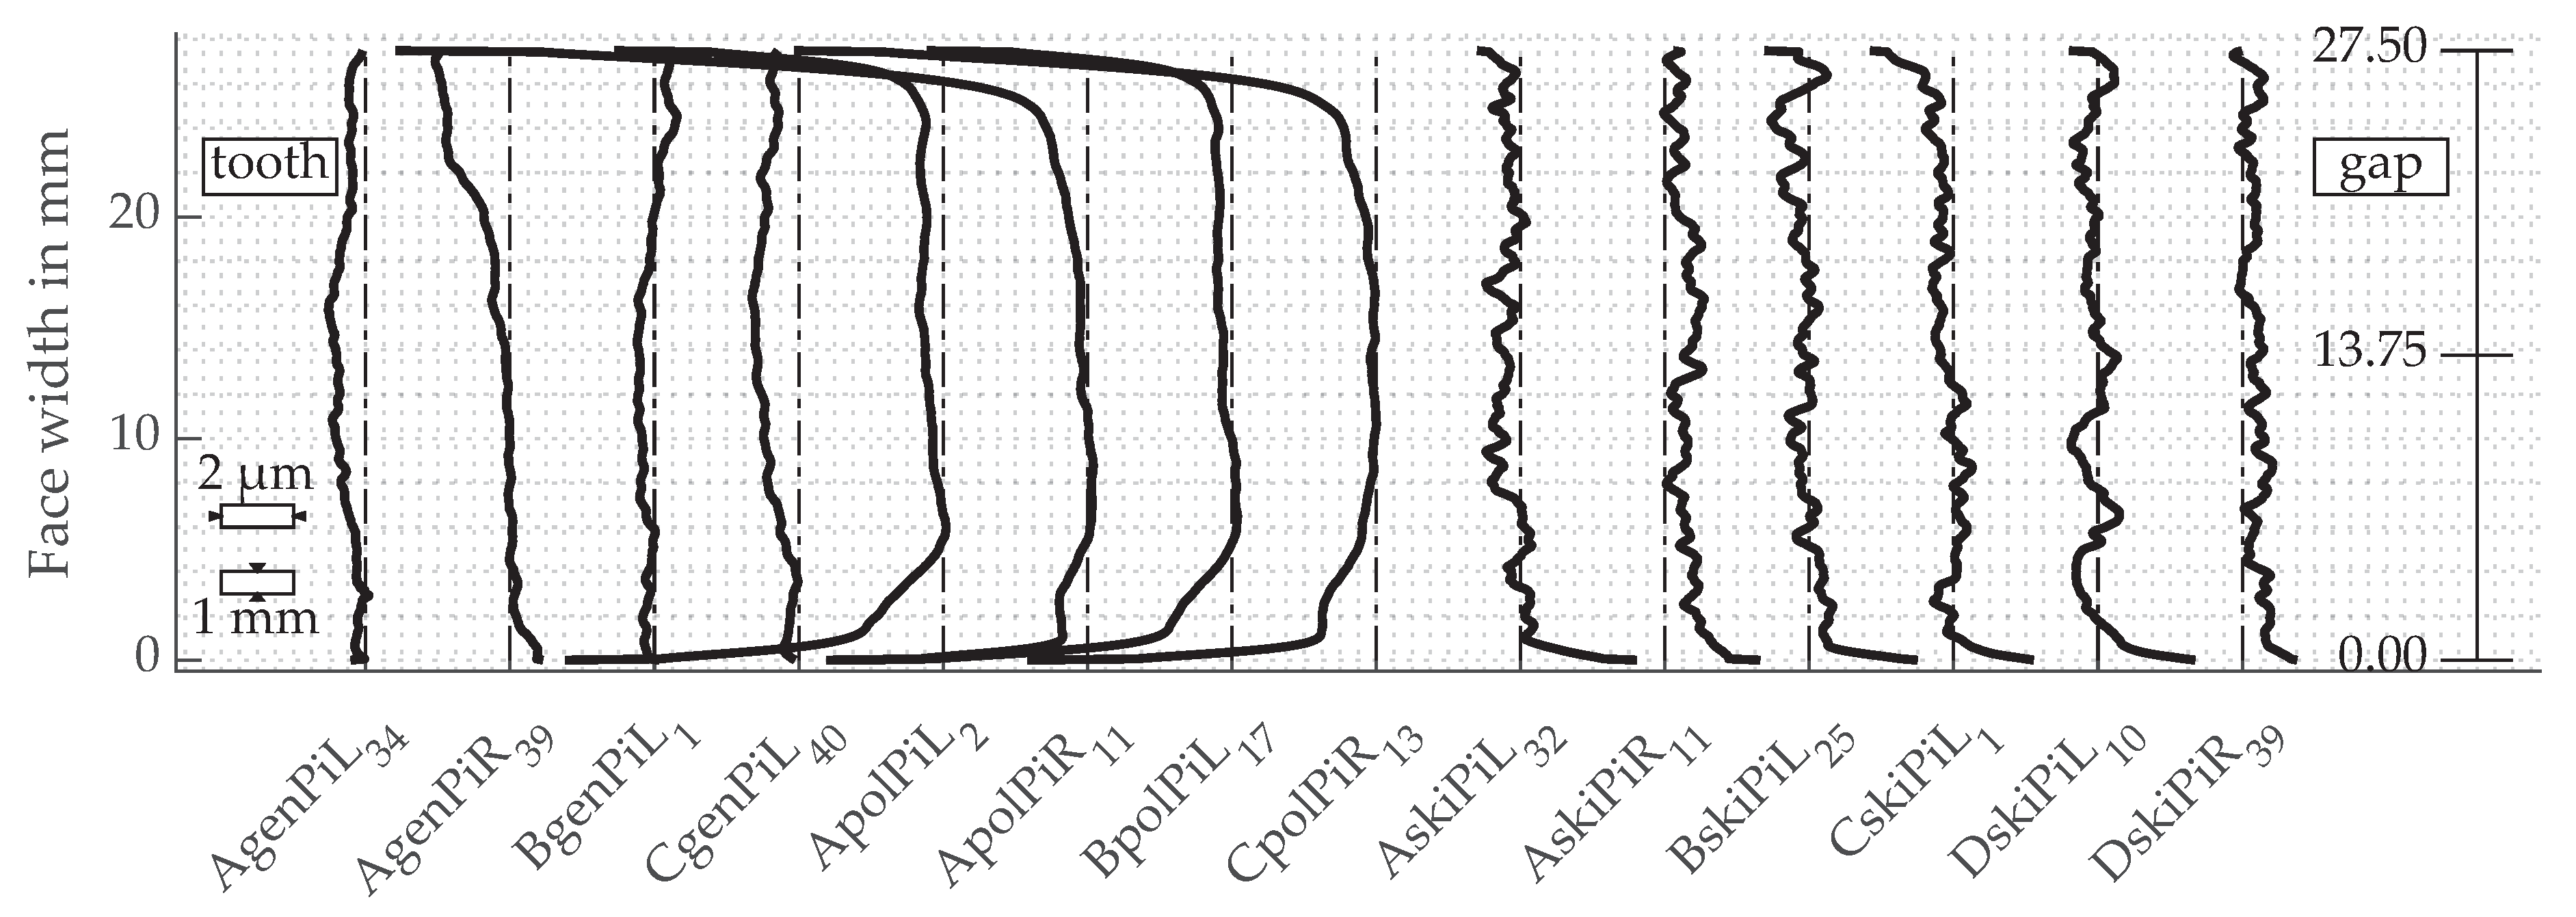
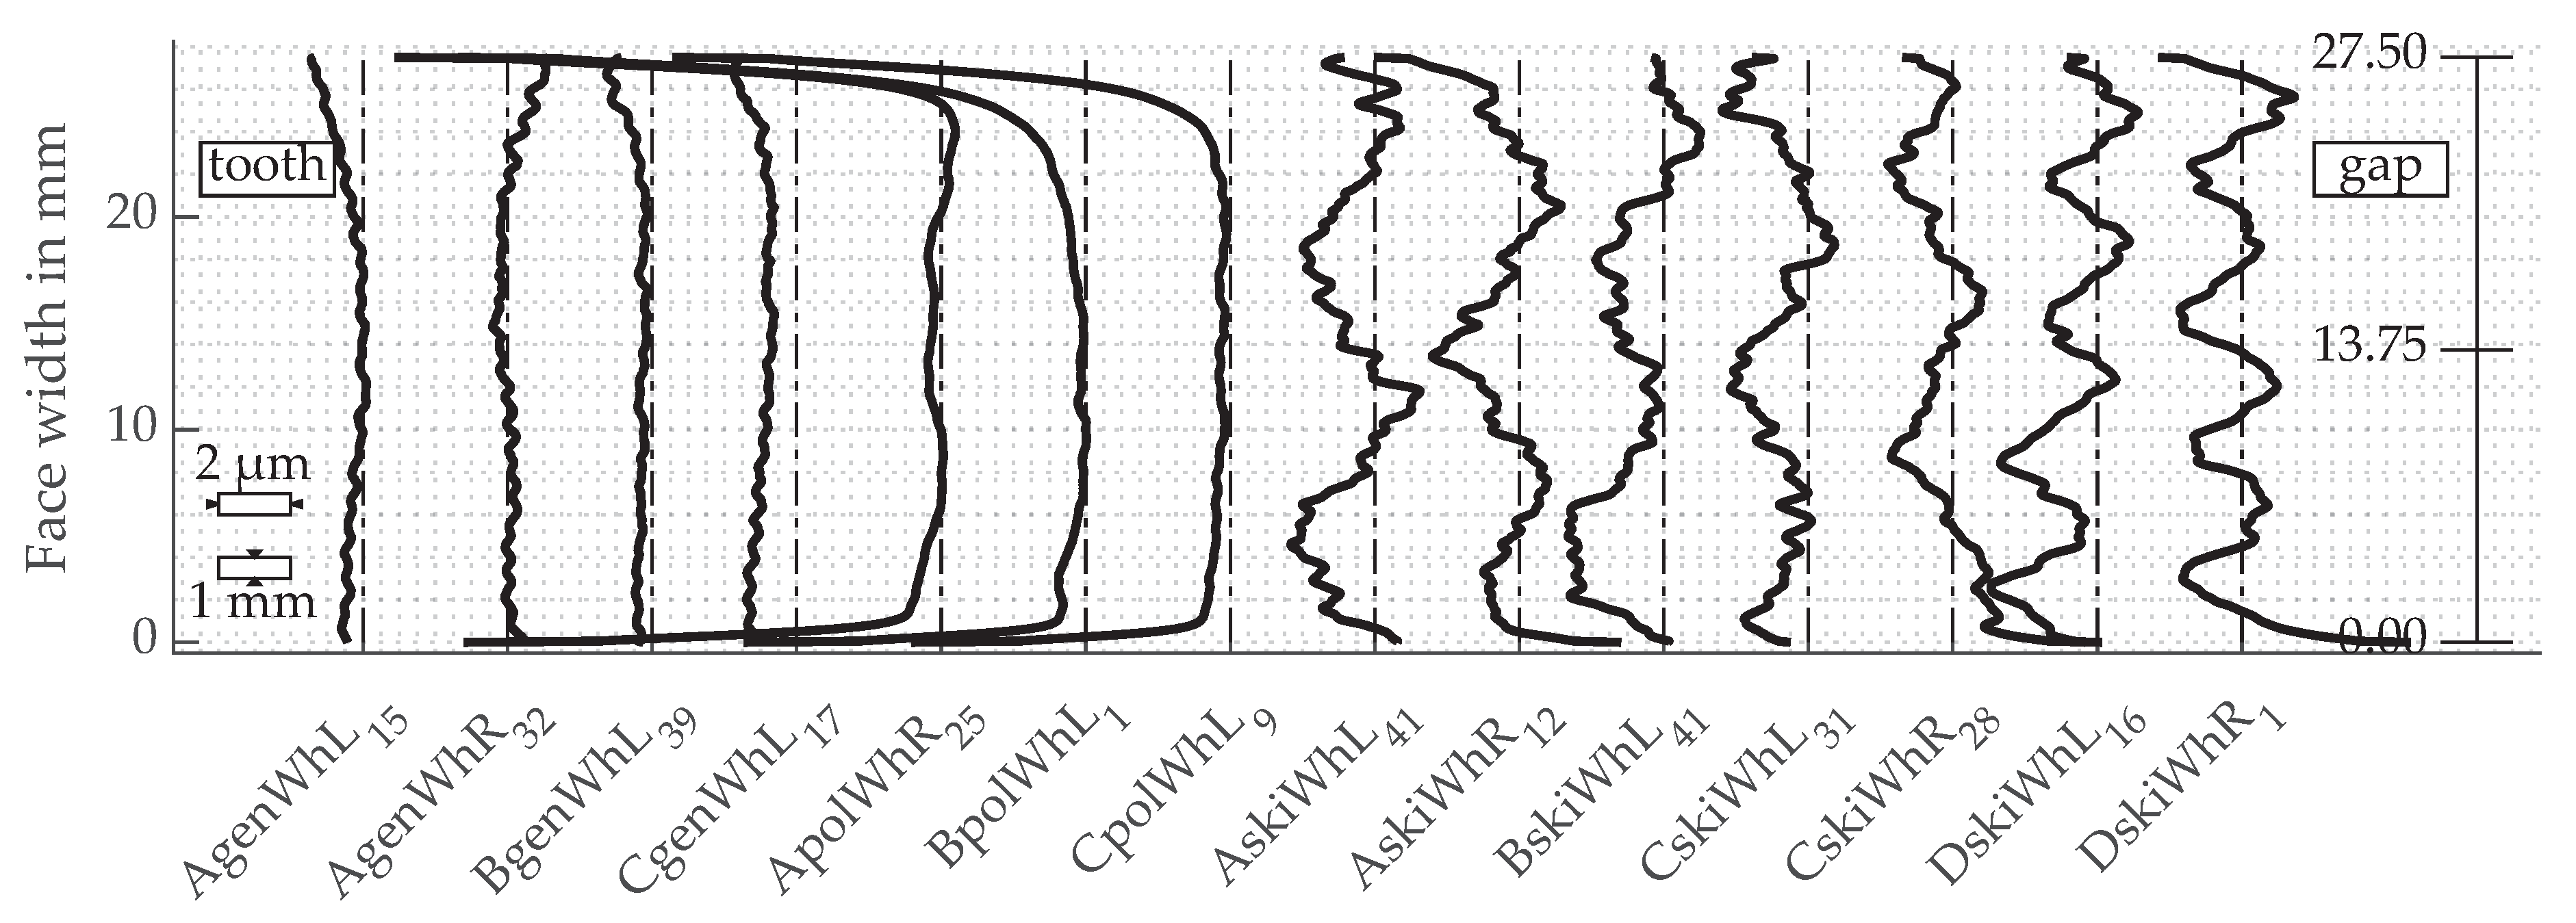
3.6. Profile and Lead Lines

The profile lines are measured in the middle of the face width. The lead lines are measured at the V-circle diameter d V . Figure 14 shows the position of the measuring lines. For the pinion the V-circle diameter d V 1 is equal to 136.909 mm. The V-circle diameter of the wheel is d V 2 = 143.185 mm. Figure 15 and Figure 16 show the profiles lines of the measured pinions and wheels.
The pinions manufactured by continuous generating grinding show similar courses of the profile line compared to the previously described pinion AgenPiL. The profile line of AgenPiL shows the smallest deviations. The pinions manufactured by polish grinding have a profile that is comparable to the previously described pinion BpolPiL. Within the range of the involute helicoid the profile line of BpolPiL shows smaller and in the range of the tip relief marginally larger deviations. The pinions manufactured by gear skiving show comparable profile lines. The pinion BskiPiL has the largest deviations at the tip relief. In the direction of the root diameter, the sign of the deviation changes for the left and right flank. The pinion manufactured by gear skiving with half of the axial feed DskiPi shows additional higher frequency deviations compared to the other pinions manufactured by gear skiving.
The profile lines of the wheels (see Figure 16) show tendencies similar to those of the pinions. In comparison to the pinions, the deviations at the tip relief are larger. The wheels manufactured by polish grinding are very accurate in the area of the involute helicoid. For gear skiving, the wheels are more wavy in the profile lines. The profile lines of the wheels manufactured by gear skiving are closer to the desired geometry in the direction of the root diameter compared to the pinions.
Figure 17 and Figure 18 show the lead lines of the manufactured pinions and wheels. The pinions manufactured by continuous generating grinding show comparable results in the flank lines. AgenPiR shows smaller deviations in the middle and larger deviations near the edges. The pinions manufactured by polish grinding show properties of a flank line end relief. At one edge of the pinions manufactured by gear skiving the flank lines show clear deviations at one edge. At the other edge the deviations are partly smaller with a different sign. The pinion manufactured with half of the axial feed shows additional higher frequency deviations in the lead line compared to the pinions manufactured by gear skiving.
The lead lines of the wheels (see Figure 18) show tendencies similar to those of the pinions. The wheels manufactured by gear skiving show an additional waviness of higher deviations with a rather large wavelength.

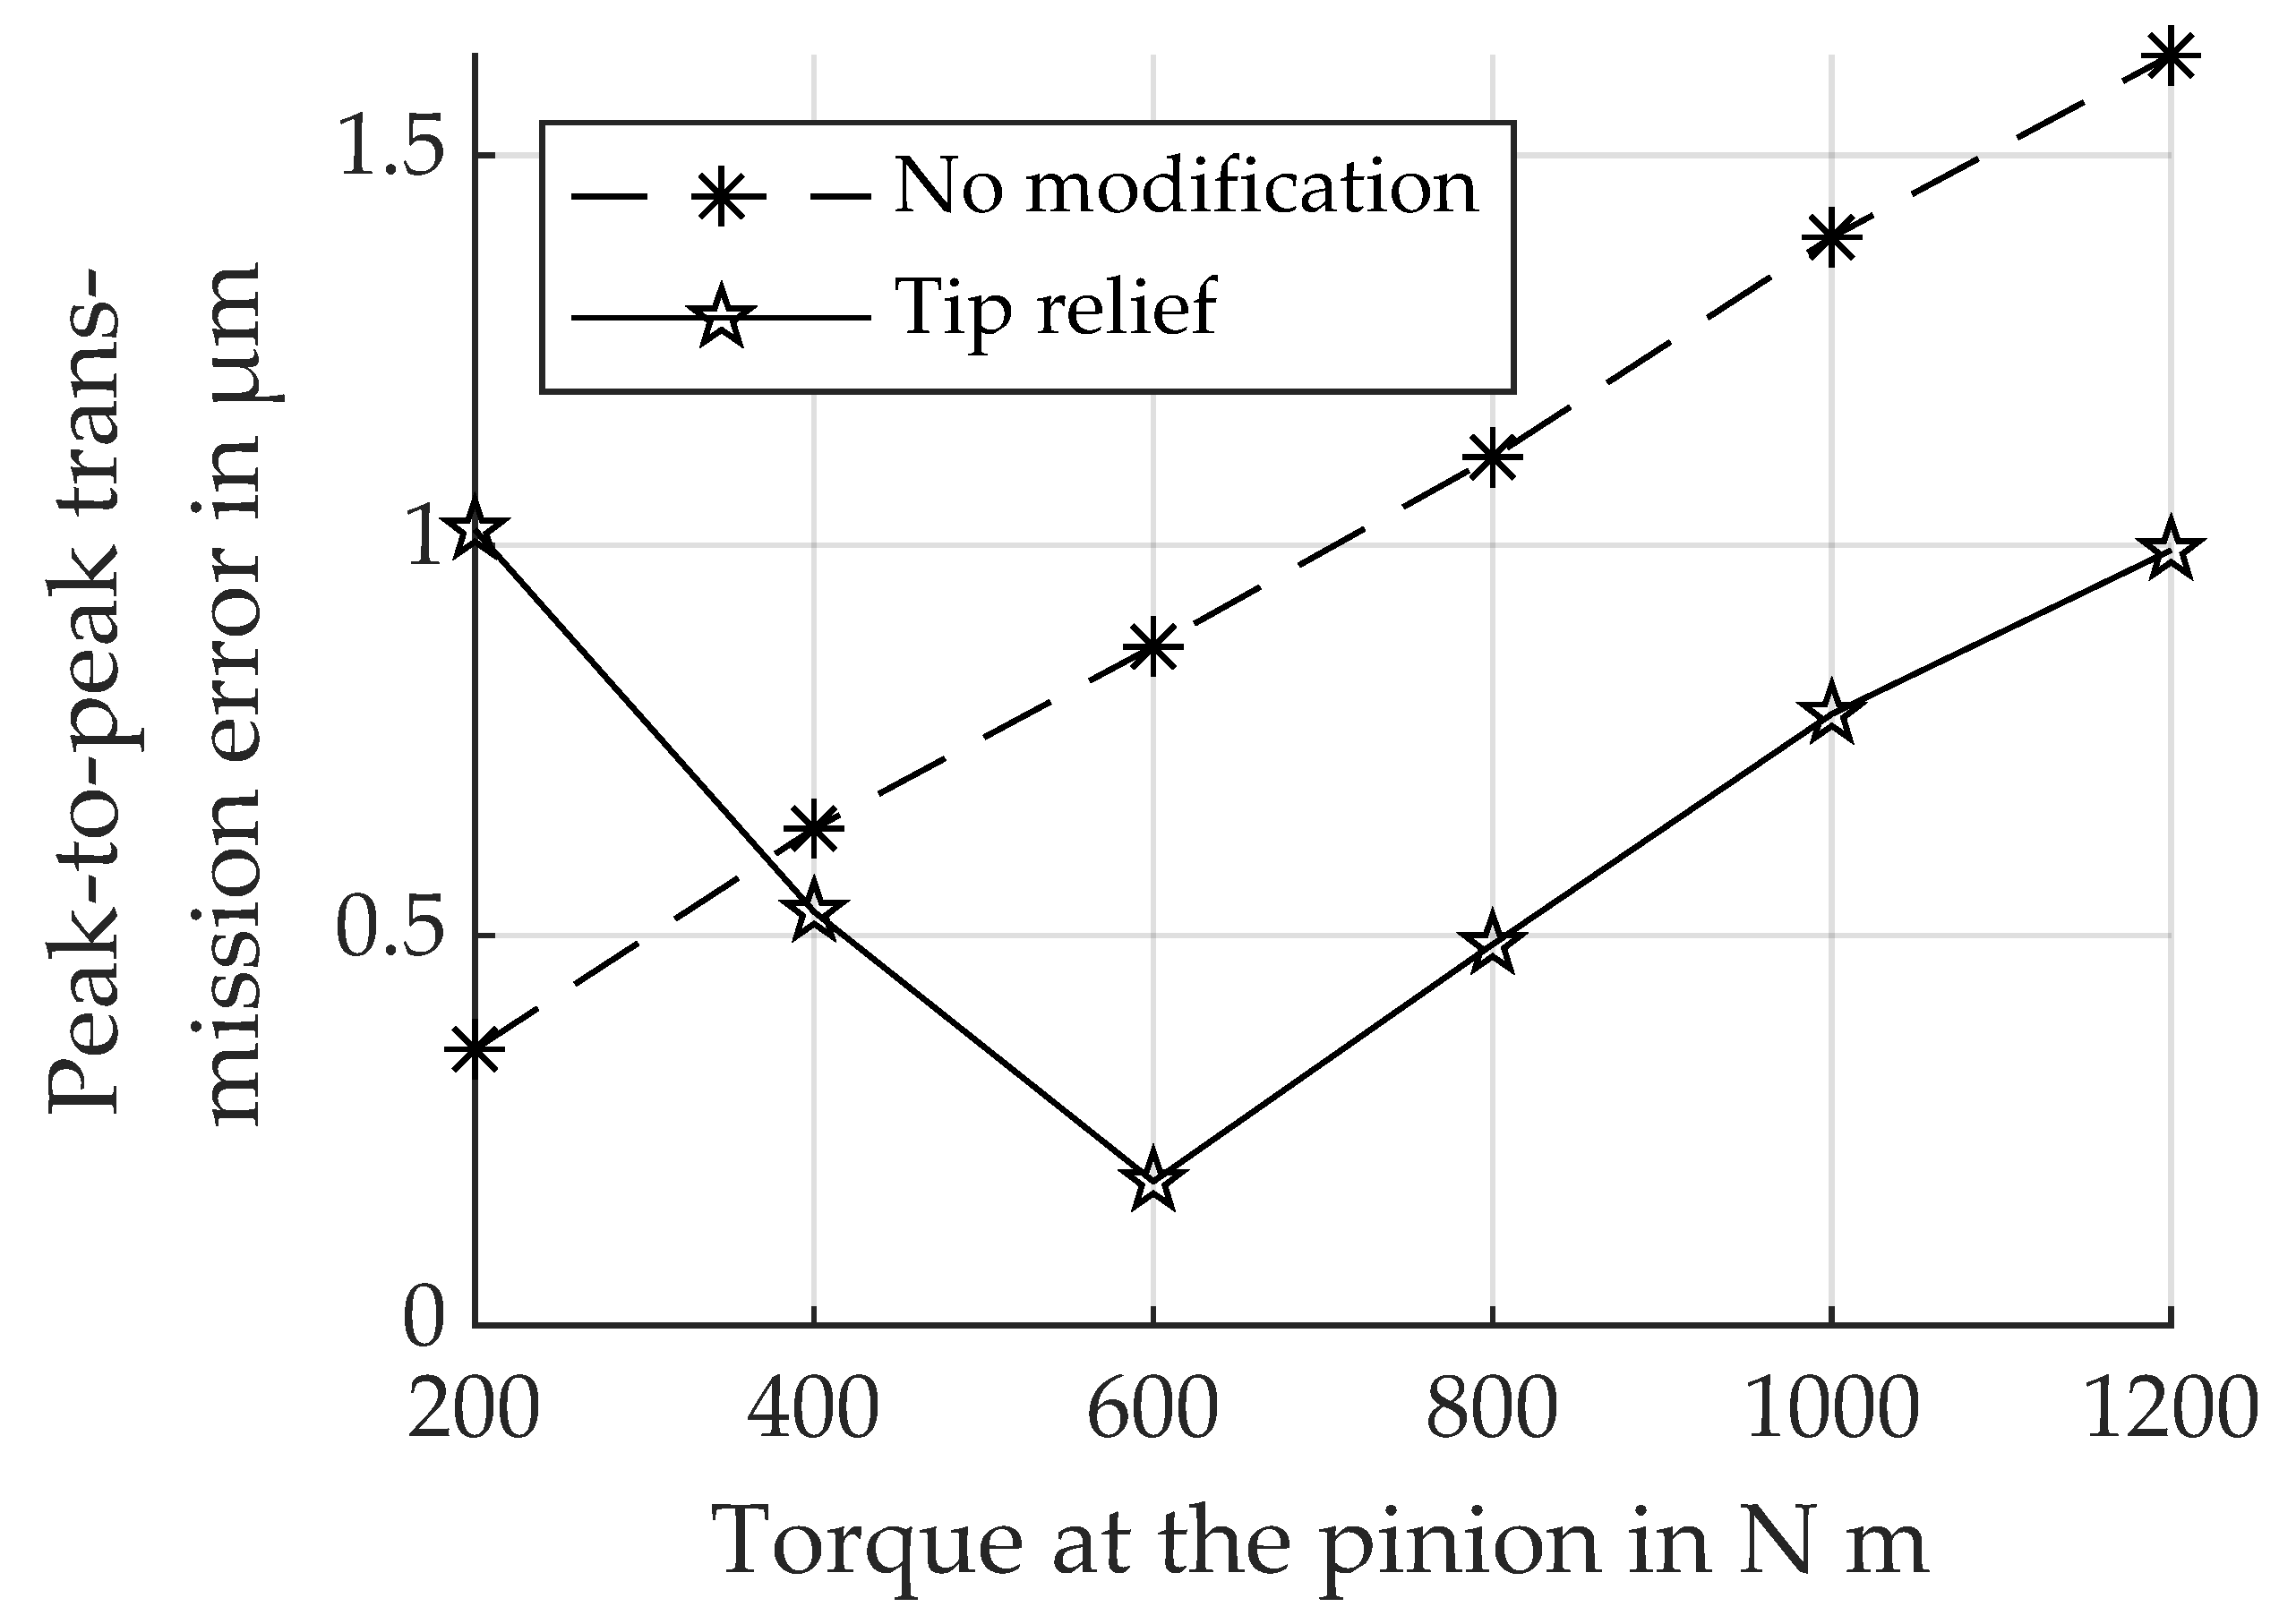
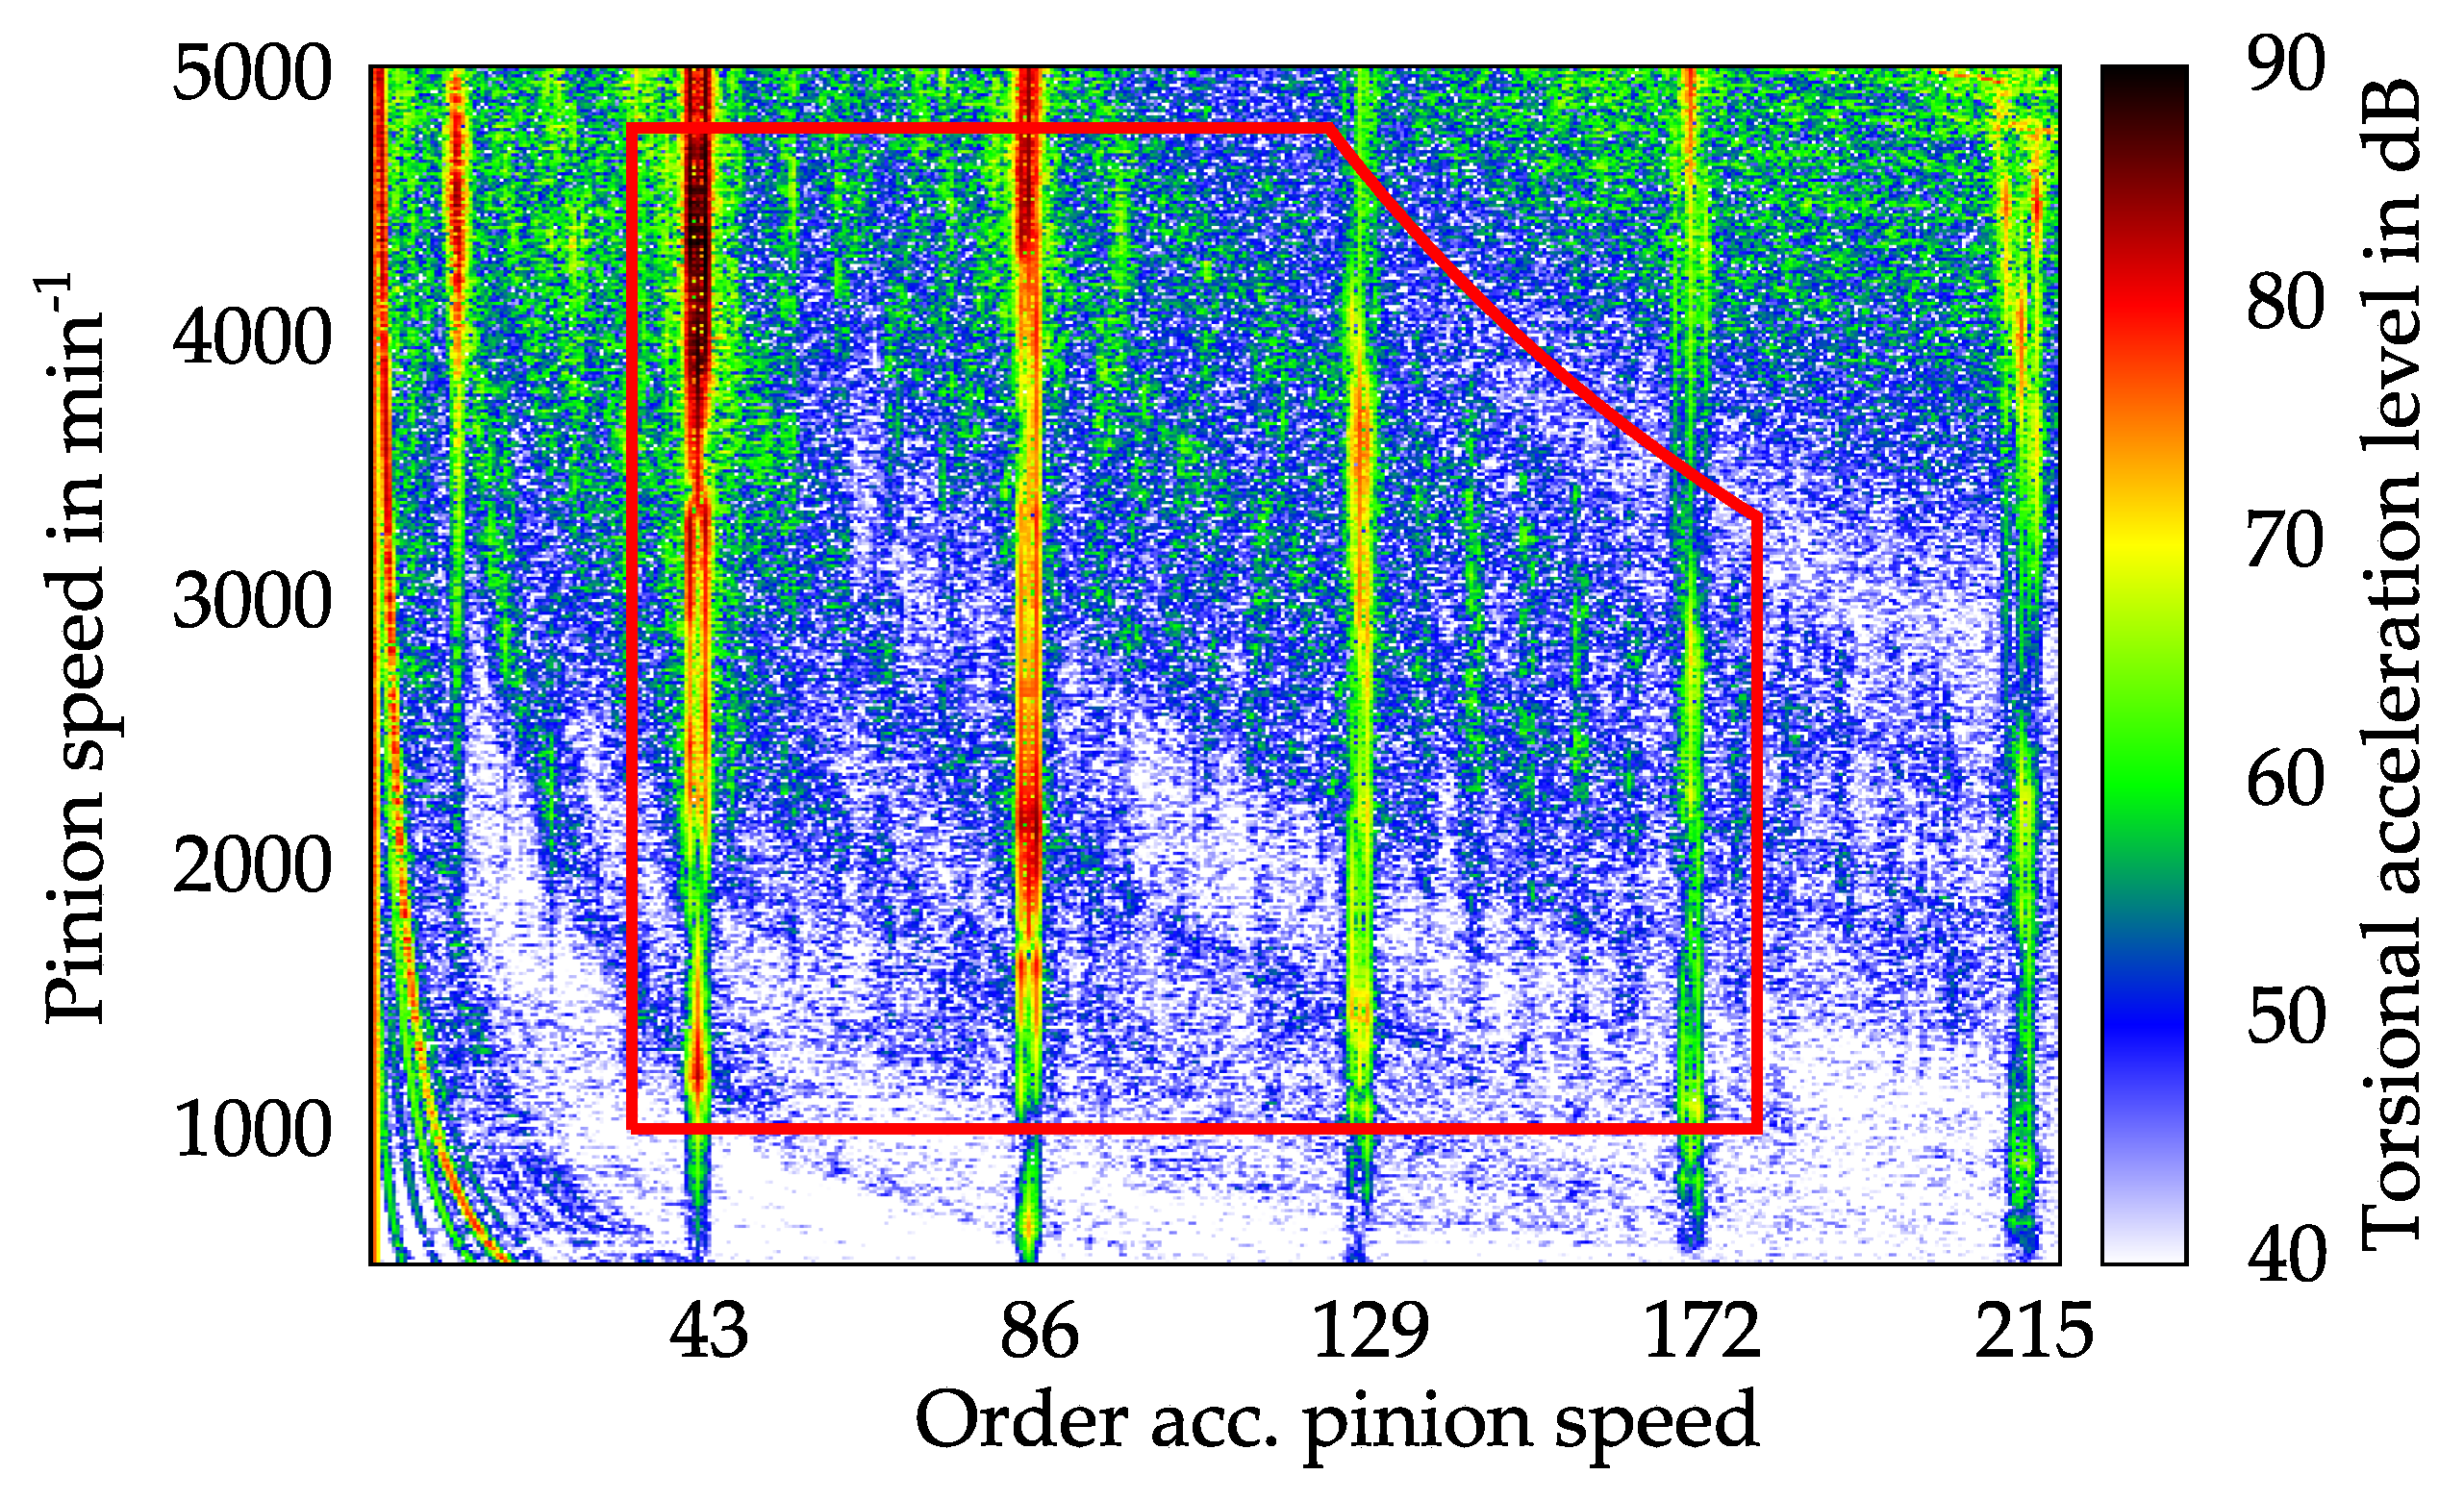
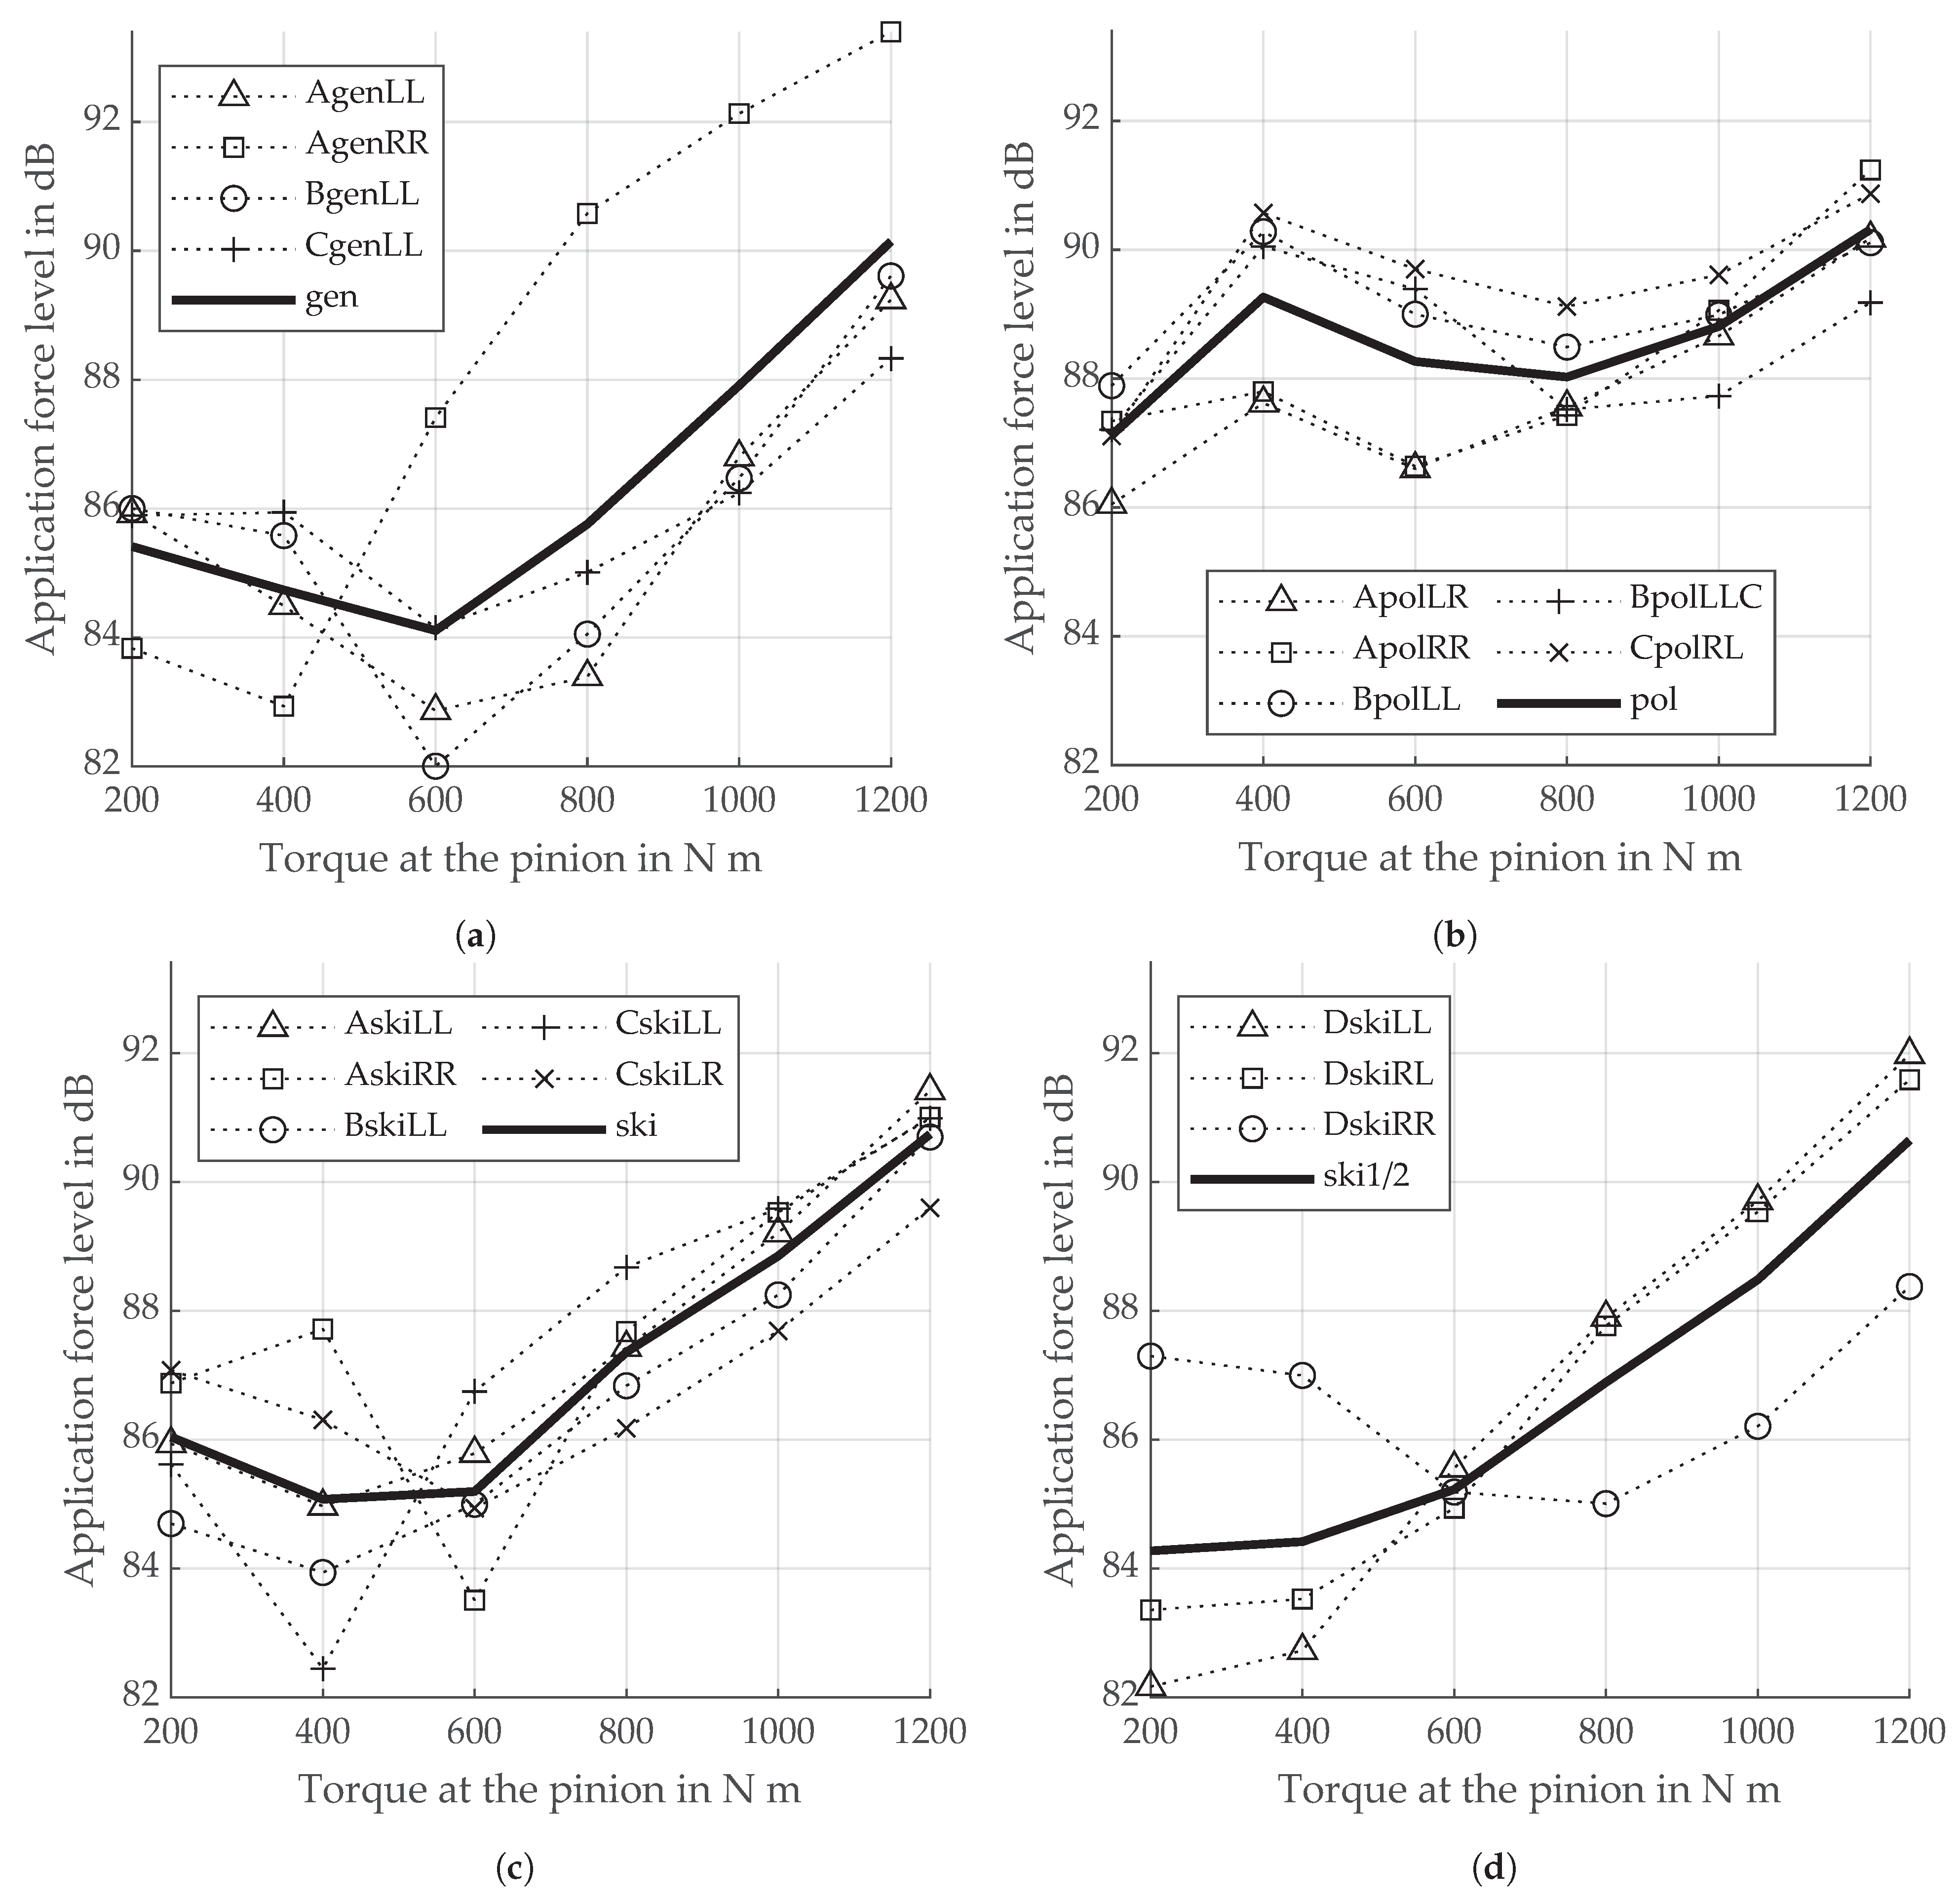
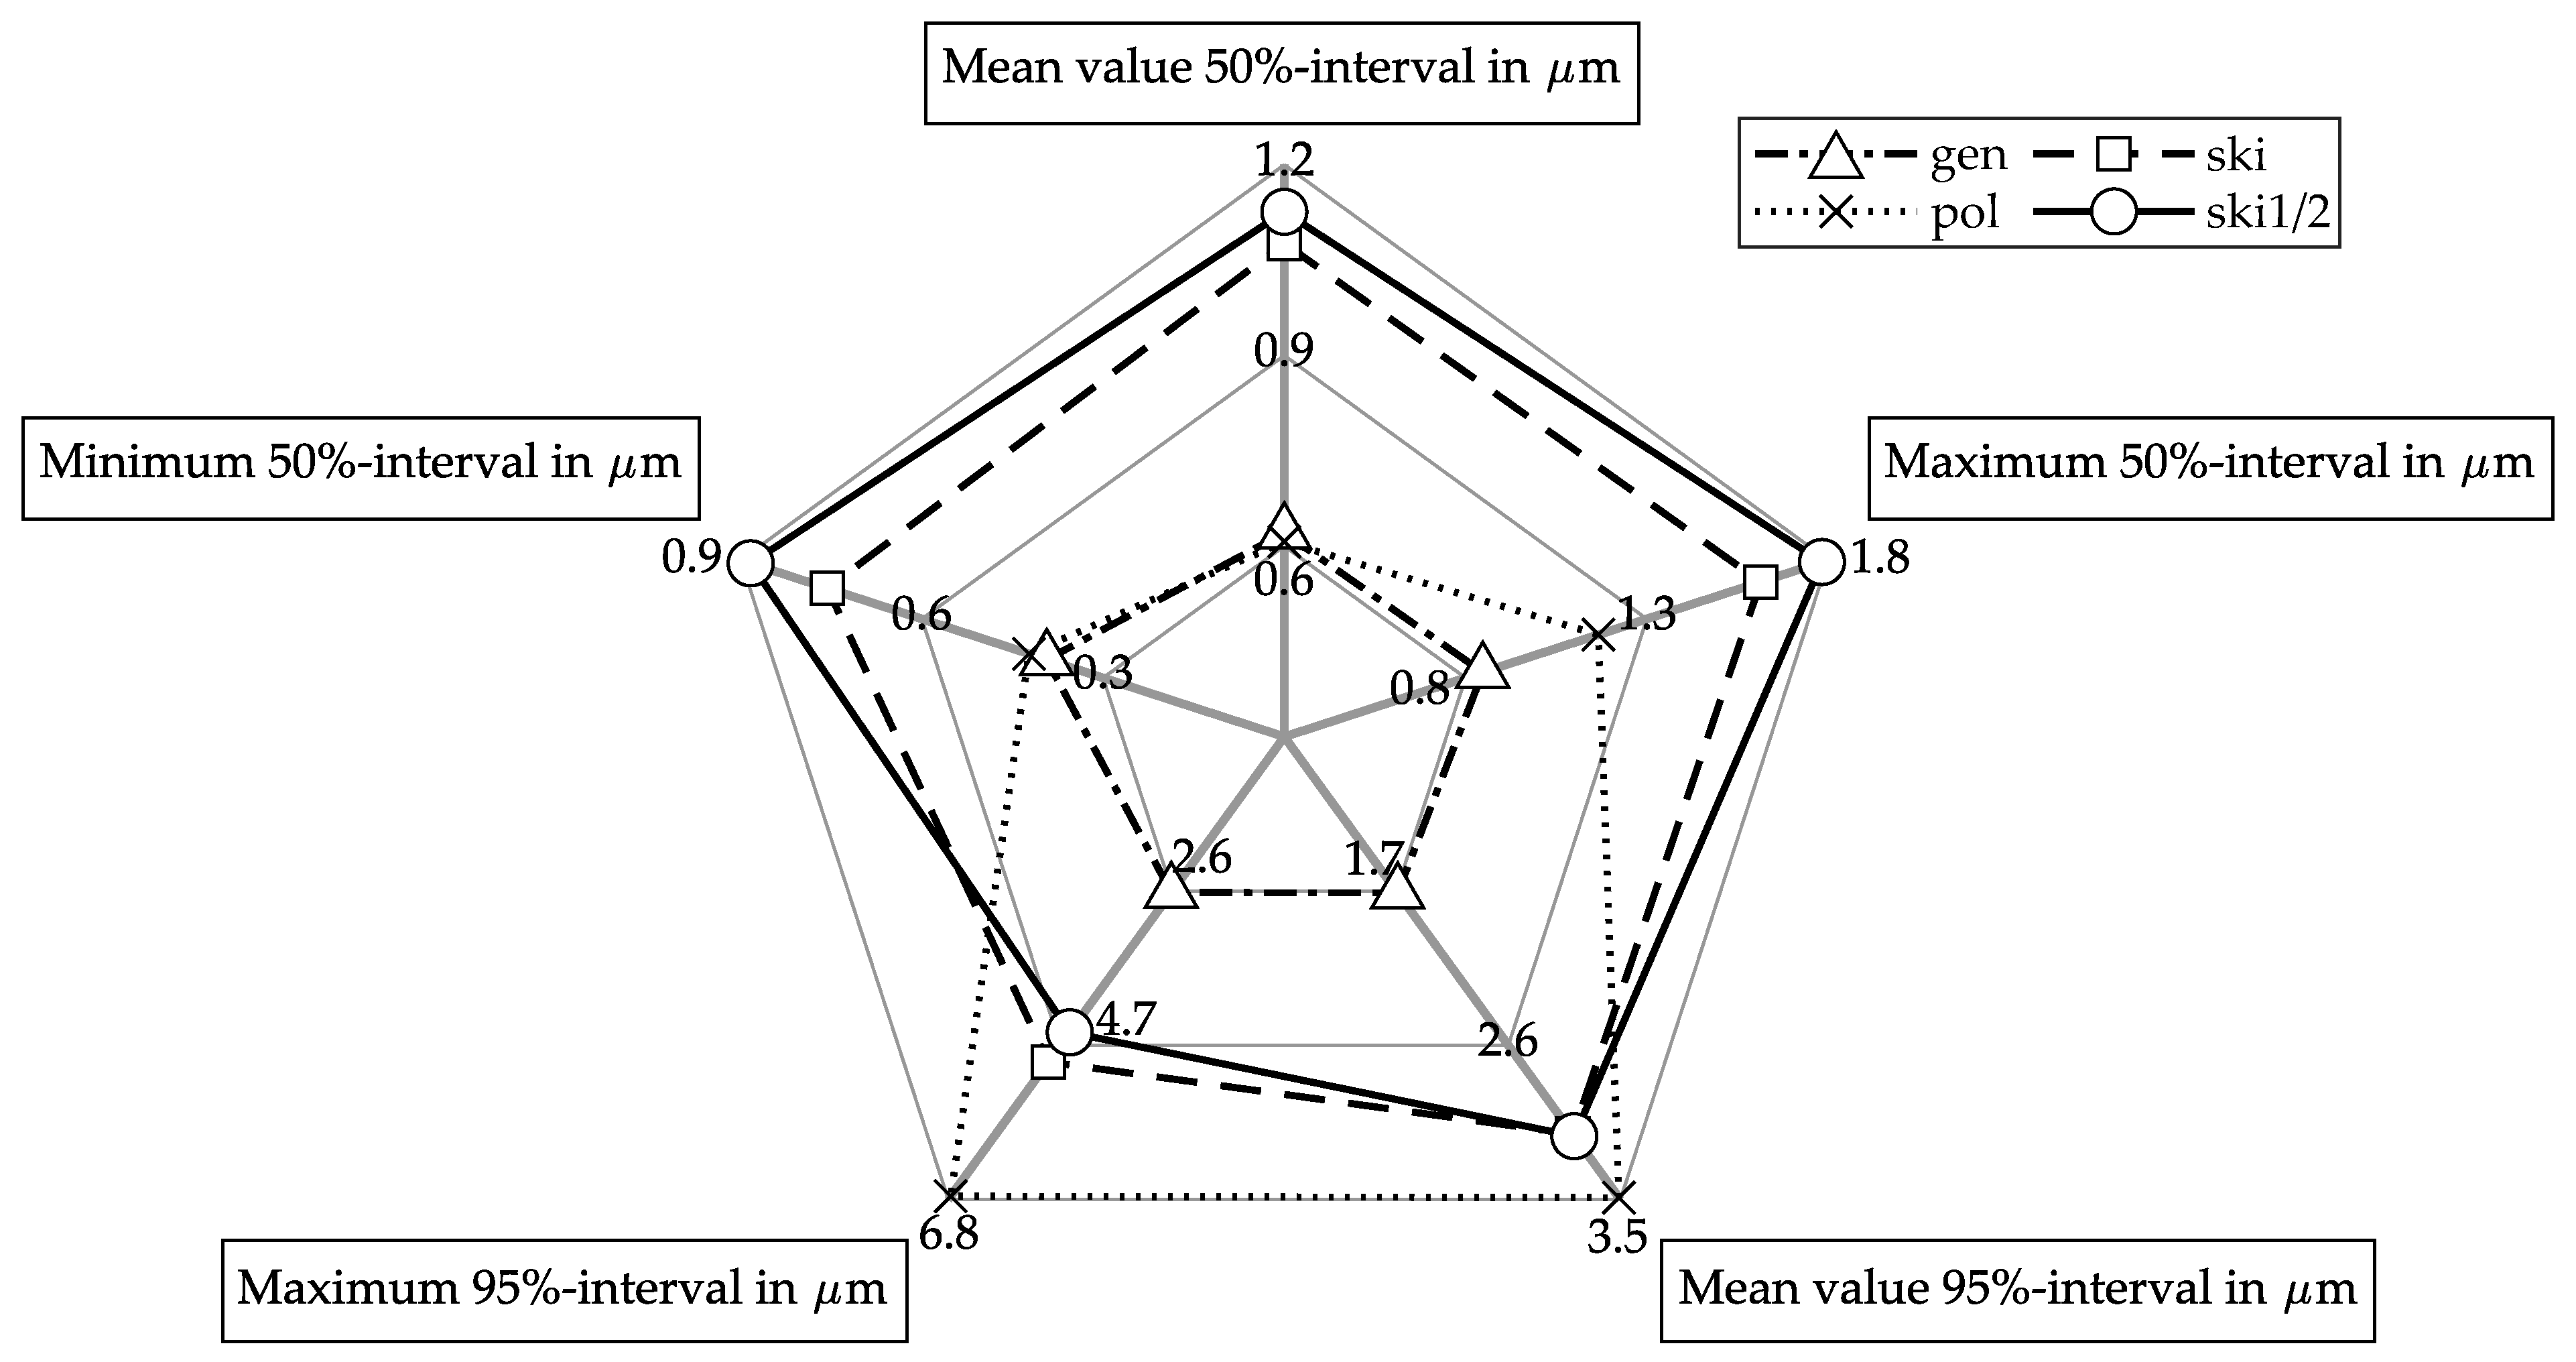
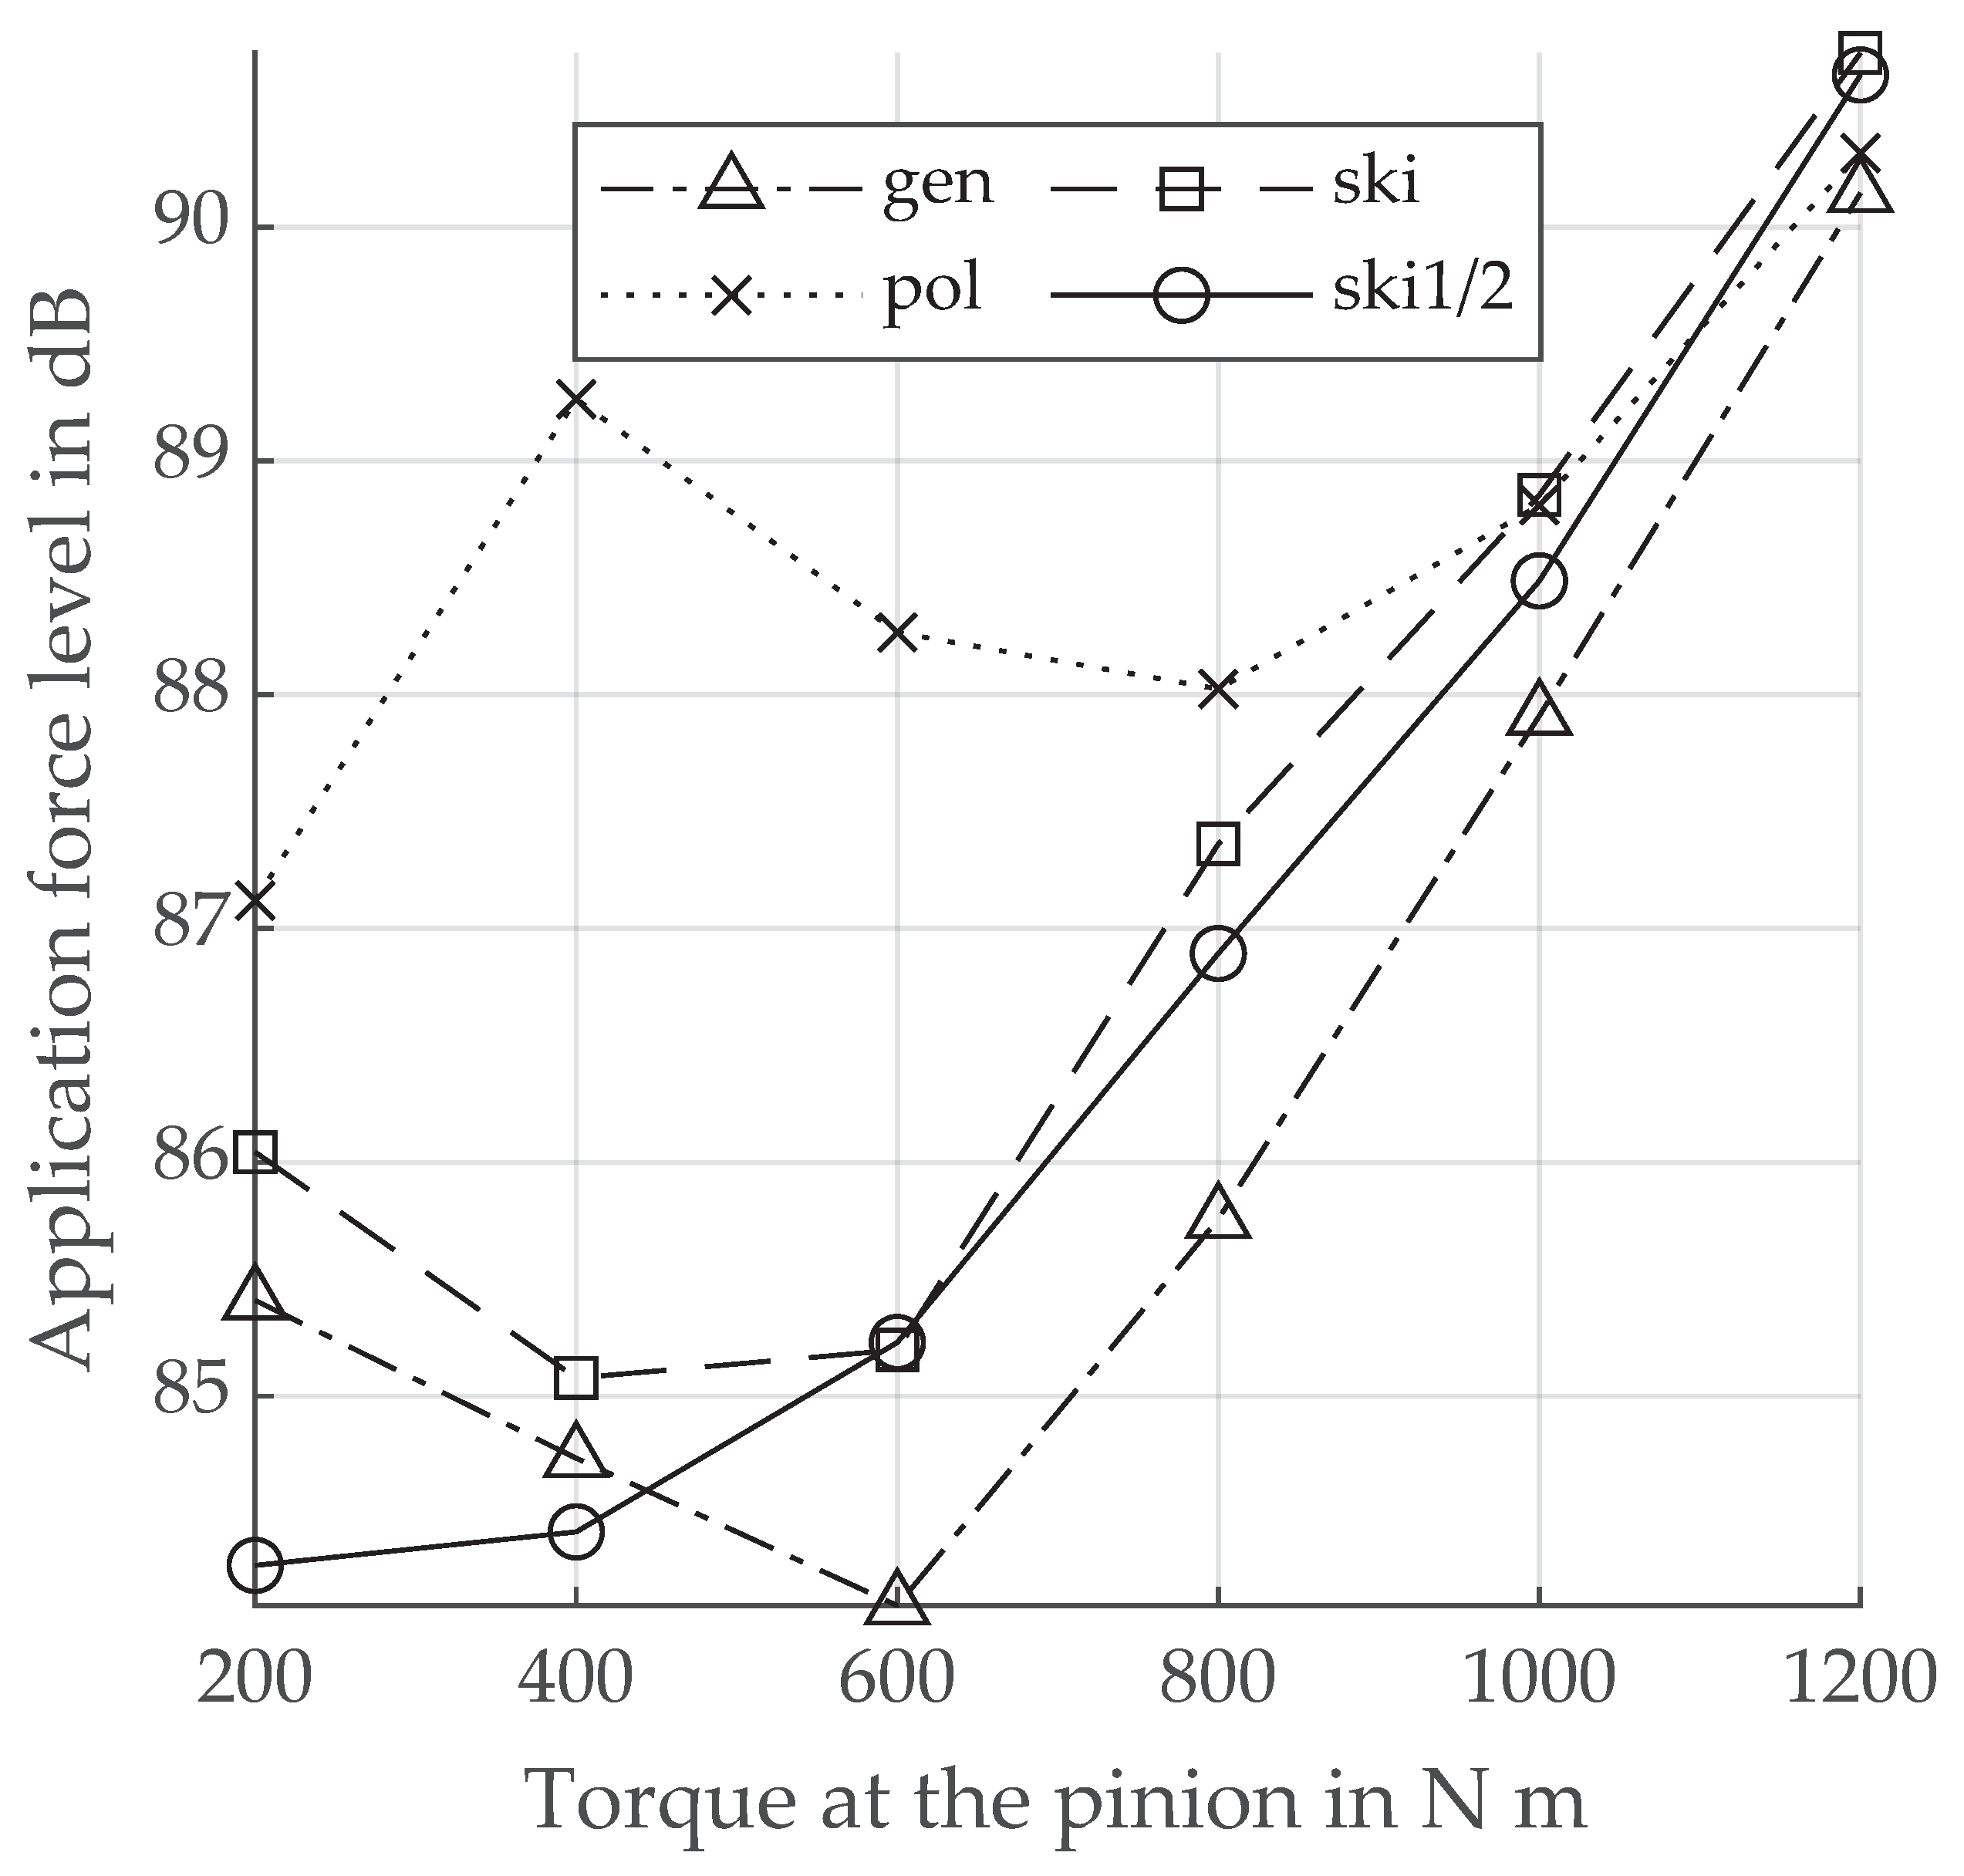
3.7. Application Force Level

The application force level L A , F of the different torsional acceleration measurements is shown in Figure 19. In addition to the results of the different tested gear pairs a compensation curve for the respective manufacturing process is also included. On the basis of cursory repeated tests, the repeatability of the measurement was examined. With roughly 1 dB difference in the application force level the repeatability is very good and the influence of assembly deviations is negligible.
The application force level of the test gears manufactured by continuous generating grinding decreases with larger load up to a minimum. Behind the minimum, the values increase with larger load. The minimum of the three tests of the continuous generating ground left flanks is 600 N m . For the three right flanks, the minimum is 400 N m . With the exception of the test run AgenRR, all tested gear pairs show an application force level between 82 dB and 86 dB in the range of 200 N m and 800 N m load. The compensation curve roughly reflects the course of the paired left flanks. For larger loads the application force level of the compensation curve is higher than from the three paired left flanks.
The polish ground test gears do not show a pronounced minimum. At the lowest load level, with the exception of the test run ApolRR, the test gears start with the lowest value of L A , F . The application force level increases to a local maximum at 400 N m . In the range from 600 N m to 800 N m the application force level decreases to a local minimum. For larger loads, the application force level increases again. The test runs BpolLL, BpolLLC and CpolRL fall within a range between 87 dB and 91 dB for each load level. The test runs ApolLR and ApolRR, which were each conducted with same gear wheel variant ApolWhR, show lower application force levels in the range of lower loads. In the range between 200 N m and 800 N m , the application force level of these tests is between 86 dB and 88 dB. The compensation line is approximately midway between the results.
The application force level of the skived gears decreases to a minimum at 400 N m and 600 N m , respectively, and increases after the local minimum with larger loads. An exception to this is the test run AskiRR. The application force level of this variant rises to a local maximum at 400 N m before reaching its minimum. In the range between 200 N m and 800 N m , the application force level of the skived gears is between 82 dB and 88 dB. Only the test run CskiLL is slightly above 800 N m at 88 dB. The compensation curve reproduces all progressions well, except for the local maximum of the test run AskiRR.
The three tests of the skived gears with half axial feed show two different progressions. The application force level of the test runs DskiLL and DskiRL increase slightly between 200 N m and 400 N m . The application force level in this range is between 82 dB and 84 dB. The increase is stronger in the further course. The application force level of the test run DskiRR drops to a minimum at 800 N m and increases with larger loads. The compensation curve rather reflects the course of the test runs DskiLL and DskiRL.

4. Discussion

4.1. Flank Roughness, Surface as Well as Profile and Lead Line

The flank roughness of the gears manufactured by polish grinding and gear skiving are of ultra-high accuracy, which is the highest possible accuracy according to [26]. The continuous generating ground gear is of high accuracy, which can be achieved by first-rate machines tools and skilled operators only according to [26]. The R a -values of the gears manufactured by continuous generating grinding and polish grinding are below the mean roughness values stated by [4]. The flank roughness measurements show the potential of all investigated manufacturing methods with respect to accuracy.
Figure 20 shows a summary of the different box plots from Figure 10, Figure 11, Figure 12 and Figure 13. The maximum value and average value of the 50%- and 95%-intervals are shown, as well as the minimum value of the 50%-interval of the different gears.
Regarding the values shown in Figure 20, continuous generating grinding shows the best values with the smallest deviations, with the exception of the mean value of the 50%-interval ( 0.62   μ m for continuous generating grinding compared to 0.61   μ m for polish grinding). For a large part of the flank, the deviations in the gears manufactured by continuous generating grinding and polish grinding show comparable results. As a consequence of the larger deviations at the edges for the gears manufactured by polish grinding, the range of the deviations is higher for polish grinding. The described characteristics of flank line end relief are also described in [4]. The values of the 95%-interval are highest for polish grinding. The gears manufactured by gear skiving show the highest values in the 50%-interval. With respect to the range of the deviations, gear skiving is between continuous generating grinding and polish grinding.
The kinematics of continuous generating grinding and polish grinding are principally the same. The cutting speed is rather small compared to the pitch speed and the axial feed [5]. Therefore, the cutting traces almost run in lead direction. The course of the cutting traces is recognizable in Figure 10 and Figure 11. Visible deviations at specific diameters cover the whole face width. Furthermore, the deviations in the lead lines (see Figure 17 and Figure 18) are smaller compared to the deviations in the profile lines (see Figure 15 and Figure 16) for continuous generating grinding and polish grinding.
The profile lines (see Figure 15 and Figure 16) of the gears manufactured by polish grinding are the smoothest. The profile lines of the pinions show rising deviations (absolute value) in direction of the root diameter. The sign of the deviation switches for the left and right flank. Neither the wheels manufactured by gear skiving nor those made by other manufacturing processes show such a systematic behavior.
The three-dimensional deviations in one flank and the median of one manufacturing method are similar for continuous generating grinding and polish grinding (see Figure 10 and Figure 11). The three-dimensional and the median visualizations both show the same recognizable deviations at specific diameters. The smoothing for continous generating grinding is clearer than for polish grinding. The small differences between the three-dimensional deviations and the median show that the deviations are rather similar at each flank of one gear. The gears manufactured by gear skiving (see Figure 12 and Figure 13) also show certain deviations at specific diameters both for the visualization of one flank and the median. For gear skiving, the median is clearly smoother than the rather rough deviations in one flank. Diagonal processing traces described by [7,8] cannot be seen in the visualization used in the present paper. Due to the greater distances of the three-dimensional visualizations in transverse direction, the lack of visible diagonal processing traces in the figures shown is comprehensible.
The lead lines of the gears manufactured by gear skiving show noticeable ripples. In particular, for the wheel (see Figure 18) the distance of the regular deviations shows a dependence on the axial feed. One variant manufactured with half of the axial feed has a distance of about 6.5   m m . Another gear manufactured by gear skiving with normal axial feed shows a distance of the regular deviations in about 15 m m . The distance of the normal axial feed is nearly twice as wide as the one of half the axial feed. CskiWhR at tooth number 28 and DskiWhR at tooth number 1 even show distances, which are exactly twice as wide ( 12.6   m m for CskiWhR and 6.3   m m for DskiWhR). The depth of these regular deviations is in a comparable range. These deviations are rather not a characteristic of the manufacturing process gear skiving, but a consequence of flaws of the boundary conditions of the manufacturing process. The tool carrier with a single tooth in combination with the test carrier used as machine tool has structural-mechanical deficiencies which results in these deviations.

4.2. Excitation Behavior

All generating ground gears show a pronounced minimum of L A , F between 400 N m and 600 N m (see Figure 19a)). The tests with active left flanks show very good agreement with the theoretical design of the micro geometry. All three pairs of left flanks show a minimum of application force level at the design load of 600 N m . This indicates flank forms with small deviations. The compensation curve is slightly increased at higher loads compared to the measurements with active left flanks due to the influence of the test with active right flanks. The minimum of the compensation curve is at 600 N m and corresponds to the design point.
The polish ground gears show a higher overall excitation level (see Figure 19b)) without a pronounced minimum. The compensation line is approximately midway between the results and gives a good representation of the progression of the individual measurements. Because the difference between the measurements of the right and left flanks is small, the compensation curve gives a good representation of a large part of the results for both flank pairs.
The minimum of the application force level of the skived wheels is in the range between 400 N m and 600 N m (see Figure 19c)). For two of the five variants, the minimum of L A , F is at the design load of 600 N m . The shift of the minimum to other loads is understandable due to the geometric flank shape deviations from the nominal flank shape (see Figure 15, Figure 16, Figure 17 and Figure 18). The compensation curve reproduces almost all gradients well.
The skived gears with half of the axial feed show a steady increase in the application force level in the tests with at least one active left flank. The steady increase is also reflected in the compensation curve.
The performed tests show a scatter on the order of 2 dB. In a repeated measurement the application force level differed by roughly 1 dB, which confirms the range of the scatter.
In the range of higher loads ( 1000 N m and 1200 N m ), with the exception of one measurement, all application force levels are in a scatter range, smaller than 4 dB. The scatter of the measured values at lower loads is more than twice as large. The tested gears differ only in manufacturing-related deviations. The macro geometry and the specification of the profile modifications in the form of a tip relief are identical for all test gears. With increasing torque, the load-induced deformations increase. If the load-induced deformations are greater than the gear tooth deviations, the influence of the gear tooth deviations on the noise excitation is subordinate. In the range of low loads (200 N m to 800 N m ), the gear tooth deviations have a greater effect on noise excitation. The decreasing influence of gear tooth deviations on noise with increasing loads is in accordance with expectations [27,28].
The production of the skived gear wheels is very precise with regard to the specified tip relief. The flanks of the skived gears show periodic waveform deviations due to manufacturing. Periodic flank deviations can influence the noise excitations [13]. For the manufactured gears, the waveform deviation is not in the gear meshing direction of the gear. Thus, the waveform deviations in the skived gears do not have a significant effect on the noise level of the application force level in the tests.
Figure 21 shows the compensation curves of the application force level measurements. In the experiment, the generating ground gears confirm the minimum noise excitation at the design load of 600 N m . The application force level of the compensation curve is the lowest for the generating ground gears, except for the results of the skived gears with half of the axial feed in the range of 200 N m to 400 N m . The progression of the compensation curves of the generating ground and skived gears is similar from 600 N m . The values of the compensation curve are shifted to higher values for the skived variant. The compensation curve of the polish ground gears has higher values in the range from 200 N m to 800 N m than the other compensation curves. All test gears were designed to be low-noise with an integer overlap ratio. The recessed edge areas of the polish ground gears result in a smaller contact area of the mesh. The overlap ratio decreases with negative consequences for noise excitation.
Large-scale gear deviations have a clear effect on the application force level in the case of the polish ground gears. The different surface structures as a function of the manufacturing process do not show any clear influence of the surface structure on the excitation level of the gear in form of the application force level L A , F in the experiments.
The test gears are designed without flank modifications in the tooth transverse direction (e.g., crowning). In practice, modifications in the transverse direction are state of the art to improve the load carrying capacity of gears. Local overloads and edge contact can be avoided and the contact pattern centered. The relieved flank areas at the edge of the polish ground gears may have no significant effect on noise performance when gears are designed including crowning or end relief. All the manufacturing processes investigated offer the potential to achieve comparable results in practice with regard to noise excitation. Compared to deviations from the design, the manufacturing-related surface structure shows hardly any influence on the application force level which is used in this study to analyze the noise excitation. However, the different manufacturing methods influence specific mesh orders differently, but those specific or intermediate orders do not affect the summed up levels in form of the application force level at least in this investigation. Furthermore, long-term effects such as a high number of load cycles and the associated continuous wear of the gear flanks are not covered in this study.

5. Conclusions

The geometrical accuracy and the quality of the gear flank form is essential for the operation of a gear stage with respect to load capacity, efficiency and excitation. In the present study, torsional acceleration measurements during speed ramp-ups at different constant torque levels determine the excitation behavior directly at the gear wheel body. The calculated application force level allows a neat comparison of the experimental results. The tactile scanning of the gear flank profiles of the different gear variants shows apparent differences in the microgeometry, accuracy and quality due to the properties of the different manufacturing processes. Compared to the size of the tip relief with parabolic transition, these differences are very small. This is also clearly visible in the results of the application force level over load for all variants. At higher loads starting from 800 N m all variants show similar application force levels L A , F , because the load-dependent deformation of the gear teeth is dominant over the manufacturing deviations. For lower loads ( 200 N m to 600 N m ), with exception of the polish ground gears, there exist slightly higher differences in the application force level L A , F .
The present study shows that the influence of the manufacturing related microstructures on the application force level is minor. The precise manufacturing of the designed microgeometry is of major influence. This is especially important when the gear stage is often operated under partial load. The difference in the application force level of the polish ground gears compared to the other manufacturing processes (for lower loads from 200 N m to 600 N m ) can be traced back to the deviations in the amount and the roll length from the design values of the microgeometry. As the designed gears have no modification in lead direction, especially polish grinding may have another effect on noise than this study revealed.

Author Contributions

Writing—original draft M.T. and J.G.; Visualization—M.T.; Investigation—B.K.; Writing—review and editing M.T., J.G., B.K., M.O. and K.S. All authors have read and agreed to the published version of the manuscript.

Funding

This research received no external funding.

Data Availability Statement

Results are contained within the article.

Acknowledgments

The authors would like to thank Reishauer AG for supporting and providing the hard finishing of the gears.

Conflicts of Interest

The authors declare no conflict of interest.

Abbreviations

The following abbreviations are used in this manuscript:
FZGGear Research Centre
NVHnoise, vibration and harshness
FVAResearch Association for Drive Technology
DZPDynamic Tooth Force Program
genLabel for test gears manufactured by continuous generating grinding
polLabel for test gears manufactured by polish grinding
skiLabel for test gears manufactured by gear skiving
PiLabel for pinion used in experiment
WhLabel for wheel used in experiment
LLabel for left flank
RLabel for right flank

References

  1. Aminbi, N. Surface Machining for Noise Suppression. Ph.D. Thesis, Chalmers University of Technology Goteburg, Gothenburg, Sweden, 1991. [Google Scholar]
  2. Jia, K.; Zheng, S.; Guo, J.; Hong, J. A surface enveloping-assisted approach on cutting edge calculation and machining process simulation for skiving. Int. J. Adv. Manuf. Technol. 2019, 100, 1635–1645. [Google Scholar] [CrossRef]
  3. Heider, M. Schwingungsverhalten von Zahnradgetrieben: Beurteilung und Optimierung des Schwingungsverhaltens von Stirnrad- und Planetengetrieben. Ph.D. Thesis, Technical University of Munich, Munich, Germany, 2012. [Google Scholar]
  4. Graf, W. Polish Grinding of Gears for Higher Transmission Efficiency. In American Gear Manufacturers Association Fall Technical Meeting; American Gear Manufacturers Association (AGMA): Detroit, MI, USA, 2015; pp. 265–277. [Google Scholar]
  5. Klocke, F.; Brecher, C. Zahnrad- und Getriebetechnik: Auslegung-Herstellung-Untersuchung-Simulation, 1st ed.; Carl Hanser Verlag: Munich, Germany, 2017. [Google Scholar]
  6. Klocke, F.; Koellner, T. Hard gear finishing with a geometrically defined cutting edge. Gear Technol. 1999, 16, 24–29. [Google Scholar]
  7. Hühsam, A. Modellbildung und Experimentelle Untersuchung des Wälzschälprozesses. Ph.D. Thesis, RWTH Aachen University, Aachen, Germany, 2002. [Google Scholar]
  8. Trübswetter, M.; Otto, M.; Stahl, K. Evaluation of Gear Flank Surface Structure Produced by Skiving. Forsch. Ingenieurwesen 2019, 83, 719–726. [Google Scholar] [CrossRef]
  9. Utakapan, T.; Kohn, B.; Fromberger, M.; Heider, M.; Otto, M.; Stahl, K. Measurement of gear noise behaviour for different microgeometries. Internoise 2016, 253, 3964–3974. [Google Scholar]
  10. Winter, H.; Seifried, A.; Ill, M. Einfluß von Verzahnungsgenauigkeit und Oberflächenstruktur der Zahnflanken auf das Geräuschverhalten von Stirnrädern. VDI Z. 1965, 107, 245–320. [Google Scholar]
  11. Gravel, G. Simulation of Deviations in Hobbing and Generation Grinding. In Proceedings of the International Conference on Gears, Garching, Germany, 7–9 October 2013. [Google Scholar]
  12. Gravel, G. Analysis of Ripple on Noisy Gears. In American Gear Manufacturers Association Fall Technical Meeting; American Gear Manufacturers Association (AGMA): Dearborn, MI, USA, 2012. [Google Scholar]
  13. Kohn, B.; Utakapan, T.; Fromberger, M.; Otto, M.; Stahl, K. Flank modifications for optimal excitation behaviour. Forsch. Ingenieurwesen 2017, 81, 65–71. [Google Scholar] [CrossRef]
  14. Kohn, B. Topologische Flankenkorrektur zur Anregungsoptimierung von Stirnradgetrieben: Entwicklung und Überprüfung von Auslegungsmethoden zur Ableitung Anregungsoptimierter Flankenkorrekturen von Stirnradgetrieben unter Berücksichtigung der Fertigbarkeit und Flankentragfähigkeit. Ph.D. Thesis, Technical University of Munich, Munich, Germany, 2019. [Google Scholar]
  15. Reishauer AG. Gear Grinding Machines—RZ 260; Reishauer AG: Wallisellen, Switzerland, 2018. [Google Scholar]
  16. Reishauer AG. Threaded Grinding Wheels—Reishauer Threaded Wheels; Reishauer AG: Wallisellen, Switzerland, 2018. [Google Scholar]
  17. Klingelnberg GmbH Präzisionsmesszentren P26|P40; Klingelnberg GmbH: Hückeswagen, Germany, 2020.
  18. Jenoptik Industrial Metrology Germany GmbH Waveline Rauheits- und Konturenmesstechnik; Jenoptik Industrial Metrology Germany GmbH: Schwenningen, Germany, 2015.
  19. ISO International Organization for Standardization. Geometrical Product Specifications (GPS)—Surface Texture: Profile Method—Metrological Characteristics of Phase Correct Filters; ISO 11562; ISO International Organization for Standardization: Geneva, Switzerland, 1996. [Google Scholar]
  20. Müller, R. Schwingungs- und Geräuschanregung bei Stirnradgetrieben. Ph.D. Thesis, Technical University of Munich, Munich, Germany, 1991. [Google Scholar]
  21. Gwinner, P. Schwingungsarme Achsgetriebe Elektromechanischer Antriebsstränge. Ph.D. Thesis, Technical University of Munich, Munich, Germany, 2017. [Google Scholar]
  22. MT-8/A Instruction Manual. Available online: https://www.magtrol.com/wp-content/uploads/mt8manual.pdf (accessed on 29 July 2021).
  23. Heider, M.; Ingeli, J. FVA-Forschungsvorhaben 487 III: Neue Kennwerte zur rechnerischen Beurteilung des Anregungsverhaltens von Verzahnungen. In FVA-Heft 983; Forschungsvereinigung Antriebstechnik e.V.: Frankfurt, Germany, 2011. [Google Scholar]
  24. Utakapan, T.; Ingeli, J. FVA-Forschungsvorhaben 487 IV: Neue Kennwerte zur rechnerischen Beurteilung des Anregungsverhaltens von Verzahnungen. In FVA-Heft 1101; Forschungsvereinigung Antriebstechnik e.V.: Frankfurt, Germany, 2014. [Google Scholar]
  25. DIN Deutsches Institut für Normung e.V. Oberflächenrauheit von Zahnflanken: Rauheitskenngrößen, Oberflächenklassen; DIN 3969-1; Beuth Verlag GmbH: Berlin, Germany, 1991. [Google Scholar]
  26. Radzevich, S.P.; Dudley, D.W. Dudley’s Handbook of Practical Gear Design and Manufacture, 2nd ed.; CRC Press: Boca Raton, FL, USA, 2012. [Google Scholar]
  27. Weck, M. Moderne Leistungsgetriebe: Verzahnungsauslegung und Betriebsverhalten; Springer: Berlin/Heidelberg, Germany, 1992. [Google Scholar]
  28. Opitz, H.; Timmers, J.; Bosch, M.; Rademacher, J. Möglichkeiten zur Verbesserung des Geräuschverhaltens von Zahnradgetrieben. In Forschungsberichte des Landes Nordrhein-Westfalen; VS Verlag für Sozialwissenschaften: Wiesbaden, Germany, 1967. [Google Scholar]
Figure 1. Gear pair used in the experiment. (a) Profile of the gear pair in transverse section. (b) Linear tip relief with parabolic transition.
Machines 09 00169 g001
Figure 2. Peak-to-peak transmission error of the gear pair used in the experiment.
Machines 09 00169 g002
Figure 3. Procedure to obtain the deviations used in this study out of the measured flank and the desired geometry. (a) The desired geometry is deduced from the measured profile line in order to obtain the resulting deviations (resulting deviations at two diamters see Δ 1 and Δ 2 ). (b) In order to compare the results with the other flanks, the resulting deviations are shifted by the median of the deviations in a single flank Δ ˜ .
Machines 09 00169 g003
Figure 4. Distance and depth analysis of the largest regular deviations using a wavy compensation curve (the diagram shows DskiPiLZ at tooth nr. 10).
Machines 09 00169 g004
Figure 5. Visualization methods used to show the deviations from the measurement. (a) Result of the measurement of a single tooth (DskiWhR at tooth nr. 1). (b) Median of the measurement of all teeth of a gear (DskiWhR). (c) Box plot of the deviations for all teeth of a gear.
Machines 09 00169 g005
Figure 6. FZG dynamic test rig: 1-test gearbox, 2-pinion shaft, 3-drive gearbox, 4-wheel shaft, 5-loading clutch. (a) CAD view. (b) Principle sketch.
Machines 09 00169 g006
Figure 7. Measurement disc and sensor position for torsional acceleration measurement: 1–2-radial sensors, 3-tangential sensor according to [9].
Machines 09 00169 g007
Figure 8. Exemplary Campbell-diagram with leveled amplitudes, that shows the torsional acceleration measurement of polish ground gears at 800 N m . The relevant operating range for the application force level is marked with red lines.
Machines 09 00169 g008
Figure 9. Overview of the active flanks of the gears in the test runs.
Machines 09 00169 g009
Figure 10. Deviations for continuous generating grinding. (a) Flank of gear AgenPiL at tooth nr. 34. (b) Median of all teeth of gear AgenPiL. (c) Box plot of the deviations in the gear pairs.
Machines 09 00169 g010
Figure 11. Deviations for polish grinding. (a) Flank of gear BpolPiL at tooth nr. 17. (b) Median of all teeth of gear BpolPiL. (c) Box plot of the deviations in the gear pairs.
Machines 09 00169 g011
Figure 12. Deviations for gear skiving. (a) Flank of gear AskiPiR at tooth nr. 11. (b) Median of all teeth of gear AskiPiR. (c) Box plot of the deviations in the gear pairs.
Machines 09 00169 g012
Figure 13. Deviations for gear skiving with half of the axial feed. (a) Flank of gear DskiPiL at tooth nr. 10. (b) Median of all teeth of gear DskiPiL. (c) Box plot of the deviations in the gear pairs.
Machines 09 00169 g013
Figure 14. Location of the profile and lead line measurement at the gear flank.
Machines 09 00169 g014
Figure 15. Profile lines of chosen teeth of all tested pinions.
Machines 09 00169 g015
Figure 16. Profile lines of chosen teeth of all tested wheels.
Machines 09 00169 g016
Figure 17. Lead lines of chosen teeth of all tested pinions.
Machines 09 00169 g017
Figure 18. Lead lines of chosen teeth of all tested wheels.
Machines 09 00169 g018
Figure 19. Application force level from torsional acceleration measurement of the different manufacturing processes. (a) Continuous generating grinding. (b) Polish grinding. (c) Gear skiving. (d) Gear skiving with half axial feed.
Machines 09 00169 g019
Figure 20. Overview of specific values of the deviations shown in the box plots of all tested gears.
Machines 09 00169 g020
Figure 21. TCompensation curves of the application force level L A , F .
Machines 09 00169 g021
Table 1. Main parameters of the gear pair used in the experiment.
Description UnitPinionWheel
Normal pressure angle α n ° 20.00
Helix angle β ° 21.00
Number of teethz 4345
Centre distancea m m 140.00
Normal module m n m m 3.00
Profile shift coefficientx 0.211 0.237
Face widthb m m 27.50 27.50
Transverse contact ratio ϵ α 1.50
Overlap ratio ϵ β 1.05
Total contact ratio ϵ γ 2.55
Tip diameter d a m m 142.30 148.50
Start of active profile diameter d Nf m m 132.74 138.99
Table 2. Parameters of the linear tip relief with parabolic transition.
Tip ReliefValue RoundingValue
Amount C α a 20.5 μ m Start L Ca A 23% · g α
Roll length L Ca 3.961 m m (28% · g α ) End L Ca B 30% · g α
Table 3. Overview of the manufactured test gear pairs.
Continuous
Generating Grinding
Polish GrindingGear SkivingGear Skiving
Half Axial Feed
PinionWheelPinionWheelPinionWheelPinionWheel
AgenPiAgenWhApolPiApolWhAskiPiAskiWhDskiPiDskiWh
BgenPiBgenWhBpolPiBpolWhBskiPiBskiWh
CgenPiCgenWhCpolPiCpolWhCskiPiCskiWh
Table 4. Operating conditions used in the test runs.
Load StagesLoad T 1 in N mRevolutions Ramp-Up
1200 n 1 = 450 … 5050 min−1
( d n / d t = const , duration: 90 s )
via main drive
2400
3600
4800
51000
61200
Table 5. Evaluation limits for the application force level L A , F .
ParameterSymbolMinimumMaximum
Speed n min , max 1000 min−14800 min−1
Frequency f min , max 0 Hz 10,000 Hz
Order ord min , max 0.8 · ord n 1 4.2 · ord n 1
Table 6. Comparison of the flank roughness of the different manufacturing methods.
Manufacturing MethodGear Ra
Continuous generating grindingAgenWhL 0.285 μ m
Polish grindingCpolWhL 0.042 μ m
Gear skivingAskiWhL 0.141 μ m
Gear skiving half axial feedDskiWhL 0.136 μ m
Publisher’s Note: MDPI stays neutral with regard to jurisdictional claims in published maps and institutional affiliations.

