1. Introduction
In the present industrial era, early fault detections and correct fault severity level identifications of machines and their components are very important for their uninterrupted availability and to avoid any catastrophic failure. Timely prediction of the defects in machines facilitates in performing timely maintenance of degraded or damaged component. Therefore, performing effective condition monitoring of mechanical systems reduces both the time and the cost of maintenance [
1]. Gears are a vital component of most of the mechanical systems. A defective gear may cause serious problem in the machine’s operation and catastrophic failure in the case of damage. Therefore, early gearbox fault detections and the correct severity level identifications or diagnoses are very much important for the availability and smooth operation of machinery. Different techniques have been introduced by the researchers for accurate fault detection and diagnosis of gears, however, the technique of fault diagnosis by monitoring the vibrational signal is most widely used [
2,
3]. Vibration signal analyses in time domain, frequency domain and time-frequency domain have been extensively used by the researchers for gearbox faults diagnosis [
4]. Effective condition monitoring or fault diagnosis is an experts-oriented task and human intervention is mostly not very effective nor efficient in terms of timely response to a huge volume of data. Therefore, intelligent condition monitoring techniques are required to be implemented in order to minimize human dependency. During the last two decades, many new approaches related to Artificial Intelligence (AI) techniques have been proposed by the researchers, such as condition monitoring of gearboxes using ANN [
5]; integration of wavelet transform and principal component analysis for intelligent fault diagnosis of rotating machinery [
6]; gearbox fault diagnosis using multimodal deep support vector classification (MDSVC) approach [
7]; gearbox fault diagnosis by multi-layer NN scheme [
8]; gearbox defect identification by convolutional neural network (CNN) [
9]; gearbox defect diagnosis by a deep random forest fusion technique [
10]; intelligent fault diagnostics of roller element bearings and gears using KNN in combination with Genetic Algorithm (GA) [
11].
Spiral bevel gears are a very important type of the gear family and are known for their smooth operation and strong capacity. They have helical teeth oriented at a 90 degree angle, and the teeth are slightly curved in order to provide improved traction, flexibility and no-slip characteristics. Therefore, spiral bevel gears are ideal for high speed and high torque applications such as the aviation industry, cement mills, cone crushers and sand mixtures, railways and mining industry.
The vibration signal of spiral bevel gears is extremely complex because of varying meshing point, changing number of meshing gear pairs, collision between the teeth during meshing and non-linear and non-stationery behavior. Particularly, in the case of defect in the spiral bevel gears, strong noise interferes with the vibration signal and identifying the fault characteristic information becomes difficult because it is submerged in the noise [
12,
13,
14]. Spiral bevel gears have a high contact ratio, which makes the diagnosis of even serious defects very difficult. Therefore, spiral-bevel gears have rarely been used as benchmarking for defect diagnosis techniques. Compared with the planetary gear system and parallel shaft gear system, only a few research studies exist on the fault diagnosis of spiral-bevel gear systems [
15,
16]. Ricci and Pennacchi introduced a methodology for spiral bevel gears defect diagnosis based on empirical mode decomposition (EMD) and automatic selection of intrinsic mode functions [
17]. Jiang et al. performed the fault diagnosis of spiral bevel gears based on complete ensemble empirical mode decomposition with adaptive noise (CEEMDAN) permutation entropy [
12,
18]. Furthermore, few researchers have focused on defect diagnosis using the features extracted based on wavelet decomposition and adaptive multiwavelet-based method [
19,
20,
21]. Fu et al. carried out a study on the fault detection of spiral bevel gears using a combination of ANN and wavelet transform [
22].
The use of AI techniques in fault detection and diagnosis has several advantages when compared to traditional methods, such as reducing the human intervention and thus relieving the experts from tedious jobs. However, there are many things that must be learned and improved for these methods in order to render them effective and practical in dealing with more complicated fault detection and diagnosis problems in real-world applications [
23]. These methods mostly use an assumption that training and testing data are from the same operating conditions. Nevertheless, when the operating conditions under which the trained model is applied differs from the operating conditions under which the model was trained, then the performance of these approaches may drop significantly. Outside the laboratory, mostly different operating conditions are encountered in real-world applications, and it may be exorbitant to obtain data for all potential operating conditions. Therefore, it is not possible to train the deep learning or machine learning models using data from all possible operating conditions.
In this instance, there is a need to devise such a method by which the performance of AI classifiers in terms of cross-domain fault detection can be improved. Furthermore, in this field, the most popular method remains to be the artificial neural network (ANN) which consists of more than 50 percent of research due to its ability to perform classification and prediction while working with uncertainties, weak data and complicated problems [
24,
25,
26]. Therefore, there is a need of performance comparison between different AI techniques.
The aim of this research study is to overcome the limitation of difficulty in fault detection and fault severity level assessment of spiral bevel gears and to improve the performance of two AI classifiers (ANN and KNN) for defect diagnosis of spiral bevel gears when applied under different operating conditions than compared to those in which the models were trained. An effort has been made to find a few fault discriminating features extracted from time domain vibration data, which are less sensitive to working conditions but are fault discriminative. Vibration data in 23 different operating conditions (speed and load) were collected from a spiral-bevel gears test rig. Statistical features are extracted from the time-domain vibration signal. Features’ analysis is performed to find their sensitivity and robustness towards the operating conditions. Features with least sensitivity to operating conditions are selected as robust features. Selected features from one operating condition are used to train ANN and KNN as diagnostic classifiers. After training, predictions are made using trained diagnostic classifiers on testing data from a combination of different operating conditions (speed and load). Furthermore, these research performances of ANN are compared with KNN in terms of their ability to detect faults and their ability to access their severity levels correctly in spiral bevel gears operating under different operating conditions.
2. Methodology
For accurate fault diagnosis of mechanical systems using vibration signals and AI techniques, the correct features’ extraction from vibration signals is of paramount importance. The features extracted from vibration data contain information regarding the machinery’s health state. Different AI models such as ANN and KNN use these features for training, and the same features are used for predictions. Vibration features change with the health condition of the machine; however, they are also sensitive to the operating conditions and may change with the altering operating conditions. Thus, misleading the AI models regarding the health state of equipment if the operating conditions for training and testing of the model are different from each other. Consequently, it has been observed that the performance of AI models for defect diagnosis is affected significantly when the models are deployed for fault detection and diagnosis under the operating conditions, which are different from those under which they were trained. Therefore, in this study, efforts have been made to identify some features that are less sensitive to operating conditions but can categorize the health state of spiral bevel gears in order to improve the fault detection and the diagnosis capability of ANN and KNN models under different operating conditions.
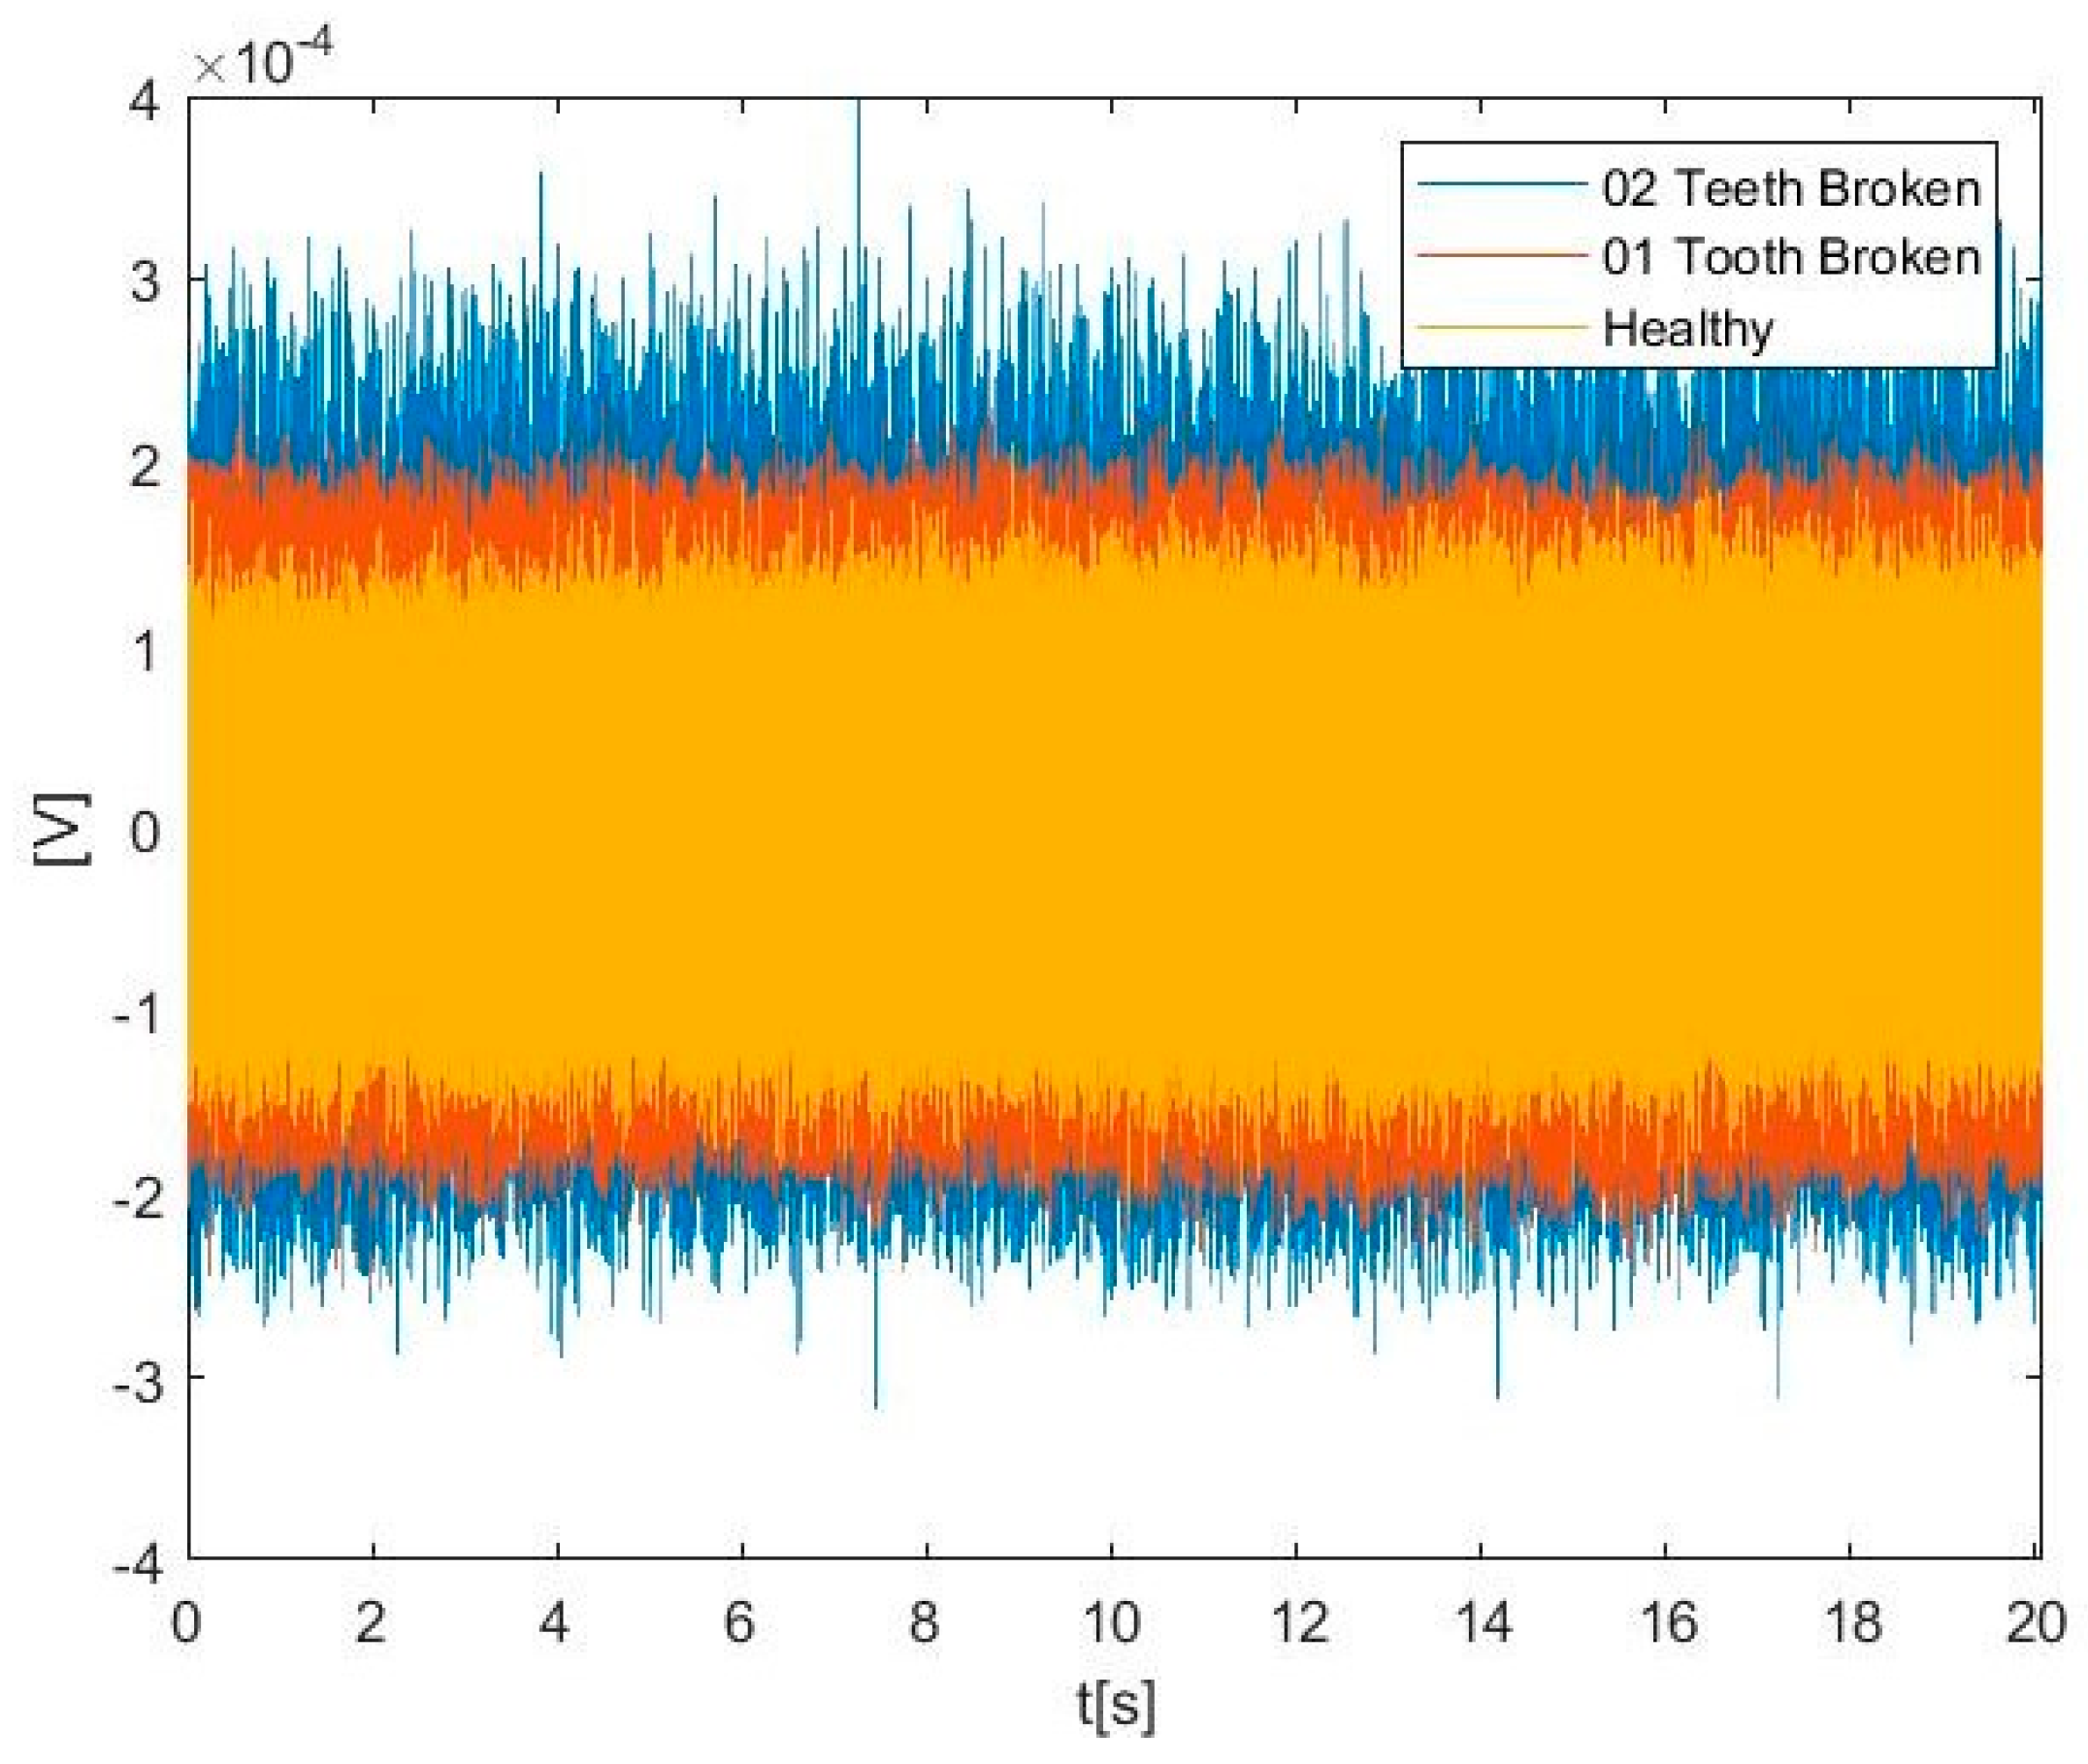
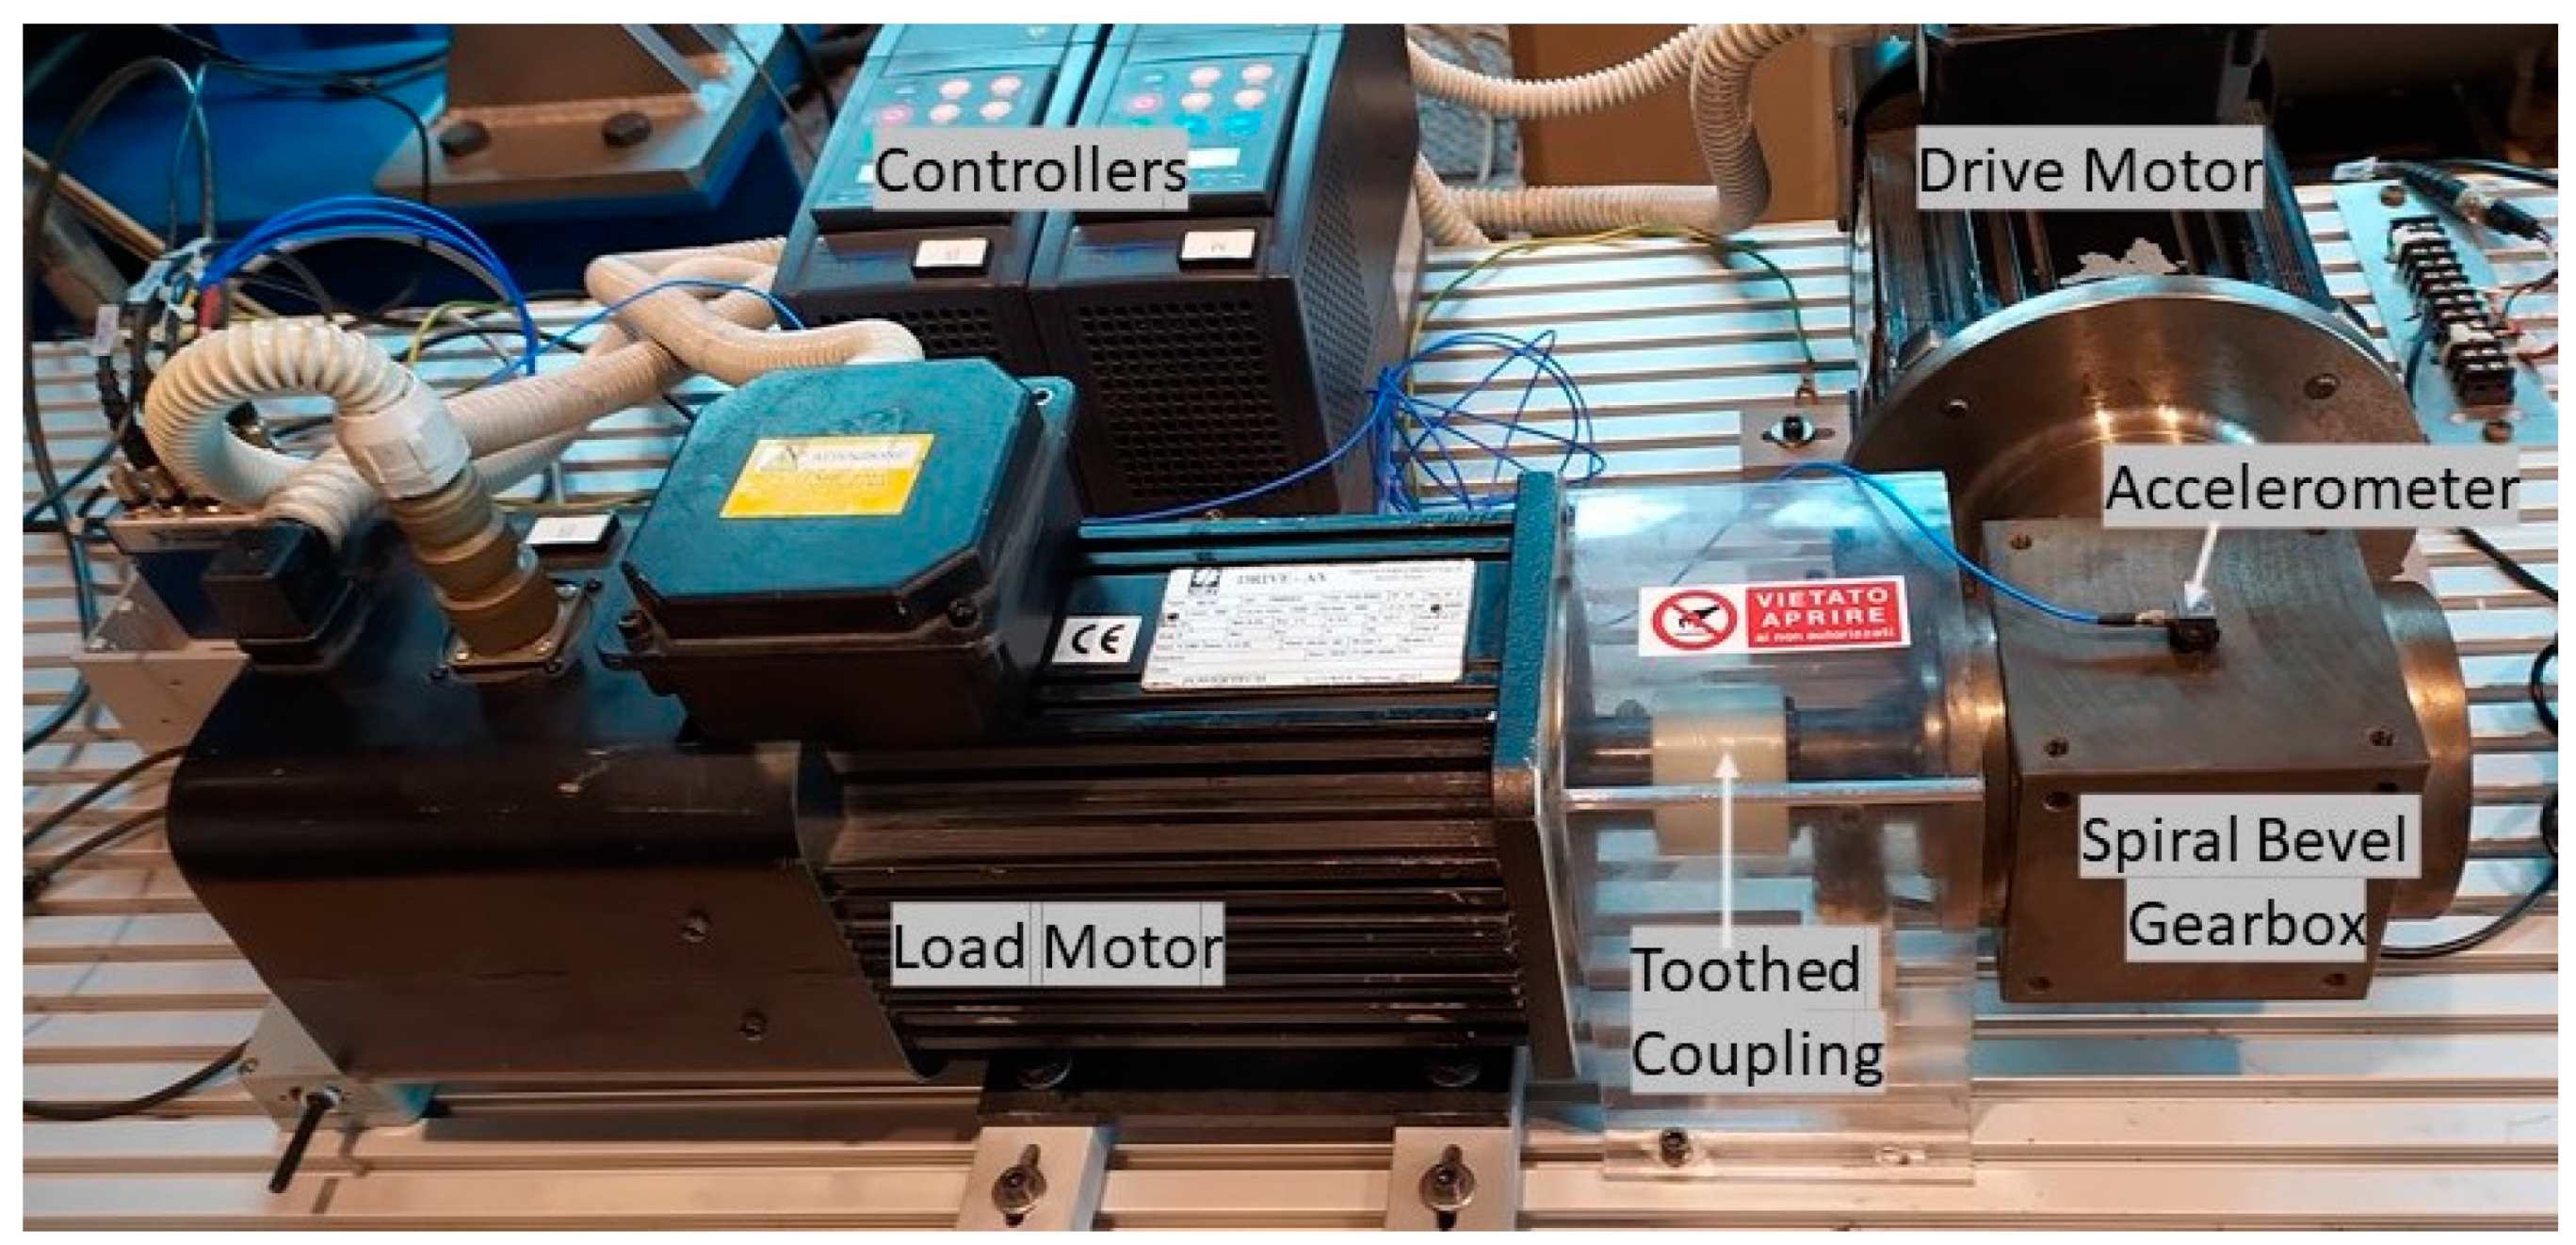
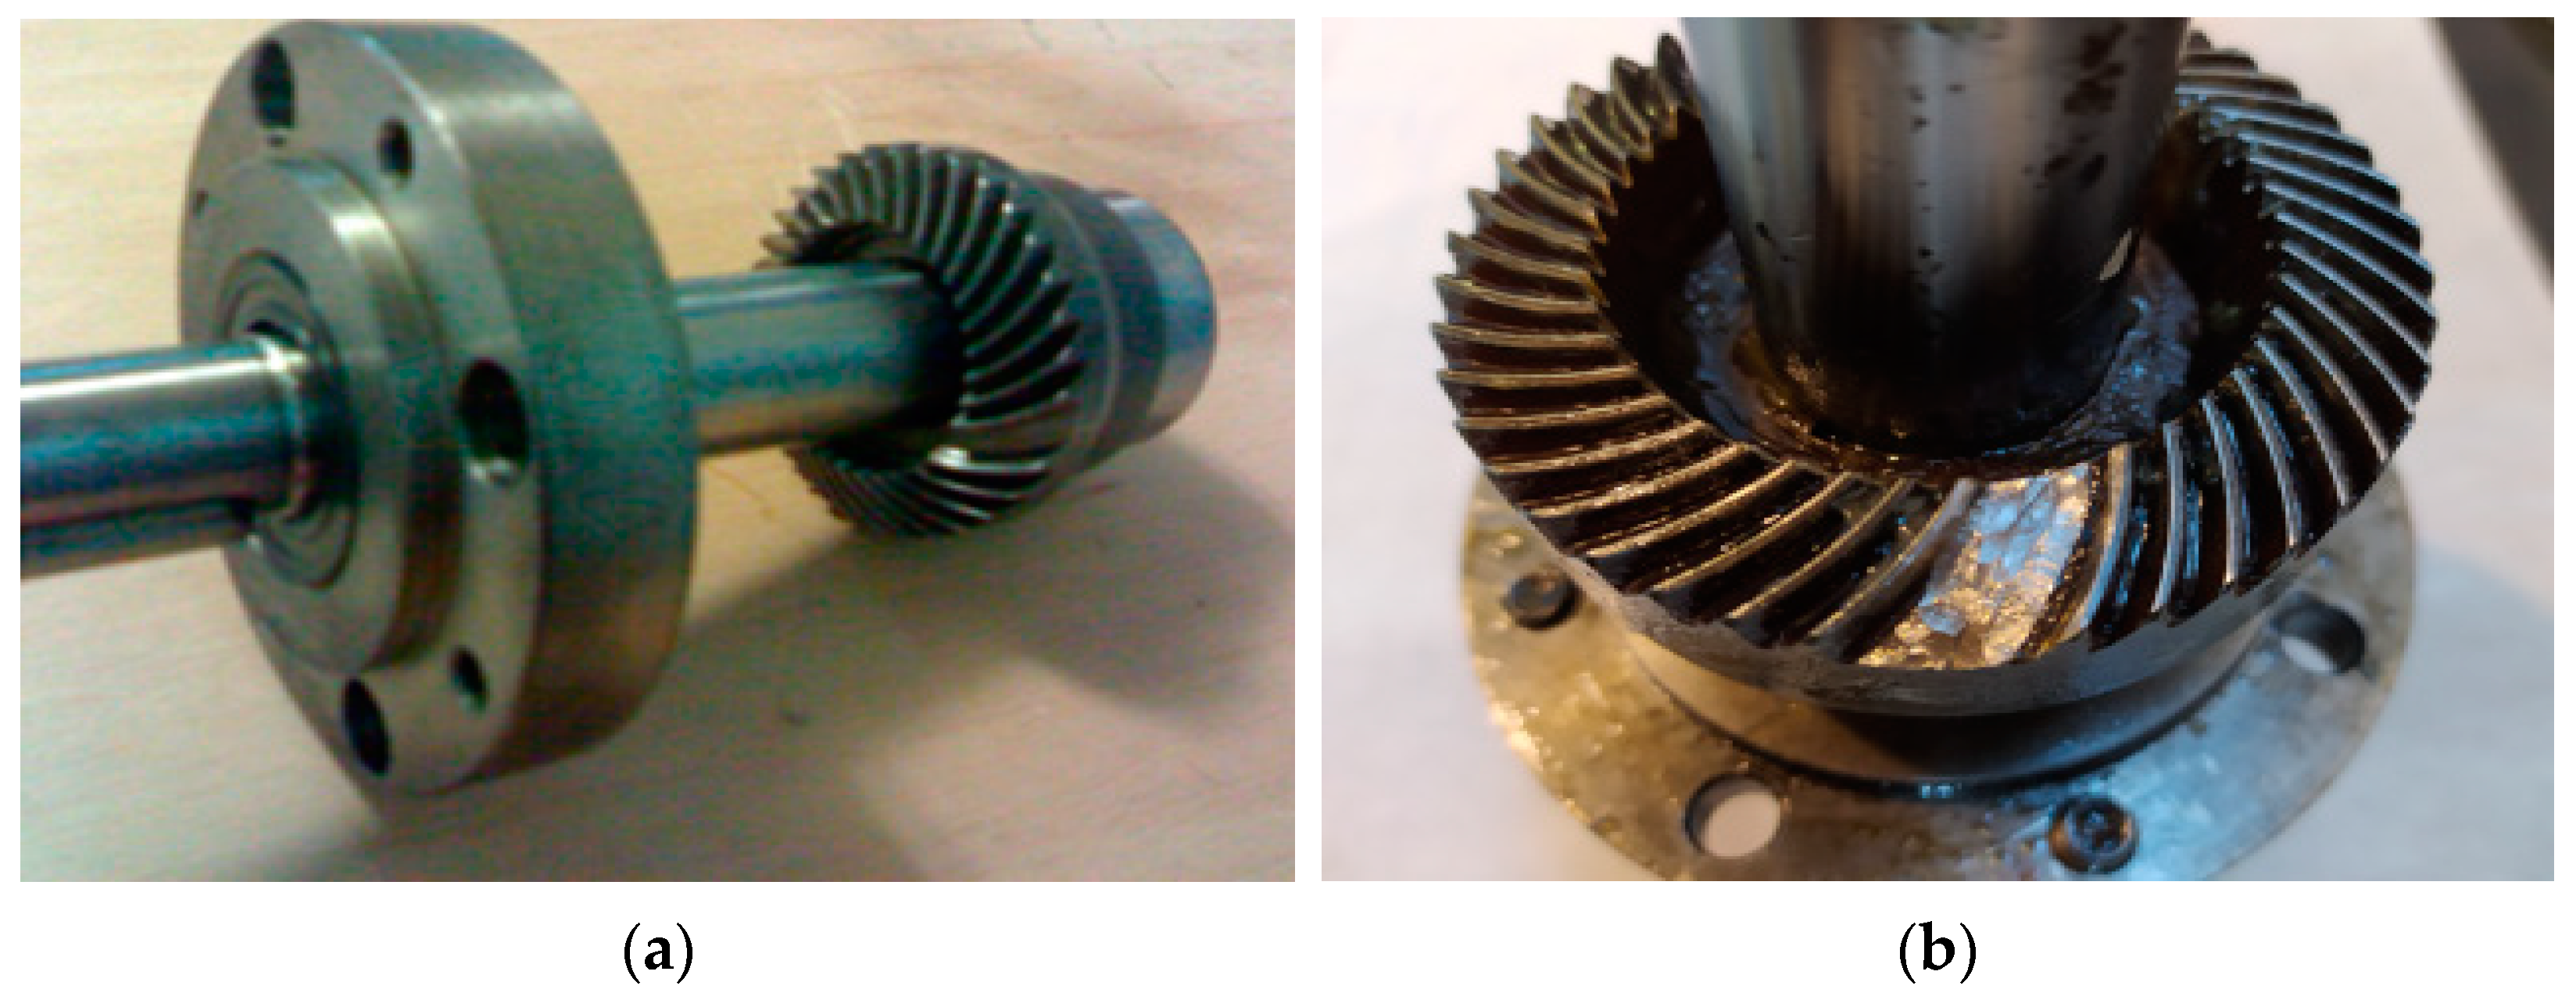
Vibration data for healthy and damaged spiral bevel gearboxes, with one tooth broken and two teeth broken, were acquired from the test rig by an accelerometer placed on the gearbox. Raw vibration signals for all three health conditions at 600 rpm and 3 Nm load torque are shown in
Figure 1.
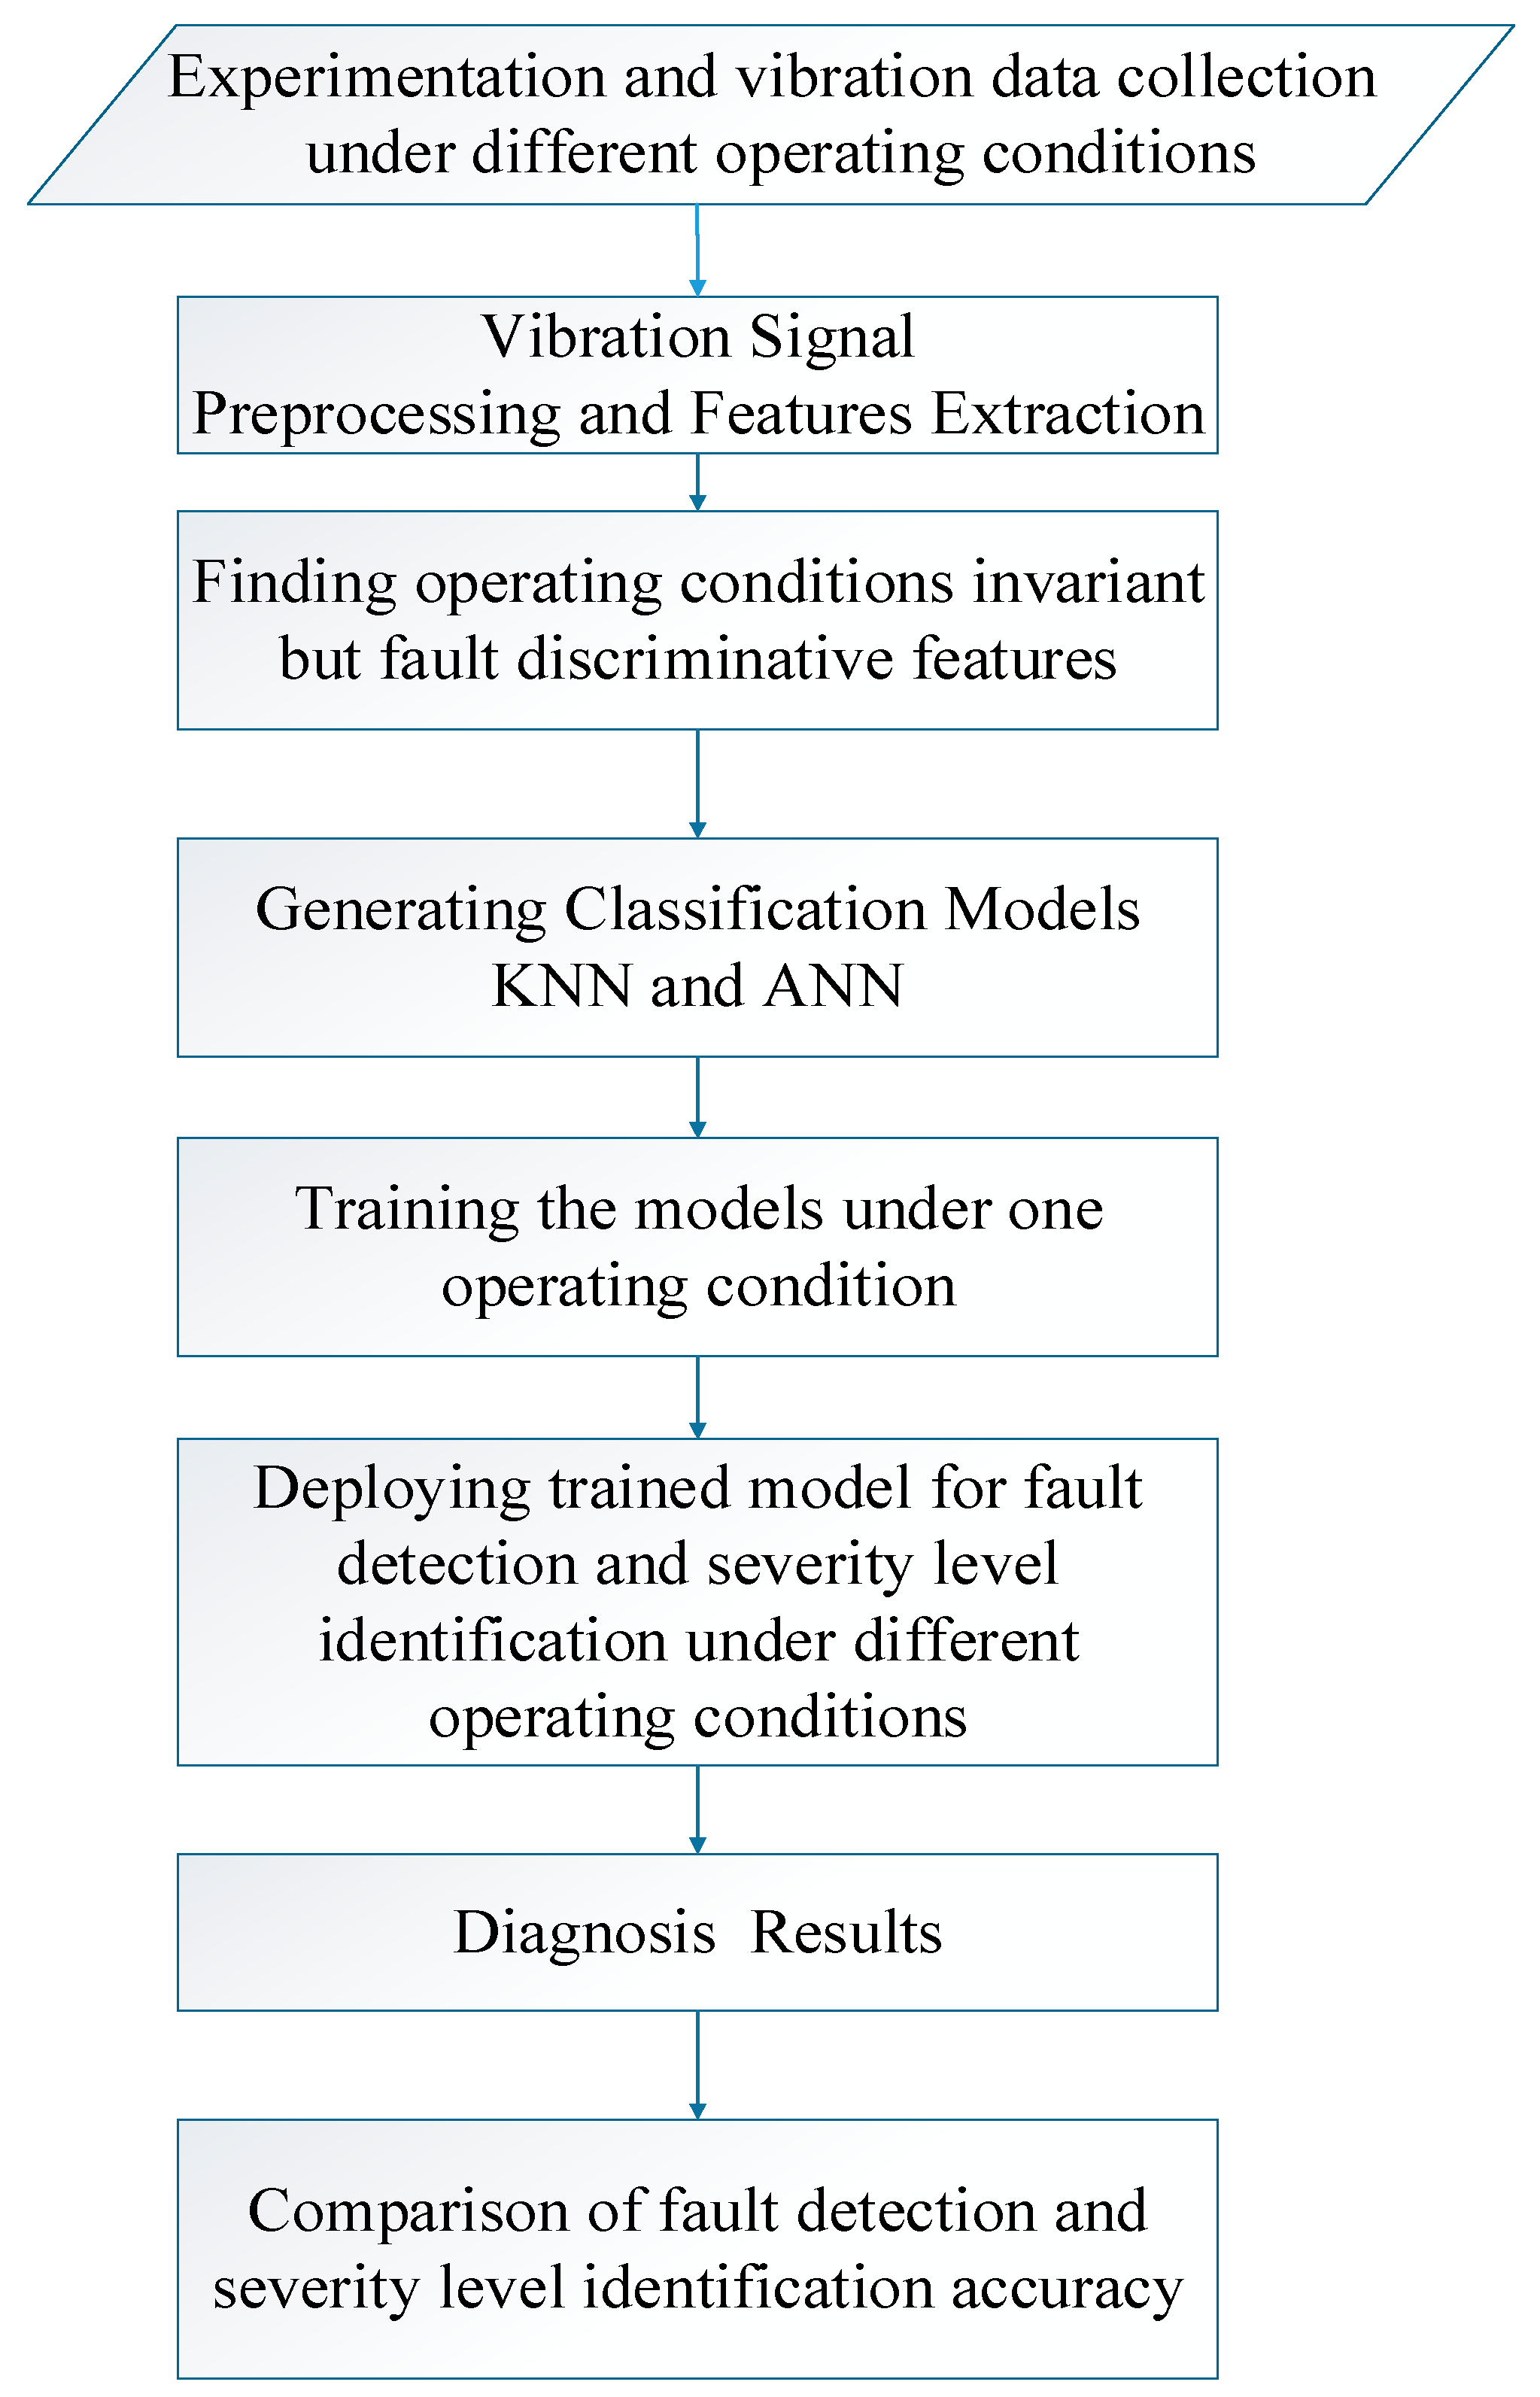
Low pass filter at 10 kHz was applied to the signal, and 12 statistical features, which are mostly used in literature, were subsequently extracted from time domain vibration data. Extracted features were analyzed for their sensitivity towards operating conditions (speed and load). After finding the most robust features, ANN and KNN models were trained and tested under different operating conditions for fault detection and severity identification of spiral bevel gears. The flow chart of the adopted methodology is shown in
Figure 2.
4. Robust Features Selection
The acquired vibration signal after filtering at 10 kHz was divided into 100 segments of equal length. It was ensured for all operating conditions that each segment of the signal represents at least two revolutions of pinion and one revolution of driven gear to guarantee that the extracted features contained enough information regarding the health condition of gearbox. Subsequently, the following 12 features were extracted.
These extracted features are used to train the AI model for fault diagnosis. The features change with changing health conditions; however, they undergo alteration because of the change in operating conditions as well. Consequently, if an AI model is trained at some specific operating conditions using these extracted features and the same trained model is deployed for fault detection and severity assessment under different operating conditions, then the performance may degrade significantly because of the influence of operating conditions on the features. Hence, in this section, the effects of changes in load and speed are analyzed in order to find the robust features that are least affected by a change in operating conditions under study but that are adequately sensitive to health conditions. The response of the extracted features to the operating conditions is studied by plotting them for all 100 segments under different operating conditions and for different health states.
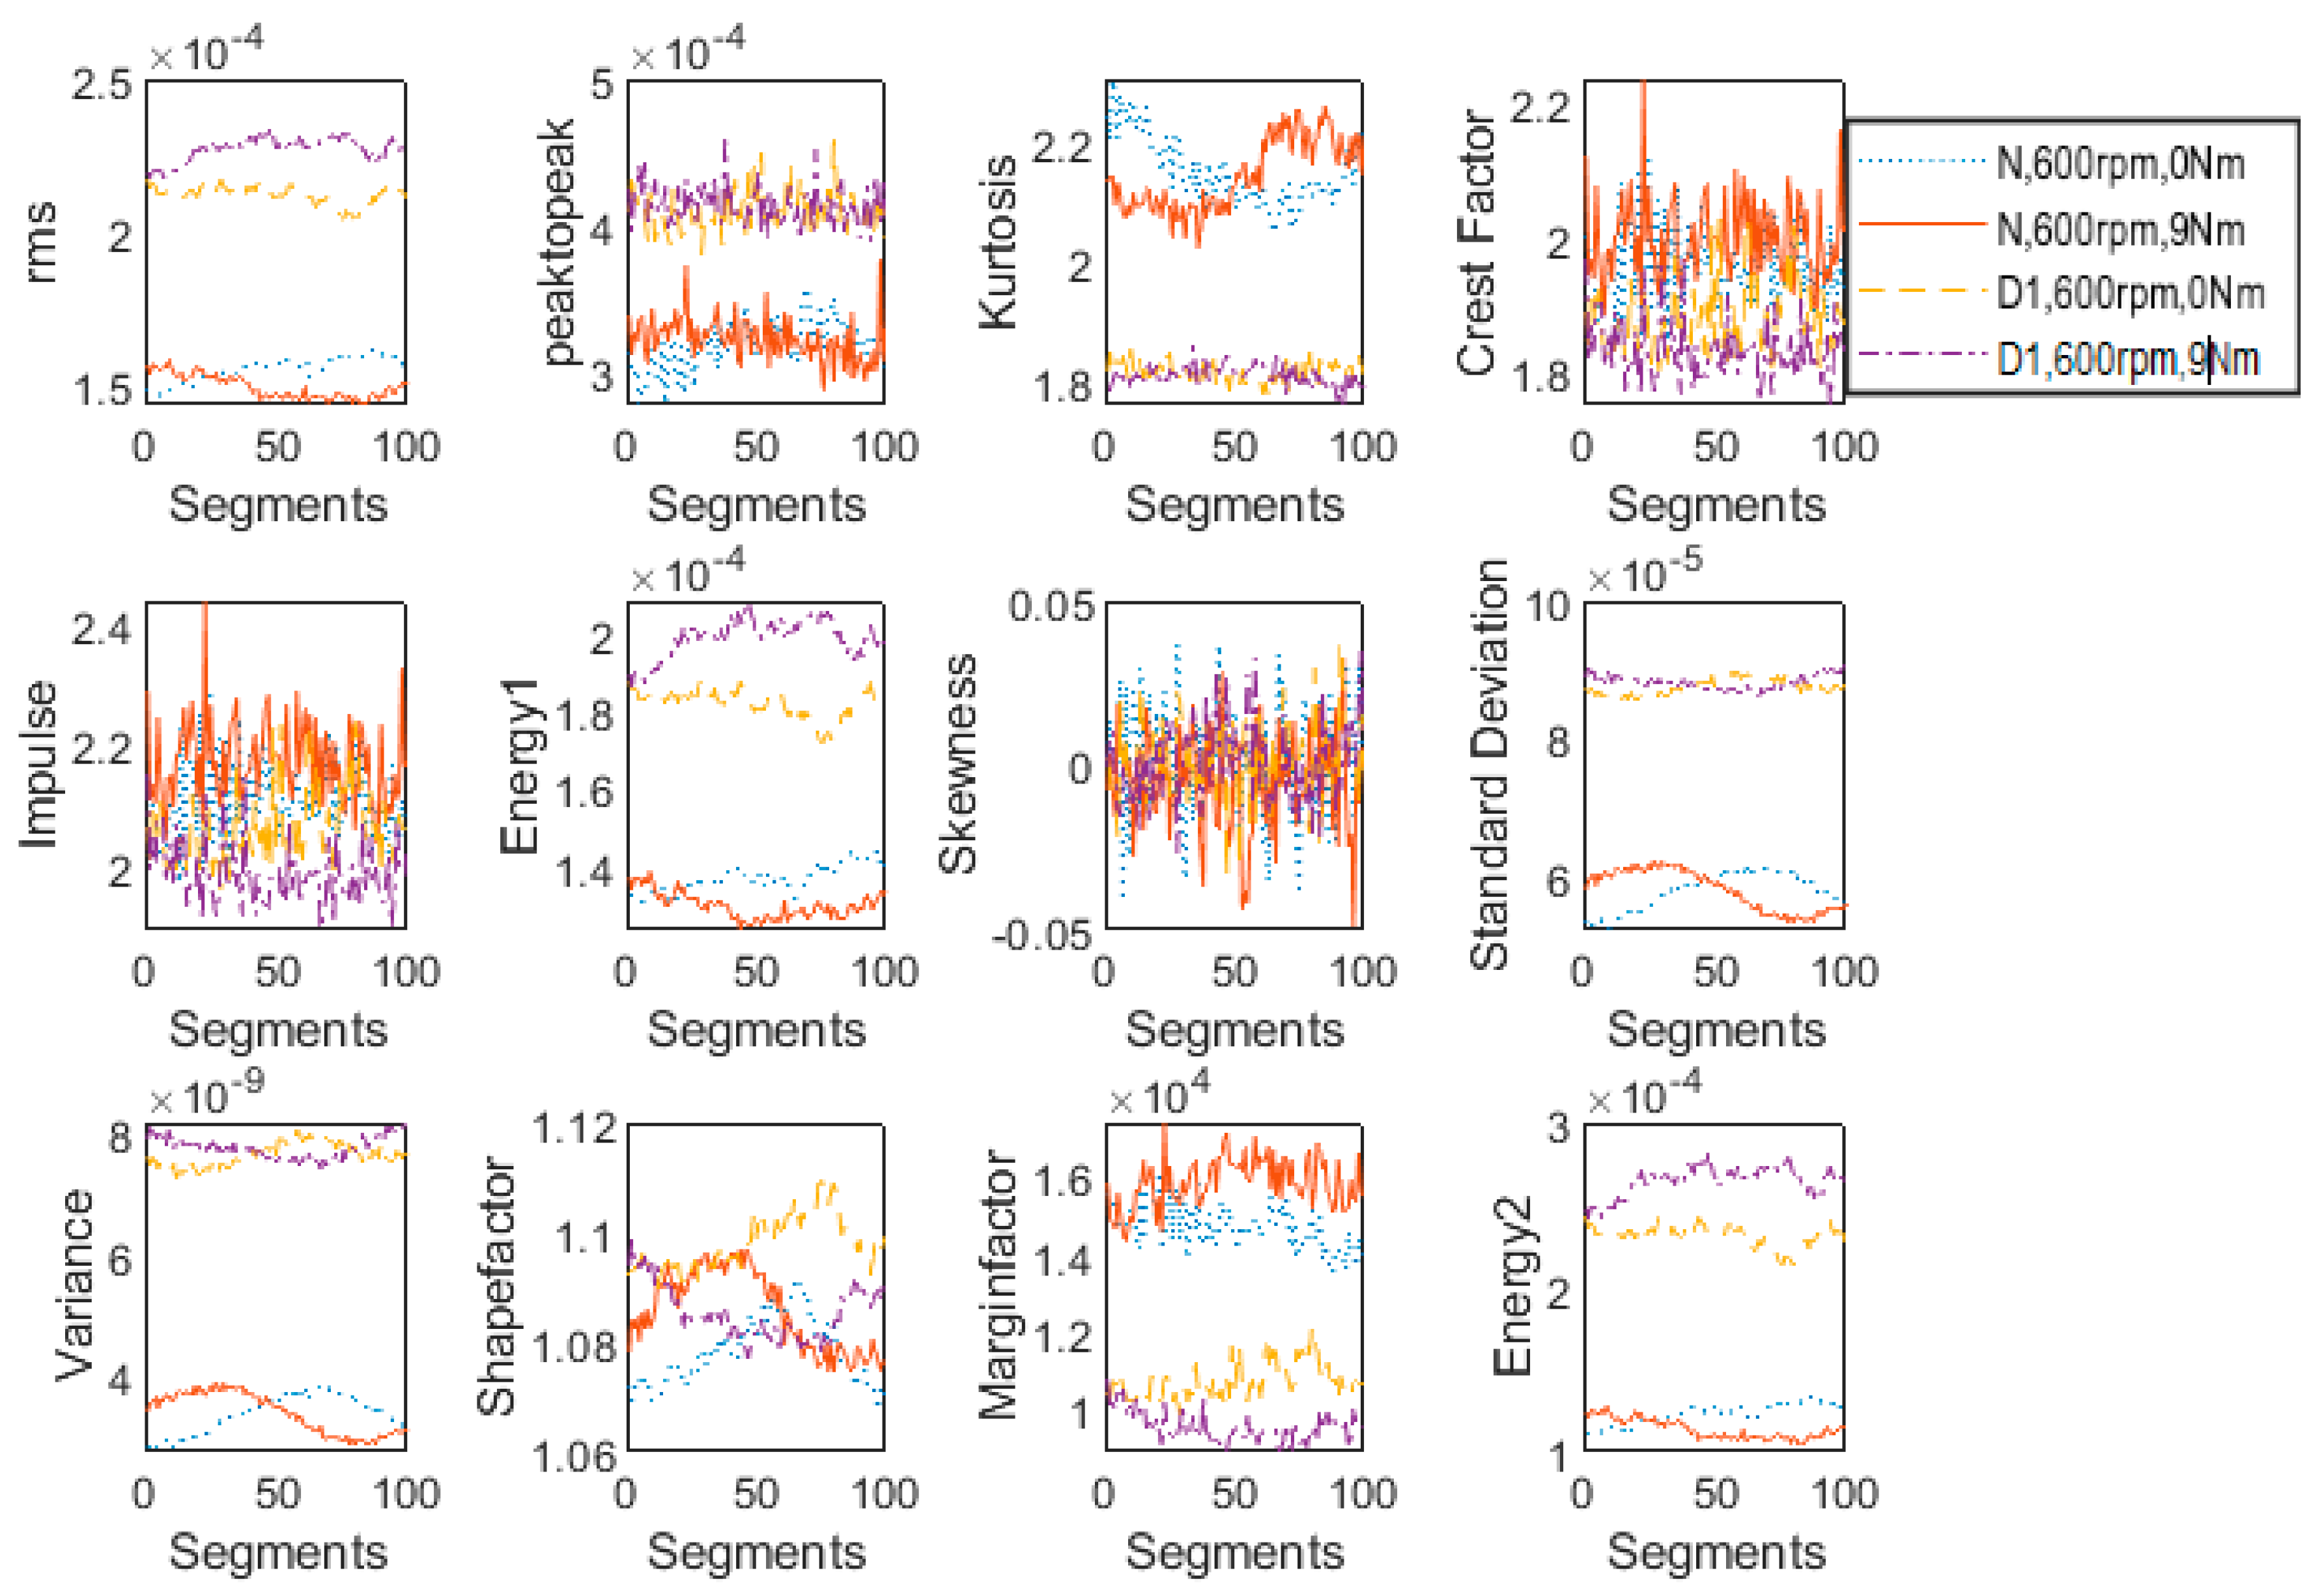
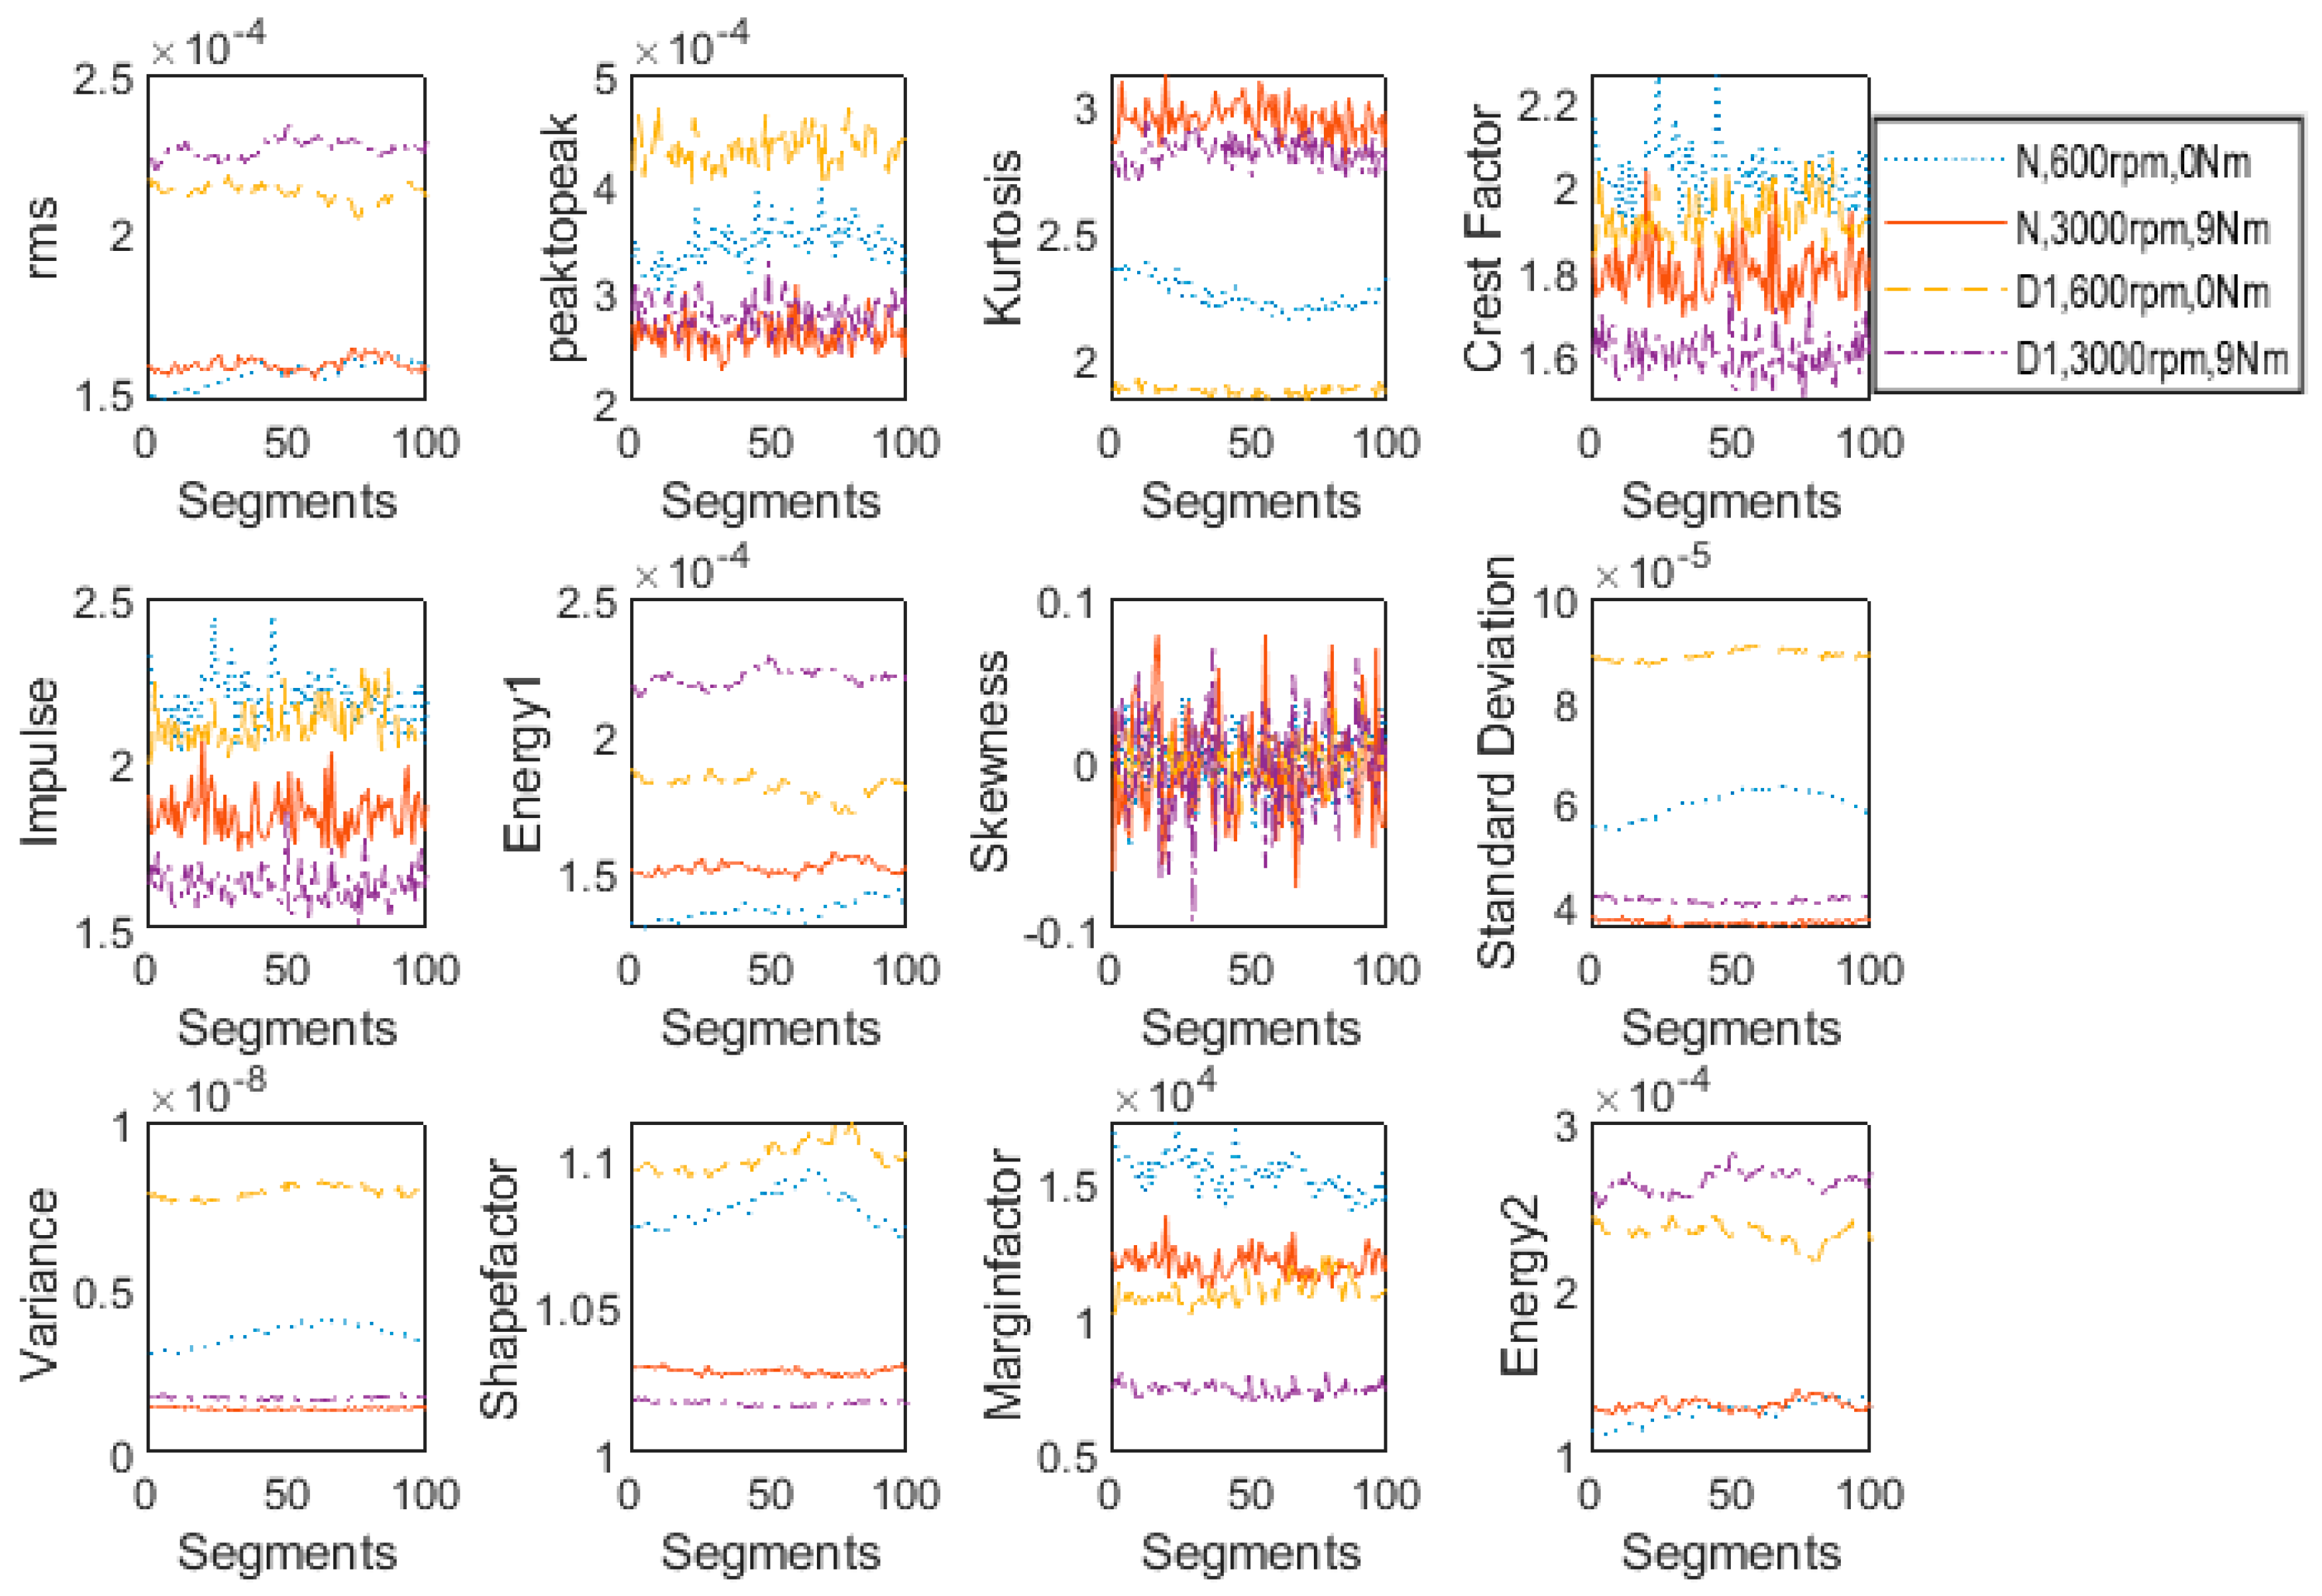
4.1. Features’ Response to Change in Load
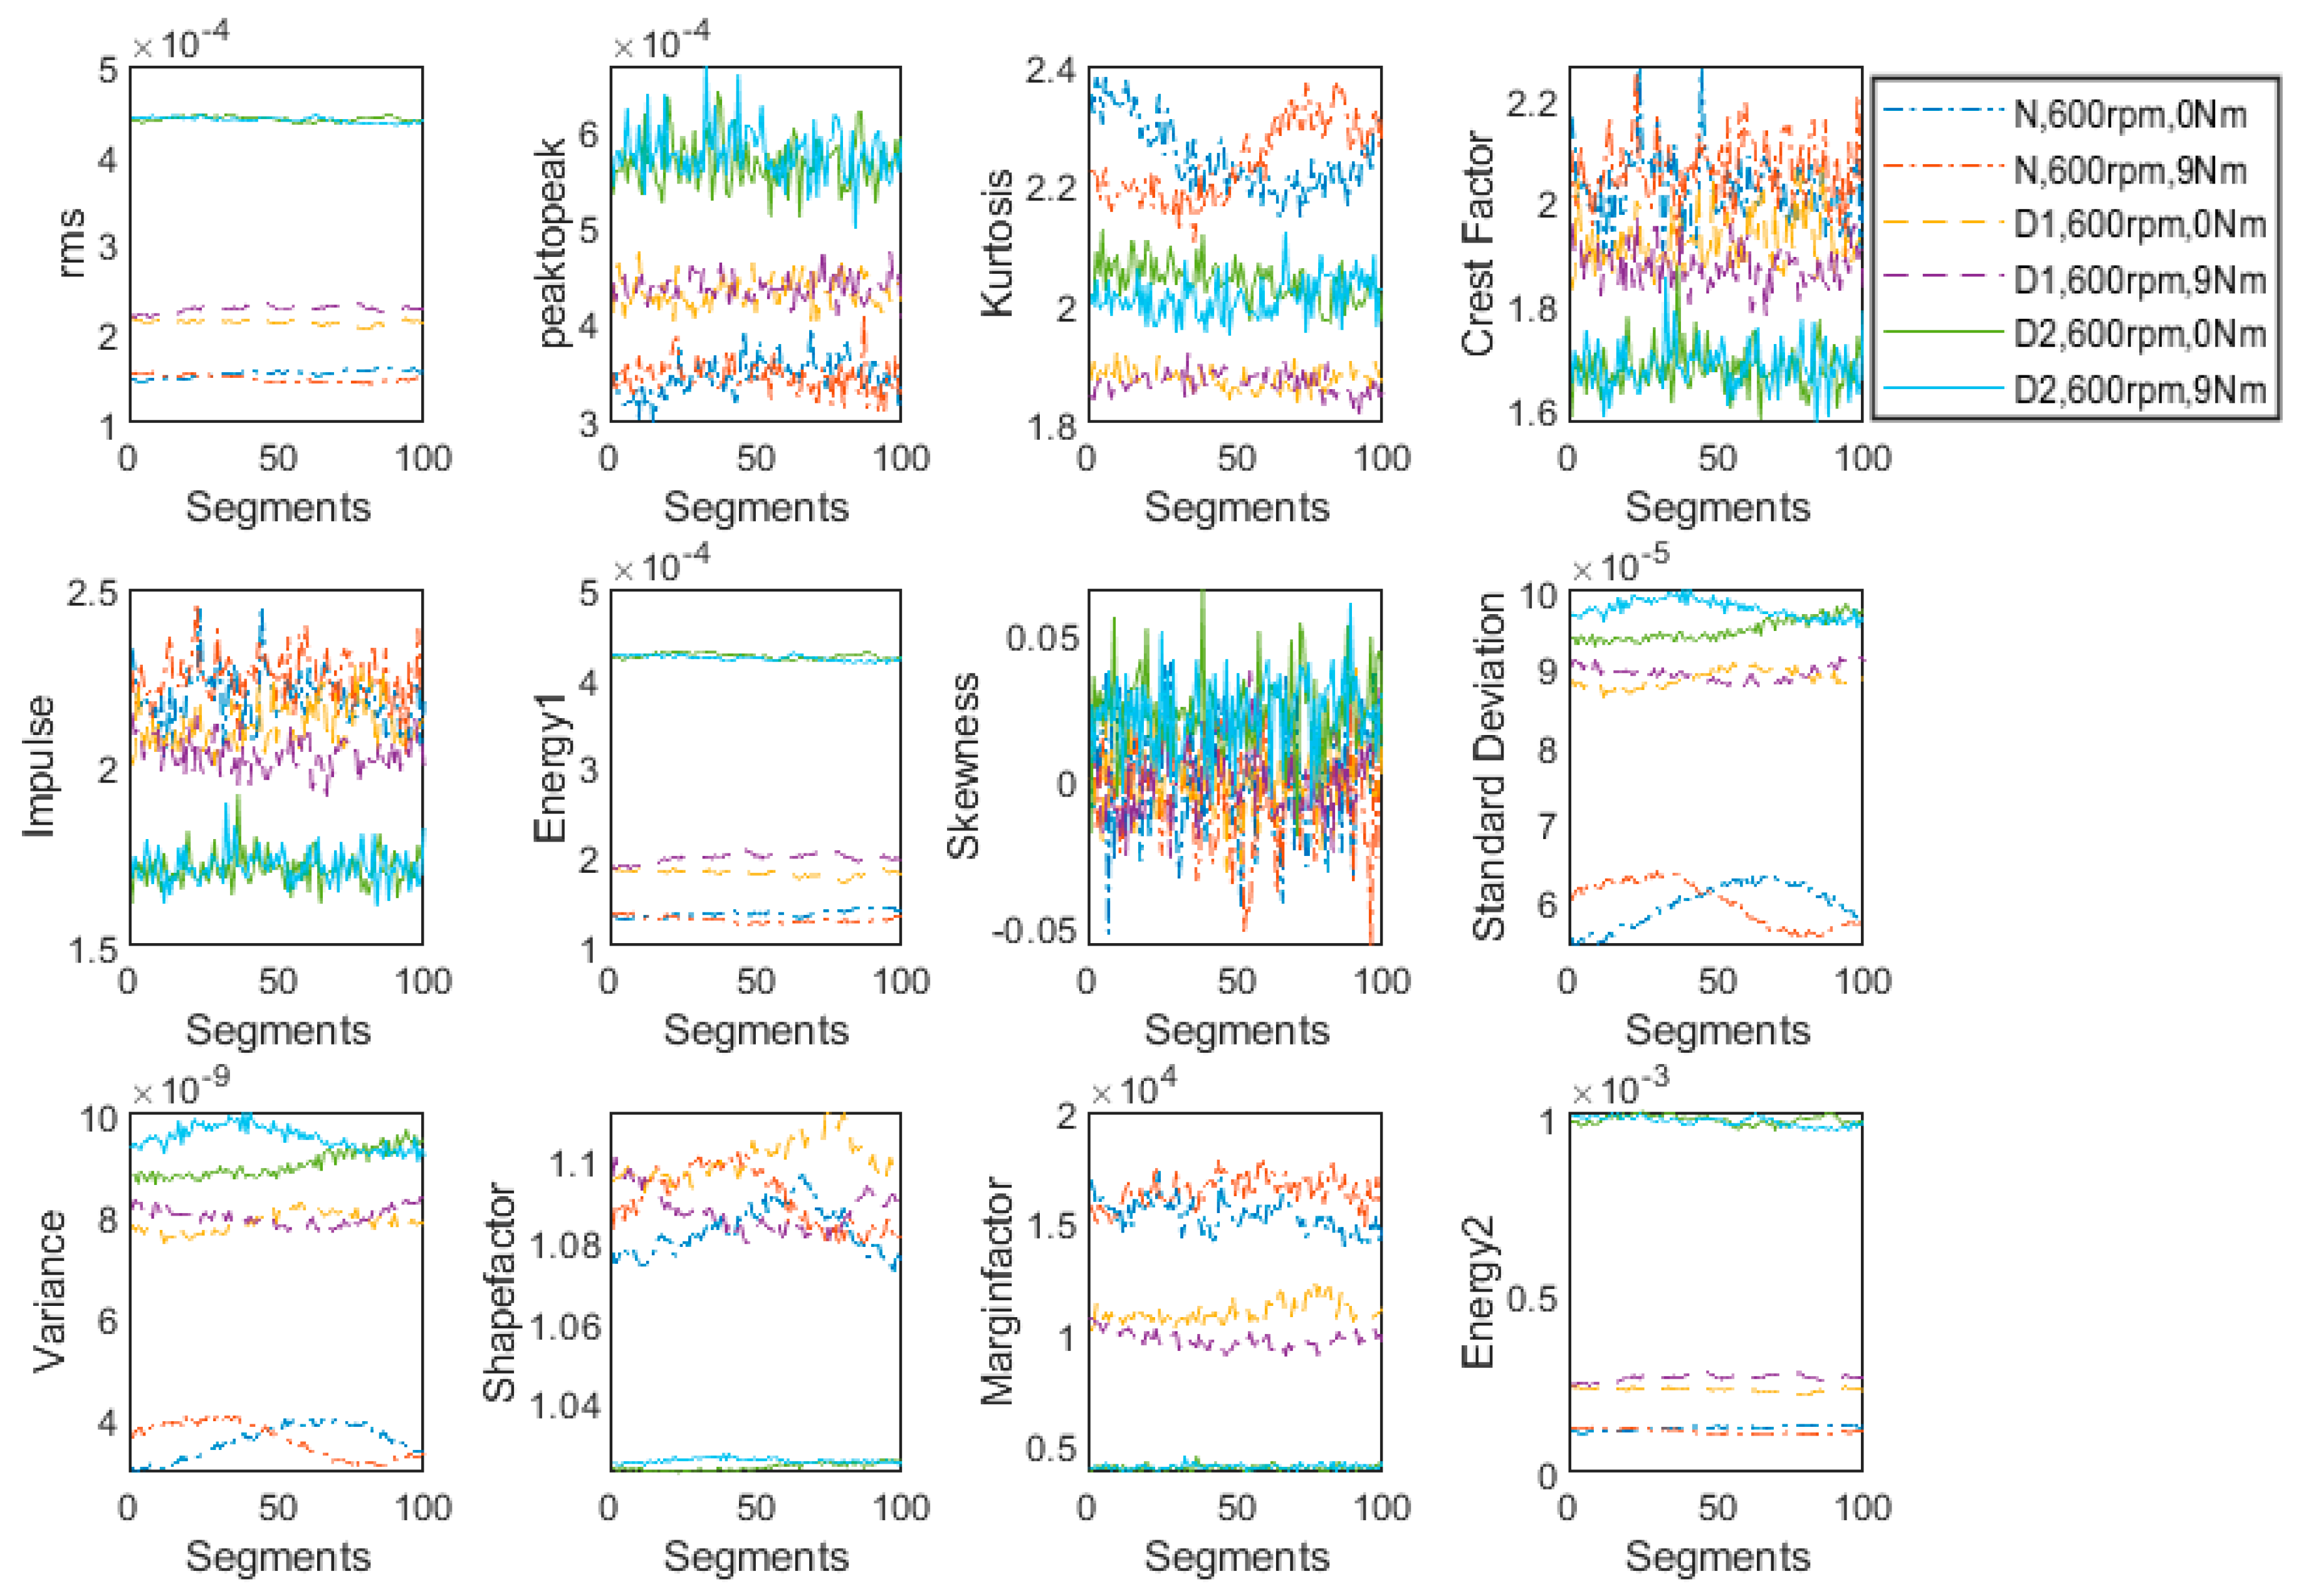
The features extracted from vibration signals of the normal and defected gearbox with one tooth broken at 600 rpm and two loading conditions (No load; 9 Nm Load) are plotted in
Figure 5 in order to analyze their sensitivity for change in load. Under the same operating conditions, the features for all three health conditions under study are plotted in
Figure 6. Although
Figure 6 contains all the information of
Figure 5, the difference between the maximum and minimum values of plotted features is much greater in
Figure 6 where the features of all three gear boxes are plotted together than compared to
Figure 5, where features of only two gearboxes (healthy and defected with one tooth broken) are plotted, rendering it difficult to observe minor changes in the features. Therefore, in order to easily monitor minute variations in features, only the healthy and the defected gearboxes with one tooth broken are plotted in
Figure 5; in order to have an overall comparison, features from all three health states under consideration are plotted in
Figure 6. The same pattern is followed in forthcoming sections.
It is observed that rms, peak to peak, kurtosis, energy-I, standard deviation, variance, margin factor and energy-II are not affected much by changing the load from 0 to 9 Nm. Therefore, these features are suitable for fault detection applications where only load is varying but speed remains constant. However, the remaining features depicted much more sensitivity for load change; therefore, crest factor, impulse, skewness and shape factor are not found to be suitable for fault detection and severity assessment under changing load conditions.
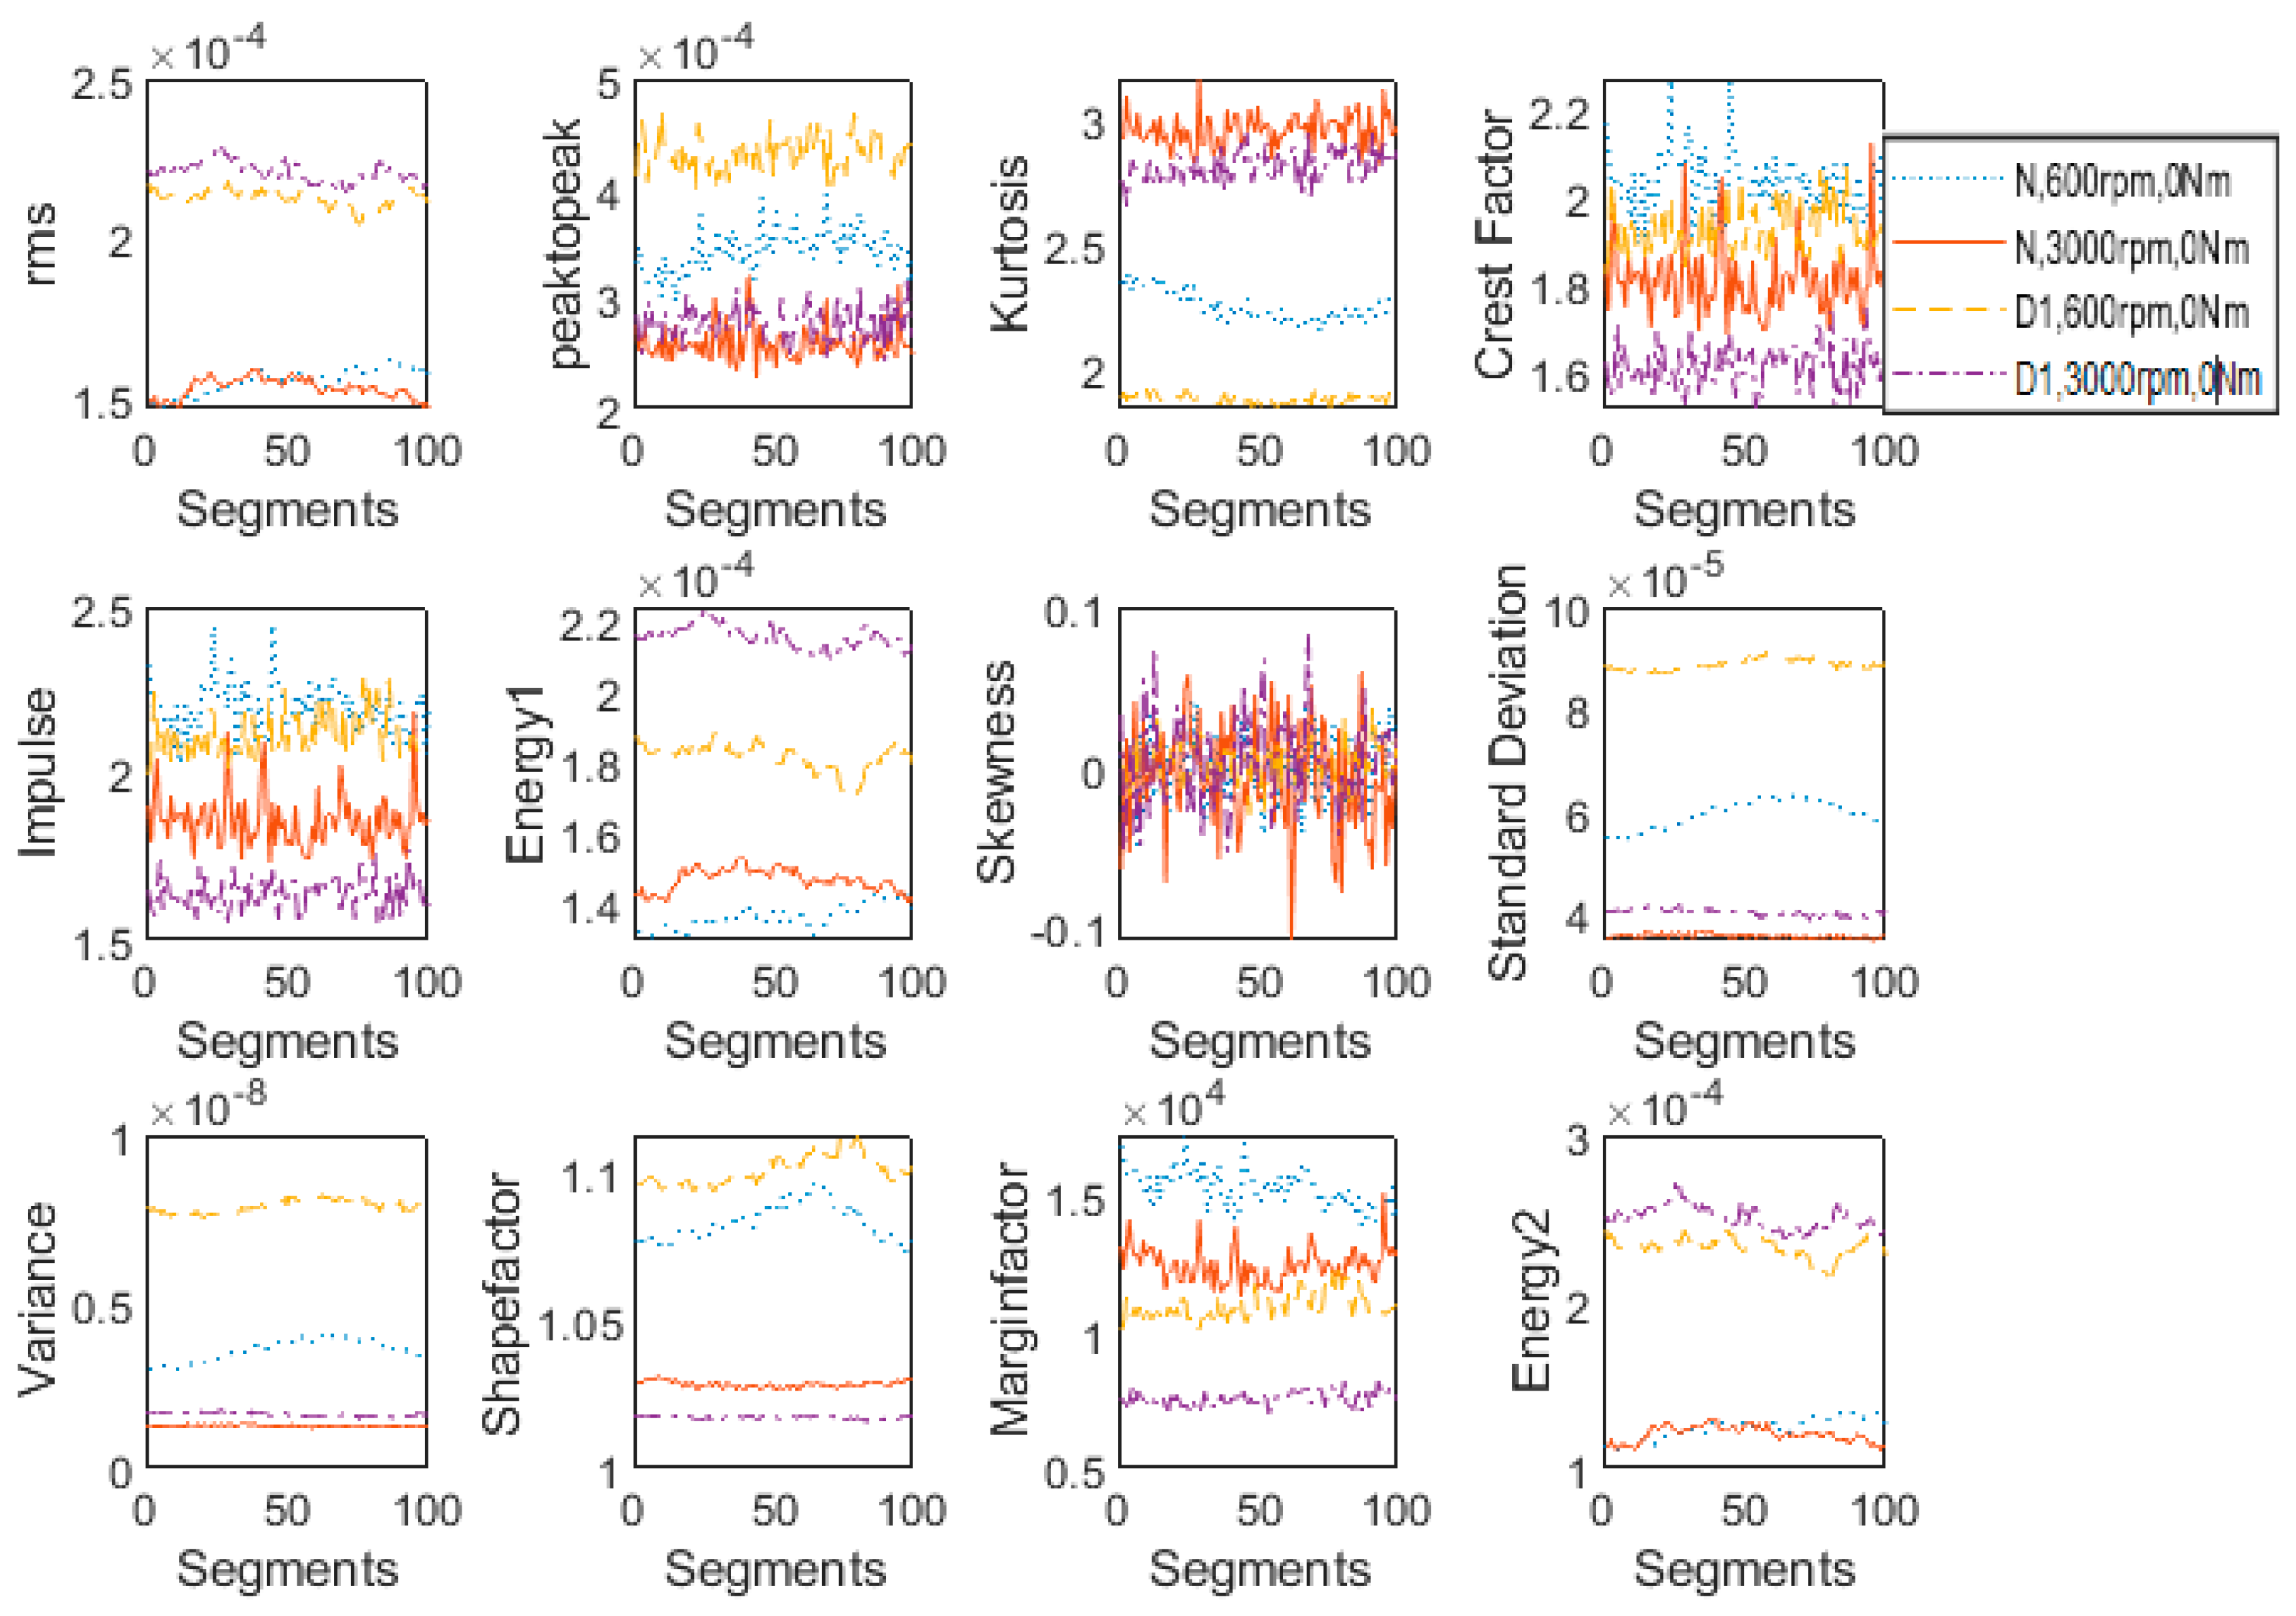
4.2. Features’ Response to Change in Speed
Features extracted from vibration signals of normal and defected gearboxes with one tooth broken, at No Load and two speed conditions (600 rpm and 3000 rpm) are plotted in
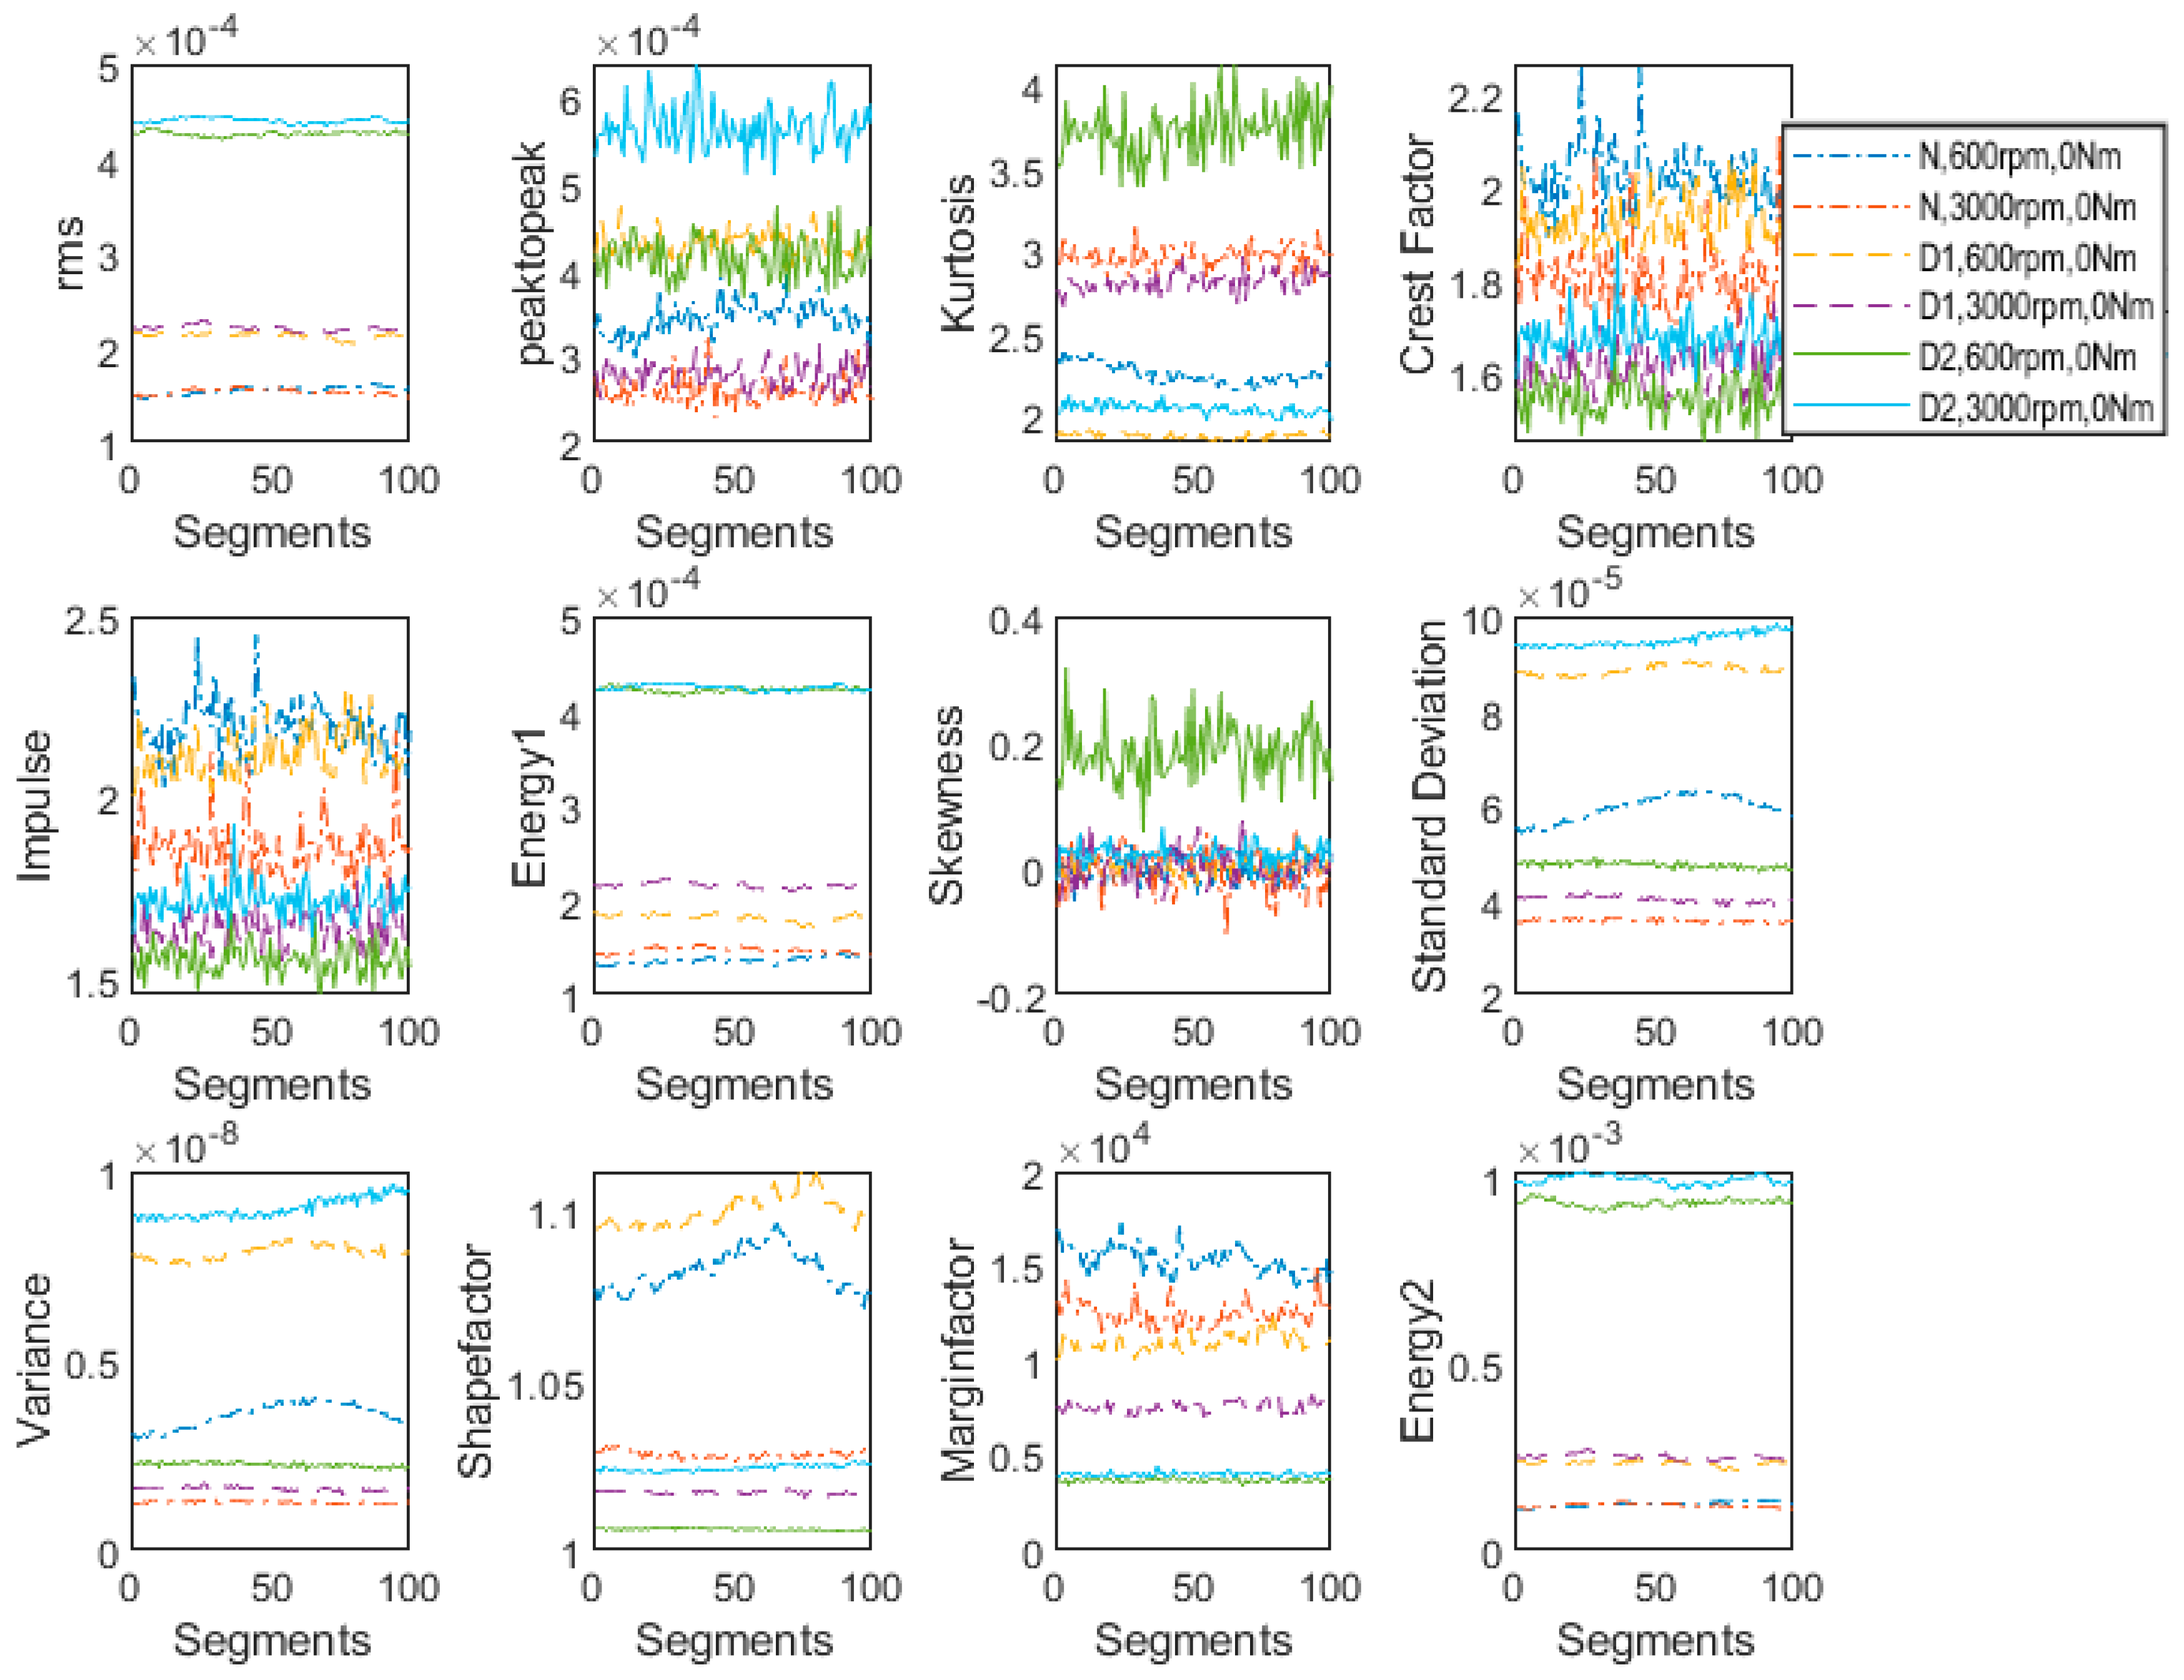
Figure 7 in order to analyze their sensitivity for speed change. Under the same operating conditions, features for all three health conditions under study are plotted in
Figure 8. It is observed that rms and energy-II are least affected by changing the speed from 600 to 3000 rpm. Energy-I demonstrated more sensitivity than compared to rms and Energy-II, however, it is less sensitive than compared to the remaining features. Therefore, rms and energy-II are the most suitable features for fault detection and fault severity level identification applications with varying speeds. However, Energy-I may also be considered as an appropriate feature for such applications.
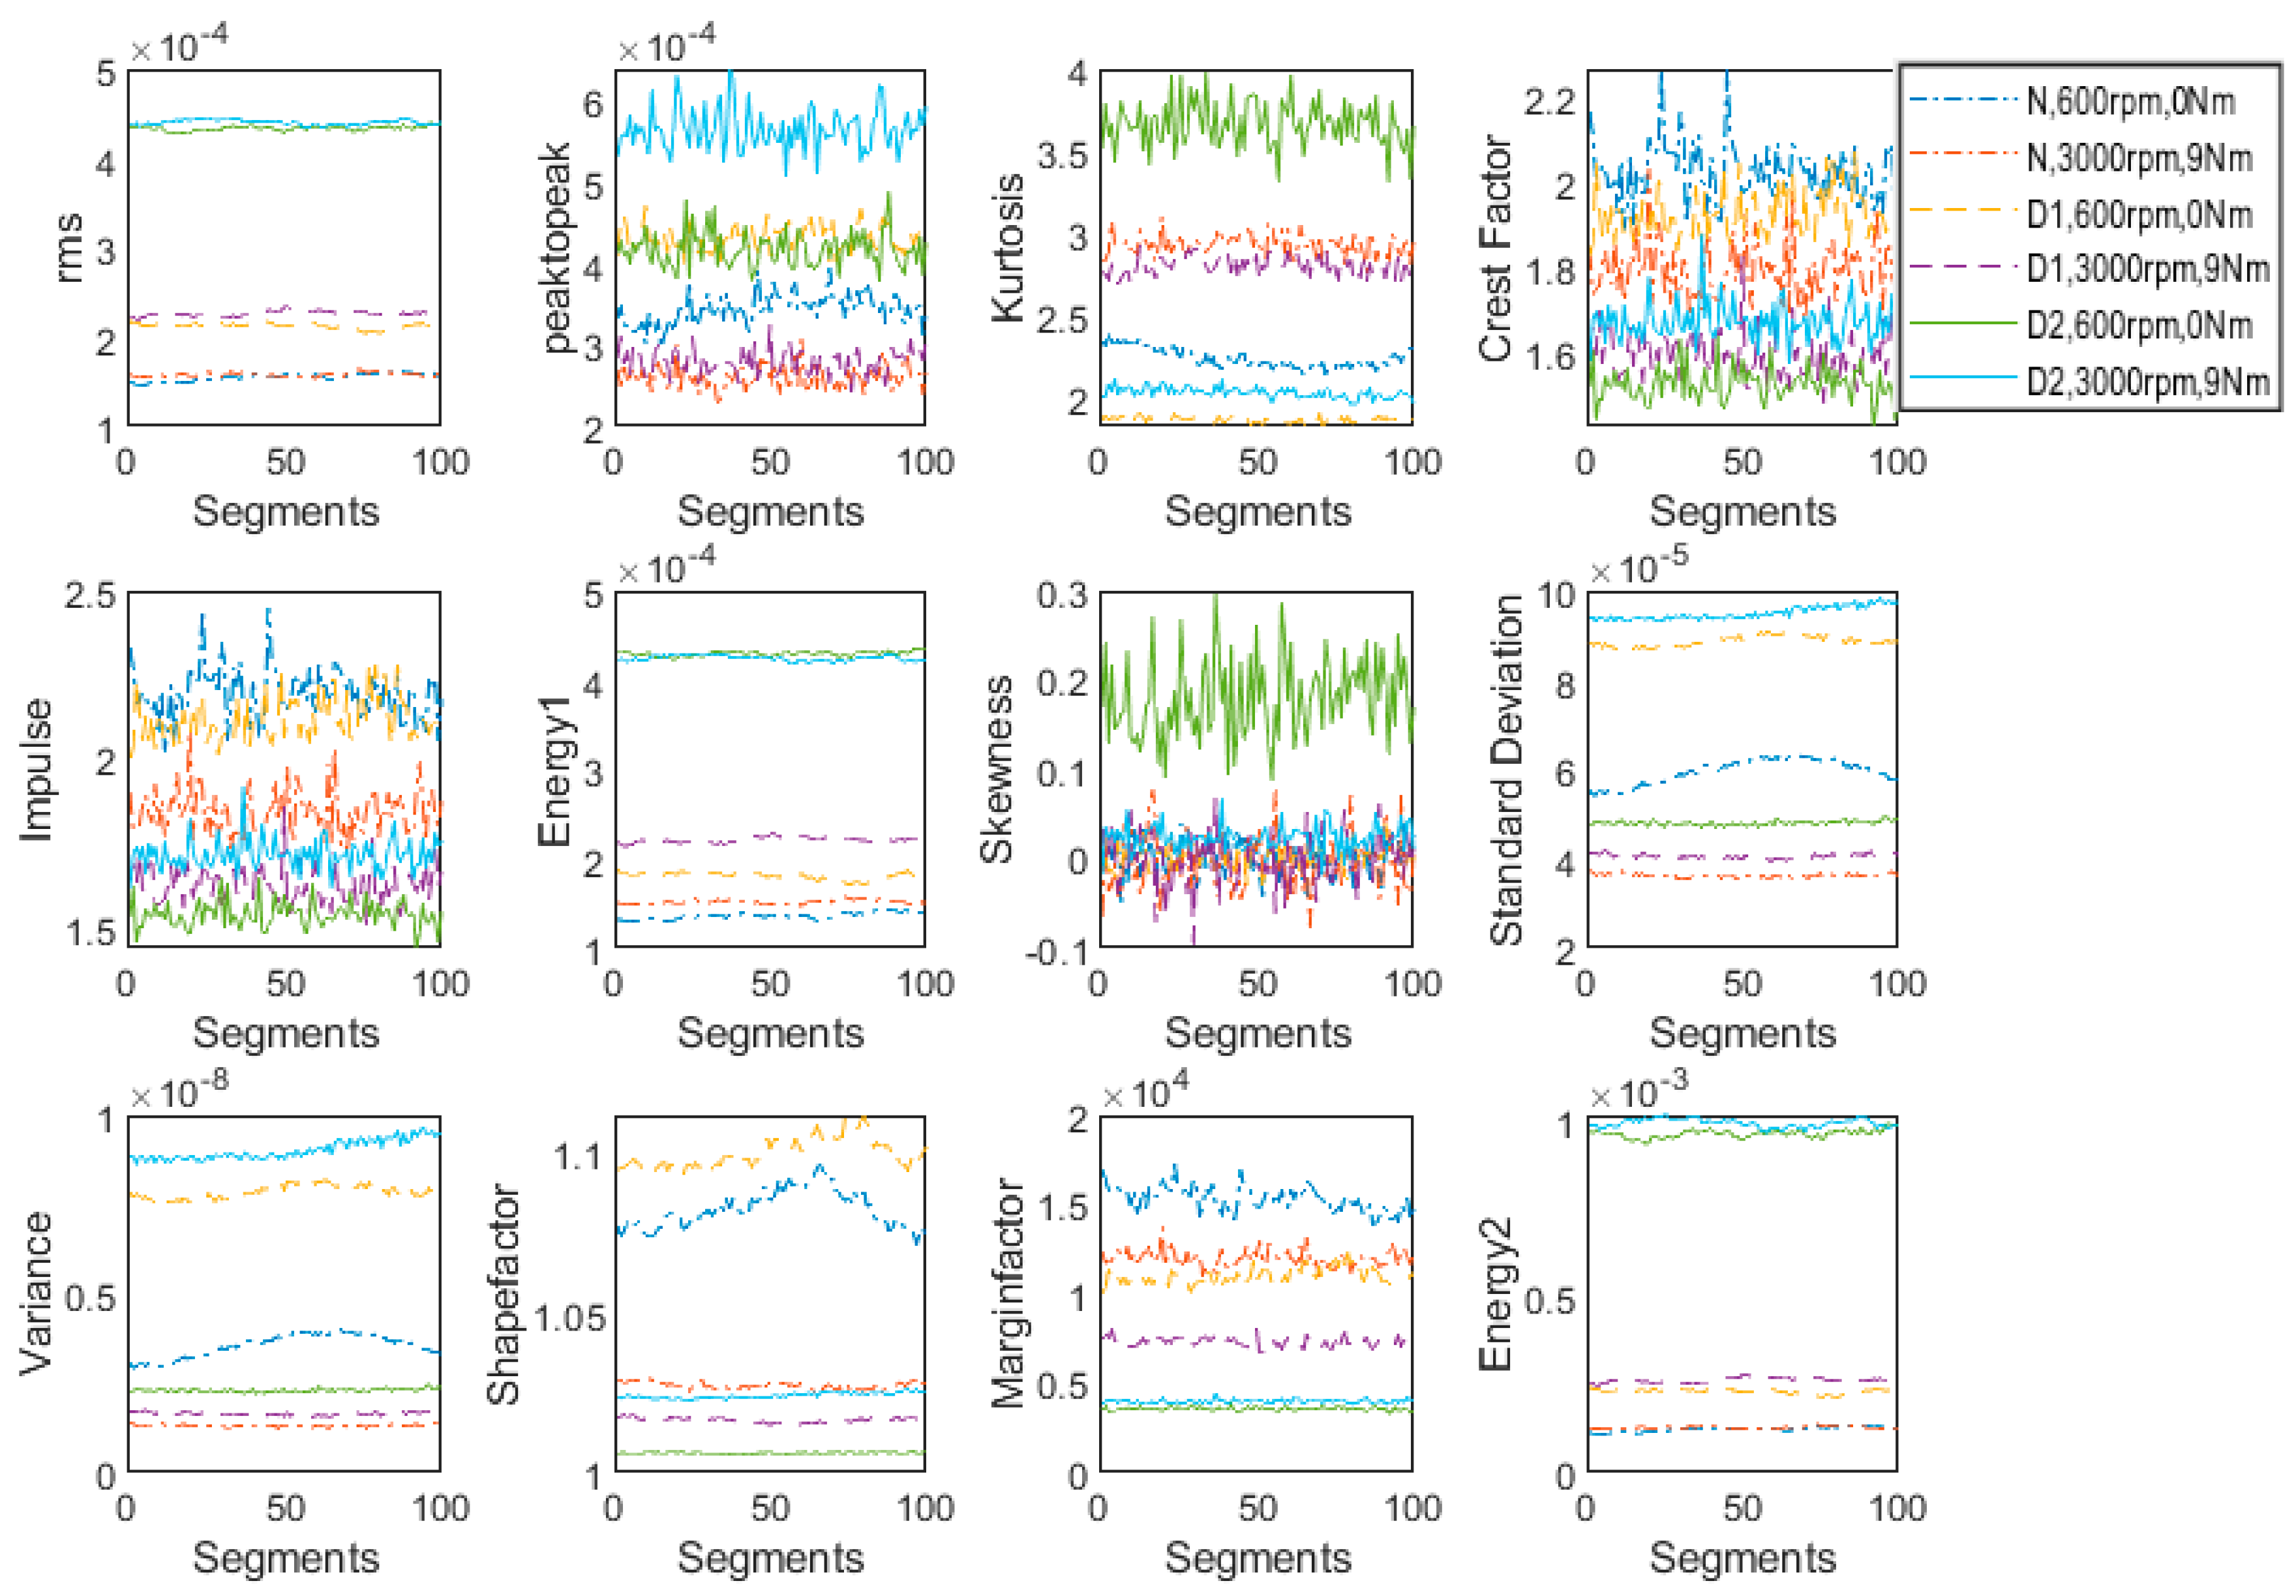
4.3. Features’ Response to Change in Speed and Load (Combined)
The features extracted from vibration signals of normal and defected gearboxes with one tooth broken at extreme operating conditions considered in this study (600 rpm + No Load and 3000 rpm + 9 Nm Load) are plotted in
Figure 9 in order to analyze their sensitivity for the applications where both speed and load are changing. Under the same operating conditions, the features for all three health conditions under study are plotted in
Figure 10. It is observed that rms and energy-II are not affected much by changing the speed and loading conditions from minimum to maximum. Therefore, these two features (rms and energy-II) are suitable for fault detection and severity assessment applications where speed and load are both varying. Energy-I demonstrated more sensitivity than compared to rms and Energy-II but depicted less sensitivity when compared to the other remaining features; nevertheless, it may also be considered as a suitable feature for such applications.
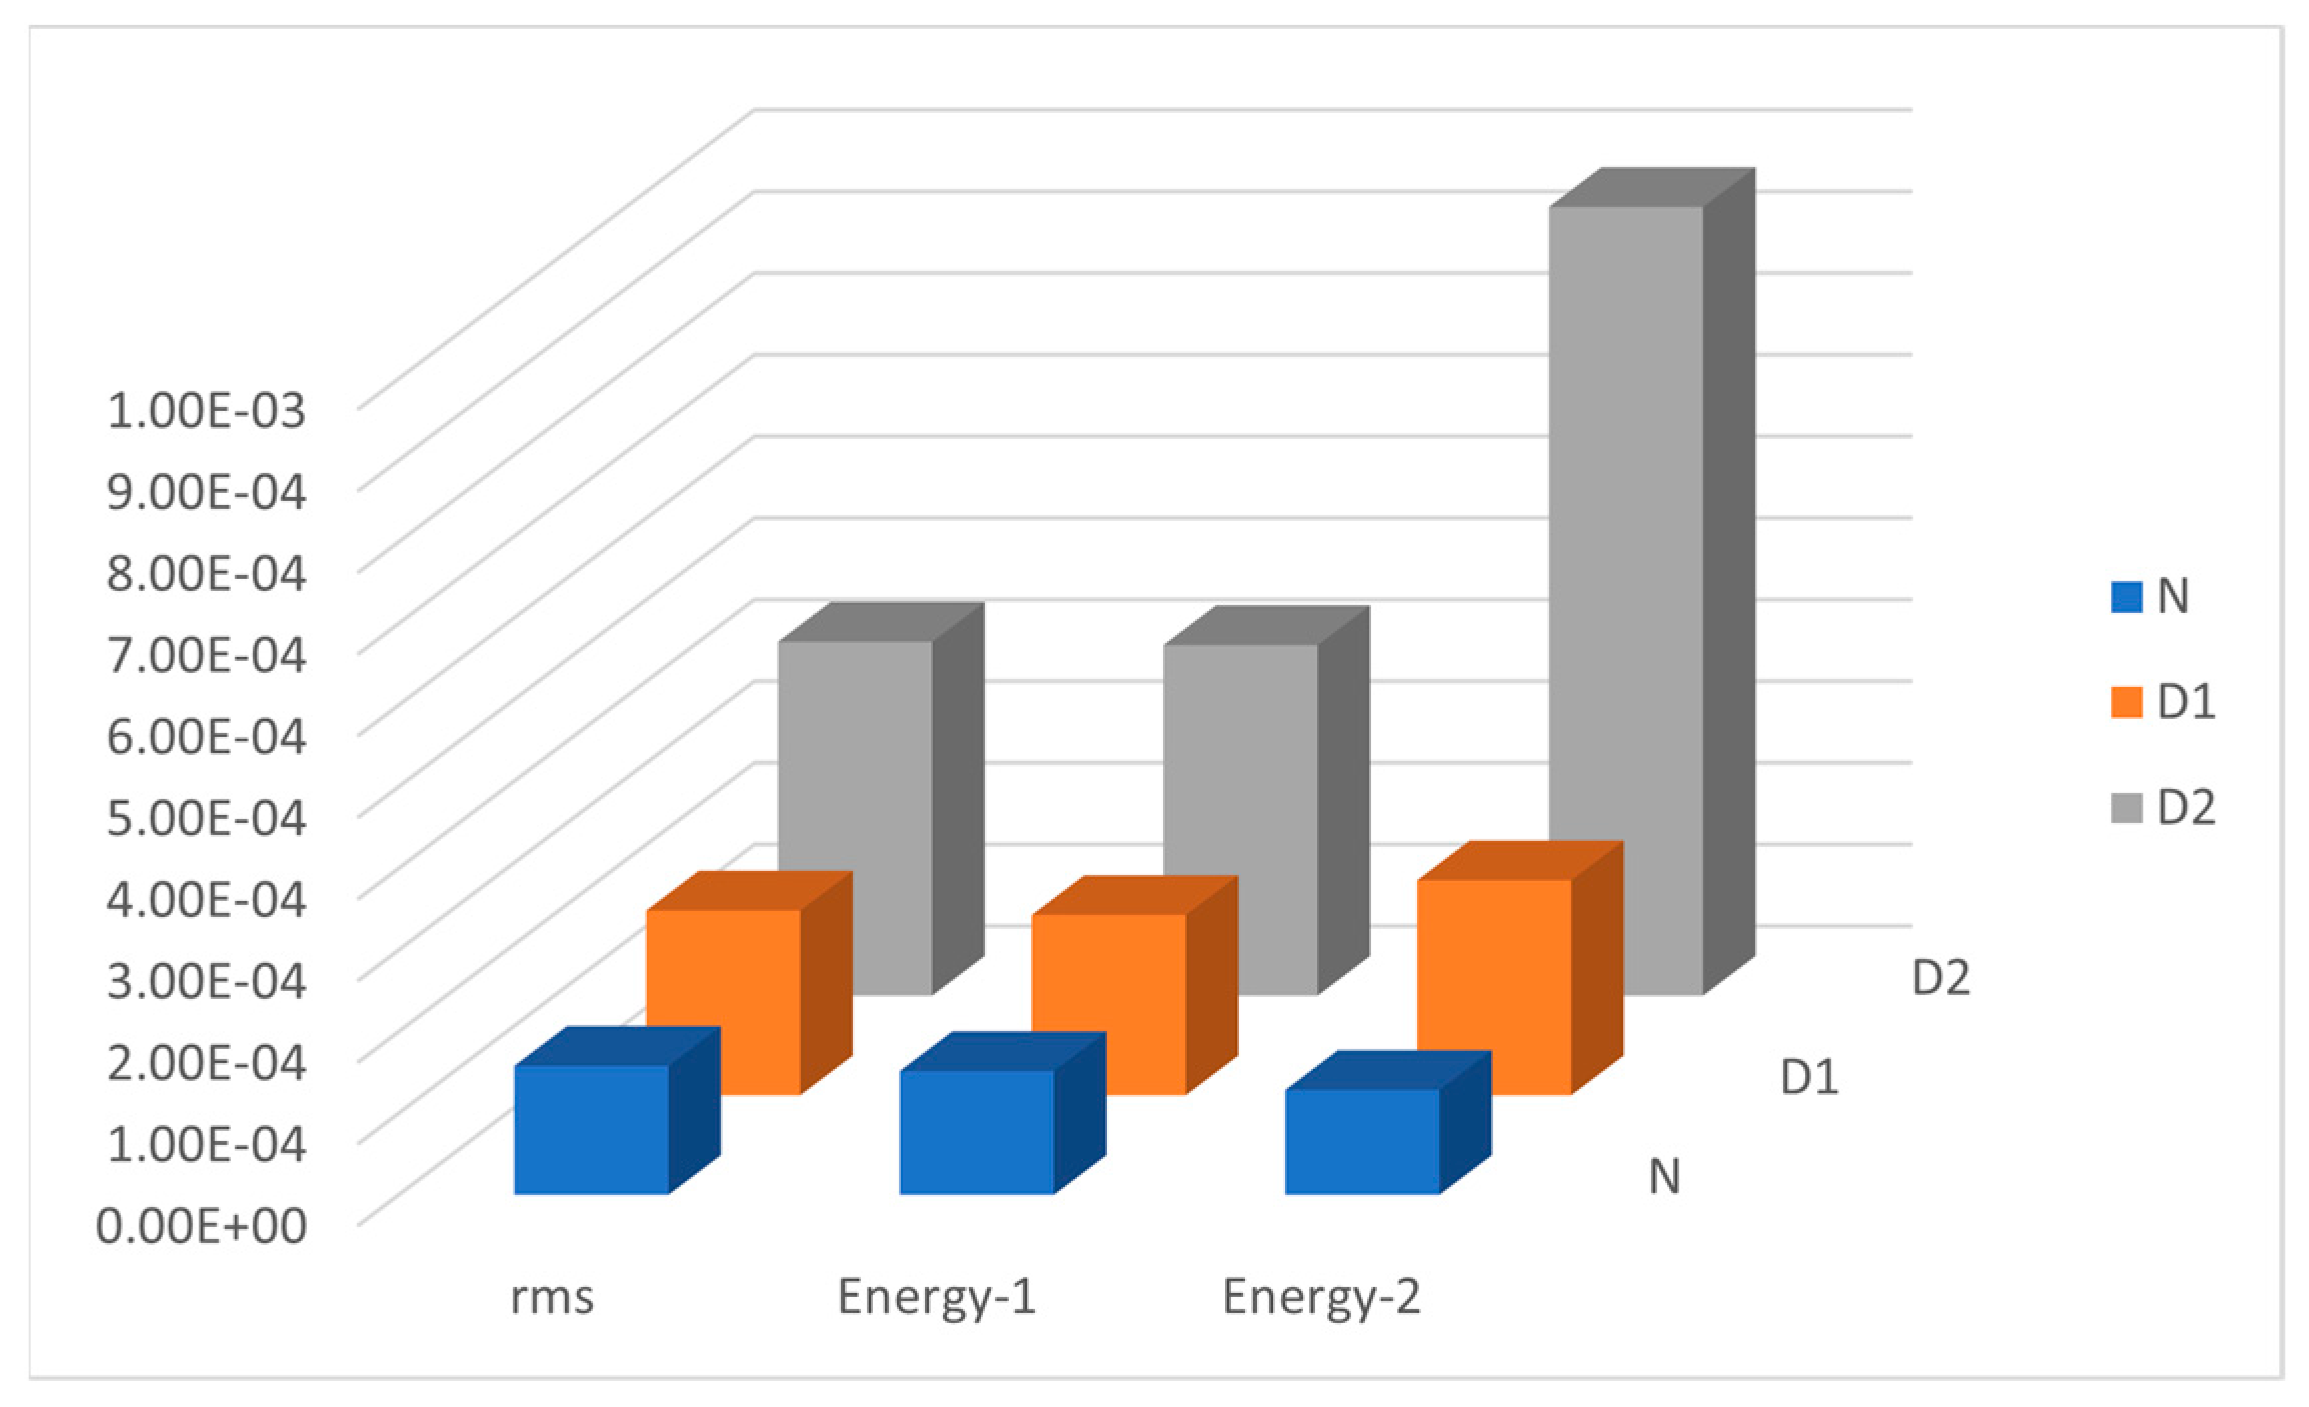
Consequently, it is found that RMS, Energy-I and Energy-II are suitable robust features that are less sensitive to the operating conditions (load and speed). Furthermore, they are sensitive to faults and depicted an increasing trend as the health condition of spiral bevel gear box deteriorated. The same can be observed in
Figure 11, where the mean of the values of RMS, Energy-I and Energy-II for 100 segments of signals are plotted for all three health conditions at 3000 rpm and 9 Nm load. Therefore, RMS, Energy-I and Energy-II are selected as the best robust features that are working conditions invariant but fault discriminative.
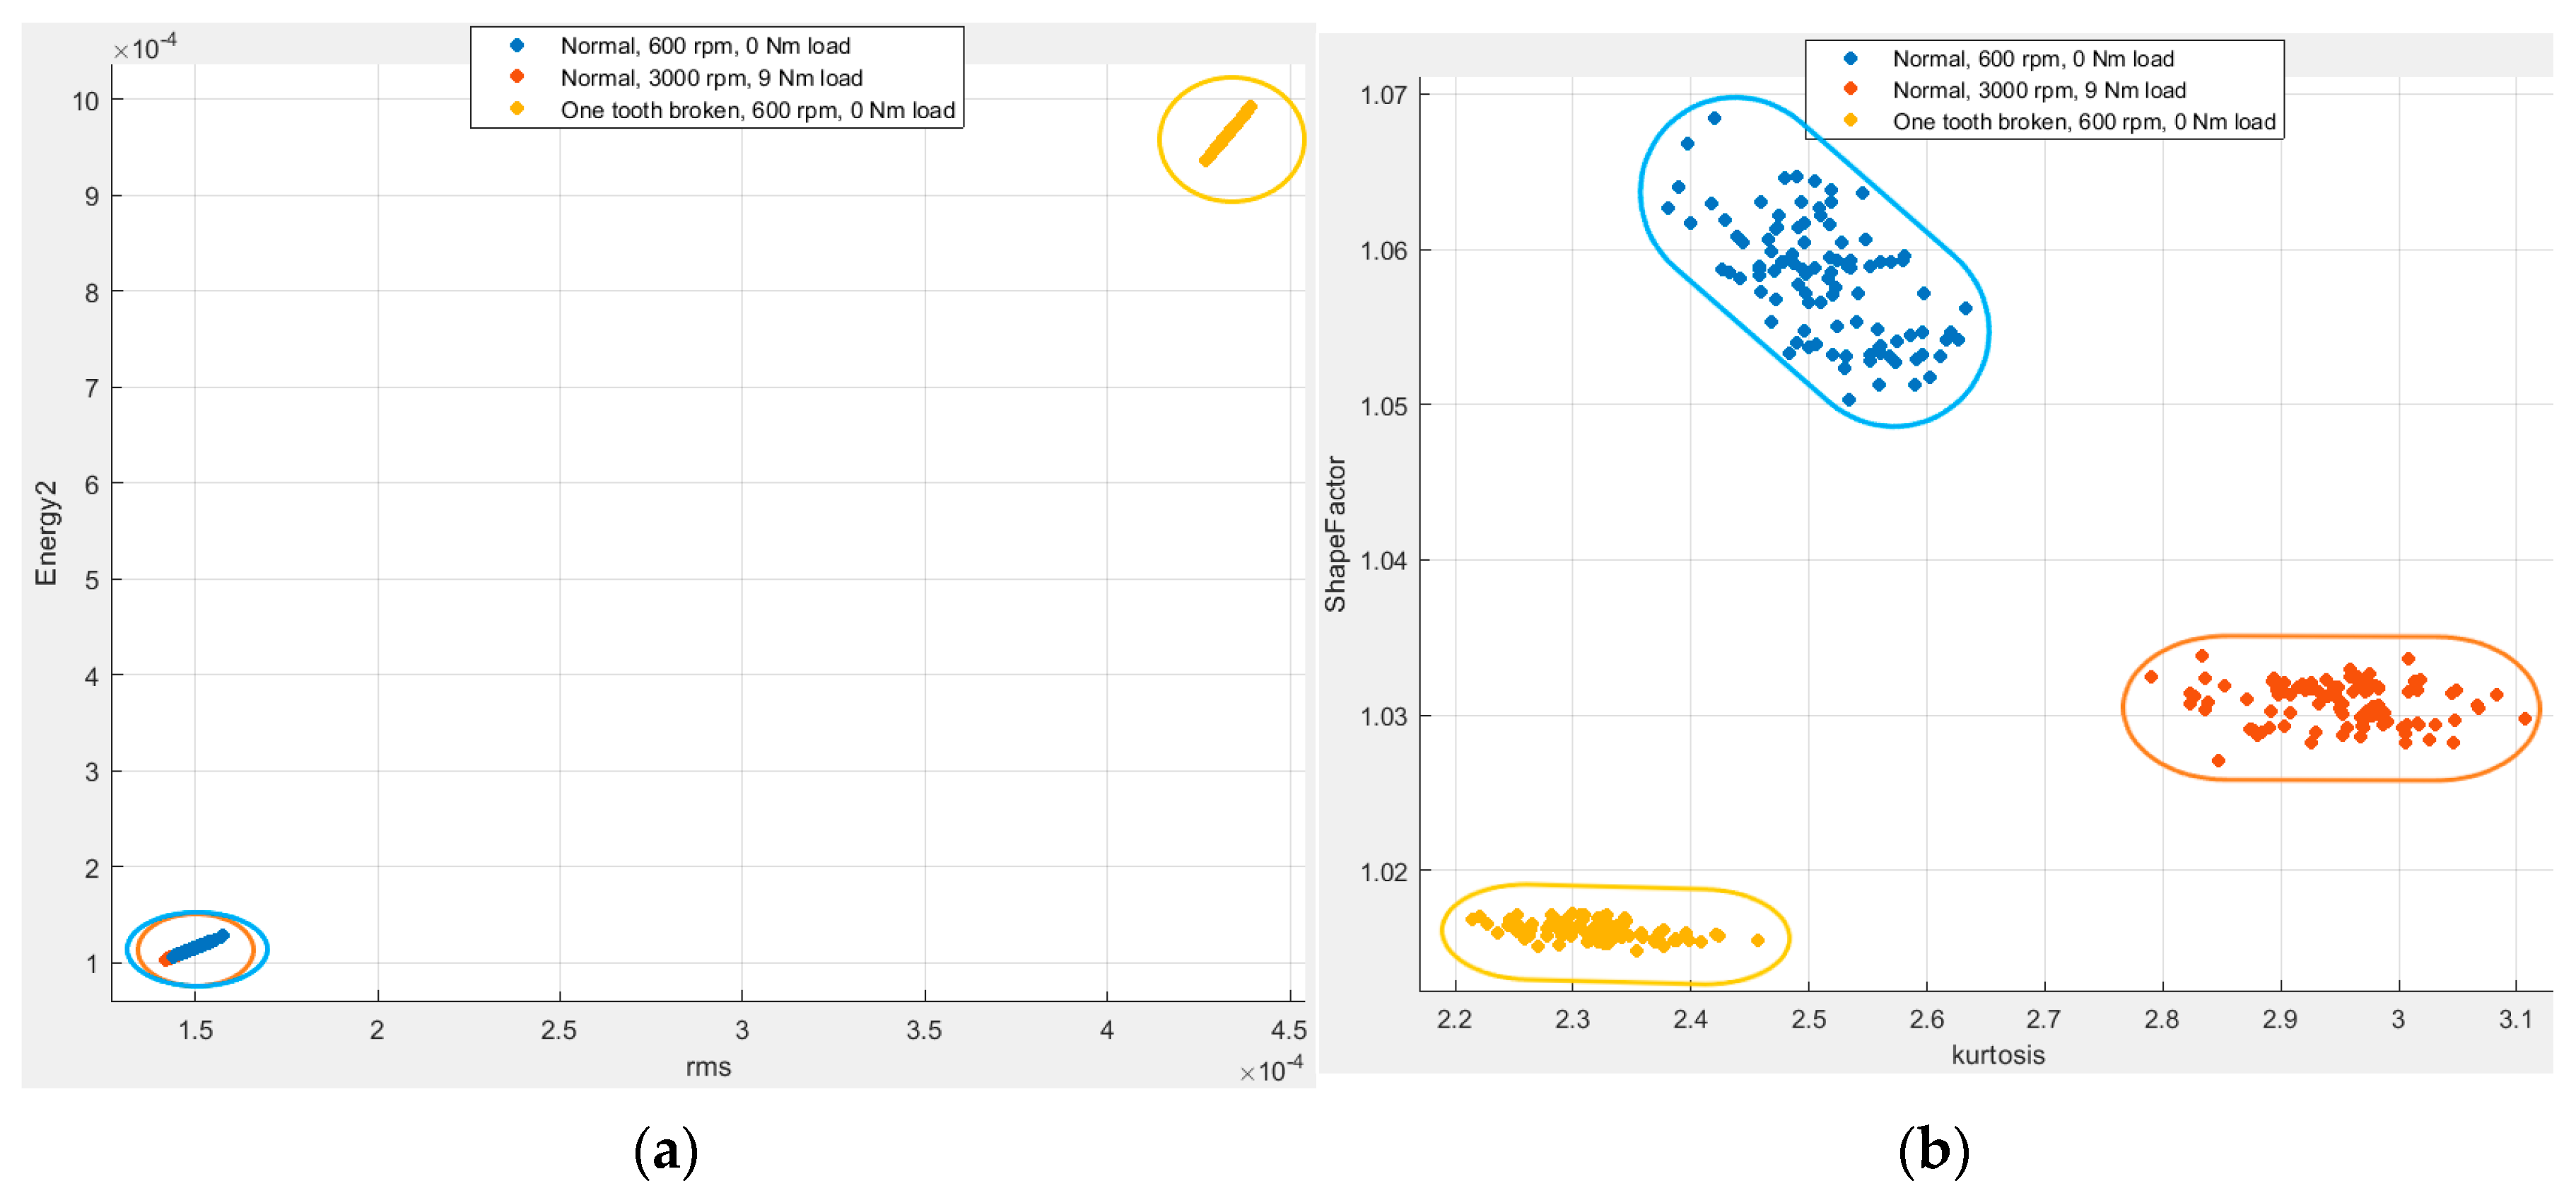
In order to confirm these findings, rms and Energy-II are plotted as a pair on a scatter plot in
Figure 12a, and two other randomly selected features (kurtosis and shape factor) are plotted in
Figure 12b. It is evident that rms and Energy-II separate the data based upon the health condition, i.e., normal (healthy) gear box and defected gear box (one tooth broken). Data from both operating conditions of normal gearbox, i.e., 600 rpm at 0 Nm load and 3000 rpm at 9 Nm load, are depicted as one class or group. However, in the case of other features, both operating conditions of normal gear box are represented by different groups. Therefore, the separation of classes is not only based upon the health condition but is also based upon the operating conditions. Consequently, these features may mislead the classifiers when the operating conditions under which the models are deployed differ from those under which they were trained.
In this study, being the robust features, RMS, Energy-I and Energy-II are used for training ANN and KNN models for fault detection and severity level identification in the spiral bevel gearboxes under different operating conditions.
5. Application of Classification Models
Industrial globalization over the past few decades thrived, and the need for automatized fault diagnosis procedures for tedious jobs without having any kind of human intervention has increased. These robust and intelligent methods have made it possible to perform the desired task without even having in depth knowledge of the field. In this instance, two Machine Learning (ML) classifiers, Artificial Neural Network (ANN) and K-Nearest Neighbors (KNN), are used for fault detection and fault severity level identification of spiral bevel gears under different operating conditions.
Artificial Neural Networks are intelligent systems that are composed of simple elements operating in a parallel manner and are inspired from biological neural system [
27]. ANN is the most used algorithm because of its ability to replicate the workings of human brain, i.e., generalizing and refereeing through similar conditions by analyzing and processing information [
28]. It has been employed in machine fault diagnoses and classification problems because of its ability to measure nonlinear relationships in complex processes. Perceptron is known as basic neural network and is used as linear classifier. In order to solve nonlinear problems, an intermediate layer of neurons, which is called hidden layer, is added between input and output of single layered perceptron to form a network. This network is called multi-layered perceptron (MLP), which consists of an input layer, one or more hidden layers and an output layer. The number of nodes in input and output layers depend upon the number of input and output variables, respectively. Hidden layer consists of computational nodes called neurons. Number of hidden layers and number of neurons in each hidden layer affects the generalization ability and computational power of the neural network. Therefore, the use of a reasonable number of nodes in the hidden layer produces a model that is computationally fast. The basic type of these networks is the feed-forward neural network in which information moves in one direction, i.e., from the input to the hidden layer and then to the output layer [
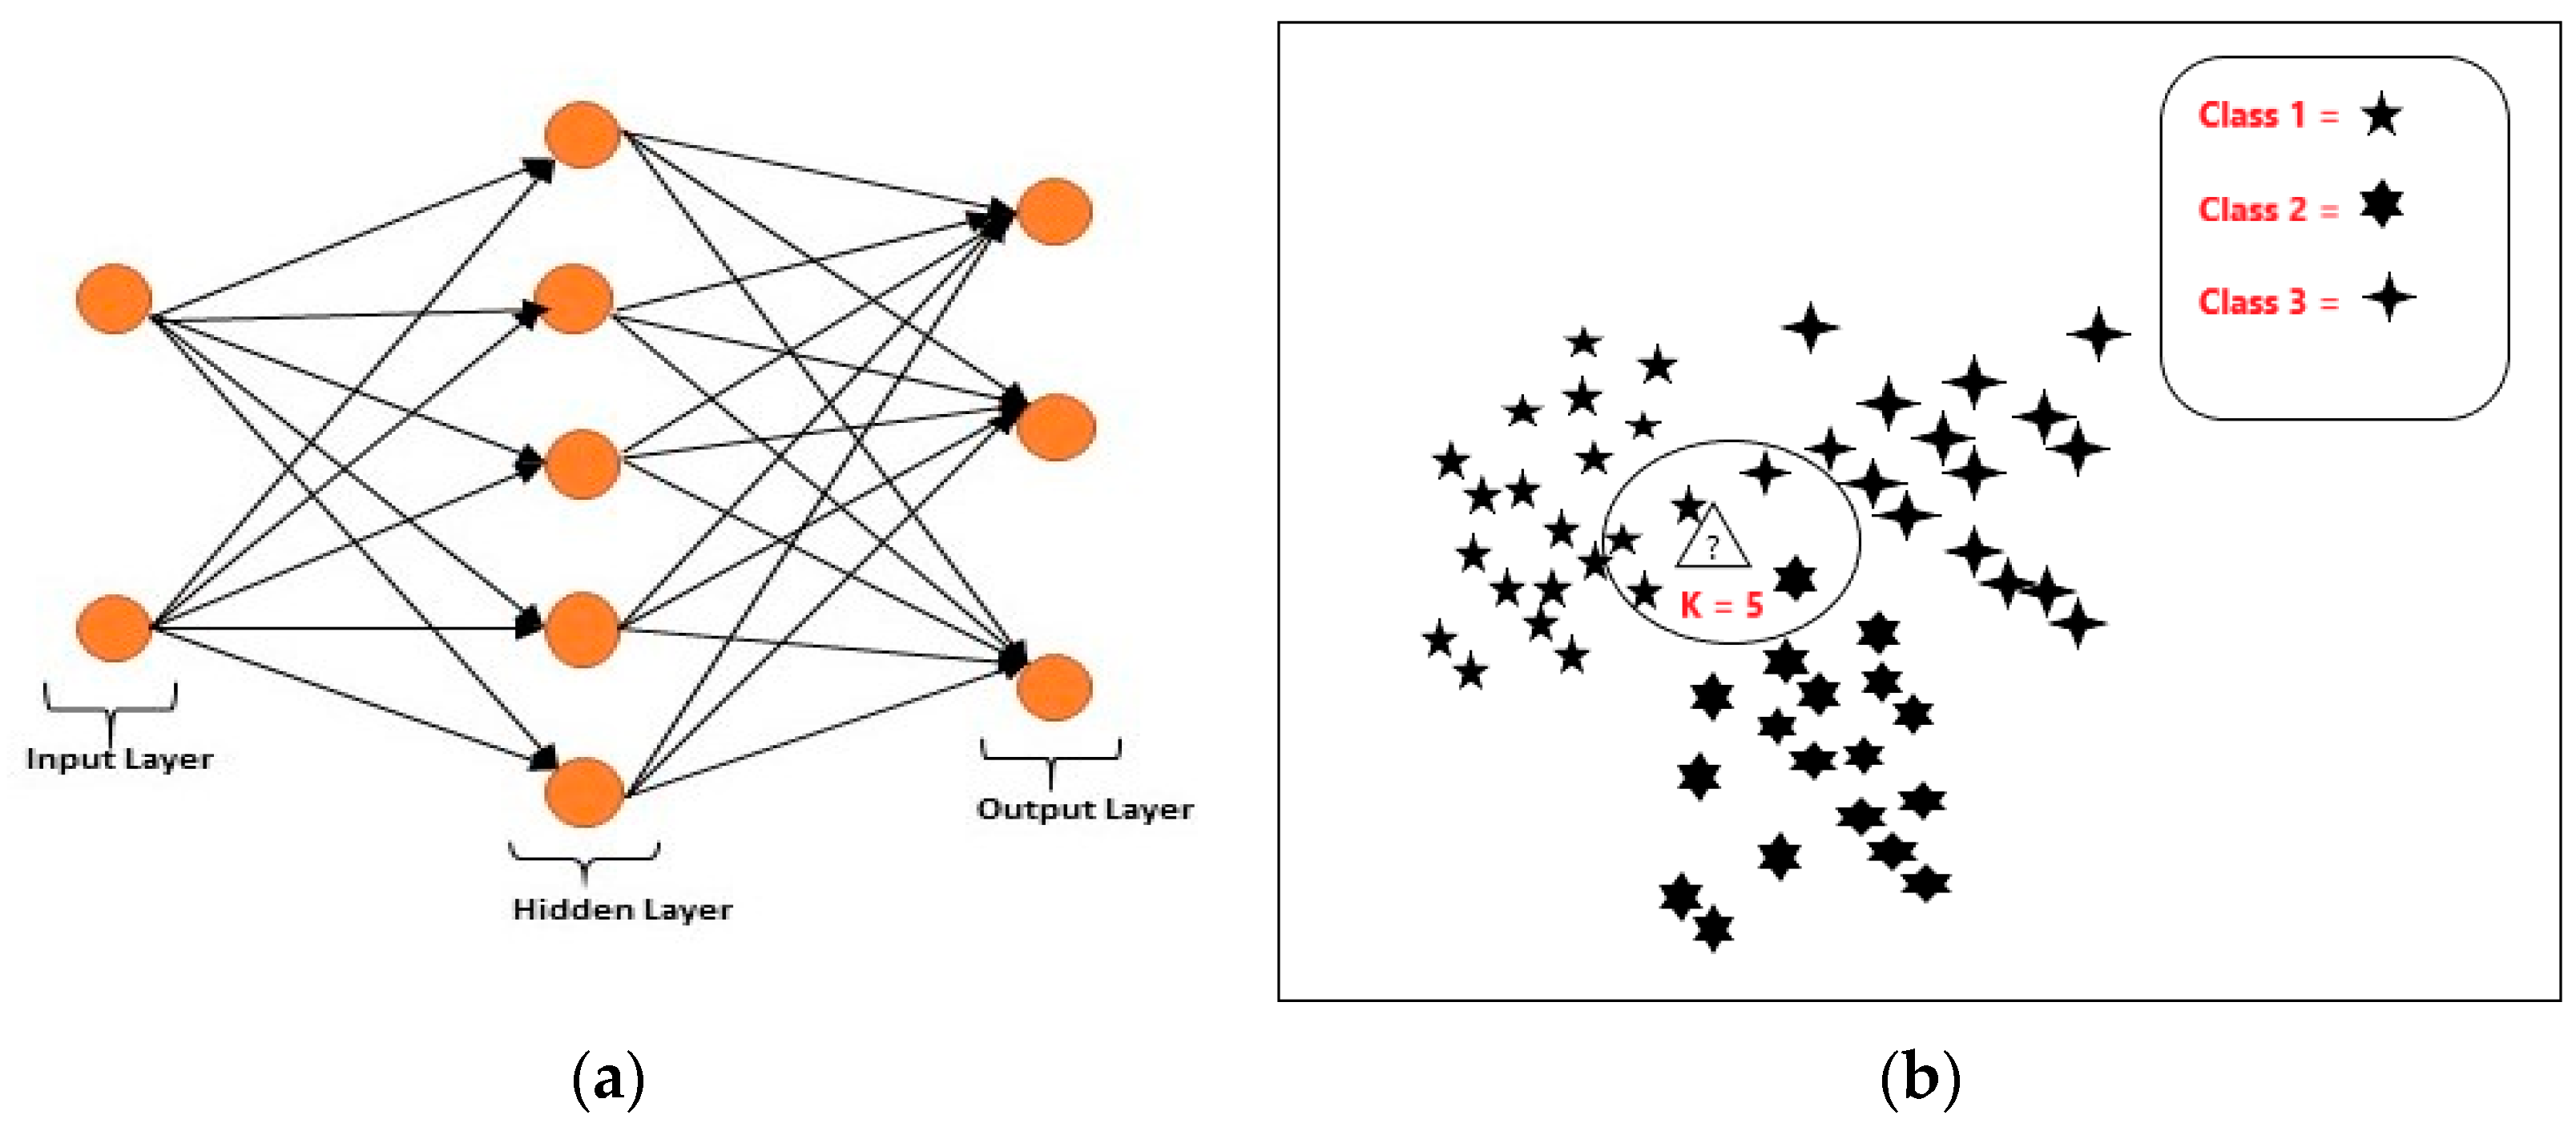
29]. In the present research, a pattern recognition neural network is applied; it is a feedforward network with sigmoid hidden and softmax output neurons. It can be trained to classify inputs according to target classes. The ANN model was computed in MATLAB. Features matrix as input vectors and the corresponding target vectors were applied to train the network by using scaled conjugate gradient backpropagation. A number of five neurons in the hidden layer (
N) were selected. The performance function used in ANN for the presented work is cross-entropy, which is most suitable for classification problems. The performance of the classifier is measured based on fault detection and severity identification accuracy. The architecture of the Artificial Neural Network used in this research study is provided in
Figure 13a.
K-nearest neighbors (KNN) is a non-parametric and simple but robust method for classification and regression. In this method, the training dataset is used as an input and the output depends on whether the algorithm was used for classification or regression. In this work, KNN is used as a classifier in which the output is a class membership. The distance amongst the patterns in the feature space is quantified by the Euclidean or Mahalanobis distance, etc. [
30,
31]. In this study, Euclidean distance was used as a distance metric as it is simple to implement and can yield competitive results even when compared to the most sophisticated machine learning methods [
32]. The classification in KNN works based on similarity measures, i.e., minimum distance. The classification was performed based on the distance, k value and some decision rules. In this study, the value of K is kept at 5. Illustration of a KNN search problem for K = 5 is given in
Figure 13b.
Initially, ANN and KNN models were trained using all the extracted features from vibration data of one set of operating conditions. The trained models were tested on all other operating conditions to ascertain their fault detection and severity identification capability when employed for predictions under different operating conditions than compared to those in which they were trained. Afterwards, the same process of training and testing was repeated by using the selected robust features during the features’ selection process.
6. Results and Discussion
Both AI models, ANN and KNN were initially trained by using all extracted features at minimum speed and loading condition considered in this research study, i.e., 600 rpm and 0 Nm Load. The trained models were deployed under 22 different operating conditions including transient operating conditions for fault detection and severity identification. The performance of both classifiers when trained at minimum operating conditions is given in
Table 2, in terms of fault detection and severity identification accuracy. It was observed that both models performed predictions with 100% accuracy for all loading conditions of 600 and 1200 rpm. When the speed increased to 1800, 2400 and 3000 rpm, the performance of both classifiers was gradually reduced to 33.3% and 64.3% for ANN and KNN, respectively. When deployed for testing under transient/varying operating conditions between 600–1200 rpm and 9 Nm load, both models depicted very good performance of 100% and 99.7%, respectively. However, when the speed increased and the models were deployed for testing under transient conditions between 1800 and 2400 rpm at 9 Nm load and 2400–3000 rpm at 0 Nm load, the performances of both classifiers were drastically reduced up to 33.3% for ANN and 65% for KNN.
Afterwards, the ANN and KNN models were trained at about medium speed and loading conditions, i.e., 1800 rpm and 3 Nm Load. The trained models were deployed under different operating conditions for fault detection and severity level identification. The performance of both classifiers when trained at medium operating conditions is given in
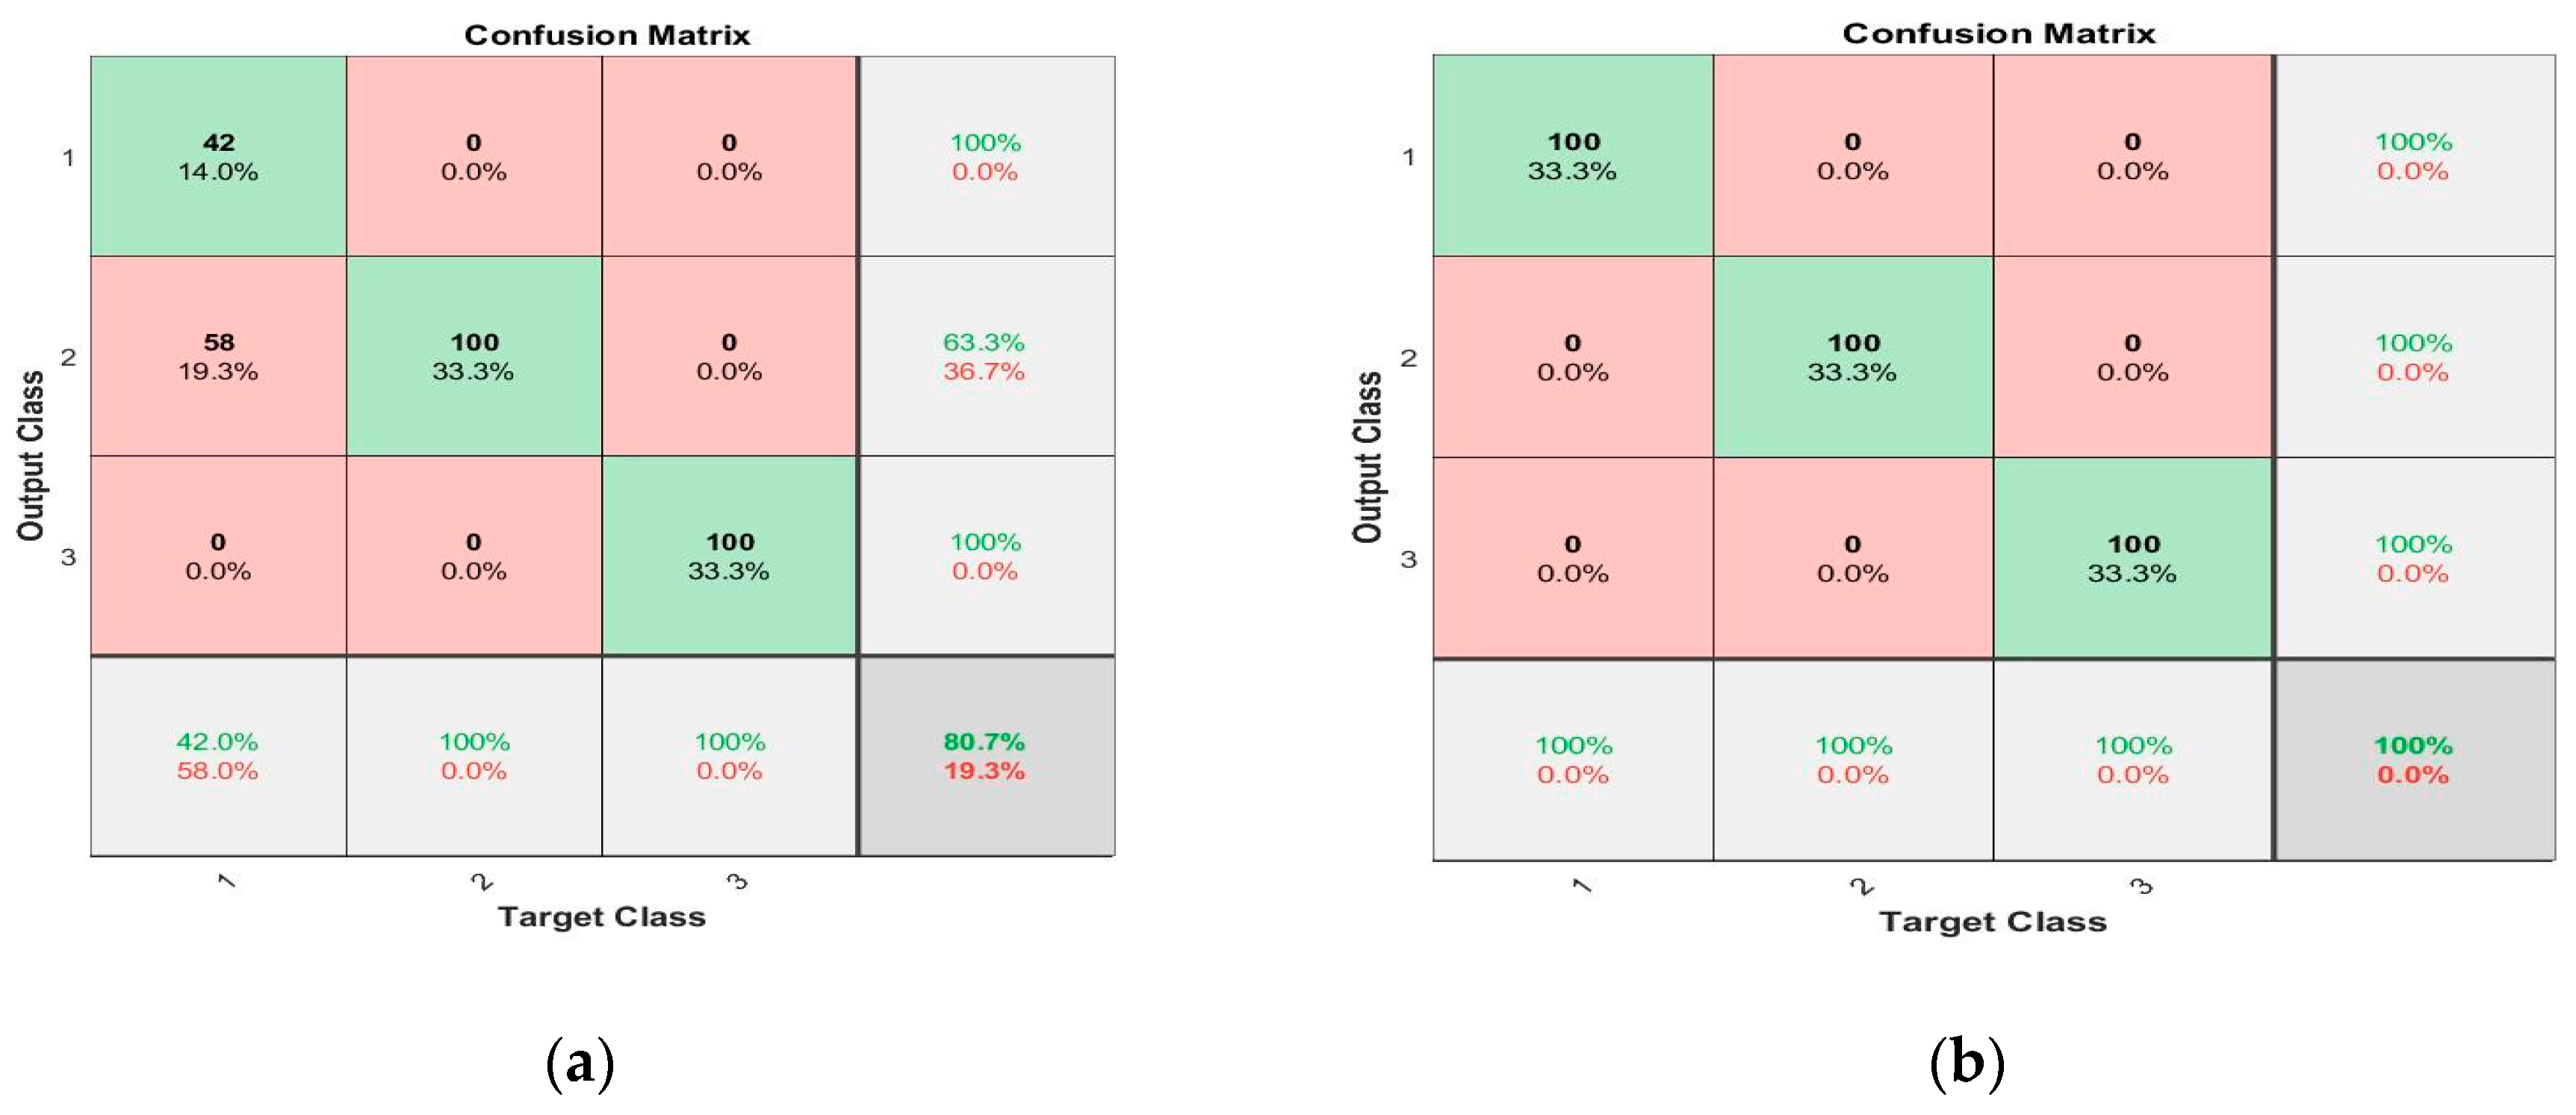
Table 3. At 600 rpm and 0 Nm load, ANN performed fault diagnosis with 80.7% accuracy (see
Figure 14a) and KNN depicted 99.6% accuracy. The performance of both classifiers increased to 100% at 1800 rpm for all loading conditions and again reduced to 66.7% by further increasing the speed to 3000 rpm. At 1200 rpm and 2400 rpm, the performance of both classifiers remained above 91% for all loading conditions. However, at 1200 rpm, the performance of KNN remained a bit better than compared to ANN and ANN showed better performance at 2400 rpm than compared to KNN for all loading conditions. When the trained models were deployed for testing under varying operating conditions, both models performed very well with 99.6% accuracy for first two transient conditions, i.e., when the speed was between 600 and 1200 rpm at 9 Nm load and when the speed was between 1800 and 2400 rpm at 9 Nm Load. For third transient condition, i.e., when the speed was between 2400 and 3000 rpm at 0 Nm load, ANN performed predictions with 70.7% accuracy, and the performance of KNN remained at 68% (see
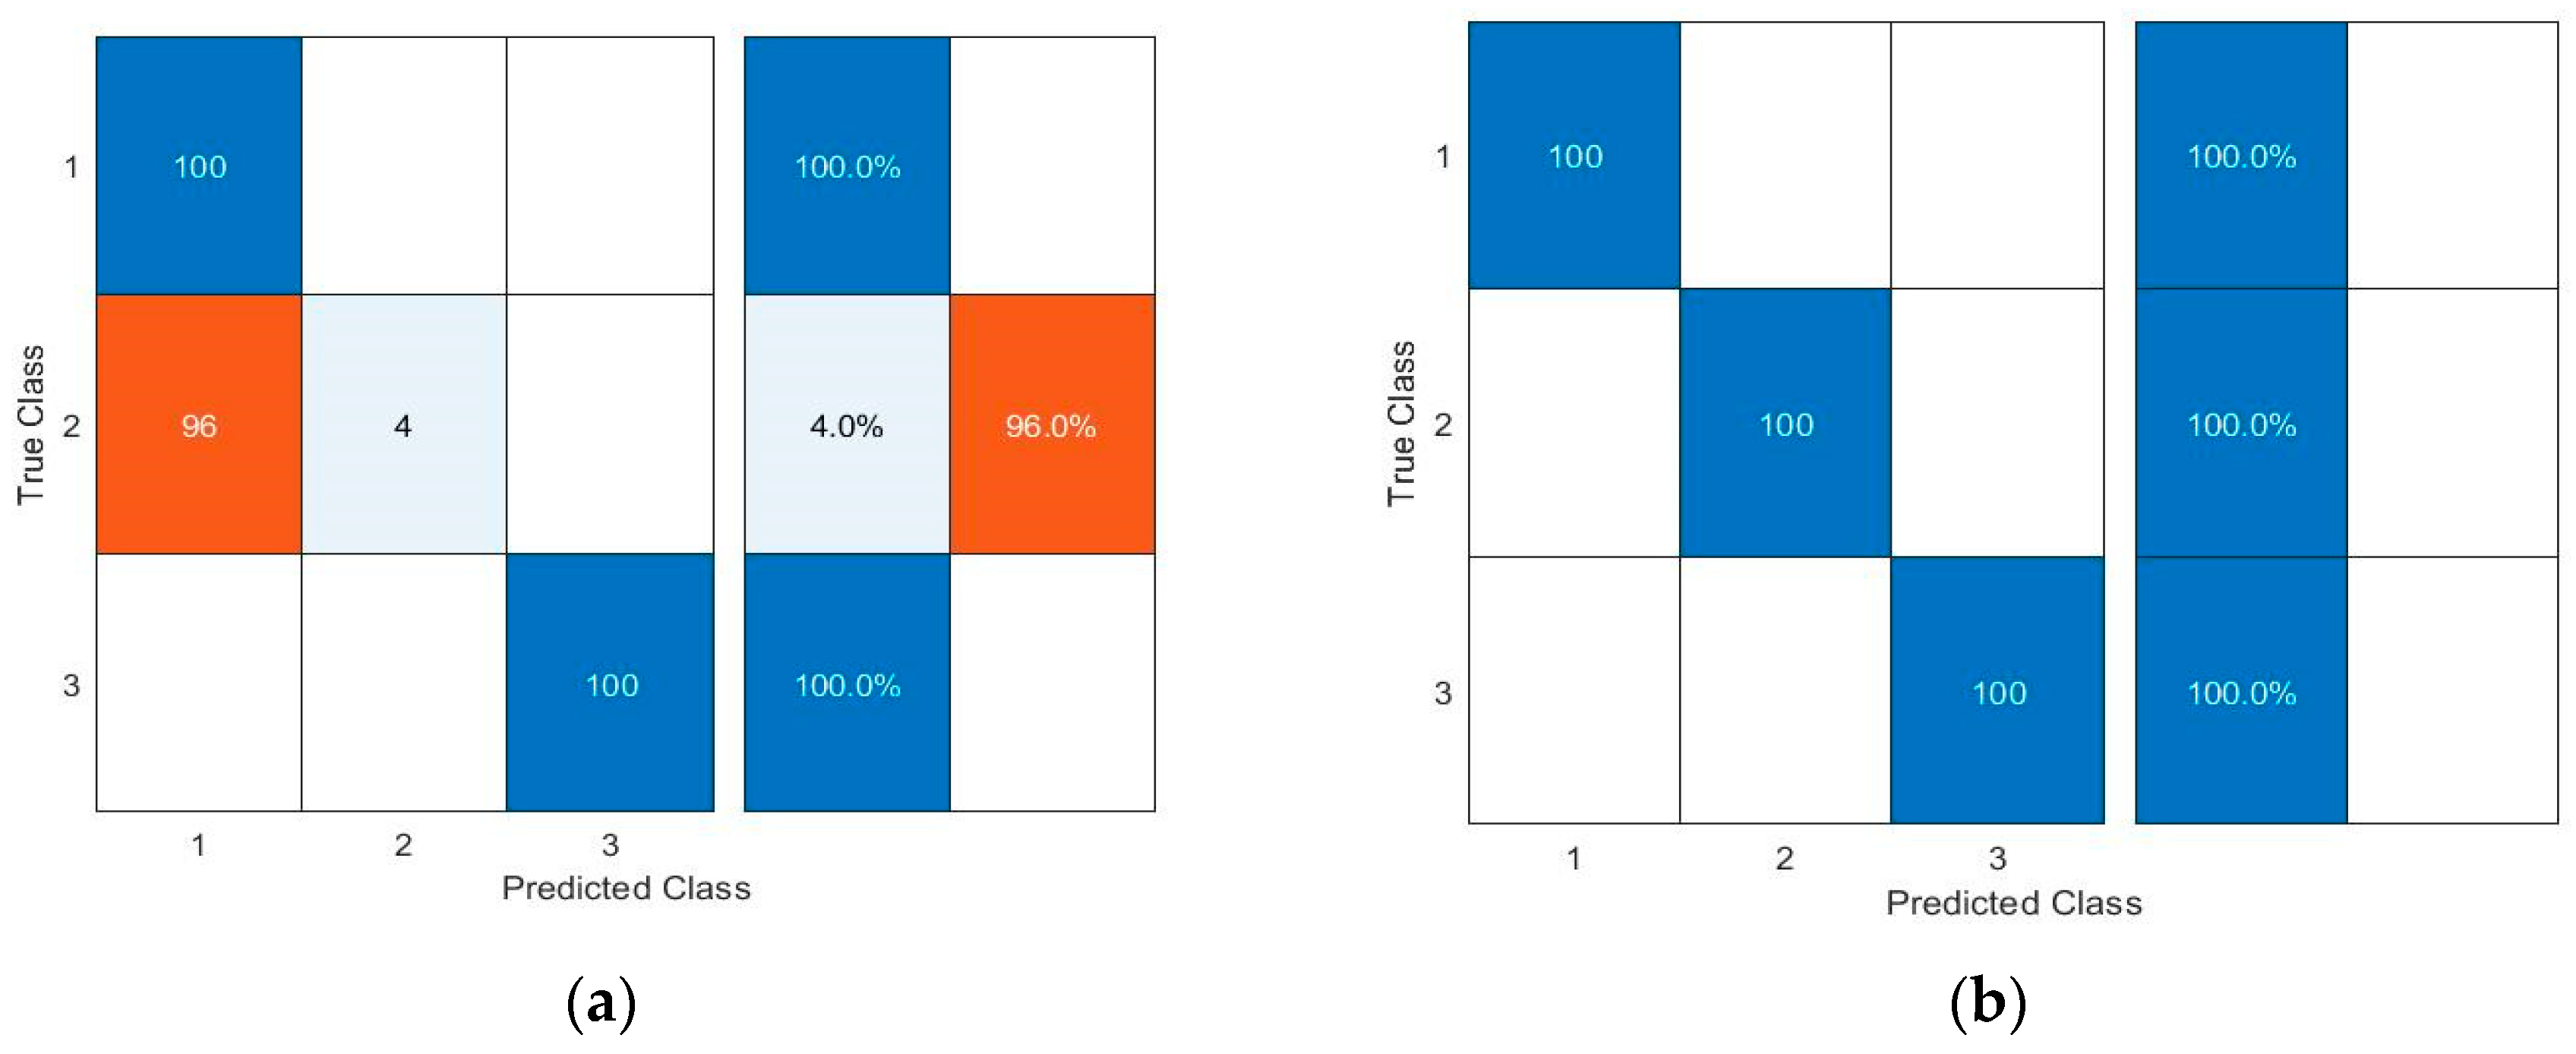
Figure 15a).
Finally, the ANN and KNN models were trained at maximum speed and loading conditions, i.e., 3000 rpm at 9 Nm Load, by using all the extracted features. The trained models were deployed to make predictions under different operating conditions. The performances of both classifiers when trained at maximum operating conditions considered in this research study are given in
Table 4 in terms of fault detection and severity identification accuracy. At 600 and 1200 rpm, the performance of ANN and KNN was 66.7% for all loading conditions. When the speed was increased to 1800 rpm, the performances of both classifiers were improved significantly with a minimum accuracy of 90.3% for ANN and 99.3% for KNN. At 2400 rpm and 3000 rpm, the performance of both classifiers was further improved, and they performed predictions with 100% accuracy. For first transient operating condition, i.e., between 600 and 1200 rpm at 9 Nm load, the performances of both classifiers remained at about 67%. For transient operating conditions between 1800 and 2400 rpm at 9 Nm, the load performances of both classifiers were increased to 99.7%. For testing under transient operating condition between 2400 and 3000 rpm at 0 Nm load, both classifiers performed predictions with 100% accuracy.
From the above information, it is evident that the performances of both AI classifiers were adversely affected as the operating conditions under which both AI models were deployed for diagnosis; the performances moved farther away from the operating conditions under which they were trained. The performance is degraded because the features extracted from the vibration signal, which are used for predictions by the trained AI models, are affected due to changes in the operating conditions. Therefore, these highly sensitive features misled the classifiers. Furthermore, it is observed that the performance of both classifiers was more adversely affected by the variation in speed than compared to load. Therefore, it can be derived that time-domain statical features, which are used in this study, are more sensitive to speed change than compared to change in loading condition.
Subsequently, the training and testing process was repeated for KNN and ANN models by using only three features (rms, Energy-I and Energy-II), which were identified as fault discriminating but operating conditions invariant features (Robust features) during features’ analysis and selection process. Since these features were identified to be less sensitive to operating conditions (speed and load), therefore, the performance of both classifiers did not drop by changing the operating conditions in which they were deployed for fault detection and severity identification. Both classifiers performed fault diagnosis with 100% accuracy over almost the entire range of operating conditions for all three training scenarios (see
Table 2,
Table 3 and
Table 4). The performance of ANN, only for the third scenario where the models were trained at 3000 rpm and 9 Nm load, was not at 100% for 600 rpm at 0 and 3 Nm load; rather, it predicted with 98% and 99% accuracy, respectively (see
Table 4). It is evident that the performances of KNN and ANN classifiers have improved in terms of fault detection and severity level identification accuracy of the spiral bevel gears under different operating conditions by using the features that are less sensitive to operating conditions but are fault discriminative. Using the selected robust features only, confusion charts for two operating conditions are shown in
Figure 14b and
Figure 15b for ANN and KNN classifiers, respectively. Furthermore, it is observed that when both classifiers were trained at intermediate operating conditions, i.e., 1800 rpm and 3 Nm load, they demonstrated better performance over entire range of operating conditions than compared to the other two training scenarios of maximum and minimum operating conditions considered in this study. An overall performance comparison of both classifiers depicts that their performance is almost comparable to one another. Therefore, both classifiers are capable enough to correctly detect the faults and identify the fault severity level of spiral bevel gears under different operating conditions while using selected robust features.
7. Conclusions
In this study, fault detection and severity level identification of spiral bevel gears are carried out under different operating conditions by using two AI models, ANN and KNN, as classifiers. Time domain statistical features were extracted from the vibration data of spiral bevel gears, one with normal health condition and two with faulty conditions at different severity levels, in order to train the classifiers. The performance of both classifiers in terms of fault detection and severity level identification accuracy gradually degraded as the operating conditions under which the models were deployed for predictions deviated farther away from the operating conditions under which the models were trained. The performance degradation was due to the higher sensitivity of most of the features under-consideration towards the operating conditions. Variation in most of the features due to operating conditions was much more prominent than compared to their change because of the fault or fault severity level. Therefore, most of the features were misleading the classifiers. The features were found more sensitive to change in speed than compared to change in load. Three features (rms, Energy-I and Energy-II) were identified as robust features which showed least sensitivity to operating conditions but were fault discriminative and demonstrated an increasing trend with respect to fault severity level. ANN and KNN performed predictions with 100% accuracy under all operating conditions while using only robust features. Thus, the performance of ANN and KNN classifiers was significantly improved for fault detection and severity level identification of spiral bevel gears under different operating conditions by eliminating misleading features, which were sensitive to operating conditions, and selecting the robust features that are less sensitive to operating conditions but were also fault discriminative. The overall performance of ANN and KNN classifiers was found almost comparable to one another.


