Article

Study on the Importance of a Slicer Selection for the 3D Printing Process Parameters via the Investigation of G-Code Readings

Department of Robotics and Mechatronics, AGH University of Science and Technology, Al. Mickiewicza 30, 30-059 Kraków, Poland
*
Author to whom correspondence should be addressed.
Machines 2021, 9(8), 163; https://doi.org/10.3390/machines9080163
Submission received: 1 July 2021 / Revised: 28 July 2021 / Accepted: 3 August 2021 / Published: 11 August 2021

Abstract

:
The work deals with the investigation of the variation of the selected 3D printing process properties that originate from the choice of a slicer. Specifically, the main aim of the present study was to assess the induced changes of the kinematic and geometric properties considered by the slicer for the printing process making use of the G-code readings. The paper provides adequate definitions and formulas required to characterize the slicer’s configuration. Next, the selected cases of the process parameters’ changes were studied, primarily taking into account varying layer height and infill. The authors performed a detailed analysis regarding the geometric implications at the mesoscale due to the slicer’s settings. Appropriate modifications of the slicer’s properties were also proposed and verified, making it possible to match the geometric and kinematic characteristics of the printed part.

1. Introduction

For about the last 20 years, extensive research has been carried out on the influence of various manufacturing process parameters on the strength and geometric properties of 3D prints [1,2,3,4,5]. Most of the tests have been conducted on the two most popular materials: PLA and ABS [6,7,8,9]. In recent years as well, researches have focused on composites, materials with impurities, and fiber reinforcement [10,11,12,13,14]. It should be, however, noted that one of the key issues regarding the obtained characteristics of the 3D-printed parts is the selection of both a 3D printer and a proper slicer. In fact, a number of 3D printers have been employed thus far to prepare samples to conduct laboratory tests. Amongst all the scientific investigations recently reviewed by the authors of the current work, the most frequently used device has been Makerbot Replicator 2x, as referenced, e.g., in [3,15,16]. Moreover, the studied cases have made use of Ultimaker 2 [7,17] and Stratasys Dimension 3D [18,19]. It is worth noting that another 16 different 3D printers have been used for manufacturing 3D samples in the remaining works in the authors’ review. Amongst them, the solutions provided by the Stratasys company have been used in six cases, as reported in [6,7,18,19,20,21].
In reference to the above-mentioned choices regarding 3D printers, Insight, the software developed by the company Stratasys, was found to be the most frequently applied slicer, considering the limitation that no external software is allowed to generate the G-code in this case. Next, the use of Cura [7,22,23] and Makerware [3,15,16] is preferred by researchers. It is especially worth noting that a significant number of the cited papers did not specify the type of slicer used, which seems an important aspect for the issue of investigation on the origins of the strength and geometric property variations for the 3D-printed components [1,9,17,24,25,26,27,28]. In the reviewed works, however, attention was drawn toward the lack of appropriate standards describing the testing processes for the elements made with the use of additive technologies. Summarizing, the research teams had test stands equipped with different printers or various 3D sample manufacturing software. This source of potential incompatibility regarding the experimental results was addressed in the work [29]. As the author of the above-cited work concluded, the mentioned issues make it difficult or even impossible to compare the obtained outcomes reported in various sources.
Making a reference to the above-raised ambiguity of the experimental characterization of 3D-printed components, the authors of the current work focused on the investigation of the variation of the selected manufacturing properties that originate from the choice of a slicer. Hence, the overall aim of the present study was to assess the induced changes of the kinematic and geometric properties considered by the slicer for the printing process.
This research complements the known studies focused on slicer selection. The works [29,30,31] reported the outcomes obtained for Cura, Slic3r, Simplify3D, and PrusaSlicer. However, in contrast to the above-cited publications, the authors of the current investigation were concerned with the data that are already contained in the generated G-code. This approach allows formulating preliminary conclusions about the geometric and kinematic properties of 3D-printed components and the manufacturing process before the creation of a physical prototype begins and experimental assessment is conducted.
The detailed scope of the paper is as follows. After the present introductory part of the manuscript, Section 2 addresses the methodology used to characterize the parameters set by the slicer. This section includes the definitions and formulas required to characterize the slicer’s configuration. Next, the results of the undertaken analysis with adequate discussion are presented in Section 3. A summary and final conclusions are presented in Section 4. Appendix A provides the information about the G-code commands used.

2. Methodology

A common approach for the assessment of the influence of the selected 3D printing process parameters on the properties of the manufactured parts consists of: (1) changing the value of a given parameter in a slicer, (2) G-code generation, (3) printing samples, and (4) conducting experiments and analyzing the data. However, according to the authors’ knowledge, there is no known research that has addressed the influence of the algorithms implemented in the slicers on the generated G-code. In the present study, the G-codes obtained with the two slicers: Cura 4.2.1 and PrusaSlicer 2.1.0, were analyzed. In both cases, the default print profiles for a layer height of 0.2 mm were used, taking into account the changes of other selected parameters, which are described below.
As the object of the planned uniaxial tensile tests, a sample model was prepared in accordance with the EN ISO 527-2 standard [32]. The aim of the research was to determine the influence of the process parameters on the properties of the 3D-printed parts. For this purpose, the following parameter changes were introduced to both slicers:
  • The number of side/top/bottom walls was zero;
  • The infill (percentage of filling) was respectively set to 30%, 65% and 100%;
  • The layer height was 0.1 mm and 0.2 mm, respectively;
  • The option “fill pattern” became “lines”.
Moreover, in the case of the software Cura, the option “Brim” was additionally changed to “Skirt”. In the following subsections, a detailed description is provided that respectively focuses on the formats of the G-code commands (Section 2.1, complemented with Appendix A), the parameter extraction based on the G-code readings (Section 2.2), and the adjustment of the above-mentioned parameters to ensure the consistency of the results regarding the process characteristics (Section 2.3).

2.1. Information Collected from the G-Code

From the programming point of view, the G-code stands for the result of the consecutive calls of individual functions, implemented in the slicer. These functions take defined process parameters as the input data, i.e., the arguments. Successive lines of the G-code are sent to a 3D printer, and hence, the device performs the required operations, i.e., ensures the proper motion of a print head. Consequently, it should be expected that the generated machine code (G-code) would contain information that had a direct impact on the quality of the 3D-printed structures.
The G-code has a relatively simple structure (syntax). Each instruction is placed in a new line of the file. The coded name of the operation is separated from its arguments with blank spaces. The order in which the input data are declared is arbitrary since each argument is set by giving its name and value without any blank space included.
The machine code may contain numerous commands used for setting the parameters of a 3D printer, including kinematic quantities, e.g., maximum acceleration for each axis, as well as others characterizing the printing process, e.g., the temperature of the head or the printing speed, i.e., the speed of the filament feed in the head. The number of the G-code commands used depends on the type of slicer. Nevertheless, the interpretation of only a few selected commands advantageously allows determining the fundamental parameters characterizing the structure of a printed part, including the mesoscale. A detailed description of the G-code commands considered is presented in Appendix A.
Taking into account the instructions referenced in Appendix A, the following parameters were determined for each line of the G-code script:
  • The position of the print head [X, Y, Z];
  • The total length of the extruded filament;
  • The length of the extruded filament determined for the currently executed G-code line;
  • The temperature of the heatbed;
  • The temperature of the print head;
  • The speed of the fan that cools down the 3D-printed part;
  • The speed of the print head.
The information about the total length of the extruded filament is stored in the event of calling the instruction that forces material retreat in the print head. This ensures that if the next instruction demands filament extrusion of a length smaller than the one applied during the previously performed material retraction, there is no extrusion initiated.

2.2. Parameters Calculated Based on the G-Code Readings

Based on the position of the print head and the length of the extruded filament, the selected properties of the printed filament’s fibers can be determined:
  • The height, which is considered equivalent to the height of the layer in a printed part;
  • The length;
  • The angle of the inclination with respect to the direction of the X axis;
  • The volume;
  • The percentage of the volumetric filling of the space with the given filament.
Moreover, having introduced the parameters of individual fibers, there may also be options to determine:
  • The total length of the filament’s fibers for which the material extrusion was not interrupted;
  • The distance between the two consecutive filament’s fibers in a layer;
  • The mass of a printed sample.
The arbitrarily chosen subset of the above-listed quantities was used by the authors to characterize the properties of the 3D-printed structure at the mesoscale. Specifically, the following parameters were taken into account: layer height, inclination angle, total length for continuous extrusion, volumetric fill, distance between the filament’s fibers (the air gap). Moreover, two other nongeometric printing process characteristics were concerned, i.e., the temperature of the print head (the extruder’s temperature) and its speed.
In order to determine the above-indicated parameters, successive positions of the extruder were found based on the consecutive lines of the G-code. Specifically, the arguments provided in the commands (A2) and (A3) (referenced in Appendix A) were taken into account. While reading the machine code, the information about the previous P 0 and the current position P 1 of the print head was stored. The case when the currently analyzed G0/G1 command has a defined argument regarding the filament displacement, i.e., E < p o s > , stands for fiber extrusion.
The length of a given line is calculated with the equation:
L = ( x 1 x 0 ) 2 + ( y 1 y 0 ) 2 + ( z 1 z 0 ) 2
In order to determine the length of a continuous extrusion, the values obtained from Equation (1) were summed up until a G0/G1 command occurred with any combination of the arguments X, Y, or Z, but without the parameter E. This case means moving the print head without extruding the filament.
Next, the inclination angle of the filament’s fiber is addressed below. It should be noted, however, that all fibers within the printed component lie in the XY plane. Thus, it is feasible to calculate the angle of inclination of a given line, which declares the orientation direction of a fiber, with respect to the X axis, using the following conditionally formulated equation:
φ = atg ( a ) if d x > 0 180 + atg ( a ) if d y 0 and d x < 0 180 + atg ( a ) if d y < 0 and d x < 0 90 if d y > 0 and d x = 0 90 if d y < 0 and d x = 0 0 otherwise
where a = d y d x , d x = x 1 x 0 , and d y = y 1 y 0 .
In the case in which negative values are obtained when applying Equation (2), they are adequately modified with the formula:
φ modified = φ + 360
The volume of a fiber is calculated based on the desired filament displacement, which is converted to the amount of material extruded. For a filament with a diameter of 1.75 mm, as considered in the present study, the volume is calculated as follows:
V i = ( 1.75 · 10 3 ) 2 π 4 e pos
where e pos is the length of the extruded filament.
Multiplying the volume of the entire sample, by summing up the volumes of individual fibers (4) and the material density ρ provided by the manufacturer allows determining the theoretical mass of the printed element:
M = i = 1 N V i ρ
It was expected that when the printing infill property reaches the level of 100%, a printed component becomes a solid part, i.e., without air gaps. Thus, the material extruded for a single filament’s fiber should exhibit a square-shaped cross-section and, hence, completely fill in the space of a cuboid defined by the printed layer height and the respective width and length, which refer to both the geometry of the printing nozzle and the filament length. The following formula was introduced to determine the percentage volumetric fill for a single fiber, i.e., for the i-th piece of a filament:
V % = V i H D L · 100 [ % ]
where H is the height of the layer and D is the diameter of the nozzle, which corresponds to the width of the fiber. The parameter L can be found with Formula (1). The case of V % = 100 is considered equivalent to the 100%-infill extrusion case and, hence, refers to printing a solid component.
It should be noted that all samples analyzed in the present study were printed following the same filling pattern, i.e., only a parallel arrangement of fibers was considered during extrusion in each layer. Hence, it was ensured that there were no crossing (overlapping) fibers lying within the same plane. Consequently, the authors did not address in the calculations the errors that would originate from this source of the filament’s geometry change. Finally, the air gap parameter was determined as the minimum distance between the consecutive fibers in the layer. The assignment of a fiber to an appropriate layer was determined with the value of the Z coordinate.

2.3. Parameter Adjustment in Slicers to Ensure the Consistency of the Process Characteristics

Due to the differences regarding the properties of the two tested slicers, the authors introduced the required parameters modifications to ensure consistency regarding the 3D printing process characteristics and comparable conditions for the assessment of the results. In fact, compared to PrusaSlicer, the Cura software allows modifying many more parameters. Hence, to obtain the mentioned consistency, the process parameters were first read from the G-code generated by PrusaSlicer and then entered into the Cura program. The changes regarding the Cura parameters that were considered to match the PrusaSlicer settings are presented in Table 1. The referential settings for the PrusaSlicer are collected in Table 2, in turn.
Having considered the above-presented parameter definition and the overall scope of the study, the authors investigated the selected properties of the 3D-printed parts based on the G-code readings. For the sake of clarity, the parameters that were not taken into account during the study were set to take their default values into the investigated software solutions. The results of the conducted analysis are presented in the following section.

3. Results

The current section is divided into two parts covering the presentation of the results obtained for the selected referential case with the assumed percentage infill (Section 3.1) and the respective results yielded after parameter modification considered for the Cura software (Section 3.2). This way of presenting the results was chosen by the authors to visualize the differences between the properties of the two investigated slicers, especially within the scope of the preparation of the data for the printing process.

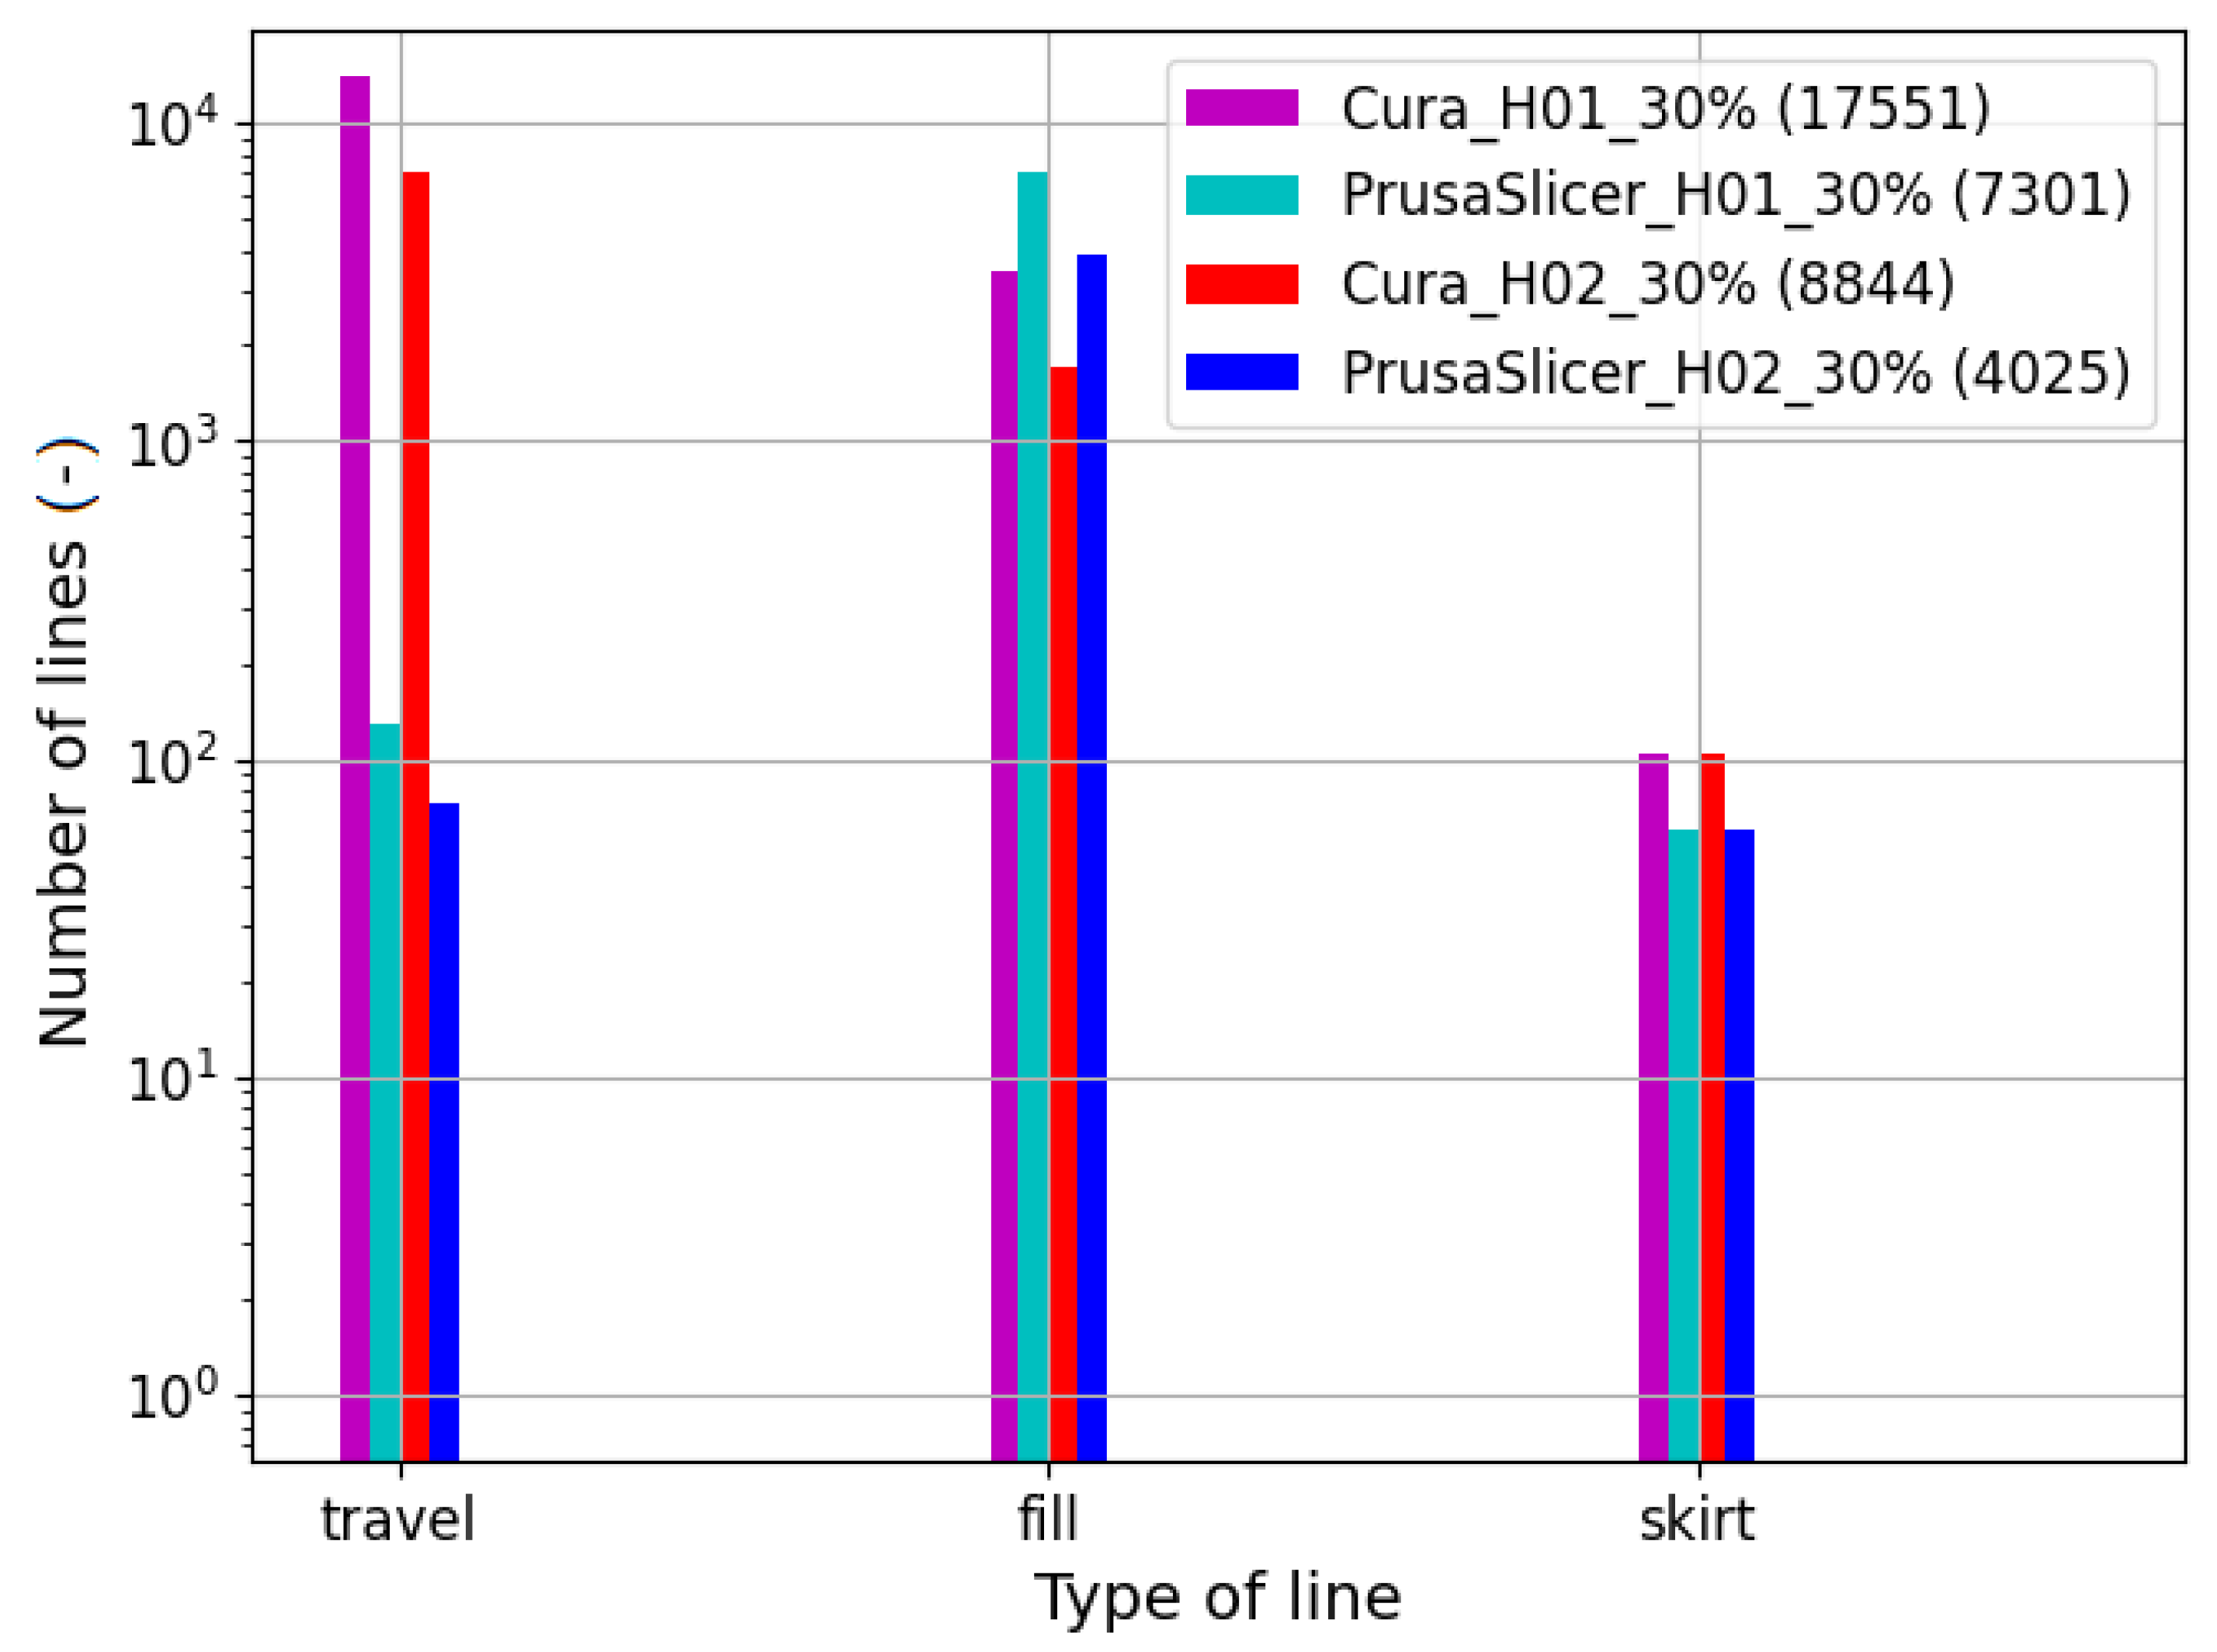
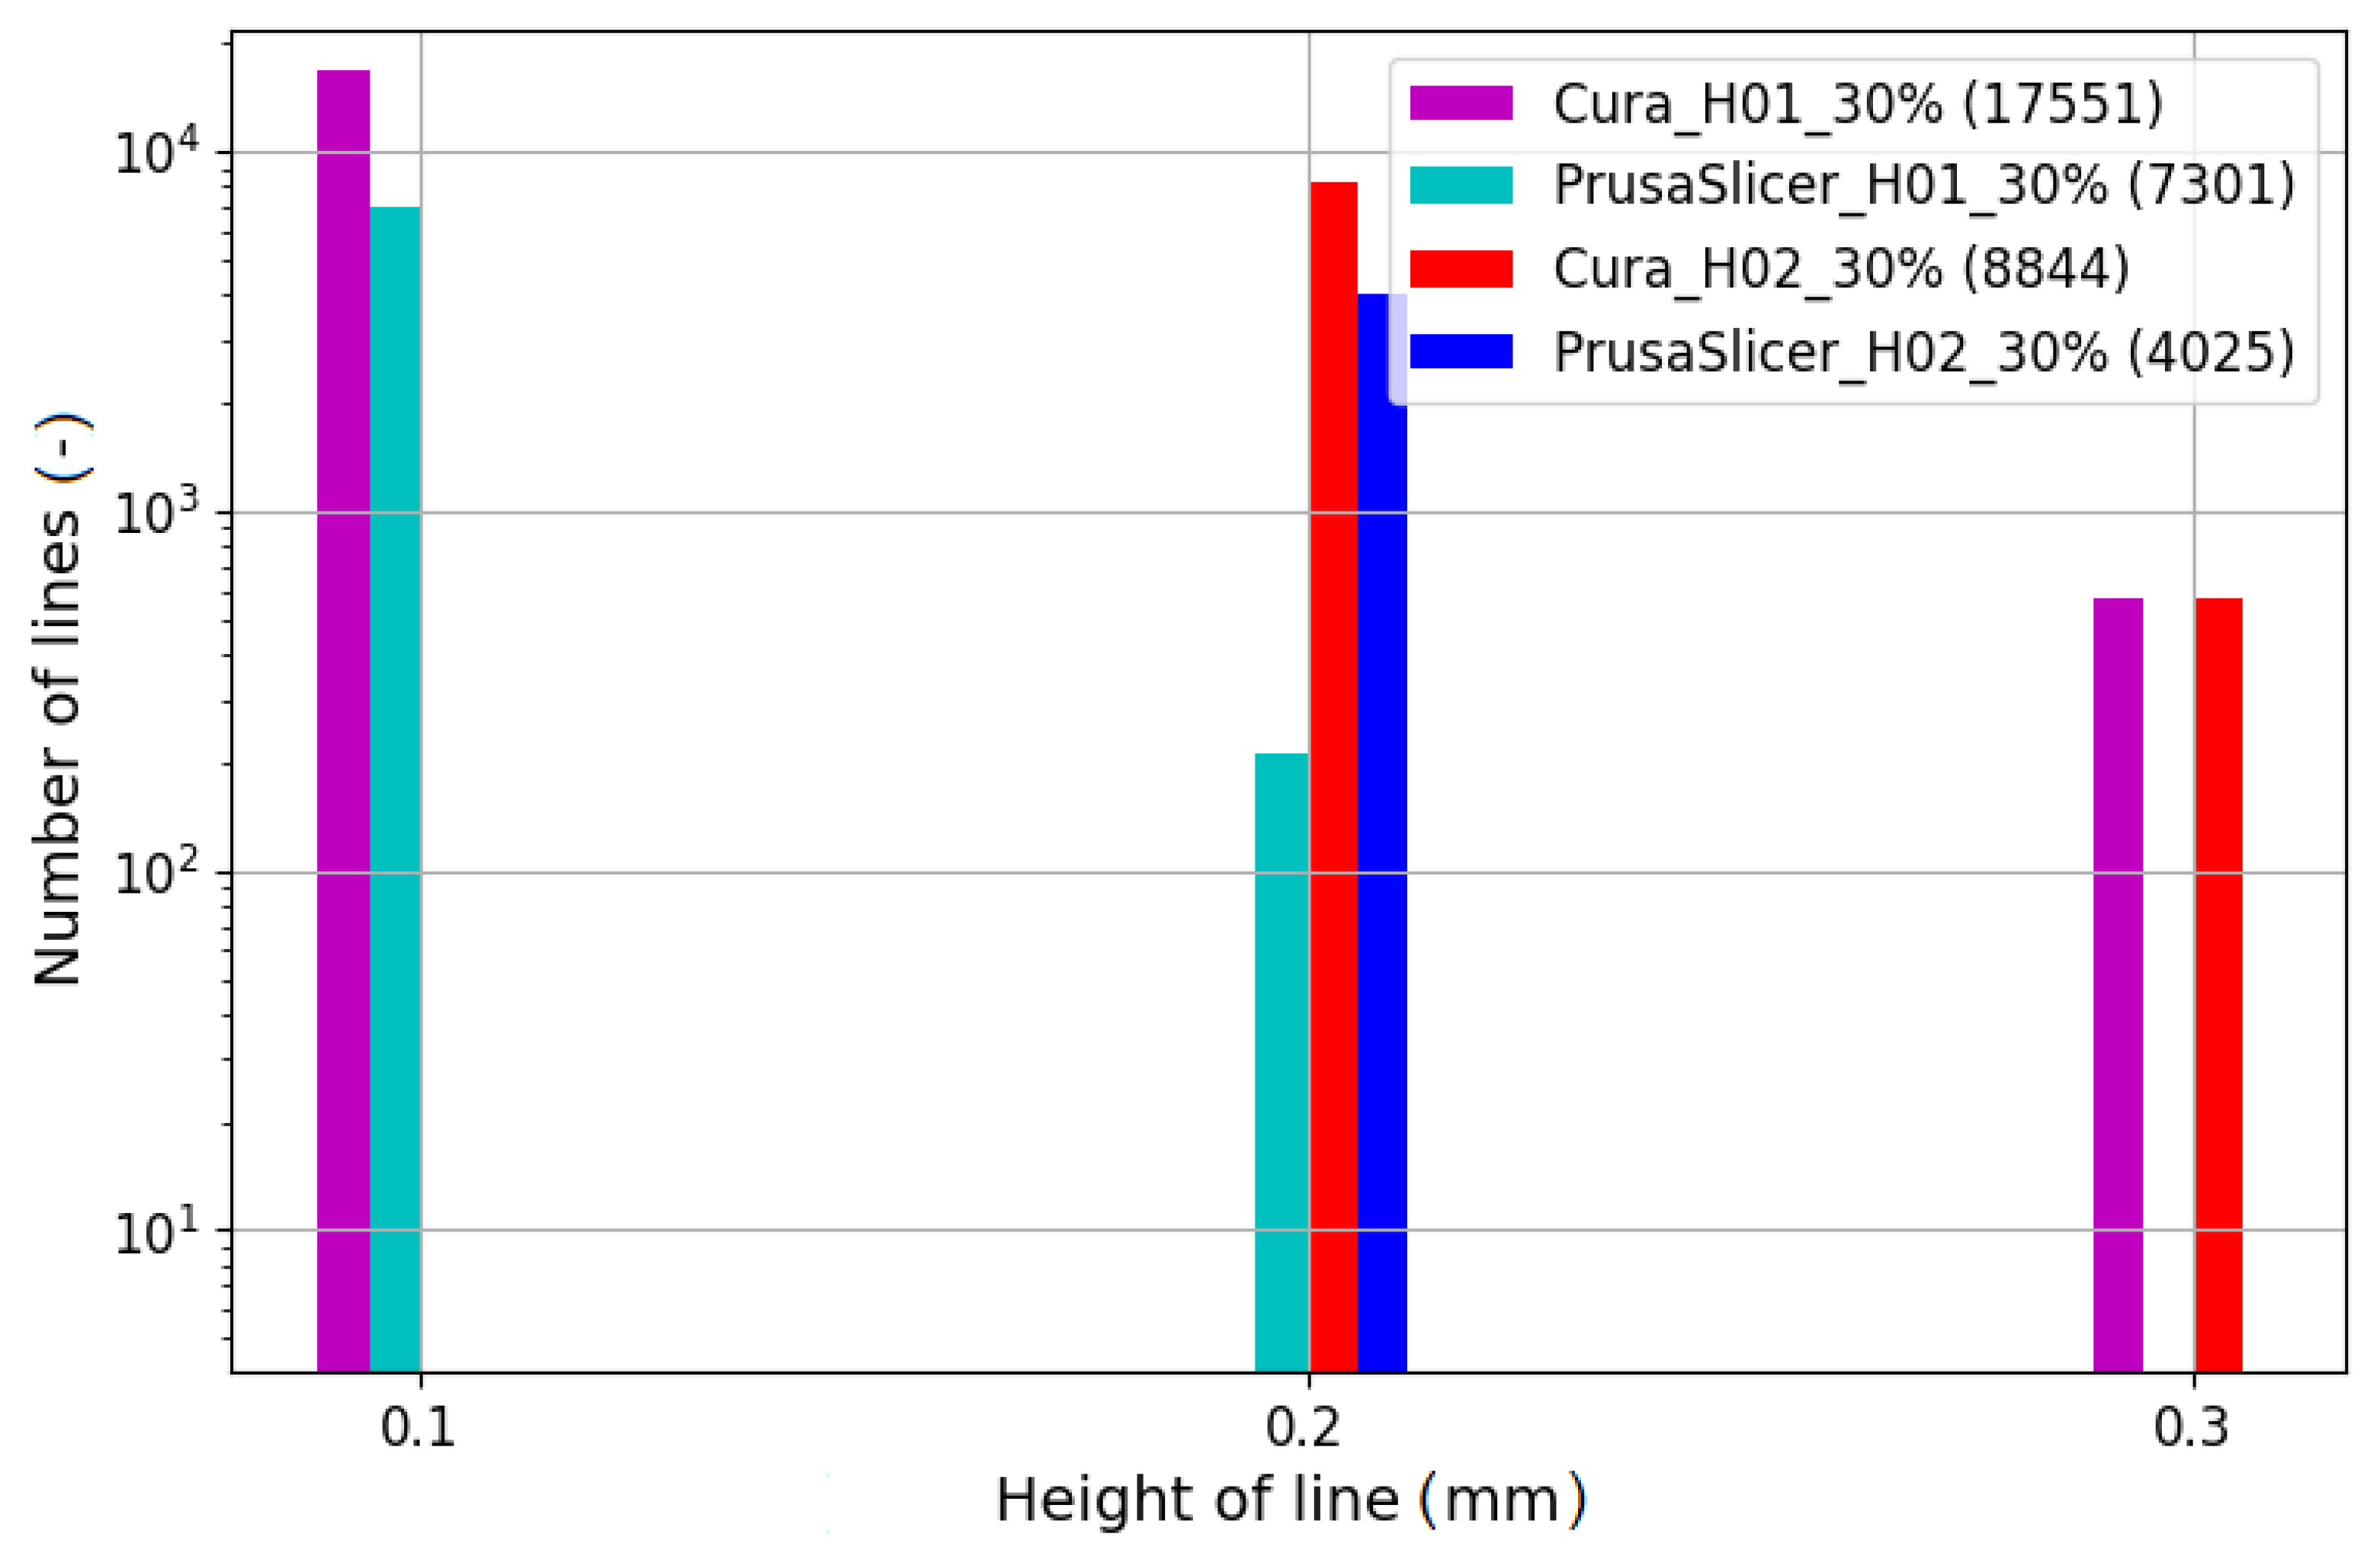
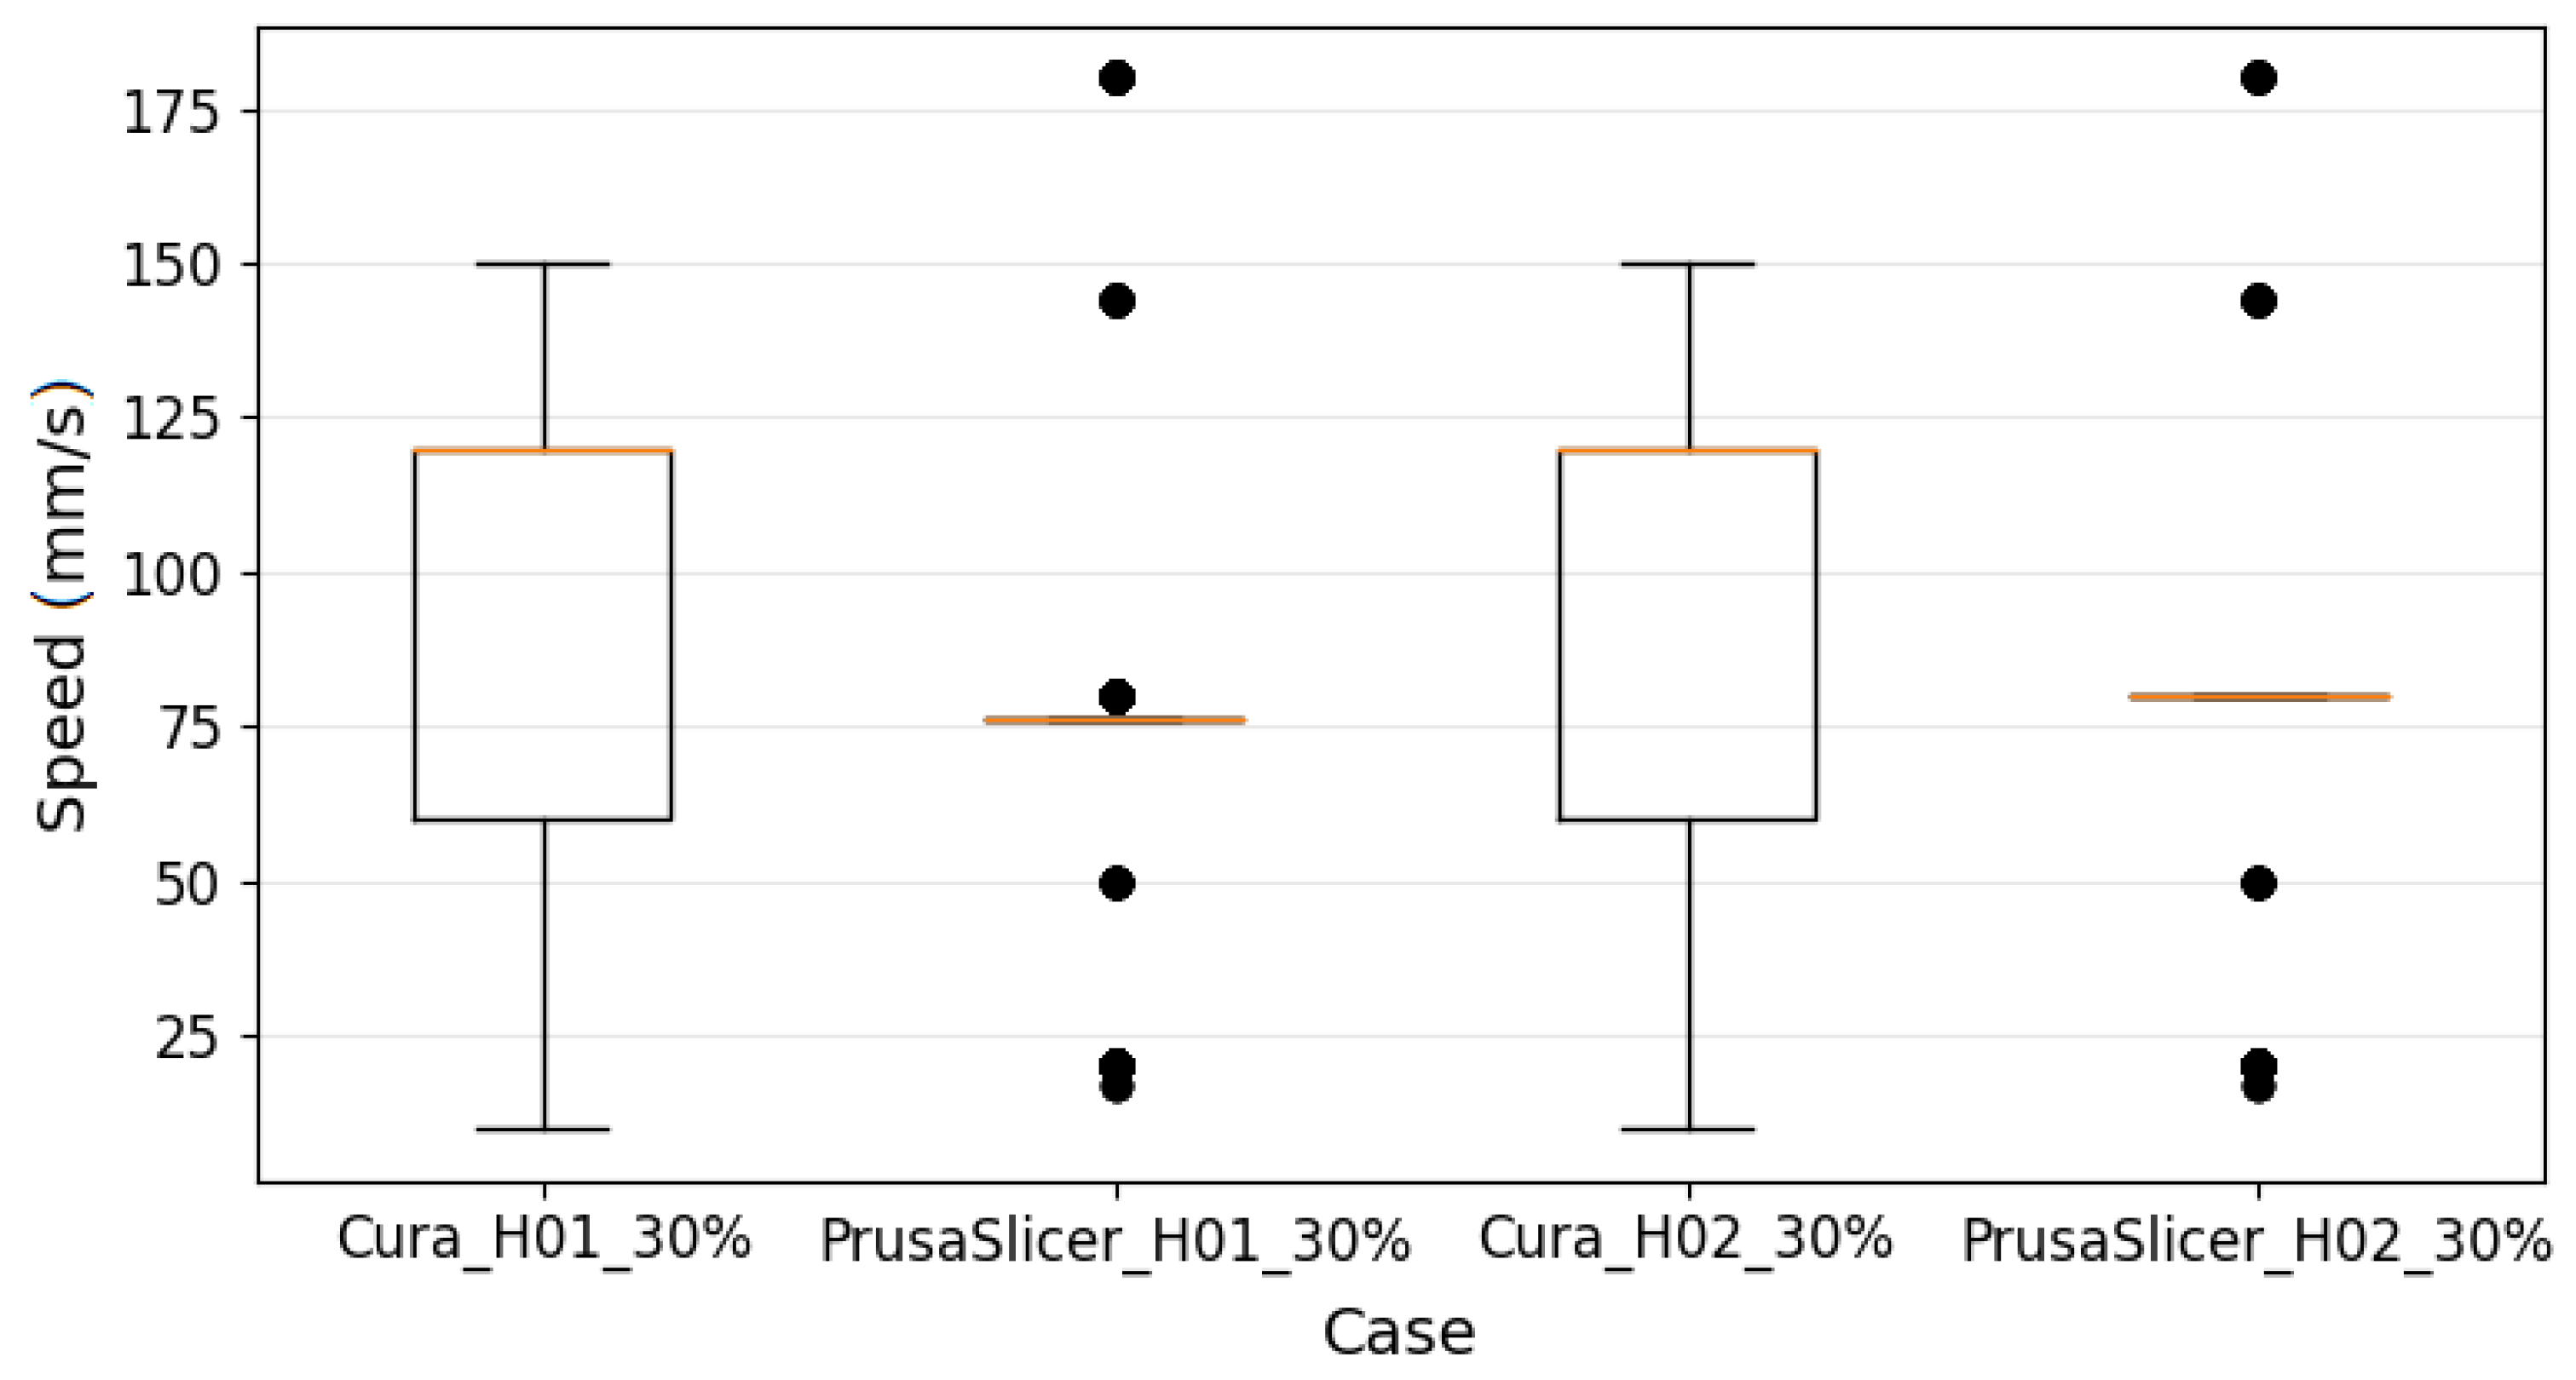
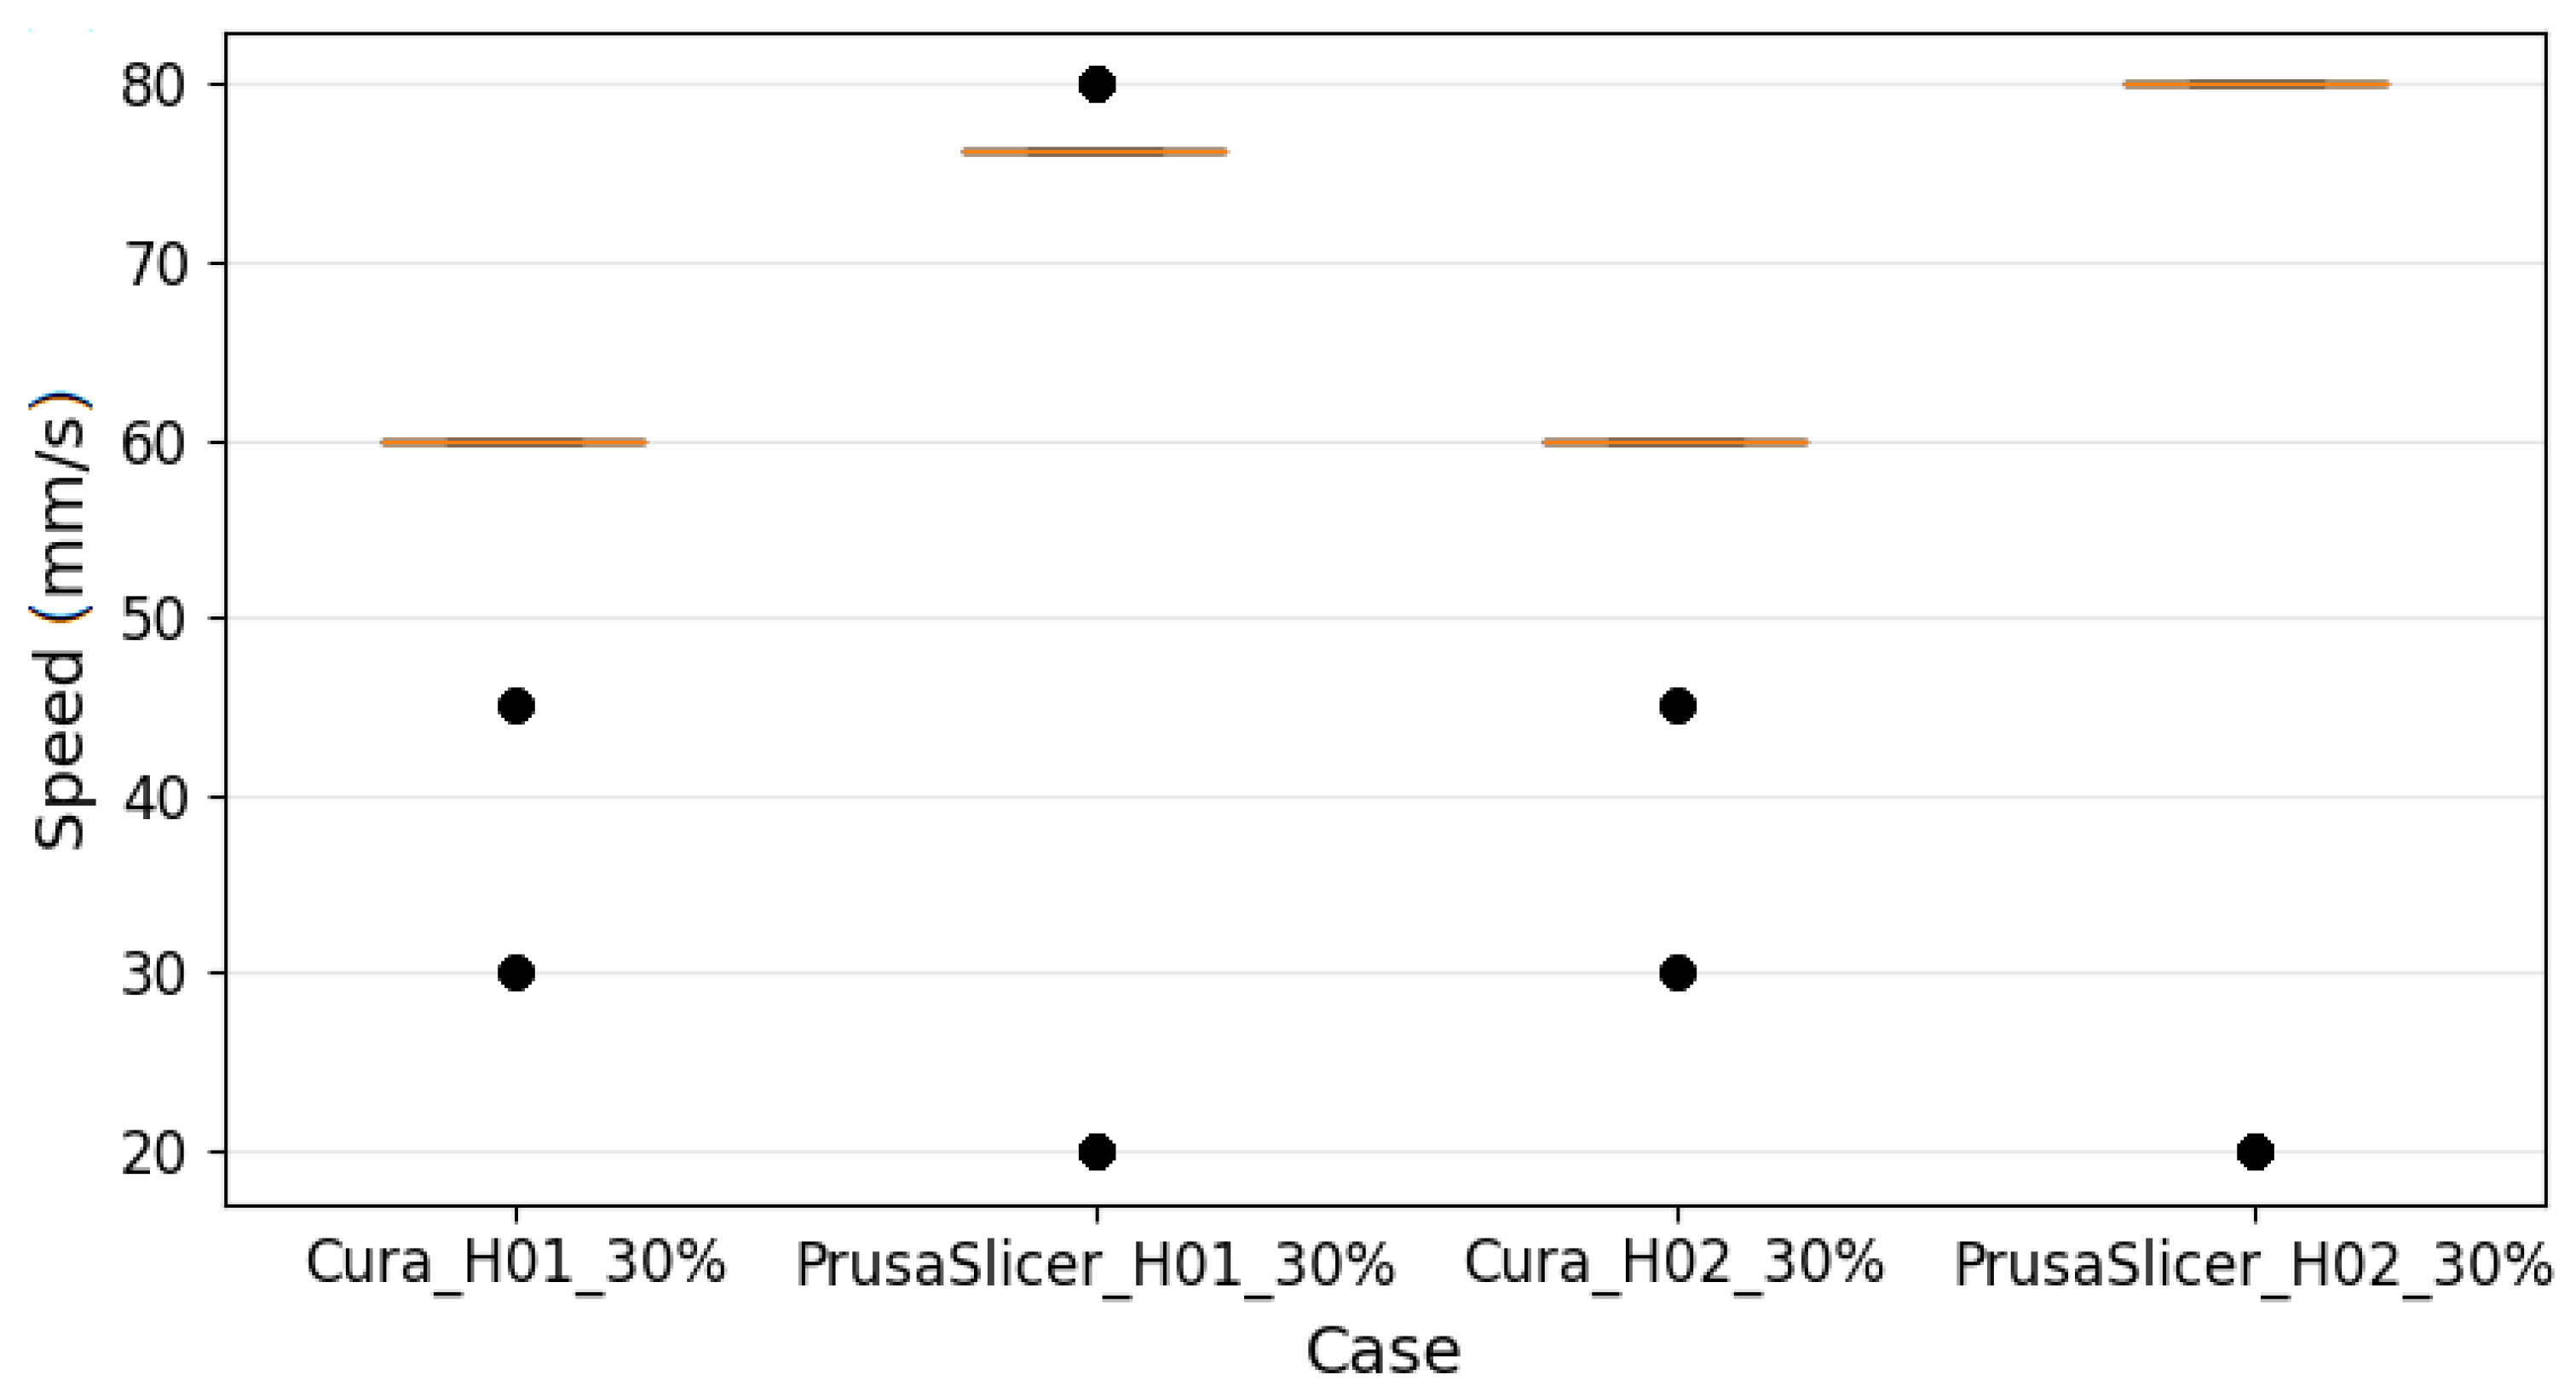
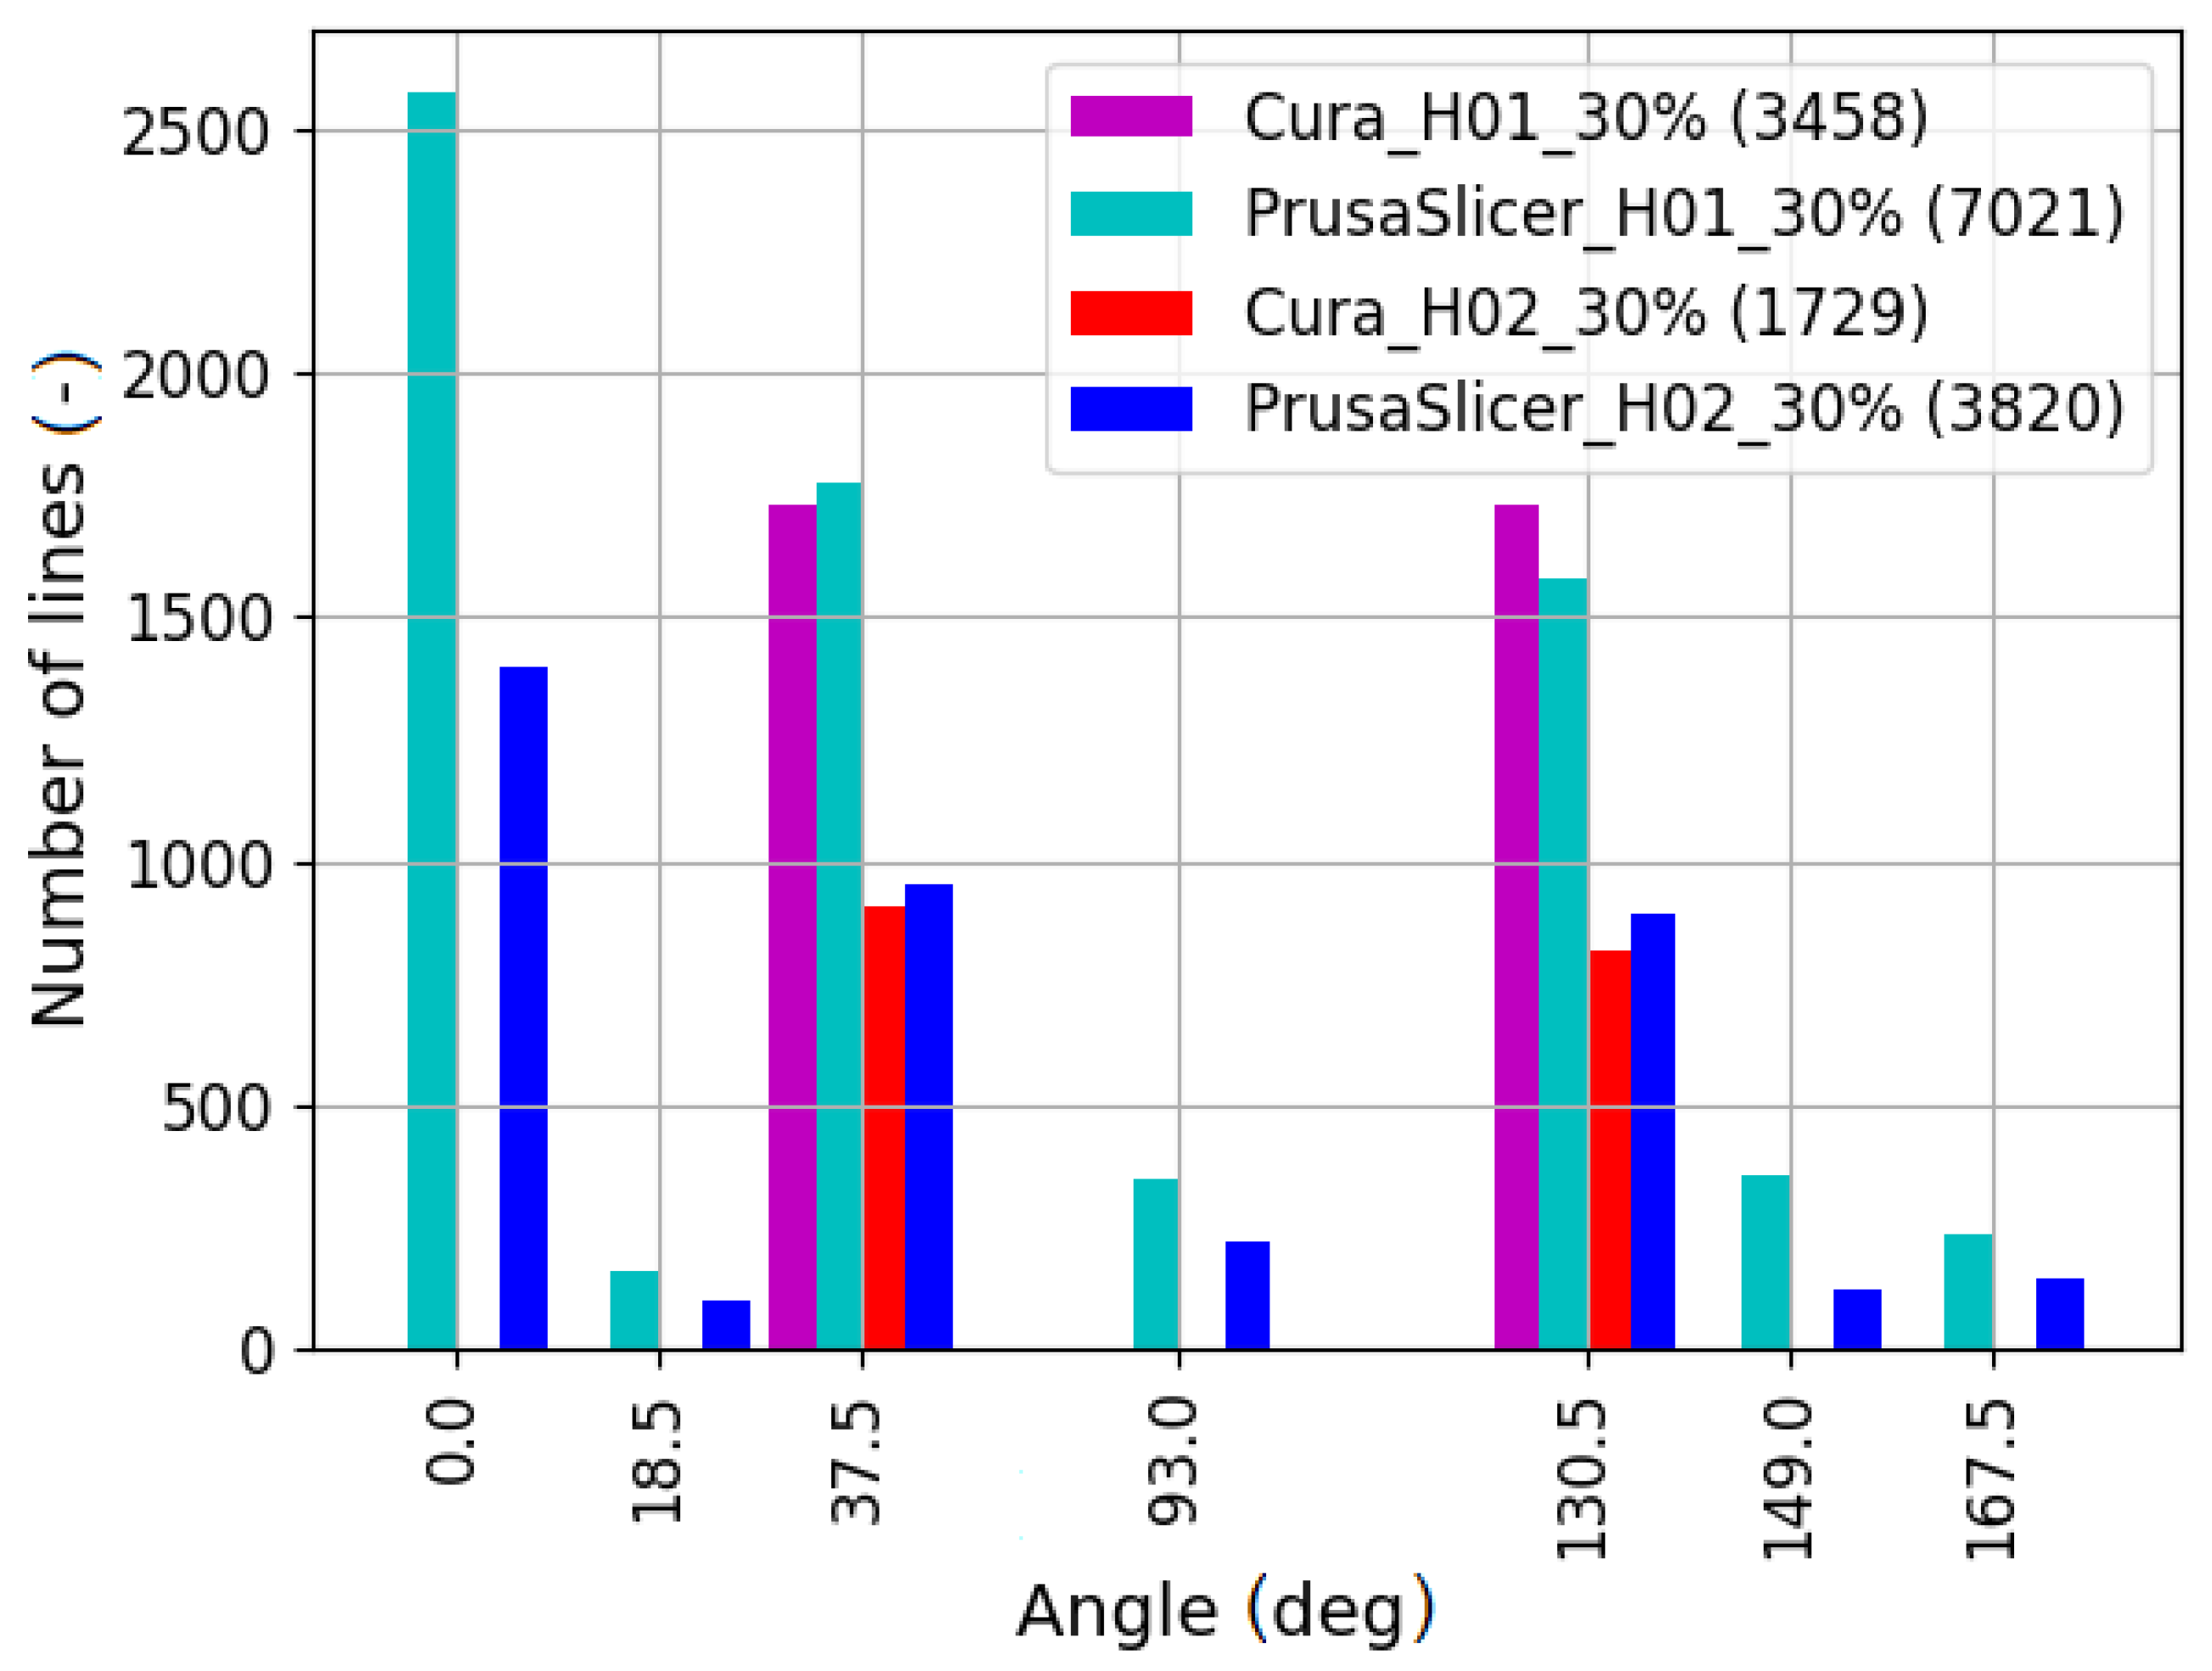
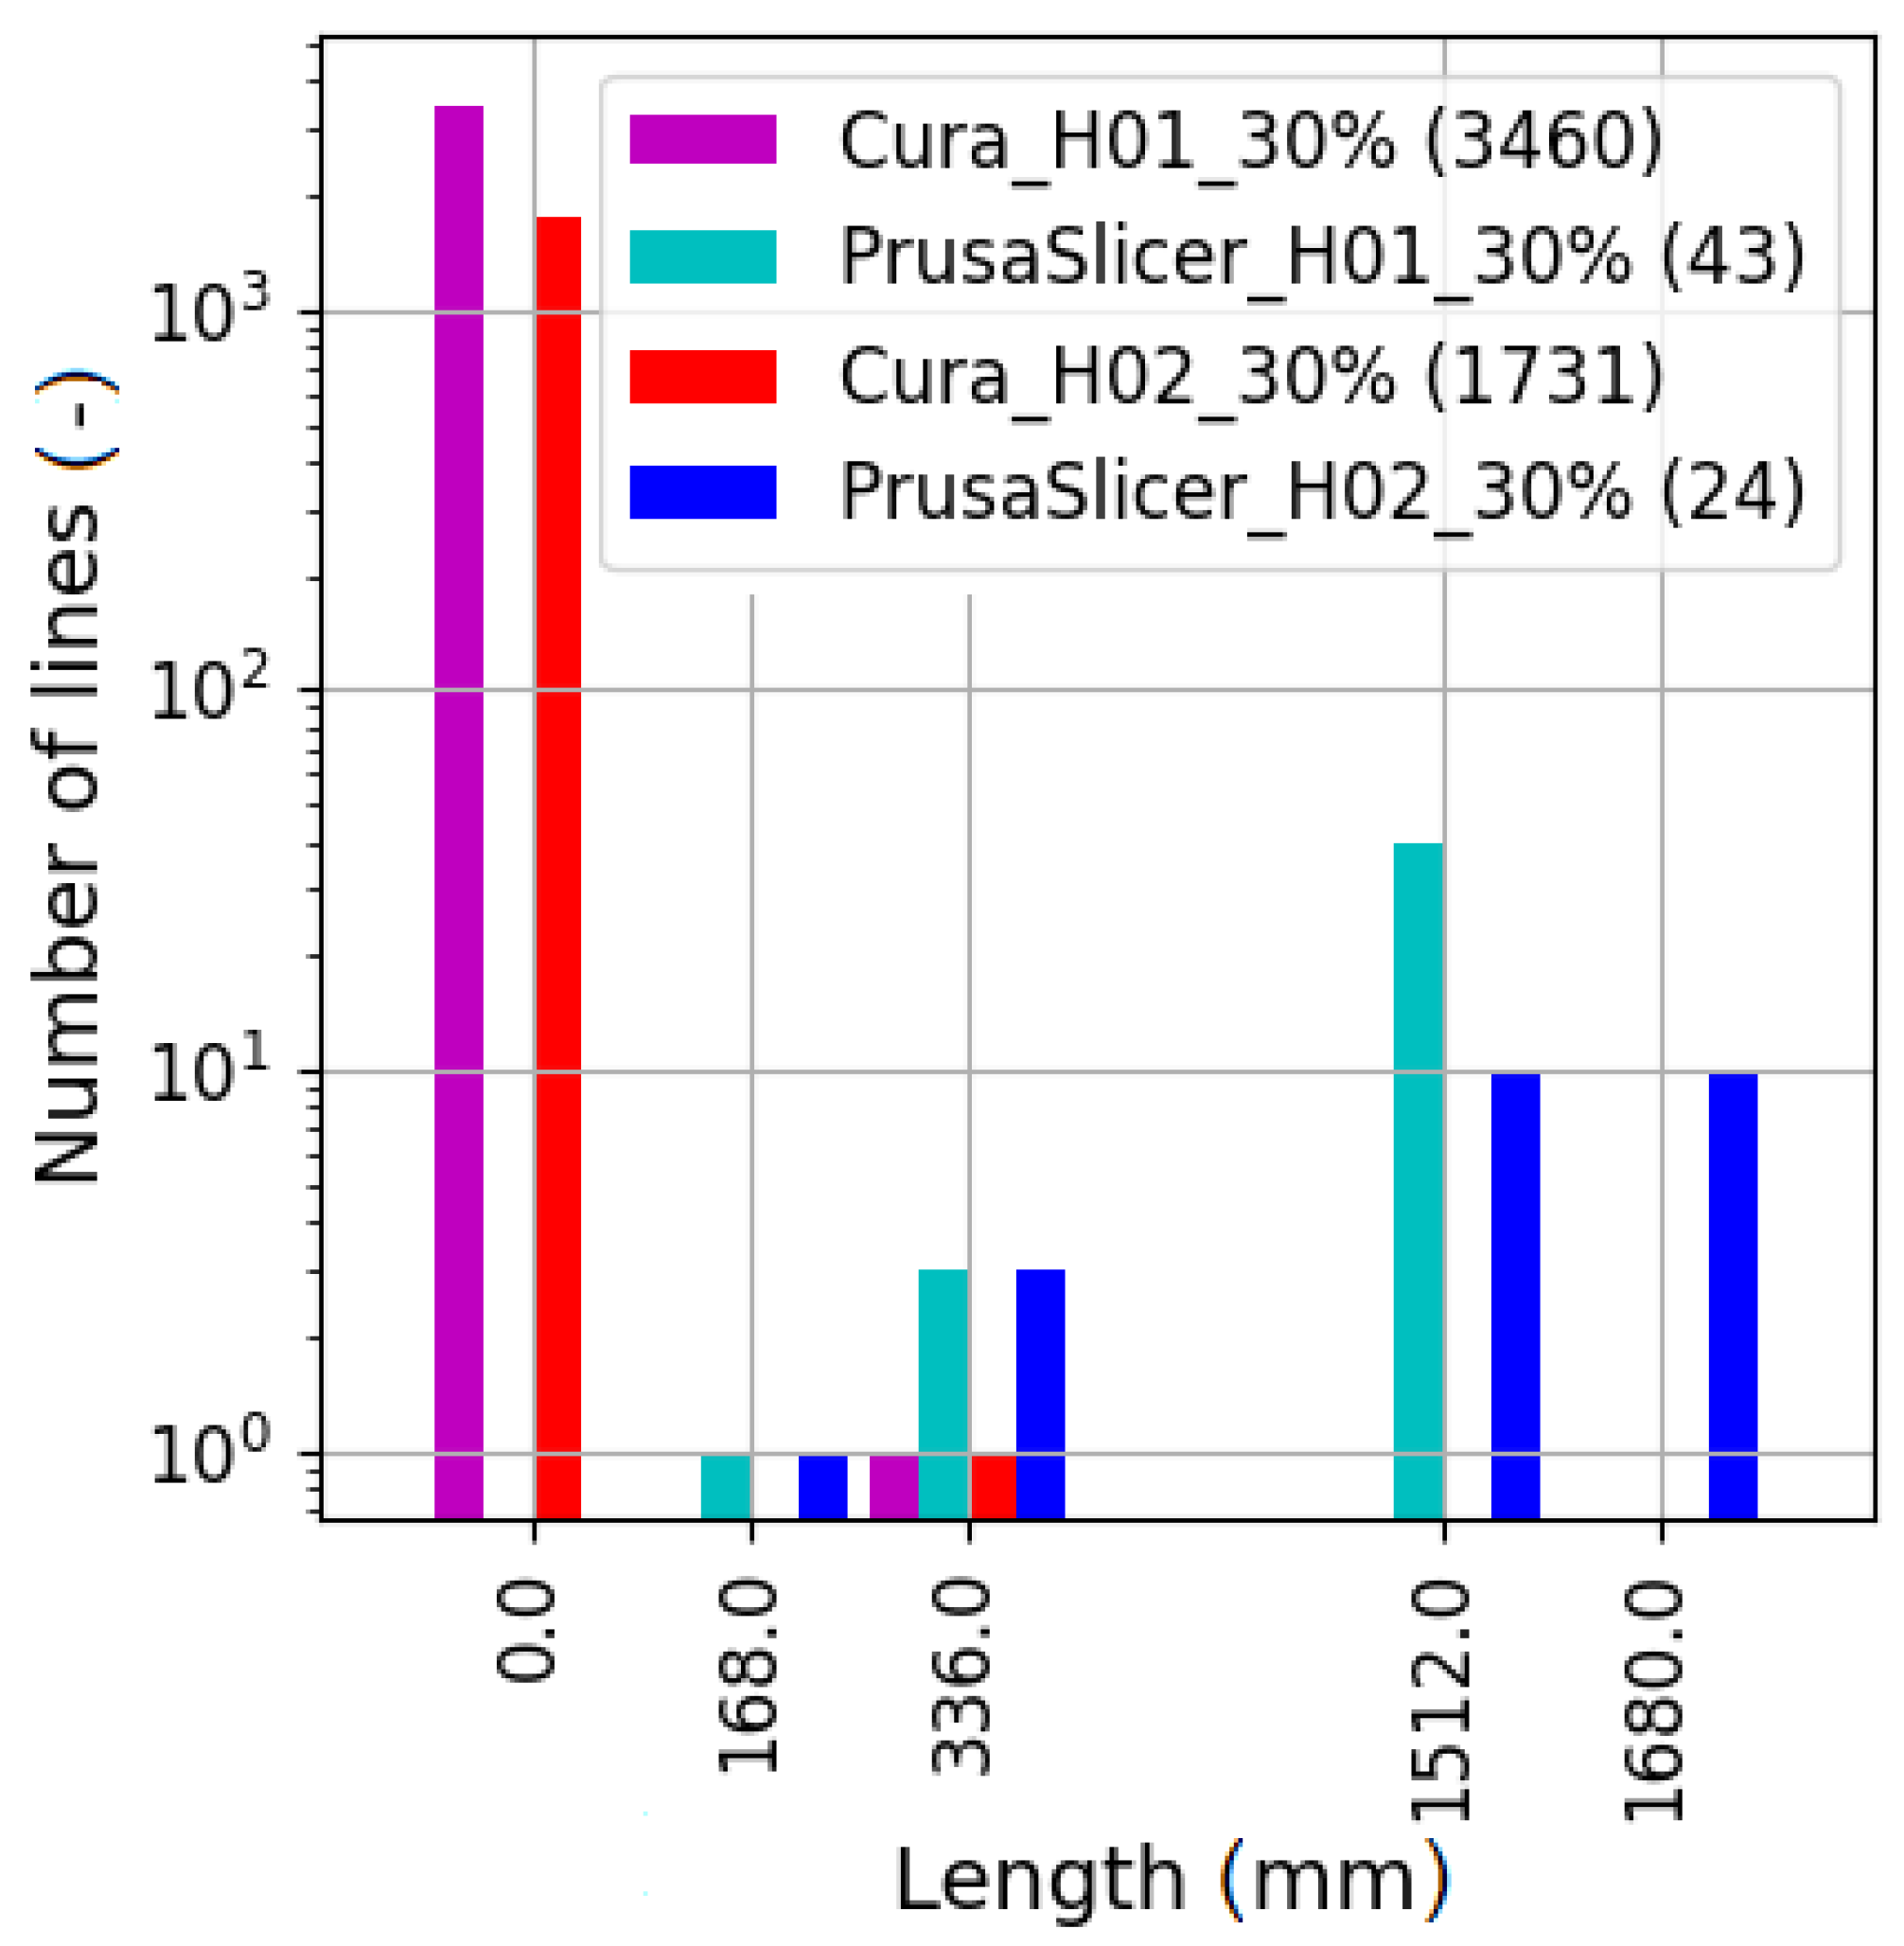
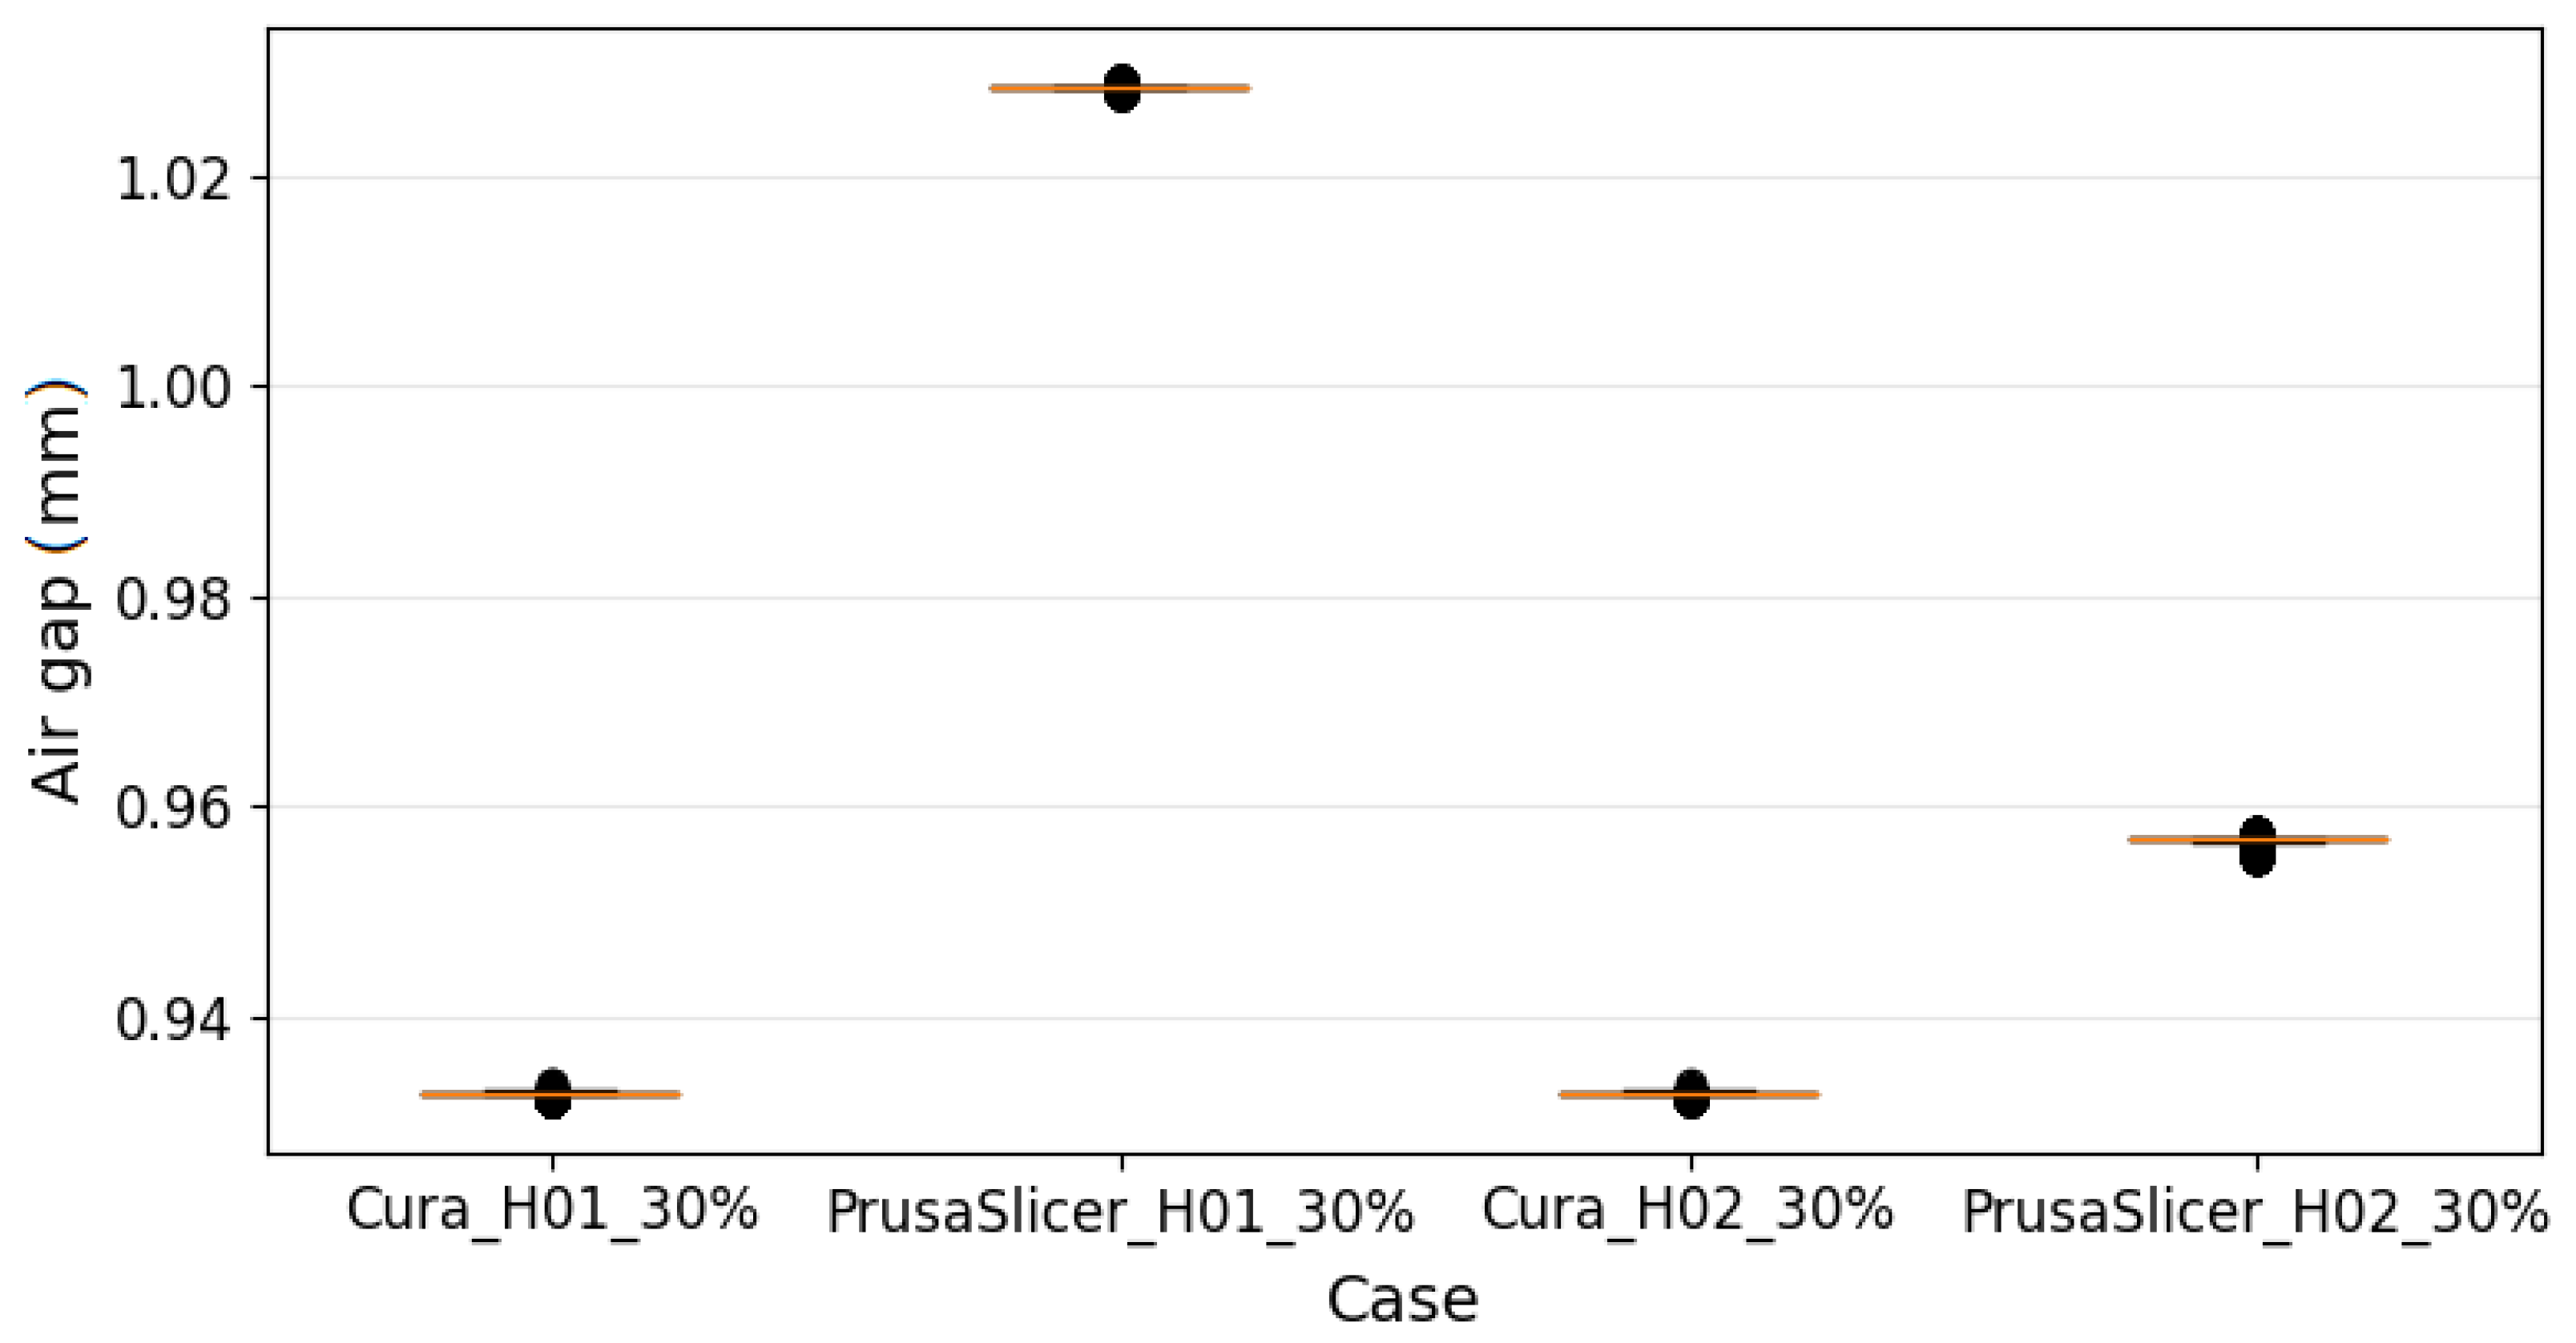
3.1. Referential Case of 30% Infill

This section presents the results, i.e., the identified printing process parameters, for the case of 30% infill. First, the types of generated lines (trajectories) for filament extrusion were analyzed based on the G-code readings. Figure 1 visualizes the numbers of the lines defining the extruder displacements during various operations, i.e., various types of extruder movements:
  • Idle movements of the extruder, i.e., without filament extrusion—option ”travel” in Figure 1;
  • Filling in the inner part of the manufactured component—option ”fill” in Figure 1;
  • Printing the outer surfaces of the component—option ”skirt” in Figure 1.
The option ”skirt” is responsible for the preparation of the contour around the printed element. Its main purpose is to protect the lower layers from shrinkage due to draft. As seen in Figure 1, the Cura software generates a significant number of idle movements, i.e., without extrusion. Additionally, this software generates more than twice as many lines in total compared to the PrusaSlicer.
Figure 2 shows the contribution of the lines of various heights. The height of the fibers was kept constant for the selected layer. It can be seen that for PrusaSlicer, the height of the first layer was always 0.2 mm, while for Cura, it equaled 0.3 mm. Based on these data, adequate changes were made regarding the Cura settings, as described in Section 2.3 (Table 1, Point 1).
Table 3 reports the population of the generated lines in terms of the extruder temperature. Again, adequate changes described in Section 2.3 (Table 1, Point 4) regarding the mentioned temperature were applied to the slicer settings.
Figure 3 reports the speeds of the print head. Making use of box plots, differences in the settings of both slicers were identified. In all box plots in the paper, the following symbols were introduced to visualize the outliers: circles mark the outliers that are outside of the range [ Q 1 1.5 × ( Q 3 Q 1 ) , Q 3 + 1.5 × ( Q 3 Q 1 ) ] ; dots denote the so-called extreme outliers that do not fall into the range [ Q 1 3 × ( Q 3 Q 1 ) , Q 3 + 3 × ( Q 3 Q 1 ) ] . Q 1 , Q 2 , and Q 3 are respectively the first, second, and third quartiles. Nonetheless, the results presented in Figure 3 and other box plots found in the following part of the paper should not be considered in a statistical way. This statement especially applies to the bounding values, which are not outliers in a statistical sense. The data shown in the mentioned figures represent the results of the operation of the deterministic (meaning repeatable) algorithms implemented in the slicers.
Based on the read values of the printing speed and idle movements from PrusaSlicer, the required changes were introduced to the Cura software with the median value found from the G-code generated by PrusaSlicer. The updated values can be found in (Table 1, Points 6–8).
It is important to note that the subsequent plots for the results were generated for the option “fill” lines only—as denoted in Figure 1. The investigation of the printing process’ parameters considering only the mentioned “ fill” case of lines allows for a more precise determination of the printing speed since it refers to the periods of actual manufacturing, i.e., with the ensured extrusion of a filament. Hence, Figure 4 was prepared as a modified version of Figure 3, excluding both the idle mode of the print head (option “ travel”) and printing the outer surfaces of the component (option “ skirt”). A slightly lower printing speed was also found for the G-code generated by PrusaSlicer for the layer height of 0.1 mm. Hence, an adequate correction was considered, as listed in Table 1 in the comments for Point 6.
Figure 5 visualizes the variation of the angle for the generated lines. For the Cura software, depending on the layer, all line slopes are either 45 or 135 , which are covered by the ranges denoted by the center values 37 . 5 and 130 . 5 , respectively. In the case of PrusaSlicer, the values were more scattered; however, the angles 0 , 45 , and 135 dominated.
Figure 6 shows the total length of the lines for continuous extrusion. Based on the presented results, it can be found that for PrusaSlicer, the extruding of fibers for a single layer was practically carried out in a continuous mode, without idle movements.
The analysis of the printed component visualizations for both slicers showed that in the case of PrusaSlicer, additional lines connecting the fibers were printed at the angles of 45 and 135 . Hence, to activate adequate connections between the filament’s fibers, the required changes were also made in the Cura software, as referenced in Table 1 in Point 3. The structure comparison for both slicers, for a sample with a layer height of 0.2 mm and 30% infill, can be seen in Figure 7.
Based on Equation (6), the fiber fill factor was determined. An adequate box plot is shown in Figure 8. In the case of PrusaSlicer, the factor depends on the layer height. The identified values of the parameter percentage volumetric fill are presented in Table 2. Appropriate changes were made in the Cura software, as presented in Table 2.
Figure 9 presents the distances between the fibers in the layers considered separately, i.e., the in-plane measures were of concern. Moreover, only the fibers inclined at the angles of 45 and 135 were taken into account. Similar to the previous case, for PrusaSlicer, the investigated quantity depends on the layer height. The values of the respective coefficients “infill” and “infill distance” are provided in Table 2. The medians for the distances between the axes of the neighboring fibers were determined by introducing the nozzle diameter. Consequently, the parameters in Table 2, which were found with the G-code generated by PrusaSlicer, were introduced into Cura as the distances between the fibers—as referenced in Table 2 in Point 2. Although all of the air gaps presented in Figure 9 are positive, it should be noted that some may become negative. The negative air gaps are, however, correct and represent the cases when the print head remained sufficiently close to the printed component. Consequently, the initially round (oval)-shaped filament was intentionally tightly placed on top of the component so that the available space would be filled in the most. In this case, it was expected that the shape of cross-section of the printed fiber would advantageously become similar to a rectangle.

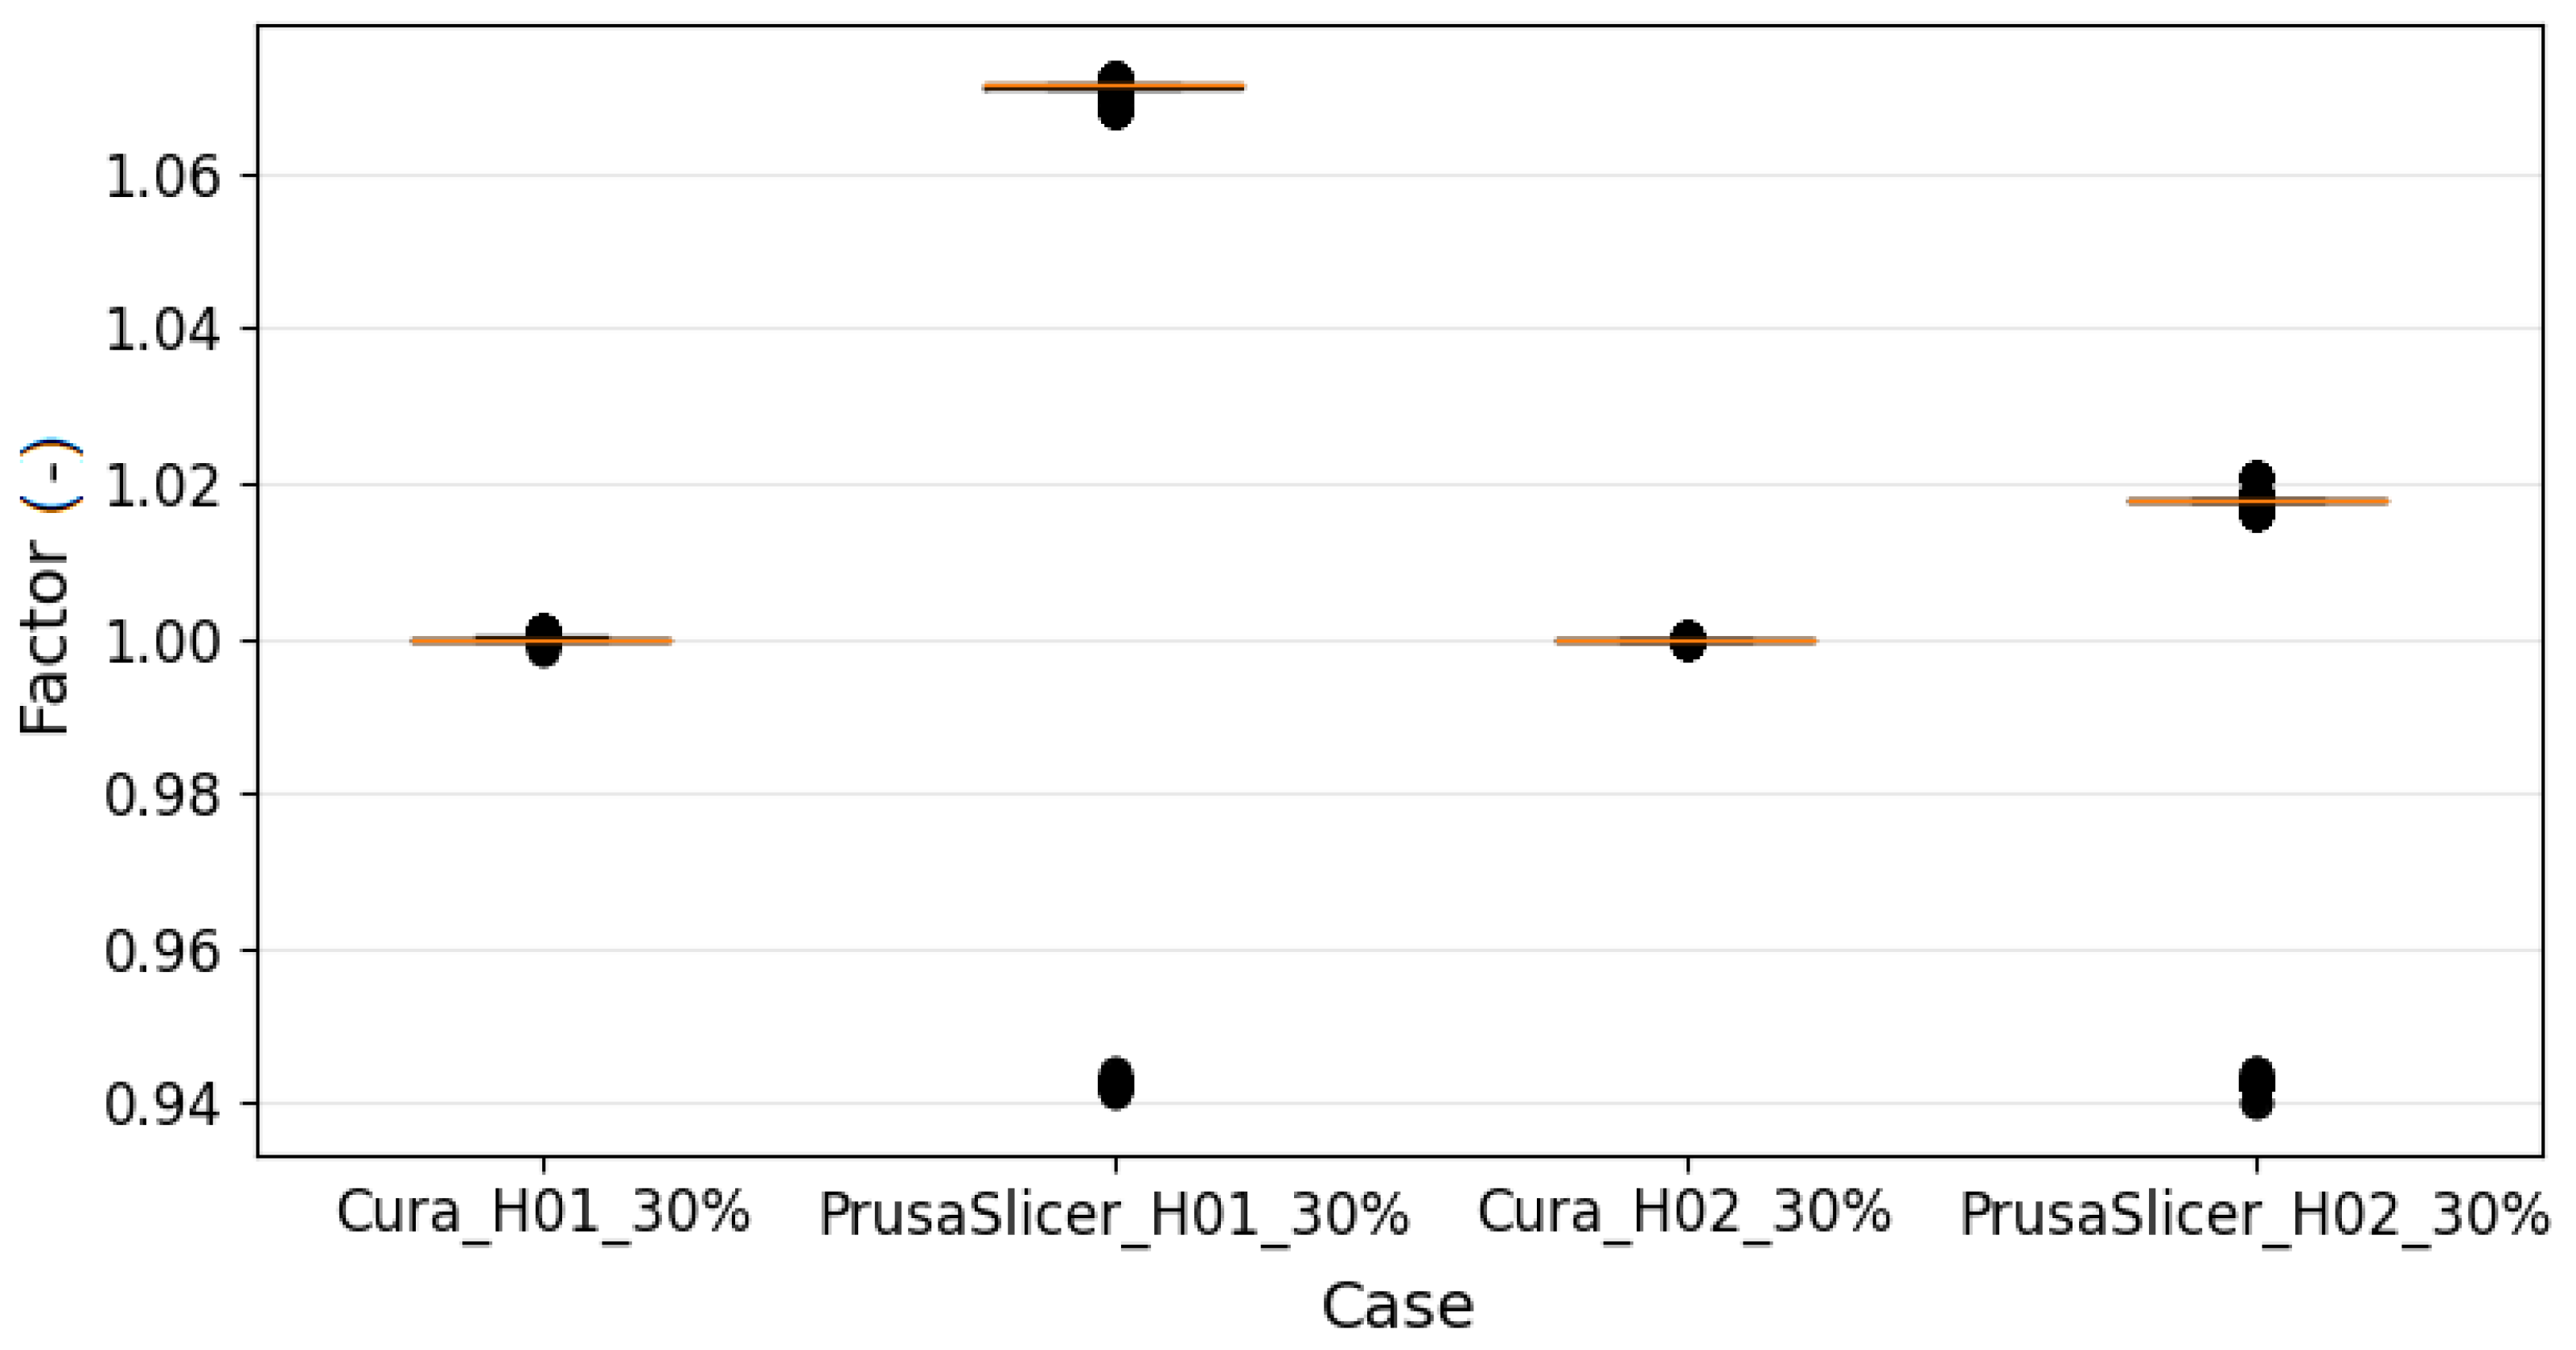
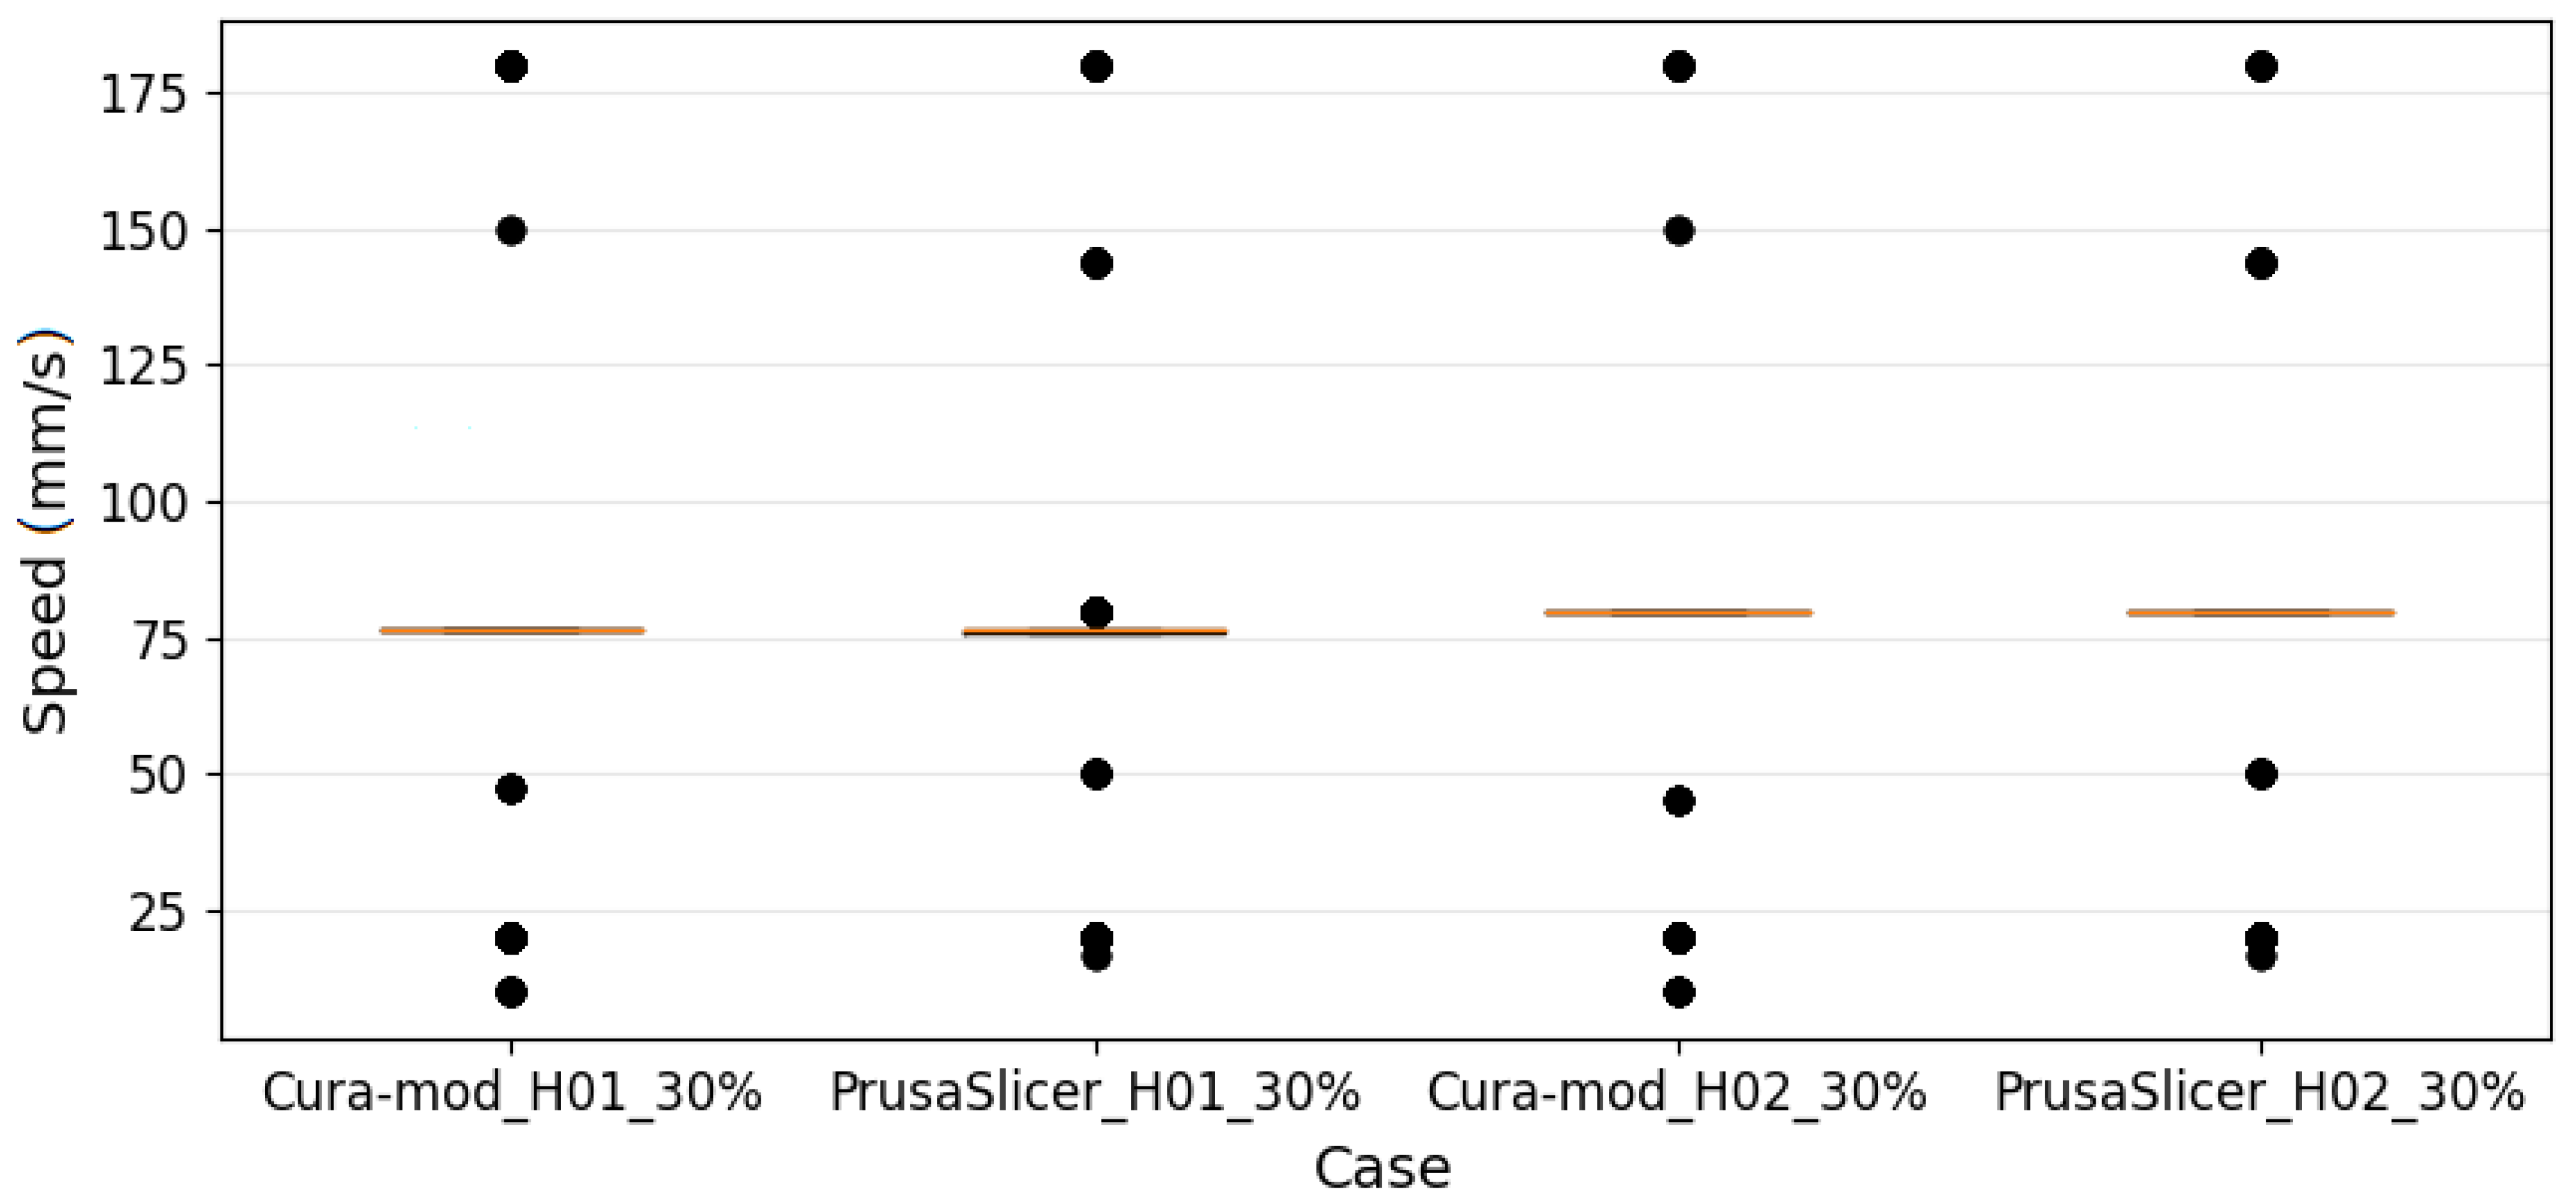
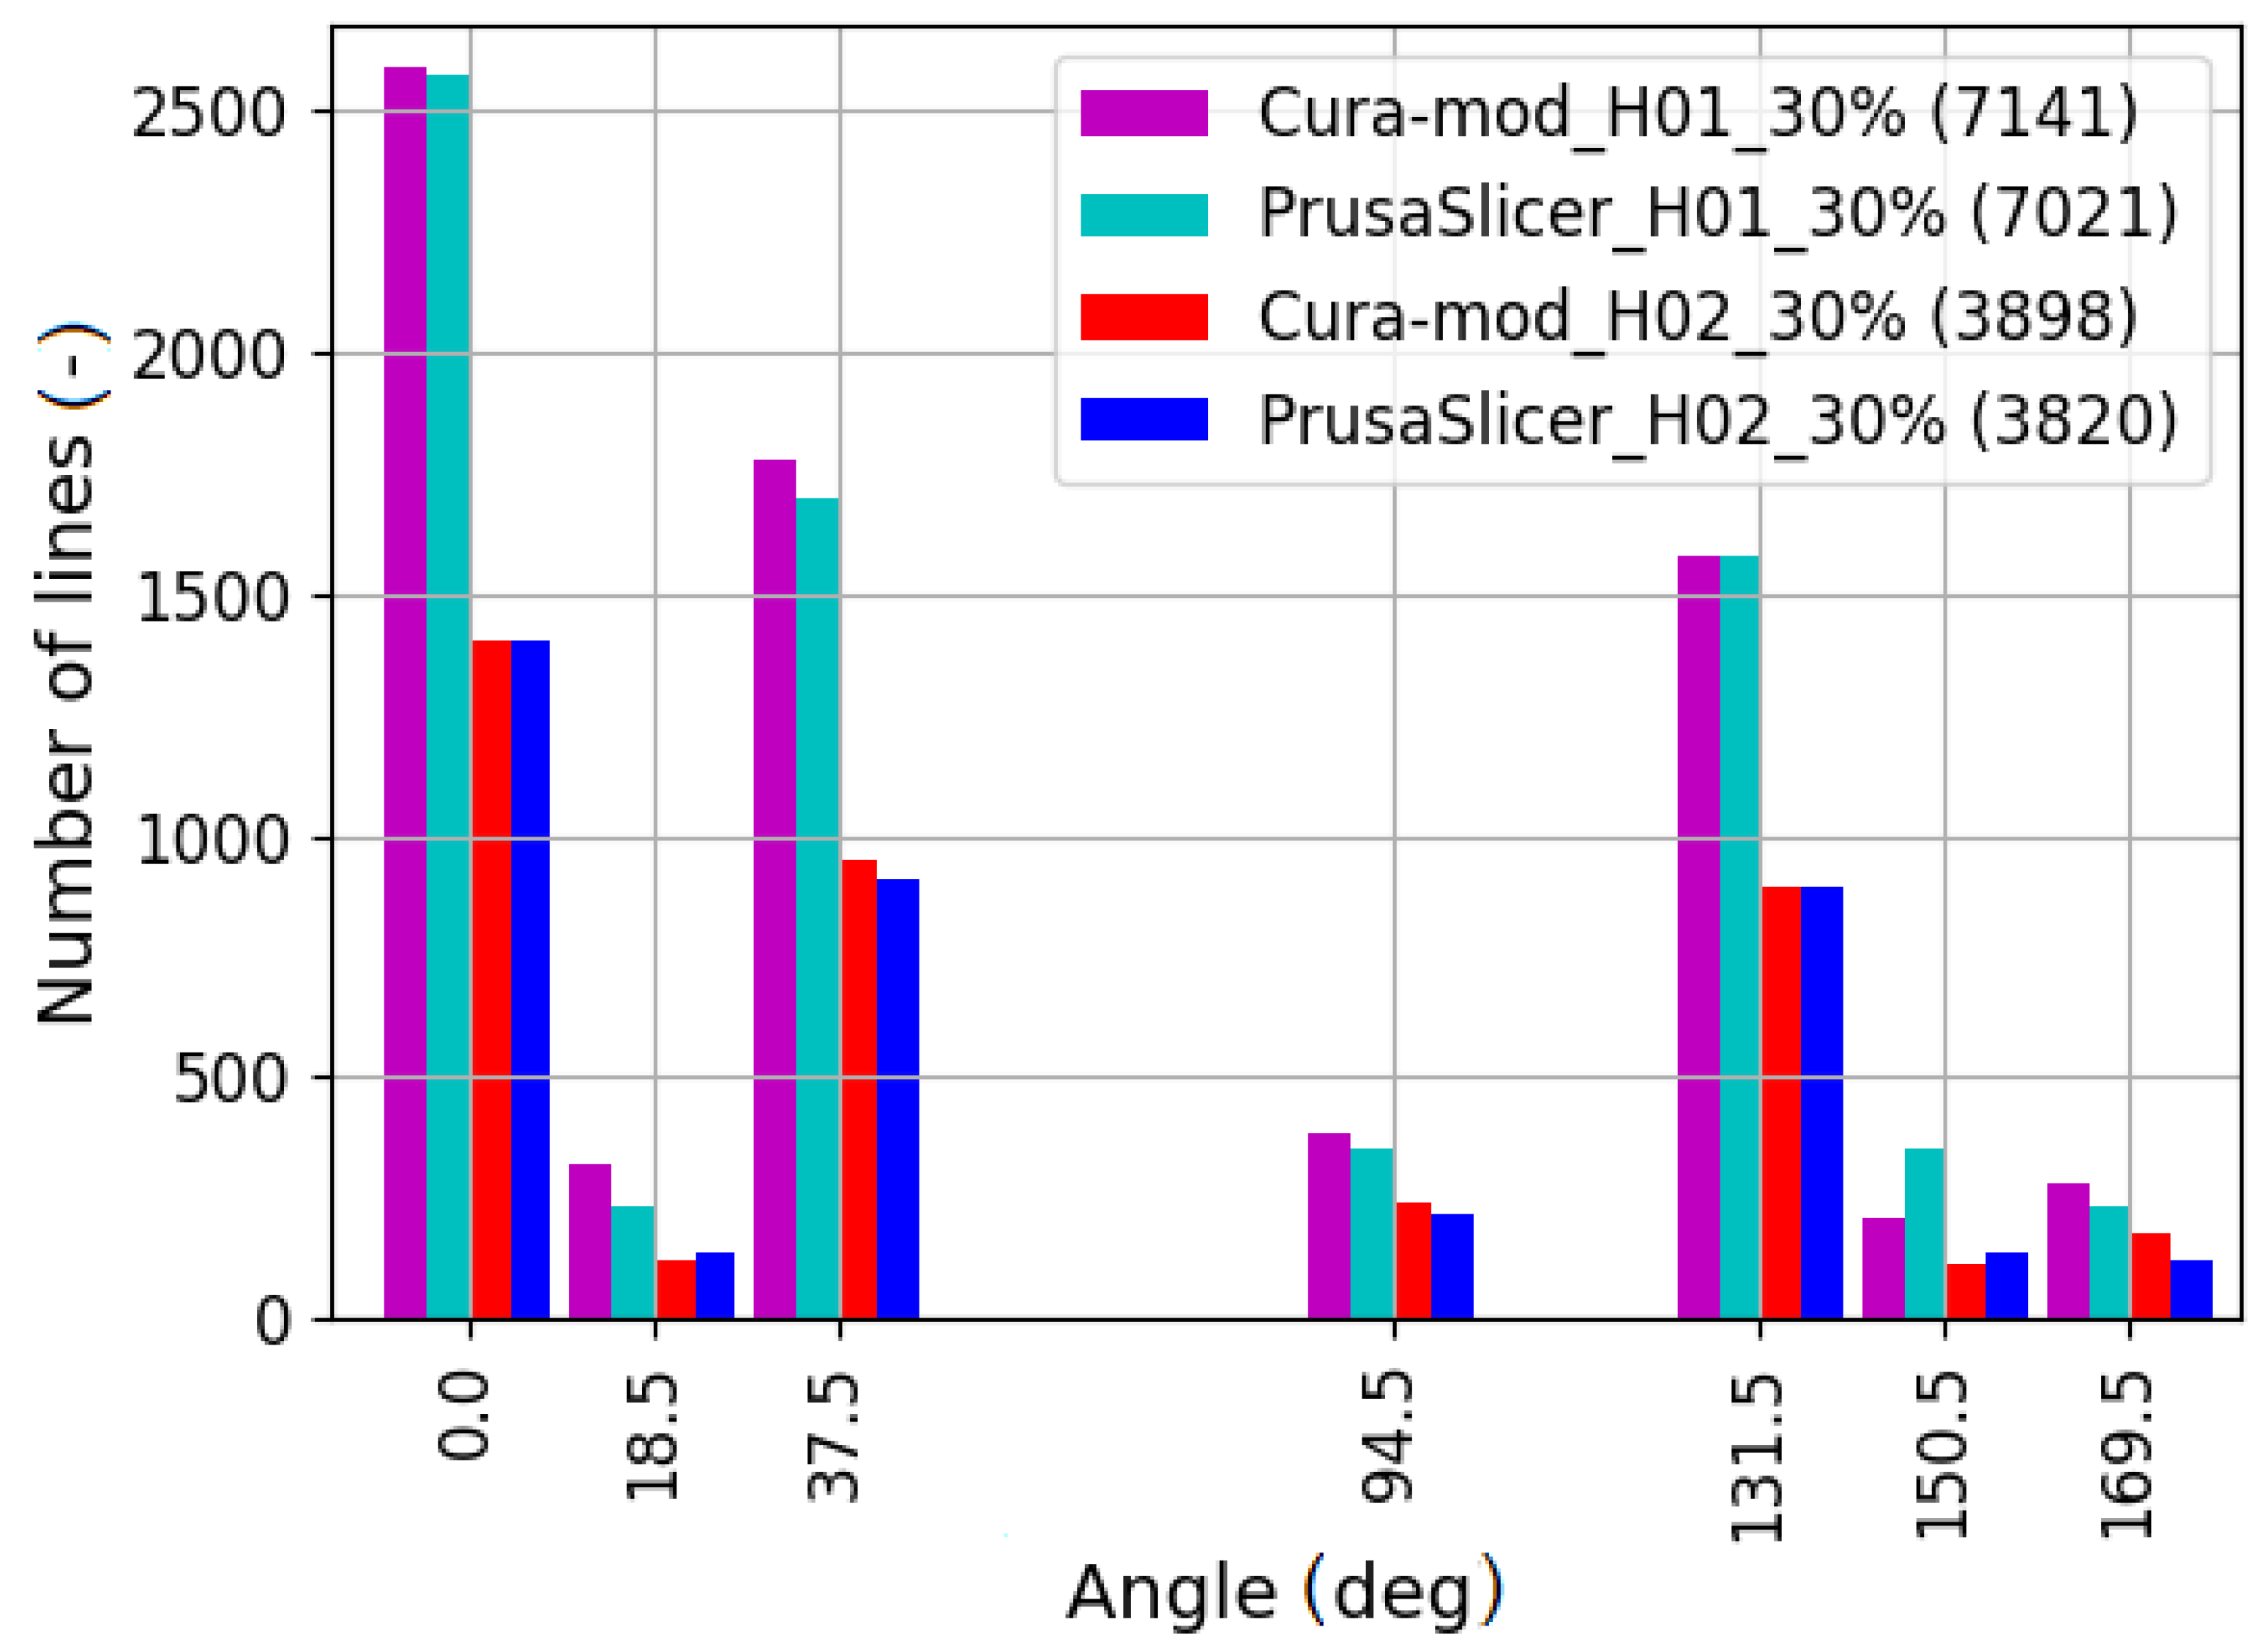
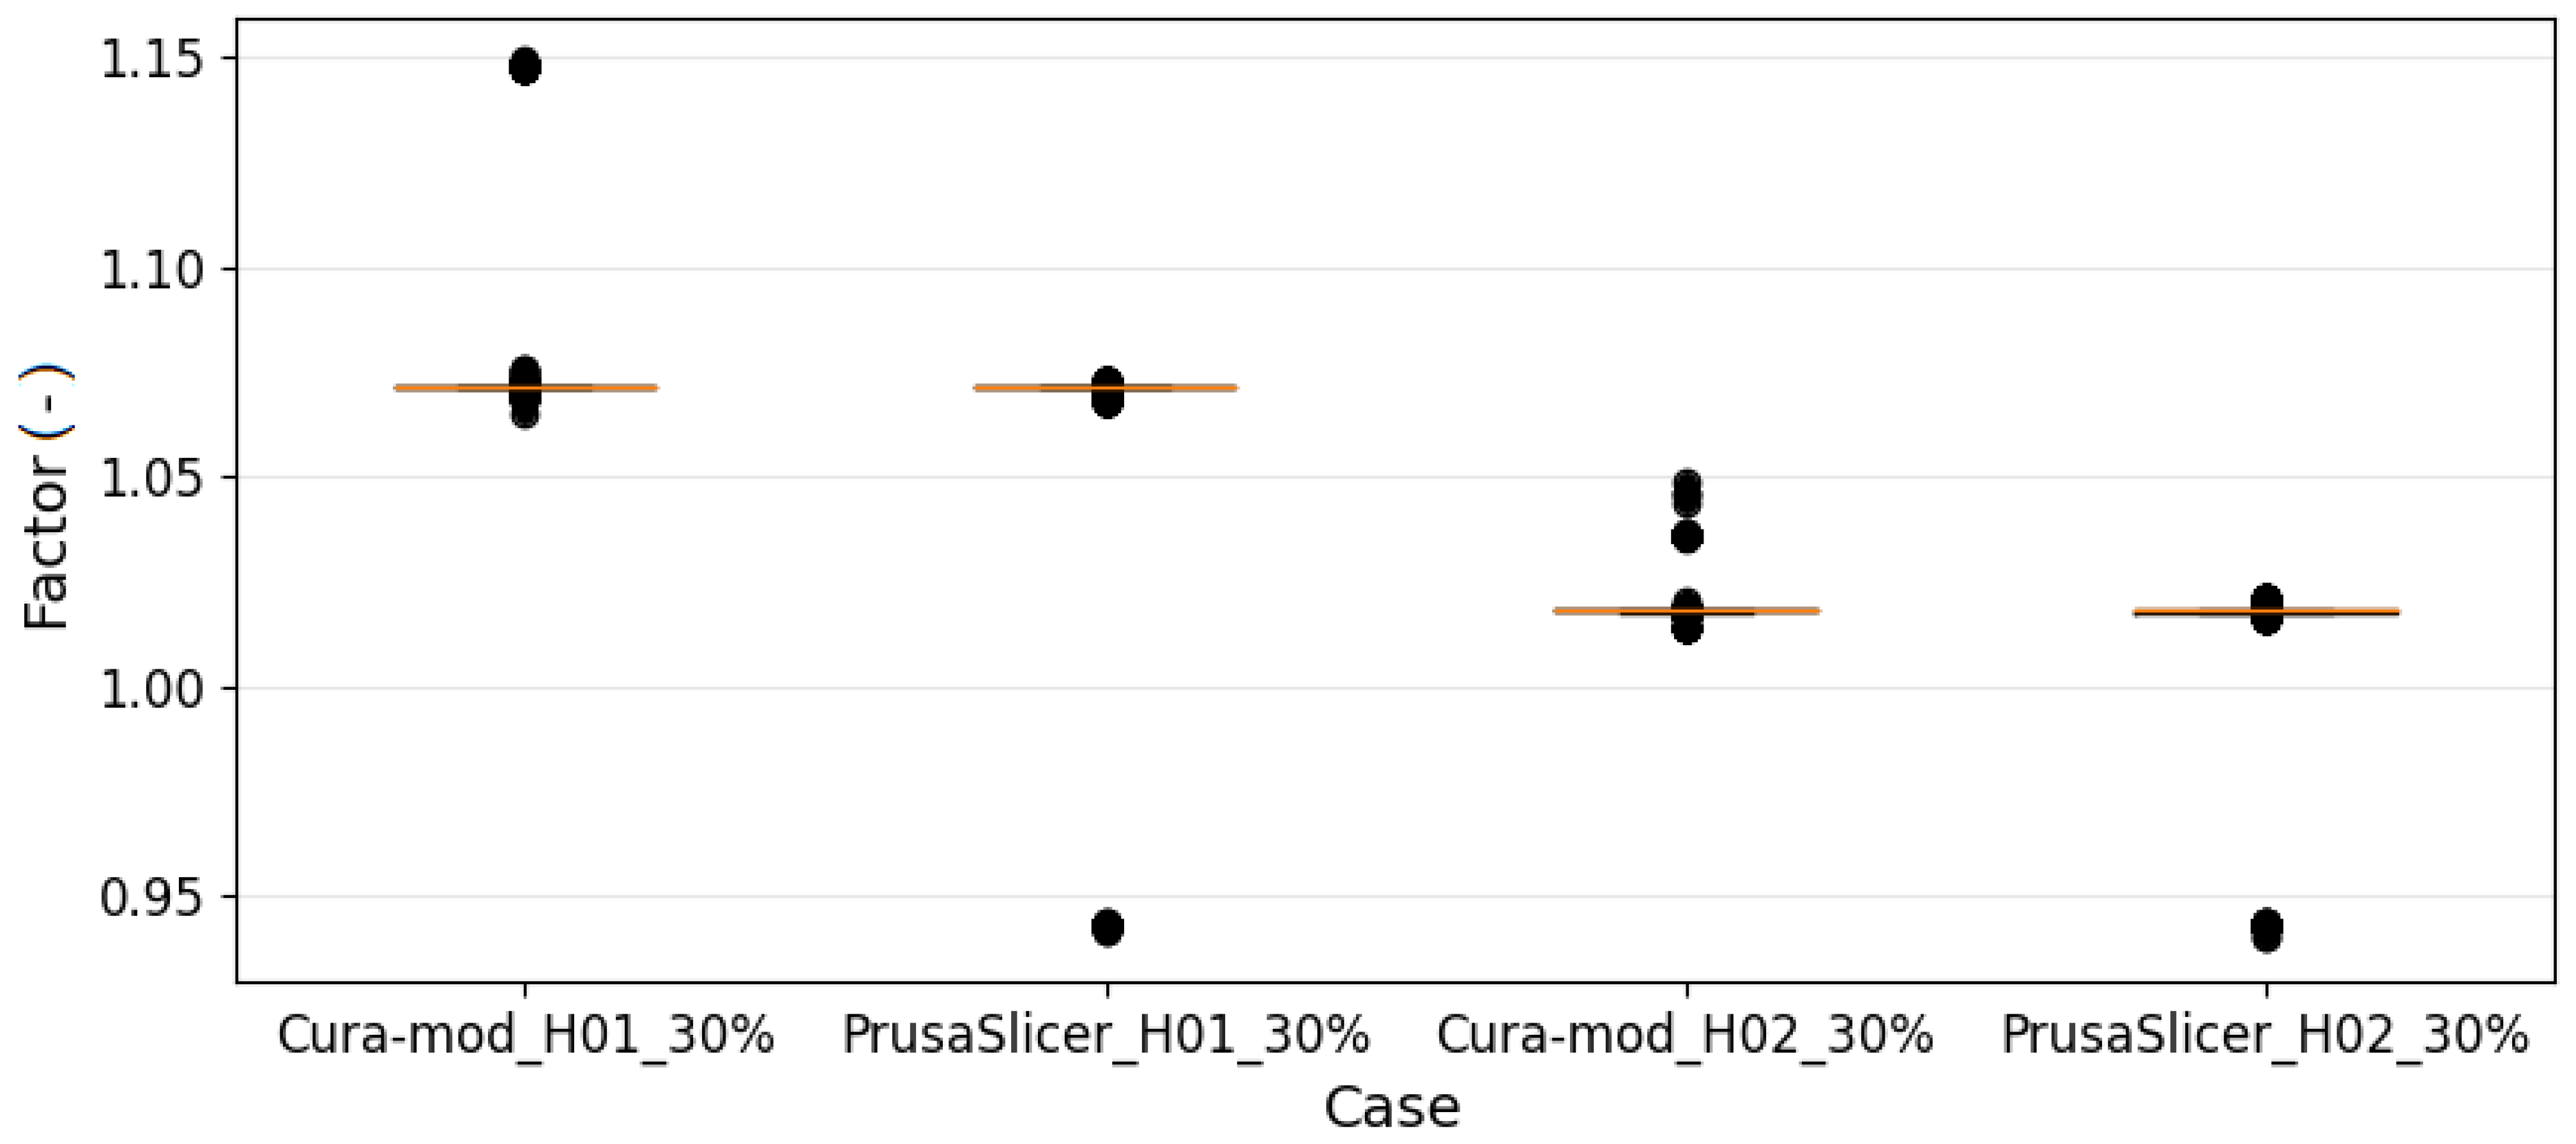
3.2. Result Comparison for the Slicers—The Case of the Modified Parameters in the Cura Software

In the following, the complementary results (with respect to the content of Section 3.1) are presented considering the previously stated modification of the settings in the Cura software, performed to ensure the consistency of the results for both analyzed slicers.
Specifically, the content of the present section addresses the comparison between the results obtained based on the readings of the G-codes generated by both PrusaSlicer and Cura. Figure 10, Figure 11, Figure 12, Figure 13 and Figure 14 subsequently refer to the former outcomes shown in Figure 4, Figure 5 and Figure 6, Figure 8 and Figure 9, taking into account: the speed of the print head, the line slopes, the total length of the lines for continuous extrusion, the volumetric fill for the fibers and air gaps. Again, only the results obtained using the option “fill” for the generated lines were of concern to the authors.
It can be seen that the G-code parameters for both slicers were almost identical in terms of the print head speed, fill factor, and line spacing (air gaps). A similar conclusion may be drawn in the case of the total length of the lines generated for continuous extrusion, except from a few additional short lines introduced by default by the PrusaSlicer software, which should be considered as expressing the specificity of this software. Moreover, the angle of inclination of the lines generated by both slicers was very similar, but in this case, these were the most significant differences found. This is probably naturally caused by the fact that both slicers generate a different structure at the mesoscale with a different number of fibers. This observation is confirmed in Figure 15, which shows the line lengths for all analyzed cases with the 30% infill. Nevertheless, it should be stated that, based on the determined parameters, the resulting 3D-printed structures should be similar.
For 65% and 100% infill, similar results were obtained, with one exception. In the case of 100% infill, the total fiber length for continuous extrusion, i.e., without retraction breaks, obtained using PrusaSlicer was significantly shorter. As identified, the assumption of a continuous extrusion for a single layer was implemented in Cura for the mentioned infill. For the sake of clarity and conciseness, only the results for the above-referenced case are presented in Figure 16.
At this stage of the research, it is important to highlight that the formulation of further conclusions regarding the relationships between the choice of slicer and the resultant properties of the 3D-printed parts requires experimental tests. These examinations would allow going beyond the pure geometry-induced inference, considering also the related physical- and technology-based factors. The intention of the paper was to show that the origin of the change of the resultant properties of the printed components was already visible at the stage of G-code generation, i.e., before any physical phenomena contributed to the above-mentioned properties. In fact, various trajectories were generated for the print head with the examined slicers, which led to different topologies of the printed filament. Consequently, various mechanical responses were expected due to the different patterns of the connections between the printed filament fibers. This experiment is currently planned by the authors to address this issue, to be reported in a future paper.
The conducted analysis confirmed that PrusaSlicer has dependencies between the printing process’ parameters, e.g., changing the layer height causes a change in the amount of extruded filament (represented by the parameter “percentage volumetric fill”) and the distance between the fibers (air gap). Thus, taking into account the two analyzed slicers, the authors of the work consider it more appropriate to generate G-code in Cura in order to conduct research on the influence of the process parameters on the properties of 3D-printed components. In fact, the implemented parameters’ presets may cause difficulties regarding the planning design of the experiment, and hence, reliable inference on the interactions between the process and material parameters may be not feasible. On the other hand, it should be stated that the above-mentioned functionality of PrusaSlicer may undoubtedly help create the first print for a given geometry. Hence, it is expected that the default printing settings will refer to the knowledge gained by the software developers.

4. Summary and Final Conclusions

The work was devoted to the investigation of the properties of 3D-printed components with G-code readings. As presented, the analysis of the G-code allows identifying and modifying the values of the process parameters and, hence, to attempt to schedule a design of experiment to analyze the interactions between the process characteristics and the properties of a 3D-printed component. Thus, the proposed approach makes it possible to selectively modify the values of the analyzed parameters.
The choice of the slicer becomes a key issue since its properties may significantly influence the generated G-code, and, therefore, the properties of the printed parts. It may be difficult or even impossible to ideally match the manufacturing process parameters for different slicers, also due to various definitions and implementations used for these parameters. Moreover, each slicer, even for the same process parameters and selected G-code parameters, creates a unique structure of the printed element, which surely affects its strength. Nevertheless, the authors confirmed that a detailed analysis of the generated G-code enables the adjustment of the slicers’ unique properties to the extent that this provides the means to manufacture, at least theoretically, components with similar geometric characteristics. On the other hand, the matching of the process parameters performed for various slicers in order to obtain the same or similar readings of the G-code allows for the study of the influence of the slicer’s properties on the characteristics of the printed parts.
The proposed approach allows analyzing the influence of the created structure on the properties of the printed sample and to distinguish differences regarding these properties resulting from the defined values of the process parameters and the generated structure making use of various slicers. However, as for the future plans, the possibility of performing tests on samples obtained from the G-code generated by several slicers would allow for additional confirmation of the influence of the tested process parameters—despite the different structures obtained from different slicers.
It should be noted that the use of PrusaSlicer for the investigation of the influence of its process parameters requires the creation of dedicated software that would enable selective modifications of the G-code, as well as to change or revoke the default settings.
Both of the investigated slicers are very useful; however, their functionalities differ. As a consequence, various scopes of potential applications may be preferred, taking into account their unique advantages. Specifically, Cura exhibits more comprehensive control over the printing process. Additionally, more parameters may be independently changed. On the one hand, this capability helps to conduct research regarding the specific properties of the manufacturing process. However, the parameter diversity may complicate the creation of the first print for a given geometry. In contrast, PrusaSlicer considers links between the printing parameters that may cause some inconveniences while setting the design of experiments. However, the mentioned feature can guide the inexperienced user to create a new print. Nonetheless, both software solutions provide effective tools for rapid prototyping.
Finally, it should be mentioned that the properties of the final 3D print also depend on the initialization of the G-code commands (the G-code file headings). These commands are, in turn, specifically declared depending on the slicer used. However, in the opinion of the authors of the current work, the above-mentioned influence may be effectively assessed using experiments only. Consequently, the present research dealt with the comparison of the cores of the generated G-code files (the G-code file main bodies). These preliminary conclusions were drawn regarding the expected behavior of the printed components. The presented approach is considered by the authors as valuable since it provides the outcomes before the printing process is actually initiated. The research focused on the trajectories generated for the print head by addressing the existing gap in the literature. Based on that data extracted from the G-code readings, potential changes of the properties of the printed parts were shown, before any physical (technological/manufacturing) factor contributed. In fact, the generated G-code decides the properties of the created components. Hence, its direct analysis, i.e., considering geometric parameters primarily, should provide interesting outcomes.

Author Contributions

Conceptualization, J.B. and A.M.; methodology, J.B. and A.M.; formal analysis, J.B. and A.M.; investigation, J.B. and A.M.; resources, J.B. and A.M.; writing—original draft preparation, J.B. and A.M.; writing–review and editing, J.B. and A.M.; visualization, J.B. and A.M.; supervision, J.B. and A.M.; project administration, J.B. and A.M.; funding acquisition, J.B. and A.M. All authors read and agreed to the published version of the manuscript.

Funding

This research was funded by the Rector of AGH University of Science and Technology (AGH-UST), Krakow, Poland, and co-funded by the Dean of Faculty of Mechanical Engineering and Robotics at AGH-UST, within the project call “Grant Rektora AGH” edition 2021 and grant number 8.

Institutional Review Board Statement

Not applicable.

Informed Consent Statement

Not applicable.

Data Availability Statement

Not applicable.

Acknowledgments

This research was conducted as an activity of the students’ scientific group “AGH Rapid Prototyping” affiliated with the AGH University of Science and Technology, Krakow, Poland (www: http://student.agh.edu.pl/rapidpro/; accessed on 1 July 2021) in cooperation with the company GOODFIBERS sp. z o.o.

Conflicts of Interest

The authors declare no conflict of interest.

Abbreviations

The following abbreviations are used in this manuscript:
ABSAcrylonitrile-butadiene-styrene
PLAPolylactide

Appendix A

Specifically, four commands are introduced in the G-code that define the way of interpreting the information about the operation of the drives in a 3D printer. Depending on the selected option, the movement of the head along the X, Y, and Z axes and the filament feed in the extruder along the E axis is provided in the form required to obtain either the position or displacement:
  • The declaration of the position for all axes-G90;
  • The declaration of the displacement for all axes-G91;
  • The declaration of the position for the E axis-M82;
  • The declaration of displacement for the E axis-M83.
Before the printing procedure is actually initialized for a given item, a 3D printer head moves to the starting position (0,0,0). This task is invoked with the command G28. Additionally, it is possible to change the value of the selected coordinate X, Y, Z, and E without moving the head or filament via command:
G 92 [ X < p o s > ] [ Y < p o s > ] [ Z < p o s > ] [ E < p o s > ]
The arguments in square brackets in Equation (A1) are optional. This means that the G92 command can be invoked with any configuration of the parameters. As expected, the first three parameters refer to the movement along the following axes of the printer: X, Y, and Z; the fourth argument, in turn, declares the feed of the filament in the extruder, i.e., along the E axis.
Finally, the movement of the head or filament is initiated by calling one of two commands:
G 0 [ X < p o s > ] [ Y < p o s > ] [ Z < p o s > ] [ E < p o s > ] [ F < s p e e d > ]
or:
G 1 [ X < p o s > ] [ Y < p o s > ] [ Z < p o s > ] [ E < p o s > ] [ F < s p e e d > ]
The last parameter in Equations (A2) and (A3) determines the speed of the head provided in units of mm/min. In the case when the last command called belongs to the set G90, G91, M82, M83, G91, or M83, there is a respective movement by a given displacement along the considered axes. In other cases, the desired displacement is calculated on the basis of the demanded and previous position.
There are additional instructions limiting the speeds of the head movement and filament extrusion, such as: M201, M203, M204, and M205. The arguments defined in these instructions affect the value of the parameter F given in the commands (A2) and (A3) in case they do not meet the criteria set by M201, M203, M204, and M205.
Finally, there are a number of commands responsible for setting the temperature parameters and cooling the extruded material:
  • Setting the temperature of the printer’s heatbed in degrees Celsius:
    M 140 S < t e m p e r a t u r e >
    M 190 S < t e m p e r a t u r e >
  • Setting the temperature of the print head in degrees Celsius:
    M 104 S < t e m p e r a t u r e >
    M 109 S < t e m p e r a t u r e >
  • Setting the speed of the fan that cools down the extruded filament—a value from zero to two-hundred fifty-five:
    M 106 S < 0 255 >
  • Turning off the fan—M107.

References

  1. Hill, N.; Haghi, M. Deposition direction-dependent failure criteria for fused deposition modeling polycarbonate. Rapid Prototyp. J. 2014, 20, 221–227. [Google Scholar] [CrossRef]
  2. Łukaszewski, K.; Wichniarek, R.; Górski, F. Determination of the Elasticity Modulus of Additively Manufactured Wrist Hand Orthoses. Materials 2020, 13, 4379. [Google Scholar] [CrossRef] [PubMed]
  3. Seppala, J.E.; Migler, K.D. Infrared thermography of welding zones produced by polymer extrusion additive manufacturing. Addit. Manuf. 2016, 12, 71–76. [Google Scholar] [CrossRef] [PubMed] [Green Version]
  4. Sood, A.K.; Ohdar, R.K.; Mahapatra, S.S. Parametric appraisal of mechanical property of fused deposition modelling processed parts. Mater. Des. 2010, 31, 287–295. [Google Scholar] [CrossRef]
  5. Straub, J. Initial Work on the Characterization of Additive Manufacturing (3D Printing) Using Software Image Analysis. Machines 2015, 3, 55–71. [Google Scholar] [CrossRef] [Green Version]
  6. Ahn, S.-H.; Montero, M.; Odell, D.; Roundy, S.; Wright, P.K. Anisotropic material properties of fused deposition modeling ABS. Rapid Prototyp. J. 2002, 8, 248–257. [Google Scholar] [CrossRef] [Green Version]
  7. Cantrell, J.T.; Rohde, S.; Damiani, D.; Gurnani, R.; DiSandro, L.; Anton, J.; Young, A.; Jerez, A.; Steinbach, D.; Kroese, C.; et al. Experimental characterization of the mechanical properties of 3D-printed ABS and polycarbonate parts. Rapid Prototyp. J. 2017, 23, 811–824. [Google Scholar] [CrossRef]
  8. Gao, X.; Qi, S.; Kuang, X.; Su, Y.; Li, J.; Wang, D. Fused filament fabrication of polymer materials: A review of interlayer bond. Addit. Manuf. 2021, 37, 101658. [Google Scholar] [CrossRef]
  9. Song, Y.; Li, Y.; Song, W.; Yee, K.; Lee, K.-Y.; Tagarielli, V.L. Measurements of the mechanical response of unidirectional 3D-printed PLA. Mater. Des. 2017, 123, 154–164. [Google Scholar] [CrossRef]
  10. Ferreira, I.; Machado, M.; Alves, F.; Marques, A.T. A review on fibre reinforced composite printing via FFF. Rapid Prototyp. J. 2019, 25, 972–988. [Google Scholar] [CrossRef]
  11. Gardner, J.M.; Saut, G.; Kim, J.W.; Cano, R.J.; Wincherski, R.A.; Stelter, C.J.; Grimsley, B.W.; Dennis, C.; Working, D.C.; Siochi, E.J. 3-D printing of multifunctional carbon nanotube yarn reinforced components. Addit. Manuf. 2016, 12, 38–44. [Google Scholar] [CrossRef]
  12. Ilardo, R.; Williams, C.B. Design and manufacture of a formula SAE intake system using fused deposition modeling and fiber-reinforced composite materials. Rapid Prototyp. J. 2010, 16, 174–179. [Google Scholar] [CrossRef]
  13. Lantean, S.; Roppolo, I.; Sangermano, M.; Pirri, C.F.; Chiappone, A. Development of New Hybrid Acrylic/Epoxy DLP-3D Printable Materials. Inventions 2018, 3, 29. [Google Scholar] [CrossRef] [Green Version]
  14. Wang, J.; Xiang, J.; Lin, H.; Wang, K.; Yao, S.; Peng, Y.; Rao, Y. Effects of Scanning Strategy and Printing Temperature on the Compressive Behaviors of 3D Printed Polyamide-Based Composites. Polymers 2020, 12, 1783. [Google Scholar] [CrossRef]
  15. Melenka, G.W.; Schofield, J.S.; Dawson, M.R.; Carey, J.P. Evaluation of dimensional accuracy and material properties of the MakerBot 3D desktop printer. Rapid Prototyp. J. 2015, 21, 618–627. [Google Scholar] [CrossRef]
  16. Rankouhi, B.; Javadpour, S.; Delfanian, F.; Letcher, T. Failure Analysis and Mechanical Characterization of 3D Printed ABS With Respect to Layer Thickness and Orientation. J. Fail. Anal. Prev. 2016, 16, 467–481. [Google Scholar] [CrossRef]
  17. Kuznetsov, V.E.; Solonin, A.N.; Urzhumtsev, O.D.; Schilling, R.; Tavitov, A.G. Strength of PLA Components Fabricated with Fused Deposition Technology Using a Desktop 3D Printer as a Function of Geometrical Parameters of the Process. Polymers 2018, 10, 313. [Google Scholar] [CrossRef] [PubMed] [Green Version]
  18. Durgun, I.; Ertan, R. Experimental investigation of FDM process for improvement of mechanical properties and production cost. Rapid Prototyp. J. 2014, 20, 228–235. [Google Scholar] [CrossRef]
  19. Kousiatza, C.; Karalekas, D. In-situ monitoring of strain and temperature distributions during fused deposition modeling process. Mater. Des. 2016, 95, 400–406. [Google Scholar] [CrossRef]
  20. Rayegani, F.; Onwubolu, G.C. Fused deposition modelling (FDM) process parameter prediction and optimization using group method for data handling (GMDH) and differential evolution (DE). Int. J. Adv. Manuf. Technol. 2014, 73, 509–519. [Google Scholar] [CrossRef]
  21. Rezayat, H.; Zhou, W.; Siriruk, A.; Penumadu, D.; Babu, S.S. Structure–mechanical property relationship in fused deposition modelling. Mater. Sci. Technol. 2015, 31, 895–903. [Google Scholar] [CrossRef]
  22. Chacon, J.M.; Caminero, M.A.; Garcia-Plaza, E.; Nunez, P.J. Additive manufacturing of PLA structures using fused deposition modelling: Effect of process parameters on mechanical properties and their optimal selection. Mater. Des. 2017, 124, 143–157. [Google Scholar] [CrossRef]
  23. Tymrak, B. M, Kreiger, M.; Pearce, J.M. Mechanical properties of components fabricated with open-source 3-D printers under realistic environmental conditions. Mater. Des. 2014, 58, 242–246. [Google Scholar] [CrossRef] [Green Version]
  24. Alafaghani, A.; Qattawi, A. Investigating the effect of fused deposition modeling processing parameters using Taguchi design of experiment method. J. Manuf. Process. 2018, 36, 164–174. [Google Scholar] [CrossRef]
  25. Compton, B.G.; Post, B.K.; Duty, C.E.; Love, L.; Kunc, V. Thermal analysis of additive manufacturing of large-scale thermoplastic polymer composites. Addit. Manuf. 2017, 17, 77–86. [Google Scholar] [CrossRef]
  26. Lee, C.-Y.; Liu, C.-Y. The influence of forced-air cooling on a 3D-printed PLA part manufactured by fused filament fabrication. Addit. Manuf. 2019, 25, 196–203. [Google Scholar] [CrossRef]
  27. Wittbrodt, B.; Pearce, J.M. The effects of PLA color on material properties of 3-D printed components. Addit. Manuf. 2015, 8, 110–116. [Google Scholar] [CrossRef] [Green Version]
  28. Yin, J.; Lu, C.; Fu, J.; Huang, Y.; Zheng, Y. Interfacial bonding during multi-material fused deposition modeling (FDM) process due to inter-molecular diffusion. Mater. Des. 2018, 150, 104–112. [Google Scholar] [CrossRef]
  29. Bryla, J. The influence of the MEX manufacturing parameters on the tensile elastic response of printed elements. Rapid Prototyp. J. 2021, 27, 187–196. [Google Scholar] [CrossRef]
  30. Ariffin, M.M.; Sukindar, N.A.; Baharudin, B.H.; Jaafar, C.N.A.; Ismail, M.I.S. Slicer Method Comparison Using Open-source 3D Printer. IOP Conf. Ser. Earth Environ. Sci. 2018, 114, 012018. [Google Scholar] [CrossRef]
  31. Šljivic, M.; Pavlovic, A.; Kraišnik, M.; Ilić, J. Comparing the accuracy of 3D slicer software in printed enduse parts. IOP Conf. Ser. Mater. Sci. Eng. 2019, 659, 012082. [Google Scholar] [CrossRef]
  32. BSI. BS EN ISO 527-2 Plastics—Determination of tensile properties. Part 2: Test Conditions for Moulding and Extrusion Plastics. In ISO Standard; BSI Group: London, UK, 2012. [Google Scholar]
Figure 1. Number of lines for various types of extruder movements. Apart from the name of the studied case, the legend also contains in the brackets the total number of analyzed lines.
Machines 09 00163 g001
Figure 2. Number of lines considering their heights with the three allowed discrete values.
Machines 09 00163 g002
Figure 3. Speed of the print head. All box plots in the paper make use of circles and dots that respectively mark the outliers and extreme outliers. The boxes are bounded with the first and third quartiles. A detailed description regarding the visualized parameters can be found in the present section.
Machines 09 00163 g003
Figure 4. Speed of the print head identified for the option “fill” lines only. A significant reduction of the total number of lines can be observed for the Cura software.
Machines 09 00163 g004
Figure 5. Variation of the line slopes.
Machines 09 00163 g005
Figure 6. Total length of the lines for continuous extrusion.
Machines 09 00163 g006
Figure 7. Visualizations of the structures generated in Cura (top) and PrusaSlicer (bottom).
Machines 09 00163 g007
Figure 8. Volumetric fill for the fibers.
Machines 09 00163 g008
Figure 9. The in-plane distances between the fibers.
Machines 09 00163 g009
Figure 10. Speed of the print head.
Machines 09 00163 g010
Figure 11. Variation of the line slopes.
Machines 09 00163 g011
Figure 12. Total length of lines for continuous extrusion.
Machines 09 00163 g012
Figure 13. Volumetric fill for the fibers.
Machines 09 00163 g013
Figure 14. The in-plane distances between the fibers.
Machines 09 00163 g014
Figure 15. Length of the lines.
Machines 09 00163 g015
Figure 16. Total length of lines for continuous extrusion—the case of 100% infill.
Machines 09 00163 g016
Table 1. Parameters declared for the Cura software—based on the PrusaSlicer settings.
ParameterValue/DefinitionComments
1. Height of the first layer0.2 mm-
2. Infill distanceData in Table 2It was required to appropriately adapt the percentage of filling (PrusaSlicer) to the infill distance (Cura). The infill distance is the distance between the axes of the consecutive fibers of the filament.
3. Fiber connectionactivated-
4. Temperature of extrusion215 C-
5. Percentage volumetric fillData in Table 2This parameter adequately relates the amount of the extruded filament to the speed of the print head.
6. Speed of the print head80 mm/sExceptional case: the speed equals 76.3 mm/s for a layer height of 0.1 mm (the case H01 in Table 2) and a percentage of infill of 30%.
7. Speed of idle movement180 mm/s-
8. Speed for the first layer20 mm/s-
9. Number of layers printed at reduced speed1-
Table 2. Initial settings for the PrusaSlicer software.
Layer Height (H01-0.1 mm, H02-0.2 mm)Infill (%)Percentage Volumetric Fill (%)Infill Distance (mm)
H0130107.131.428
H0230101.781.357
H0165107.130.659
H0265101.780.625
H01100107.130.429
H02100101.780.407
Table 3. Temperature of the extruder.
CaseTemperature ( C)Number of Lines
Cura H01 30%20017,551
PrusaSlicer H01 30%2157301
Cura H02 30%2008844
PrusaSlicer H02 30%2154025
Publisher’s Note: MDPI stays neutral with regard to jurisdictional claims in published maps and institutional affiliations.

