

Quantitative Evaluation of Paleocene Reservoir Diagenetic Facies by Logging in Lishui West Sag, East China Sea Basin
Abstract
:1. Introduction
2. Geological Setting
3. Materials and Methods
3.1. Well Logging Data and Experimental Procedures
3.2. Quantitative Evaluation Methods of Diagenetic Facies
4. Results
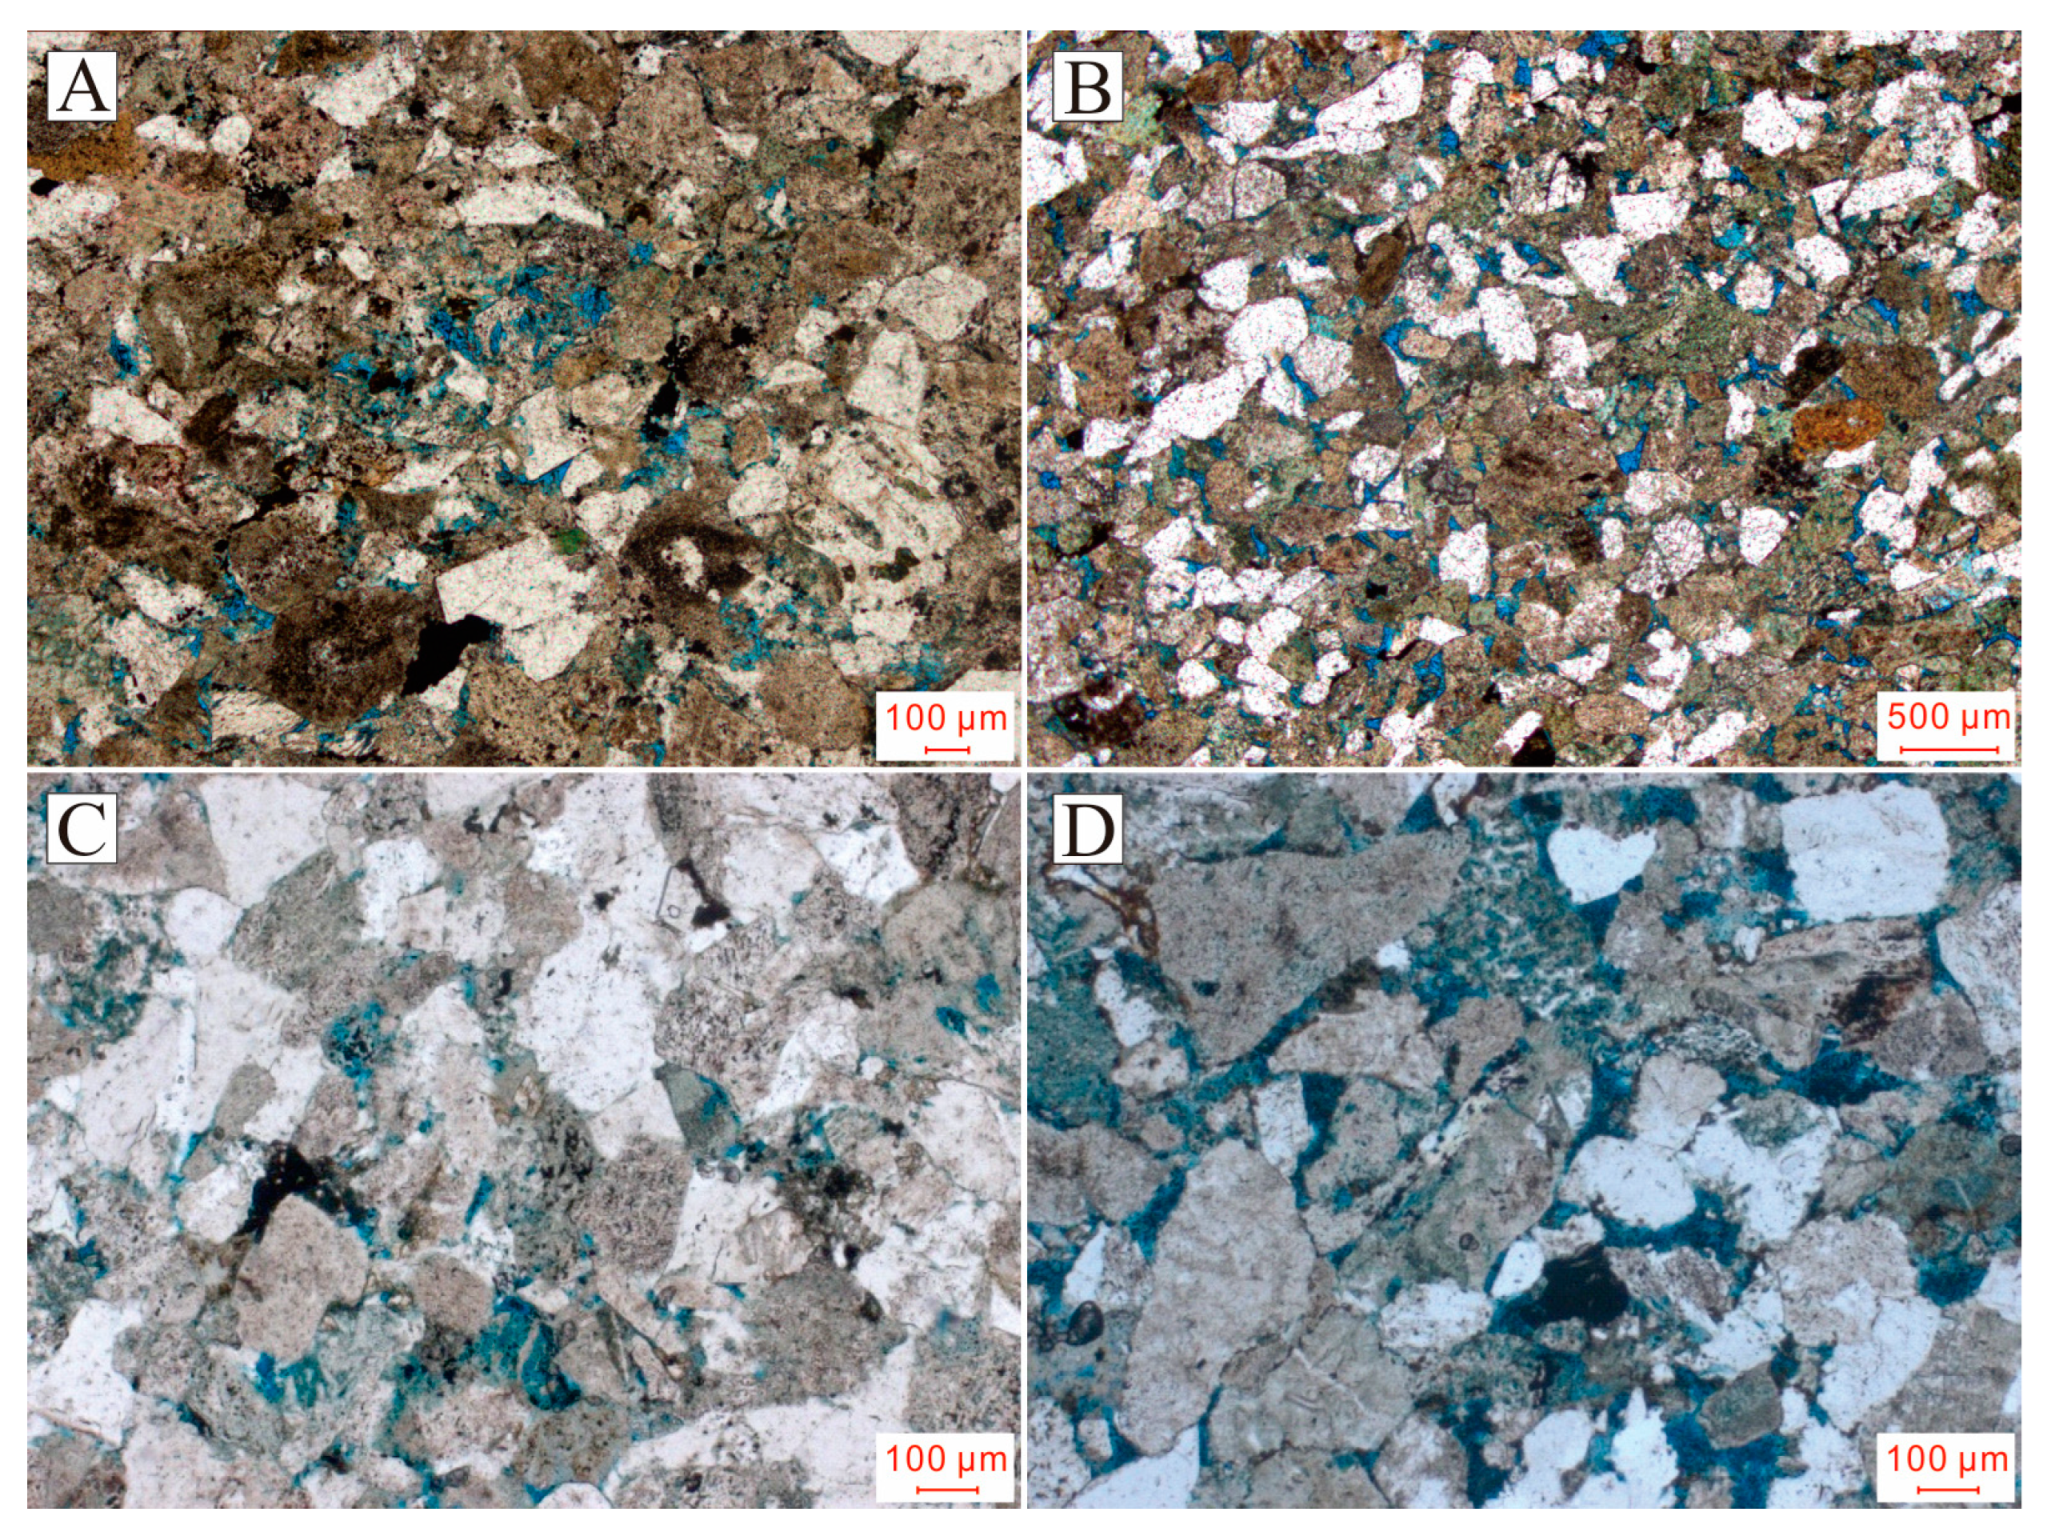
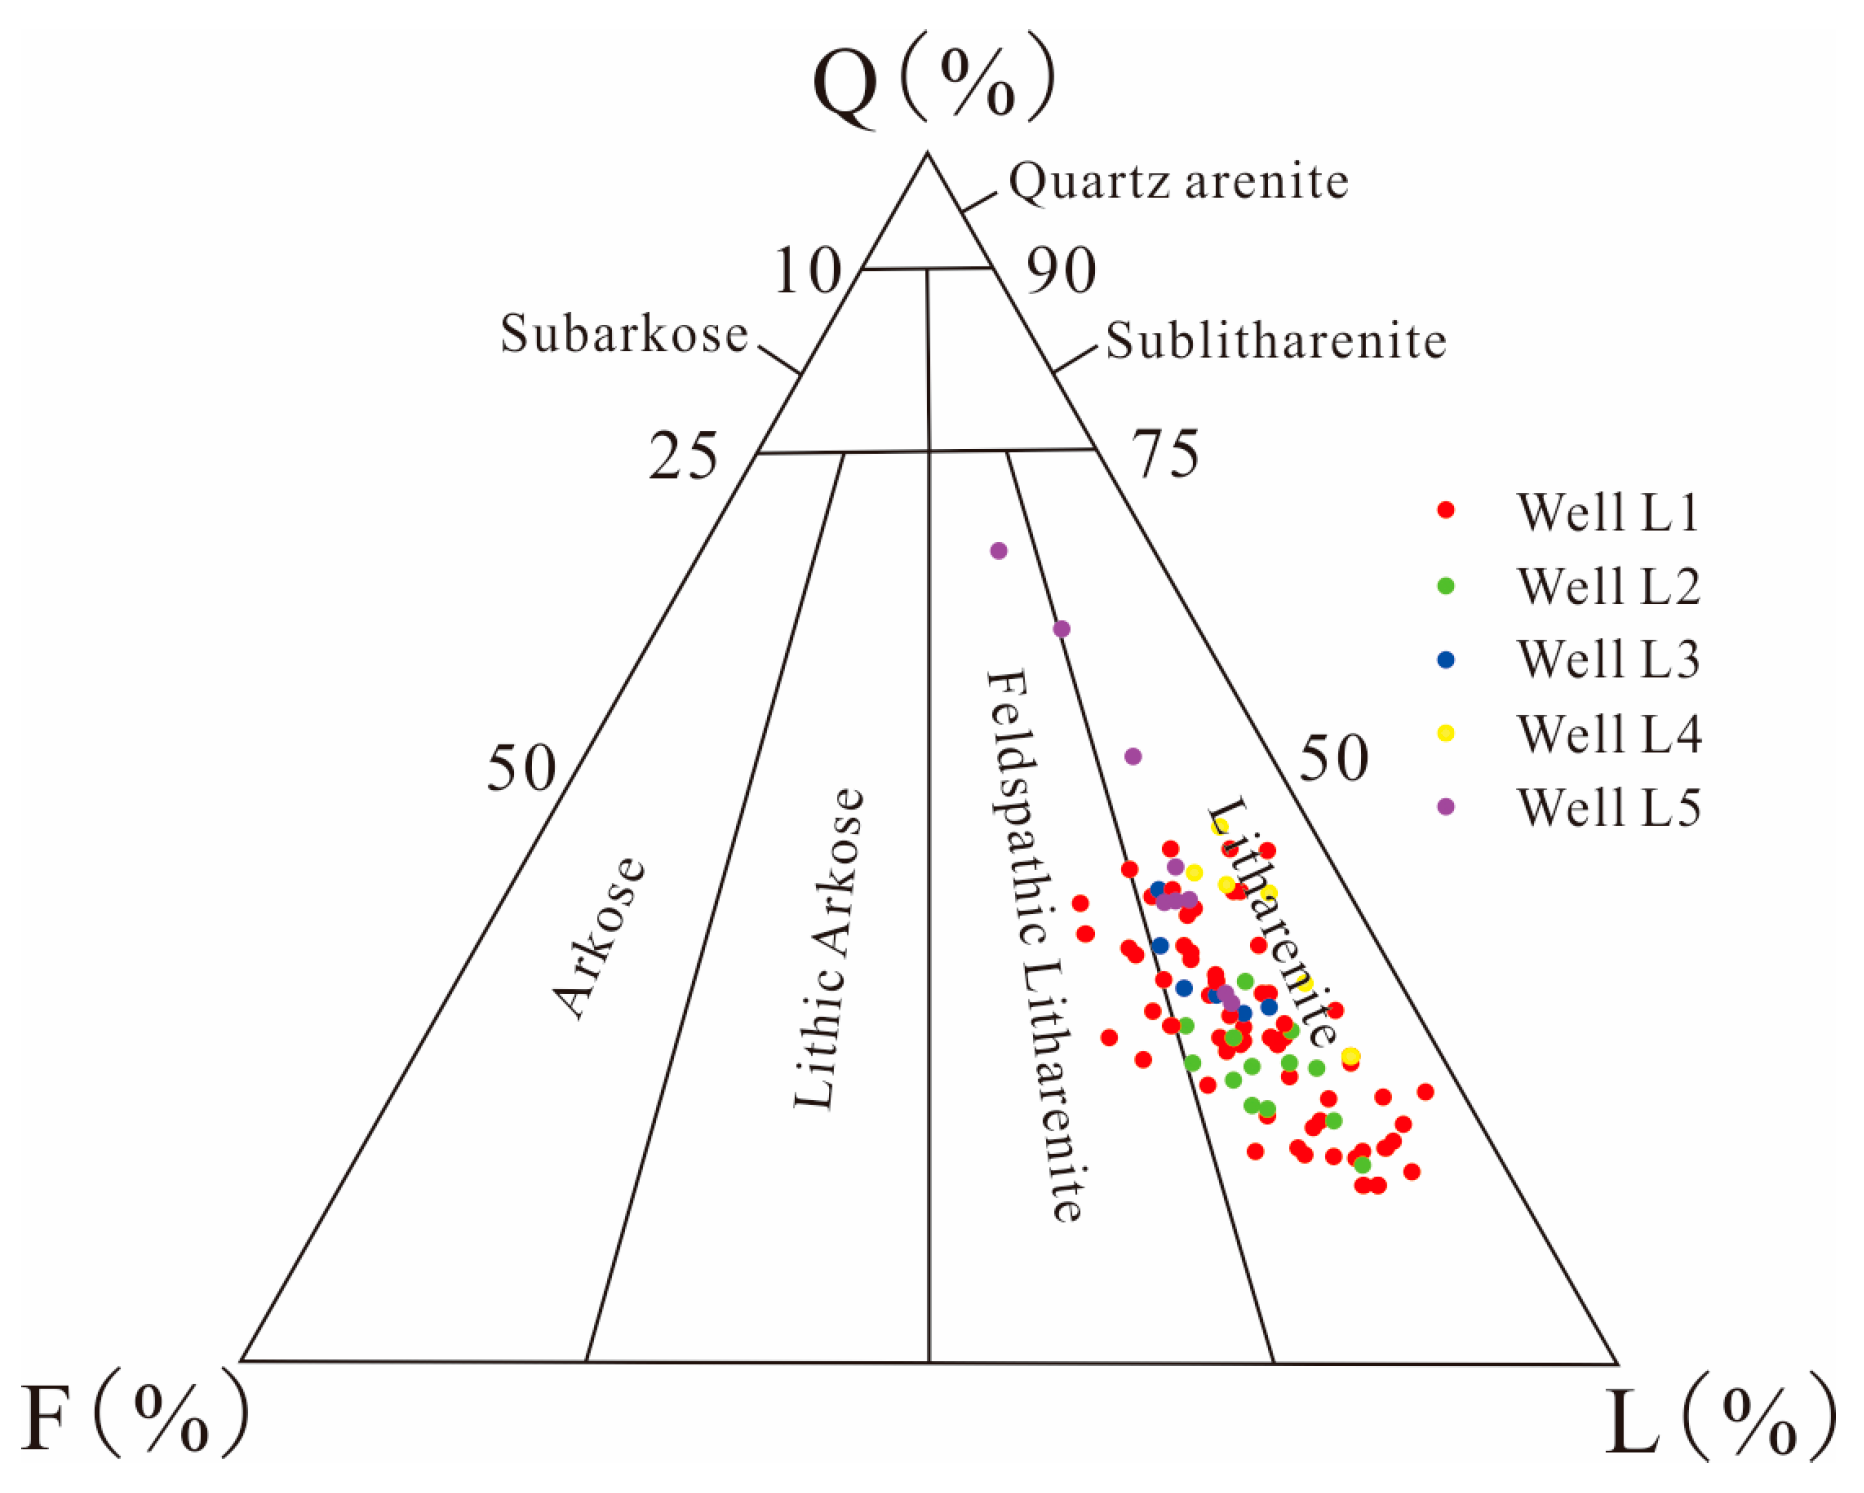
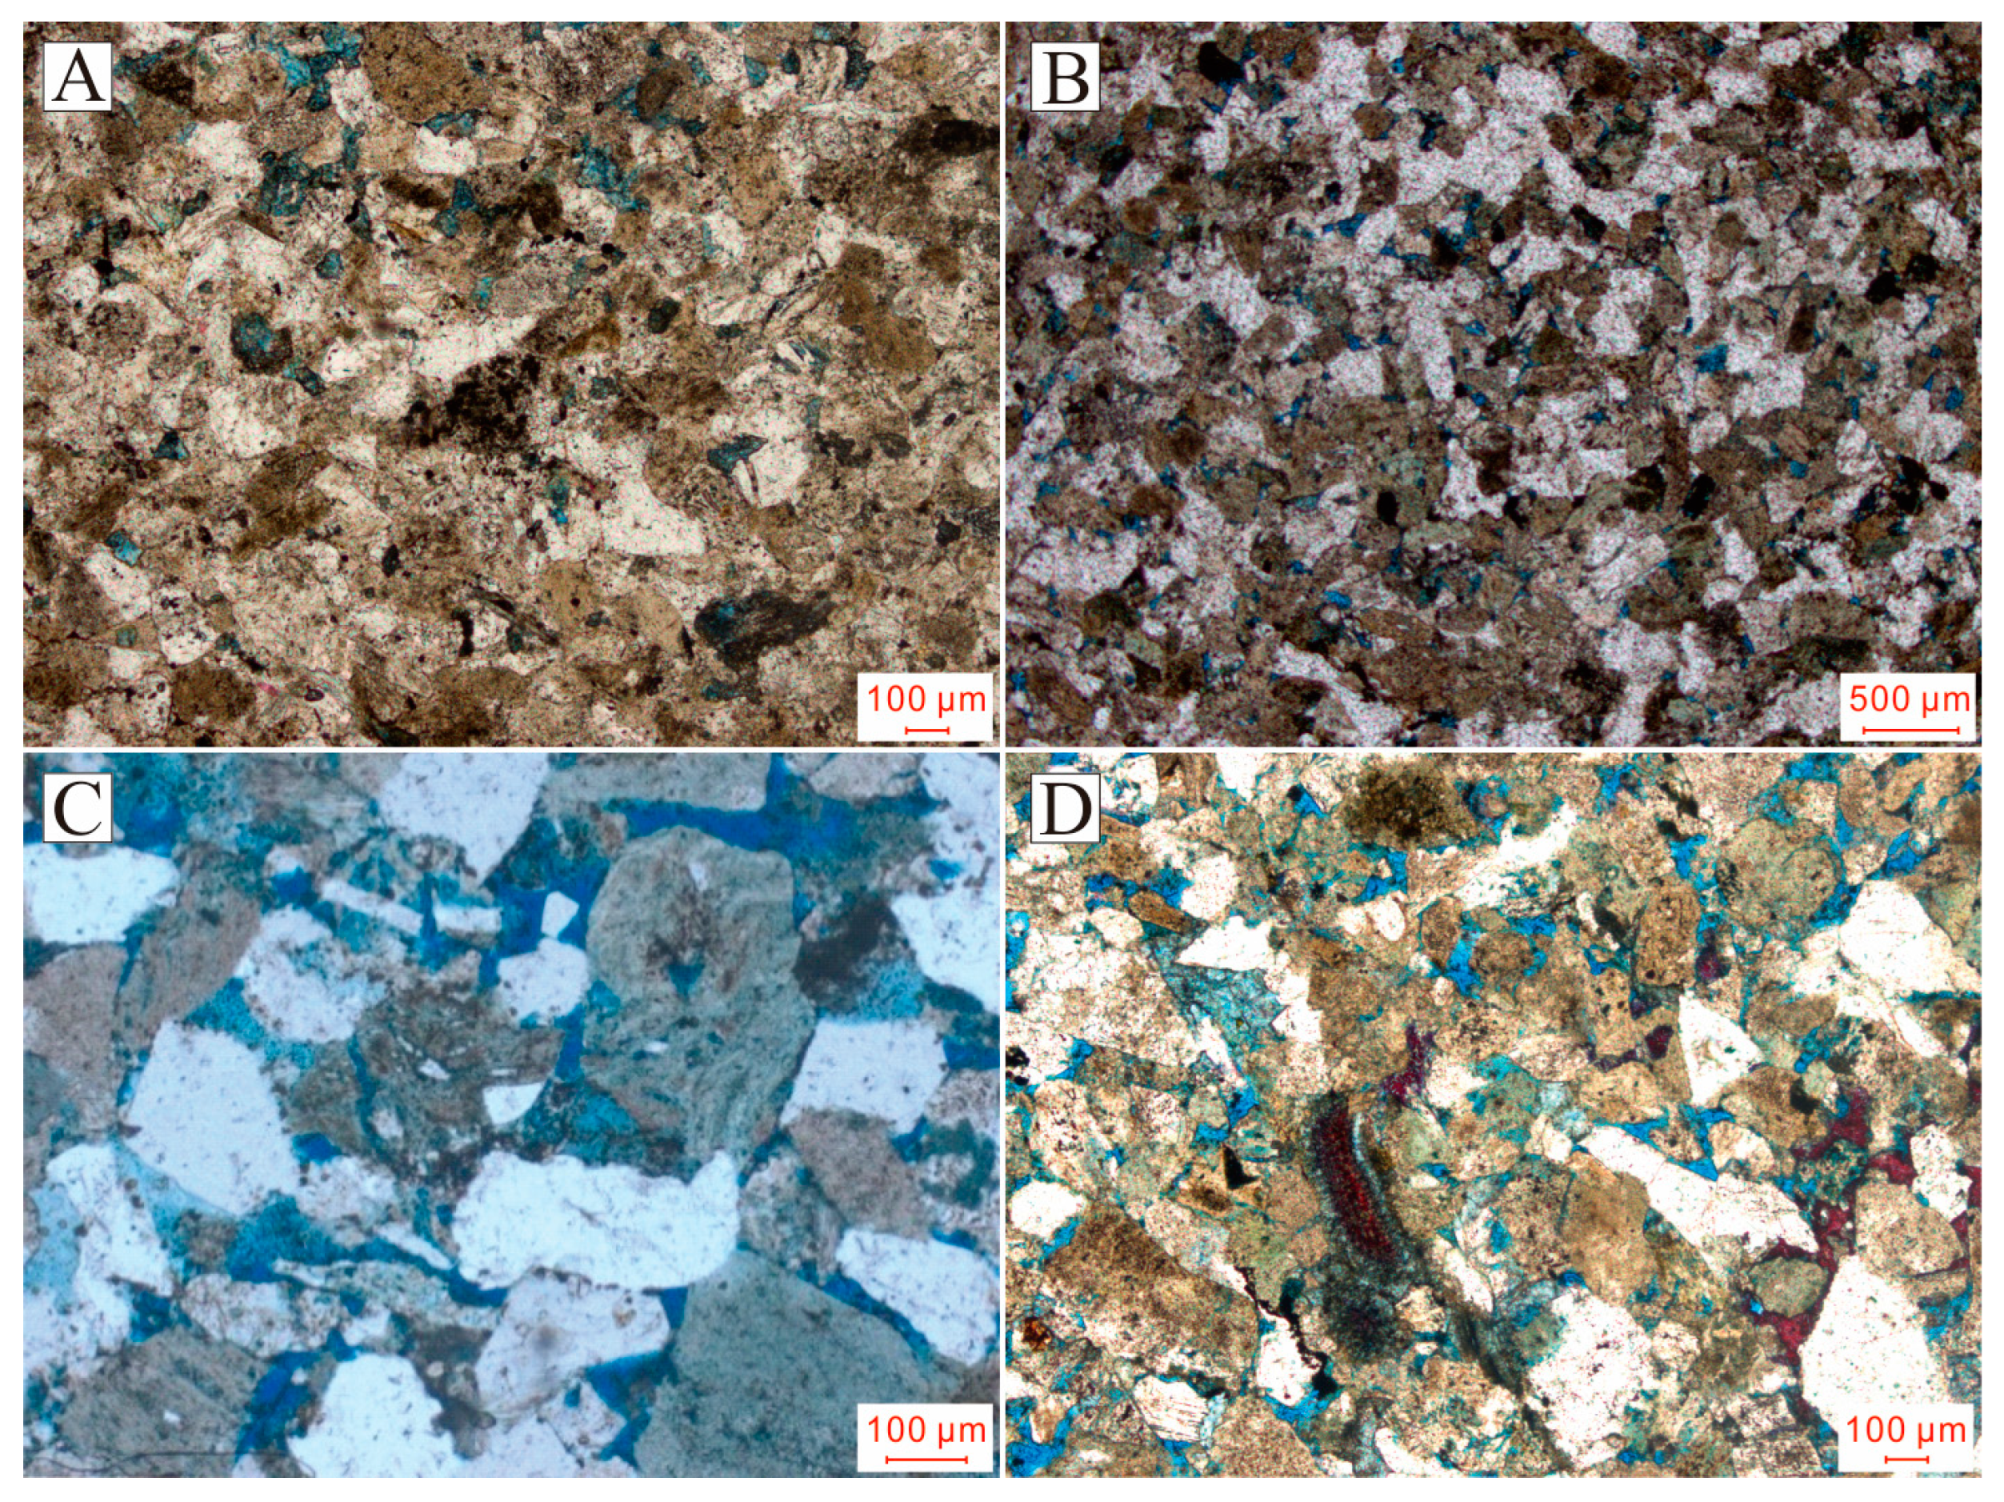
4.1. Petrology Characteristics
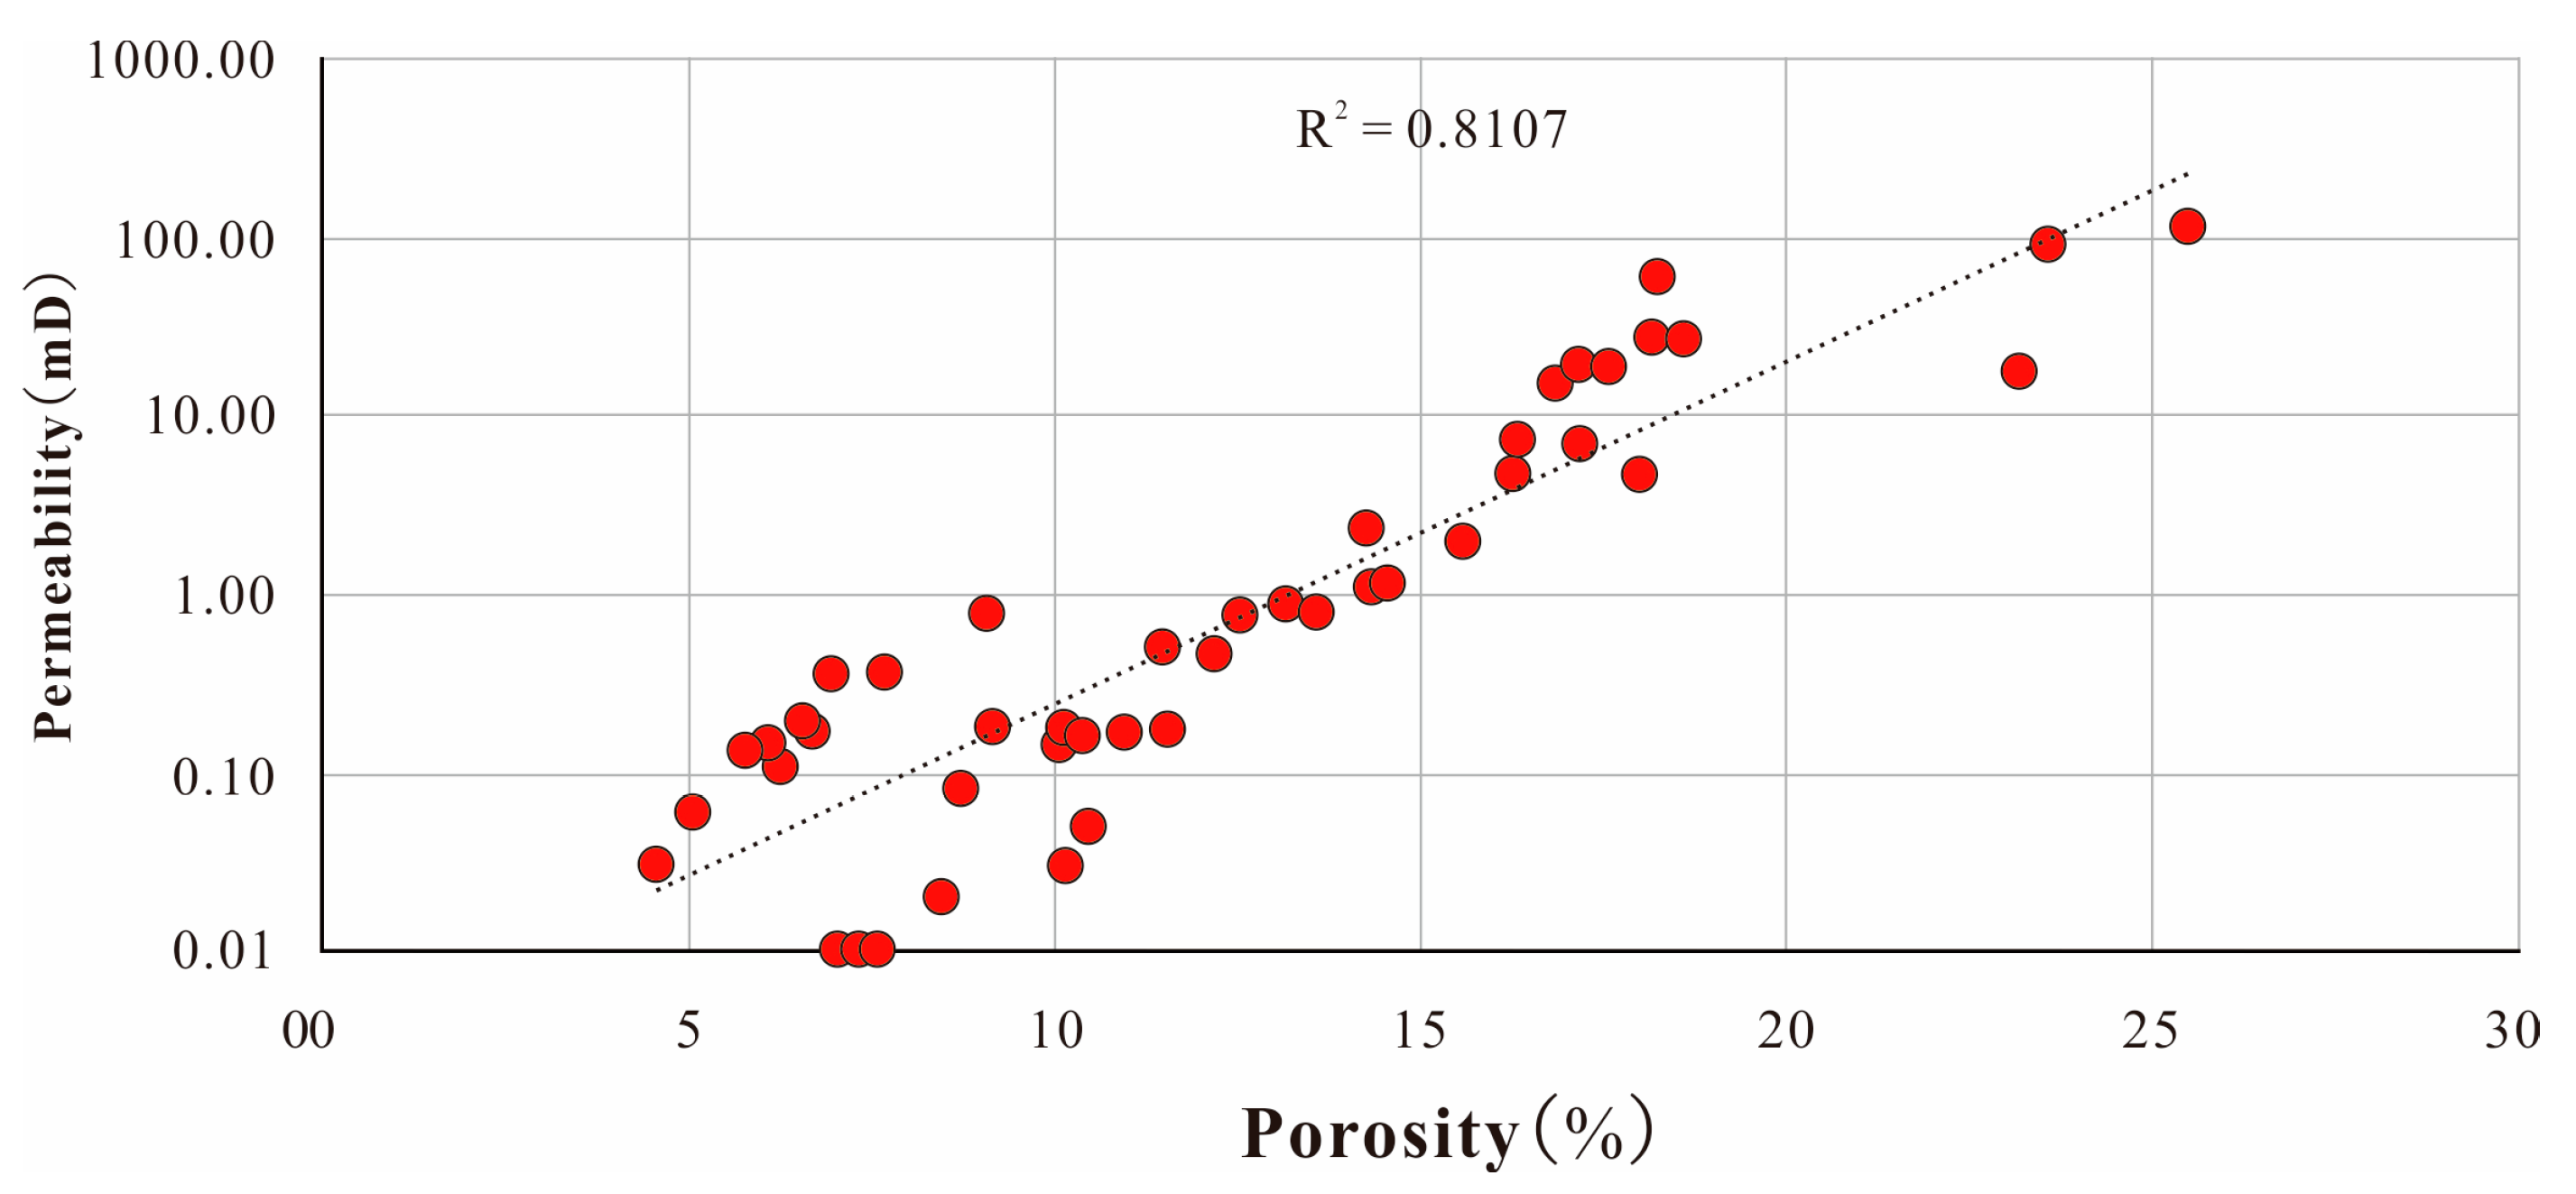
4.2. Reservoir Physical Property
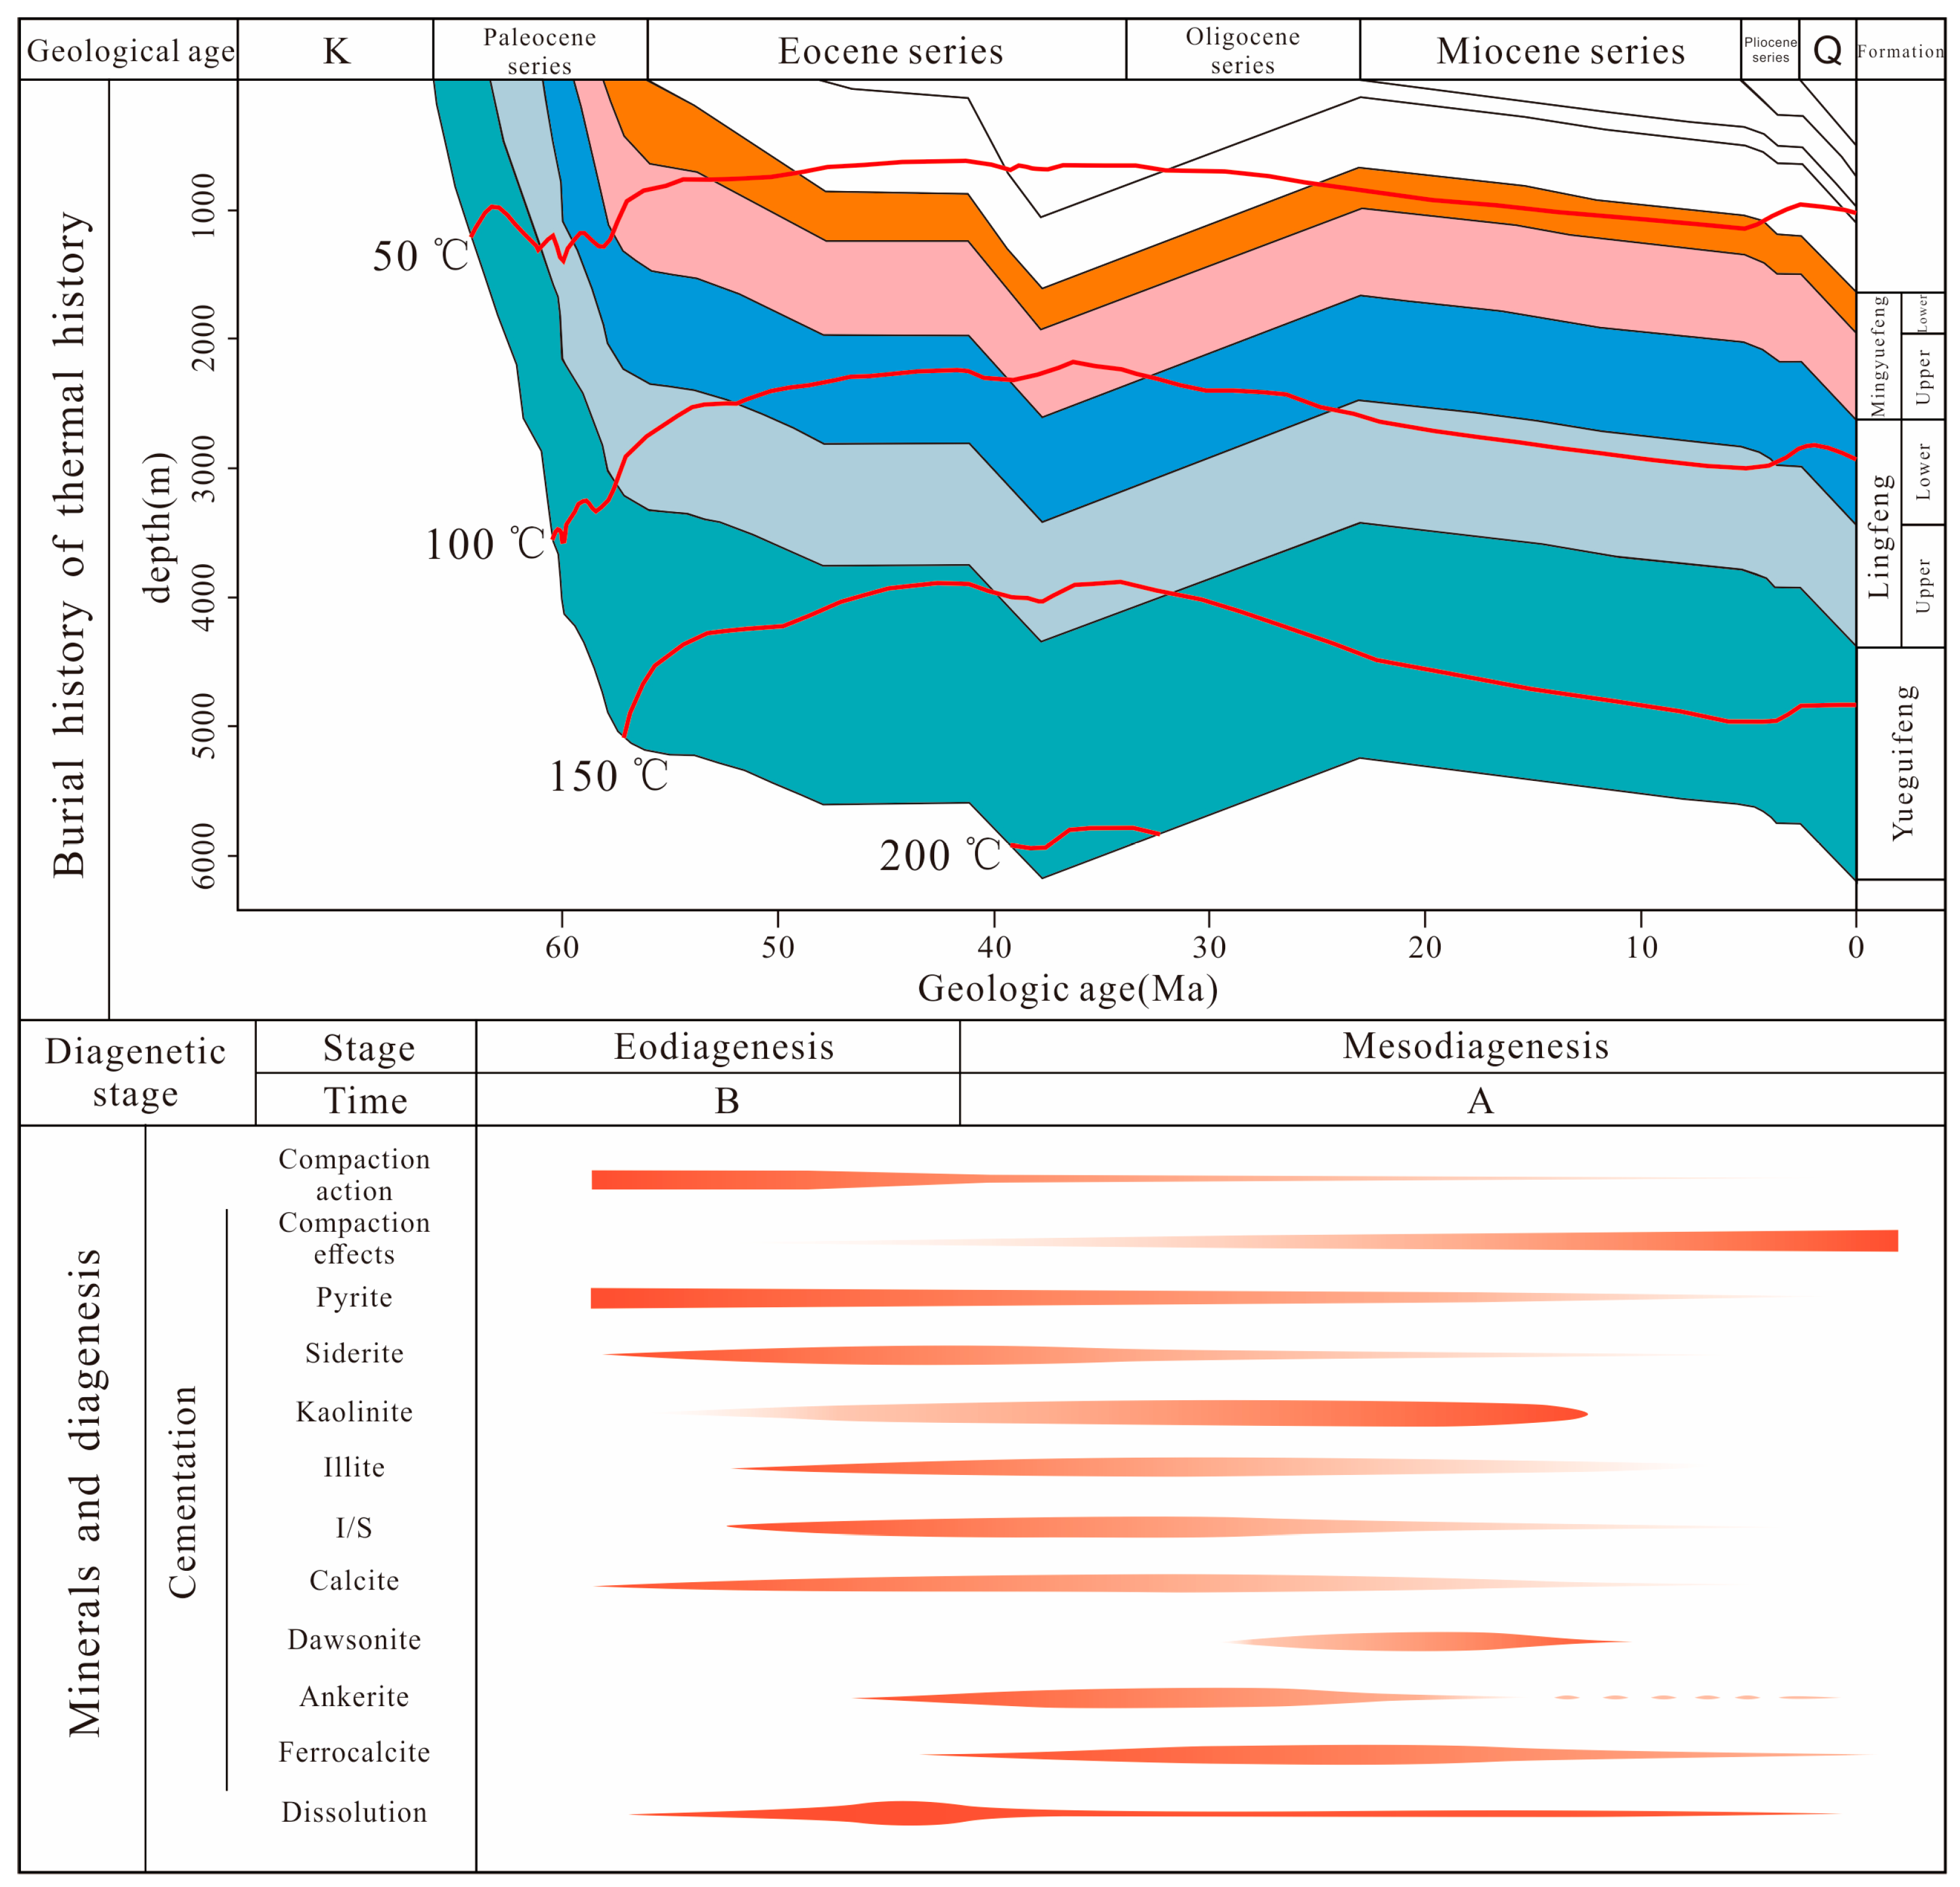
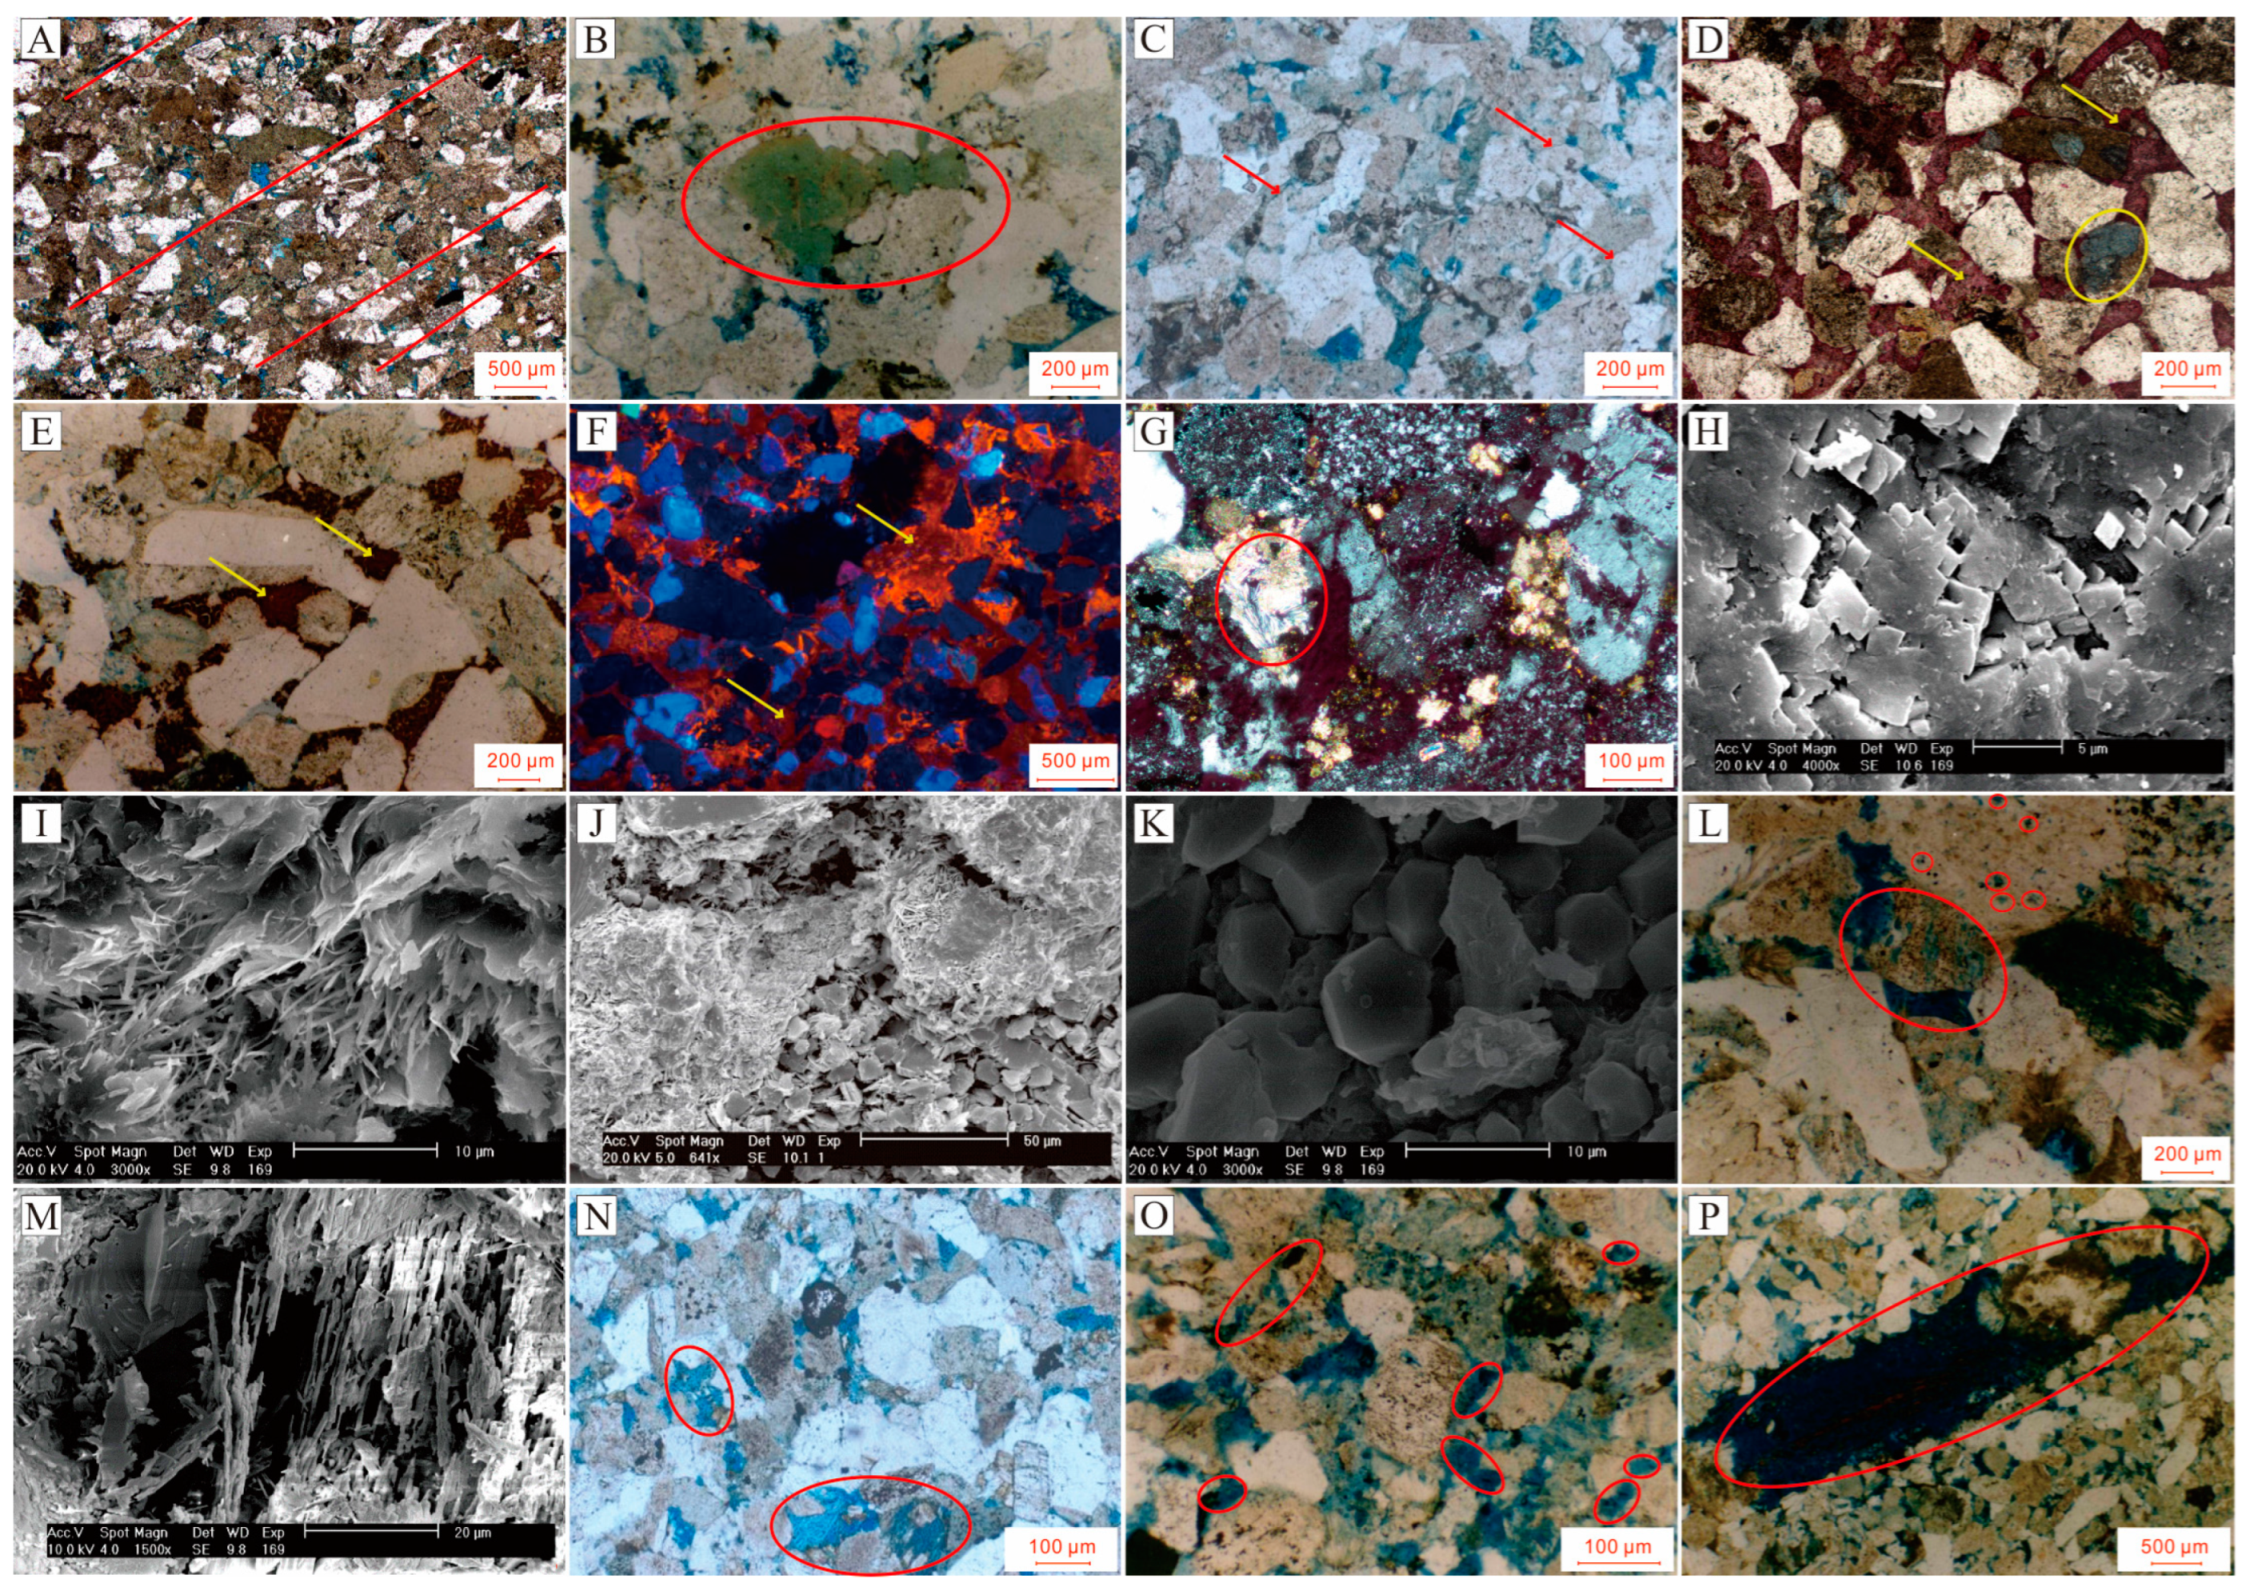
4.3. Diagenesis Type of Reservoir
4.3.1. Compaction
4.3.2. Cementation
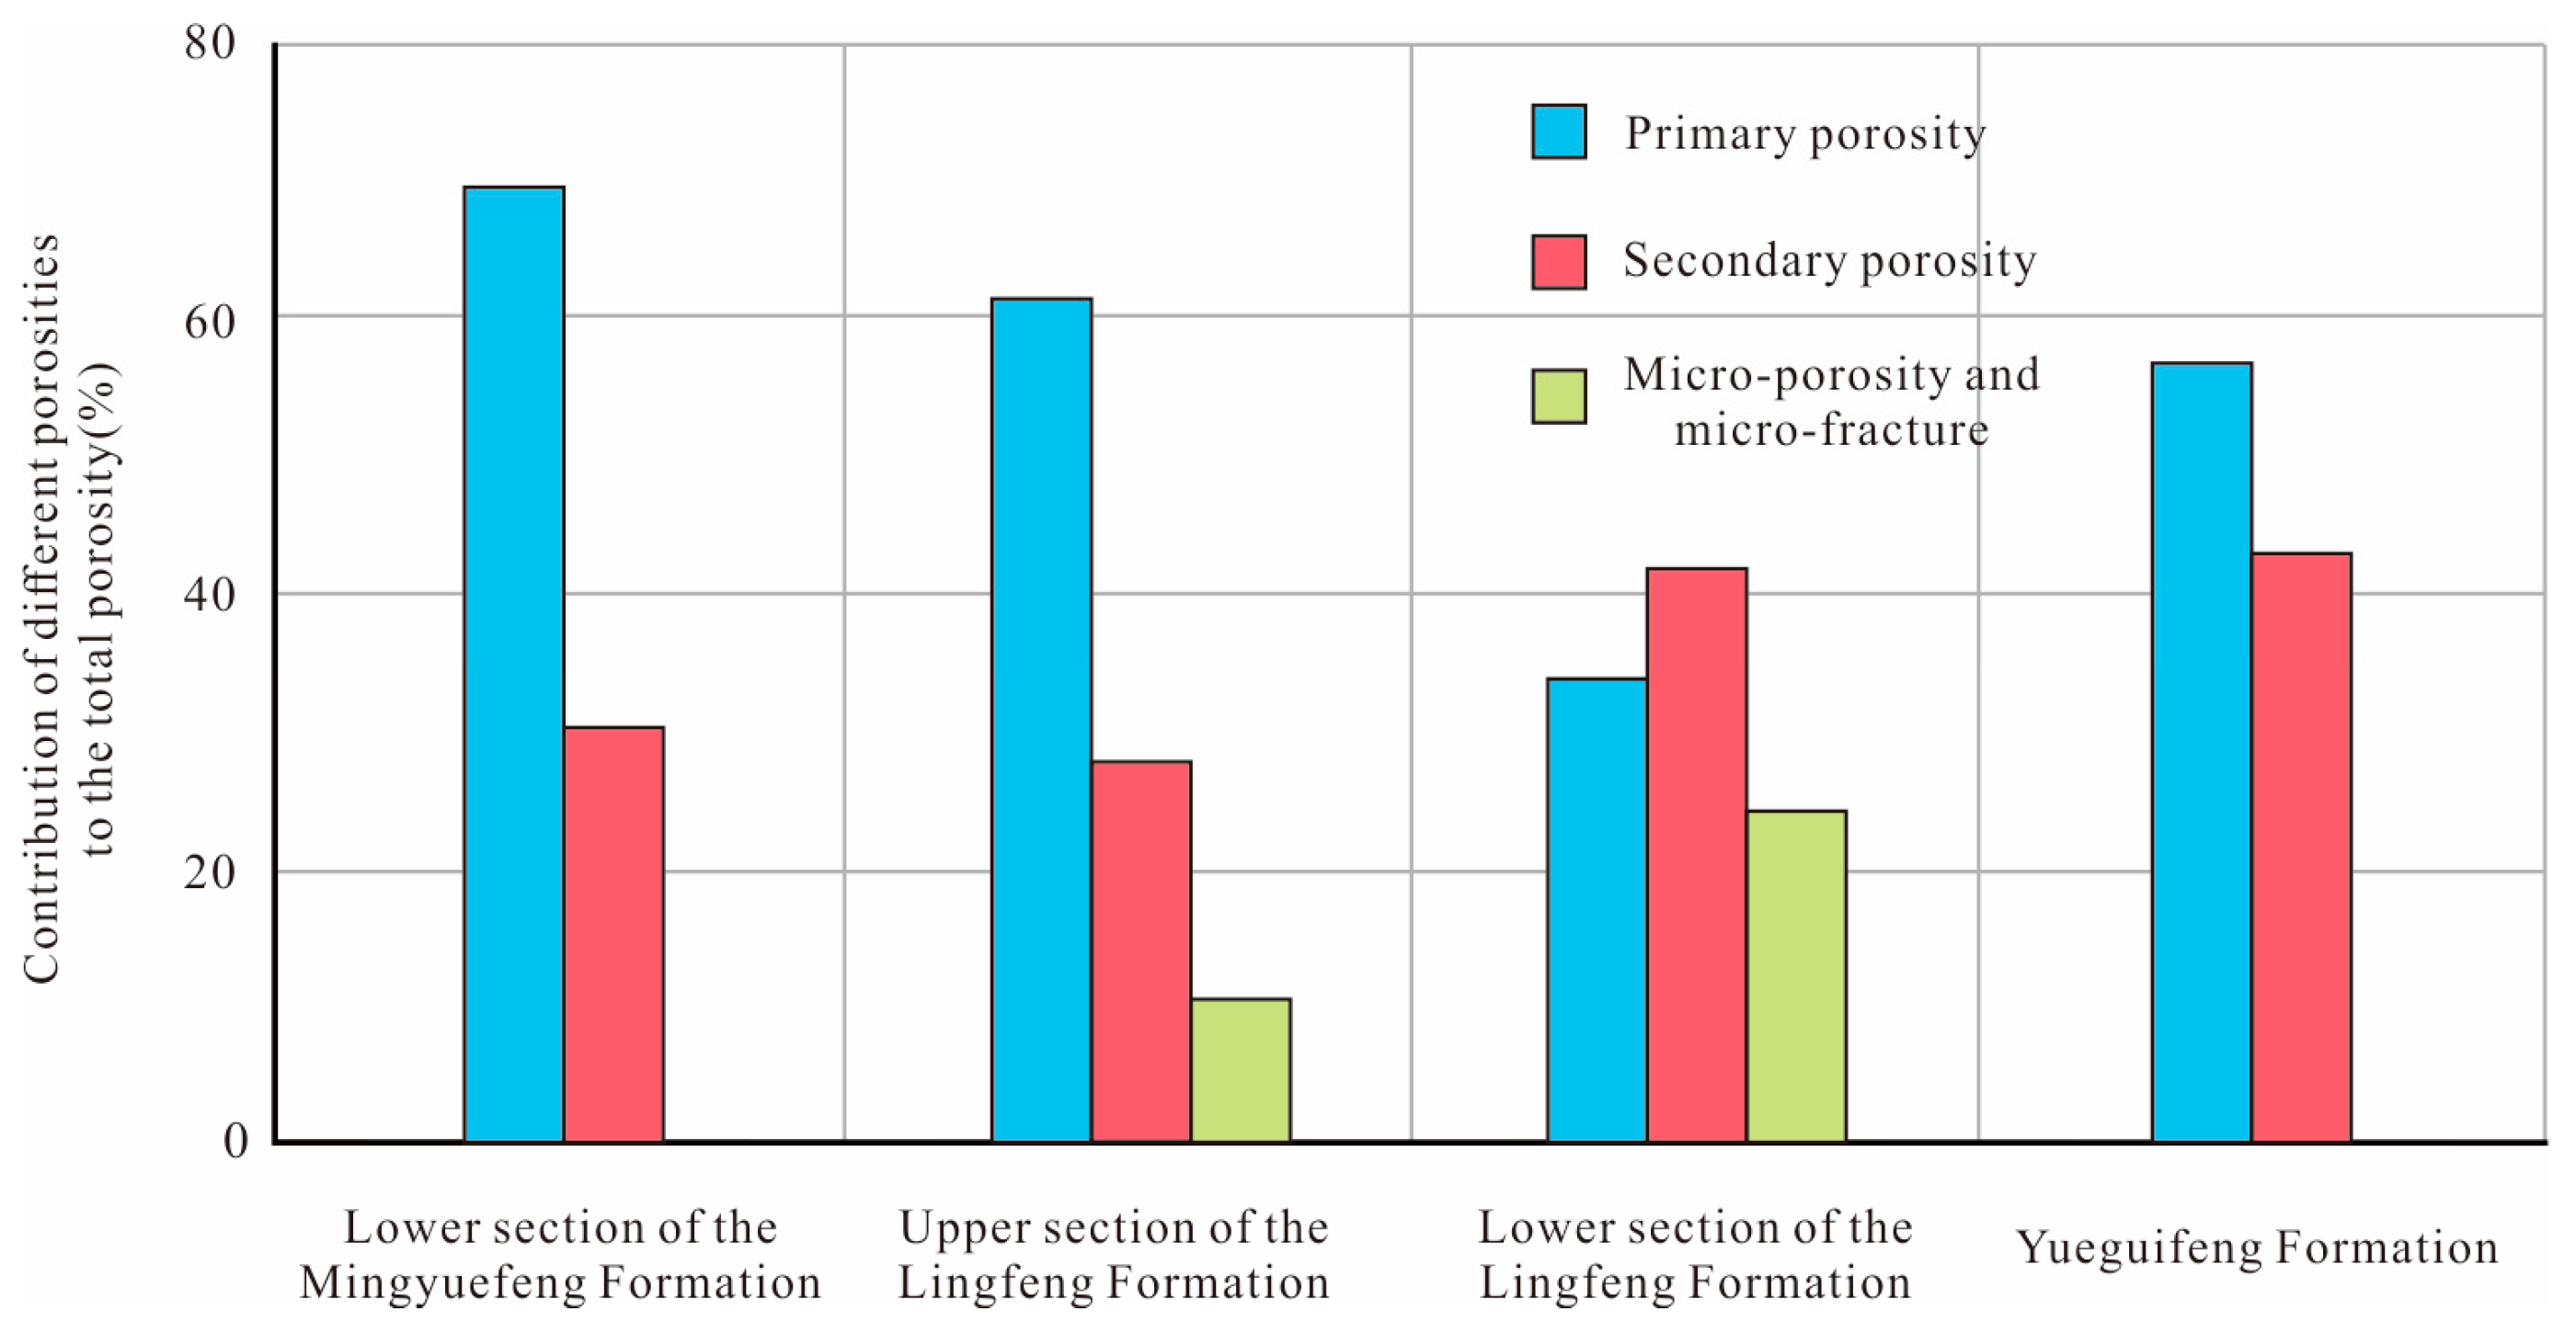
4.3.3. Dissolution
5. Discussion
5.1. Characteristics and Classification of Reservoir Diagenetic Facies
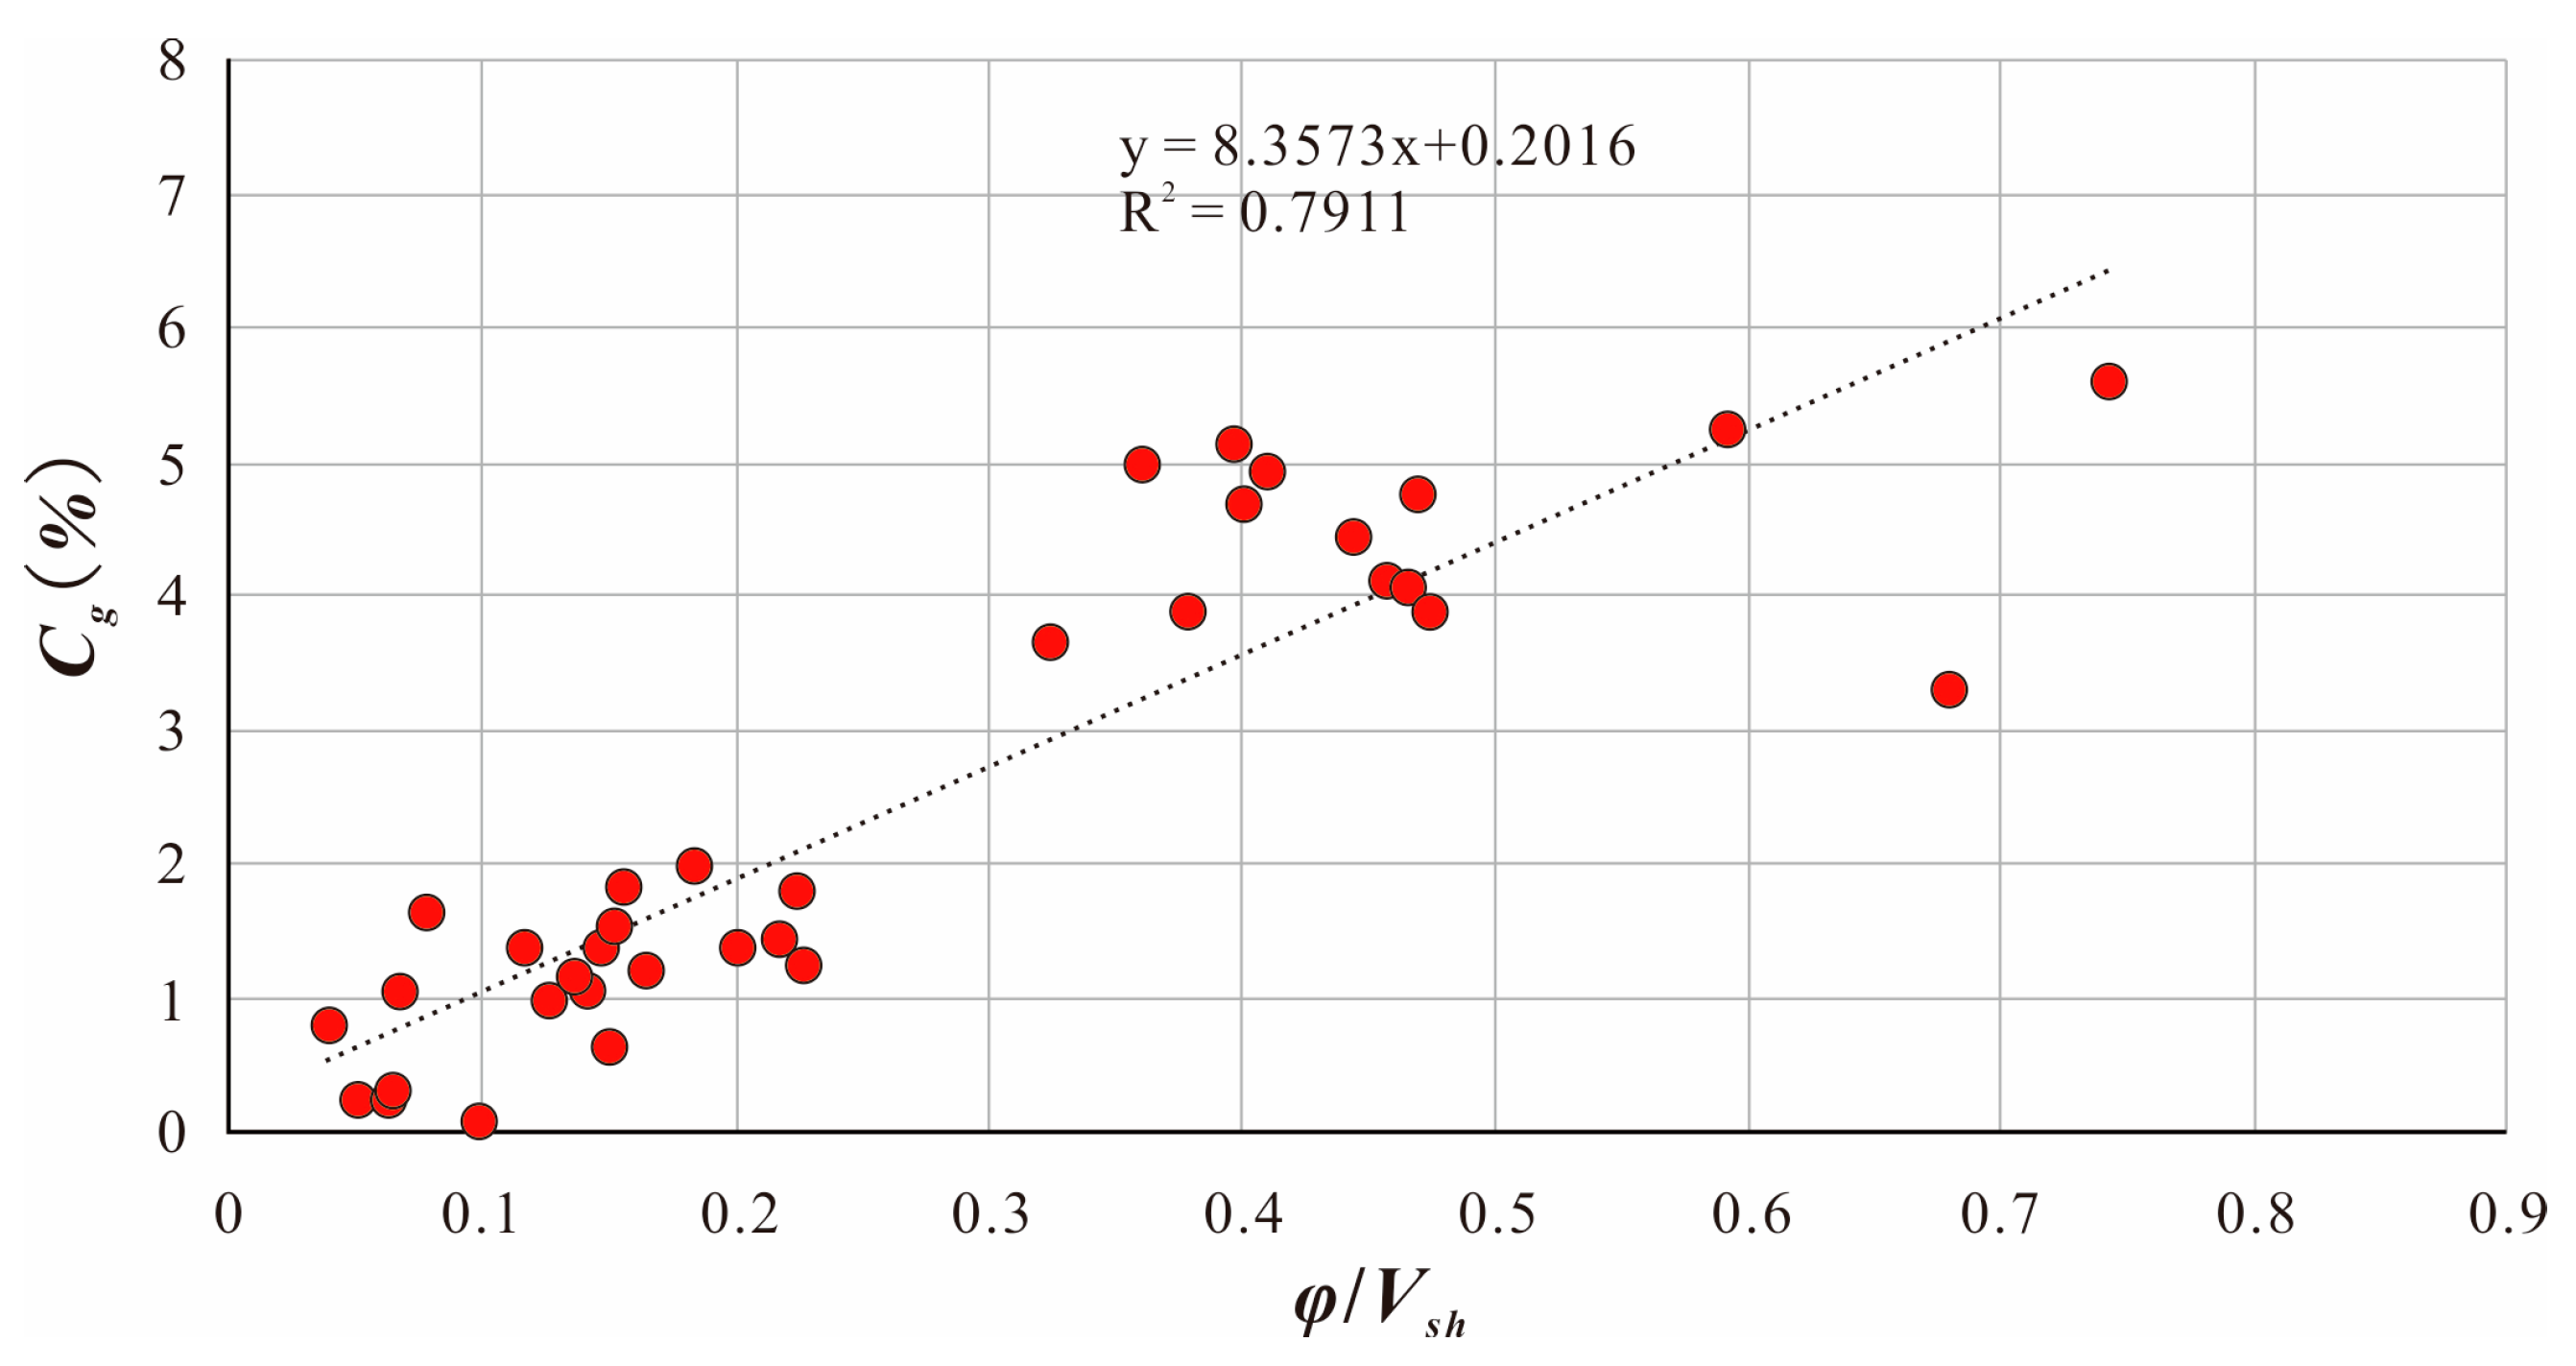
5.2. Quantitative Characterization Method for Diagenetic Facies Logging
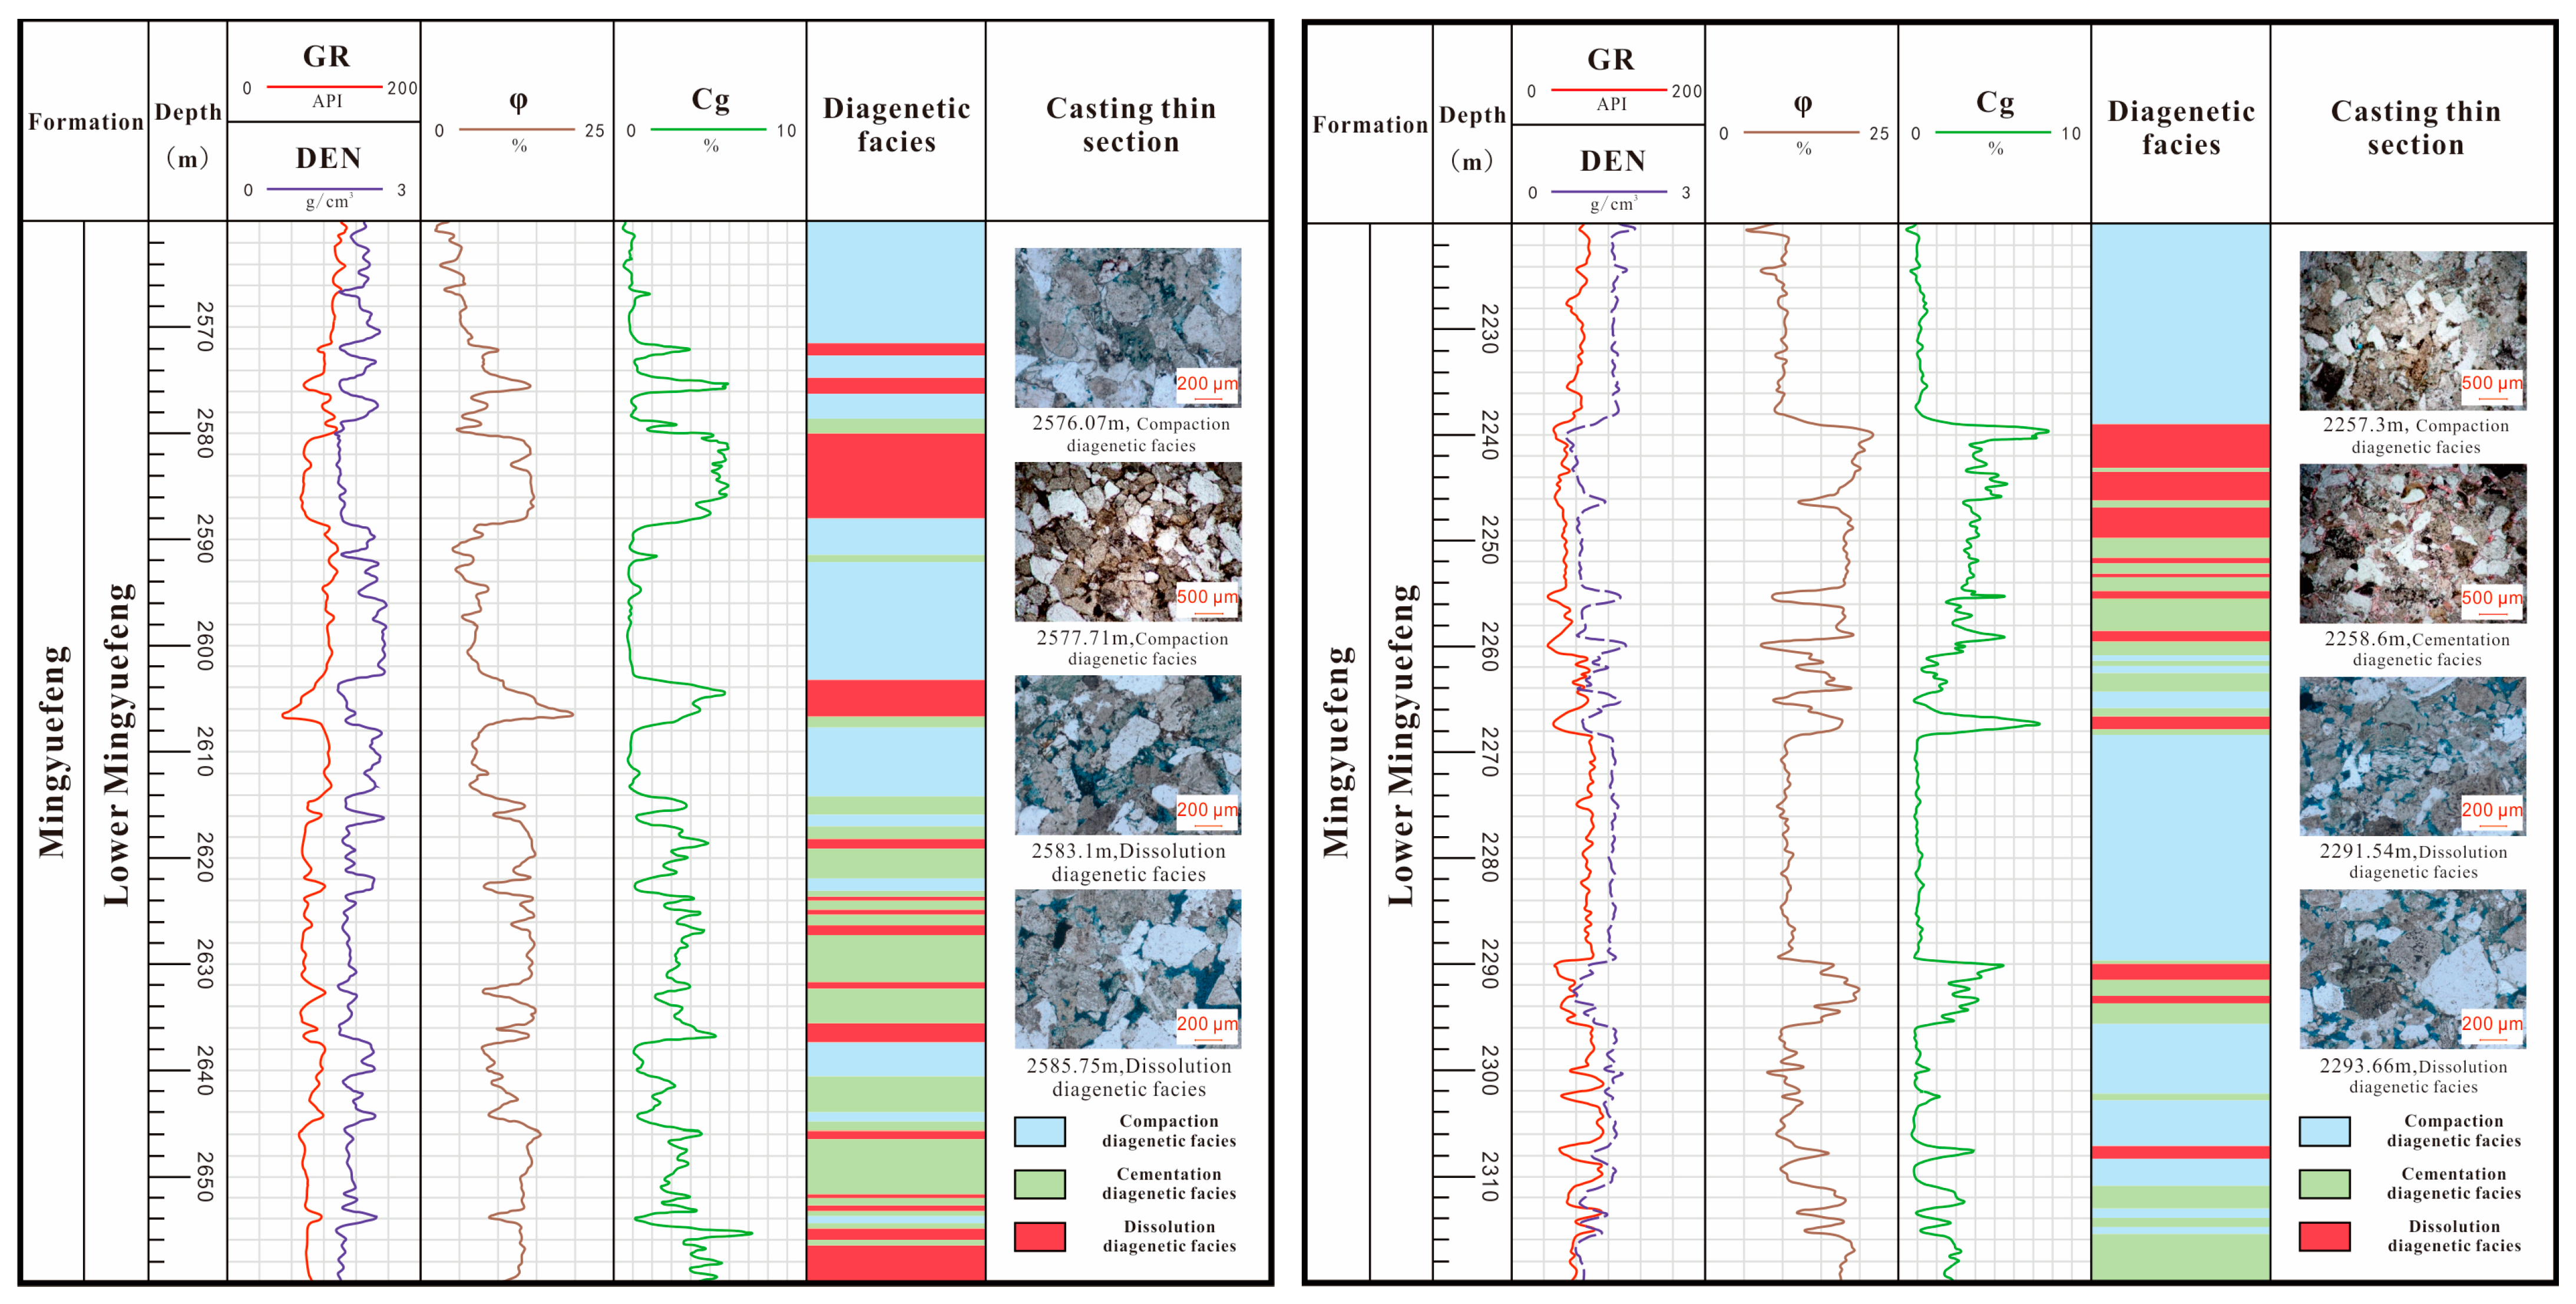
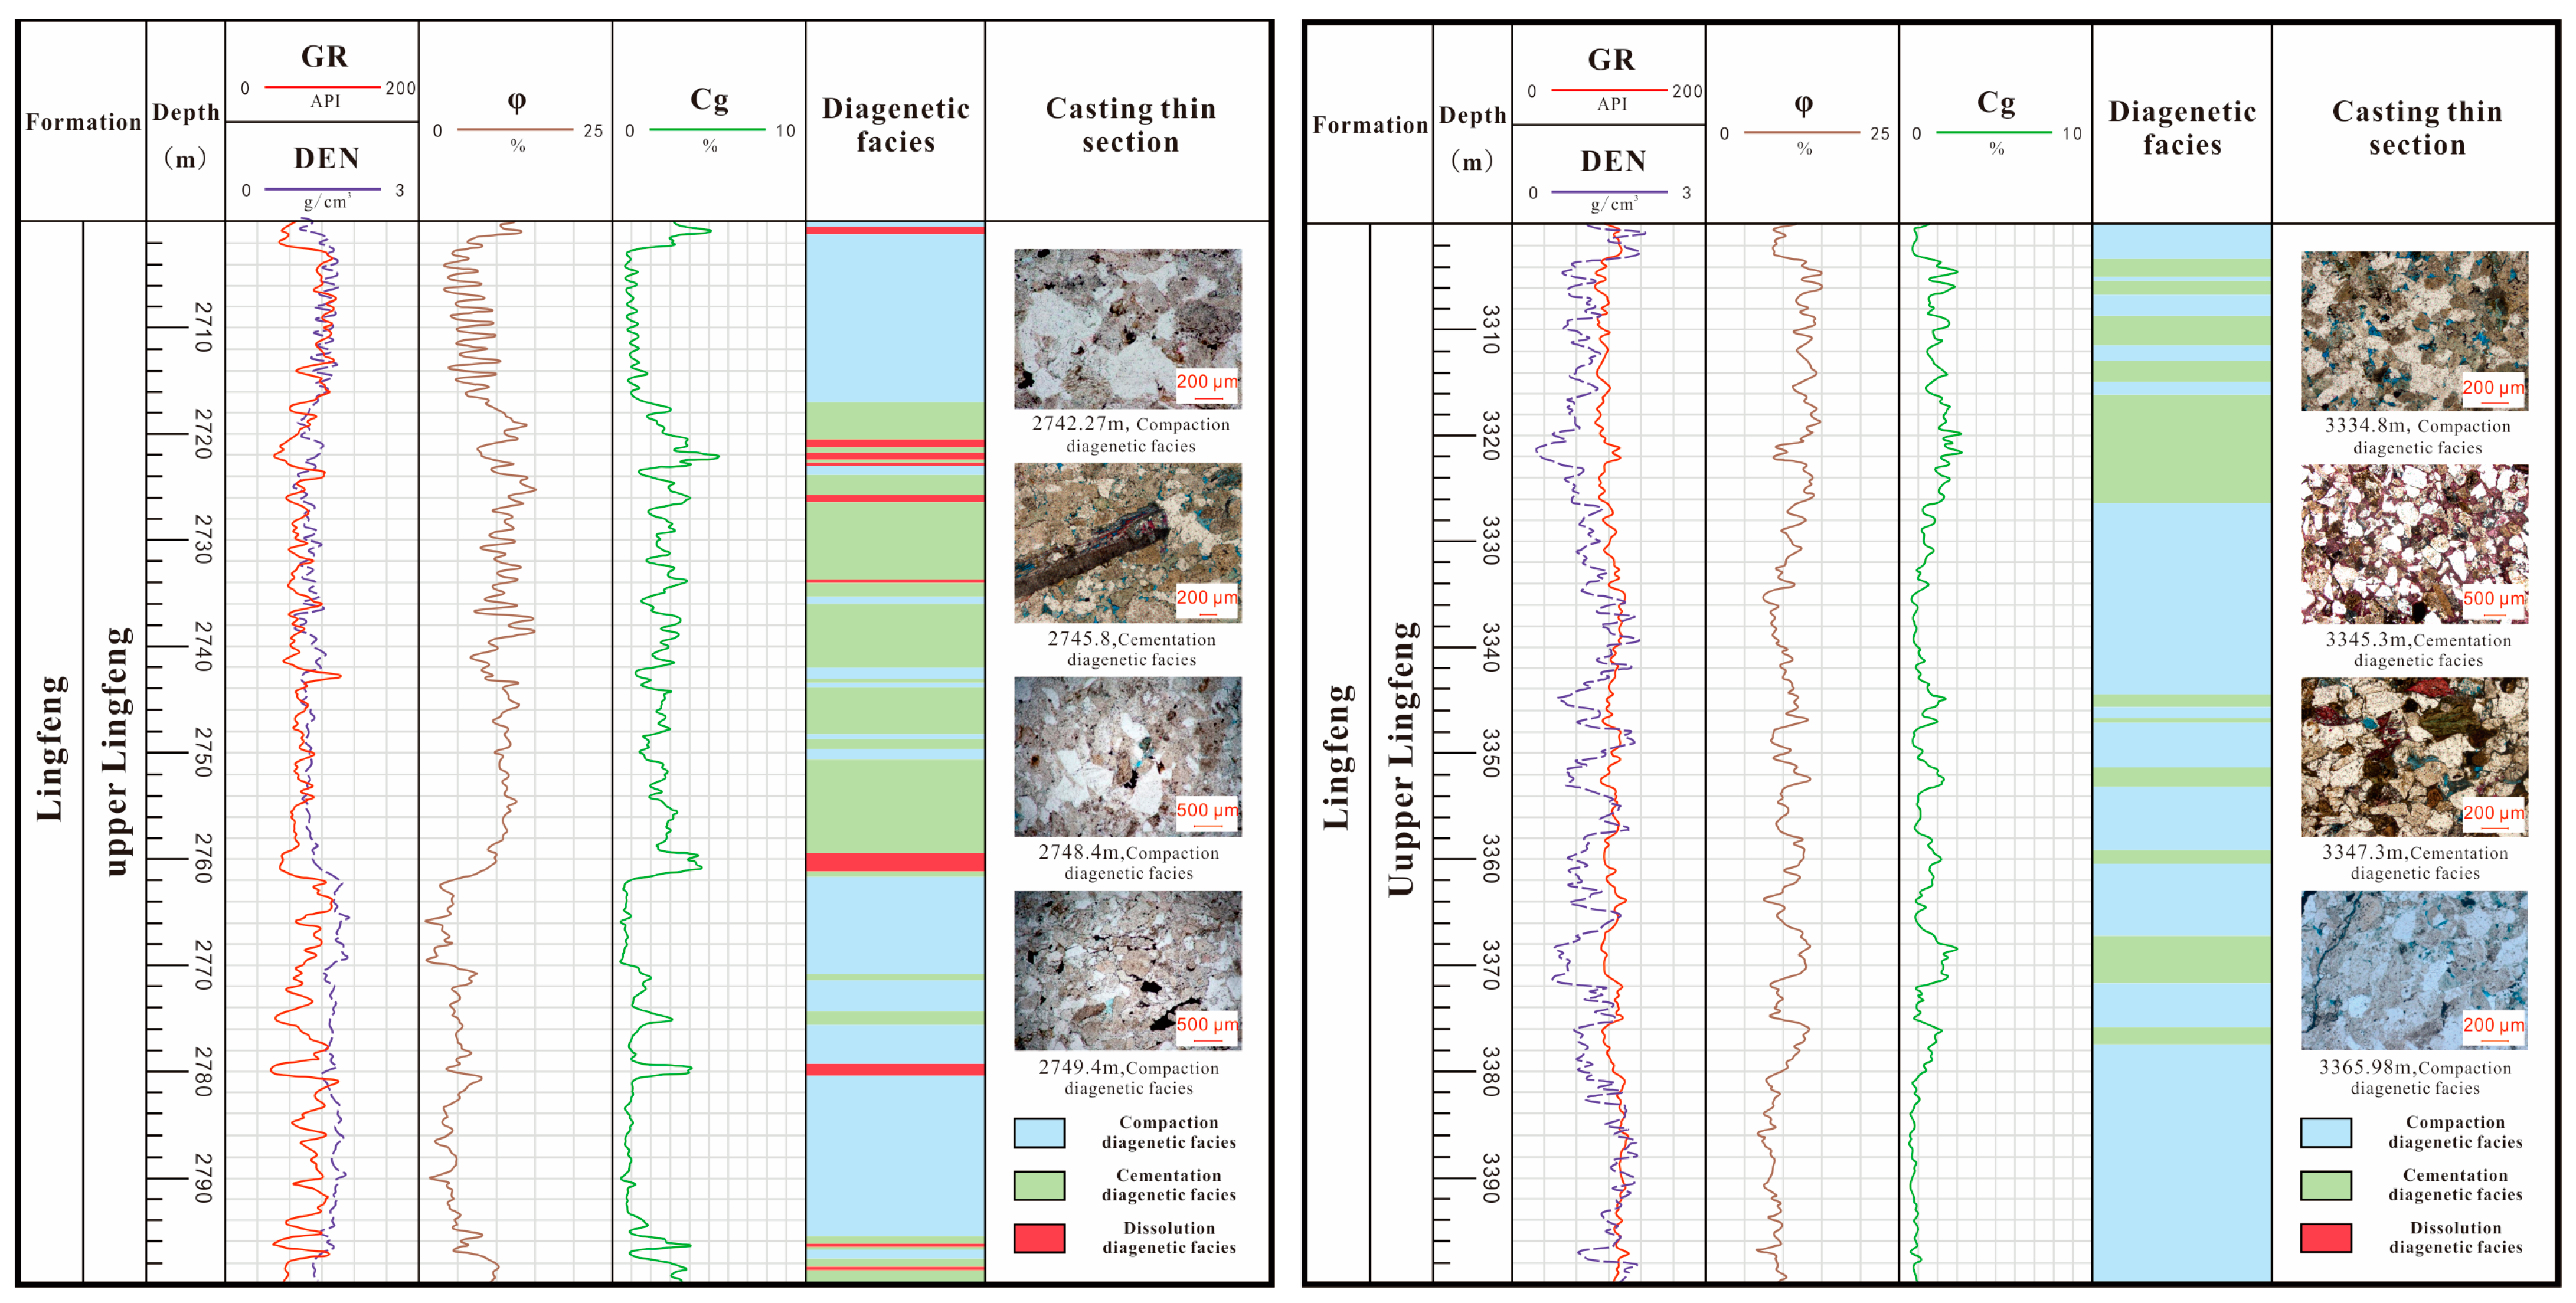
5.3. Single-Well Diagenetic Facies Discrimination
5.4. Implications of Diagenetic Facies Control on Reservoir Quality for Hydrocarbon Exploration
6. Conclusions
Author Contributions
Funding
Data Availability Statement
Acknowledgments
Conflicts of Interest
References
- Lai, J.; Wang, G.; Wang, S.; Cao, J.; Li, M.; Pang, X.; Zhou, Z.; Fan, X.; Dai, Q.; Yang, L.; et al. Review of diagenetic facies in tight sandstones: Diagenesis, diagenetic minerals, and prediction via well logs. Earth-Sci. Rev. 2018, 185, 234–258. [Google Scholar] [CrossRef]
- De Segonzac, G.D. The birth and development of the concept of diagenesis (1866–1966). Earth-Sci. Rev. 1968, 4, 153–201. [Google Scholar] [CrossRef]
- Zhang, Y.L.; Bao, Z.D.; Zhao, Y.; Jiang, L.; Zhou, Y.Q.; Gong, F.H. Origins of authigenic minerals and their impacts on reservoir quality of tight sandstones: Upper Triassic Chang-7 Member, Yanchang Formation, Ordos Basin, China. Aust. J. Earth Sci. 2017, 64, 519–536. [Google Scholar] [CrossRef]
- Zhang, Y.; Pe-Piper, G.; Piper, D.J. How sandstone porosity and permeability vary with diagenetic minerals in the Scotian Basin, offshore eastern Canada: Implications for reservoir quality. Mar. Pet. Geol. 2015, 63, 28–45. [Google Scholar] [CrossRef]
- Wu, D.; Liu, S.; Chen, H.; Lin, L.; Yu, Y.; Xu, C.; Pan, B. Investigation and prediction of diagenetic facies using well logs in tight gas reservoirs: Evidences from the Xu-2 member in the Xinchang structural belt of the western Sichuan Basin, western China. J. Pet. Sci. Eng. 2020, 192, 107326. [Google Scholar] [CrossRef]
- Zou, C.N.; Tao, S.Z.; Hui, Z.; Zhang, X.X.; He, D.B.; Zhou, C.M.; Lan, W.; Wang, X.S.; Li, F.H.; Zhu, R.K.; et al. Genesis, classification, and evaluation method of diagenetic facies. Pet. Explor. Dev. 2008, 35, 526–540. [Google Scholar] [CrossRef]
- Zeng, H.; Zhu, X.; Zhu, R.; Zhang, Q. Seismic prediction of sandstone diagenetic facies: Applied to Cretaceous Qingshankou Formation in Qijia Depression, Songliao Basin, East China. Pet. Explor. Dev. 2013, 40, 287–295. [Google Scholar] [CrossRef]
- Mansurbeg, H.; Morad, S.; Salem, A.; Marfil, R.; El-Ghali, M.; Nystuen, J.; Caja, M.; Amorosi, A.; Garcia, D.; La Iglesia, A. Diagenesis and reservoir quality evolution of palaeocene deep-water, marine sandstones, the Shetland-Faroes Basin, British continental shelf. Mar. Pet. Geol. 2008, 25, 514–543. [Google Scholar] [CrossRef]
- Ajdukiewicz, J.M.; Lander, R.H. Sandstone reservoir quality prediction: The state of the art. AAPG Bull. 2010, 94, 1083–1091. [Google Scholar] [CrossRef]
- Nguyen, B.T.T.; Jones, S.J.; Goulty, N.R.; Middleton, A.J.; Grant, N.; Ferguson, A.; Bowen, L. The role of fluid pressure and diagenetic cements for porosity preservation in Triassic fluvial reservoirs of the Central Graben, North Sea. AAPG Bull. 2013, 97, 1273–1302. [Google Scholar] [CrossRef]
- Cui, Y.; Wang, G.; Jones, S.J.; Zhou, Z.; Ran, Y.; Lai, J.; Li, R.; Deng, L. Prediction of diagenetic facies using well logs—A case study from the upper Triassic Yanchang Formation, Ordos Basin, China. Mar. Pet. Geol. 2017, 81, 50–65. [Google Scholar] [CrossRef]
- Ozkan, A.; Cumella, S.P.; Milliken, K.L.; Laubach, S.E. Prediction of lithofacies and reservoir quality using well logs, Late Cretaceous Williams Fork Formation, Mamm Creek field, Piceance Basin, Colorado. AAPG Bull. 2011, 95, 1699–1723. [Google Scholar] [CrossRef]
- Zhang, X.; Zou, C.; Zhu, R.; Tao, S.; Yang, S. Reservoir diagenetic facies of the Upper Triassic Xujiahe Formation in the central Sichuan Basin. Acta Pet. Sin. 2011, 32, 257–264. [Google Scholar]
- Yujiang, S.; Liang, X.; Zhiqiang, M.; Haopeng, G. An identification method for diagenetic facies with well logs and its geological significance in low-permeability sandstones: A case study on Chang 8 reservoirs in the Jiyuan region, Ordos Basin. Acta Pet. Sin. 2011, 32, 820–828. [Google Scholar]
- Liu, H.; Zhao, Y.; Luo, Y.; Chen, Z.; He, S. Diagenetic facies controls on pore structure and rock electrical parameters in tight gas sandstone. J. Geophys. Eng. 2015, 12, 587–600. [Google Scholar] [CrossRef]
- Lai, J.; Fan, X.; Liu, B.; Pang, X.; Zhu, S.; Xie, W.; Wang, G. Qualitative and quantitative prediction of diagenetic facies via well logs. Mar. Pet. Geol. 2020, 120, 104486. [Google Scholar] [CrossRef]
- Li, Y.; Zhang, J.; Liu, Y.; Shen, W.; Chang, X.; Sun, Z.; Xu, G. Organic geochemistry, distribution and hydrocarbon potential of source rocks in the Paleocene, Lishui Sag, East China Sea Shelf Basin. Mar. Pet. Geol. 2019, 107, 382–396. [Google Scholar] [CrossRef]
- Liu, J. Fine description of structure research of Lishui sag, East China Sea Basin. Arab. J. Geosci. 2014, 8, 4433–4441. [Google Scholar] [CrossRef]
- Lei, C.; Yin, S.; Ye, J.; Wu, J.; Wang, Z.; Gao, B. Characteristics and deposition models of the paleocene source rocks in the Lishui Sag, east China sea shelf basin: Evidences from organic and inorganic geochemistry. J. Pet. Sci. Eng. 2021, 200, 108342. [Google Scholar] [CrossRef]
- Zhang, M.; Zhang, J.; Xu, F.; Li, J.; Liu, J.; Hou, G.; Zhang, P. Paleocene sequence stratigraphy and depositional systems in the Lishui Sag, East China Sea Shelf Basin. Mar. Pet. Geol. 2015, 59, 390–405. [Google Scholar] [CrossRef]
- Lai, J.; Wang, G.; Cai, C.; Fan, Z.; Wang, S.; Chen, J.; Luo, G. Diagenesis and reservoir quality in tight gas sandstones: The fourth member of the Upper Triassic Xujiahe Formation, Central Sichuan Basin, Southwest China. Geol. J. 2017, 53, 629–646. [Google Scholar] [CrossRef]
- Fa, X.; Penghui, Z.; Jinliang, Z.; Jinshui, L.; Guowei, H.; Ming, Z.; Jingzhe, L.; Shasha, L.; Jiaqi, G.; Ningning, M. Diagenesis and Diagenetic Evolution of Deltaic and Neritic Gas-Bearing Sandstones in the Lower Mingyuefeng Formation of Paleogene, Lishui Sag, East China Sea Shelf Basin: Implications for Depositional Environm. Acta Geol. Sin. 2015, 89, 1625–1635. [Google Scholar] [CrossRef]
- Liu, L.; Li, Y.; Dong, H.; Sun, Z. Diagenesis and reservoir quality of Paleocene tight sandstones, Lishui Sag, East China Sea Shelf Basin. J. Pet. Sci. Eng. 2020, 195, 107615. [Google Scholar] [CrossRef]
- Liang, J.; Wang, H. Cenozoic tectonic evolution of the East China Sea Shelf Basin and its coupling relationships with the Pacific Plate subduction. J. Asian Earth Sci. 2019, 171, 376–387. [Google Scholar] [CrossRef]
- Xu, F.; Zhang, P.H.; Zhang, J.L.; Zhang, M. Diagenetic Facies in Paleocene Sandstones, Lishui Sag, East China Sea. Adv. Mater. Res. 2013, 807–809, 2170–2173. [Google Scholar] [CrossRef]
- Sun, Z.; Zhang, J.; Liu, Y.; Shen, W.; Li, Y.; Li, L. Sedimentological Signatures and Identification of Sedimentary Facies of the Paleocene in the Lishui Sag, East China Sea Shelf Basin. Can. J. Earth Sci. 2019, 57, 377–395. [Google Scholar] [CrossRef]
- Huang, Y.; Tarantola, A.; Wang, W.; Caumon, M.-C.; Pironon, J.; Lu, W.; Yan, D.; Zhuang, X. Charge history of CO2 in Lishui sag, East China Sea basin: Evidence from quantitative Raman analysis of CO2-bearing fluid inclusions. Mar. Pet. Geol. 2018, 98, 50–65. [Google Scholar] [CrossRef]
- Fu, C.; Li, S.; Li, S.; Xu, J.; Huang, Y. Genetic types of mudstone in a closed-lacustrine to open-marine transition and their organic matter accumulation patterns: A case study of the paleocene source rocks in the east China sea basin. J. Pet. Sci. Eng. 2022, 208, 109343. [Google Scholar] [CrossRef]
- Liu, J.S.; Zhang, M.; Zhang, J.L.; Wang, C.Y.; Zhang, P.H. Tectonic Evolution and Sequence Filling of Paleocene in Lishui Sag, East China Sea Shelf Basin. Adv. Mater. Res. 2013, 807–809, 2244–2248. [Google Scholar] [CrossRef]
- Han, X.; Hou, D.; Cheng, X.; Li, Y. Impact of Terrigenous Organic Matter Input on Organic Matter Enrichment of Paleocene Source Rocks, Lishui Sag, East China Sea. Energies 2023, 16, 2046. [Google Scholar] [CrossRef]
- Su, A.; Chen, H.; Cao, L.; Lei, M.; Wang, C.; Liu, Y.; Li, P. Genesis, source and charging of oil and gas in Lishui sag, East China Sea Basin. Pet. Explor. Dev. 2014, 41, 574–584. [Google Scholar] [CrossRef]
- Hou, G.; Liu, J.; Cai, K.; Wang, Y. Analysis of Sandbody Development Model in Lishui Depression. Earth Sci. Res. 2018, 7, 18–24. [Google Scholar] [CrossRef]
- Houseknecht, D.W. Assessing the relative importance of compaction processes and cementation to reduction of porosity in sandstones. AAPG Bull. 1987, 71, 501–510. [Google Scholar]
- Hongkun, L.; Yong, A.; Guiwen, W.; Kangjun, C.; Deyang, C.; Juntao, C.; Yuqiang, X.; Dong, L.; Jin, L. Quantitative well logging evaluation of diagenetic facies of deep and ultra deep tight sandstone reservoirs: A case study of Bozi-Dabei area in Kuqa Depression. Bull. Geol. Sci. Technol. 2023, 42, 299–310. [Google Scholar]
- Ning, Y.A.; Guiwen, W.A.; Chaoliu, L.I. Reservoir diagenetic facies of Bashijiqike Formation in Dabei gas field compartmentalization and quantitative evaluation. J. China Univ. Pet. 2014, 38, 18–24. [Google Scholar]
- Ziqi, S.; Jing, W.; Xiangwei, L.; Xiaolong, Y.; Lilei, Y.; Hongyu, Z. Speciallow permeability reservoir diagenetic reservoir faciesquantitative evaluation method. Pet. Geol. Recovery Efficiecy 2006, 13, 21–23. [Google Scholar]
- Qigui, C.; Lei, Z.; Haini, Z.; Fuhua, G. Based on the diagenesis of quantitative characterizationof diagenetic reservoir facies classification and signifi-cance. J. Pet. Nat. Gas 2010, 32, 60–65. [Google Scholar]
- Lai, J.; Wang, G.; Chai, Y.; Ran, Y.; Zhang, X. Depositional and Diagenetic Controls on Pore Structure of Tight Gas Sandstone Reservoirs: Evidence from Lower Cretaceous Bashijiqike Formation in Kelasu Thrust Belts, Kuqa Depression in Tarim Basin of West China. Resour. Geol. 2015, 65, 55–75. [Google Scholar] [CrossRef]
- Li, Y.; Qiao, W.; Yang, X.; Wu, Y.; Li, X.; Zhang, S. A Comprehensive Classification Method for the Pore Permeability of Deep-Mine Sandstone Used to Guide Grouting. Appl. Sci. 2023, 13, 1840. [Google Scholar] [CrossRef]
- Zhu, P.; Dong, Y.; Chen, M.; Li, Z.; Han, B.; Wang, J.; Cui, Y. Quantitative evaluation of pore structure from mineralogical and diagenetic information extracted from well logs in tight sandstone reservoirs. J. Nat. Gas Sci. Eng. 2020, 80, 103376. [Google Scholar] [CrossRef]
- Carvalho, M.V.F.; Ros, L.F.D.; Gomes, N.S. Carbonate cementation patterns and diagenetic reservoir facies in the Campos Basin Cretaceous turbidites, offshore eastern Brazil. Mar. Pet. Geol. 1995, 12, 741–758. [Google Scholar] [CrossRef]
- Rushing, J.A.; Newsham, K.E.; Blasingame, T.A. Rock Typing: Keys to Understanding Productivity in Tight Gas Sands. J. Pet. Technol. 2008, 60, 53–54. [Google Scholar]
- Guo-min, F.; Xiao-li, Q.; Qing, M.; Tian-jin, Z.; Jian-peng, Y. Division of diagenesis reservoir facies and its control—Case study of Chang-3 reservoir in Yangchang formation of Fuxian exploration area in northern Shaanxi. Min. Sci. Technol. 2009, 19, 0537–0543. [Google Scholar]
- Shirley, D.P.F.; Robert, L.G. Diagenetic controls on evolution of porosity and permeability in lower Tertiary Wilcox sandstones from shallow to ultradeep (200–6700 m) burial, Gulf of Mexico Basin, U.S.A. Mar. Pet. Geol. 2010, 27, 69–81. [Google Scholar]
- Lai, J.; Wang, G.; Chai, Y.; Xin, Y.; Wu, Q.; Zhang, X.; Sun, Y. Deep burial diagenesis and reservoir quality evolution of high-temperature, high-pressure sandstones: Examples from Lower Cretaceous Bashijiqike Formation in Keshen area, Kuqa depression, Tarim basin of China. AAPG Bull. 2017, 101, 829–862. [Google Scholar] [CrossRef]


| Diagenetic Facies | Surface Pore Rate M (%) | Apparent Compaction Rate Rp (%) | Apparent Cementation Rate Rc (%) | Micro-Pore Rate Rm (%) | Filling Density Df (%) | Diagenetic Comprehensive Coefficient (%) |
|---|---|---|---|---|---|---|
| Compaction facies | 0.1~12.4 | 63.9~97.8 | 10.3~99.7 | 63.5~98.3 | 93.6~98.7 | <1.82 |
| Cementation facies | 1.3~9.8 | 36.2~73.4 | 67.1~99.8 | 28.4~94.3 | 89.2~99.6 | 1.82~3.7 |
| Dissolution facies | 3.1~14.5 | 17.3~72.5 | 8.3~65.4 | 17.9~48.1 | 79.3~91.5 | >3.7 |
Disclaimer/Publisher’s Note: The statements, opinions and data contained in all publications are solely those of the individual author(s) and contributor(s) and not of MDPI and/or the editor(s). MDPI and/or the editor(s) disclaim responsibility for any injury to people or property resulting from any ideas, methods, instructions or products referred to in the content. |
© 2023 by the authors. Licensee MDPI, Basel, Switzerland. This article is an open access article distributed under the terms and conditions of the Creative Commons Attribution (CC BY) license (https://creativecommons.org/licenses/by/4.0/).
Share and Cite
Teng, J.; Fu, Q.; Qin, J.; Ma, W.; Zhang, G.; Feng, K. Quantitative Evaluation of Paleocene Reservoir Diagenetic Facies by Logging in Lishui West Sag, East China Sea Basin. Minerals 2024, 14, 28. https://doi.org/10.3390/min14010028
Teng J, Fu Q, Qin J, Ma W, Zhang G, Feng K. Quantitative Evaluation of Paleocene Reservoir Diagenetic Facies by Logging in Lishui West Sag, East China Sea Basin. Minerals. 2024; 14(1):28. https://doi.org/10.3390/min14010028
Chicago/Turabian StyleTeng, Ji, Qiang Fu, Jun Qin, Wenrui Ma, Guanyu Zhang, and Kailong Feng. 2024. "Quantitative Evaluation of Paleocene Reservoir Diagenetic Facies by Logging in Lishui West Sag, East China Sea Basin" Minerals 14, no. 1: 28. https://doi.org/10.3390/min14010028