
Lithofacies Controls on Hydrocarbon Generation Potentiality of the Syn-Rift Late Cretaceous Rakopi Deltaic Facies in the North-Eastern Offshore Part of Taranaki Basin, New Zealand

Abstract
:1. Introduction
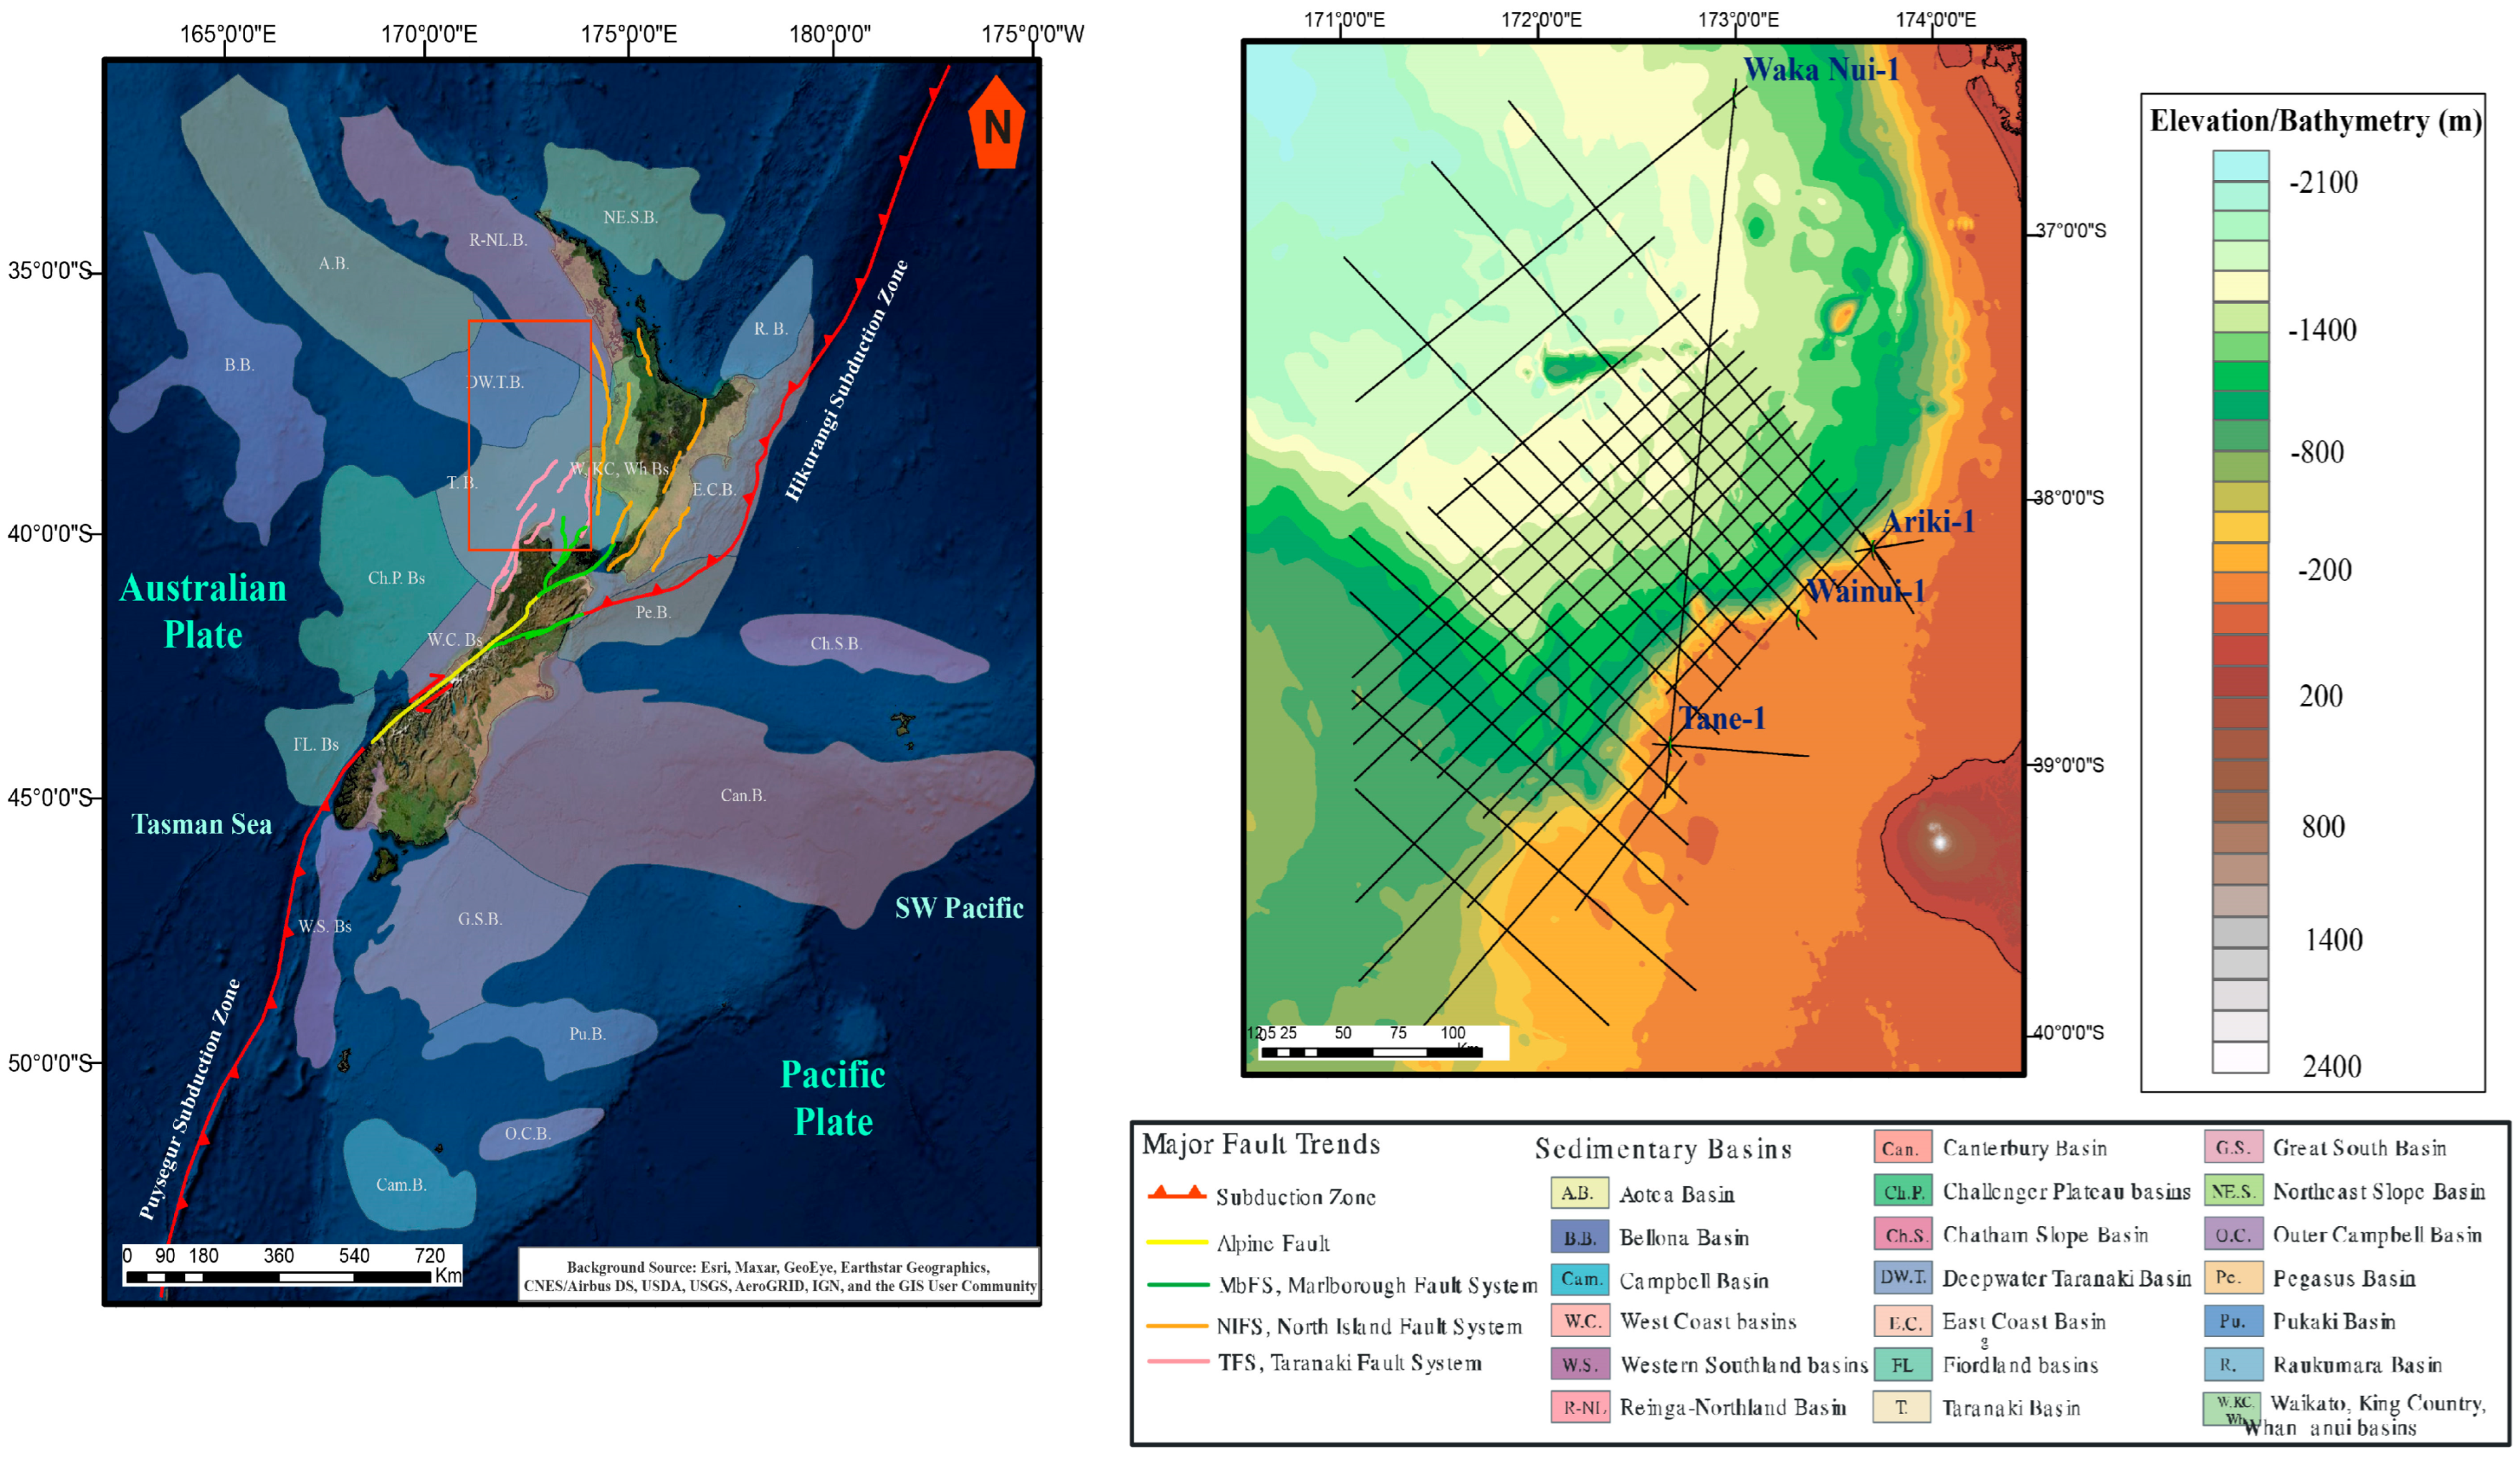
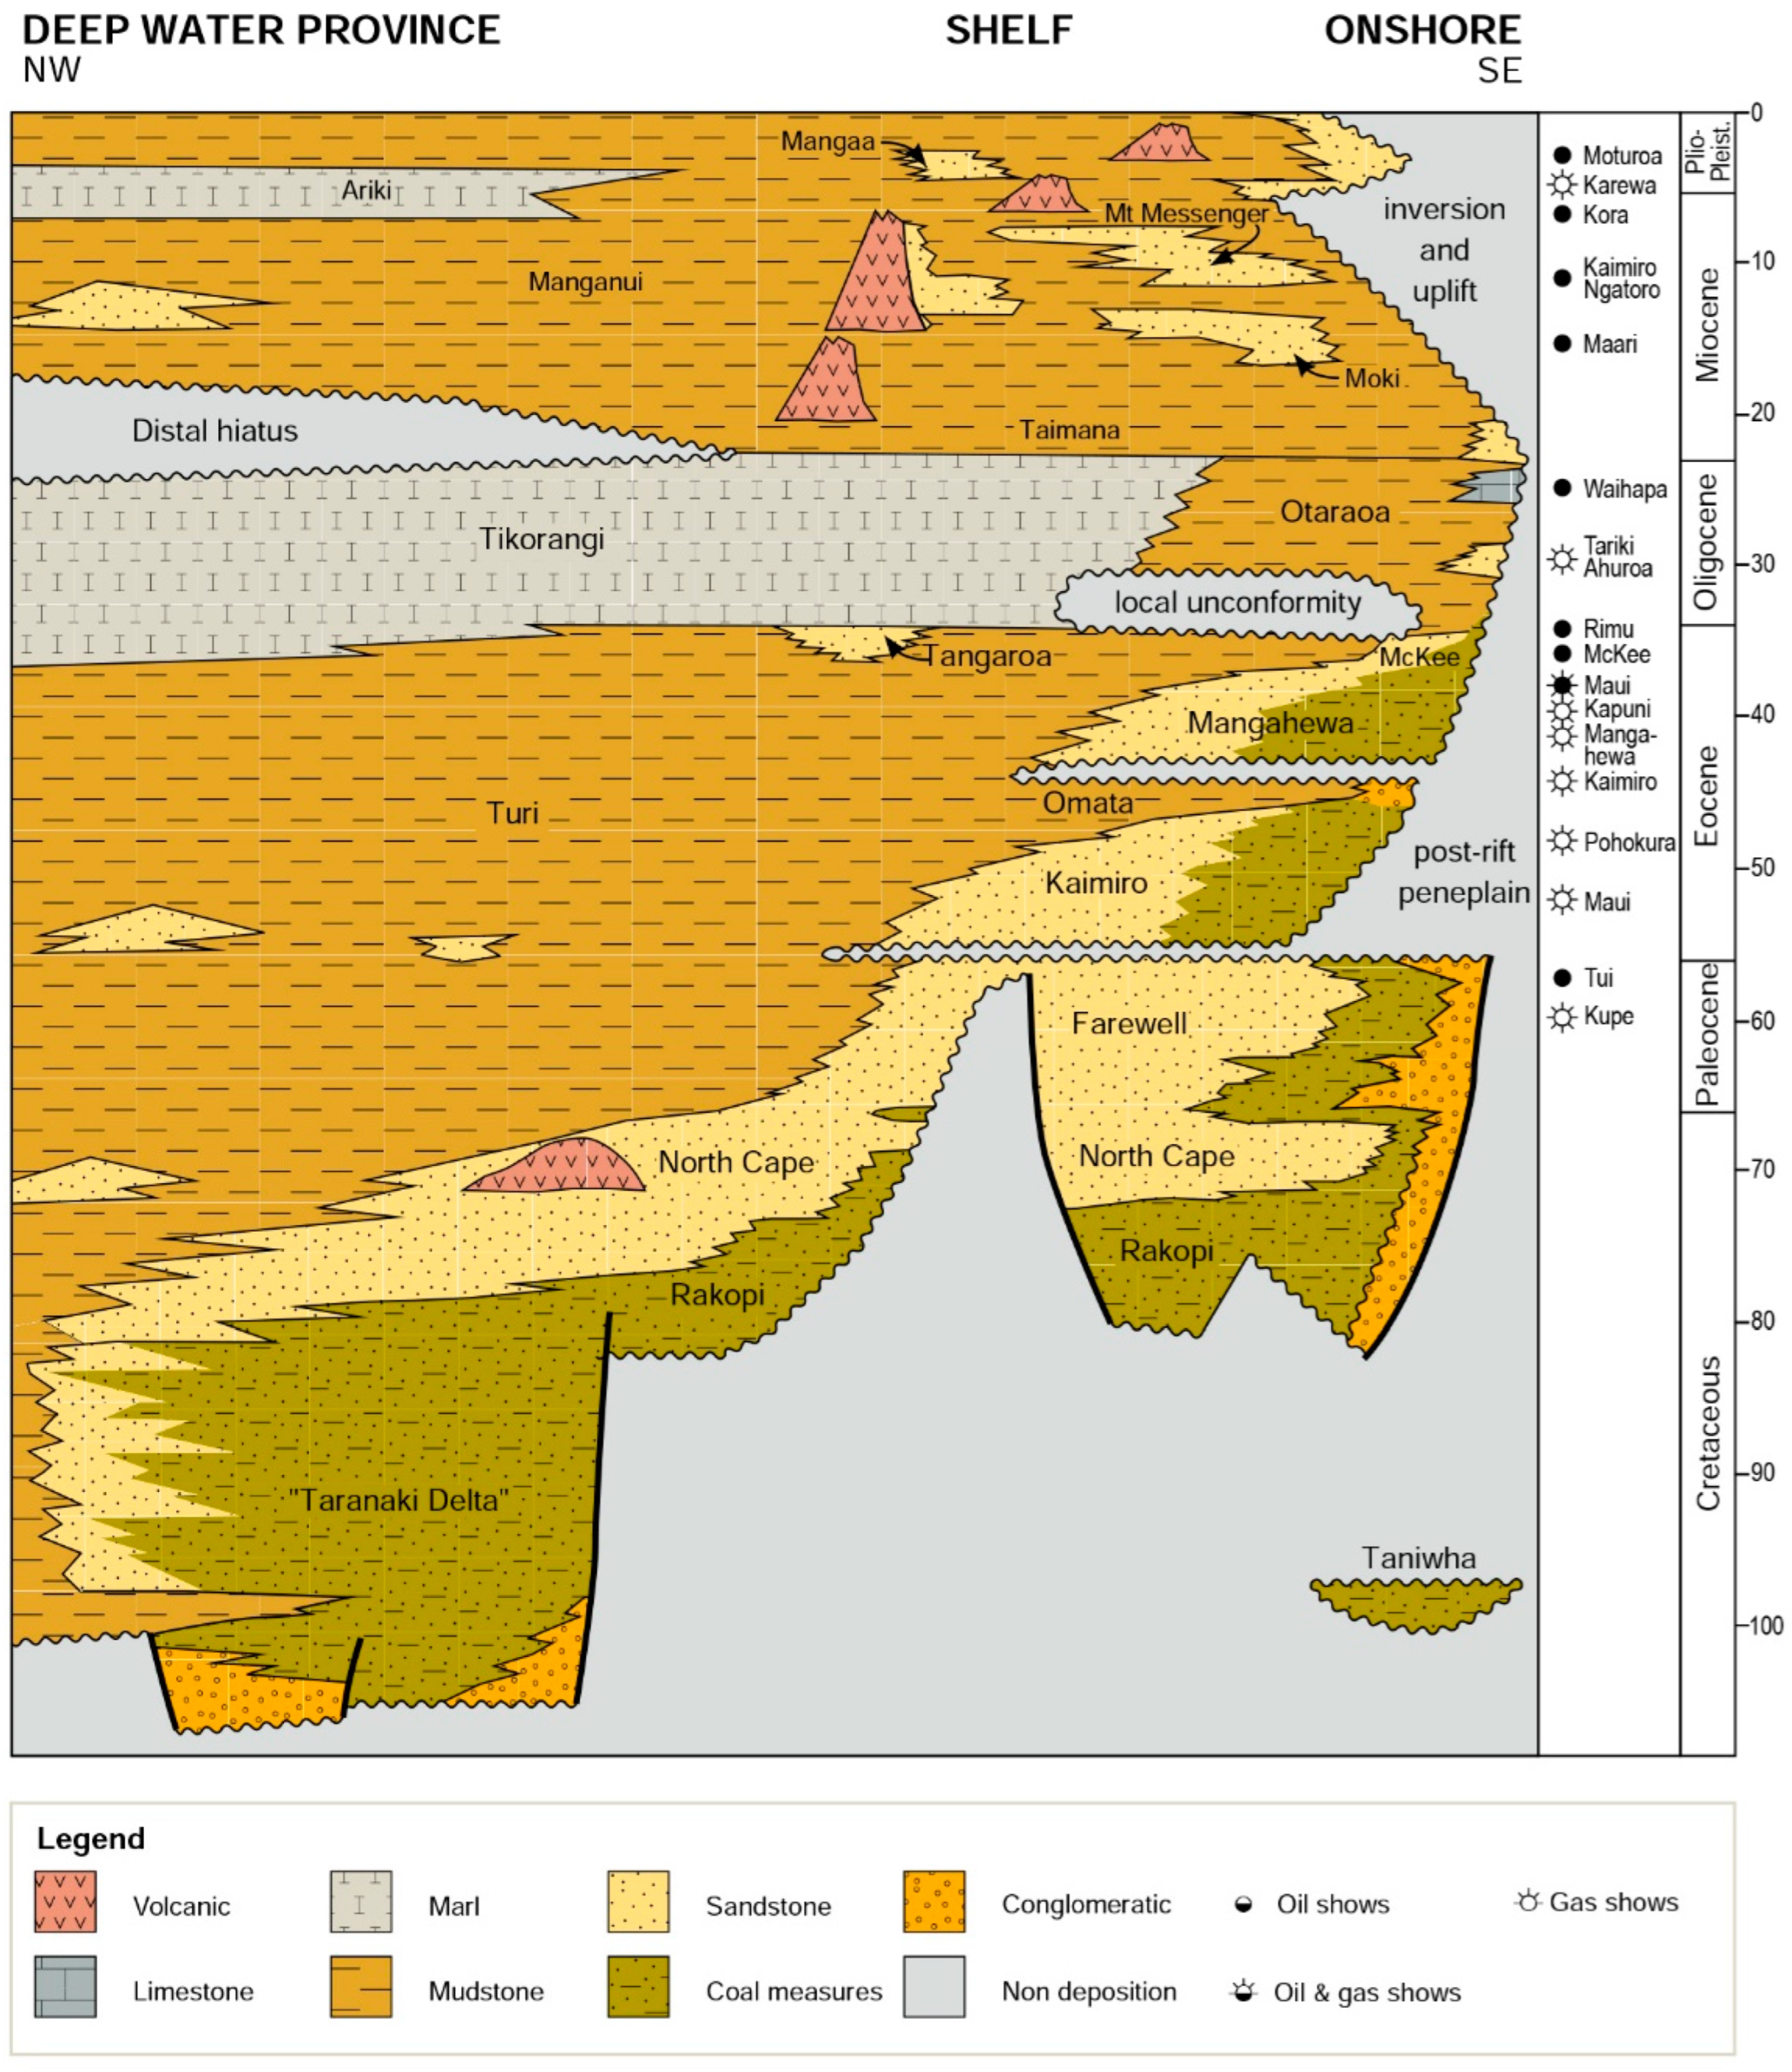
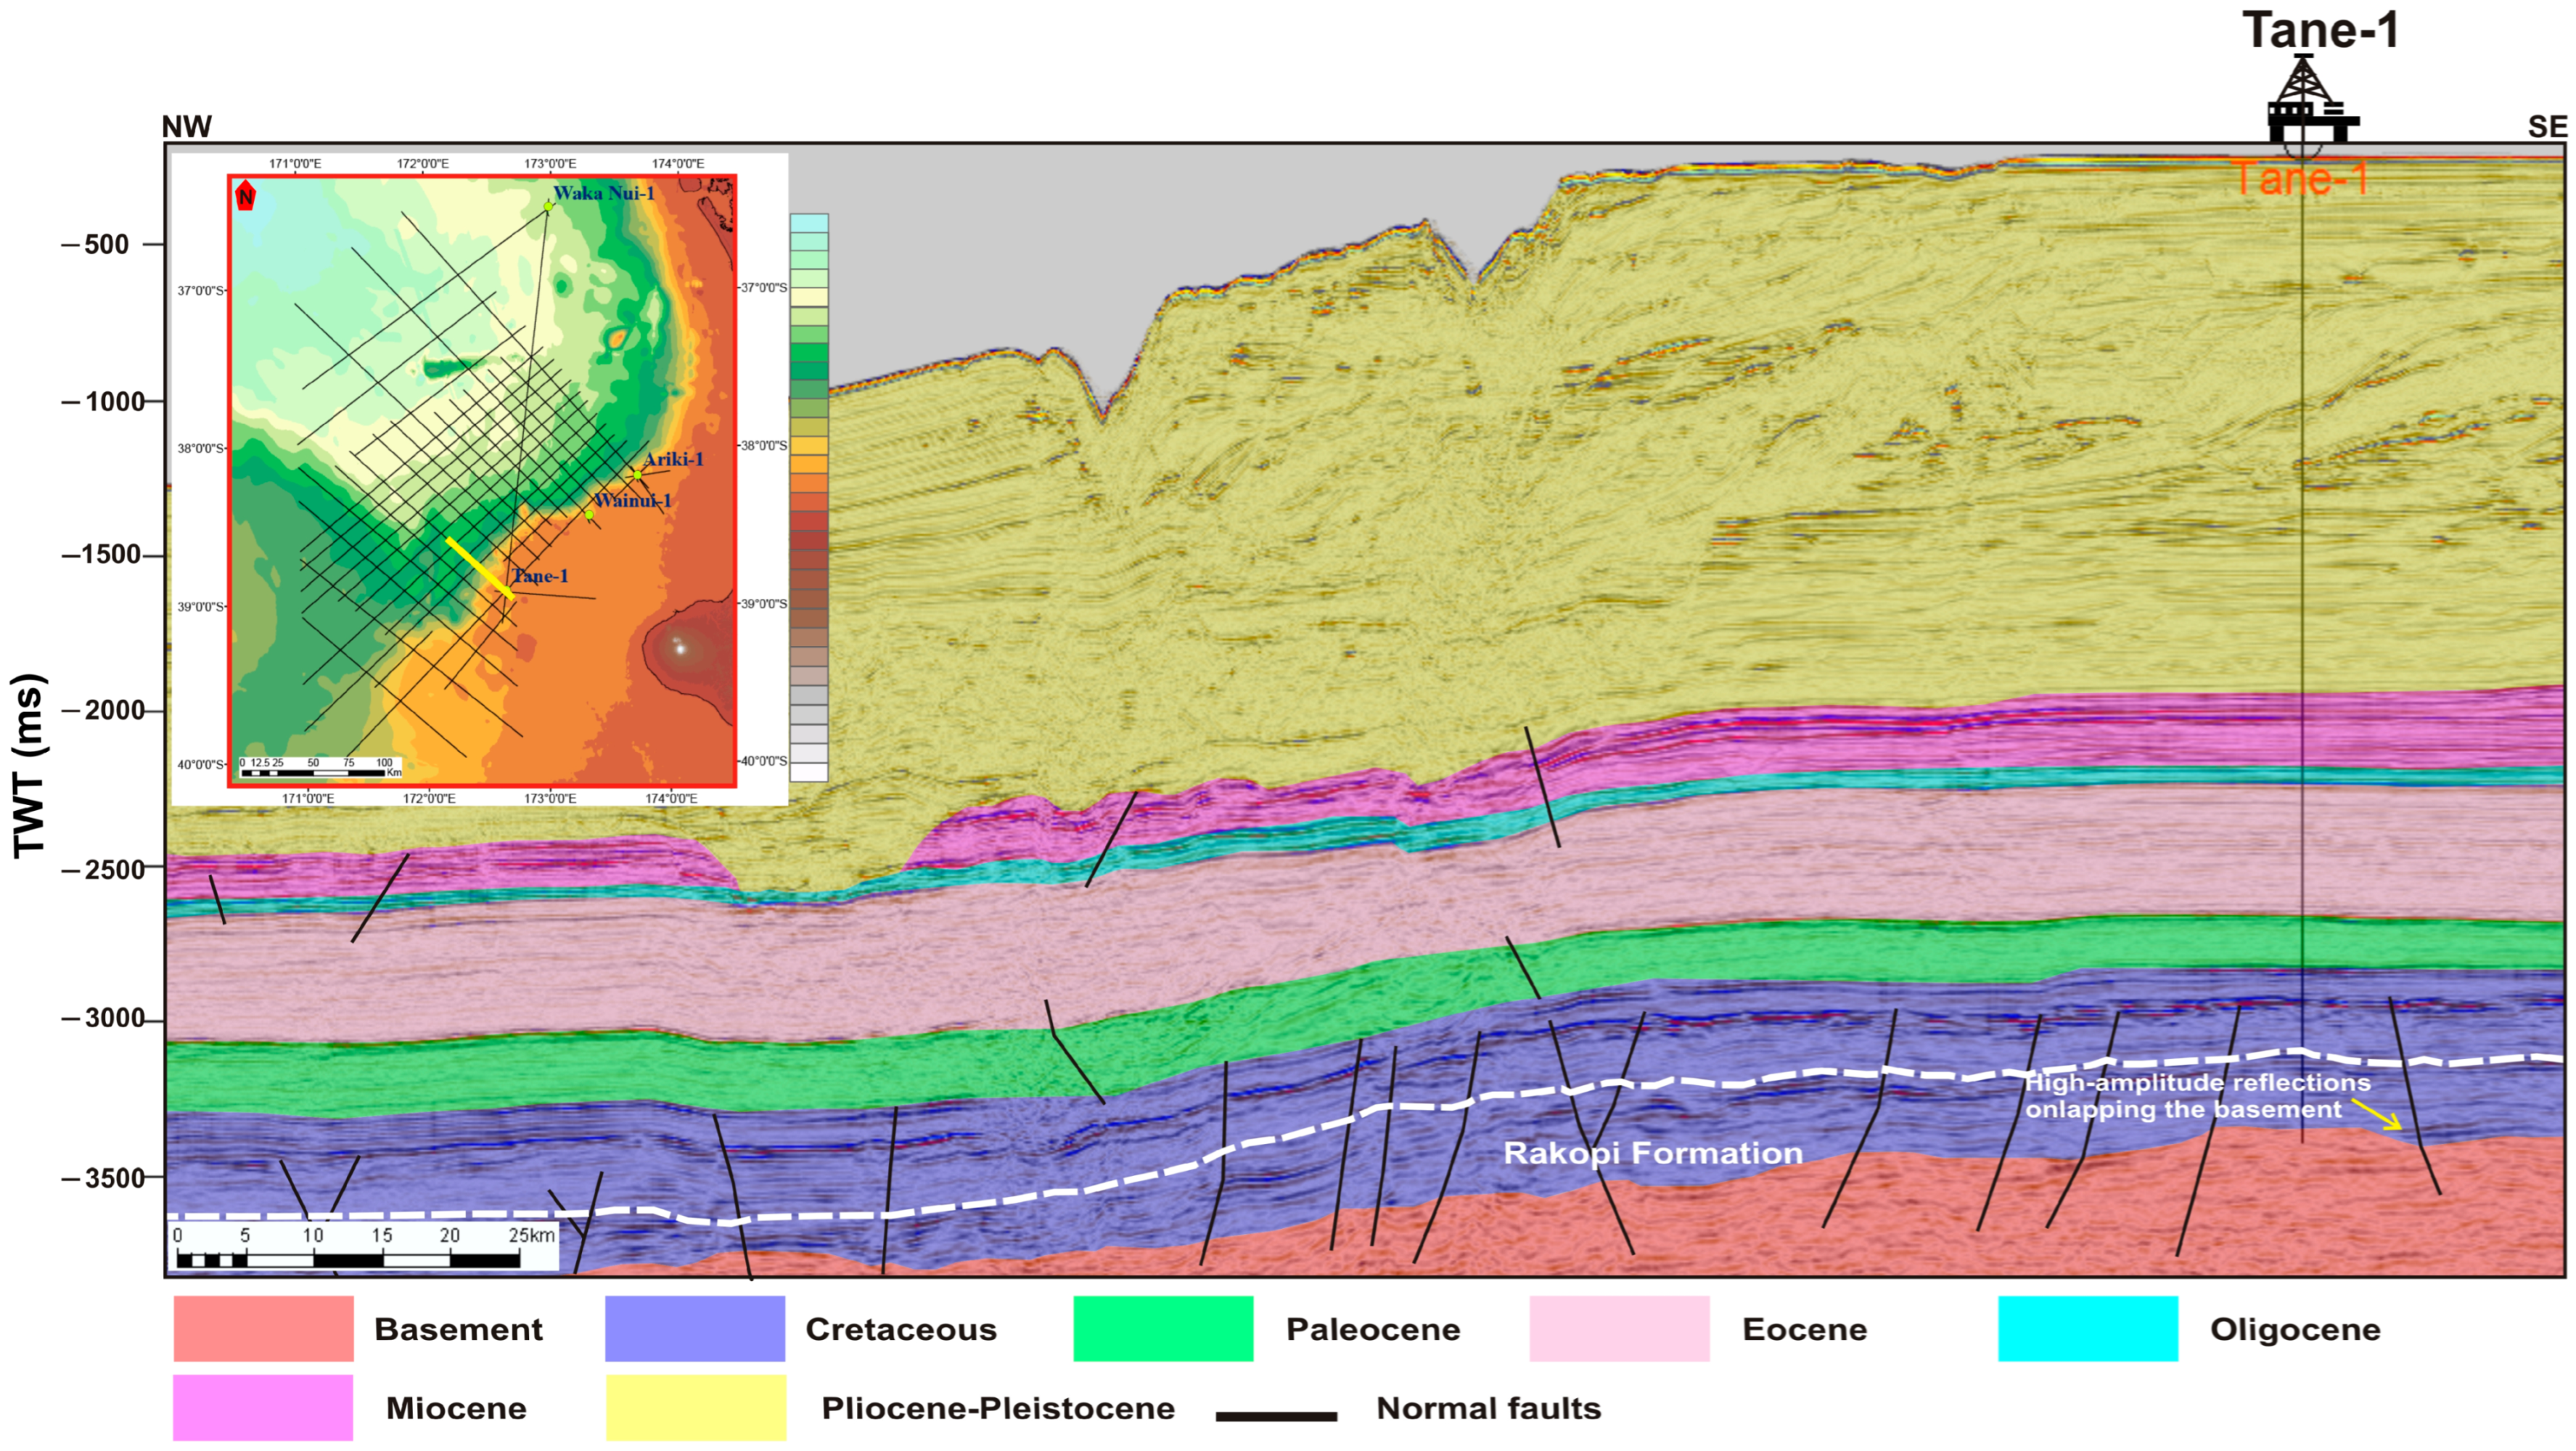
2. Geologic Setting

3. Data and Methods
3.1. Total Organic Carbon “TOC” and Rock-Eval Pyrolysis Analysis
3.2. Total Sulfur “TS” Analysis
3.3. Vitrinite Reflectance and Kerogen Petrography
3.4. Biomarker Analysis
4. Results and Interpretation
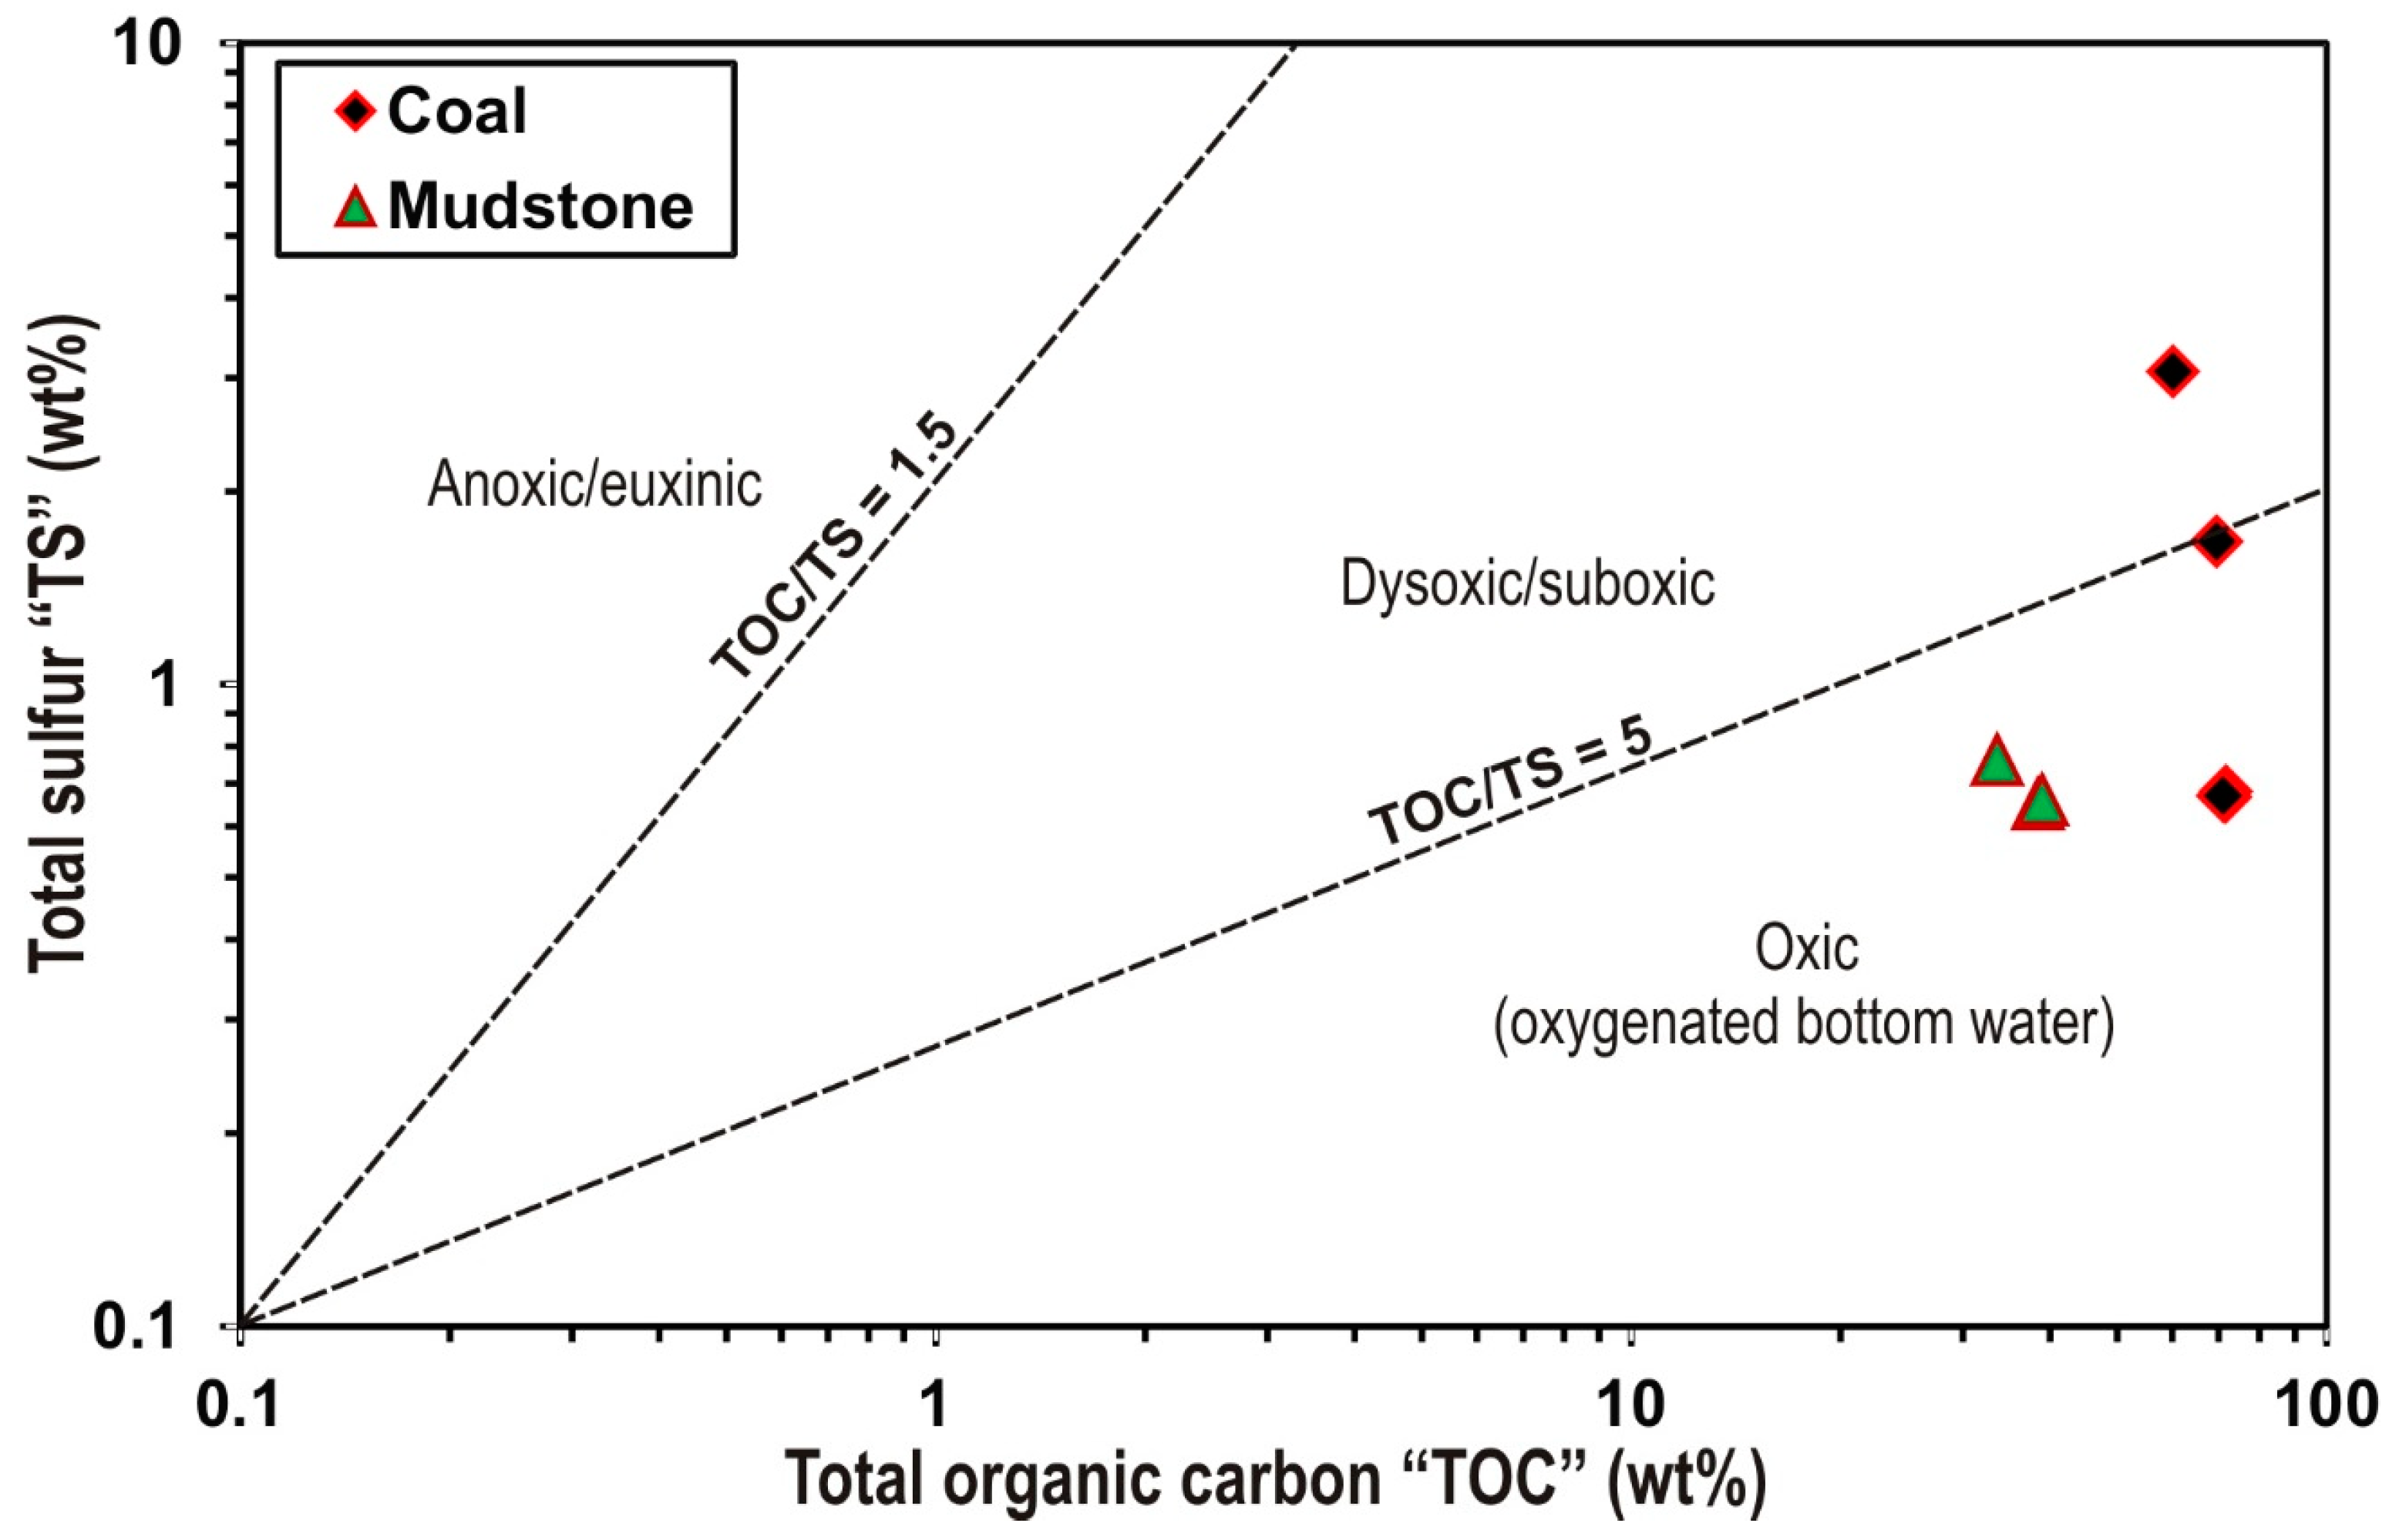
4.1. Total Sulfur “TS” and Total Organic Carbon “TOC” Contents
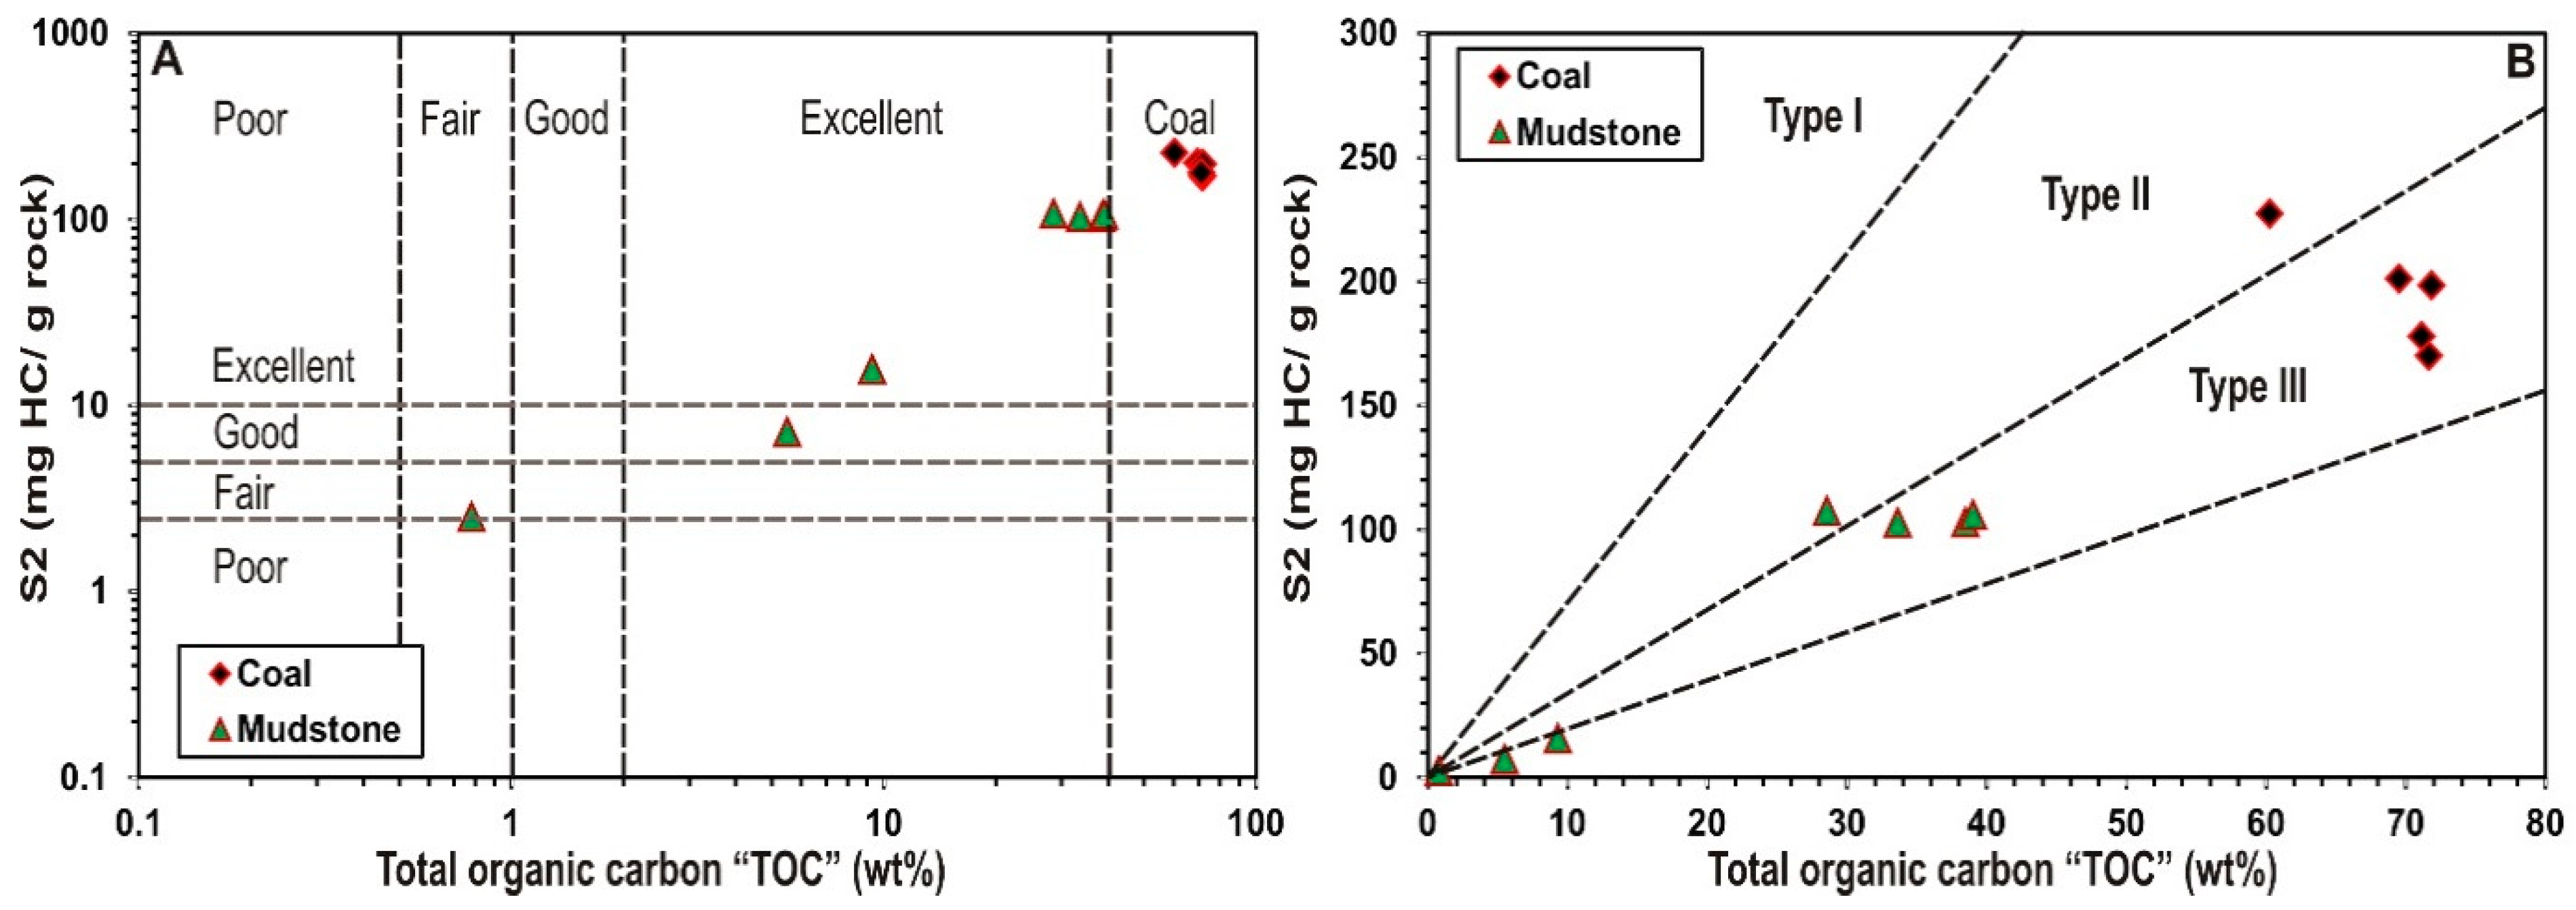
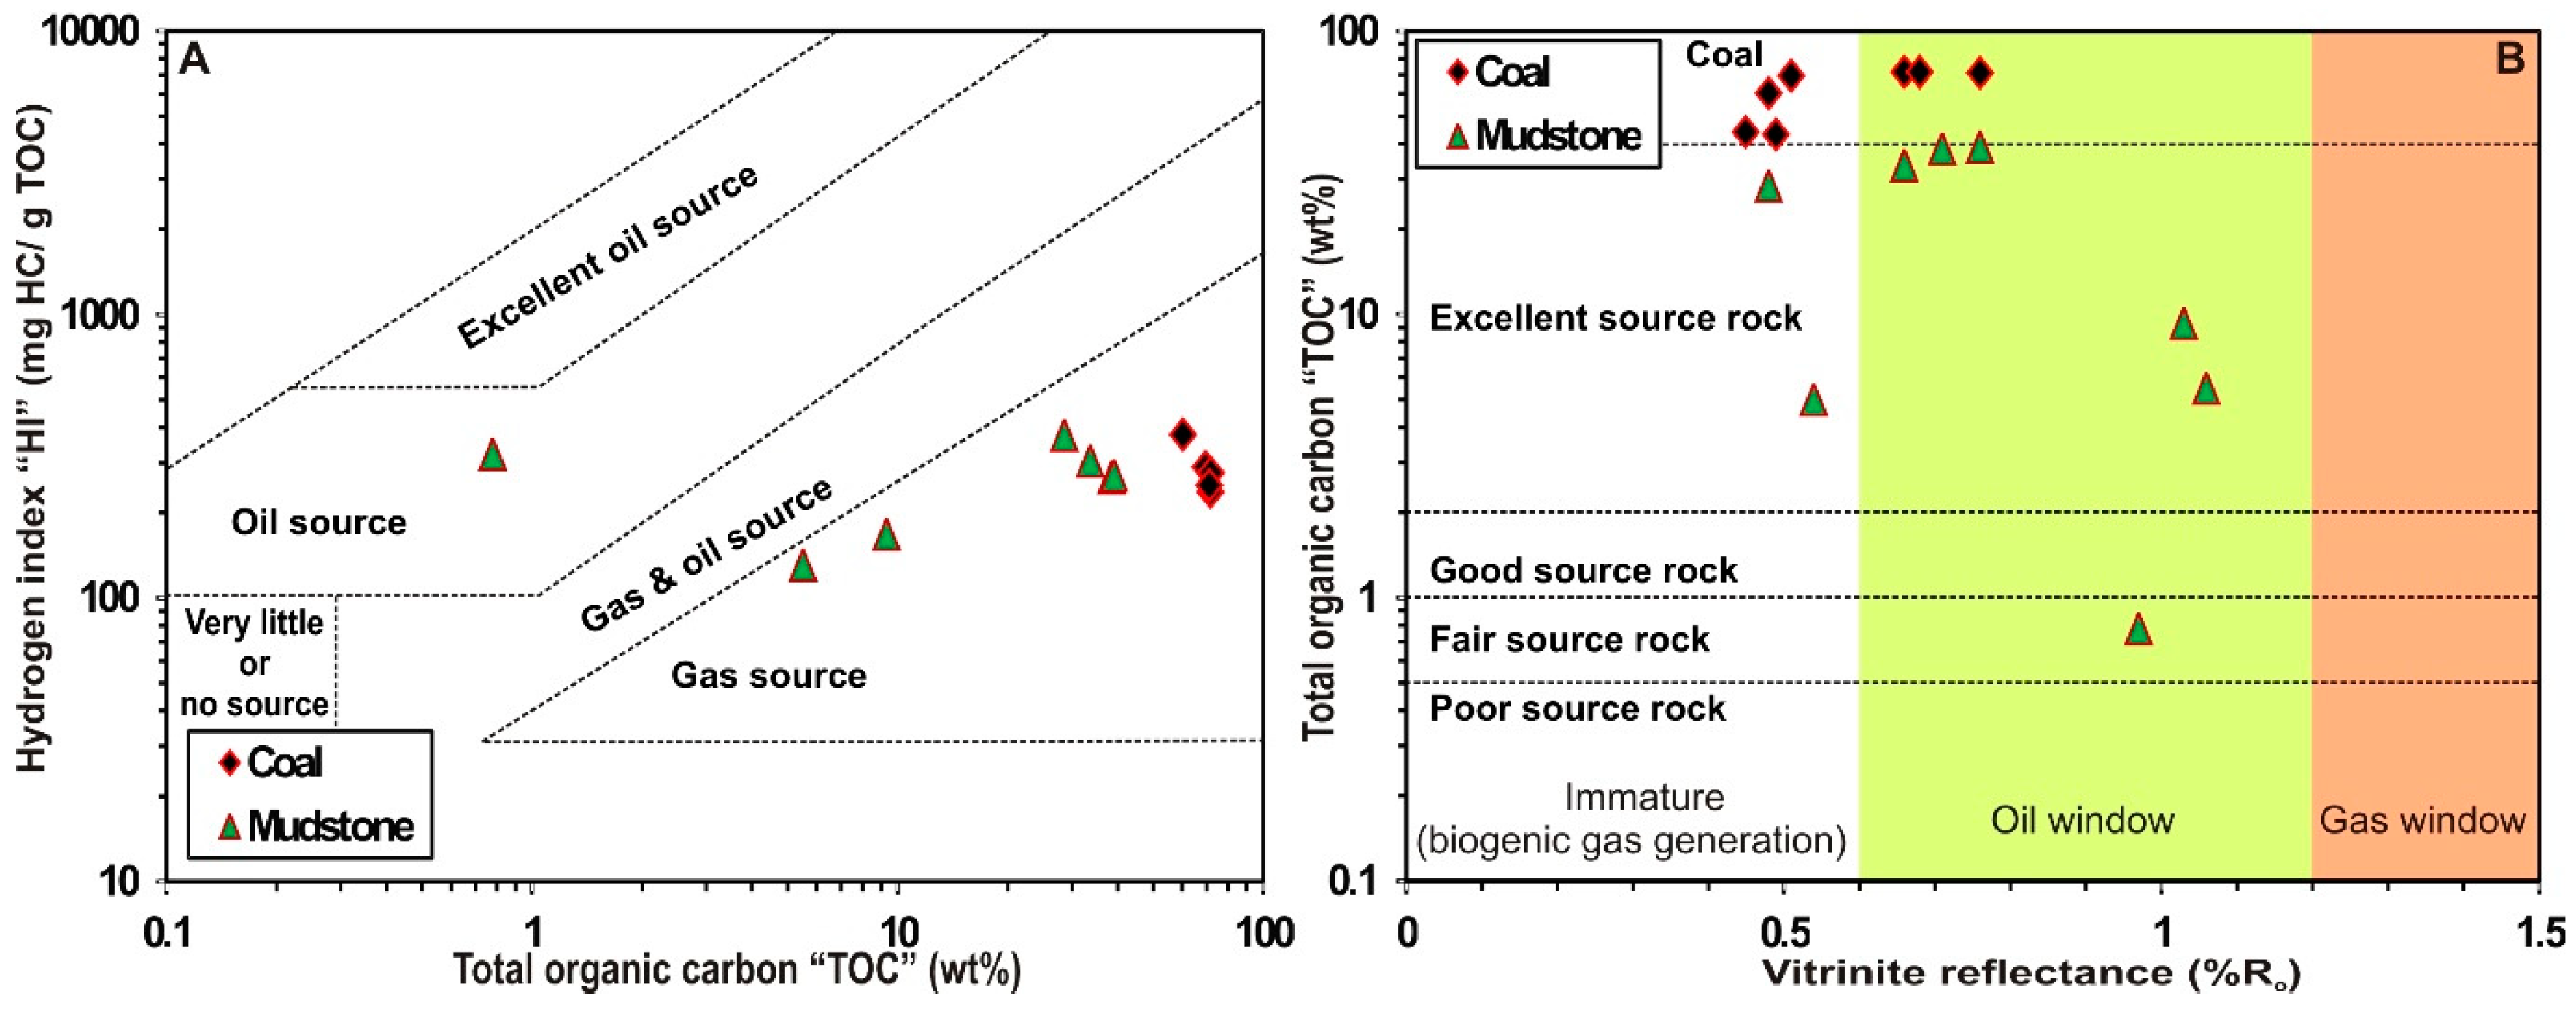
4.2. Rock-Eval Pyrolysis
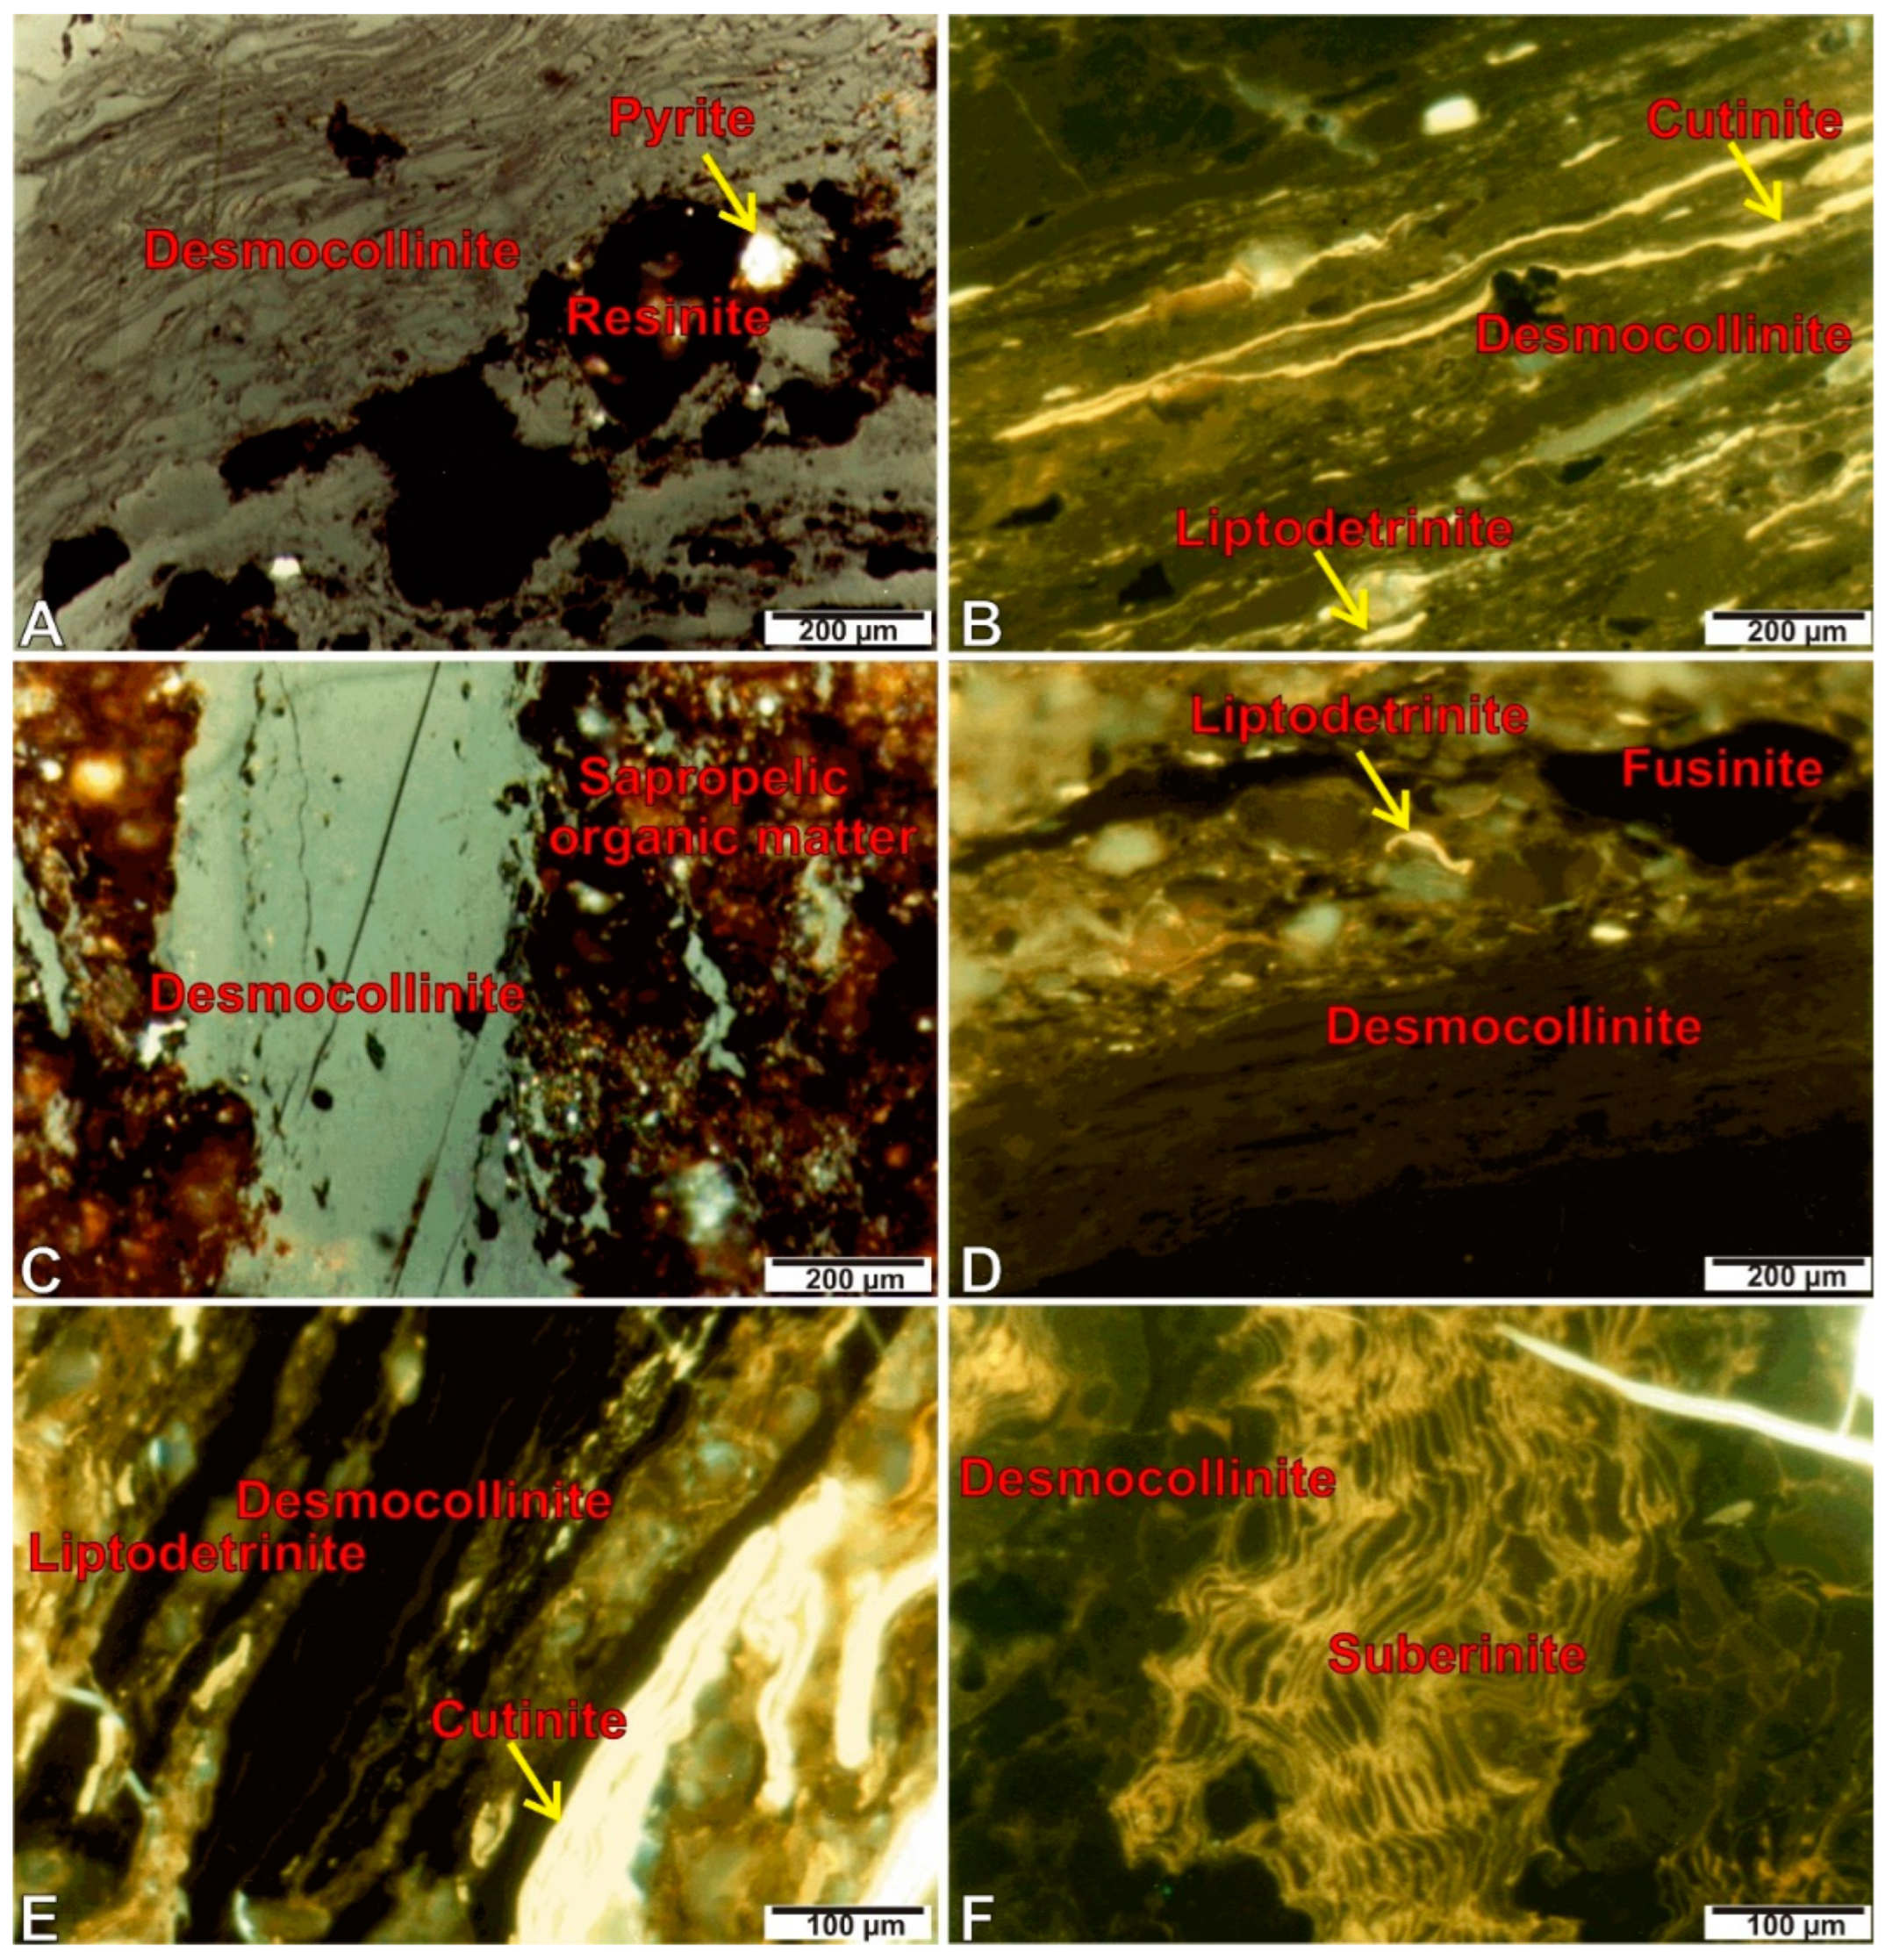
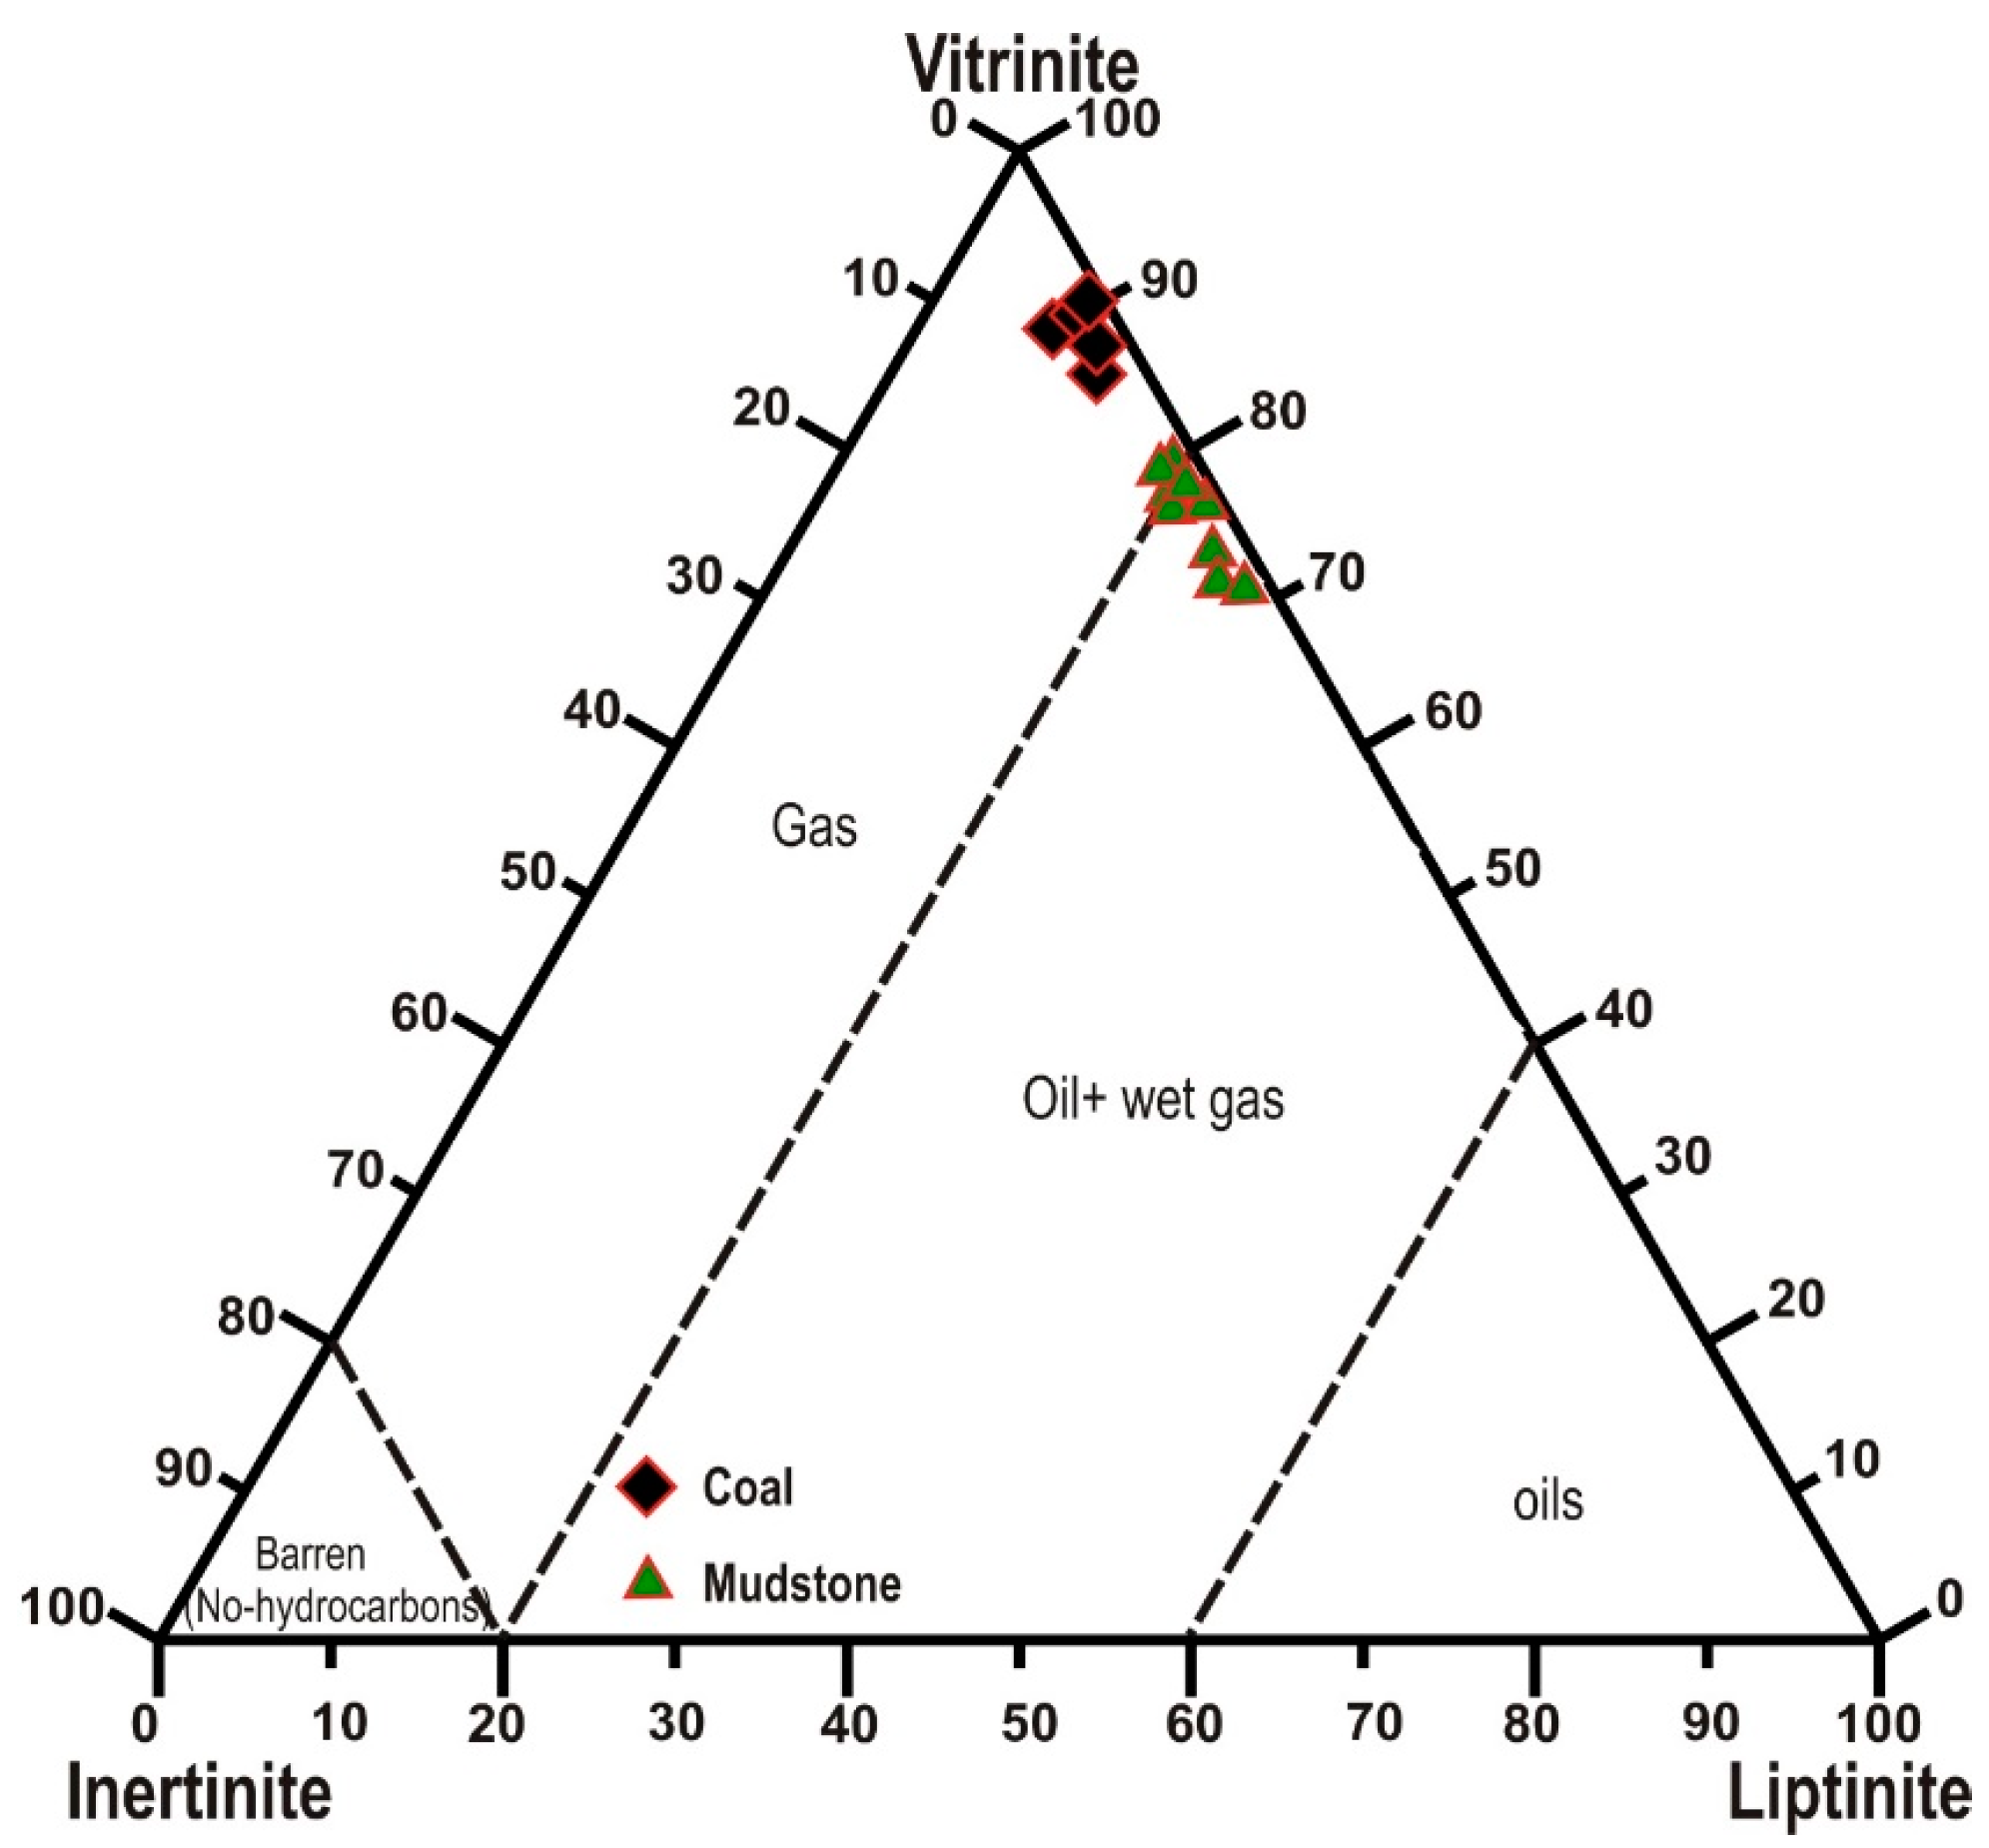
4.3. Organic Petrography
4.4. Biomarker Analysis
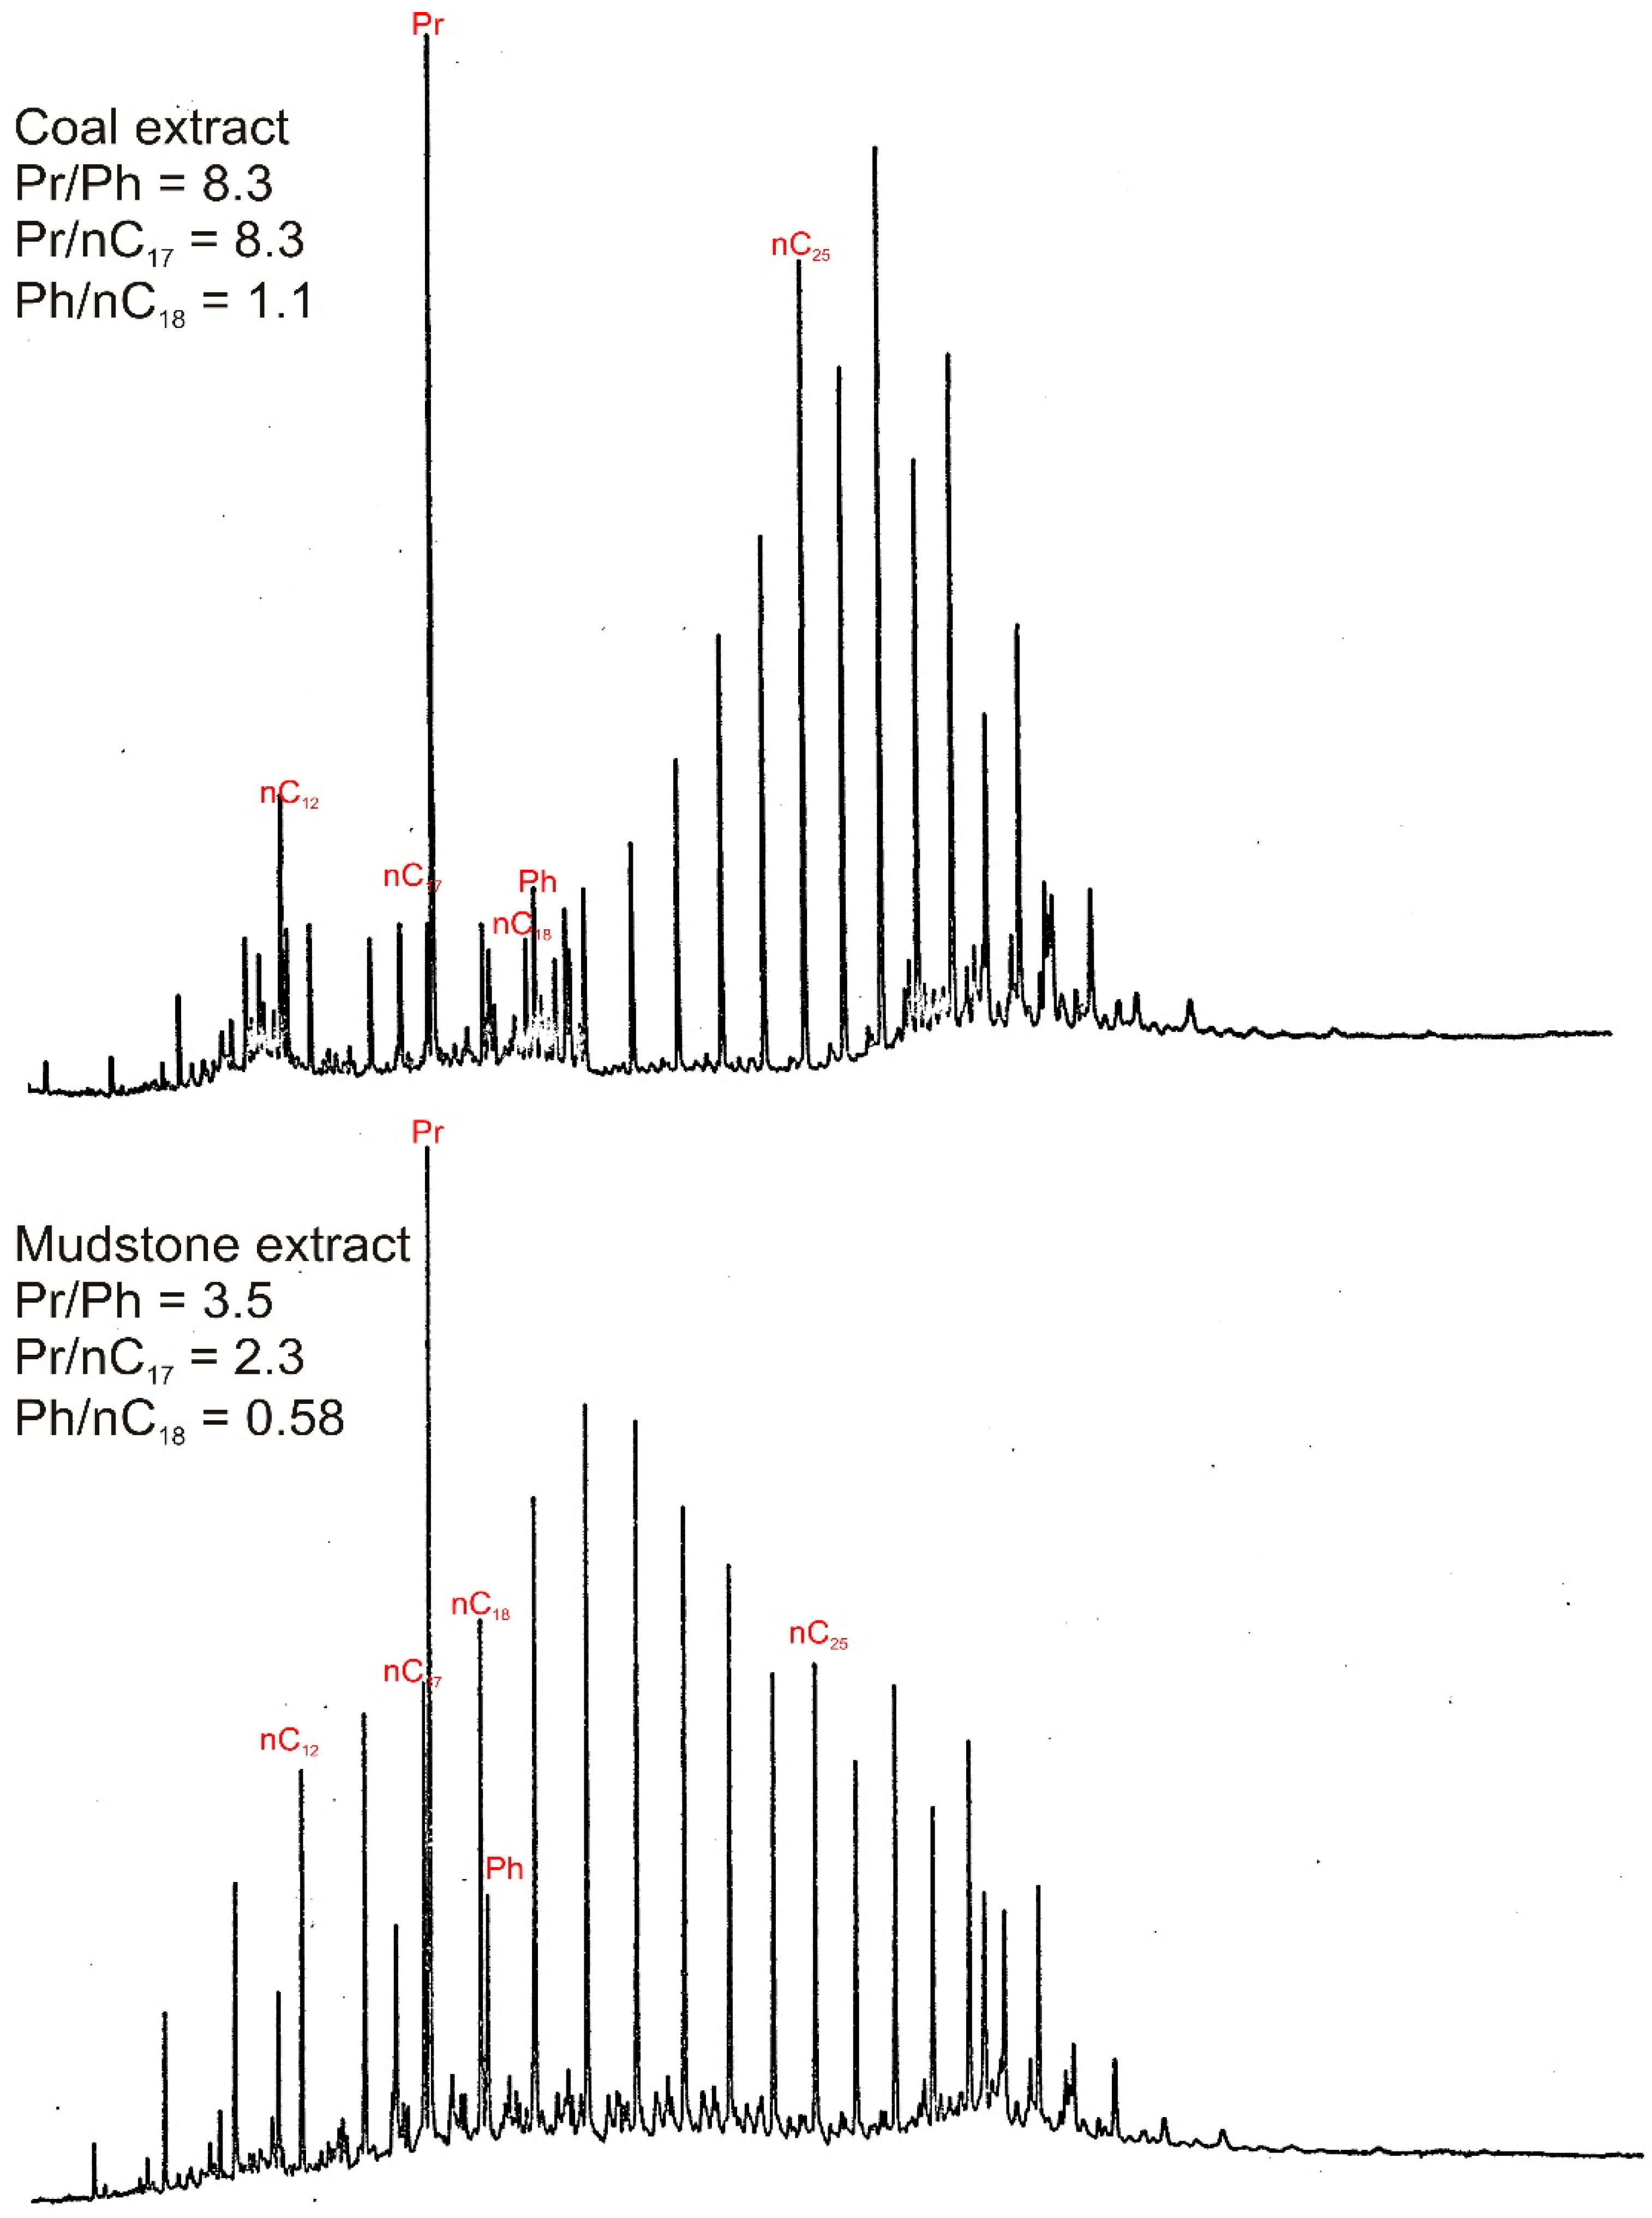
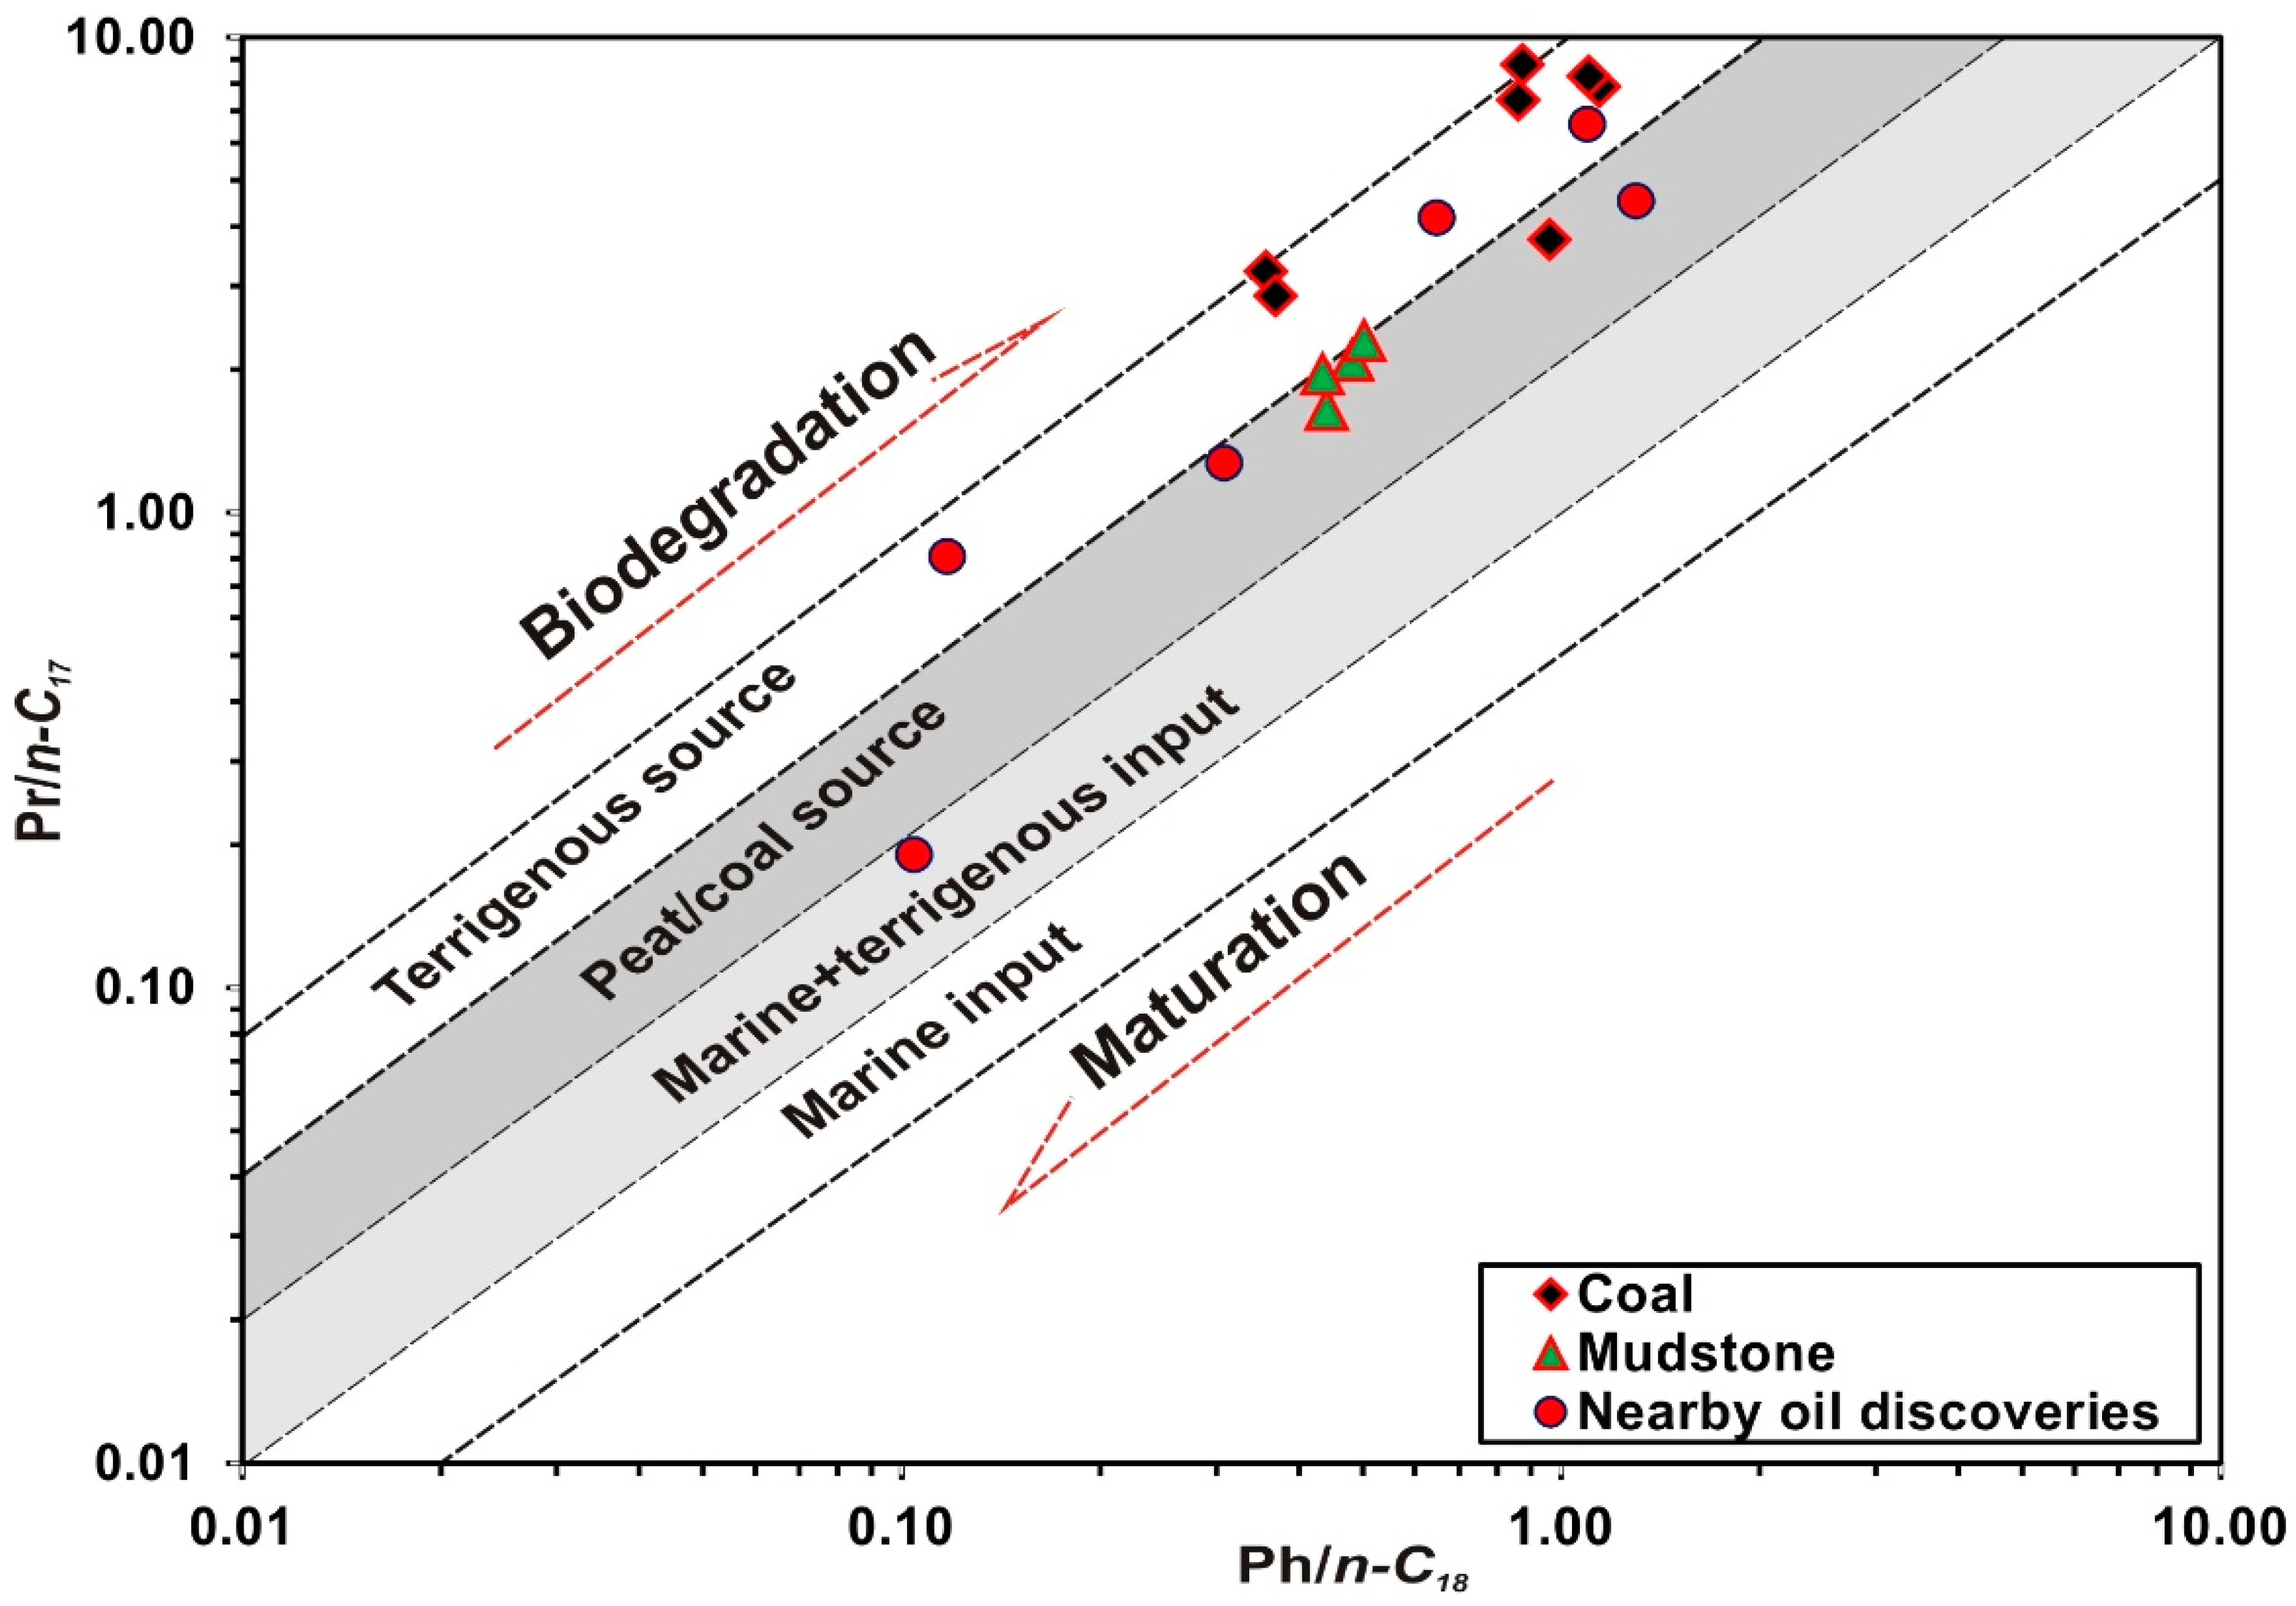
4.4.1. Bulk Composition and n-Alkane Distribution
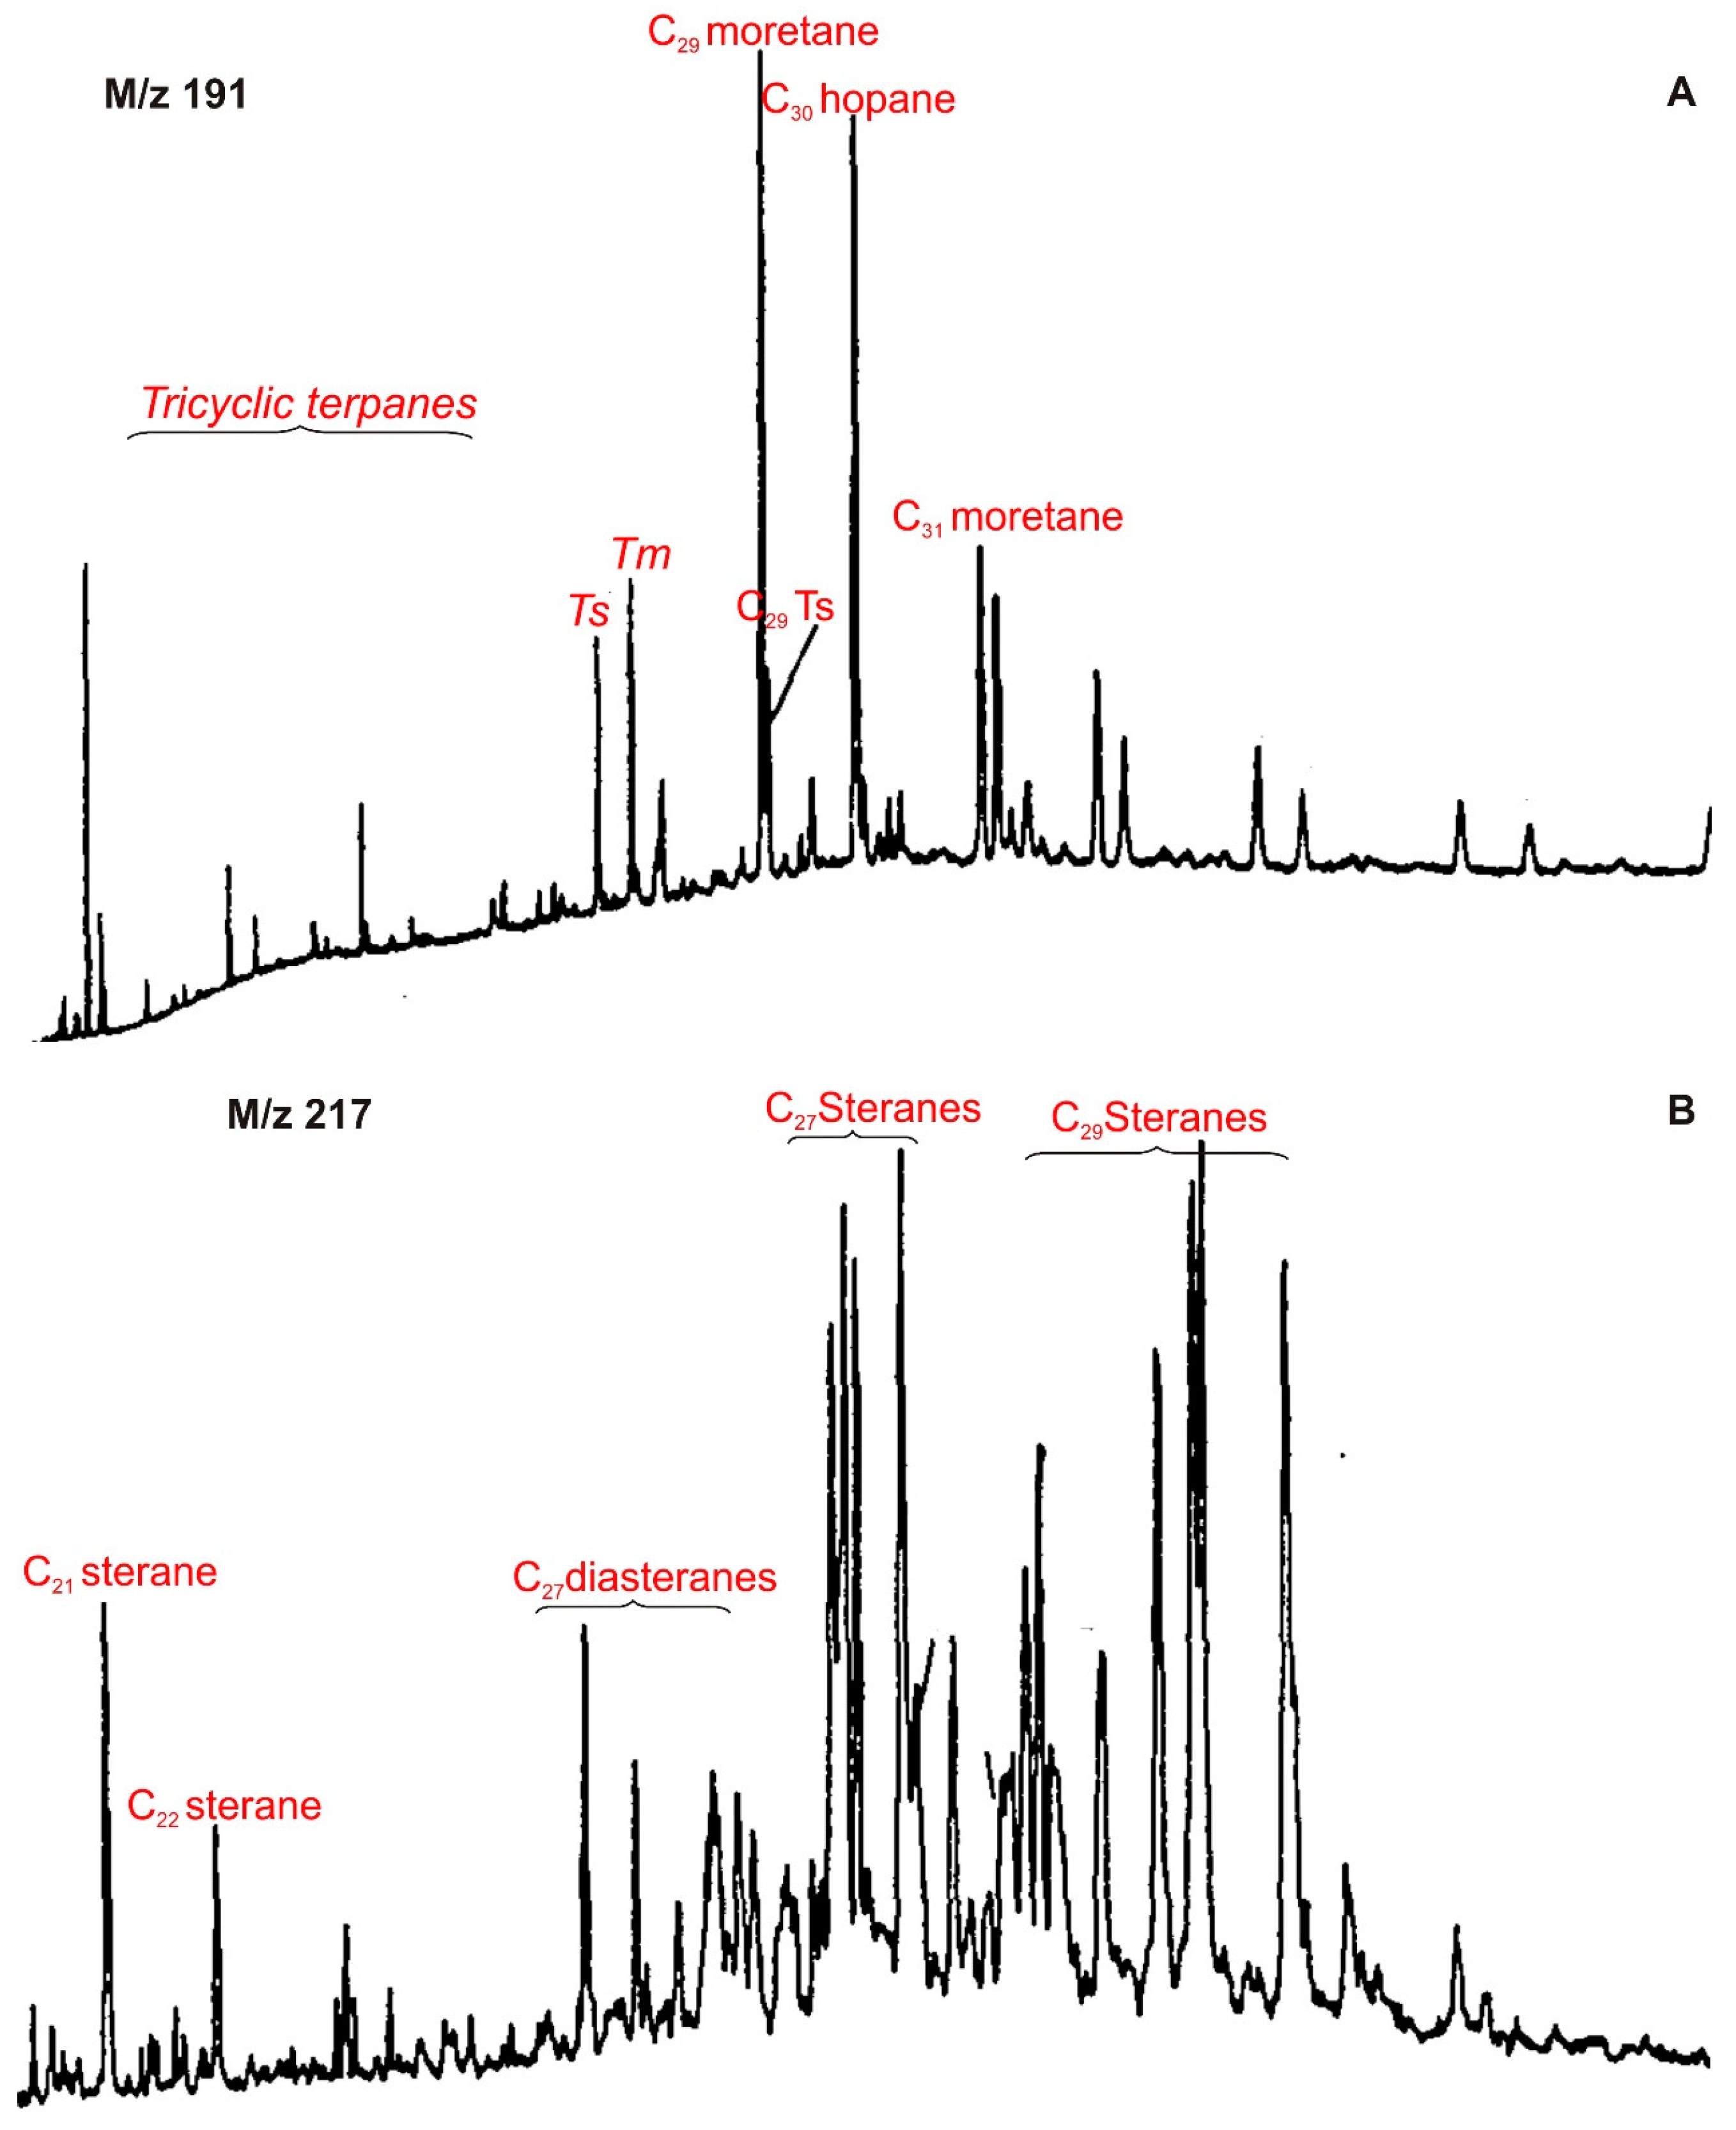
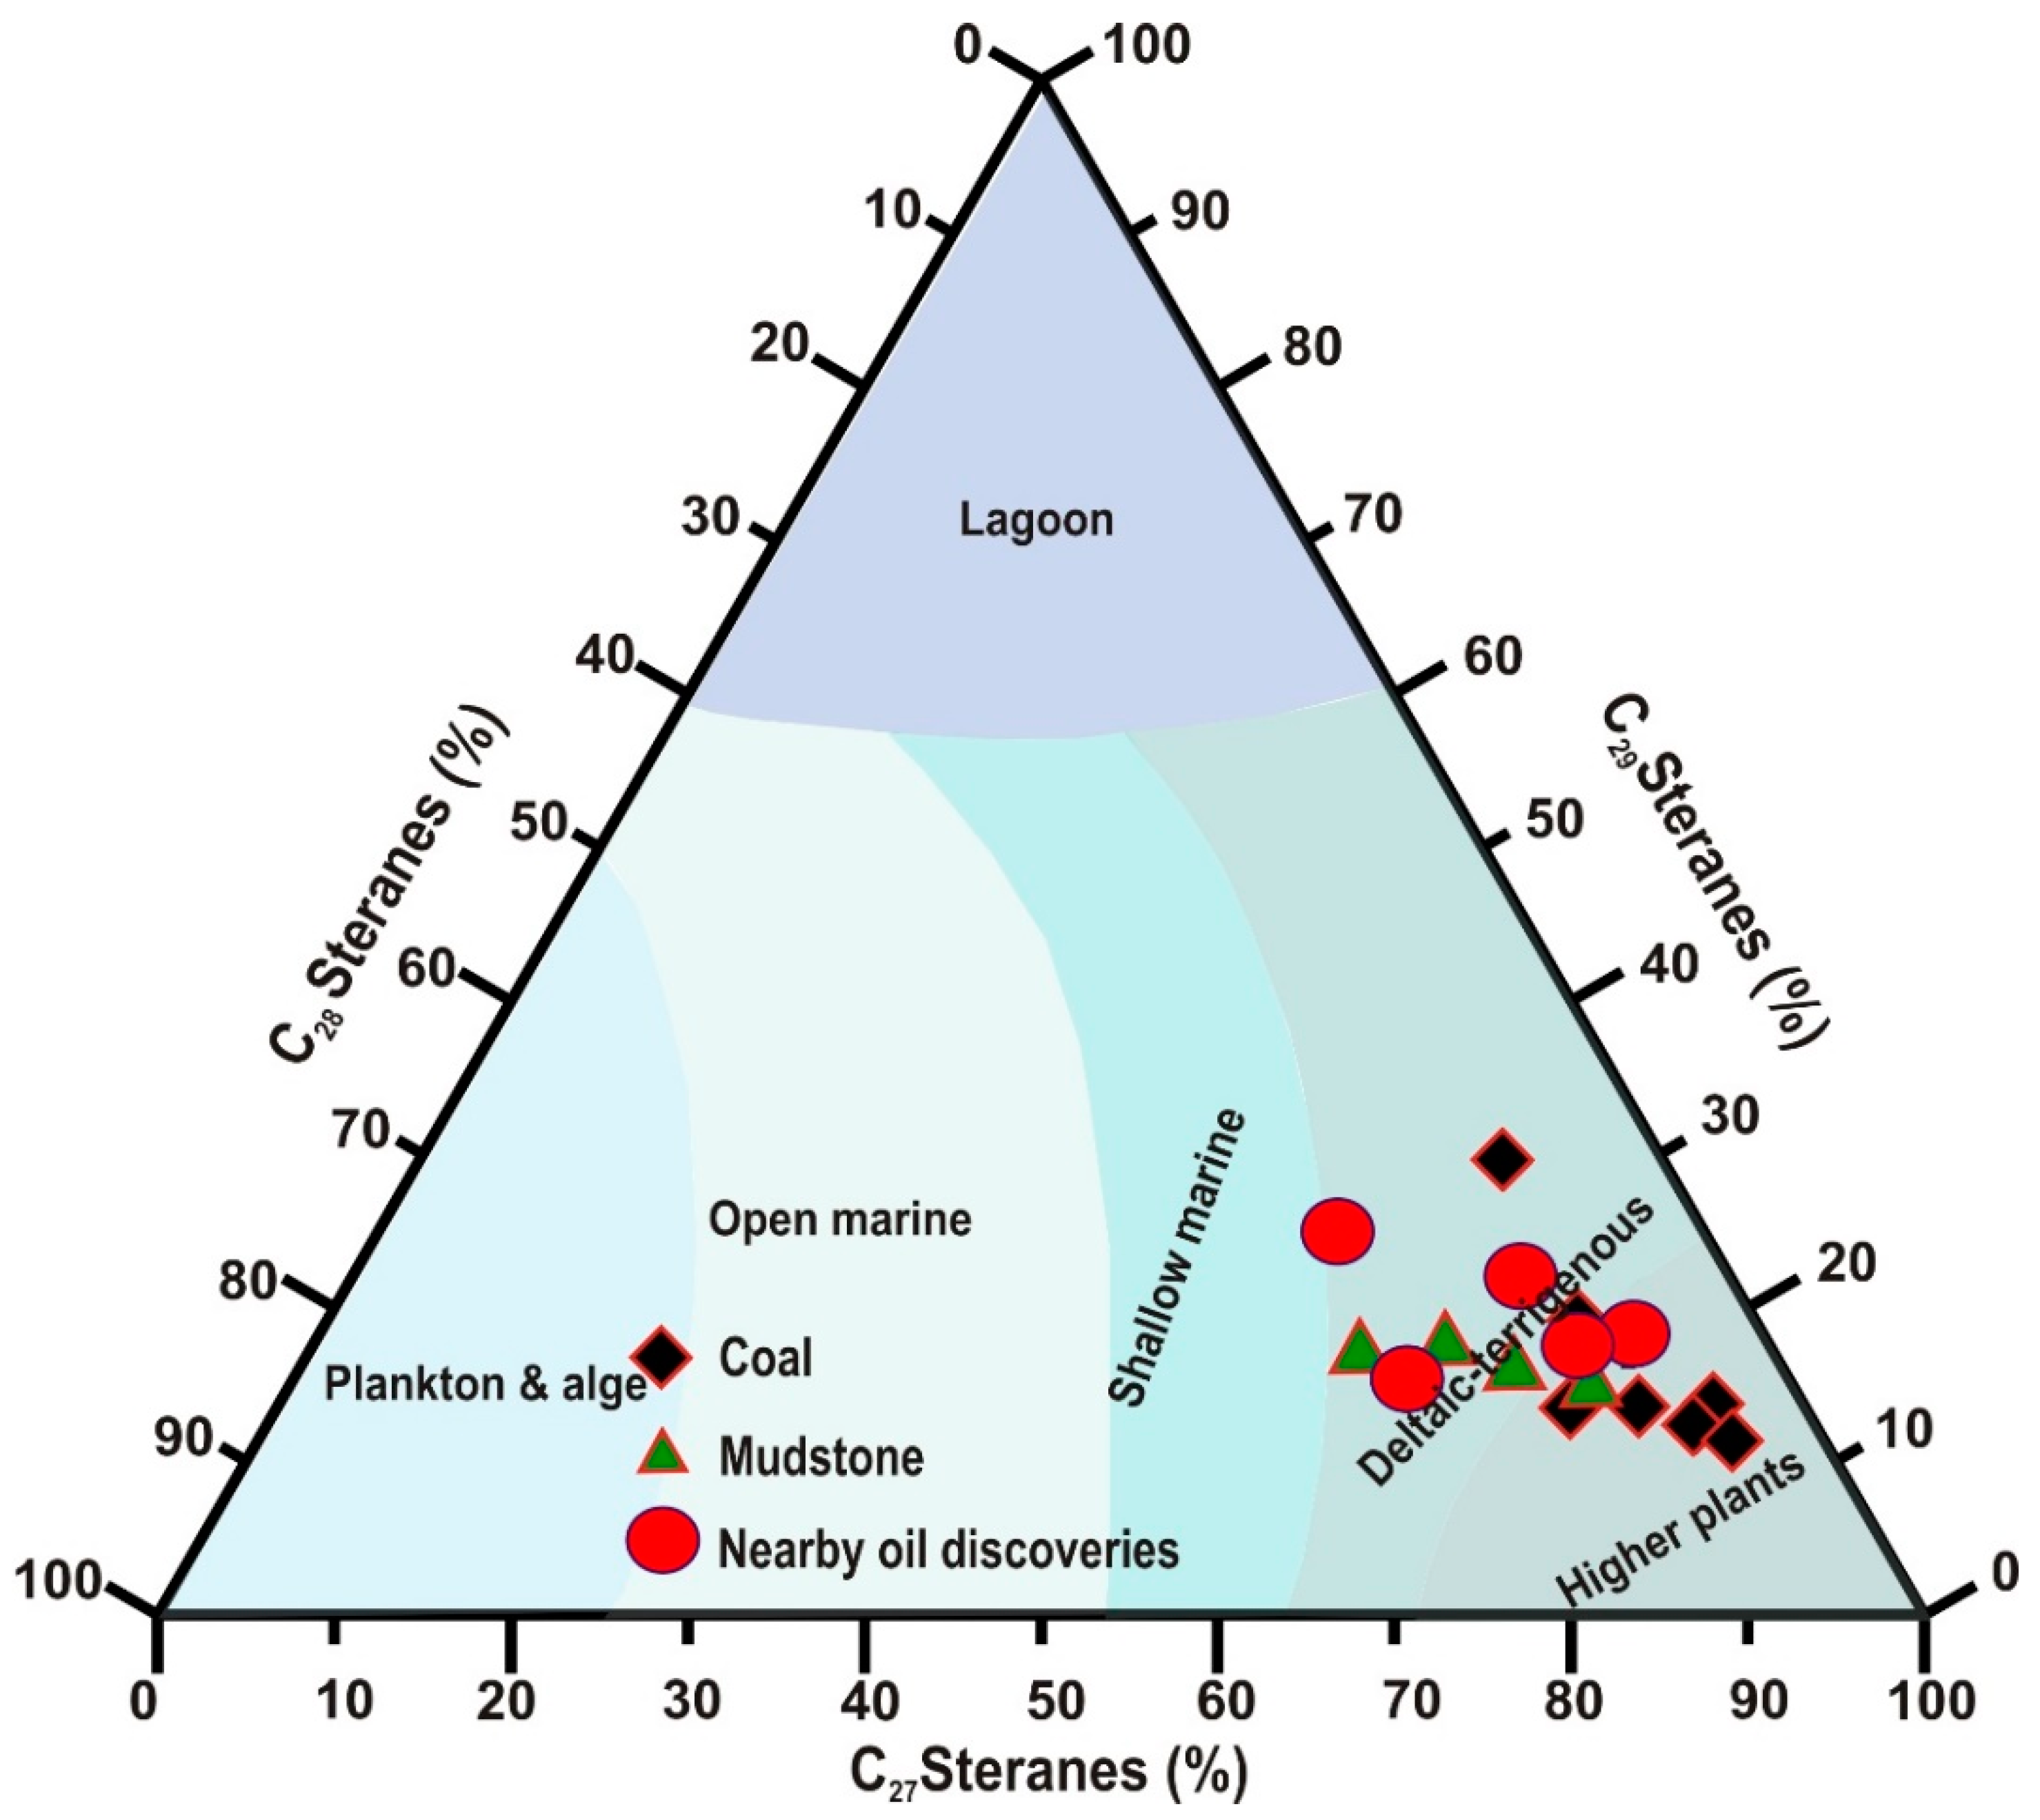
4.4.2. Terpanes and Steranes
5. Discussion
5.1. Kerogen Compositional Controls on Hydrocarbon Generation
5.2. Oil–Source Correlation and Implications for Exploration Future in Taranaki Basin
6. Conclusions
- The upper Cretaceous coal and mudstone facies of the Rakopi Formation host potential organofacies in the Taranaki Basin, New Zealand. These lithofacies have high TOC (average > 20 wt%) despite their deposition in oxygenated bottom water conditions (TOC/TS > 5).
- Rakopi coals are enriched in desmocollinite, suberinite, and resinite macerals, whereas the mudstone facies are enriched in liptodetrinite and cutinite. Vitrinite reflectance is greater in mudstone than that in coal lithofacies.
- Extracts from the coal and mudstone lithofacies have similar compositional attributes, however, the coal extracts have greater input from terrestrial materials.
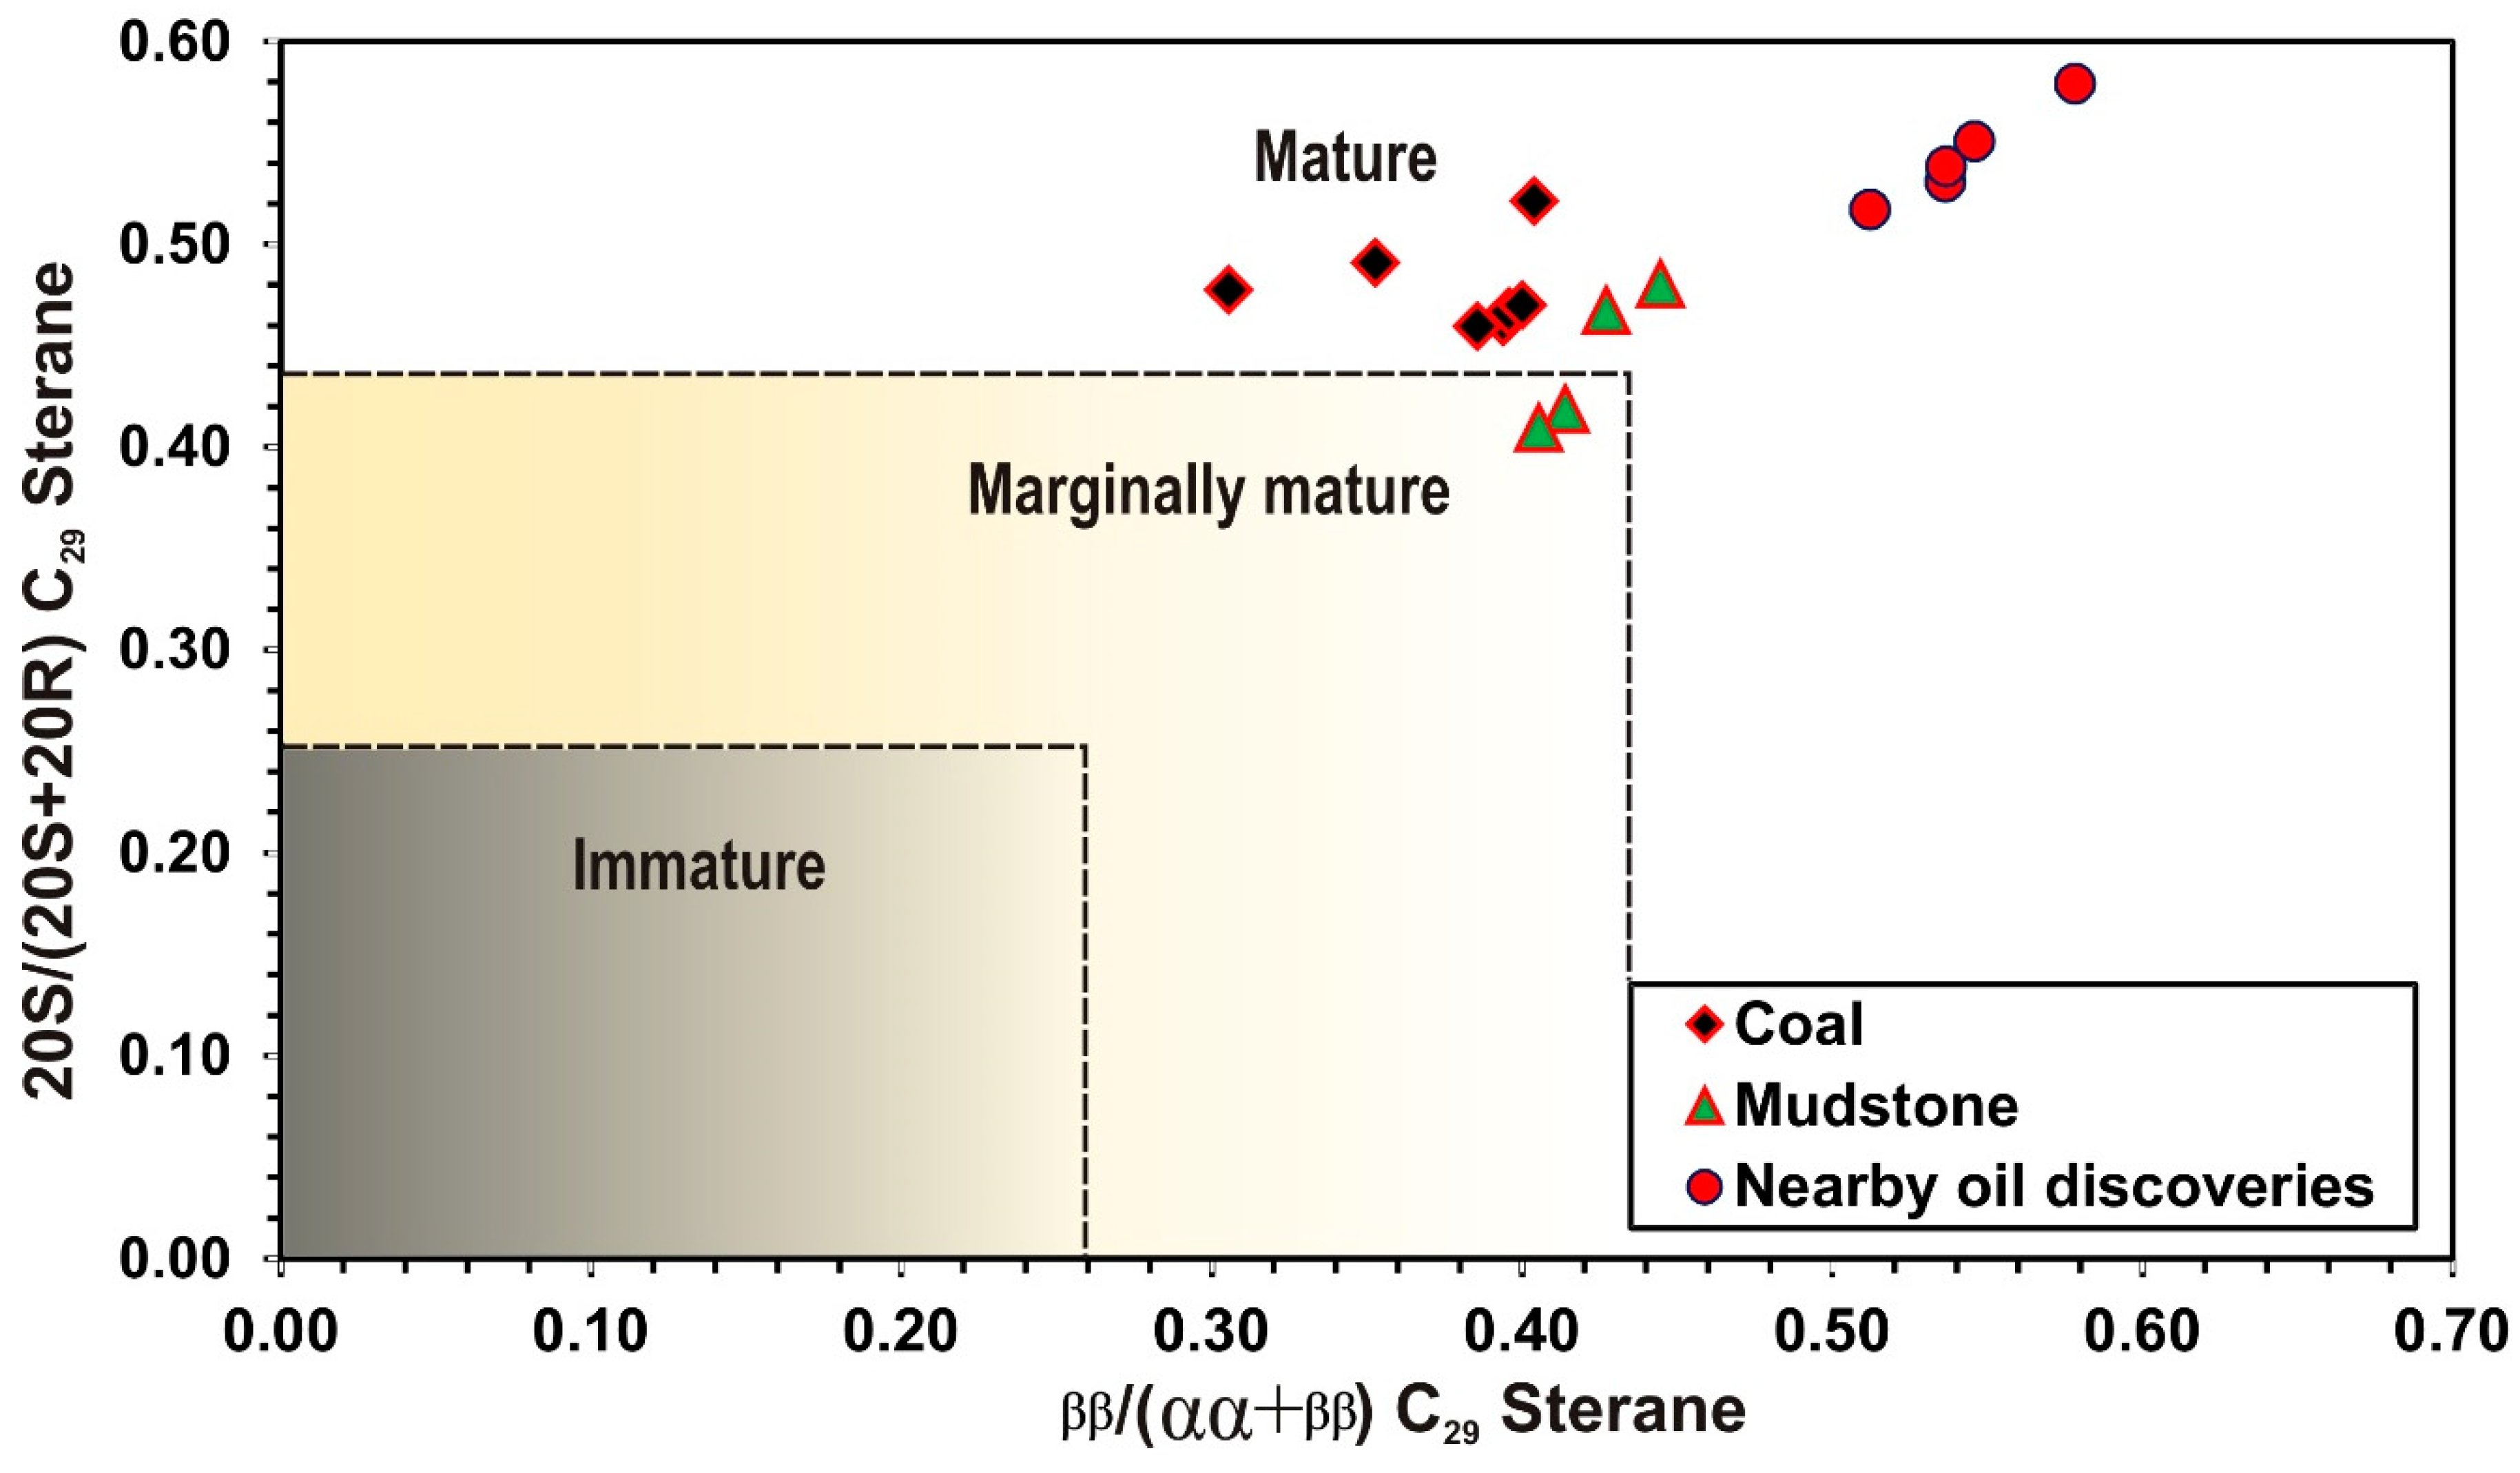
- Maturity-relevant biomarkers elucidate similar levels of maturity, suggesting an early phase of expulsion from the coal lithofacies.
- Correlation between compositional markers in coal, mudstone extracts, and nearby oil discoveries revealed a mixing signature between oil derived from coal and mudstone organofacies, despite the variable levels of maturity.
- The present results demonstrate the ability of marginal mature coals to generate liquid hydrocarbon phases, thereby opening new frontiers for exploration in several regions of the Taranaki Basin.
Author Contributions
Funding
Data Availability Statement
Acknowledgments
Conflicts of Interest
References
- Hunt, M.J. Organic geochemistry of the marine environment. In Advances in Organic Geochemistry; Tissot, B., Bienner, F., Eds.; Pergamon Press: Oxford, UK, 1974; pp. 597–605. [Google Scholar]
- Peters, K.E.; Cassa, M.R. Applied source rock geochemistry. In The Petroleum System from Source to Trap; Magoon, L.B., Dow, W.G., Eds.; AAPG: Tulsa, OK, USA, 1994; pp. 93–117. [Google Scholar]
- Peters, E.K.; Walters, C.C.; Moldowan, M.J. The Biomarker guide. In Biomarkers and Isotopes in the Environment and Human History, 2nd ed.; Cambridge University Press: Cambridge, UK, 2005; Volume I, p. 471. [Google Scholar]
- El Matboly, E.; Leila, M.; Peters, K.; El Diasty, W. Oil biomarker signature and hydrocarbon prospectivity of paleozoic versus mesozoic source rocks in the Faghur–Sallum basins, Egypt’s Western Desert. J. Pet. Sci. Eng. 2022, 217, 110872. [Google Scholar] [CrossRef]
- Mahmoud, A.I.; Metwally, A.M.; Mabrouk, W.M.; Leila, M. Controls on hydrocarbon accumulation in the pre-rift paleozoic and late syn-rift cretaceous sandstones in PTAH oil field, north Western Desert, Egypt: Insights from seismic stratigraphy, petrophysical rock-typing and organic geochemistry. Mar. Pet. Geol. 2023, 155, 106398. [Google Scholar] [CrossRef]
- Pedersen, T.; Calvert, S.E. Anoxia vs. productivity: What controls the formation of organic-carbon-rich sediments and sedimentary rocks? AAPG Bull. 1990, 74, 454–466. [Google Scholar]
- Akande, S.O.; Egenhoff, S.O.; Obaje, N.G.; Ojo, O.J.; Adekeye, O.A.; Erdtmann, B.D. Hydrocarbon potential of Cretaceous sediments in the Lower and Middle Benue Trough, Nigeria: Insights from new source rock facies evaluation. J. Afr. Earth Sci. 2012, 64, 34–47. [Google Scholar] [CrossRef]
- Fathy, D.; Abart, R.; Wagreich, M.; Gier, S.; Ahmed, M.S.; Sami, M. Late Campanian Climatic-Continental Weathering Assessment and Its Influence on Source Rocks Deposition in Southern Tethys, Egypt. Minerals 2023, 13, 160. [Google Scholar] [CrossRef]
- Lewan, M.D.; Ruble, T.E. Comparison of petroleum generation kinetics by isothermal hydrous and nonisothermal open-system pyrolysis. Org. Geochem. 2002, 33, 1457–1475. [Google Scholar] [CrossRef]
- Leila, M.; Loiseau, K.; Moretti, I. Controls on generation and accumulation of blended gases (CH4/H2/He) in the Neoproterozoic Amadeus Basin, Australia. Marine and Petroleum Geology 2022, 140, 105643. [Google Scholar] [CrossRef]
- Leila, M.; Awadalla, A.; Farag, A.; Moscariello, A. Organic geochemistry and oil-source rock correlation of the Cretaceous succession in West Wadi El-Rayan (WWER) concession: Implications for a new Cretaceous petroleum system in the north Western Desert, Egypt. J. Pet. Sci. Eng. 2022, 219, 111071. [Google Scholar] [CrossRef]
- Stockhausen, M.; Galimberti, R.; Elias, R.; Di Paolo, L.; Schwark, L. Expulsinator assessment of oil/ gas generation and expulsion characteristics of different source rocks. Mar. Pet. Geol. 2021, 129, 105057. [Google Scholar] [CrossRef]
- Weston, R.J.; Engel, M.H.; Philp, R.P.; Woolhouse, A.D. The stable carbon isotopic composition of oil from the Taranaki Basin of New Zealand. Org. Geochem. 1988, 12, 487–493. [Google Scholar] [CrossRef]
- Johnston, J.; Collier, R.; Maidment, A. Coals as source rocks for hydrocarbon generation in the Taranaki Basin, New Zealand: A geochemical biomarker study. J. Southeast Asian Earth Sci. 1991, 5, 283–289. [Google Scholar] [CrossRef]
- King, P.R.; Thrasher, G.P. Cretaceous-Cenozoic Geology and Petroleum Systems of the Taranaki Basin, New Zealand; Institute of Geological & Nuclear Sciences Monograph: Lower Hutt, New Zealand, 1996; Volume 13, p. 244. [Google Scholar]
- Higgs, K.; King, P.; Raine, J.; Sykes, R.; Browne, G.; Crouch, E.; Baur, J. Sequence stratigraphy and controls on reservoir sandstone distribution in an Eocene marginal marine-coastal plain fairway, Taranaki Basin, New Zealand. Mar. Pet. Geol. 2012, 32, 110–137. [Google Scholar] [CrossRef]
- Higgs, K.; Crouch, E.; Raine, J. An interdisciplinary approach to reservoir characterisation; an example from the early to middle Eocene Kaimiro Formation, Taranaki Basin, New Zealand. Mar. Pet. Geol. 2017, 86, 111–139. [Google Scholar] [CrossRef]
- Kumar, P.C.; Sain, K. Attribute amalgamation-aiding interpretation of faults from seismic data: An example from Waitara 3D prospect in Taranaki basin off New Zealand. J. Appl. Geophys. 2018, 159, 52–68. [Google Scholar] [CrossRef]
- Leila, M.; El-Sheikh, I.; Abdelmaksoud, A.; Radwan, A.A. Seismic sequence stratigraphy and depositional evolution of the Cretaceous-Paleogene sedimentary successions in the offshore Taranaki Basin, New Zealand: Implications for hydrocarbon exploration. Mar. Geophys. Res. 2022, 43, 23. [Google Scholar] [CrossRef]
- Abdelmaksoud, A.; Radwan, A.A. Integrating 3D seismic interpretation, well log analysis and static modelling for characterizing the Late Miocene reservoir, Ngatoro area, New Zealand. Géoméch. Geophys. Geo-Energy Geo-Resour. 2022, 8, 63. [Google Scholar] [CrossRef]
- Radwan, A.A.; Nabawy, B.S.; Shihata, M.; Leila, M. Seismic interpretation, reservoir characterization, gas origin and entrapment of the Miocene-Pliocene Mangaa C sandstone, Karewa Gas Field, North Taranaki Basin, New Zealand. Mar. Pet. Geol. 2021, 135, 105420. [Google Scholar] [CrossRef]
- Katz, H.R. Potential oil formations in New Zealand, and their stratigraphic position as related to basin evolution. New Zealand J. Geol. Geophys. 1968, 11, 1077–1133. [Google Scholar] [CrossRef]
- Czochanska, Z.; Gilbert, T.; Philp, R.; Sheppard, C.; Weston, R.; Wood, T.; Woolhouse, A. Geochemical application of sterane and triterpane biomarkers to a description of oils from the Taranaki Basin in New Zealand. Org. Geochem. 1988, 12, 123–135. [Google Scholar] [CrossRef]
- Collier, R.; Johnston, J. The identification of possible hydrocarbon source rocks, using biomarker geochemistry, in the Taranaki basin, New Zealand. J. Southeast Asian Earth Sci. 1991, 5, 231–239. [Google Scholar] [CrossRef]
- Killops, S.; Frewin, N. Triterpenoid diagenesis and cuticular preservation. Org. Geochem. 1994, 21, 1193–1209. [Google Scholar] [CrossRef]
- Murray, A.P.; Summons, R.E.; Boreham, C.J.; Dowling, L.M. Biomarker and n-alkane isotope profiles for Tertiary oils: Relationship to source rock depositional setting. Org. Geochem. 1994, 22, 521–542, IN5–IN6. [Google Scholar] [CrossRef]
- Killops, S.; Raine, J.; Woolhouse, A.; Weston, R. Chemostratigraphic evidence of higher-plant evolution in the Taranaki Basin, New Zealand. Org. Geochem. 1995, 23, 429–445. [Google Scholar] [CrossRef]
- Killops, S.; Funnell, R.; Suggate, R.; Sykes, R.; Peters, K.; Walters, C.; Woolhouse, A.; Weston, R.; Boudou, J.-P. Predicting generation and expulsion of paraffinic oil from vitrinite-rich coals. Org. Geochem. 1998, 29, 1–21. [Google Scholar] [CrossRef]
- Sykes, R.; Snowdon, L. Guidelines for assessing the petroleum potential of coaly source rocks using Rock-Eval pyrolysis. Org. Geochem. 2002, 33, 1441–1455. [Google Scholar] [CrossRef]
- Wilkins, R.W.; George, S.C. Coal as a source rock for oil: A review. Int. J. Coal Geol. 2002, 50, 317–361. [Google Scholar] [CrossRef]
- Sykes, R.; Volk, H.; George, S.; Ahmed, M.; Higgs, K.; Johansen, P.; Snowdon, L. Marine influence helps preserve the oil potential of coaly source rocks: Eocene Mangahewa Formation, Taranaki Basin, New Zealand. Org. Geochem. 2014, 66, 140–163. [Google Scholar] [CrossRef]
- Qadri, S.M.T.; Shalaby, M.; Islam, A.; Hoon, L.L. Source rock characterization and hydrocarbon generation modeling of the Middle to Late Eocene Mangahewa Formation in Taranaki Basin, New Zealand. Arab. J. Geosci. 2016, 9, 559. [Google Scholar] [CrossRef]
- Makeen, Y.M.; Abdullah, W.H.; Hakimi, M.H.; Mustapha, K.A. Source rock characteristics of the Lower Cretaceous Abu Gabra Formation in the Muglad Basin, Sudan, and its relevance to oil generation studies. Mar. Pet. Geol. 2015, 59, 505–516. [Google Scholar] [CrossRef]
- El-Shafeiy, M.; El-Kammar, A.; El-Barkooky, A.; Meyers, P.A. Paleo-redox depositional conditions inferred from trace metal accumulation in two Cretaceous-Paleocene organic-rich sequences from Central Egypt. Mar. Pet. Geol. 2016, 73, 333–349. [Google Scholar] [CrossRef]
- Cao, J.; Yang, R.; Yin, W.; Hu, G.; Bian, L.; Fu, X. Mechanism of Organic Matter Accumulation in Residual Bay Environments: The Early Cretaceous Qiangtang Basin, Tibet. Energy Fuels 2018, 32, 1024–1037. [Google Scholar] [CrossRef]
- Palmer, J.A.; Andrews, P.B. Cretaceous–Tertiary sedimentation and implied tectonic controls on the structural evolution of Taranaki Basin, New Zealand. South Pacific sedimentary basins. Sediment. Basins World 1993, 2, 309–328. [Google Scholar]
- Sutherland, R.; King, P.; Wood, R. Tectonic evolution of Cretaceous rift basins in southeastern Australia and New Zealand: Implications for exploration risk assessment. In Eastern Australasian Basins Symposium; Hill, K.C., Bernecker, T., Eds.; Petroleum Exploration Society of Australia Special Publication; Petroleum Exploration Society of Australia: Perth, Australia, 2001; pp. 3–13. [Google Scholar]
- Sutherland, R.; Collot, J.; Lafoy, Y.; Logan, G.A.; Hackney, R.; Stagpoole, V.; Uruski, C.; Hashimoto, T.; Higgins, K.; Herzer, R.H.; et al. Lithosphere delamination with foundering of lower crust and mantle caused permanent subsidence of New Caledonia Trough and transient uplift of Lord Howe Rise during Eocene and Oligocene initiation of Tonga-Kermadec subduction, western Pacific. Tectonics 2010, 29, TC2004. [Google Scholar] [CrossRef]
- Kumar, P.C.; Omosanya, K.O.; Eruteya, O.E.; Sain, K. Geomorphological characterization of basal flow markers during recurrent mass movement: A case study from the Taranaki Basin, offshore New Zealand. Basin Res. 2021, 33, 2358–2382. [Google Scholar] [CrossRef]
- Radwan, A.A.; Nabawy, B.S.; Abdelmaksoud, A.; Lashin, A. Integrated sedimentological and petrophysical characterization for clastic reservoirs: A case study from New Zealand. J. Nat. Gas Sci. Eng. 2021, 88, 103797. [Google Scholar] [CrossRef]
- Radwan, A.A.; Nabawy, B.S. Hydrocarbon prospectivity of the miocene-pliocene clastic reservoirs, Northern Taranaki basin, New Zealand: Integration of petrographic and geophysical studies. J. Pet. Explor. Prod. Technol. 2022, 12, 1945–1962. [Google Scholar] [CrossRef]
- Elmahdy, M.; Radwan, A.A.; Nabawy, B.S.; Abdelmaksoud, A.; Nastavkin, A.V. Integrated geophysical, petrophysical and petrographical characterization of the carbonate and clastic reservoirs of the Waihapa Field, Taranaki Basin, New Zealand. Mar. Pet. Geol. 2023, 151, 106173. [Google Scholar] [CrossRef]
- Radwan, A.A.; Nabawy, B.S.; Kassem, A.A.; Elmahdy, M. An integrated workflow for seismic interpretation, petrophysical and petrographical characterization for the clastic Mangahewa reservoir in Pohokura gas field, Taranaki Basin, New Zealand. Geoenergy Sci. Eng. 2023, 229, 212117. [Google Scholar] [CrossRef]
- Shalaby, M.R.; Malik, O.A.; Lai, D.; Jumat, N.; Islam, M.A. Thermal maturity and TOC prediction using machine learning techniques: Case study from the Cretaceous–Paleocene source rock, Taranaki Basin, New Zealand. J. Pet. Explor. Prod. Technol. 2020, 10, 2175–2193. [Google Scholar] [CrossRef]
- Schellart, W.; Lister, G.; Toy, V. A Late Cretaceous and Cenozoic reconstruction of the Southwest Pacific region: Tectonics controlled by subduction and slab rollback processes. Earth-Sci. Rev. 2006, 76, 191–233. [Google Scholar] [CrossRef]
- Strogen, D.P.; Bland, K.J.; Nicol, A.; King, P.R. Paleogeography of the Taranaki Basin region during the latest Eocene–Early Miocene and implications for the ‘total drowning’of Zealandia. N. Zealand J. Geol. Geophys. 2014, 57, 110–127. [Google Scholar] [CrossRef]
- Grahame, J. Deepwater Taranaki Basin, New Zealand—New interpretation and modelling results for Large Scale Neogene Channel and Fan Systems: Implications for hydrocarbon prospectivity. In Proceedings of the AAPG/SEG 2015 International Conference and Exhibition (ICE), A Powerhouse Emerges: Energy for the Next Fifty Years, Melbourne, Australia, 13–16 September 2015. [Google Scholar]
- Behar, F.; Beaumont, V.D.E.B.; Penteado, H.D.B. Rock-Eval 6 Technology: Performances and Developments. Oil Gas Sci. Technol. 2001, 56, 111–134. [Google Scholar] [CrossRef]
- Wu, M.; Shen, J.; Qin, Y.; Qin, Y.; Wang, X.; Zhu, S. Method of Identifying Total Sulfur Content in Coal: Geochemical and Geophysical Logging Data from the Upper Paleozoic in North China. ACS Omega 2022, 7, 45045–45056. [Google Scholar] [CrossRef] [PubMed]
- Mukhopadhyay, P.K. Maturation of organic matter as revealed by microscopic methods: Applications and limitations of vitrinite reflectance, and continuous spectral and pulsed laser fluorescence spectroscopy. In Developments in Sedimentology; Elsevier: Amsterdam, The Netherlands, 1992; Volume 47, pp. 435–510. [Google Scholar]
- Rogers, K.M.; Collen, J.D.; Johnston, J.H.; Elgar, N.E. A geochemical appraisal of oil seeps from the East Coast Basin, New Zealand. Org. Geochem. 1999, 30, 593–605. [Google Scholar] [CrossRef]
- A Berner, R.; Raiswell, R. Burial of organic carbon and pyrite sulfur in sediments over phanerozoic time: A new theory. Geochim. Et Cosmochim. Acta 1983, 47, 855–862. [Google Scholar] [CrossRef]
- Hedges, J.I.; Keil, R.G. Sedimentary organic matter preservation: An assessment and speculative synthesis. Mar. Chem. 1995, 49, 81–115. [Google Scholar] [CrossRef]
- Fathy, D.; Wagreich, M.; Fathi, E.; Ahmed, M.S.; Leila, M.; Sami, M. Maastrichtian Anoxia and Its Influence on Organic Matter and Trace Metal Patterns in the Southern Tethys Realm of Egypt during Greenhouse Variability. ACS Omega 2023, 8, 19603–19612. [Google Scholar] [CrossRef] [PubMed]
- Cornford, C.; Rullkotter, J.; Welte, D. Organic geochemistry of DSDP Leg 47a, Site 397, eastern North Atlantic: Organic petrography and extractable hydrocarbons. Initial Rep. Deep Sea Drill. Proj. 1979, 47 Pt 1, 511–522. [Google Scholar]
- Dutta, S.; Mathews, R.P.; Singh, B.D.; Tripathi, S.M.; Singh, A.; Saraswati, P.K.; Banerjee, S.; Mann, U. Petrology, palynology and organic geochemistry of Eocene lignite of Matanomadh, Kutch Basin, western India: Implications to depositional environment and hydrocarbon source potential. Int. J. Coal Geol. 2011, 85, 91–102. [Google Scholar] [CrossRef]
- Tao, S.; Wang, Y.; Tang, D.; Wu, D.; Xu, H.; He, W. Organic petrology of Fukang Permian Lucaogou Formation oil shales at the northern foot of Bogda Mountain, Junggar Basin, China. Int. J. Coal Geol. 2012, 99, 27–34. [Google Scholar] [CrossRef]
- Tissot, B.P.; Welte, D.H. Kerogen: Composition and Classification. In Petroleum Formation and Occurrence; Springer: Berlin/Heidelberg, Germany, 1984; pp. 131–159. [Google Scholar]
- Mello, M.; Gaglianone, P.; Brassell, S.; Maxwell, J. Geochemical and biological marker assessment of depositional environments using Brazilian offshore oils. Mar. Pet. Geol. 1988, 5, 205–223. [Google Scholar] [CrossRef]
- Peters, K.E.; Fraser, T.H.; Amris, W.; Rustanto, B.; Hermanto, E. Geochemistry of crude oils from eastern Indonesia. AAPG Bull. 1999, 83, 1927–1942. [Google Scholar]
- Hassan, M.; Leila, M.; Ahmed, M.; Issa, G.; Hegab, O. Geochemical characteristics of natural gases and source rocks in Obayied sub-basin, north Western Desert, Egypt: Implications for gas-source correlation. Acta Geochim. 2023, 42, 241–255. [Google Scholar] [CrossRef]
- Zhao, C.Y.; Cheng, K.M. The Organic Petrology Characteristics of Oil Derived from Coal in Turpan-Hami Basin. Pet. Explor. Dev. 1995, 22, 24–27. [Google Scholar]
- Li, C.; Yuan, Q.; Zhang, M. Generative Potential of Carboniferous-Permian Coal-Bearing Source Rocks in Ordos Basin. Open J. Yangtze Oil Gas 2021, 2, 260–272. [Google Scholar] [CrossRef]
- Wan Hasiah, A. Evidence of early generation of liquid hydrocarbon from suberinite as visible under the microscope. Org. Geochem. 1997, 27, 591–596. [Google Scholar] [CrossRef]
- Yao, S.; Cao, J.; Zhang, K.; Jiao, K.; Ding, H.; Hu, W. Artificial bacterial degradation and hydrous pyrolysis of suberin: Implications for hydrocarbon generation of suberinite. Org. Geochem. 2012, 47, 22–33. [Google Scholar] [CrossRef]
- Pickel, W.; Kus, J.; Flores, D.; Kalaitzidis, S.; Christanis, K.; Cardott, B.J.; Misz-Kennan, M.; Rodrigues, S.; Hentschel, A.; Hamor-Vido, M.; et al. Classification of liptinite–ICCP System 1994. Int. J. Coal Geol. 2017, 169, 40–61. [Google Scholar] [CrossRef]
- Waples, D.W. Source-Rock Evaluation. In Geochemistry in Petroleum Exploration; Springer: Berlin/Heidelberg, Germany, 1985; pp. 93–120. [Google Scholar]
- Magoon, L.B.; Dow, W.G. The Petroleum System. In The Petroleum System—From Source to Trap; Magoon, L.B., Dow, W.G., Eds.; AAPG Memoire; AAPG: Tulsa, OK, USA, 1994; Volume 60, pp. 3–24. [Google Scholar]
- Dembicki, H., Jr. Practical Petroleum Geochemistry for Exploration and Production; Elsevier: Amsterdam, The Netherlands, 2017; p. 331. [Google Scholar]
- Sofer, Z. Stable Carbon Isotope Compositions of Crude Oils: Application to Source Depositional Environments and Petroleum Alteration. AAPG Bull. 1984, 68, 31–49. [Google Scholar]
- Peters, K.; Moldowan, J. Effects of source, thermal maturity, and biodegradation on the distribution and isomerization of homohopanes in petroleum. Org. Geochem. 1991, 17, 47–61. [Google Scholar] [CrossRef]
- Sykes, R. Chemometric Classification of Terrestrial Oil Families in Taranaki Basin, New Zealand: Higher Plant Trends and Migration Contamination Effects. In Proceedings of the AAPG Hedberg Conference, The Evolution of Petroleum Systems Analysis: Changing of the Guard from Late Mature Experts to Peak Generating Staff, Houston, TX, USA, 4–6 March 2019. [Google Scholar]
- Shanmugam, G. Significance of Coniferous Rain Forests and Related Organic Matter in Generating Commercial Quantities of Oil, Gippsland Basin, Australia. AAPG Bull. 1985, 69, 1241–1254. [Google Scholar] [CrossRef]
- Huang, W.Y.; Meinschein, W.G. Sterols as ecological indicators. Geochim. Et Cosmochim. Acta 1979, 43, 739–745. [Google Scholar] [CrossRef]
- Seifert, W.K.; Moldowan, J.M. Use of biological markers in petroleum exploration. Methods Geochem. Geophys. 1986, 24, 261–290. [Google Scholar]
- Glikson, M.; Boreham, C.; Thiede, D. Coal composition and mode of maturation, a determination factor in quantifying hydrocarbon species generated. In Coalbed Methane: Scientific, Environmental and Economic Evaluation; Mastalerz, M., Glikson, M., Golding, S., Eds.; Springer: Berlin/Heidelberg, Germany, 1999; pp. 155–158. [Google Scholar]
- Cooles, G.; Mackenzie, A.; Quigley, T. Calculation of petroleum masses generated and expelled from source rocks. Org. Geochem. 1986, 10, 235–245. [Google Scholar] [CrossRef]
- Sandvik, E.; Young, W.; Curry, D. Expulsion from hydrocarbon sources: The role of organic absorption. Org. Geochem. 1992, 19, 77–87. [Google Scholar] [CrossRef]
- Stach, E.; Mackowsky M-Th Teichmuller, M.; Taylor, G.H.; Chandra, D.; Teichmuller, R. Stach’s Textbook of Coal Petrology, 3rd ed.; Gebruder Borntraeger: Stuttgart, Germany, 1982; 535p. [Google Scholar]
- Levine, J.R. Coalification: The evolution of coal as source rock and reservoir rock for oil and gas. In Hydrocarbons from Coal: AAPG Studies in Geology #38; Law, B.E., Rice, D.D., Eds.; AAPG: Tulsa, OK, USA, 1993; pp. 39–77. [Google Scholar]


| Well | Lithology | TS Wt (%) | TOC Wt (%) | S2 Mg HC/g Rock | HI Mg HC/g TOC | VR (%Ro) |
|---|---|---|---|---|---|---|
| Tane-1 | Coal | 1.67 | 69.53 | 200.95 | 289 | 0.51 |
| Tane-1 | Coal | 0.67 | 71.85 | 198.30 | 276 | 0.66 |
| Tane-1 | Coal | 0.65 | 71.67 | 169.85 | 237 | 0.68 |
| Tane-1 | Coal | 0.67 | 71.14 | 177.85 | 250 | 0.76 |
| Wainui-1 | Coal | - | 43.2 | - | - | 0.49 |
| Wainui-1 | Coal | - | 44.0 | - | - | 0.45 |
| Wainui-1 | Coal | 3.07 | 60.26 | 227.18 | 377 | 0.48 |
| Average | 1.35 | 62 | 195 | 286 | 0.57 | |
| Tane-1 | Mudstone | 0.76 | 33.63 | 102.57 | 305 | 0.66 |
| Tane-1 | Mudstone | 0.65 | 38.48 | 102.74 | 267 | 0.71 |
| Tane-1 | Mudstone | 0.66 | 39.04 | 105.79 | 271 | 0.76 |
| Wainui-1 | Mudstone | - | 28.55 | 107.34 | 376 | 0.48 |
| Wainui-1 | Mudstone | - | 5.0 | - | - | 0.54 |
| Wainui-1 | Mudstone | - | 0.78 | 2.51 | 322 | 0.97 |
| Wainui-1 | Mudstone | - | 9.31 | 15.6 | 168 | 1.03 |
| Wainui-1 | Mudstone | - | 5.50 | 7.18 | 131 | 1.06 |
| Average | 0.70 | 20 | 63.4 | 263 | 0.78 | |
| Well | Lithology | Saturates Wt (%) | Aromatics Wt (%) | Asphaltene & Polar Compounds Wt (%) | δ13Csaturates (‰) | δ13Caromatics (‰) | Canonical Variable CV | Pr/Ph | Pr/nC17 | Ph/nC18 | CPI |
|---|---|---|---|---|---|---|---|---|---|---|---|
| Tane-1 | Coal | 3.4 | 26.7 | 69.9 | −29.0 | −26.6 | 2.67 | 5.69 | 7.88 | 1.14 | 1.59 |
| Tane-1 | Coal | 5.7 | 24.4 | 70.0 | −28.5 | −26.9 | 0.74 | 8.83 | 8.78 | 0.87 | 1.55 |
| Tane-1 | Coal | 5.6 | 18.3 | 76.1 | −28.5 | −27.3 | −0.15 | 8.12 | 7.38 | 0.86 | 1.57 |
| Tane-1 | Coal | 5.2 | 13.9 | 81.0 | −29.1 | −26.5 | 3.14 | 5.03 | 3.76 | 0.96 | 1.55 |
| Tane-1 | Coal | 5.4 | 28.6 | 65.9 | −27.5 | −26.5 | −0.91 | 8.16 | 3.22 | 0.36 | 1.29 |
| Tane-1 | Coal | 3.6 | 31.8 | 64.7 | −28.1 | −27.1 | −0.72 | 7.16 | 2.86 | 0.37 | 1.25 |
| Wainui-1 | Coal | 5.2 | 31.8 | 63.1 | −28.3 | −26.8 | 0.45 | 8.30 | 8.30 | 1.10 | 1.38 |
| Average | 4.8 | 25.0 | 70.2 | −28.42 | −26.81 | 0.74 | 7.32 | 6.02 | 0.80 | 1.45 | |
| Wainui-1 | Mudstone | 11.0 | 19.9 | 69.1 | −28.3 | −26.8 | 0.45 | 4.42 | 2.09 | 0.44 | 1.35 |
| Wainui-1 | Mudstone | 15.3 | 9.0 | 75.6 | −28.1 | −26.9 | −0.28 | 3.73 | 1.65 | 0.43 | 1.36 |
| Wainui-1 | Mudstone | 29.9 | 13.3 | 56.7 | −28.1 | −27.0 | −0.50 | 4.22 | 1.96 | 0.50 | 1.36 |
| Wainui-1 | Mudstone | - | - | - | − | − | − | 3.50 | 2.30 | 0.58 | 1.17 |
| Average | 18.7 | 14.0 | 67.3 | −28.17 | −26.90 | −0.11 | 3.97 | 2.00 | 0.49 | 1.31 | |
| Well | Lithology | A | B | C | D | E | F | G | H | I | J | K | L | M |
|---|---|---|---|---|---|---|---|---|---|---|---|---|---|---|
| Tane-1 | Coal | 0.03 | 3.45 | 0.36 | 0.06 | 0.12 | 0.74 | 4.76 | 10.18 | 19.09 | 70.74 | 0.44 | 0.46 | 0.39 |
| Tane-1 | Coal | 0.02 | 3.74 | 0.20 | 0.04 | 0.05 | 0.85 | 4.82 | 5.30 | 11.67 | 83.03 | 0.34 | 0.49 | 0.35 |
| Tane-1 | Coal | 0.03 | 9.60 | 0.23 | 0.06 | 0.09 | 0.74 | 7.08 | 6.77 | 12.33 | 80.90 | 0.38 | 0.48 | 0.31 |
| Tane-1 | Coal | 0.08 | 18.89 | 0.30 | 0.09 | 0.17 | 0.67 | 10.41 | 13.41 | 13.42 | 73.17 | 0.50 | 0.47 | 0.40 |
| Tane-1 | Coal | 0.02 | - | 0.19 | 0.03 | 0.03 | 0.90 | 3.39 | 5.07 | 13.80 | 81.13 | 0.19 | 0.52 | 0.40 |
| Tane-1 | Coal | 0.12 | 5.57 | 0.43 | 0.05 | 0.06 | 0.82 | 5.31 | 9.14 | 29.44 | 61.42 | 0.26 | 0.46 | 0.39 |
| Wainui-1 | Coal | 0.09 | 11.64 | 0.26 | 0.12 | 0.13 | 0.70 | 10.20 | 9.42 | 13.53 | 77.05 | 0.31 | 0.47 | 0.40 |
| Average | 0.06 | 7.55 | 0.28 | 0.06 | 0.09 | 0.77 | 6.57 | 8.47 | 16.18 | 75.35 | 0.34 | 0.48 | 0.38 | |
| Wainui-1 | Mudstone | 0.08 | 24.21 | 0.28 | 0.10 | 0.28 | 0.50 | 12.16 | 11.52 | 14.76 | 73.73 | 0.46 | 0.42 | 0.41 |
| Wainui-1 | Mudstone | 0.09 | 28.00 | 0.27 | 0.08 | 0.46 | 0.29 | 13.24 | 15.28 | 15.83 | 68.89 | 0.48 | 0.47 | 0.43 |
| Wainui-1 | Mudstone | 0.13 | 13.62 | 0.35 | 0.08 | 0.48 | 0.35 | 13.19 | 23.41 | 16.79 | 59.80 | 0.50 | 0.48 | 0.44 |
| Wainui-1 | Mudstone | 0.10 | 10.00 | 0.24 | 0.08 | 0.35 | 0.32 | 10.10 | 18.40 | 17.40 | 64.20 | 0.47 | 0.41 | 0.41 |
| Average | 0.10 | 18.96 | 0.28 | 0.08 | 0.39 | 0.36 | 12.17 | 17.15 | 16.19 | 66.65 | 0.48 | 0.44 | 0.42 | |
Disclaimer/Publisher’s Note: The statements, opinions and data contained in all publications are solely those of the individual author(s) and contributor(s) and not of MDPI and/or the editor(s). MDPI and/or the editor(s) disclaim responsibility for any injury to people or property resulting from any ideas, methods, instructions or products referred to in the content. |
© 2023 by the authors. Licensee MDPI, Basel, Switzerland. This article is an open access article distributed under the terms and conditions of the Creative Commons Attribution (CC BY) license (https://creativecommons.org/licenses/by/4.0/).
Share and Cite
Leila, M.; Radwan, A.A.; Abdel-Fattah, M.I. Lithofacies Controls on Hydrocarbon Generation Potentiality of the Syn-Rift Late Cretaceous Rakopi Deltaic Facies in the North-Eastern Offshore Part of Taranaki Basin, New Zealand. Minerals 2023, 13, 1169. https://doi.org/10.3390/min13091169
Leila M, Radwan AA, Abdel-Fattah MI. Lithofacies Controls on Hydrocarbon Generation Potentiality of the Syn-Rift Late Cretaceous Rakopi Deltaic Facies in the North-Eastern Offshore Part of Taranaki Basin, New Zealand. Minerals. 2023; 13(9):1169. https://doi.org/10.3390/min13091169
Chicago/Turabian StyleLeila, Mahmoud, Ahmed A. Radwan, and Mohamed I. Abdel-Fattah. 2023. "Lithofacies Controls on Hydrocarbon Generation Potentiality of the Syn-Rift Late Cretaceous Rakopi Deltaic Facies in the North-Eastern Offshore Part of Taranaki Basin, New Zealand" Minerals 13, no. 9: 1169. https://doi.org/10.3390/min13091169