
Gas Desorption Characteristics of the Chang 7 Member Shale in the Triassic Yanchang Formation, Yan’an Area, Ordos Basin
Abstract
:1. Introduction
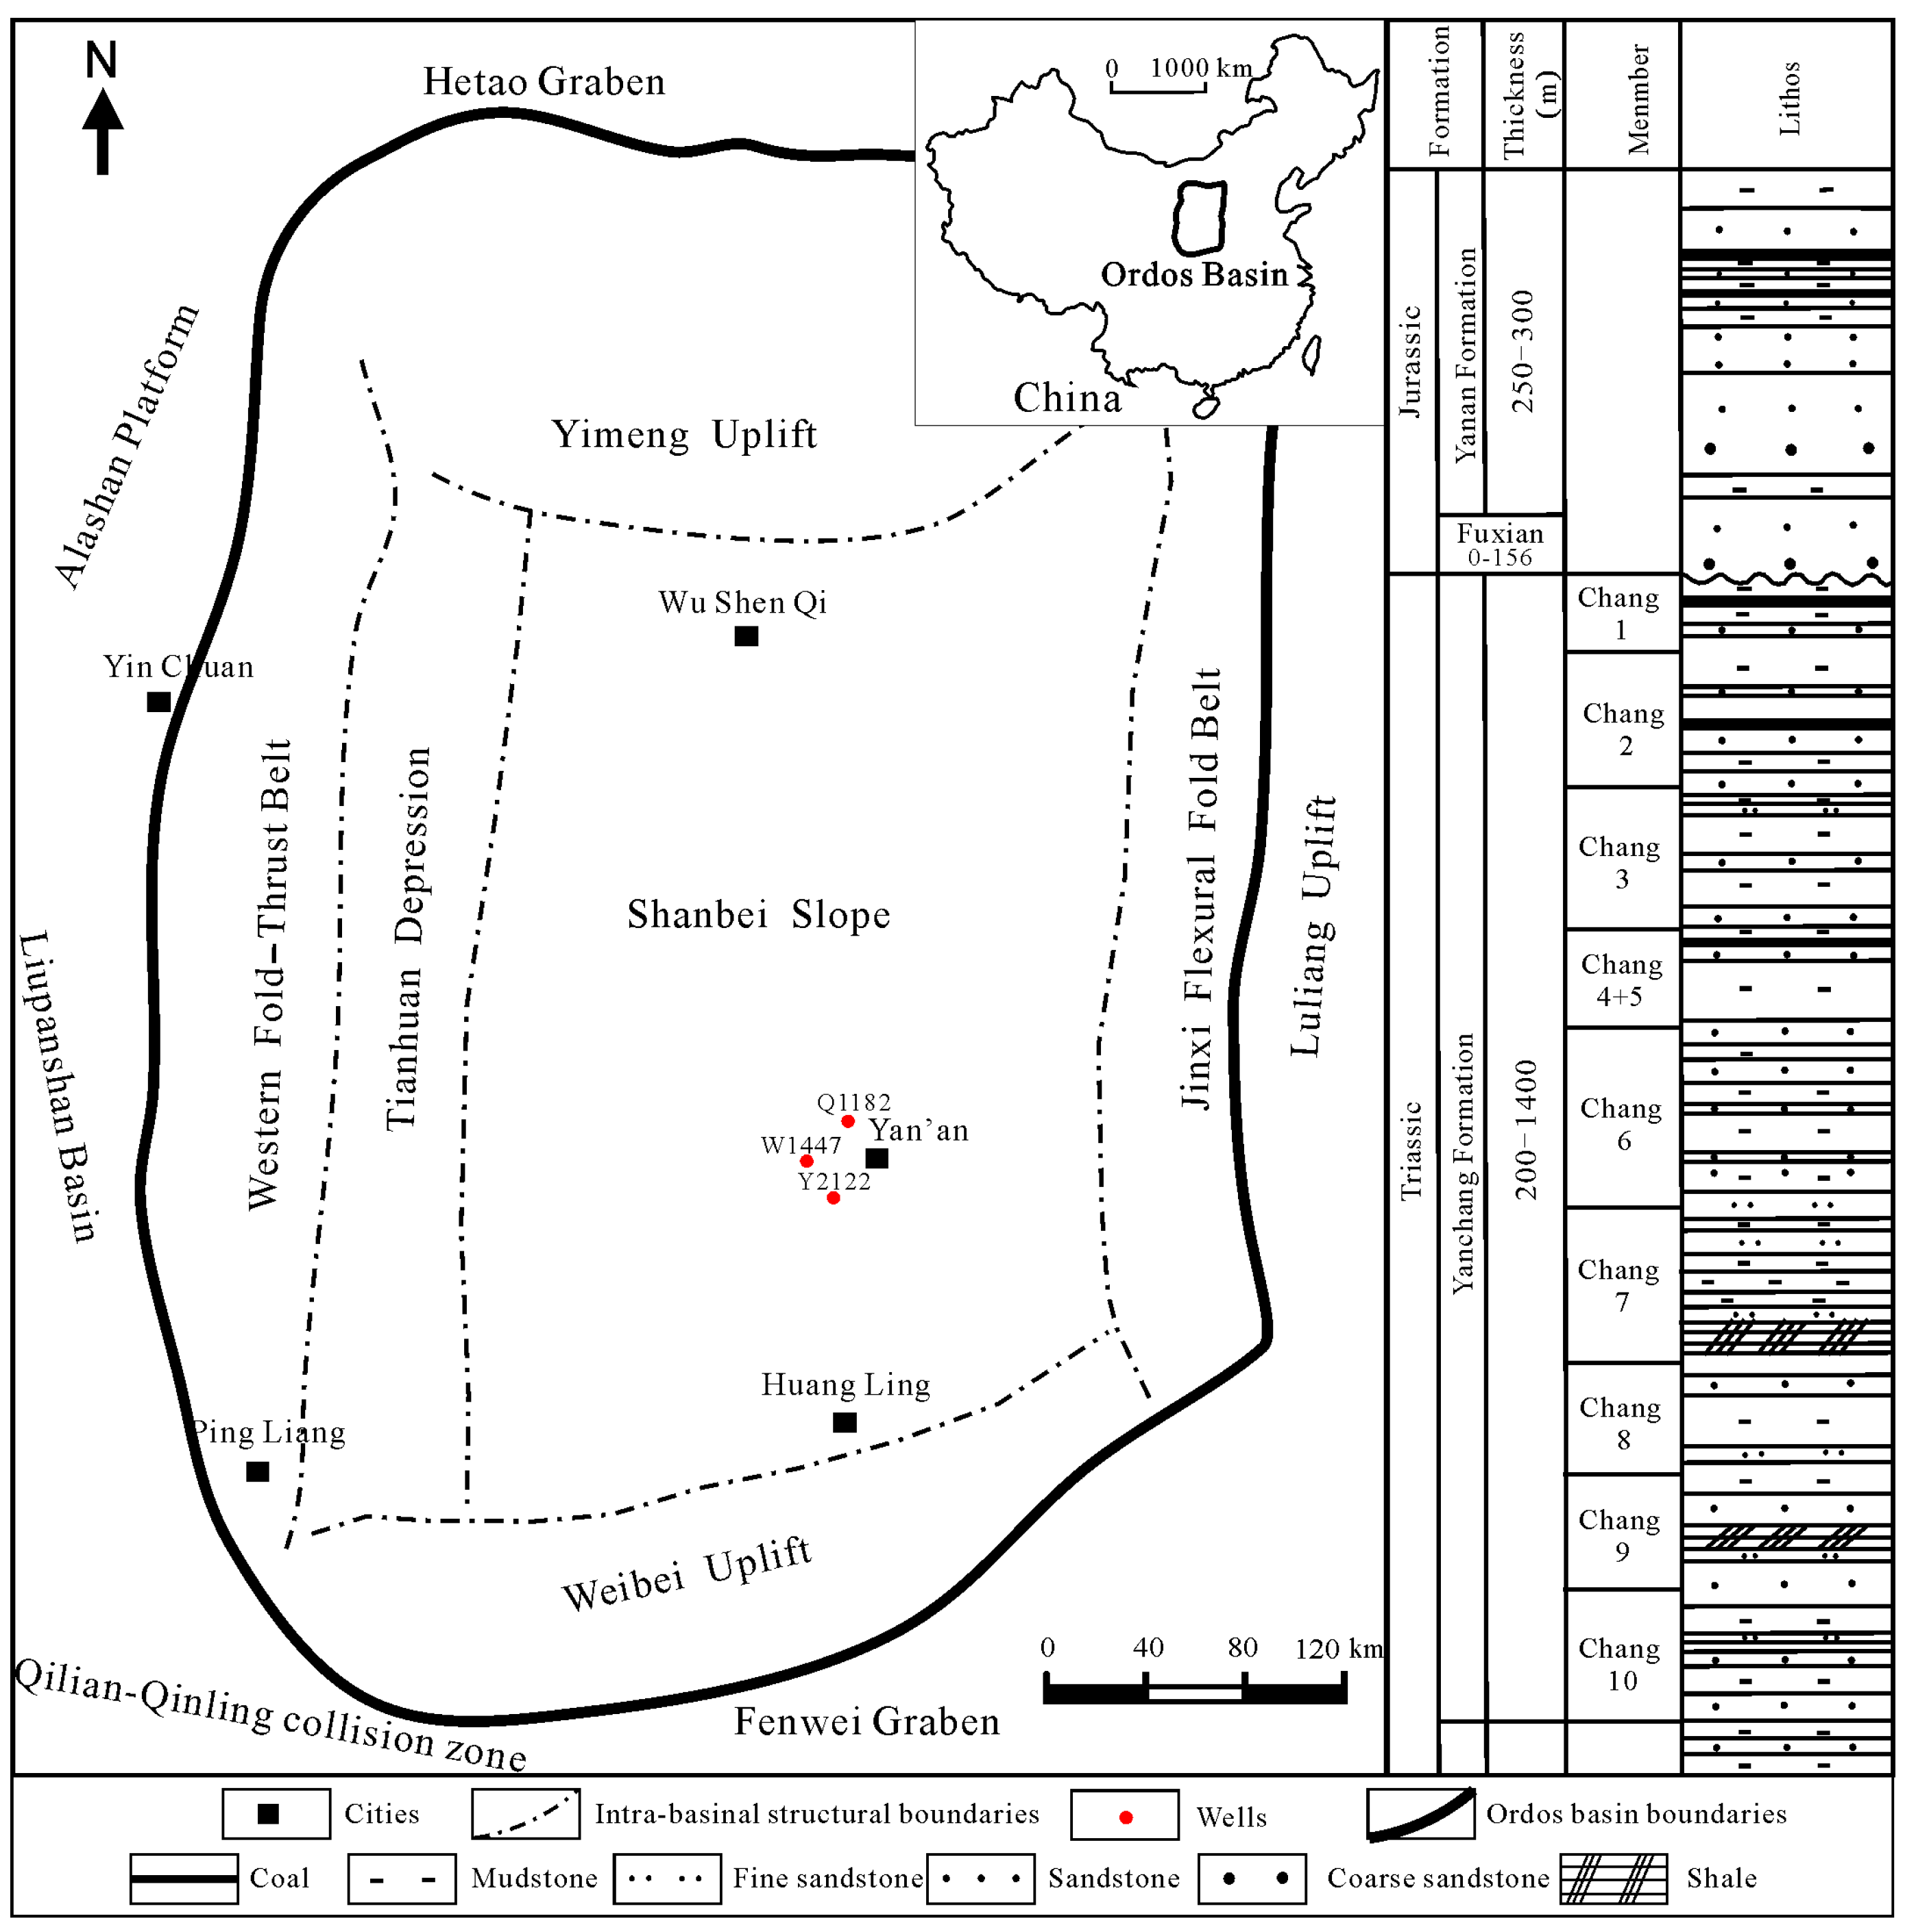
2. Geological Background
3. Sampling and Experiments
4. Experimental Results
5. Discussion
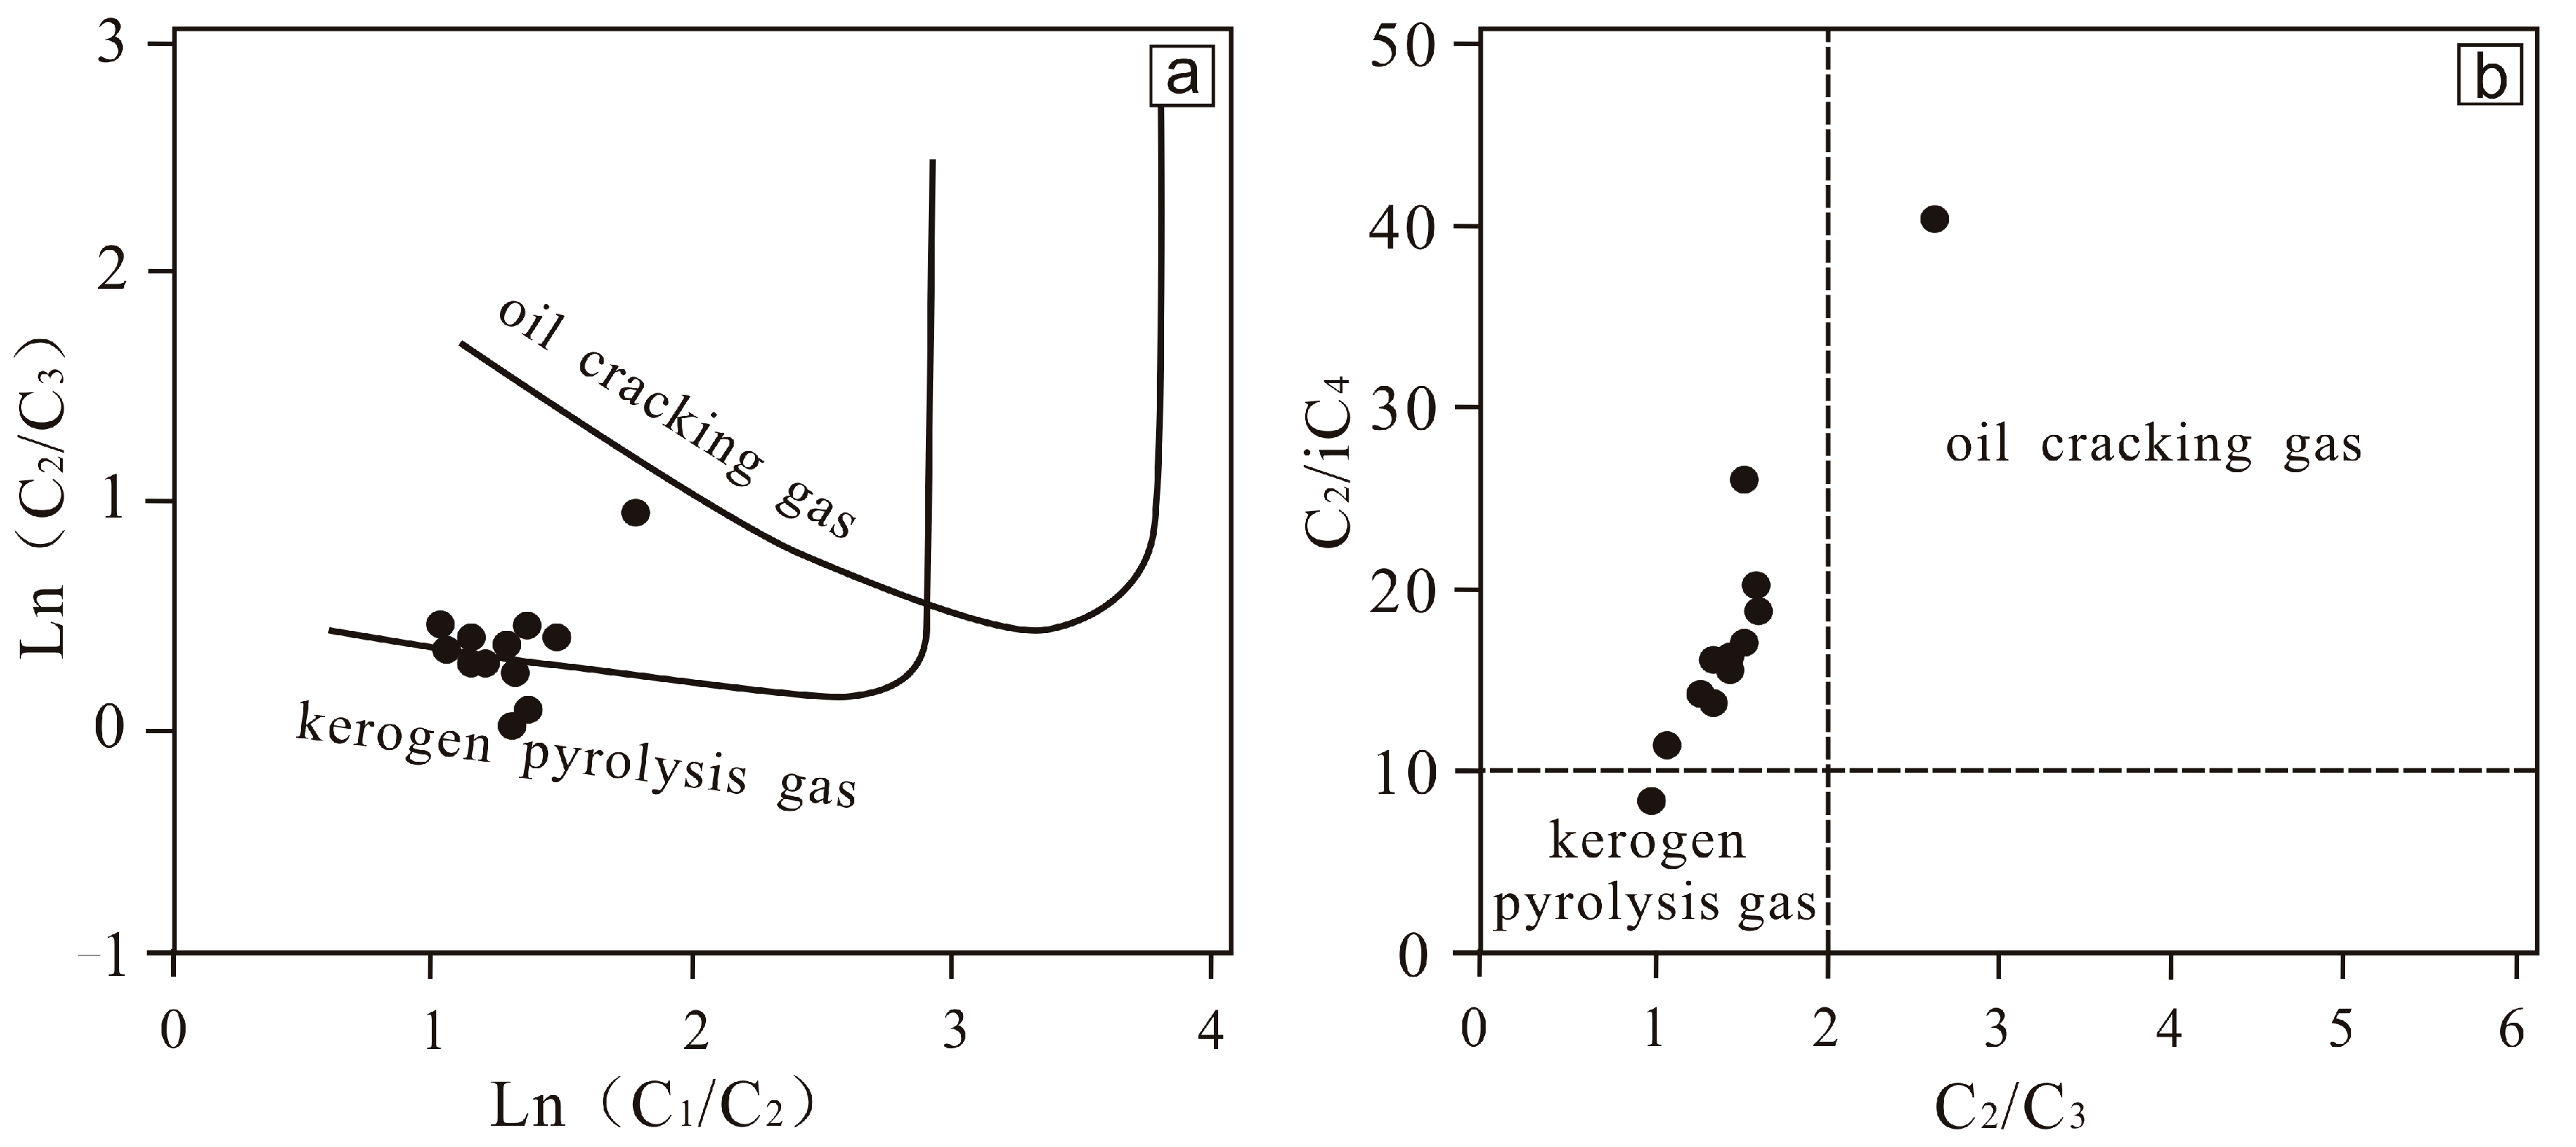
5.1. Origins of Shale Gas
5.2. Shale Gas Content
5.3. Gas Generating Capability
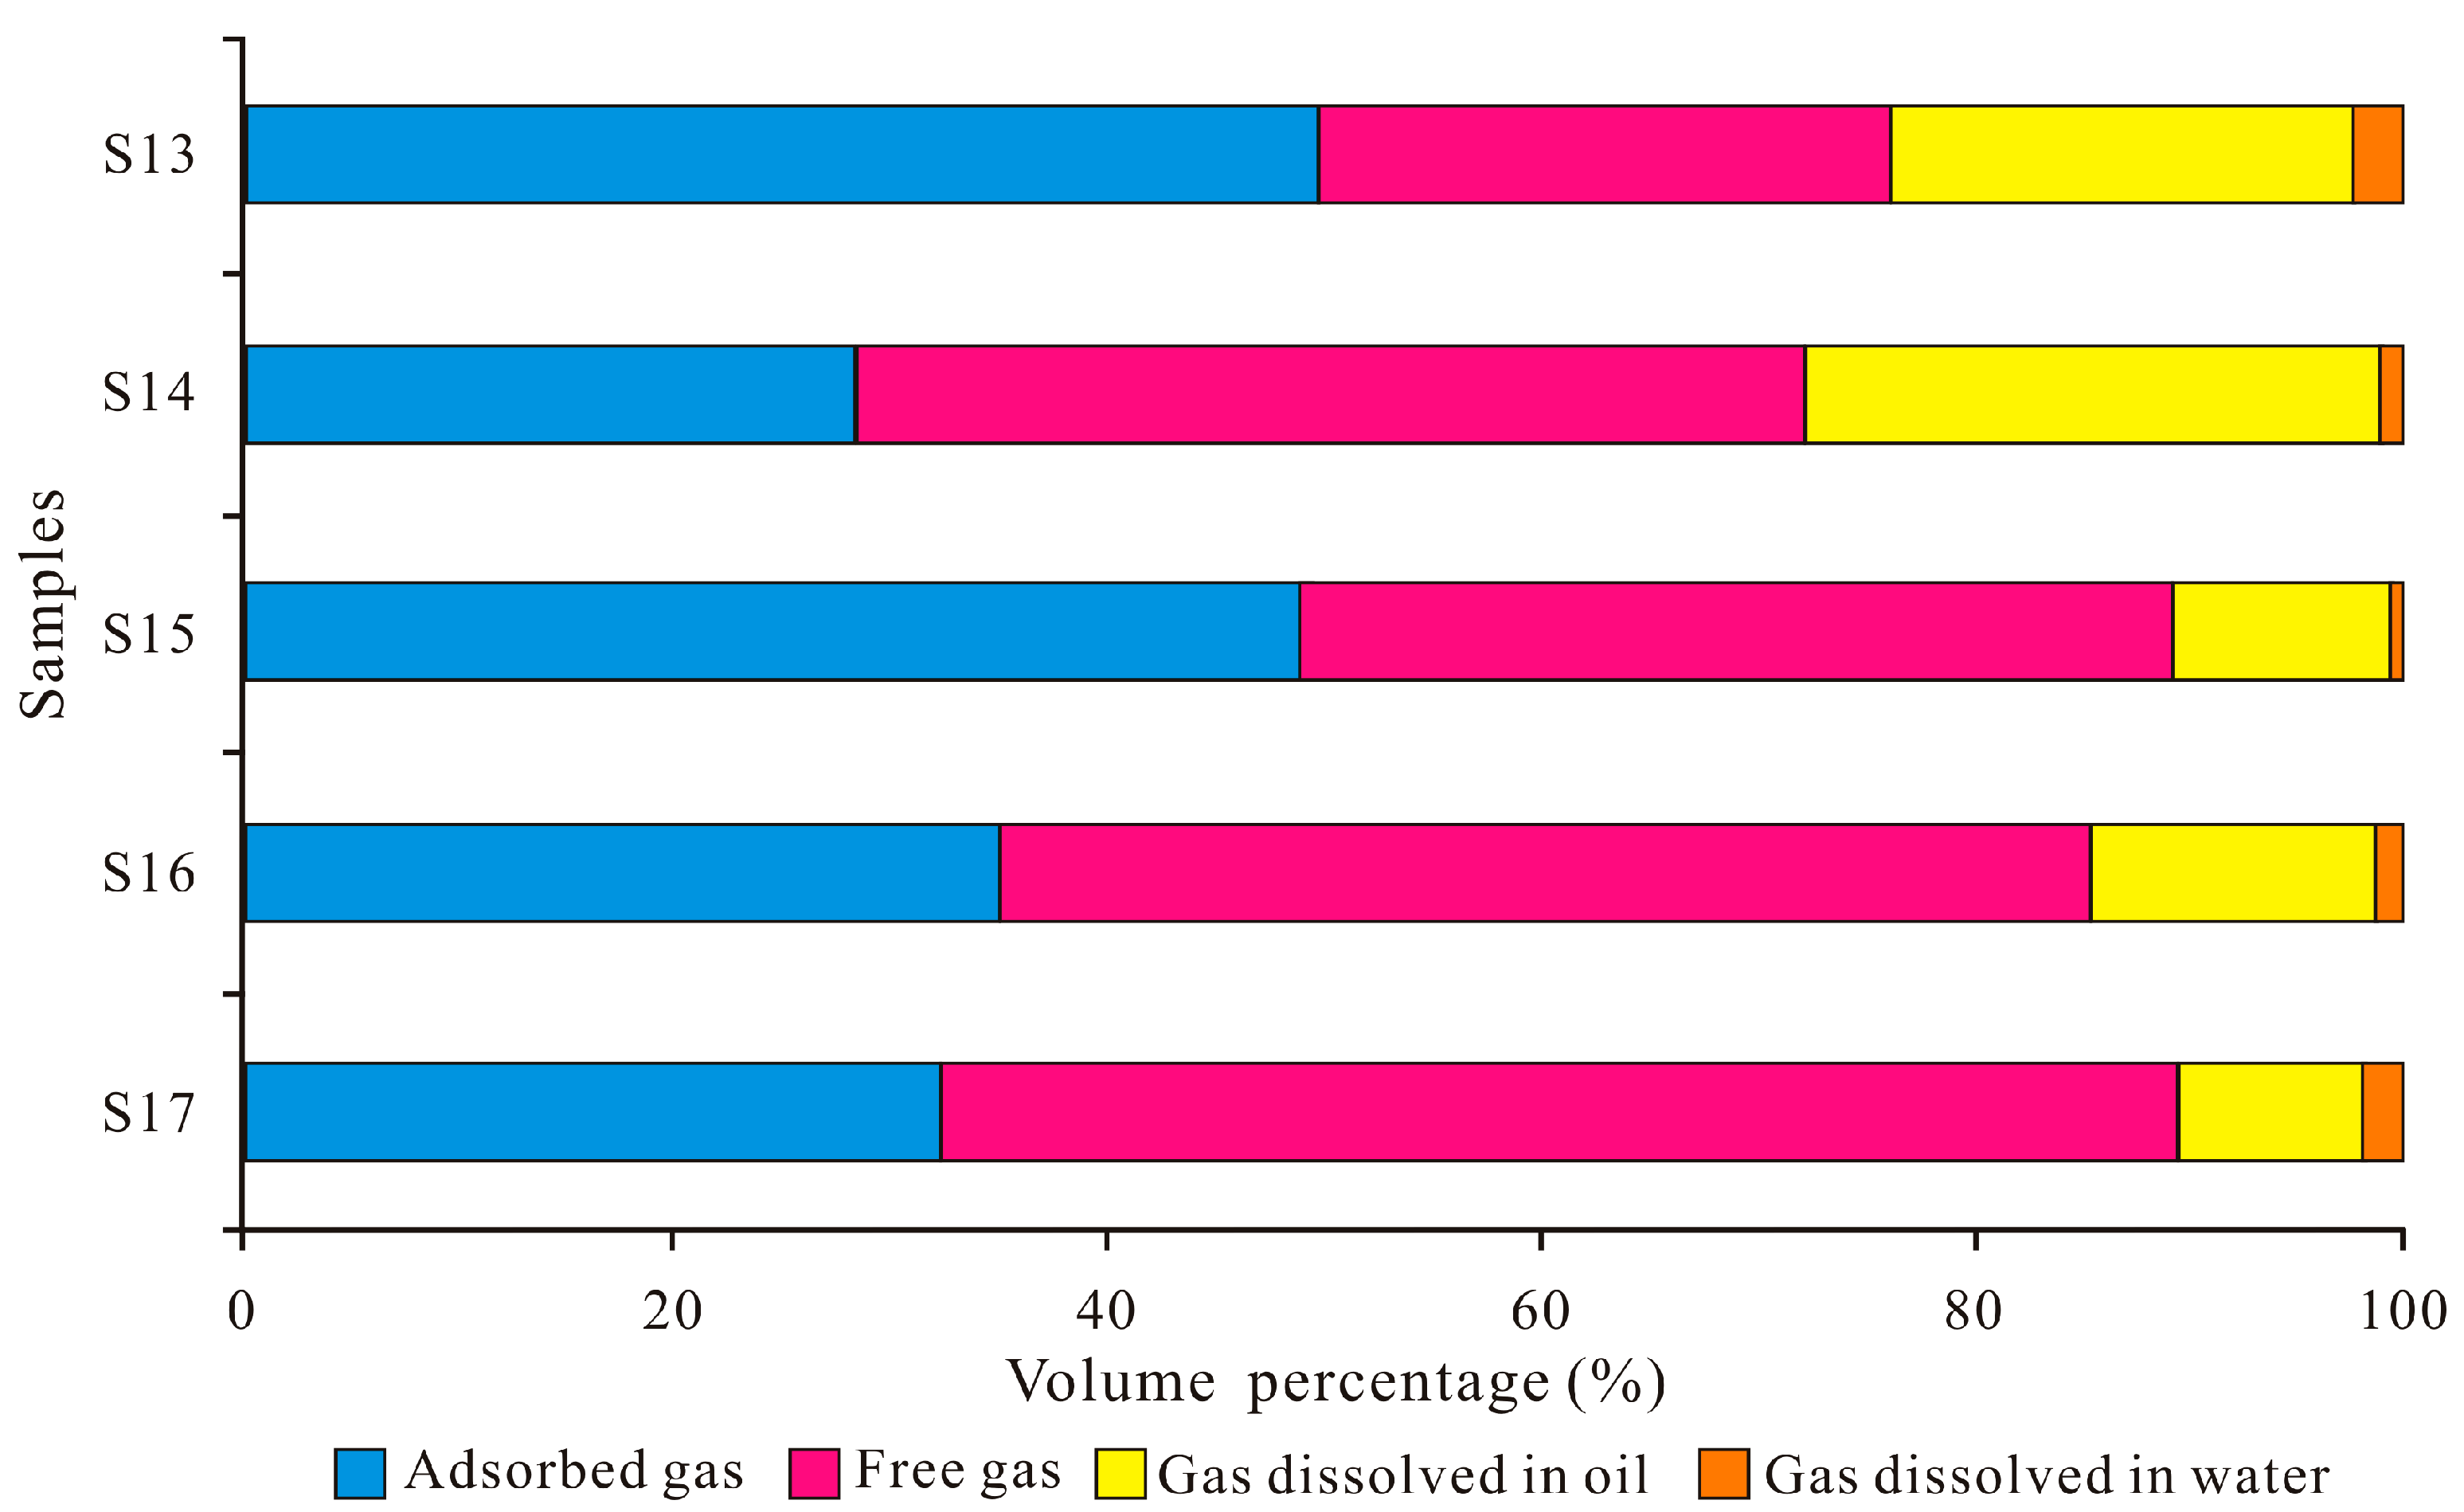
5.4. Hosting States of Shale Gas
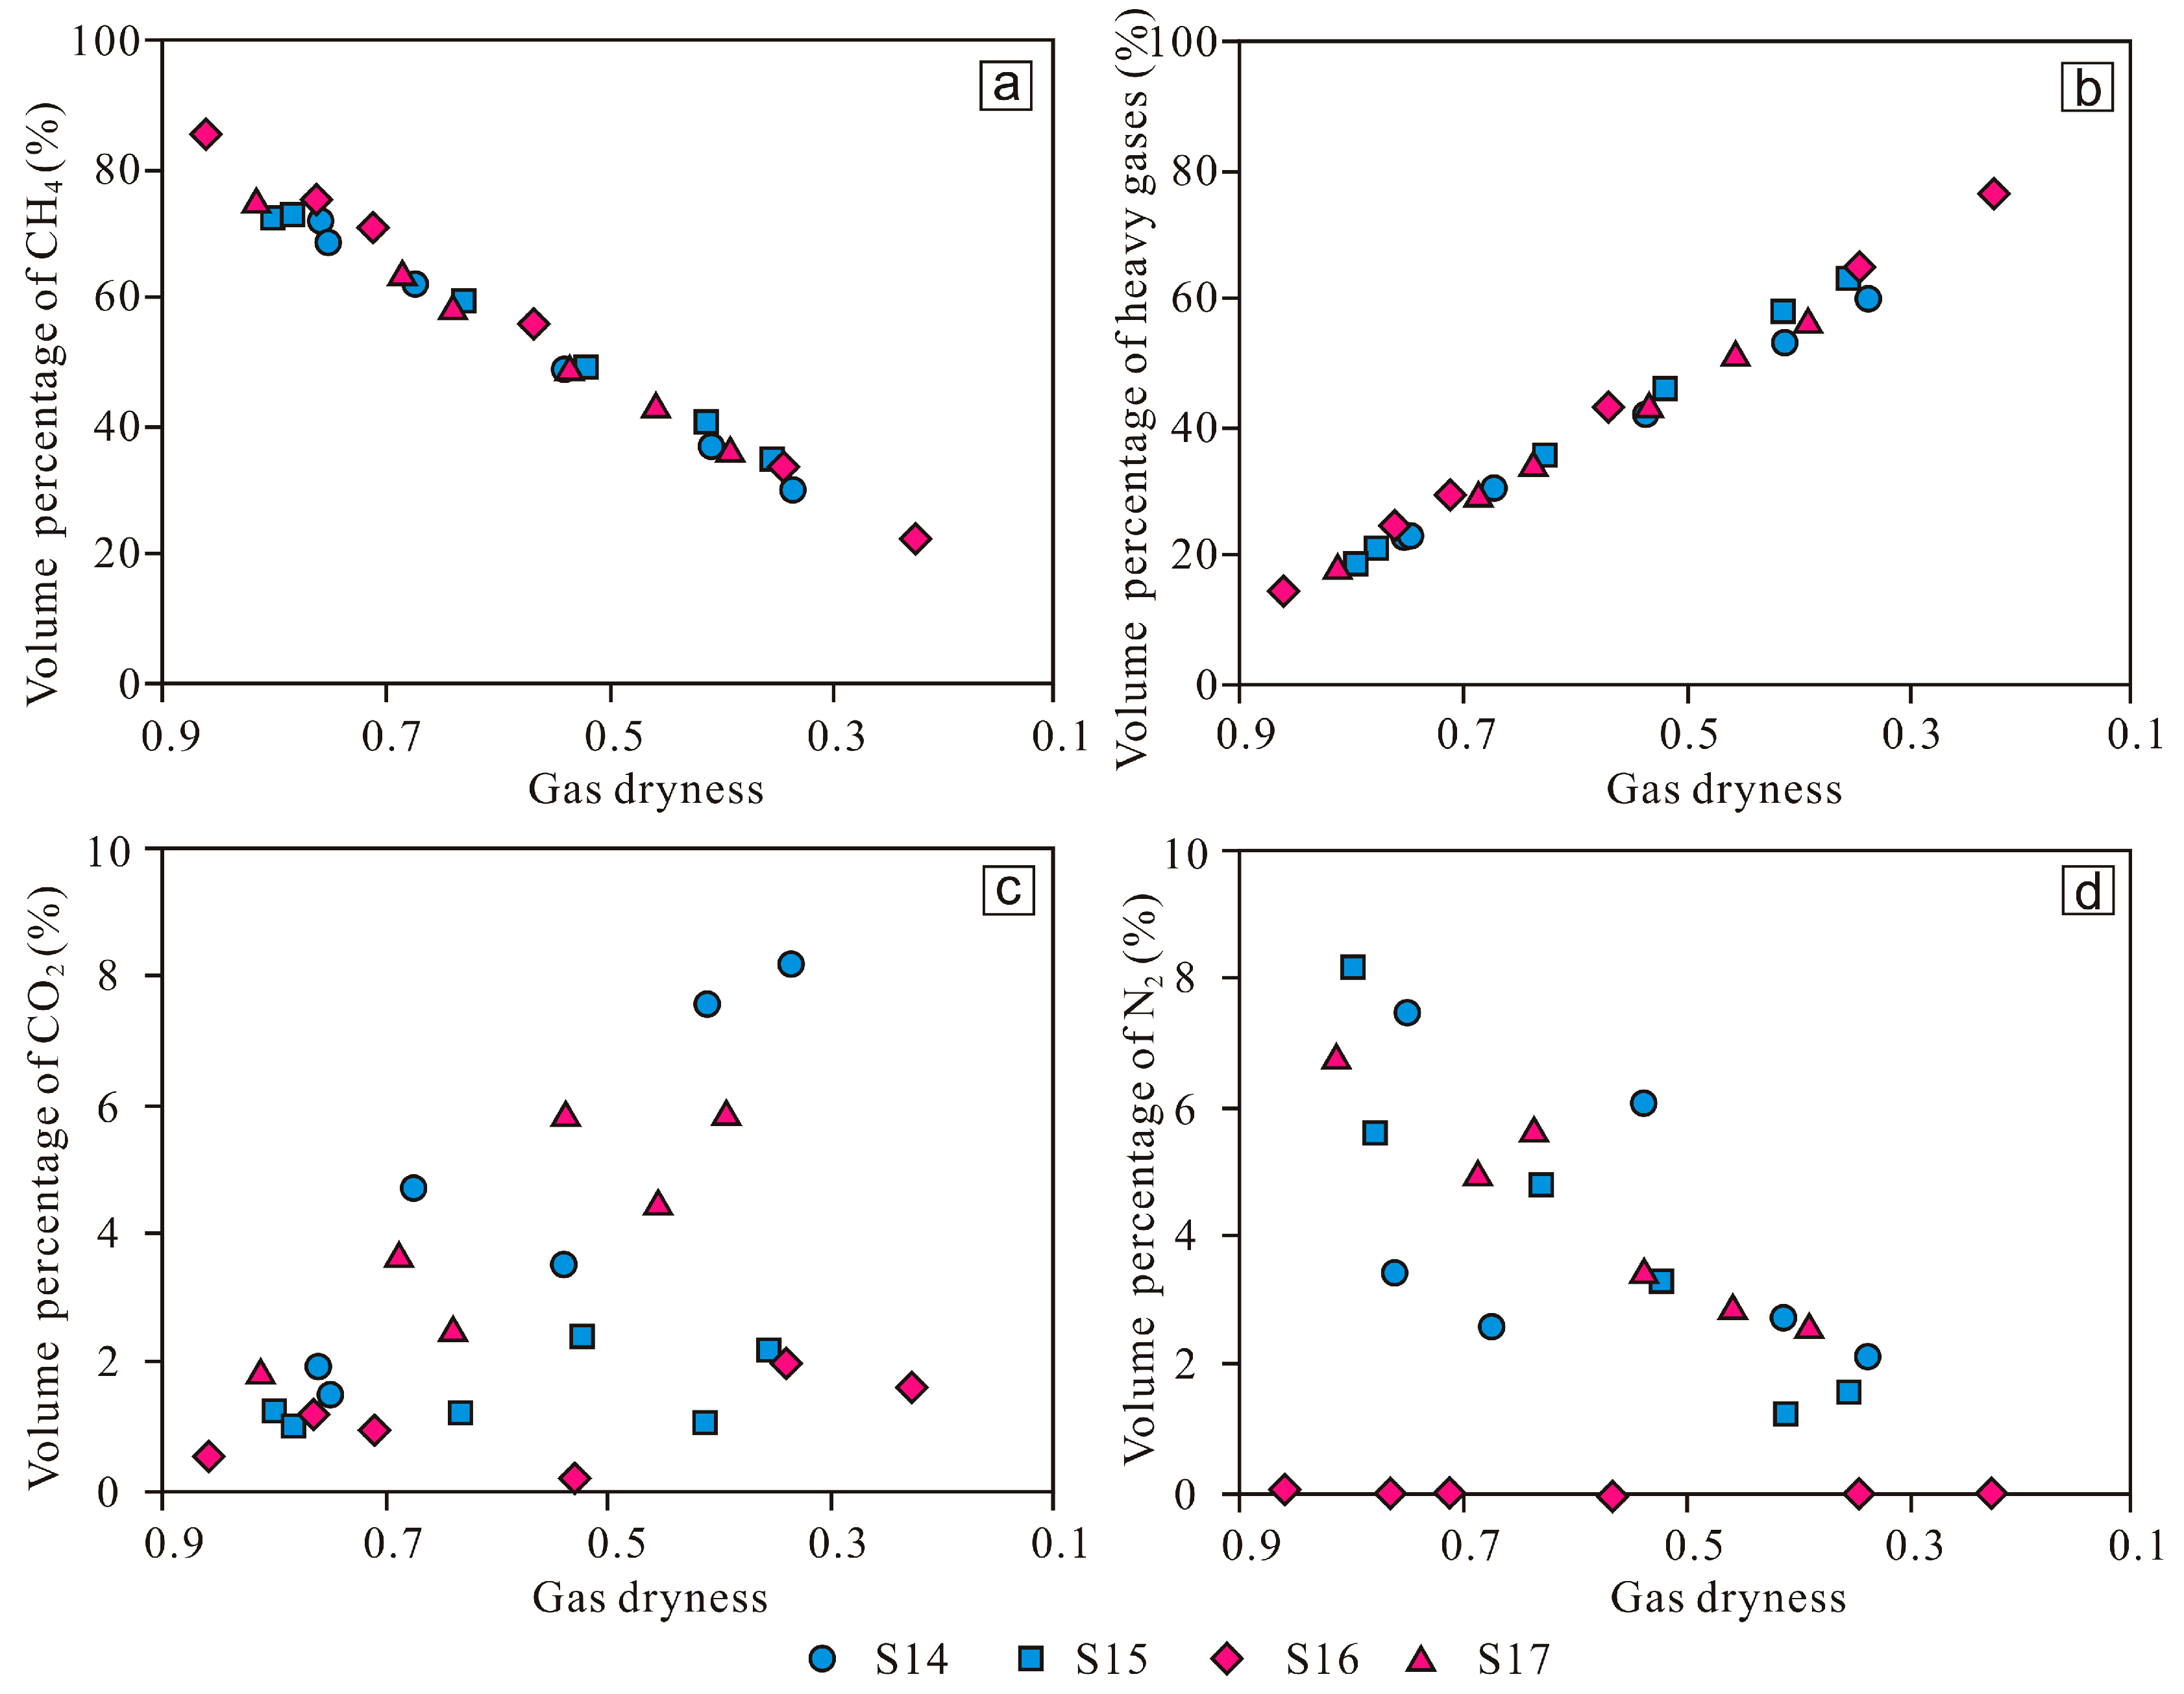
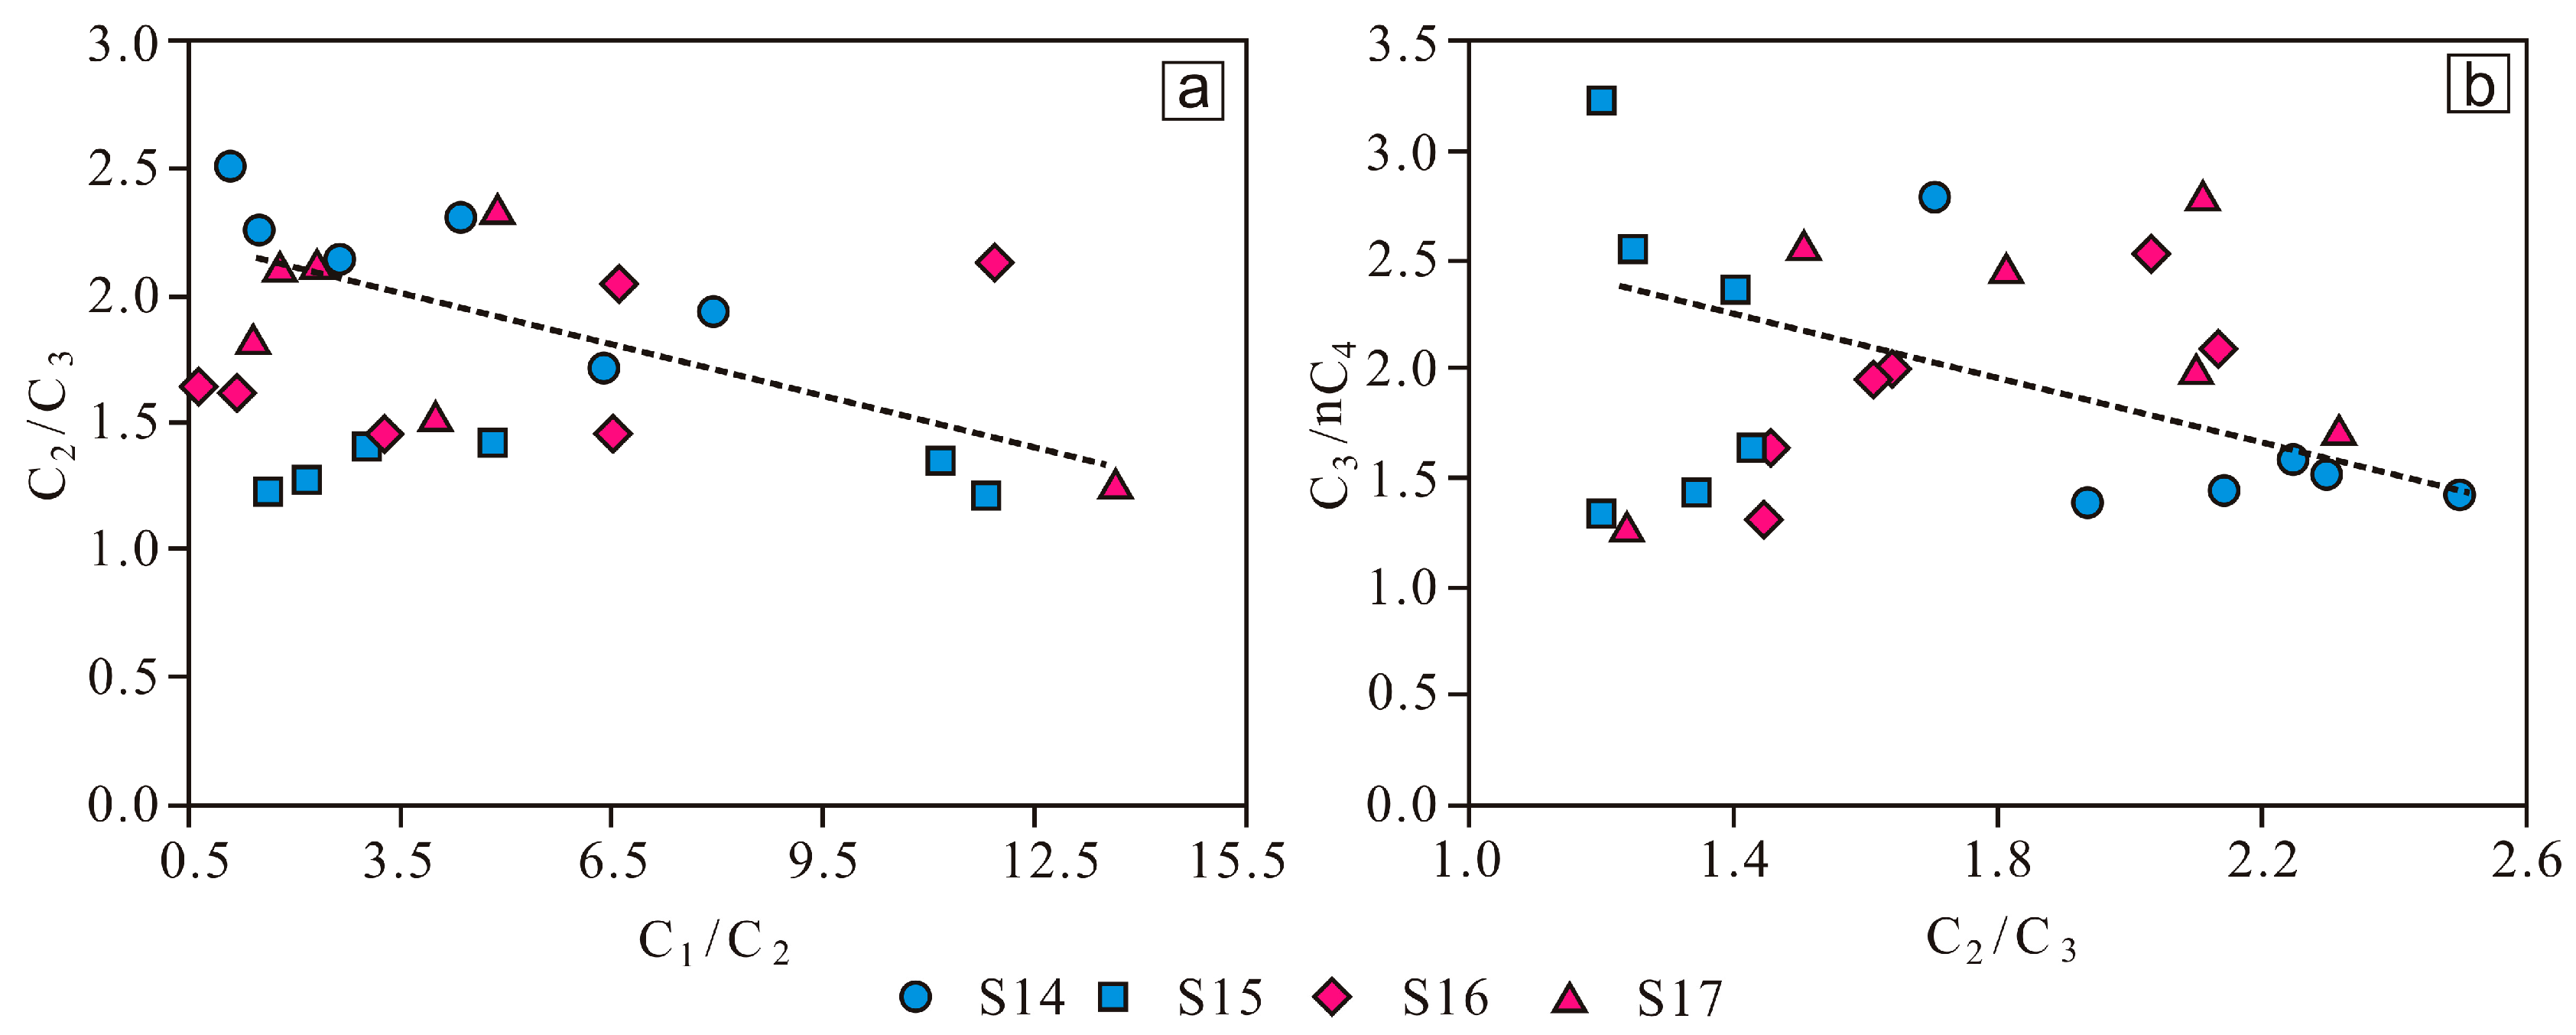
5.5. Migration Capability of Different Gases
6. Conclusions
Author Contributions
Funding
Data Availability Statement
Conflicts of Interest
References
- Stephenson, M.H. Shale gas in North America and Europe. Energy Sci. Eng. 2016, 4, 4–13. [Google Scholar] [CrossRef]
- Langan, R. A Short History of the Shale Gas Phenomenon in North America. Aseg Ext. Abstr. 2013, 2013, 1–3. [Google Scholar] [CrossRef]
- Meakin, P.; Huang, H.; Malthe-Sørenssen, A.; Thøgersen, K. Shale gas: Opportunities and challenges. Environ. Geosci. 2013, 20, 151–164. [Google Scholar] [CrossRef]
- Guo, X.; Hu, D.; Li, Y.; Liu, R.; Wang, Q. Geological Features and Reservoiring Mode of Shale Gas Reservoirs in Longmaxi Formation of the Jiaoshiba Area. Acta Geol. Sin. 2014, 88, 1811–1821. [Google Scholar] [CrossRef]
- Zhang, B.; Mao, Z.; Zhang, Z.; Yuan, Y.; Chen, X.; Shi, Y.; Liu, G.; Shao, X. Black shale formation environment and its control on shale oil enrichment in Triassic Chang 7 Member, Ordos Basin, NW China. Pet. Explor. Dev. Engl. Ed. 2021, 48, 1304–1314. [Google Scholar] [CrossRef]
- Chen, T.; Lei, F.; Han, W.; Gao, X.; Xia, L.; Liu, G.; Jiang, Z.; Huang, Z. Reservoir characterization of Chang 7 member shale: A case study of lacustrine shale in the Yanchang Formation, Ordos Basin, China. J. Nat. Gas Sci. Eng. 2016, 34, 458–471. [Google Scholar]
- Sun, L.; Tuo, J.; Zhang, M.; Wu, C.; Wang, Z.; Zheng, Y. Formation and development of the pore structure in Chang 7 member oil-shale from Ordos Basin during organic matter evolution induced by hydrous pyrolysis. Fuel 2015, 158, 549–557. [Google Scholar] [CrossRef]
- Cui, J.; Zhu, R.; Li, S.; Zhao, Z. Oderly accumulation theory of shale system petroleum resource and its prospecting significance-A case study of Chang 7 Member of Yanchang Formation in Ordos Basin. Acta Geol. Sin.—Engl. Ed. 2017, 91, 265–266. [Google Scholar]
- Chen, J.; Jiang, F.; Hu, T.; Wang, Z.; Xu, Z.; Peng, J.; Chen, D.; Li, L. Experimental investigation of the characteristics of organic matter pores in Chang 7 member lacustrine shale from the Ordos Basin due to organic matter evolution induced by hydrous pyrolysis. J. Nat. Gas Sci. Eng. 2016, 35, 412–424. [Google Scholar] [CrossRef]
- Wang, X. Advances in unconventional gas exploration and development of Yanchang Petroleum Group. Acta Pet. Sin. 2016, 37, 137–145, (In Chinese with English Abstract). [Google Scholar]
- Wang, X. Characteristics of Chang 7 shale gas in the Triassic Yanchang Formation, Ordos Basin, China. Interpretation 2017, 5, 31–39. [Google Scholar] [CrossRef]
- Liu, Y.; Zhou, W.; Deng, H. Geological characteristics of gas-bearing shales in the Yanchang Formation and its resource assessment in the Ordos Basin. Nat. Gas Ind. 2013, 33, 19–23, (In Chinese with English Abstract). [Google Scholar]
- Lei, Y.; Luo, X.; Wang, X.; Zhang, L.; Zhang, L. Characteristics of silty laminae in Zhangjiatan Shale of southeastern Ordos Basin, China: Implications for shale gas formation. AAPG Bull. 2015, 99, 661–687. [Google Scholar] [CrossRef]
- Illing, V.C. The migration of oil and natural gas (with discussion). J. Inst. Pet. Technol. 1933, 19, 229–274. [Google Scholar]
- Magoon, L.B.; Dow, W.G. The petroleum system. In The Petroleum System—From Source to Trap; Magoon, L.B., Dow, W.G., Eds.; American Association of Petroleum Geologists Memoir: Tulsa, OK, USA, 1994; Volume 60, pp. 3–24. [Google Scholar]
- Burton, Z.F.M.; Moldowan, J.M.; Sykes, R.; Graham, S.A. Unraveling petroleum degradation, maturity, and mixing and addressing impact on petroleum prospectivity: Insights from frontier exploration regions in New Zealand. Energy Fuels 2018, 32, 1287–1296. [Google Scholar] [CrossRef]
- Craig, J.; Hakhoo, N.; Bhat, G.M.; Hafiz, M.; Khan, M.R.; Misra, R. Petroleum systems and hydrocarbon potential of the North-West Himalaya of India and Pakistan. Earth-Sci. Rev. 2018, 187, 109–185. [Google Scholar] [CrossRef]
- Burton, Z.F.M.; Moldowan, J.M.; Magoon, L.B.; Sykes, R.; Graham, S.A. Interpretation of source rock depositional environment and age from seep oil, east coast of New Zealand. Int. J. Earth Sci. 2019, 108, 1079–1091. [Google Scholar] [CrossRef]
- Milkov, A.V. New approaches to distinguish shale-sourced and coal-sourced gases in petroleum systems. Org. Geochem. 2021, 158, 104271. [Google Scholar] [CrossRef]
- Fan, B.J.; Shi, L. Deep-lacustrine shale heterogeneity and its impact on hydrocarbon generation, expulsion, and retention: A case study from the upper triassic Yanchang Formation, Ordos Basin, China. Nat. Resour. Res. 2019, 28, 241–257. [Google Scholar] [CrossRef]
- Xiangzeng, W.; Shengli, G.; Chao, G. Geological features of Mesozoic lacustrine shale gas in south of Ordos Basin, NW China. Pet. Explor. Dev. 2014, 41, 326–337. [Google Scholar]
- Liu, X.; Jian, X.; Liang, L. Investigation of pore structure and fractal characteristics of organic-rich Yanchang formation shale in central China by nitrogen adsorption/desorption analysis. Plateau Meteorol. 2015, 22, 62–72. [Google Scholar] [CrossRef]
- Tang, X.; Jiang, Z.; Jiang, S.; Xing, F. Effects of organic matter and mineral compositions on pore structures of shales: A comparative study of lacustrine shale in Ordos Basin and Marine Shale in Sichuan Basin, China. Energy Explor. Exploit. 2017, 36, 28–42. [Google Scholar] [CrossRef]
- Hua, Y.; Zhang, W.; Kai, W.; Li, S.; Peng, P.; Yan, Q. Uranium enrichment in lacustrine oil source rocks of the Chang 7 member of the Yanchang Formation, Ordos Basin, China. J. Asian Earth Sci. 2010, 39, 285–293. [Google Scholar]
- Fan, B.; Shi, L.; Li, Y.; Zhang, T.; Lv, L.; Tong, S. Lithologic heterogeneity of lacustrine shale and its geological significance for shale hydrocarbon-a case study of Zhangjiatan Shale. Open Geosci. 2019, 11, 101–112. [Google Scholar] [CrossRef]
- Fan, B. Geochemical Characteristics and Paleoenvironment of Organic-Rich Triassic Shale in the Central Ordos Basin. Nat. Resour. Res. 2022, 31, 1739–1757. [Google Scholar] [CrossRef]
- Yuan, X.J.; Lin, S.H.; Liu, Q.; Yao, J.L.; Wang, L.; Guo, H.; Deng, X.Q.; Cheng, D.W. Lacustrine fine-grained sedimentary features and organic-rich shale distribution pattern: A case study of Chang 7 Member of Triassic Yanchang Formation in Ordos Basin, NW China. Pet. Explor. Dev. 2015, 42, 37–47, (In Chinese with English Abstract). [Google Scholar] [CrossRef]
- Prinzhofer, A.A.; Huc, A.Y. Genetic and post-genetic molecular and isotopic fractionations in natural gases. Chem. Geol. 1995, 126, 281–290. [Google Scholar] [CrossRef]
- Wang, X.; Zhang, M.; Liu, Y. Origins of natural gas in Tazhong area, the Tarim Basin and their differences. Oil Gas Geol. 2010, 31, 335–342, (In Chinese with English Abstract). [Google Scholar]
- Bertard, C.; Bruyet, B.; Gunther, J. Determination of desorbable gas concentration of coal (direct method). Int. J. Rock Mech. Min. Sci. Geomech. Abstr. 1970, 7, 43–50. [Google Scholar] [CrossRef]
- Kissell, F.N.; Meculloch, C.M.; Elder, C.H. The Direct Method of Determining Methane Content of Coalbeds for Ventilation Design; U.S. Bureau of Mines Report of Investigations, Report Number BM-RI-7767; Department of the Interior: Pittsburgh, PA, USA, 1973.
- Yee, D.; John, P.S.; William, B.H. Gas sorption on coal and measurement of gas content. In Hydrocarbons from Coal; Studies in Geology; Law, B.E., Rice, D.D., Eds.; American Association of Petroleum Geologists: Tulsa, OK, USA, 1993. [Google Scholar]
- Curtis, J.B. Fractured shale-gas systems. AAPG Bull. 2002, 86, 1921–1938. [Google Scholar]
- Liu, B.; Mastalerz, M.; Schieber, J. SEM petrography of dispersed organic matter in black shales: A review. Earth-Sci. Rev. 2022, 224, 103874. [Google Scholar] [CrossRef]
- Dodson, C.R.; Standing, M.B. Pressure-volume-temperature and solubility relations for natural-gas-water mixtures. In Drilling and Production Practice; American Petroleum Institute: Washington, DC, USA, 1944; pp. 173–179. [Google Scholar]
- Weniger, P.; Kalkreuth, W.; Busch, A.; Krooss, B.M. High-pressure methane and carbon dioxide sorption on coal and shale samples from the Paraná Basin, Brazil. Int. J. Coal Geol. 2010, 84, 190–205. [Google Scholar] [CrossRef]
- Xue, H.T.; Lu, S.F.; Fu, X.T. Forecasting model of solubility of CH4, CO2 and N2 in crude oil. Oil Gas Geol. 2005, 26, 444–449, (In Chinese with English abstract). [Google Scholar]


| Samples | Burial Depth (m) | Volume Percentage (%) | ||||||||
|---|---|---|---|---|---|---|---|---|---|---|
| C1 | C2 | C3 | iC4 | nC4 | iC5 | nC5 | CO2 | N2 | ||
| S1 | 1717.32 | 60.33 | 18.17 | 13.63 | 1.31 | 3.54 | 0.59 | 0.64 | 0.44 | 0.46 |
| S2 | 1720.03 | 69.23 | 16.17 | 10.63 | 0.62 | 0.00 | 0.00 | 0.00 | 0.00 | 0.00 |
| S3 | 1761.55 | 57.89 | 15.25 | 14.08 | 1.33 | 4.44 | 0.72 | 1.00 | 1.72 | 0.00 |
| S4 | 1763.48 | 79.47 | 13.68 | 5.19 | 0.34 | 0.31 | 0.00 | 0.00 | 1.04 | 0.00 |
| S5 | 1765.04 | 57.88 | 20.73 | 12.99 | 1.05 | 2.07 | 0.22 | 0.15 | 0.71 | 4.19 |
| S6 | 1423.97 | 65.30 | 17.00 | 10.52 | 0.89 | 2.11 | 0.27 | 0.20 | 0.46 | 3.26 |
| S7 | 1424.54 | 62.33 | 16.97 | 13.19 | 1.22 | 2.03 | 0.24 | 0.22 | 1.47 | 2.33 |
| S8 | 1427.35 | 59.22 | 18.54 | 13.62 | 1.17 | 2.10 | 0.27 | 0.28 | 0.94 | 3.86 |
| S9 | 1429.07 | 56.96 | 18.33 | 12.08 | 1.09 | 1.86 | 0.20 | 0.15 | 1.16 | 8.18 |
| S10 | 1431.64 | 51.86 | 18.44 | 12.81 | 1.17 | 2.46 | 0.34 | 0.30 | 1.29 | 11.34 |
| S11 | 1432.23 | 64.60 | 18.28 | 12.40 | 1.12 | 1.90 | 0.24 | 0.20 | 1.26 | 0.00 |
| S12 | 1434.81 | 58.14 | 15.82 | 15.81 | 1.87 | 4.27 | 0.57 | 0.47 | 2.72 | 0.33 |
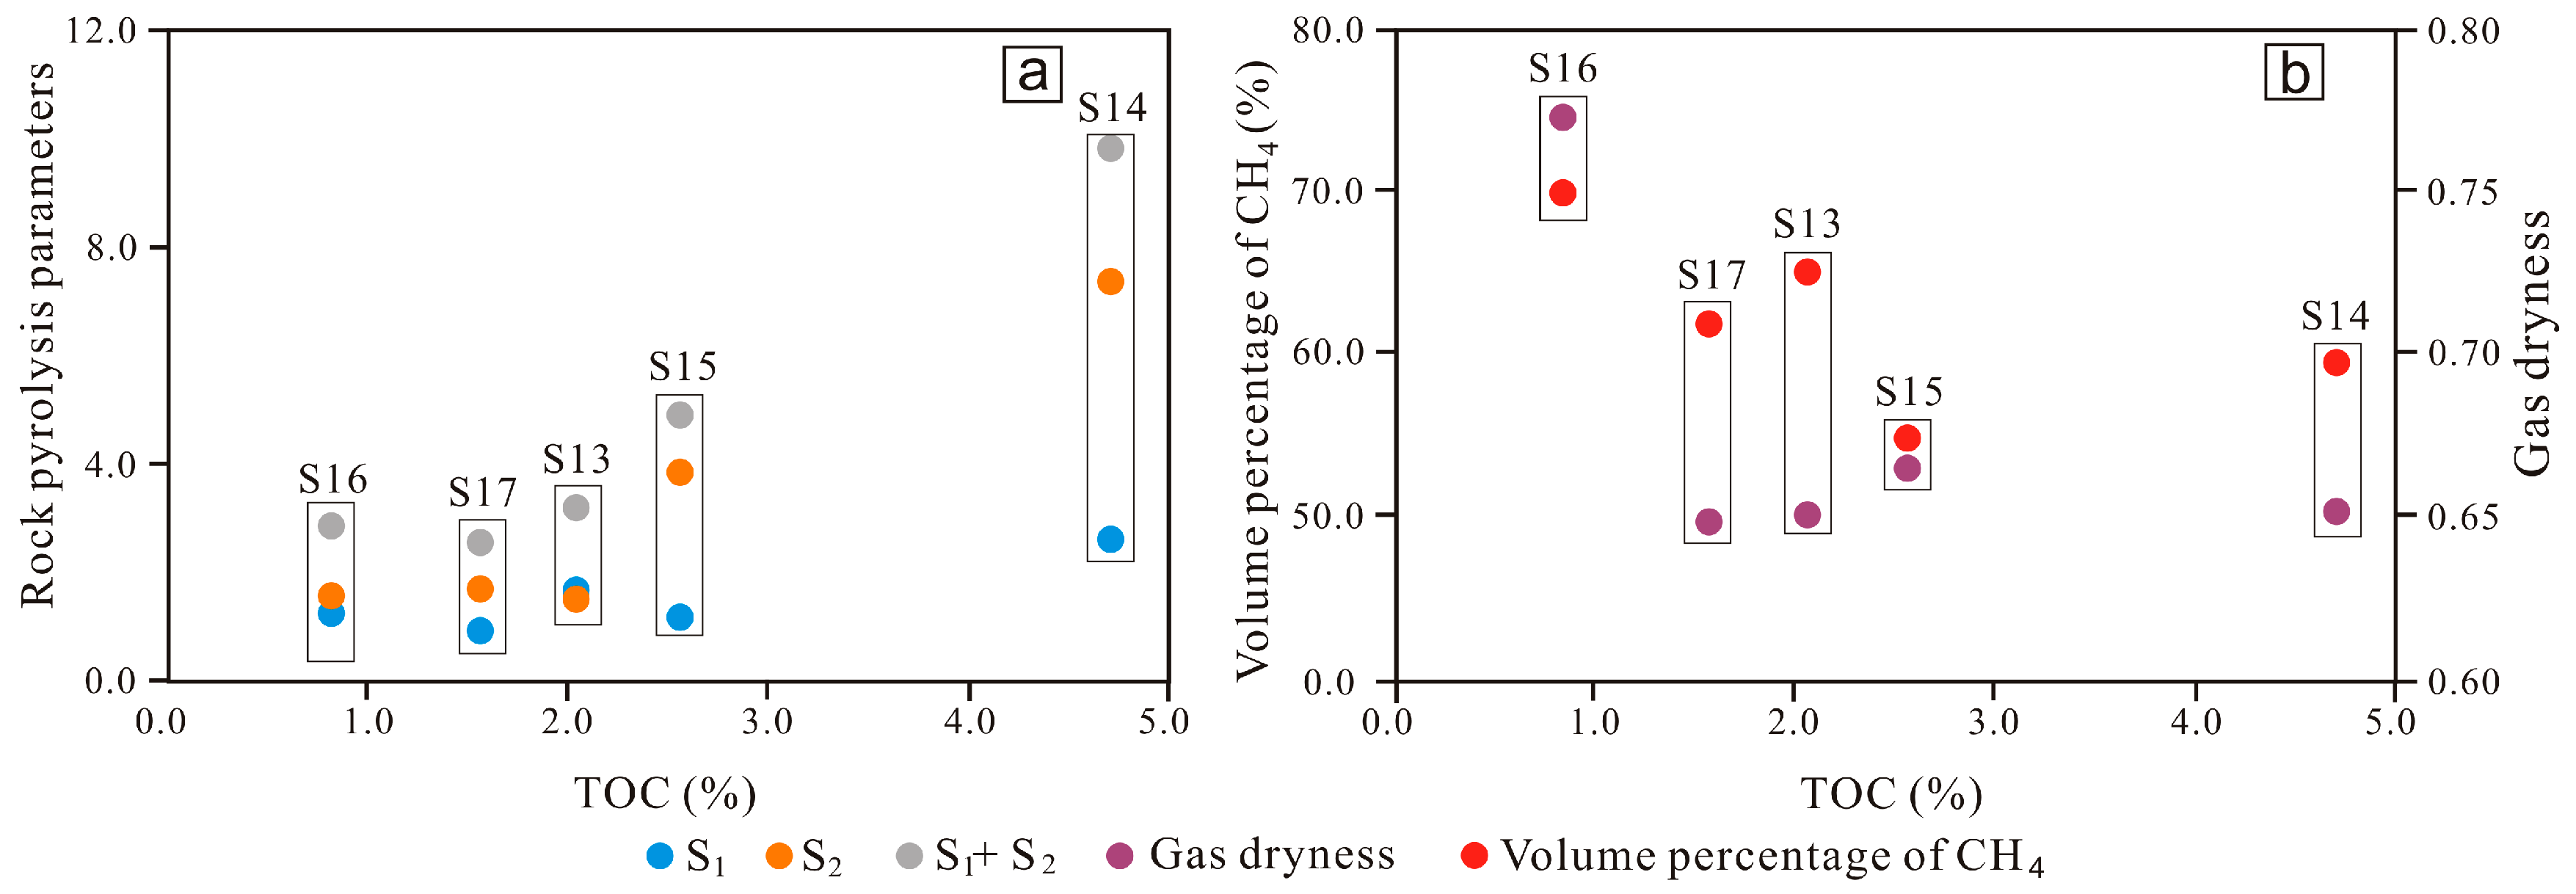
| Samples | Sample Weight (g) | Burial Depth (m) | TOC (%) | S1 (mg/g) | S2 (mg/g) | Tmax (°C) | Φ (%) | Ρr (g/cm3) | ρo (g/cm3) | So (%) | Sw (%) | Sg (%) | Gs (m3/t) | Gf (m3/t) | Go (m3/t) | Gw (m3/t) | Ga (m3/t) |
|---|---|---|---|---|---|---|---|---|---|---|---|---|---|---|---|---|---|
| S13 | 856 | 1953.77 | 2.06 | 1.63 | 1.48 | 449 | 6.3 | 2.43 | 0.85 | 7.40 | 70 | 22.60 | 0.880 | 0.233 | 0.188 | 0.022 | 0.436 |
| S14 | 938 | 1954.25 | 4.73 | 2.57 | 7.24 | 458 | 6.1 | 2.37 | 0.85 | 11.75 | 41 | 47.25 | 1.104 | 0.485 | 0.296 | 0.013 | 0.311 |
| S15 | 1007 | 1954.82 | 2.57 | 1.12 | 3.73 | 452 | 5.7 | 2.46 | 0.85 | 5.69 | 39 | 55.31 | 1.288 | 0.511 | 0.129 | 0.011 | 0.637 |
| S16 | 822 | 1955.02 | 0.84 | 1.28 | 1.55 | 447 | 7.3 | 2.5 | 0.85 | 5.16 | 47 | 47.84 | 1.109 | 0.557 | 0.148 | 0.016 | 0.389 |
| S17 | 773 | 1955.27 | 1.58 | 0.85 | 1.62 | 451 | 8.4 | 2.44 | 0.85 | 2.90 | 51 | 46.10 | 1.110 | 0.632 | 0.098 | 0.021 | 0.359 |
| Samples | Temperature (°C) | Time (H) | Volume of Desorped Gas (L) | C1/C1–5 (%) | Volume Percentage (%) | ||||||||
|---|---|---|---|---|---|---|---|---|---|---|---|---|---|
| C1 | C2 | C3 | iC4 | nC4 | iC5 | nC5 | CO2 | N2 | |||||
| S13 | 30 | 12 | 0.098 | 76.8 | 70.04 | 6.33 | 5.77 | 2.67 | 4.16 | 1.55 | 0.71 | 3.14 | 5.63 |
| 30 | 12 | 0.063 | 67.6 | 62.03 | 7.81 | 10.78 | 4.48 | 3.38 | 0.90 | 2.26 | 2.12 | 6.24 | |
| 50 | 24 | 0.167 | 69.4 | 58.74 | 10.04 | 6.24 | 3.22 | 3.24 | 1.42 | 1.75 | 5.58 | 9.77 | |
| 60 | 24 | 0.136 | 68.0 | 60.55 | 10.25 | 4.47 | 3.24 | 4.07 | 3.27 | 3.16 | 6.16 | 4.83 | |
| 75 | 24 | 0.183 | 80.8 | 72.76 | 6.16 | 5.52 | 0.41 | 2.04 | 2.13 | 0.94 | 3.72 | 6.32 | |
| 85 | 24 | 0.095 | 71.6 | 67.28 | 10.13 | 8.53 | 2.84 | 1.17 | 1.73 | 2.27 | 4.48 | 1.57 | |
| 95 | 24 | 0.011 | 53.5 | 48.87 | 18.48 | 10.56 | 4.17 | 5.28 | 1.81 | 2.04 | 6.33 | 2.46 | |
| S14 | 30 | 12 | 0.475 | 74.9 | 68.25 | 10.67 | 6.24 | 2.18 | 2.24 | 0.76 | 0.78 | 1.45 | 7.43 |
| 30 | 12 | 0.089 | |||||||||||
| 50 | 24 | 0.228 | 75.7 | 71.76 | 9.02 | 4.65 | 3.76 | 3.36 | 1.25 | 0.97 | 1.87 | 3.36 | |
| 60 | 24 | 0.114 | 67.2 | 62.34 | 14.27 | 6.2 | 3.14 | 4.13 | 1.47 | 1.25 | 4.65 | 2.55 | |
| 75 | 24 | 0.085 | 53.7 | 48.56 | 18.64 | 8.68 | 4.86 | 5.97 | 1.83 | 1.95 | 3.47 | 6.04 | |
| 85 | 24 | 0.032 | 40.9 | 36.77 | 24.36 | 10.83 | 5.62 | 6.84 | 2.61 | 2.78 | 7.52 | 2.67 | |
| 95 | 24 | 0.013 | 33.6 | 30.12 | 27.38 | 10.94 | 7.31 | 7.76 | 2.87 | 3.36 | 8.14 | 2.12 | |
| S15 | 30 | 12 | 0.574 | 79.6 | 72.18 | 6.43 | 4.77 | 1.98 | 3.35 | 1.28 | 0.64 | 1.24 | 8.13 |
| 30 | 12 | 0.233 | |||||||||||
| 50 | 24 | 0.227 | 77.8 | 72.67 | 6.14 | 5.09 | 2.68 | 3.84 | 2.17 | 0.87 | 0.95 | 5.59 | |
| 60 | 24 | 0.085 | 62.9 | 59.15 | 12.18 | 8.54 | 5.41 | 5.27 | 2.34 | 1.15 | 1.22 | 4.74 | |
| 75 | 24 | 0.093 | 52.0 | 49.03 | 15.87 | 11.31 | 9.46 | 4.82 | 2.45 | 1.43 | 2.37 | 3.26 | |
| 85 | 24 | 0.062 | 41.1 | 40.17 | 18.6 | 14.87 | 13.7 | 5.86 | 2.93 | 1.66 | 1.03 | 1.18 | |
| 95 | 24 | 0.023 | 35.3 | 33.94 | 20.76 | 17.28 | 15.14 | 5.35 | 2.42 | 1.38 | 2.2 | 1.53 | |
| S16 | 30 | 12 | 0.452 | 85.8 | 85.43 | 7.17 | 3.36 | 1.24 | 1.57 | 0.41 | 0.34 | 0.48 | 0 |
| 30 | 12 | 0.086 | |||||||||||
| 50 | 24 | 0.197 | 76.1 | 75.2 | 11.35 | 5.58 | 3.79 | 2.17 | 0.5 | 0.28 | 1.13 | 0 | |
| 60 | 24 | 0.084 | 71.1 | 70.47 | 10.73 | 7.35 | 3.76 | 5.82 | 0.55 | 0.44 | 0.88 | 0 | |
| 75 | 24 | 0.062 | 56.7 | 55.97 | 17.24 | 11.88 | 5.05 | 7.35 | 0.67 | 0.58 | 1.26 | 0 | |
| 85 | 24 | 0.023 | 34.2 | 33.57 | 28.24 | 17.47 | 8.51 | 8.9 | 0.65 | 0.69 | 1.97 | 0 | |
| 95 | 24 | 0.008 | 22.5 | 22.17 | 33.84 | 20.55 | 9.45 | 10.33 | 1.24 | 0.86 | 1.56 | 0 | |
| S17 | 30 | 12 | 0.383 | 81.0 | 74.18 | 5.41 | 4.37 | 2.24 | 3.45 | 1.13 | 0.76 | 1.78 | 6.68 |
| 30 | 12 | 0.041 | |||||||||||
| 50 | 24 | 0.238 | 63.5 | 58.41 | 14.84 | 9.84 | 2.78 | 3.84 | 1.45 | 0.87 | 2.44 | 5.53 | |
| 60 | 24 | 0.105 | 68.4 | 62.57 | 12.85 | 5.54 | 4.43 | 3.27 | 1.64 | 1.15 | 3.67 | 4.88 | |
| 75 | 24 | 0.046 | 53.3 | 48.47 | 20.77 | 9.83 | 4.75 | 3.52 | 1.98 | 1.54 | 5.75 | 3.39 | |
| 85 | 24 | 0.027 | 45.6 | 42.25 | 23.57 | 11.2 | 6.58 | 5.64 | 2.07 | 1.42 | 4.42 | 2.85 | |
| 95 | 24 | 0.018 | 39.0 | 35.8 | 25.33 | 14.01 | 6.64 | 5.75 | 2.23 | 1.95 | 5.84 | 2.45 | |
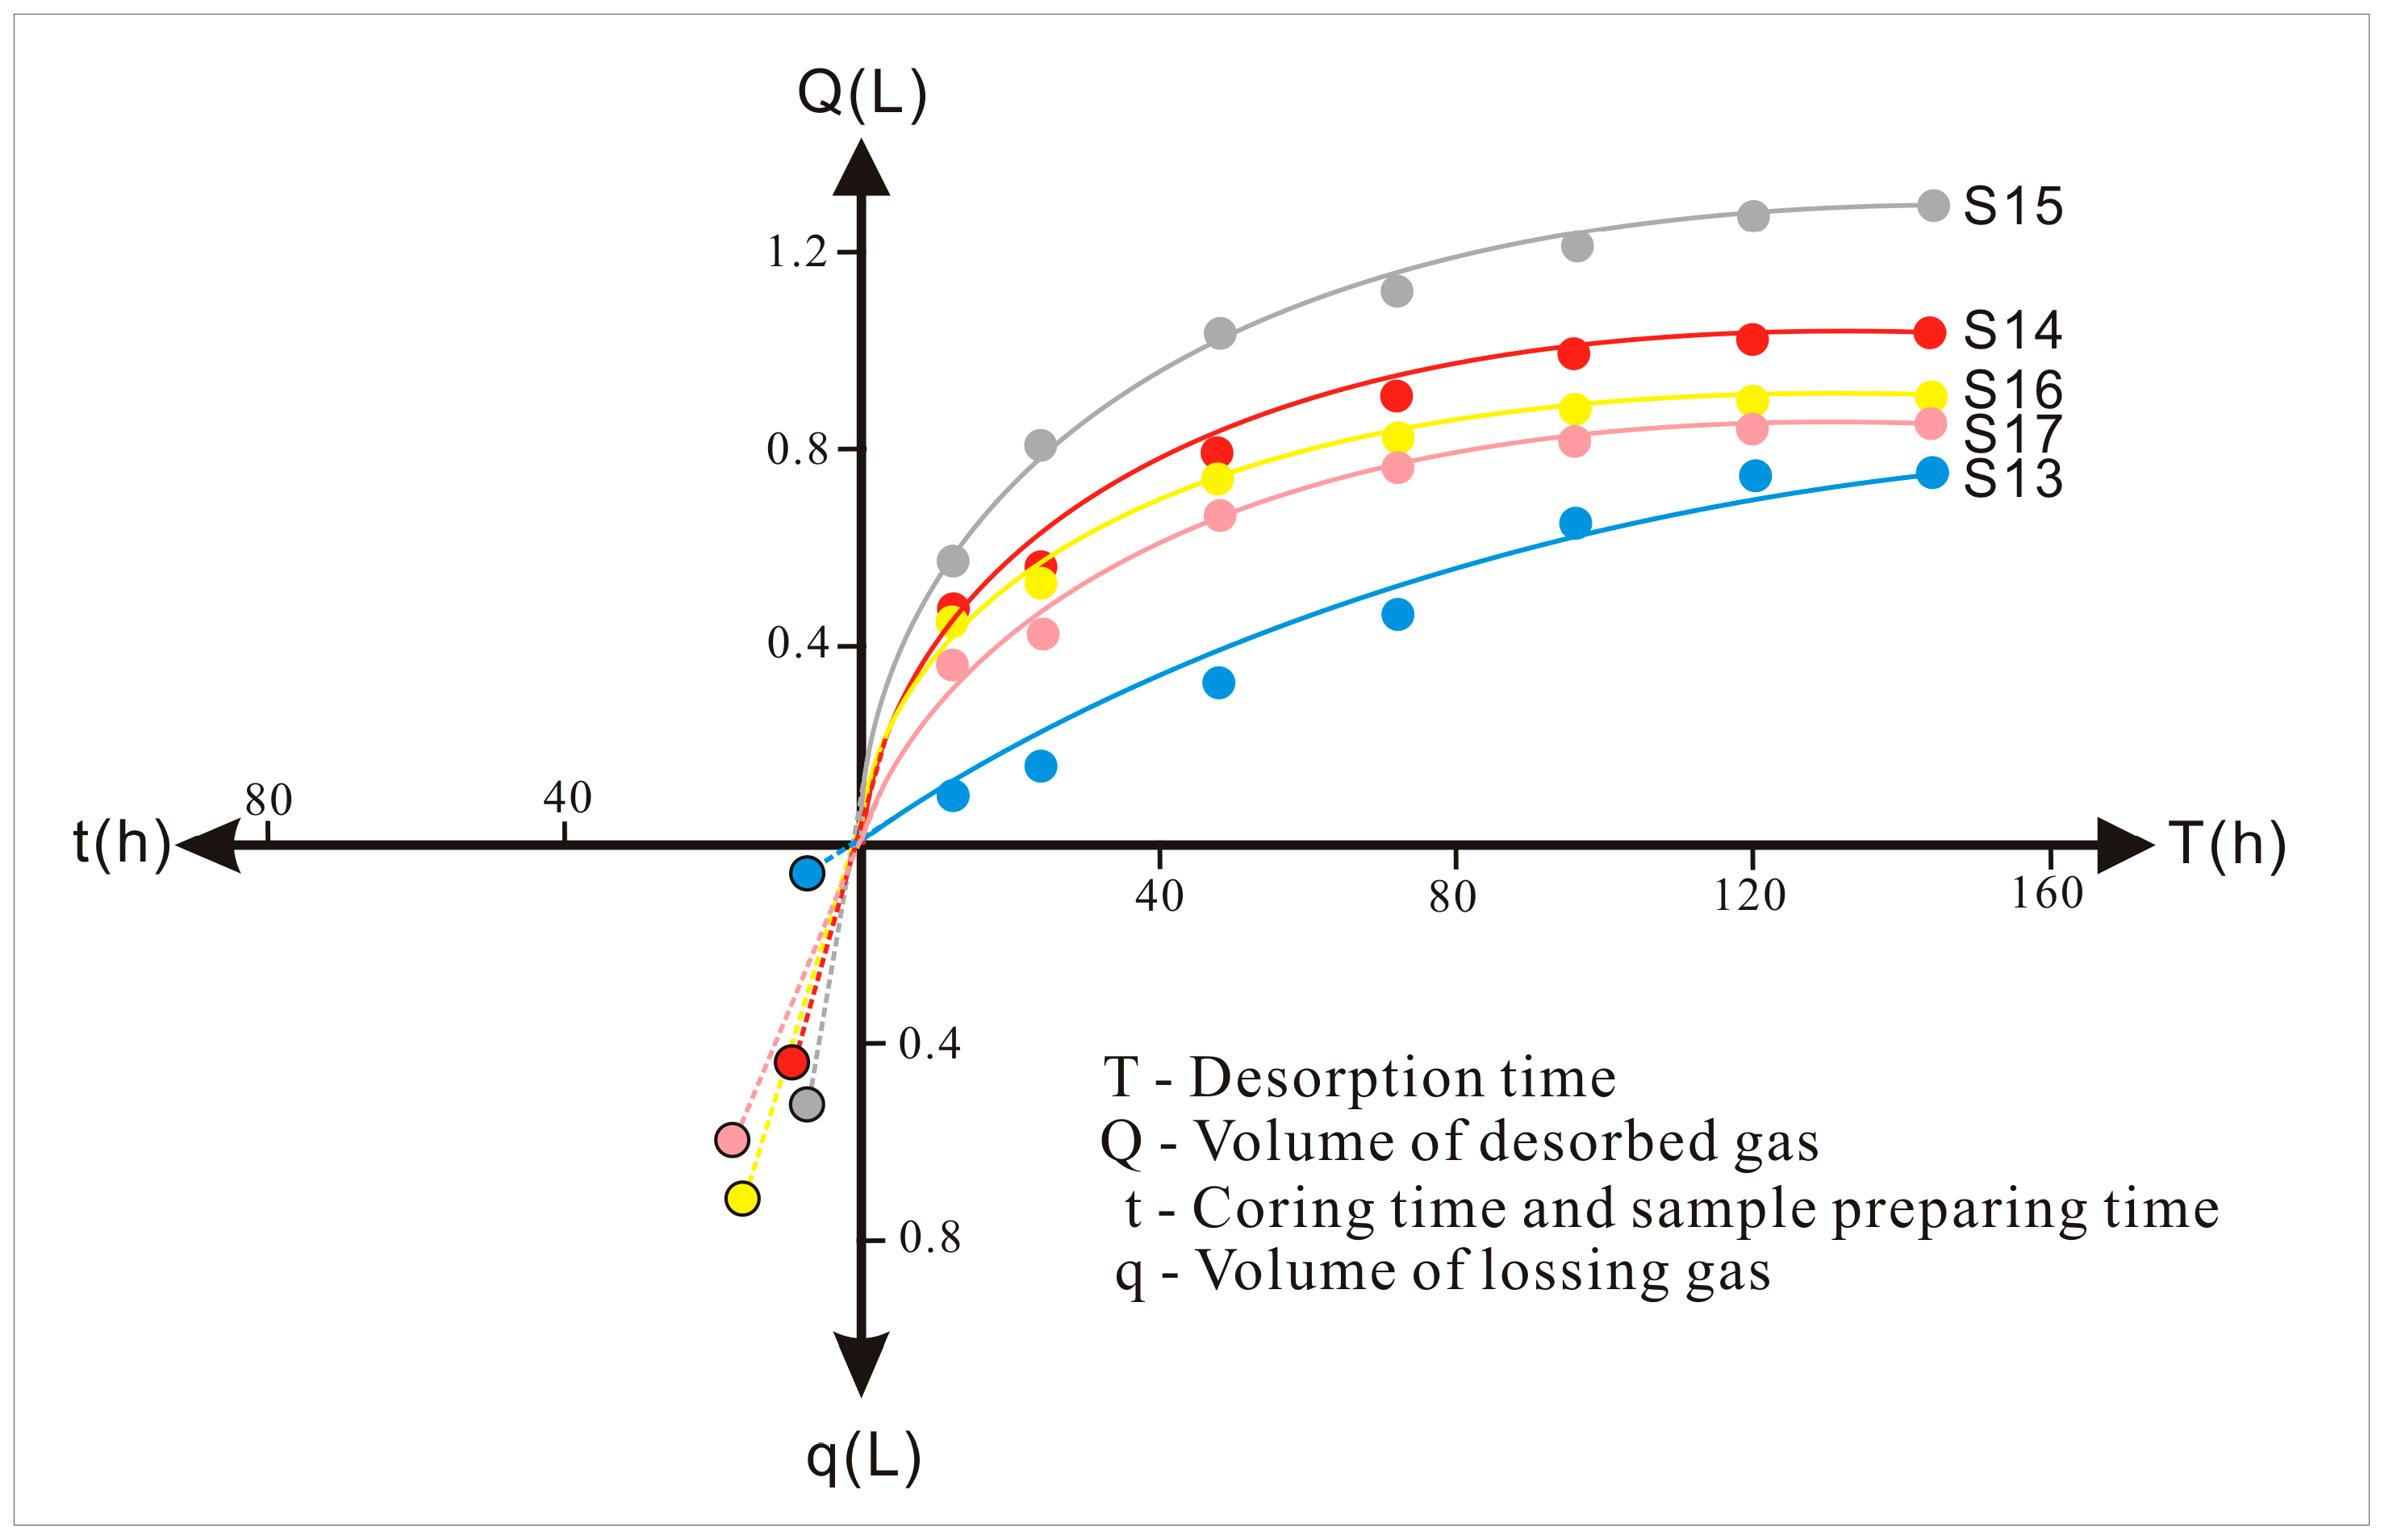
| Samples | Coring and Sampling Times (h) | Volumes of Desorbed Gas (L) | Volumes of Lost Gas (L) | Content of Lost Gas (m3/t) | Content of Shale Gas (m3/t) | The Ratio of Lost Gas to Shale Gas (%) |
|---|---|---|---|---|---|---|
| S13 | 7.7 | 0.753 | 0.08 | 0.093 | 0.973 | 9.60 |
| S14 | 8.2 | 1.036 | 0.58 | 0.618 | 1.723 | 35.89 |
| S15 | 9.6 | 1.297 | 0.46 | 0.457 | 1.745 | 26.18 |
| S16 | 16.3 | 0.912 | 0.75 | 0.912 | 2.022 | 45.13 |
| S17 | 17.2 | 0.858 | 0.63 | 0.815 | 1.925 | 42.34 |
| States | Formulas | Note | Parameters |
|---|---|---|---|
| Gd | Gd = Go + Gw Go = Rog × S1/(1000ρo) Gw = Φ × Sw × Rwg/(1000ρr) | Sw parameters are interpreted from well logging data. | Gd—content of dissolved gas, m3/t; |
| Go—content of shale gas dissolved in oil, m3/t; | |||
| Gw—content of shale gas dissolved in water, m3/t; | |||
| So—oil saturation of rock sample, %; | |||
| So parameters are calculated using the following formula: So = 10 × S1 × ρr/(Φ × ρo) | S1—free hydrocarbon content, mg/g; | ||
| ρo—oil density, g/cm3; | |||
| Gf | Gf = Φ × Sg/(1000 × Bg × ρr) | ρr—rock density, g/cm3; | |
| Rog—solubility of gas in oil, m3/m3; | |||
| Φ—rock porosity, %; | |||
| Sg parameters are calculated using the following formula: Sg = 1 − So − Sw | Sw—water saturation of rock sample, %; | ||
| Rwg—solubility of gas in water, m3/m3; | |||
| Gf—content of free gas, m3/t; | |||
| Ga | Ga = Gs − Go − Gw − Gf Gs = Wr/(1000 × Gdesorption) | Sg—gas saturation of rock sample, %; | |
| Bg—volume coefficient; | |||
| Rwg and Rog parameters are obtained using the using solubility chart, and their values are 1.2 m3/m3 and 98 m3/m3 respectively. | Ga—content of adsorbed gas, m3/t; | ||
| Gs—content of shale gas, m3/t; | |||
| Wr—weight of rock, g; | |||
| Gdesorption—volume of desorbed gas, L. |
Disclaimer/Publisher’s Note: The statements, opinions and data contained in all publications are solely those of the individual author(s) and contributor(s) and not of MDPI and/or the editor(s). MDPI and/or the editor(s) disclaim responsibility for any injury to people or property resulting from any ideas, methods, instructions or products referred to in the content. |
© 2023 by the authors. Licensee MDPI, Basel, Switzerland. This article is an open access article distributed under the terms and conditions of the Creative Commons Attribution (CC BY) license (https://creativecommons.org/licenses/by/4.0/).
Share and Cite
Fan, B.; Dai, X.; Wang, C. Gas Desorption Characteristics of the Chang 7 Member Shale in the Triassic Yanchang Formation, Yan’an Area, Ordos Basin. Minerals 2023, 13, 622. https://doi.org/10.3390/min13050622
Fan B, Dai X, Wang C. Gas Desorption Characteristics of the Chang 7 Member Shale in the Triassic Yanchang Formation, Yan’an Area, Ordos Basin. Minerals. 2023; 13(5):622. https://doi.org/10.3390/min13050622
Chicago/Turabian StyleFan, Bojiang, Xinyang Dai, and Chi Wang. 2023. "Gas Desorption Characteristics of the Chang 7 Member Shale in the Triassic Yanchang Formation, Yan’an Area, Ordos Basin" Minerals 13, no. 5: 622. https://doi.org/10.3390/min13050622