Article

Application of Organic Petrology and Raman Spectroscopy in Thermal Maturity Determination of the Karoo Basin (RSA) Shale Samples

1
South African Bureau of Standards (SABS), CSIR Campus, Pretoria 0040, South Africa
2
DSI-NRF CIMERA, Department of Geology, University of Johannesburg, Johannesburg 2006, South Africa
3
School of Chemical and Metallurgical Engineering, University of the Witwatersrand, Johannesburg 2000, South Africa
*
Author to whom correspondence should be addressed.
Minerals 2023, 13(9), 1199; https://doi.org/10.3390/min13091199
Submission received: 1 August 2023 / Revised: 8 September 2023 / Accepted: 11 September 2023 / Published: 13 September 2023
(This article belongs to the Special Issue Geochemical Characterization of Source Rocks in Oil and Gas Fields)

Abstract

:
An assessment performed using raman spectroscopy has found space in the black shales of the Cisuralian-age rocks of the Karoo Basin in South Africa, particularly those from the Guadalupian Ripon, Cisuralian Whitehill and Prince Albert Formations. It is used in conjunction with geochemical screening techniques such as organic petrology and programmed pyrolysis. In turn, the combination of these techniques is used for the assessment of the thermal maturity of the sedimentary organic matter from the perspective of hydrocarbon generation, retention, and expulsion. To provide further understanding of the black shales in the Cisuralian-age rocks of the Karoo Basin in South Africa, this study focuses on the characterization of samples from the KWV−01 borehole drilled in the southeastern Karoo Basin. In addition, the USA Devonian/Carboniferous Berea Sandstone project samples were included for comparison, and were used as a quality assurance measure. Organic petrology was utilized to assess the organic quality and thermal maturity of the black shales. The results obtained showed that the Karoo Basin shales are overmature, containing an abundance of solid bitumen, and this often characterizes a shale reservoir with moveable hydrocarbons (shale gas). The programmed pyrolysis analysis conducted on the black shales of the Karoo Basin yielded artifact results, as they were determined from a very low and poorly defined S2 peak. This indicated the shales to be overmature and categorized them to be of poor hydrocarbon generation potential. Raman spectroscopy was used to gain insights about the molecular structure of the black shales and to assess if this technique could be used as a complimentary tool to determine the thermal maturity of the shale samples. Raman parameters such as G–D1 Band separation, G and D1 band full width at half maximum (Gfwhm and D1fwhm) and G band position were successfully correlated with vitrinite reflectance (RoV), demonstrating a good potential for Raman spectroscopy to predict the thermal maturity of the shales. Overall, the study provides valuable information and knowledge concerning black shale sample characterization (particularly the thermal maturity and molecular structural characterization) in the Karoo Basin, South Africa.

1. Introduction

The shale gas exploration initiatives in the Karoo Basin, South Africa, were encouraged by the success of unconventional shale gas exploration in the United States of America (USA) and China. The Karoo Basin has a technically recoverable shale gas resource estimate of approximately 13 Tcf, with 19–23 Tcf of recoverable free gas [1,2,3]. This resource estimate is considered low when compared to those from other countries. However, the estimate represents a large resource with development potential for the South African petroleum and energy industries [3,4].
Various studies have recently been conducted in the Karoo Basin, focusing on the black shale of the Cisuralian formations which include the Prince Albert, Whitehill, and Collingham Formations [2,3,4,5,6,7,8,9,10,11,12,13]. These studies employed various geochemical and mineralogical techniques to characterize the organic-rich black shale. However, obtaining a detailed understanding of the properties of the organic matter within the black shale reservoir of the Karoo Basin, specifically with regards to their thermal maturity, remains a challenge due to limited knowledge. The understanding of the thermal maturity of the organic matter plays an important role in the initial assessment of unconventional gas resources [14,15]. This is of importance since the generated hydrocarbon quantities are a function of the organic matter content, type and maturity, as well as the degree of burial depth of the formation [16].
Traditionally, the thermal maturity of organic matter is evaluated using vitrinite reflectance (RoV) measurements [17,18,19,20,21,22]. However, this can be difficult to execute, particularly in vitrinite-lean rocks or in samples where primary vitrinite is absent [23,24]. In cases where vitrinite is absent, reflectance measurements can be conducted on solid bitumen to obtain the mean reflectance value (RoBr), which is converted to the vitrinite reflectance equivalent (RoVeq) [4,25,26,27]. Solid bitumen is the dominant maceral found in North American shales [22]. Organic petrographers describe solid bitumen as a secondary organic maceral product of hydrocarbon generation from kerogen [22,28]. The characteristic features of identifying solid bitumen include fracture filling, amorphous enveloping and void-filling textures, as well as the absence of plant structures [22,25,26]. The presence of solid bitumen can be an indicator for the presence of gas (and/or oil), especially in vitrinite-lean sedimentary sequences, and can also reveal some information on the migration pathways [25,26,29,30].
Programmed pyrolysis is another characterization technique used to evaluate the thermal maturity of organic matter [31,32], and yields parameters that characterize the kerogen type, quality, and kerogen potential to produce hydrocarbons [15]. Raman spectroscopy has also been successfully utilized to evaluate the thermal maturity of organic matter [14,15,33,34,35,36,37,38,39,40,41,42,43,44,45]. Raman is used to study the vibration of molecules [14,46,47], and can provide molecular structural information in relation to the organic matter in shales [48,49,50]. The thermal maturity of the carbonaceous organic matter (kerogen) in shales can be measured using Raman spectroscopy, as the full width at half maximum (FWHM) values of the Raman G band (Gfwhm) are correlated with its thermal maturity [35,40]. An increase in the thermal maturity increases the structural order throughout the carbon network, thus decreasing the G band FWHM (Gfwhm).
This current study focuses on black shale samples from the Guadalupian Ripon, the Cisuralian Whitehill and the Prince Albert Formations of the Karoo Basin (RSA) (Figure 1), as well as the Devonian/Carboniferous shales (Berea Sandstone project samples) from the Appalachian Basin, USA. The samples were analyzed by organic petrology, programmed pyrolysis, and Raman spectroscopy. The main aim of this study was to acquire Raman spectroscopy signals from the organic matter of the black shales and correlate their signal properties with the maturity parameters such as vitrinite reflectance (RoV) and the geochemical properties obtained from programmed pyrolysis. It is anticipated that the application of Raman spectroscopy together with vitrinite reflectance measurements will contribute to a better understanding of the organic components of black shales and enhance the characterization technique of shale gas samples in the Karoo Basin and elsewhere.

2. Sample Materials and Methodology

2.1. Samples and Studied Formations

A stratigraphic chart containing the major lithostratigraphic subdivisions of the Karoo Supergroup hosted in the Karoo Basin of South Africa is presented in Figure 2. The studied formations include the Ripon, Collingham, Whitehill and Prince Albert Formations of the Cisuralian. These formations are of importance because they are considered to have shale gas reservoir properties with the potential for future shale gas exploration and production. They have attracted interest in exploration activities and scientific research in the field of shale gas in South Africa.
From an organic petrology perspective, the vitrinite reflectance (RoV) and maceral analyses methods, and the results of the 14 black shale samples considered in this paper, are presented in Chabalala et al. (2020) [4]. The samples include the SA KWV−01 samples and the USA Berea Sandstone project samples, selected based on their total organic carbon (TOC) results, formations, and geological units. The Devonian/Carboniferous Berea Sandstone project samples were included for comparison and for quality assurance purposes.

2.2. Programmed Pyrolysis

From the 14 black shale samples considered in this paper, only eleven (11) samples were selected and sent to India for programmed pyrolysis analysis. This was because the other three (3) samples not considered were sourced later after the 11 samples were already sent to India for analysis. The samples were selected based on their TOC results, formations, and geological units, considered in Chabalala et al. (2020) [4]. The analysis was conducted using a Rock-Eval 6 pyrolyser in the Earth Sciences Department at the India Institute of Technology (IIT Bombay), India. Powdered shale samples were progressively heated initially to 300 °C in a helium atmosphere. The temperature was programmed to increase at about 25 °C/minute, up to 550 °C over a period of 20 min, and further increased to 750 °C at the same rate (crudely simulating the effects of the much lower geological rates of heating). The S1 and S2 (the amounts of hydrocarbons released during the pyrolysis of a sample) are detected in the flame ionization detector (FID). An online infra-red detector continuously detects the gases such as carbon dioxide (CO2) and carbon monoxide (CO) released during pyrolysis. The obtained parameters, such as S1, S2, S3, Tmax, and TOC, were used to calculate the oxygen index (OI), hydrogen index (HI) and production index (PI) using equations 1 to 3, respectively [16,56,57].
OI = 100 × S3/TOC%
HI = 100 × S2/TOC%
PI = S1/(S1 + S2)
where S1 represents the amount of free hydrocarbon already in a sample; S2 represents the potential hydrocarbon yielded when kerogen is subjected to thermal cracking; S3 represents the CO2 released during the cooling phase of the pyrolysis; and Tmax is the temperature at which the maximum rate of hydrocarbon generation occurred. These parameters were used to evaluate the geochemistry and thermal maturity of the organic matter in the source rock. The programmed pyrolysis results are presented in Table 1.

2.3. Raman Spectroscopy

A Raman spectroscopy analysis was conducted on mounted sample blocks already prepared for petrographic analysis [4]. This analysis was conducted using an alpha 300R (WITec) confocal laser Raman microscope in the Geology Department at the University of Johannesburg. The Raman microspectrometer was calibrated with a silicon (Si) standard (111). The baseline was established through the deconvolution and fitting of Raman spectra while examining the change in bandwidth and frequency of the Raman bands. The scattered radiation of the Raman spectra of the carbon particles was collected using a 50X objective lens and a 532 nm wavelength with a frequency-doubled Nd-YAG laser beam. The vitrinite particles were measured for the Berea Sandstone samples, and solid bitumen/pyrobitumen was measured for the KWV samples. The laser power was set at 2 mW to avoid thermal degradation, and the sample laser spot diameter was 4–5 µm.
Approximately 30 different particles of vitrinite (from the Berea Sandstone project samples) and of pyrobitumen (from KWV samples) were randomly chosen and analyzed from each polished block. The spectral range recorded was from 0 to 4500 cm−1, which covered the first-order and second-order spectra. Each spectrum acquisition time was 60 s, with 10 accumulations to obtain a good signal-to-noise ratio and to minimize laser induced degradation. The setting of 30 s integration time with a total of five cycles was adhered to during the analysis. Curve fitting was applied on each spectrum. The residuals of the curve fittings were the Raman bands, appearing between 700 and 3500 cm−1. Any portion of the Raman spectrum below 700 cm−1 and above 3500 cm−1 was discarded. The Raman spectra were fitted using the Lorentzian and Gaussian peak shapes, and no position was held fixed during the fitting. The fitted peak parameters, such as peak position, peak intensity ratios, and peak full width at half maximum (FWHM), are presented in Table 2.

3. Results and Discussion

3.1. Organic Petrology

The organic petrology data presented in this article are taken from Chabalala et al., (2020) [4], and the results of the selected samples considered in this research study are summarized in Table 1. The thermal maturity results indicate that the KWV−01 shale samples are overmature, with an average calculated vitrinite reflectance equivalent (RoVeq.Av) ranging from 3.74 to 4.40% RoV. The thermal maturity of the Berea Sandstone project shale samples ranges from immature (0.52% RoV) to mature (1.28% RoV). The maceral analysis results of the KWV−01 shale samples are presented in Figure 3, which indicate the dominance of solid bitumen, particularly in the Whitehill Formation. The presence of the solid bitumen can be an indicator of the presence of gas, especially in the Whitehill Formation, and can also provide information on the migration pathways of the gas [25,26,29,30]. These results will render the Whitehill Formation a target horizon for shale gas exploration in the Karoo Basin. However, the proportion of organic matter in the KWV−01 shale samples was much lower when compared to the Berea Sandstone project shale samples, with up to 35.4% by volume of organic matter obtained from Berea Sandstone project shale samples [4].

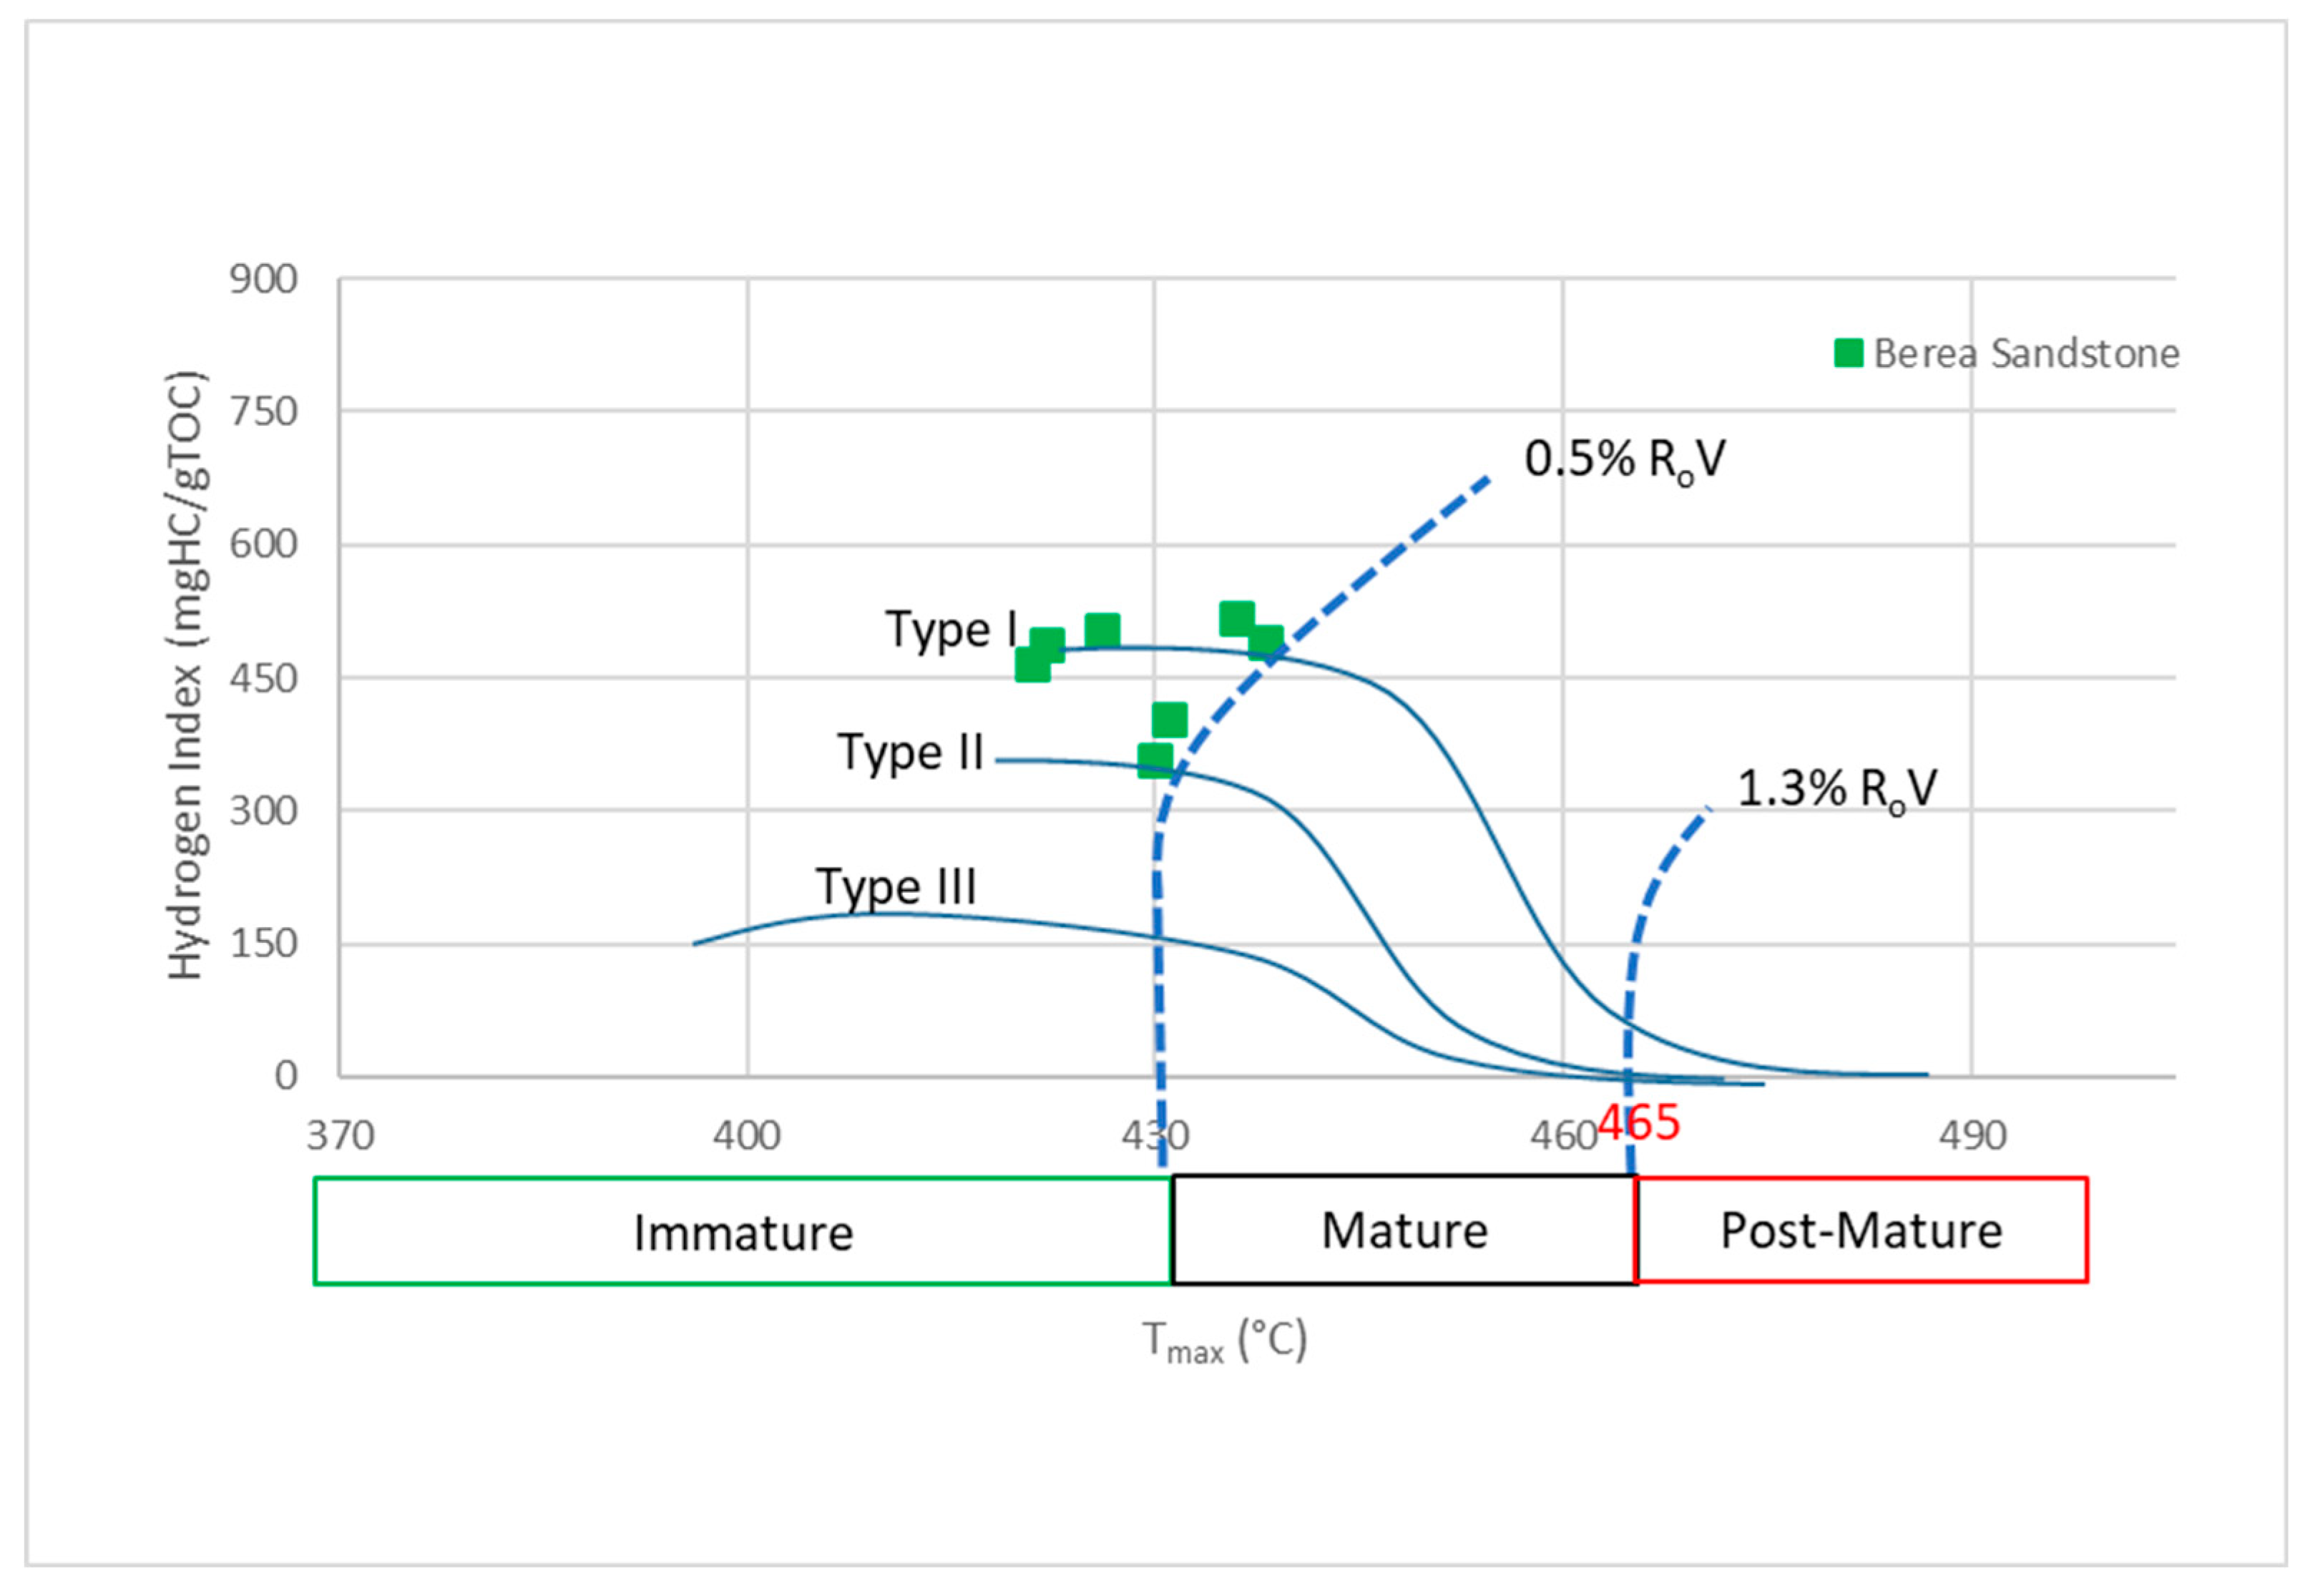
3.2. Programmed Pyrolysis

In programmed pyrolysis, the OI is of significance for kerogen type determination; HI is of significance for thermal maturity, kerogen type and oil/gas proneness; and PI is referred to as the transformation ratio, being of significance for free petroleum content/yield. The threshold for oil production occurs at a PI of around 0.1 to 0.4. Beyond a PI of 0.4, gas will be the main hydrocarbon phase [56,58]. Equations (1)–(3) were used to calculate the OI, HI and PI [16,56,57].
The programmed pyrolysis data for the KWV−01 shale samples and the Berea Sandstone project shale samples are presented in Table 1. In order to determine the kerogen type, a modified van Krevelen diagram of the programmed pyrolysis HI versus the OI plot was constructed, following Peter and Cassa (1994) [56]. The programmed pyrolysis data indicates that the KWV−01 shale samples possess Type III gas prone kerogens, as indicated in Figure 4. The KWV−01 shale samples are characterized by very low S1 and S2 values, reflecting wide and poorly defined peaks, low Tmax values and very low HI values compared to the minimum required level (above 150 mgHC/gTOC) for a good yield. The Tmax and HI data generated from the KWV−01 samples are due to instrumental artifacts, hence they can be plotted as outliers in the immature to mature field of Figure 5. These samples are overmature, and they fall in the category of poor hydrocarbon generation potential. Similar findings were observed by Ross and Bustin (2008) [59] with Besa River shales, from which the programmed pyrolysis data did not yield a distinct S2 peak despite TOC values of 5.7 wt%, highlighting the overmature nature of the shales. The thermal maturity of the evaluated Besa River shales is about 2.5% RoV.
The Berea Sandstone project shale samples are characterized by values much higher than those obtained from the KWV−01 shale samples (Table 1). The HI and OI values indicate that the organic material of these samples is mainly oil-prone kerogen type I and II (Figure 5 and Table 1). The PI values from 0.02 to 0.03 that were obtained for the Berea Sandstone project shale samples (Table 1) are below the threshold for oil production (ranging from 0.1 to 0.4) [56,58]. The Tmax values of the Berea Sandstone project shale samples range from 415–431 °C, averaging 426 °C and corresponding to the measured RoVr average of 0.55% RoV (Table 1). These shale samples plot in the immature field, just below the Tmax of 430 °C/0.58% reflectance threshold for entrance to the oil window (Figure 5). The obtained results correspond to the kerogen type plots illustrated in Figure 5, as anticipated. Therefore, the results confirm that the Berea Sandstone project shale samples are thermally immature, making them less likely to have potential for oil generation.

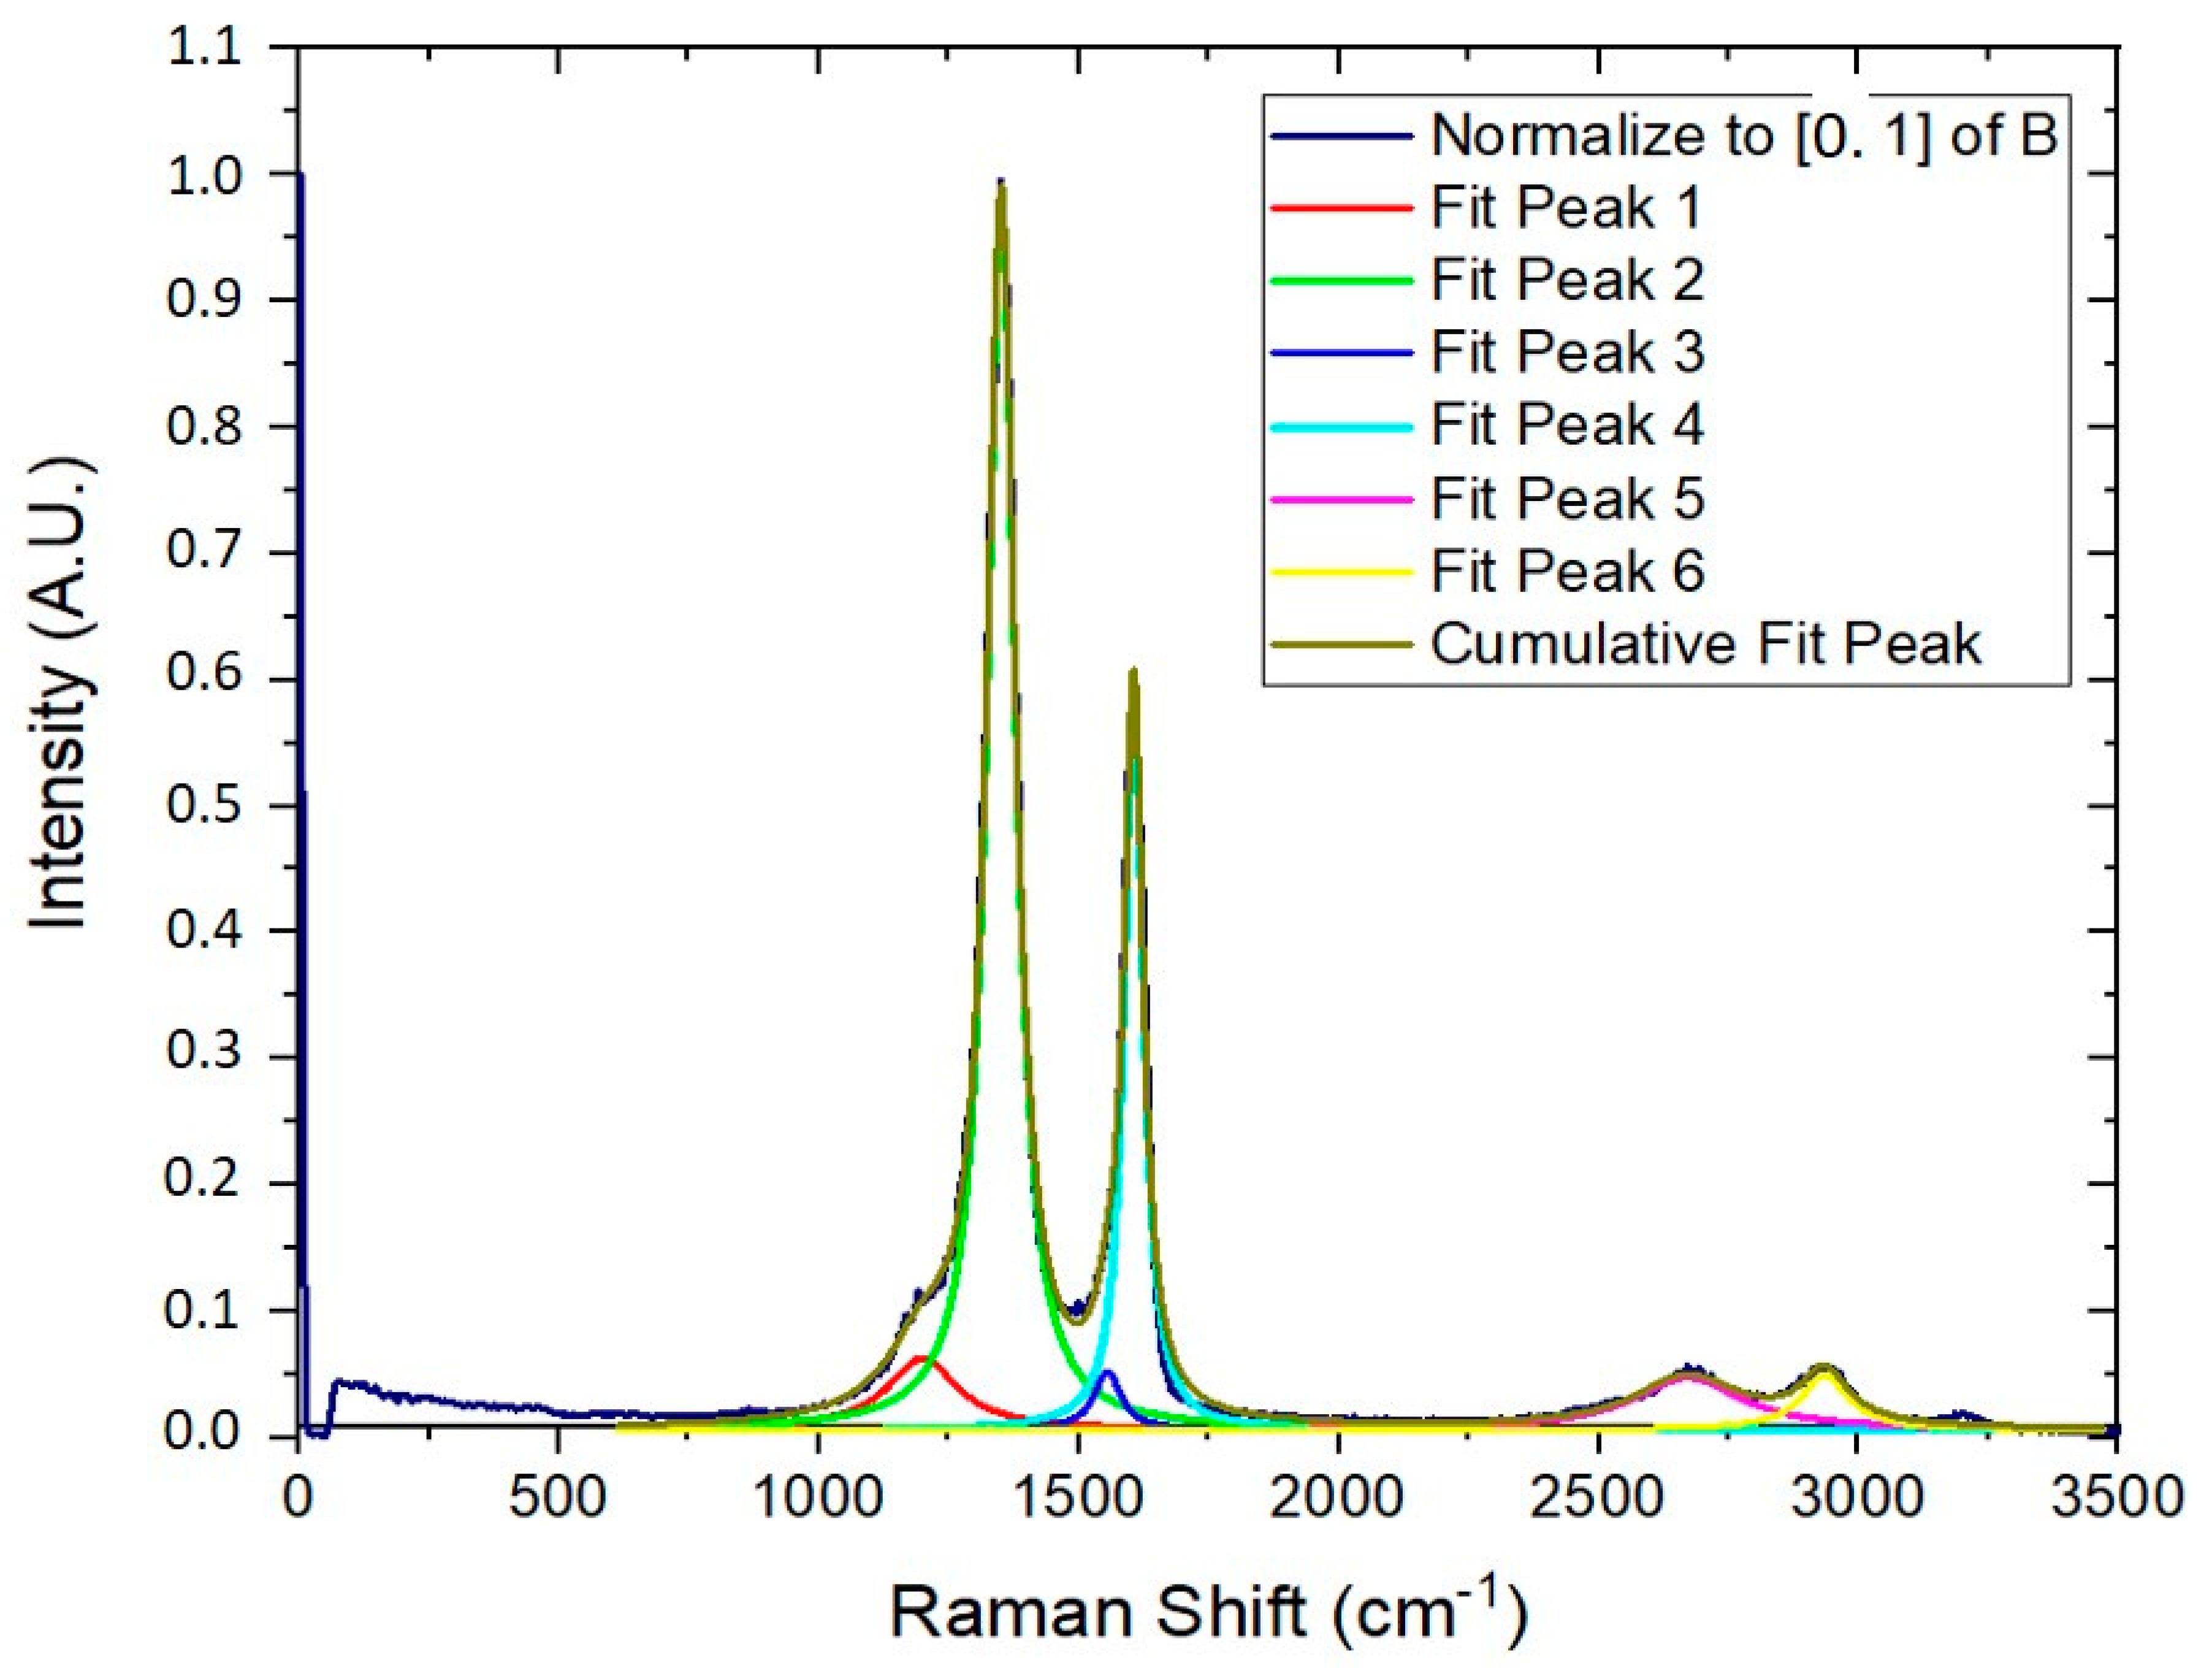
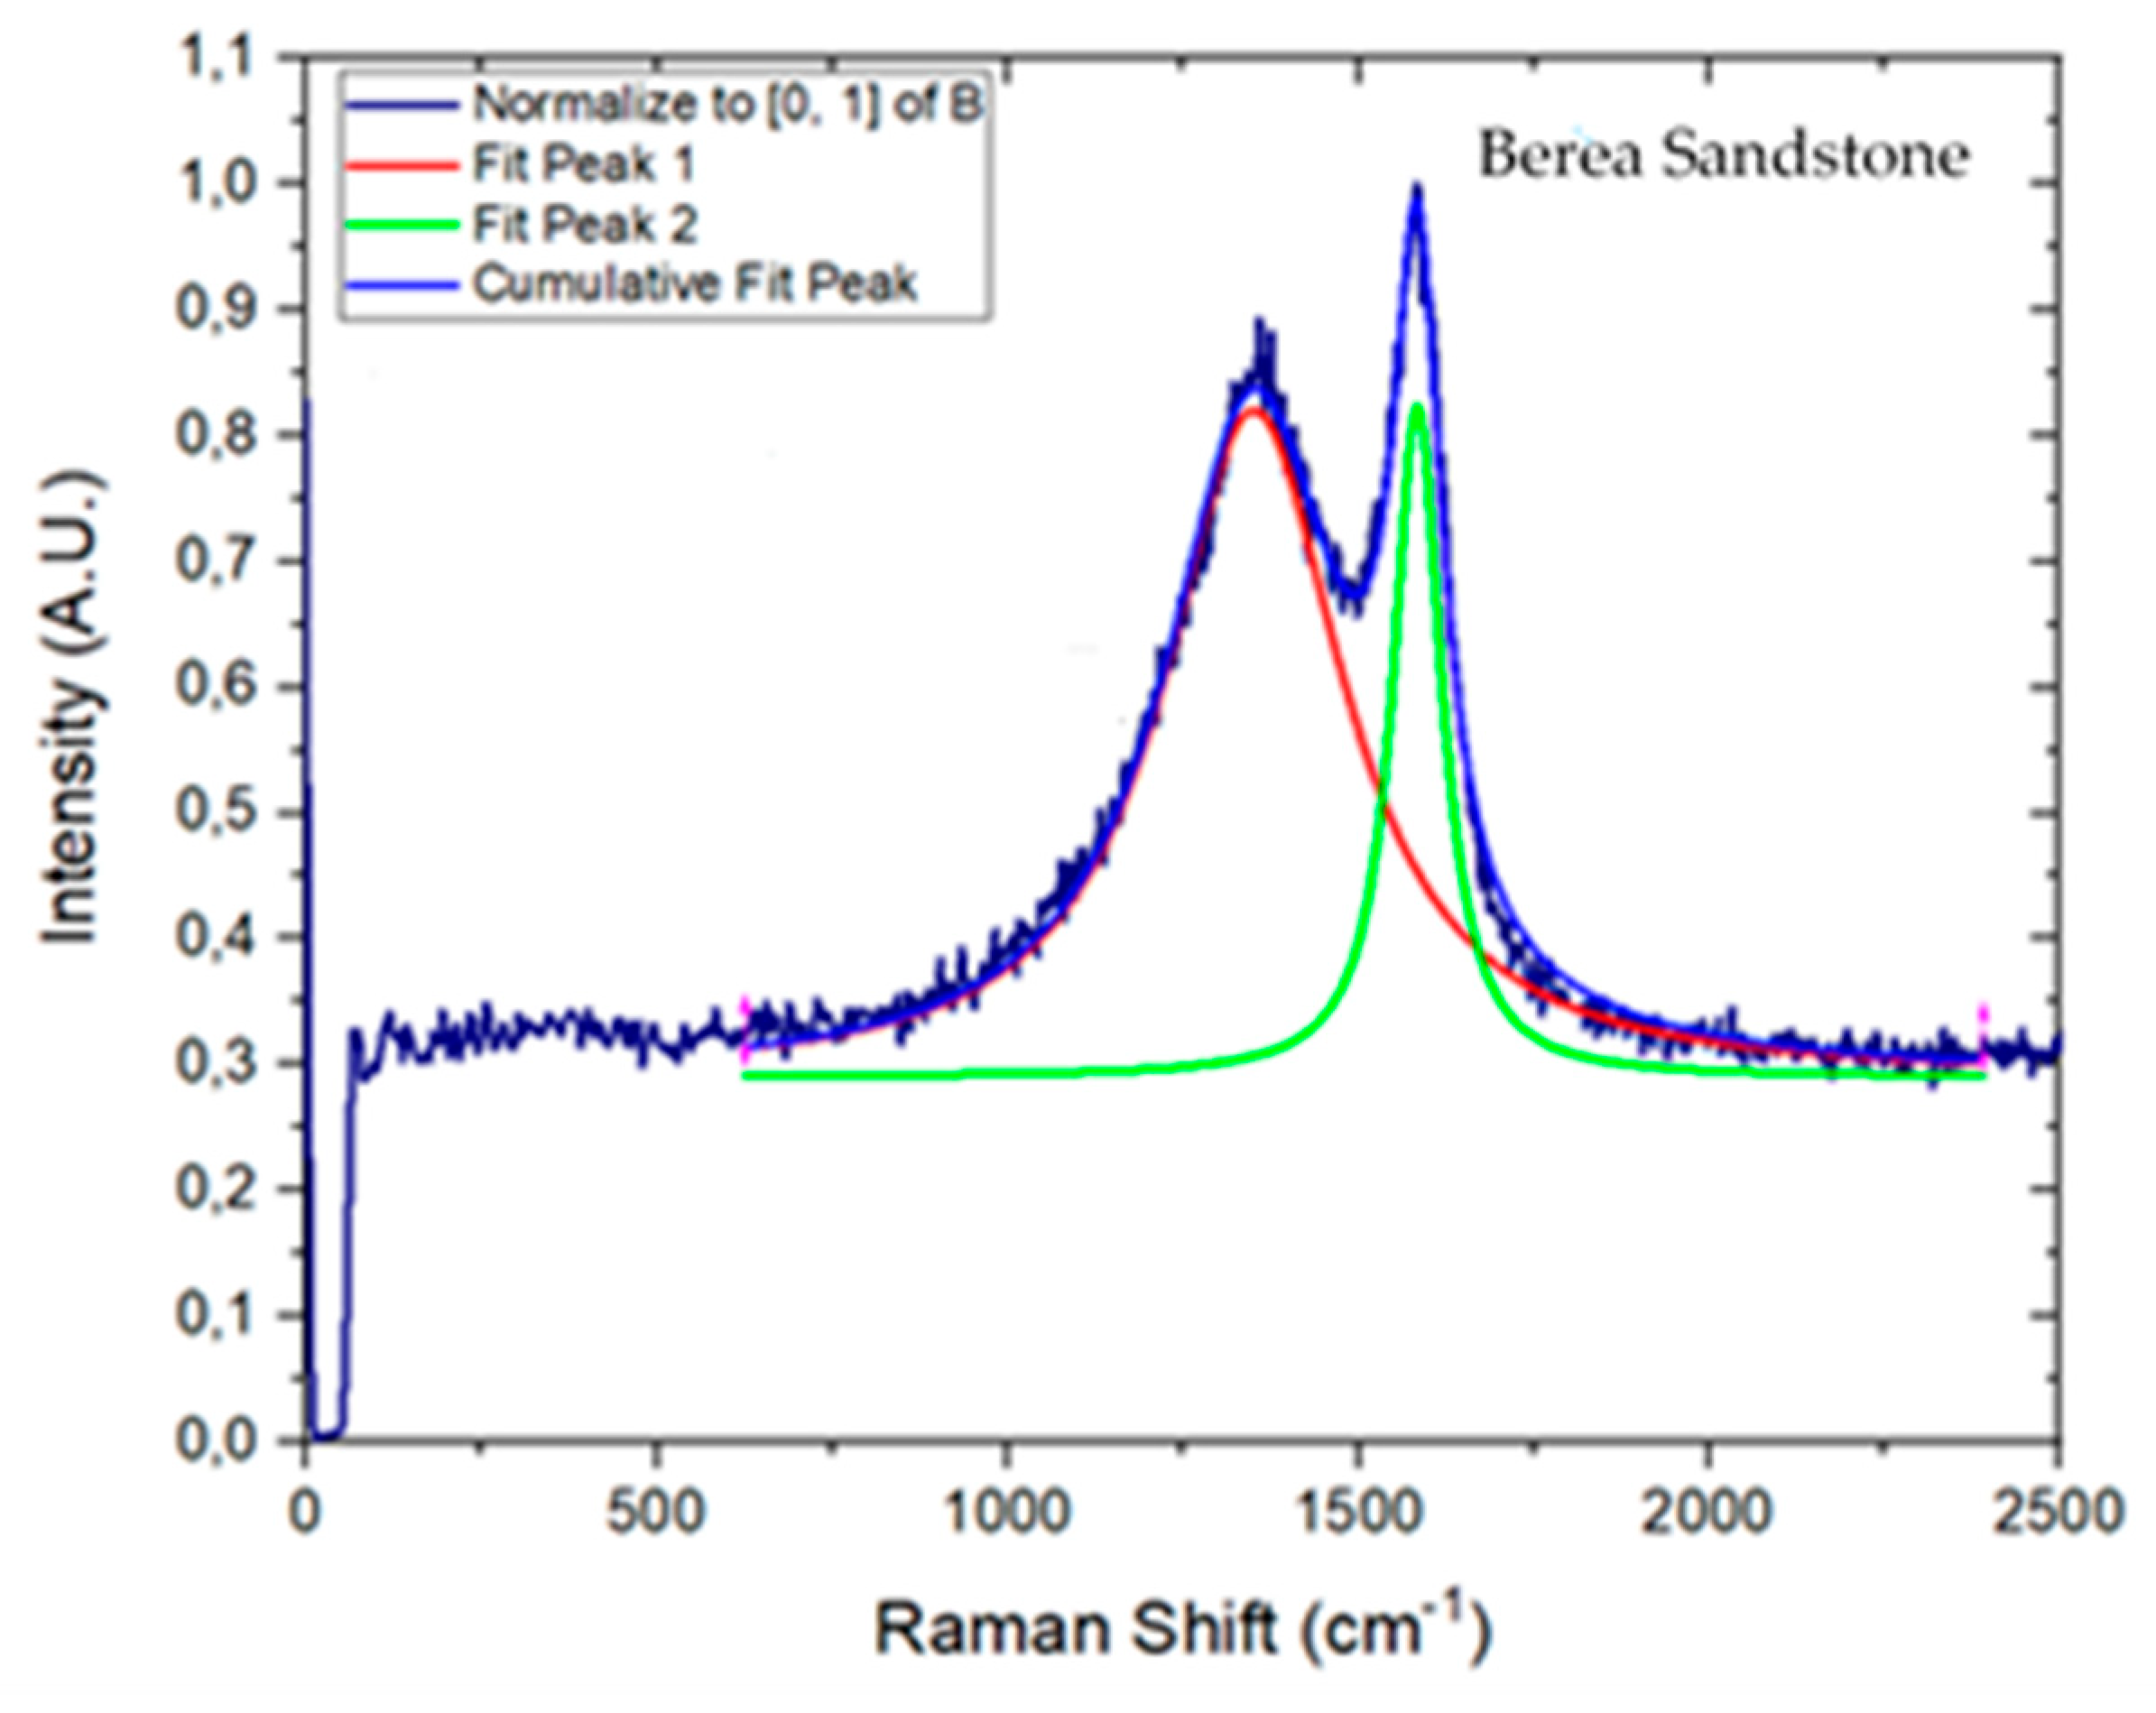
3.3. Raman Spectroscopy

Table 2 presents the Raman spectroscopy results obtained in this research study. The first-order Raman spectra are characterized by two primary peaks, the D1 and G bands. The D1 band of the studied shale samples is observed from 1339 to 1357 cm−1, and this band indicates the disorder structure of the carbon. The G band is observed from 1585 to 1594 cm−1 and it indicates the graphitic structure (which is a more ordered, carbon-like structure). In comparison to the G band location of the Berea Sandstone project shale samples, the G-band of the KWV−01 shale samples shifted up slightly into the range of 1601 to 1605 cm−1 (Table 2). Figure 6 shows the appearance of additional first-order “disorder bands” (D-bands) found between the range of 1188 and 1251 cm−1 for the D4 band; from 1500 to 1552 cm−1 for the D3 band; and the second-order “disorder bands” from 2654 to 2687 cm−1 and from 2922 to 2937 cm−1, respectively, which are clearly observed in the overmature KWV−01 shale samples. The activation of these bands (D bands) is caused by finite size effects and structural defects of the carbon material [62,63,64]. The additional first-order bands (D3 and D4 bands) and the second-order “disorder bands” could not be identified clearly on the spectra from the immature to mature Berea Sandstone project shale samples (Sample 3411 to 4155) due to the broadening of the peaks, as shown in Table 2 and Figure 7.

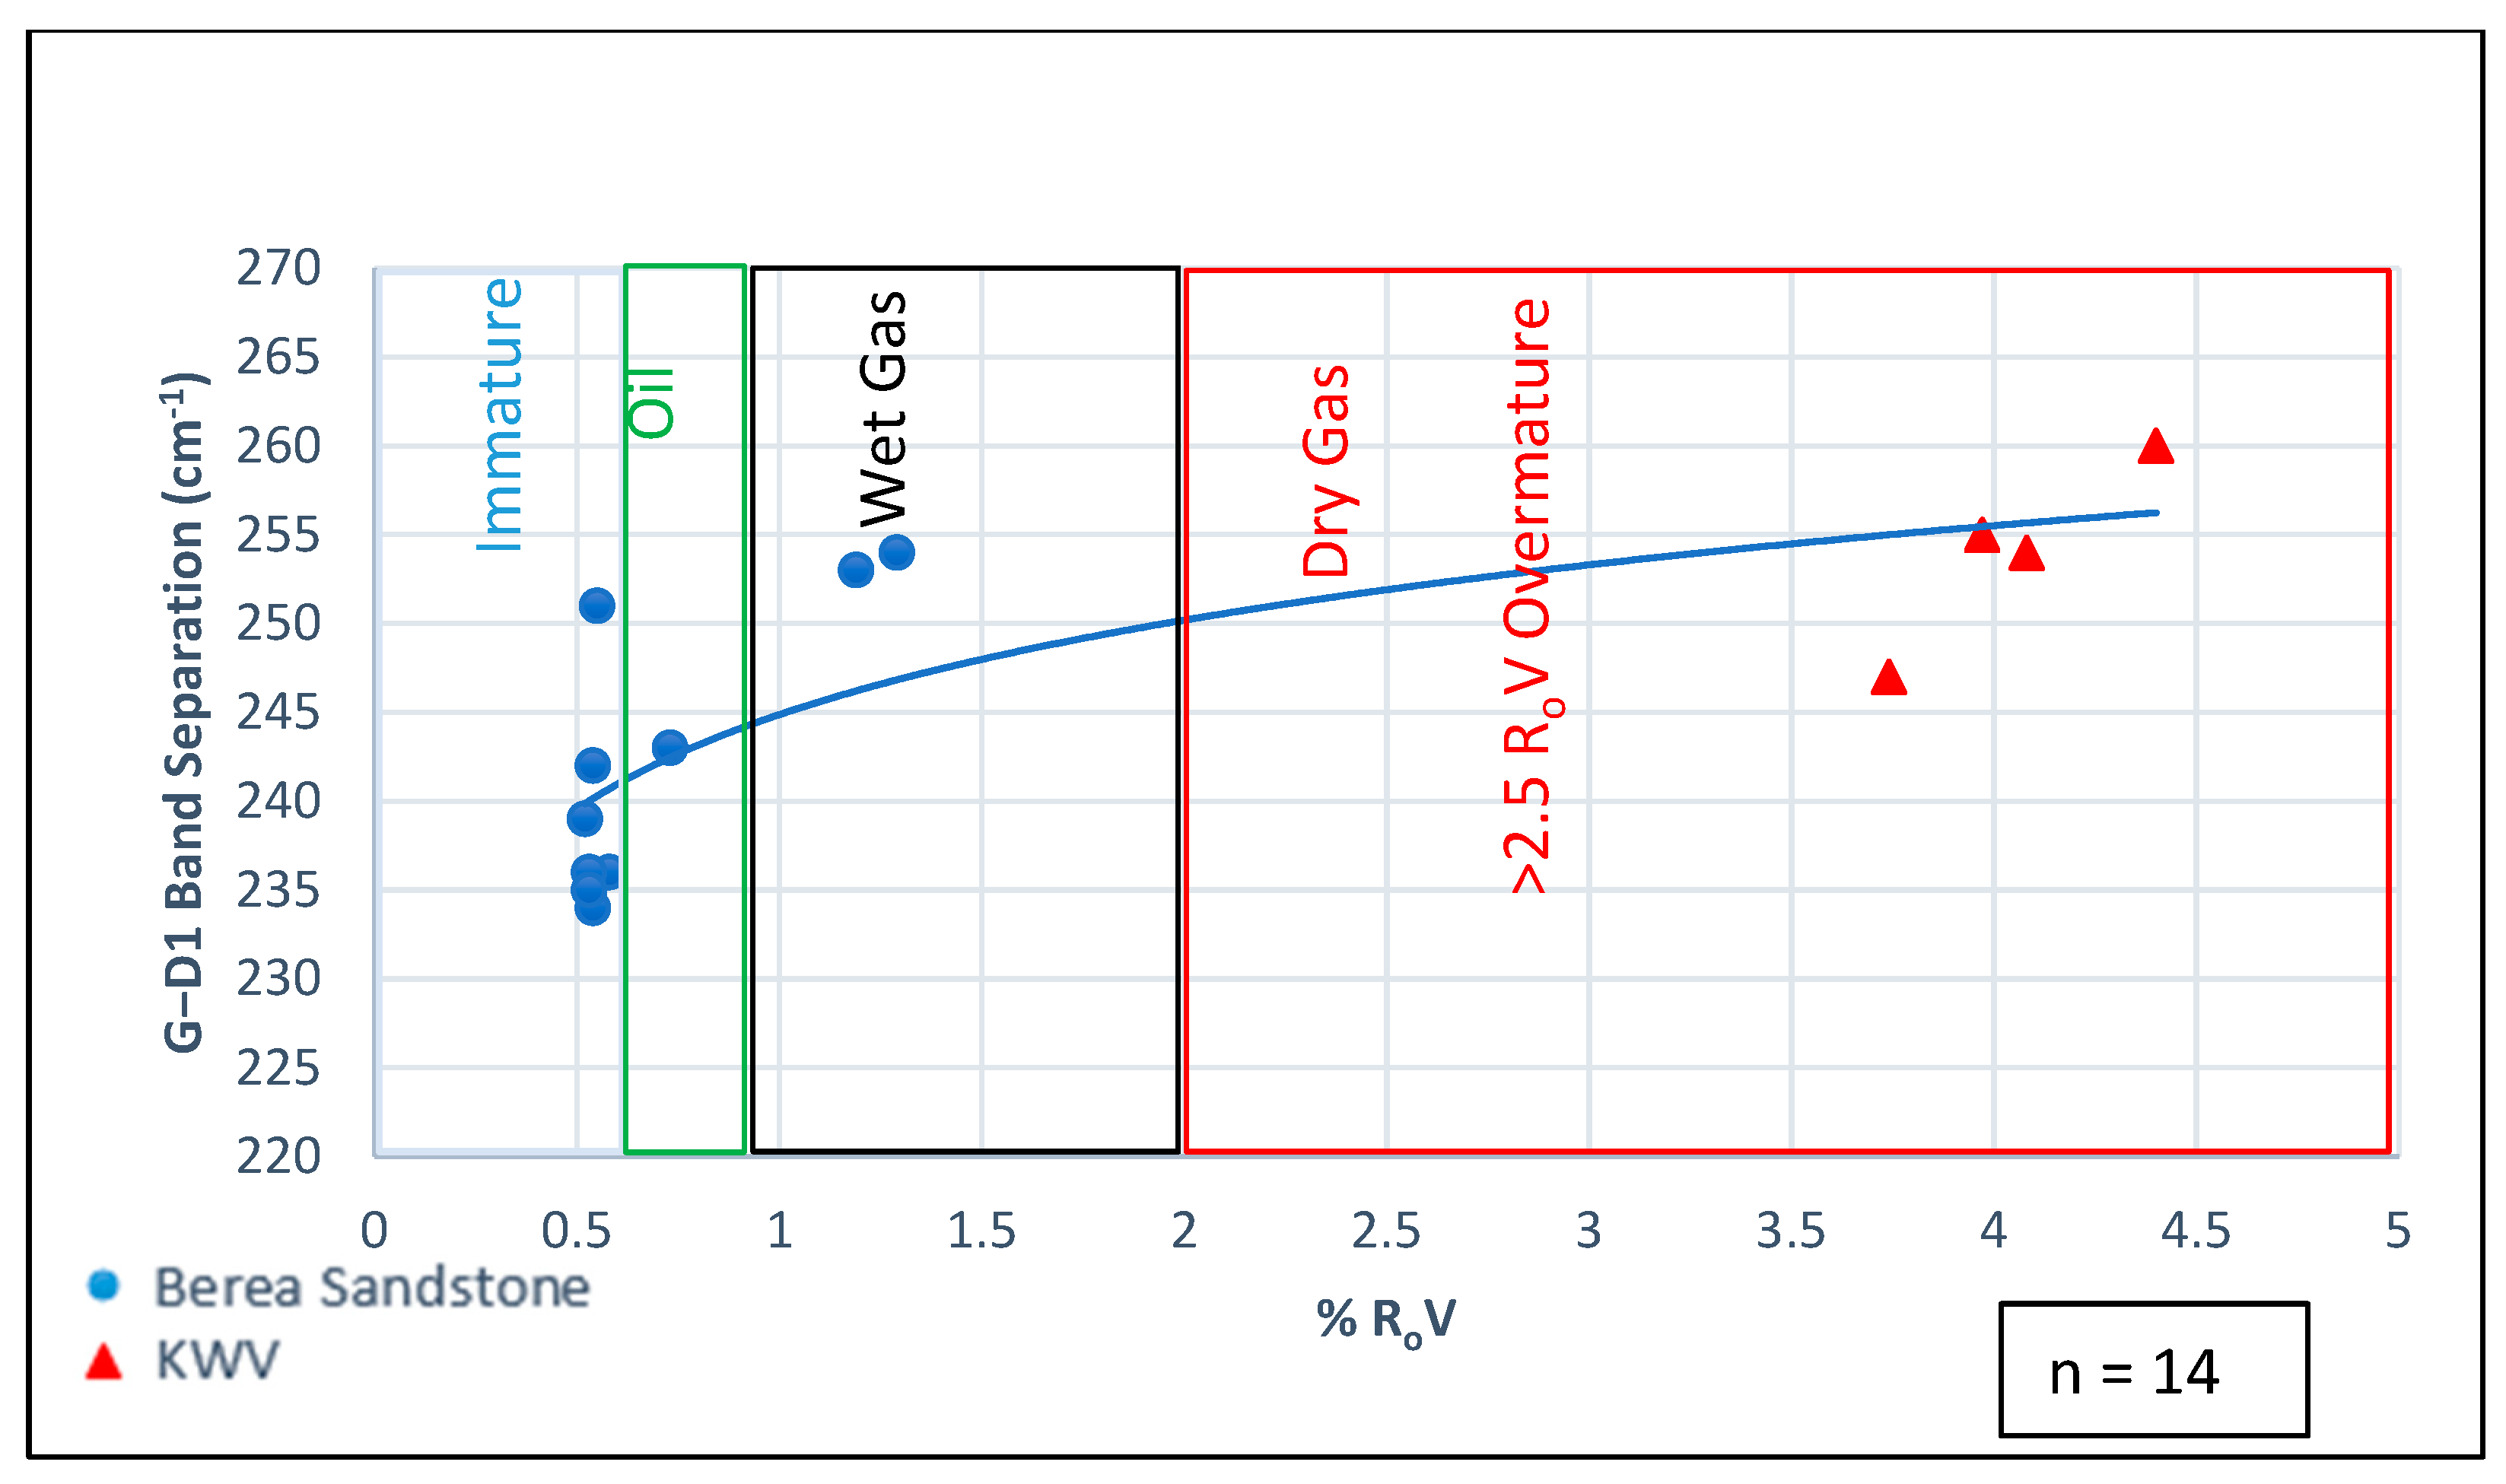
3.4. Correlations between Raman Parameters and Vitrinite Reflectance

The viability of Raman spectroscopy as an assessment tool for the determination of thermal maturity in carbonaceous materials has previously been studied [14,15,33,39,41,44,45]. Raman spectral parameters considered included the positions and separation of the D1 and G bands as well as the FWHM bands. The systematical change in these parameters is a function of thermal maturity, which reflects molecular structural transformations of carbonaceous materials at different maturation levels.
Figure 8 shows G–D1 band separations to correlate with thermal maturity through RoV (RoVr and RoVeq—applicable to overmature samples). It is observed that as RoV increases, the G–D1 band separation also increases/widens with bad correlation, possibly due to the disorder caused by the D1 band. The increase in G–D1 band separation during maturation can be attributed to the increasing aromatic clustering and the structural ordering of the kerogen [35,44,45,65]. This is true since the D1 band refers to the disorder of the heteroatom-rich organic precursors attached to the aromatic structure of organic matter, while the graphitic structure that emerges with the origin of in-plane E2g vibrational modes of the aromatic carbon atoms is represented by the G band [24,44,45]. During maturation, the number of attachments that separate from the aromatic carbons increases [14,66], while clusters of aromatic bands are formed. Figure 8 also shows that the Raman band separation variation can be used to determine the maturation windows (immature, oil, wet gas and dry gas).
Other changes observed in the Raman spectra of the black shale samples include the narrowing of the FWHM band with increasing thermal maturity. The G band FWHM (Gfwhm) was observed to narrow from 87 to 45 cm−1 with increasing thermal maturity (Figure 9). The obtained results are consistent with those reported by various authors [34,48,67,68,69]. The reduction of Gfwhm occurred as a result of the increase in the carbon network structural ordering, which was due to an increase in the thermal maturity [35,40]. The G band originated as a result of the in-plane E2g vibrational modes of the aromatic carbon atoms [14,24,44,62,70]. The G band shifted slightly to the higher wavenumber as the thermal maturity increased concurrently with the increasing aromaticity, as illustrated in Figure 10 [33].
The D1 band FWHM (D1fwhm) of the studied black shale samples was observed to narrow from 306 to 59 cm−1 (Figure 11). The D1 band represents the disorder and defects of the sp2 carbon network-like heteroatoms [14,24,44,45]. Therefore, the attachments (aliphatic carbon linkages and heteroatoms) that separate from the organic matter during thermal maturation concurrent with hydrocarbon generation can be measured using the D1 band. Previous studies observed a shift in the D1 band position to a lower wavenumber (1370 to 1330 cm−1) with increasing thermal maturity [65,71]. This relates to the transformation of organic matter from a disordered state to more ordered molecules as a result of increasing attachments such as aliphatic carbon linkages and heteroatoms separating from the aromatic groups [15]. The narrowing of the D1fwhm with the increase in thermal maturity (Figure 11) observed in this study verifies this phenomenon.

4. Conclusions

The current study investigated the viability of Raman spectroscopy as a tool for assessing the thermal maturity of the Karoo Basin samples. The Berea sandstone project samples from the Appalachian Basin, USA, were included in order to benchmark the analytical techniques (TOC, RoV) used in South Africa in comparison to those used in USA. In this study, Raman spectroscopy was applied in order to gain insight into the molecular structure of the organic matter. The study findings lead to the following conclusions:
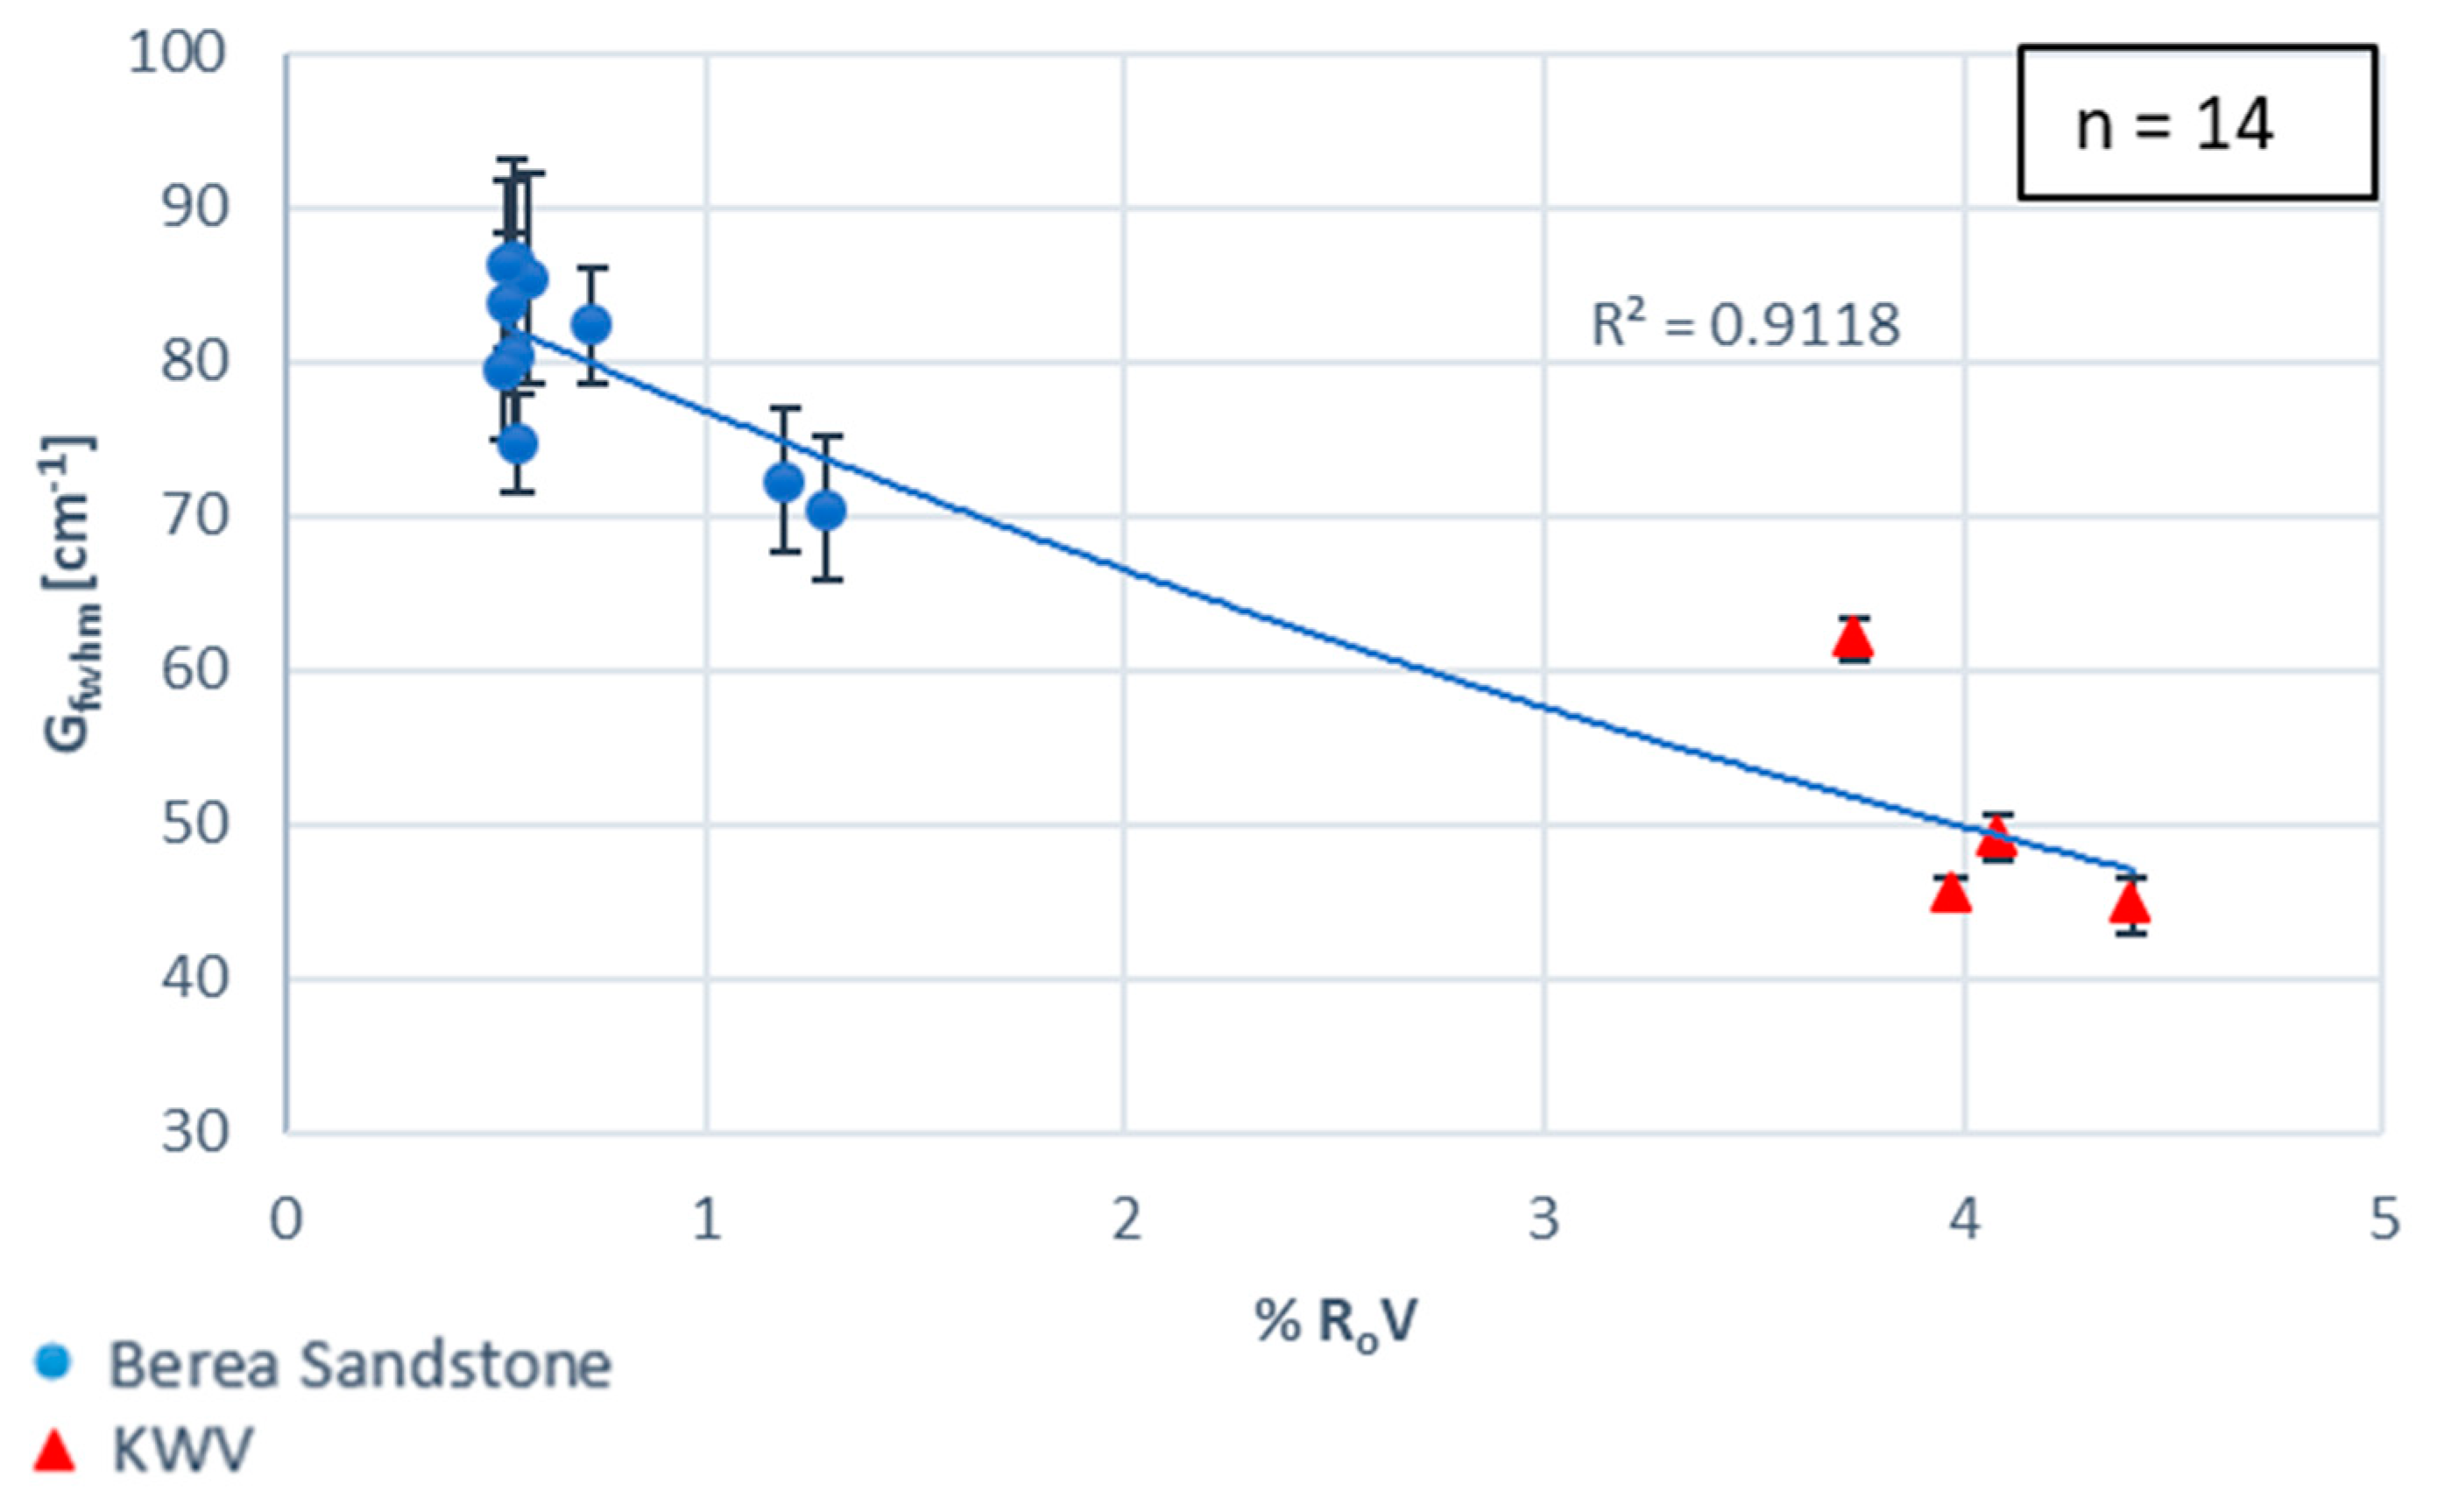
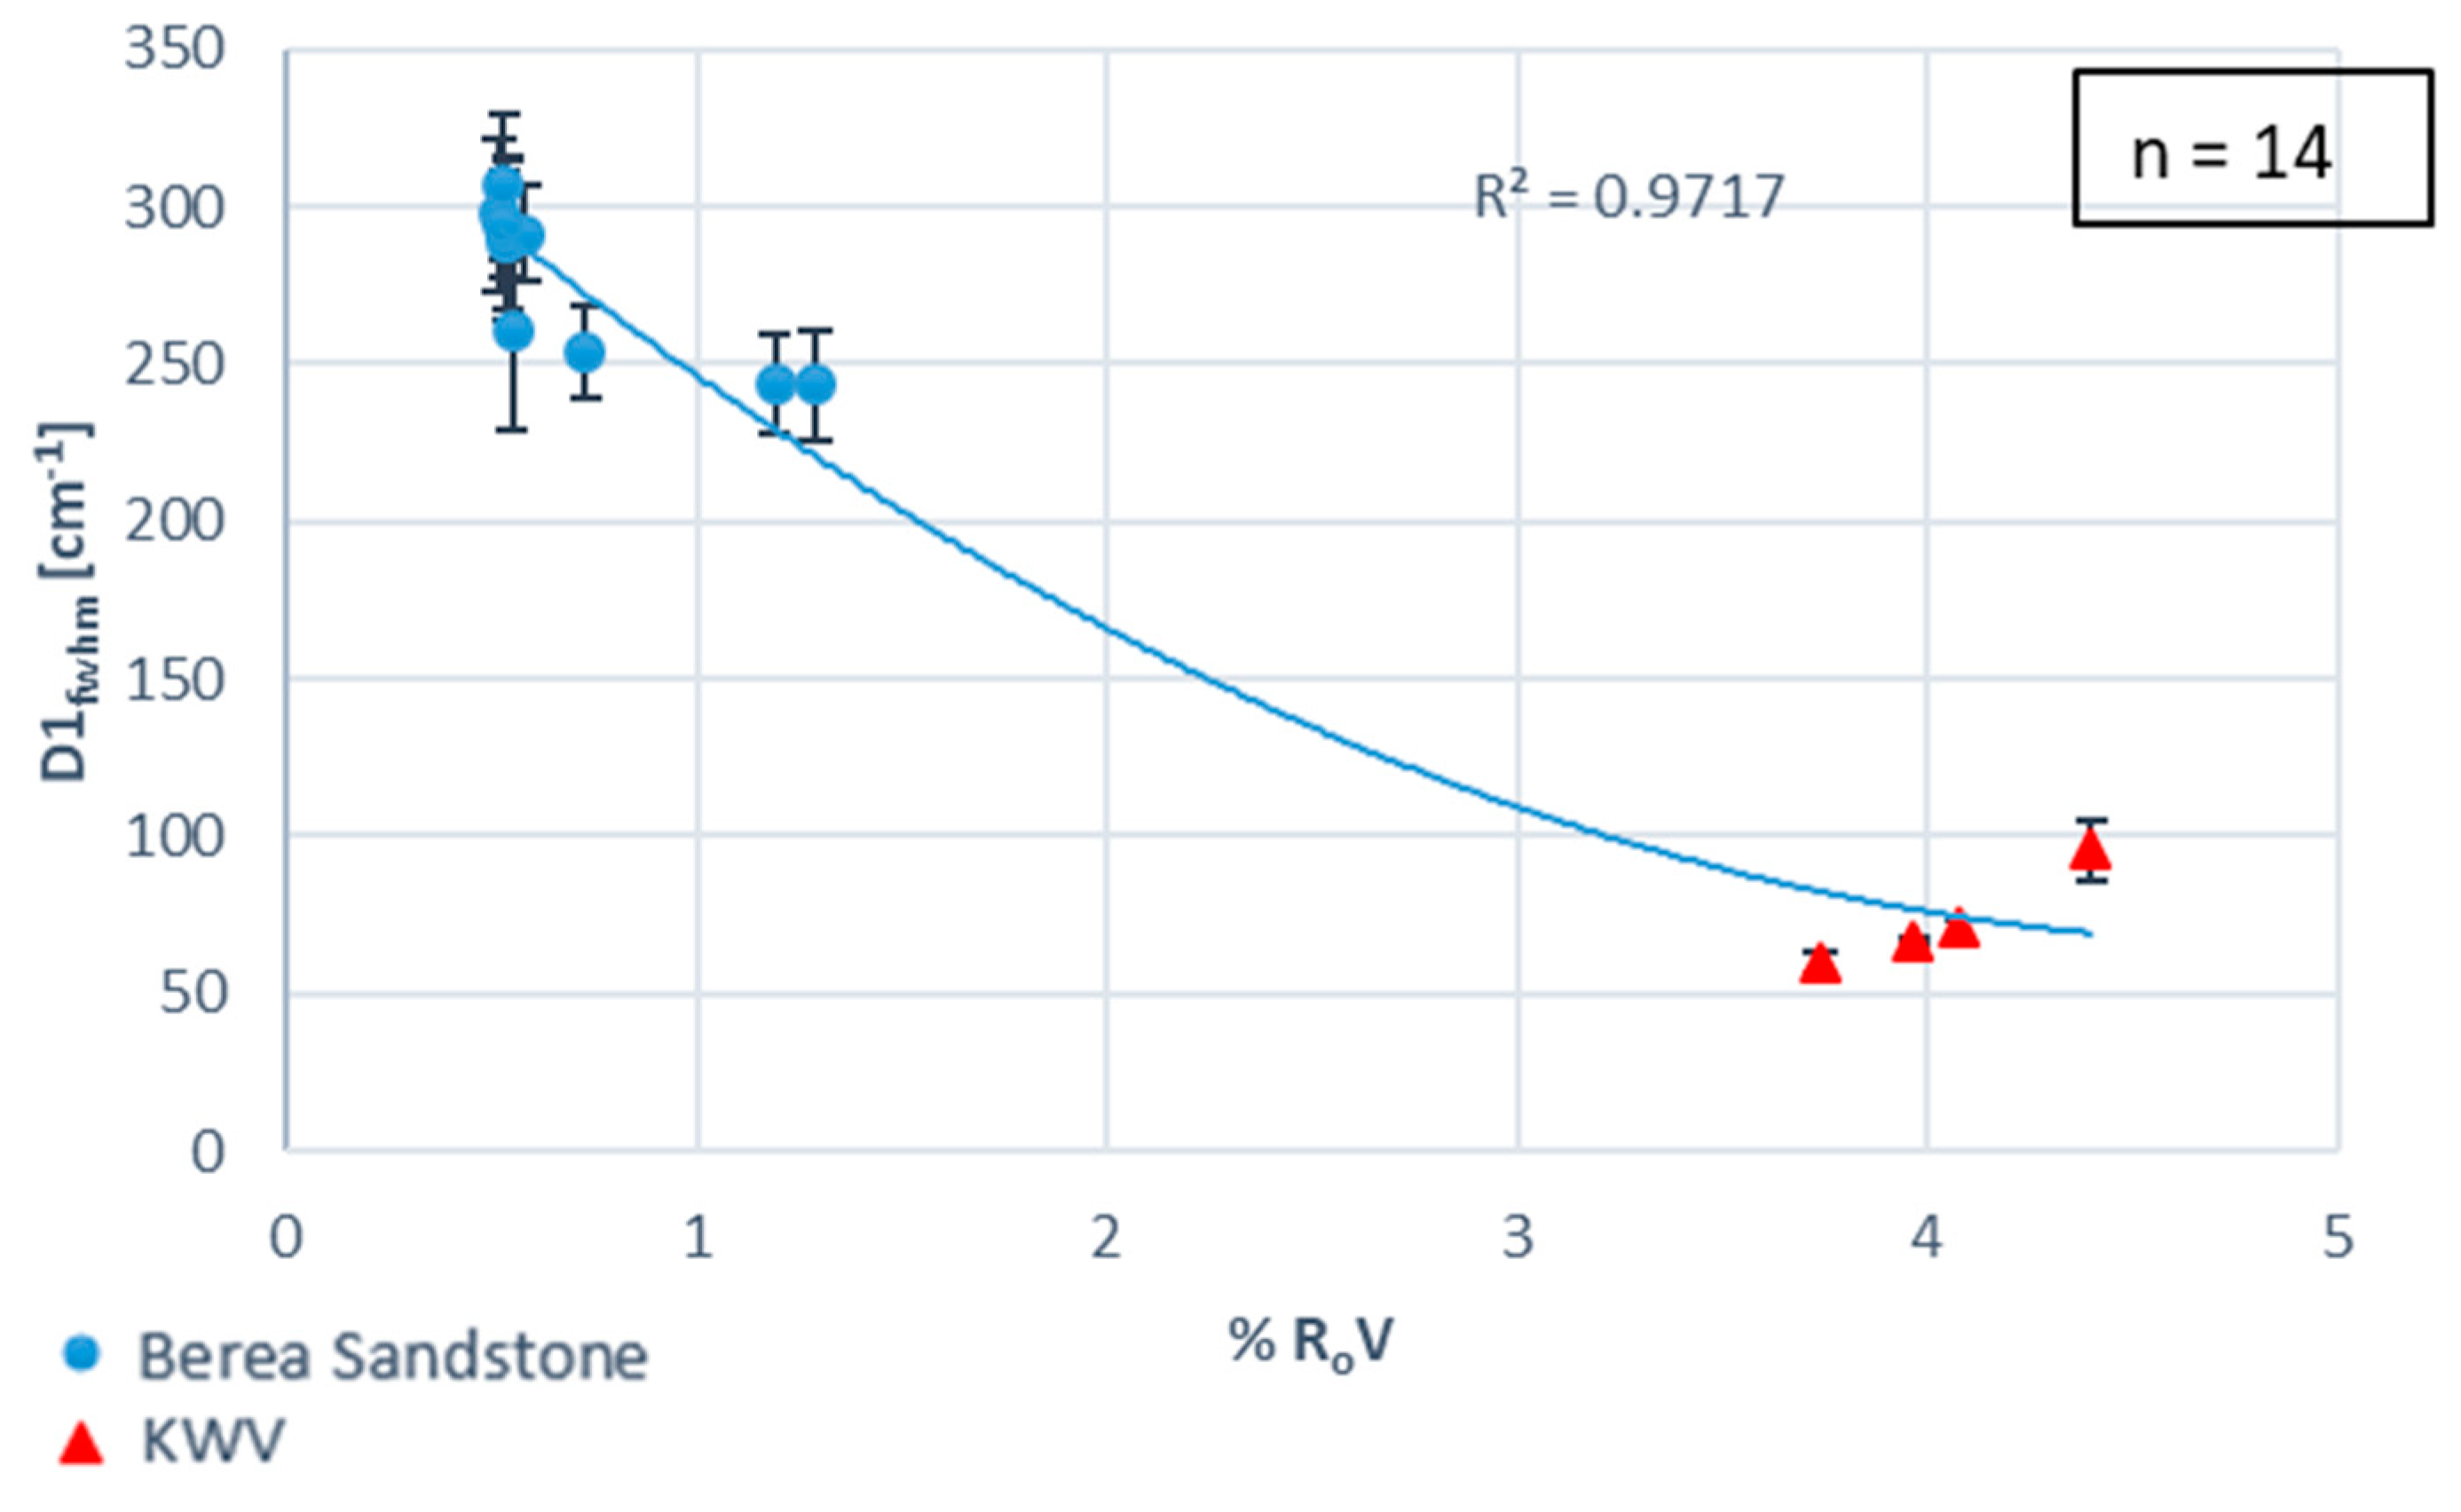
  • The Gfwhm and D1fwhm showed good correlations with RoV.
  • The Gfwhm and D1fwhm are the most reliable indicators of change in carbon structure, making them the most accurate means of measurement for the Raman thermal maturity index.
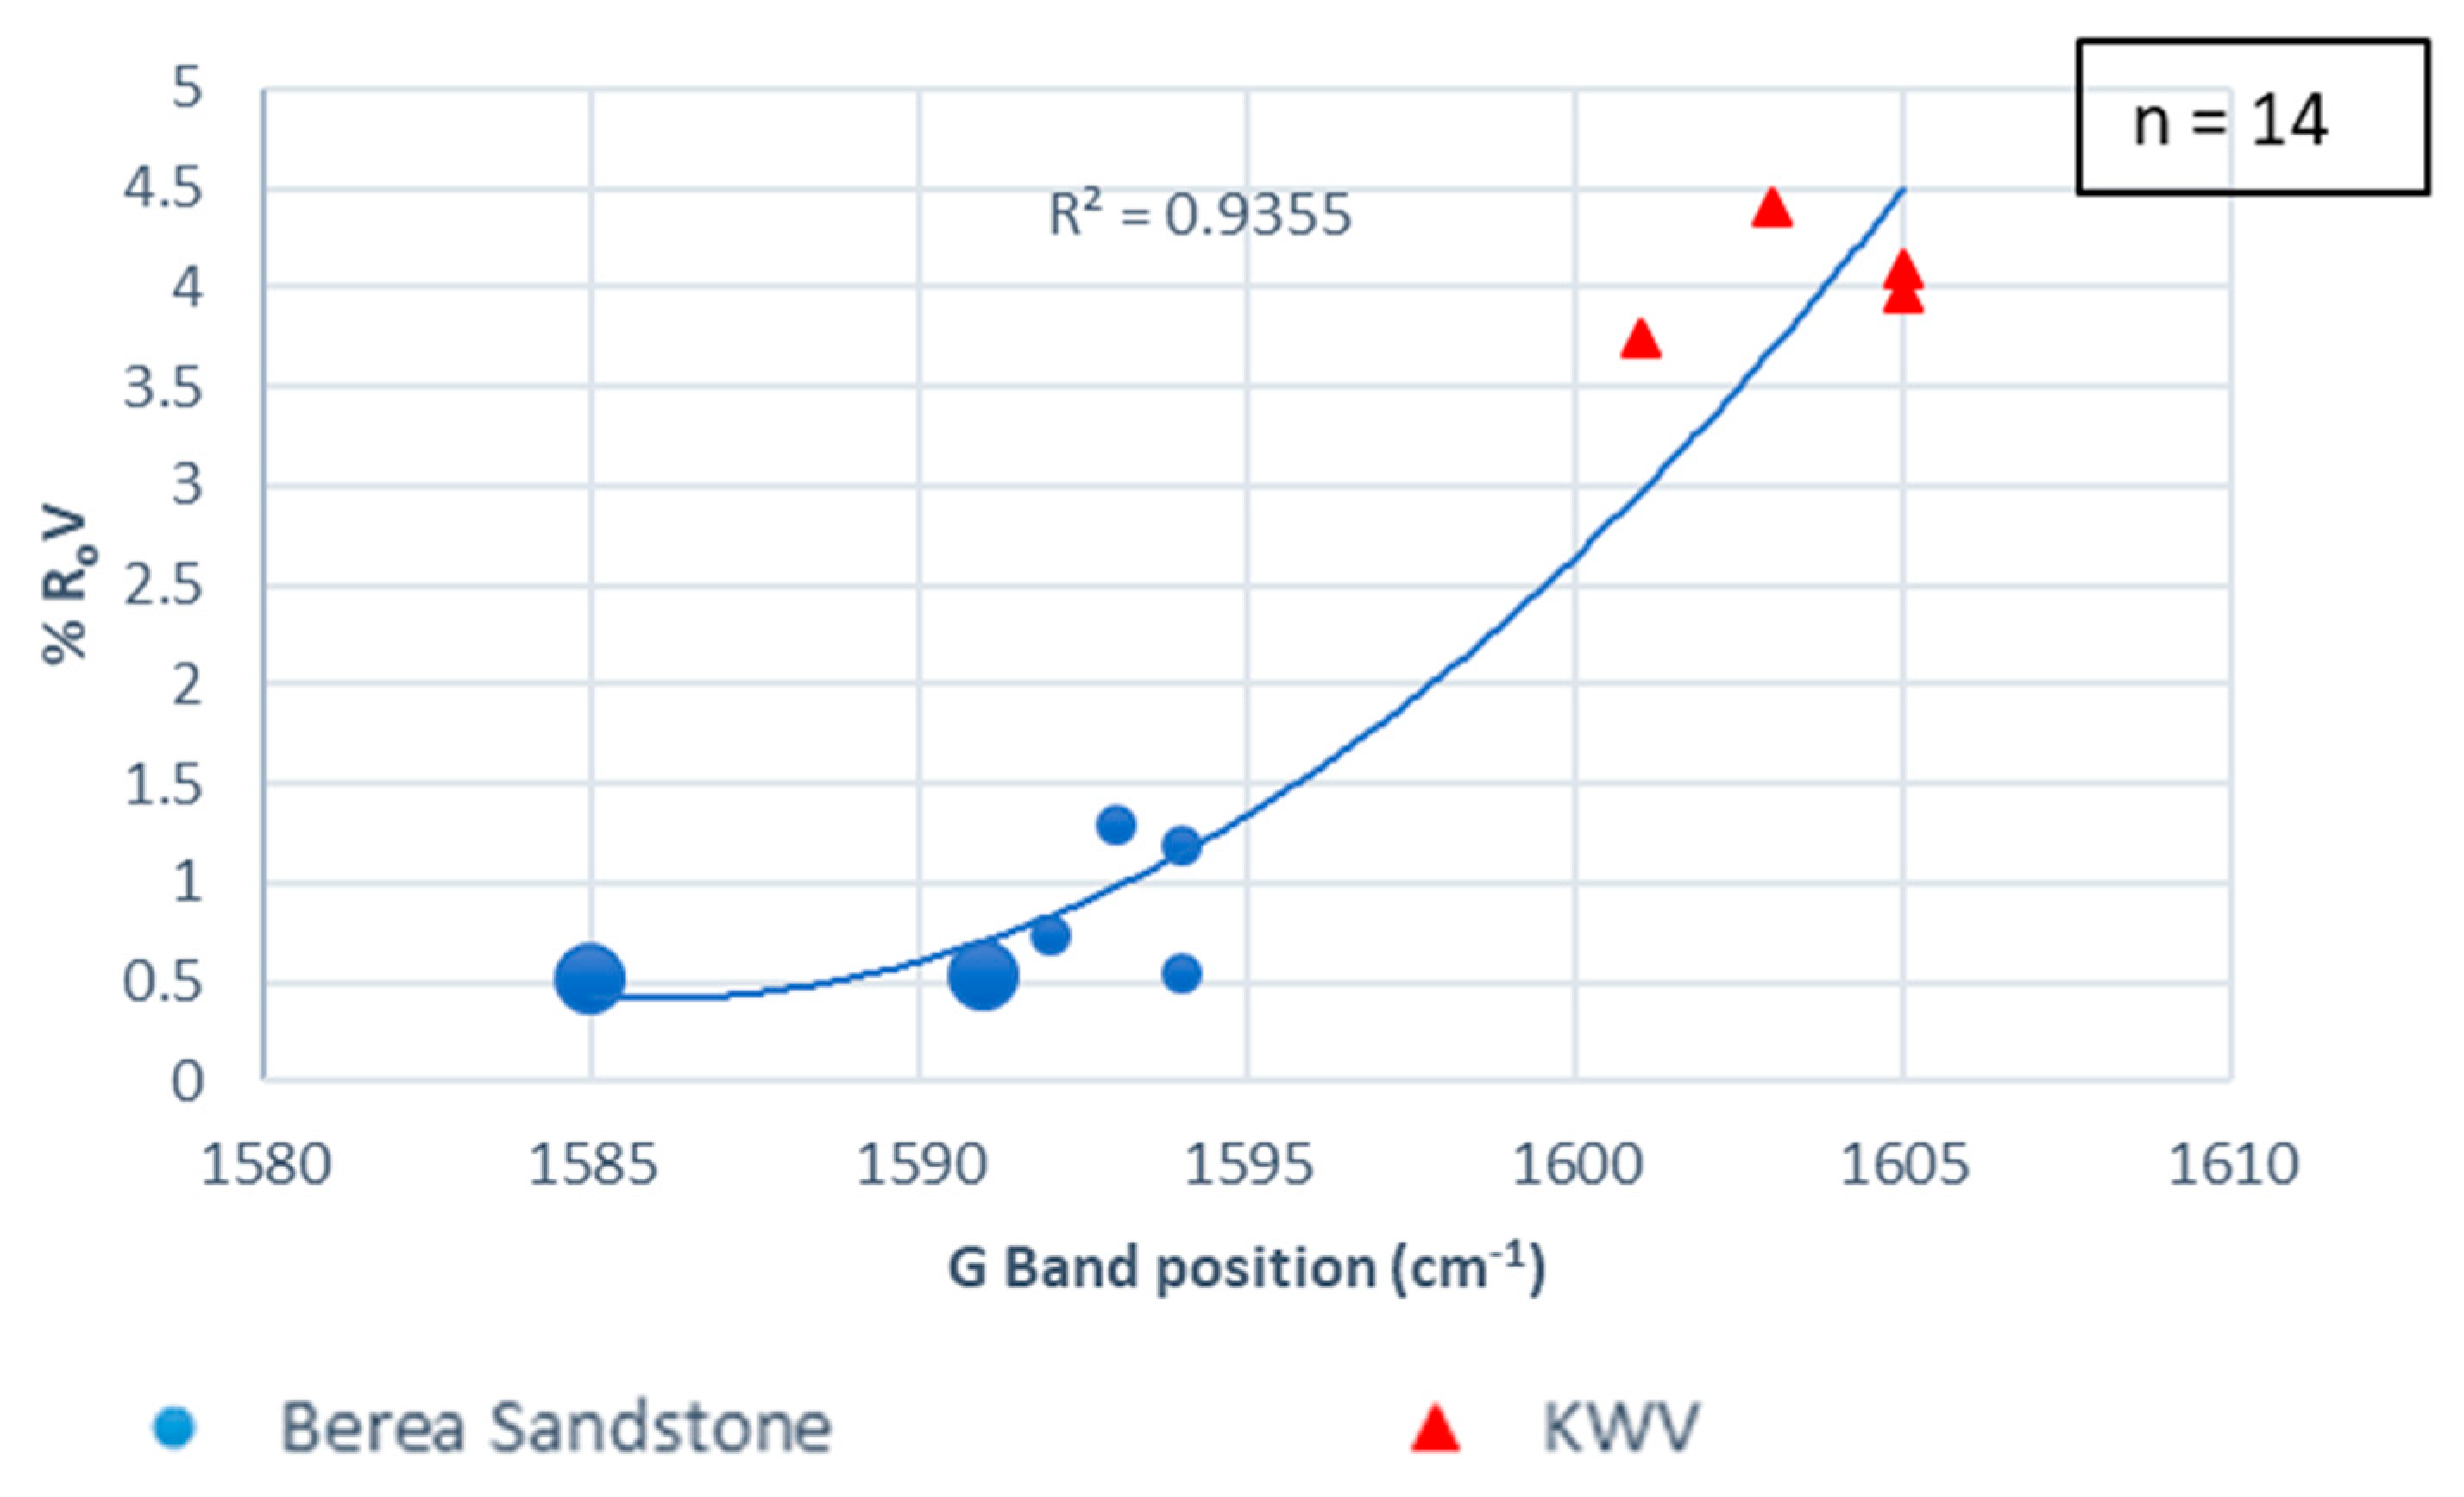
  • The G–D1 band separation can be used as a maturity indicator; however, its correlation with RoV is poor.
  • The reduction of Raman Gfwhm and Dfwhm with an increase in thermal maturity was observed and shown to have a positive correlation with RoV.
  • No correlation was found between Raman parameters and programmed pyrolysis parameters.
  • Programmed pyrolysis data indicate that the KWV−01 samples possess type III gas-prone kerogens. These samples are overmature, and they fall in the poor hydrocarbon generation potential category.
Therefore, the integration of Raman spectroscopy and vitrinite reflectance measurements provides an opportunity to find an alternative or additional method for evaluating the thermal maturity of organic matter in shales. Raman spectroscopy was successfully applied as a complementary analytical technique in the characterization of the organic matter in the Karoo Basin black shales. Collectively, this research provides valuable data for the characterization of Karoo Basin samples, and ultimately broadened our knowledge of shale gas exploration and development in the Karoo Basin, South Africa.

Author Contributions

V.C., Software, Investigation, Writing—original draft; N.W., Supervision, funding acquisition; N.M., Supervision, Project administration. All authors have read and agreed to the published version of the manuscript.

Funding

The Authors would like to acknowledge the South African Bureau of Standards (SABS) for financial support to the doctoral student. DSI-NRF CIMERA is acknowledged for providing additional financial support.

Data Availability Statement

All research data included on the manuscript.

Acknowledgments

The CIMERA-KARIN project is acknowledged as the source for the samples, and the Council for Geoscience (CGS) for allowing the student to conduct sampling from the stored drilled cores. Acknowledgements also go to Cortland Eble from the Kentucky Geological Survey (KGS) for donating the USA samples used in this research. This research was presented at the 72nd ICCP meeting in Prague, Czech Republic on 24 September 2021. The study also forms part of the author’s PhD thesis registered at the University of Johannesburg.

Conflicts of Interest

The authors declare no conflict of interest.

References

  1. Cole, D. Geology of Karoo shale gas and how this can influence economic gas recovery. Gas—The game changer of South Africa? In Proceedings of the Fossil Fuel Foundation Conference, Johannesburg, South Africa, 12 May 2014. [Google Scholar]
  2. Geel, C.; deWit, M.; Booth, P.; Schulz, H.M.; Horsfield, B. Palaeo-environment, diagenesis and characteristics of the Permian black shales in the Lower karoo Supergroup flanking the Cape Fold Belt near Jansenville, Eastern Cape, South Africa: Implication for the shale gas potential of the Karoo Basin. South Afr. J. Geol. 2015, 118, 249–274. [Google Scholar] [CrossRef]
  3. De Kock, M.O.; Beukes, N.J.; Adeniyi, E.O.; Cole, D.; Götz, A.E.; Geel, C.; Ossa, F.-G. Deflating the shale gas potential of South Africa’s Main Karoo Basin. South Afr. J. Sci. 2017, 113, 1–12. [Google Scholar] [CrossRef] [PubMed]
  4. Chabalala, V.P.; Wagner, N.; Malumbazo, N.; Eble, C.F. Geochemistry and Organic Petrology of the Permian Whitehill Formation, Karoo Basin (RSA) and the Devonian/Carboniferous shale of the Appalachian Basin (USA). Int. J. Coal Geol. 2020, 232, 103612. [Google Scholar] [CrossRef]
  5. Geel, C.; Schulz, H.; Booth, P.; deWit, M.; Horsfield, B. Shale gas characteristics of Permian black shales in South Africa: Results from recent drilling in the Ecca Group (Eastern Cape). Energy Procedia 2013, 40, 256–265. [Google Scholar] [CrossRef]
  6. Maré, L.P.; de Kock, M.O.; Cairncross, B.; Mouri, H. Application of magnetic geothermomethers in sedimentary basin: An example from the western Karoo Basin, South Africa. South Afr. J. Geol. 2014, 117, 1–14. [Google Scholar] [CrossRef]
  7. Smithard, T.; Bordy, E.M.; Reid, D. The effect of dolerite intrusions on the hydrocarbon potential of the lower Permian Whitehill Formation (Karoo Supregroup) in South Africa and Southern Namibia: A preliminary study. South Afr. J. Geol. 2015, 118, 489–510. [Google Scholar] [CrossRef]
  8. Black, D.E.; Booth, P.W.K.; De Wit, M.J. Petrographic, geochemical and petro-physical analysis of the Collingham Formation near Jansenville, Eastern Cape, South Africa—Potential cap rocks to shale gas in the Karoo. South Afr. J. Geol. 2016, 119, 171–186. [Google Scholar] [CrossRef]
  9. Chukwuma, K.; Bordy, E.M. Spatiotemporal Sedimentary Facies Variations in the Lower Permian Whitehill Formation, Ecca Group, Karoo Basin. In Origin and Evolution of the Cape Mountains and Karoo Basin; Regional Geology Reviews; Linol, B., de Wit, M.J., Eds.; Springer: Berlin/Heidelberg, Germany, 2016; pp. 101–110. [Google Scholar]
  10. De Kock, M.O.; Beukes, N.J.; Götz, A.E.; Cole, D.; Robey, K.; Birch, A.; Withers, A.; Niekerk, H.S. Progress report on exploration of the southern Karoo Basin through CIMERAKARIN borehole KZF-1 in the Tankwa Karoo, Witzenberg (Ceres) district. CIMERAKARIN Open-File Rep. 2016, 1, 1–12. [Google Scholar]
  11. De Kock, M.O.; Beukes, N.J.; van Niekerk, H.S.; Cole, D.; Robey, K.; Birch, A.; Götz, A.E. Progress report on investigation of the southeastern Main Karoo Basin through CIMERA-KARIN borehole KWV-1 near Willowvale in the Eastern Cape Province. CIMERA-KARIN Open-File Rep. 2016, 2, 1–13. [Google Scholar]
  12. Götz, A.E.; Ruckwied, K.; Wheeler, A. Marine flooding surfaces recorded in Permian black shales and coal deposits of the main Karoo Basin (South Africa): Implication for basin dynamics and cross-basin correlation. Int. J. Coal Geol. 2018, 190, 178–190. [Google Scholar] [CrossRef]
  13. Costin, G.; Götz, A.E.; Ruckwied, K. Sedimentary organic matter characterization of the Whitehill shales (Karoo Basin, South Africa): An integrated quantitative approach using FE-EPMA and LA-ICP-MS. Rev. Palaeobot. Palynol. 2019, 268, 29–42. [Google Scholar] [CrossRef]
  14. Khatibi, S.; Ostadhassan, M.; Aghajanpour, A. Raman spectroscopy: An analytical tool for evaluating organic matter. J. Oil Gas Petrochem. Sci. 2018, 1, 28–33. [Google Scholar] [CrossRef]
  15. Khatibi, S.; Ostadhassan, M.; Tuschel, D.; Gentzis, T.; Carvajal-Ortiz, H. Evaluating molecular evolution of kerogen by Raman spectroscopy: Correlation with Optical Microscopy and Rock-Eval pyrolysis. Energies 2018, 11, 1406. [Google Scholar] [CrossRef]
  16. McCarthy, K.; Rojas, K.; Niemann, M.; Palmowski, D.; Peters, K.; Stankiewicz, A. Basic Petroleum Geochemistryfor Source Rock Evaluation. Schlumberger Oil Field Rev. 2011, 23, 32–43. [Google Scholar]
  17. Curtis, J.B. Fractured shale-gas systems. Am. Assoc. Pet. Geol. Bull. 2022, 86, 1921–1938. [Google Scholar]
  18. Miller, R. Shale reservoir evaluation: Reservoir characterization and production properties. In Core Laboratories Integrated Reservoir Solutions Short Course Notes; Unpaginated; Core Lab Reservoir Optimization (Metropolitan Conference Centre): Perth, Australia, 2014. [Google Scholar]
  19. Bernard, S.; Horsfield, B. Thermal maturation of gas shale systems. Annu. Rev. Earth Planet. Sci. 2014, 42, 635–651. [Google Scholar] [CrossRef]
  20. Dembicki, H., Jr.; Madren, J.D. Lessons learned from the Floyed shale play. J. Unconv. Oil Gas Resour. 2014, 7, 1–10. [Google Scholar] [CrossRef]
  21. De Silva, P.N.K.; Simons, S.J.R.; Stevens, P.; Philip, L.M. A comparison of North American shale plays with emerging non-marine shale plays in Australia. Mar. Pet. Geol. 2015, 67, 16–29. [Google Scholar] [CrossRef]
  22. Hackley, P.C.; Cardott, B.J. Application of organic petrography in North American shale petroleum systems: A review. Int. J. Coal Geol. 2016, 163, 8–51. [Google Scholar] [CrossRef]
  23. Hackley, P.C.; Araujo, C.V.; Borrego, A.G.; Bouzinos, A.; Cardott, B.J.; Cook, A.C.; Eble, C.; Flores, D.; Gentzis, T.; Gonçalves, P.A. Standardization of reflectance measurements in dispersed organic matter: Results of an exercise to improve interlaboratory agreement. Mar. Pet. Geol. 2015, 59, 22–34. [Google Scholar] [CrossRef]
  24. Sauerer, B.; Craddock, P.R.; AlJohani, M.D.; Alsamadony, K.L.; Abdallah, W. Fast and accurate shale maturity determination by Raman spectroscopy measurement with minimal sample preparation. Int. J. Coal Geol. 2017, 173, 150–157. [Google Scholar] [CrossRef]
  25. Jacob, H. Classification, structure, genesis, and practical importance of natural solid bitumen (“migrabitumen”). Int. J. Coal Geol. 1989, 11, 65–79. [Google Scholar] [CrossRef]
  26. Landis, C.R.; Castaño, J.R. Maturation and bulk chemical properties of a suite of solid hydrocarbons. Org. Geochem. 1995, 22, 137–149. [Google Scholar] [CrossRef]
  27. Schoenherr, J.; Littke, R.; Urai, J.L.; Kukla, P.A.; Rawahi, Z. Polyphase thermal evolution in the Infra-Cambrian Ara Group (South Oman salt basin) as deduced by maturity of solid reservoir bitumen. Org. Geochem. 2007, 38, 1293–1318. [Google Scholar] [CrossRef]
  28. Curiale, J.A. Origin of solid bitumens, with emphasis on biological marker results. Org. Geochem. 1986, 10, 559–580. [Google Scholar] [CrossRef]
  29. Gentzis, T.; Goodarzi, F. A review of the use of bitumen reflectance in hydrocarbon exploration with examples from Melville Island, Arctic Canada. In Applications of Thermal Maturity Studies to Energy Exploration; Society for Sedimentary Geology (SEPM), Rocky Mountain Section; Nuccio, V.F., Barker, C.E., Eds.; Norwegian Petroleum Society Special Publications: Amsterdam, The Netherlands, 1990; pp. 23–36. [Google Scholar]
  30. Gonçalves, P.A.; Graciano Mendonça Filho, J.; da Silva, F.S.; Flores, D. Solid bitumen occurrences in the Arruda sub-basin (Lusitanian Basin, Portugal): Petrographic features. Int. J. Coal Geol. 2014, 131, 239–249. [Google Scholar] [CrossRef]
  31. Clementz, D.M. Effect of oil and bitumen saturation on source-rock pyrolysis: Geologic notes. Am. Assoc. Pet. Geol. Bull. 1979, 63, 2227–2232. [Google Scholar]
  32. Larter, S.; Douglas, A. A pyrolysis-gas chromatographic method for kerogen typing. Phys. Chem. Earth 1980, 12, 579–583. [Google Scholar] [CrossRef]
  33. Kelemen, S.R.; Fang, H.L. Maturity trends in Raman spectra from kerogen and coal. Energy Fuels 2001, 15, 653–658. [Google Scholar] [CrossRef]
  34. Beyssac, O.; Goffe’, B.; Chopin, C.; Rouzaud, J.N. Raman spectra of carbonaceous material in metasediments: A new geothermometer. J. Metamorph. Geol. 2002, 20, 859–871. [Google Scholar] [CrossRef]
  35. Quirico, E.; Rouzaud, J.; Bonal, L.; Montagnac, G. Maturation grade of coals as revealed by Raman spectroscopy: Progress and problems. Spectrochim. Acta Part A 2005, 61, 2368–2377. [Google Scholar] [CrossRef] [PubMed]
  36. Lahfid, A.; Beyssac, O.; Deville, E.; Negro, F.; Chopin, C.; Goffé, B. Evolution of the Raman spectrum of carbonaceous material in low-grade metasediments of the Glarus Alps (Switzerland). Terra Nova 2010, 22, 354–360. [Google Scholar] [CrossRef]
  37. Guedes, A.; Valentim, B.; Prieto, A.; Noronha, F. Raman spectroscopy of coal macerals and fluidized bed char morphotypes. Fuel 2012, 97, 443–449. [Google Scholar] [CrossRef]
  38. Hinrichs, R.; Brown, M.T.; Vasconcellos, M.A.; Abrashev, M.V.; Kalkreuth, W. Simple procedure for an estimation of the coal rank using micro-Raman spectroscopy. Int. J. Coal Geol. 2014, 136, 52–58. [Google Scholar] [CrossRef]
  39. Wilkins, R.W.; Boudou, R.; Sherwood, N.; Xiao, X. Thermal maturity evaluation from inertinites by Raman spectroscopy: The ‘RaMM’ technique. Int. J. Coal Geol. 2014, 128, 143–152. [Google Scholar] [CrossRef]
  40. Zhou, Q.; Xiao, X.; Pan, L.; Tian, H. The relationship between micro-Raman spectral parameters and reflectance of solid bitumen. Int. J. Coal Geol. 2014, 121, 19–25. [Google Scholar] [CrossRef]
  41. Lünsdorf, N.K. Raman spectroscopy of dispersed vitrinite—Methodical aspects and correlation with reflectance. Int. J. Coal Geol. 2016, 153, 75–86. [Google Scholar] [CrossRef]
  42. Mumm, A.S.; İnan, S. Microscale organic maturity determination of graptolites using Raman spectroscopy. Int. J. Coal Geol. 2016, 162, 96–107. [Google Scholar] [CrossRef]
  43. Ferralis, N.; Matys, E.D.; Knoll, A.H.; Hallmann, C.; Summons, R.E. Rapid, direct and non-destructive assessment of fossil organic matter via microRaman spectroscopy. Carbon 2016, 108, 440–449. [Google Scholar] [CrossRef]
  44. Khatibi, S.; Ostadhassan, M.; Tuschel, D.; Gentzis, T.; Bubach, B.; Carvajal-Ortiz, H. Raman spectroscopy to study thermal maturity and elastic modulus of kerogen. Int. J. Coal Geol. 2018, 185, 103–118. [Google Scholar] [CrossRef]
  45. Khatibi, S.; Aghajanpour, A.; Ostadhassan, M.; Farzay, O. Evaluating Single- Parameter parabolic failure criterion in wellbore stability analysis. J. Nat. Gas Sci. Eng. 2018, 50, 166–180. [Google Scholar] [CrossRef]
  46. Speer, M.L. Raman Spectroscopy as a Technique for Studying the Structure and Mechanism of the Volume Phase Transition of Poly(N-isopropylacrylamide). Master’s Thesis, University of Pittsburgh, Pittsburgh, PA, USA, 2013. Available online: https://core.ac.uk/download/pdf/17356362.pdf (accessed on 7 January 2019).
  47. Dwivedi, Y. Molecular and Laser Spectroscopy: Chapter 14: Concept and Applications of Standoff Raman Spectroscopy Techniques; Advances and Applications; Department of Physics, National Institute of Technology Kurukshetra: Haryana, India, 2020; Volume 2, pp. 483–520. [Google Scholar]
  48. Wopenka, B.; Pasteris, J.D. Structural characterisation of kerogens to granulite-facies graphite: Applicability of Raman microprobe spectroscopy. Am. Mineral. 1993, 78, 533–557. [Google Scholar]
  49. Zhao, Q.; Wagner, H.D. Raman spectroscopy of carbon-nanotube-based composites. Philos. Trans. R. Soc. A Math. Phys. Eng. Sci. 2004, 362, 2407–2424. [Google Scholar] [CrossRef] [PubMed]
  50. Marshall, C.P.; Edwards, H.G.; Jehlicka, J. Understanding the application of Raman spectroscopy to the detection of traces of life. Astrobiology 2010, 10, 229–243. [Google Scholar] [CrossRef] [PubMed]
  51. Cohen, K.M.; Harper, D.A.T.; Gibbard, P.L. ICS International Chronostratigraphic Chart 2020/03. International Commission on Stratigraphy, IUGS. Available online: www.stratigraphy.org (accessed on 10 September 2023).
  52. Cohen, K.M.; Finney, S.C.; Gibbard, P.L.; Fan, J.-X. The ICS International Chronostratigraphic Chart. Epis. J. Int. Geosci. 2013, 36, 199–204. [Google Scholar] [CrossRef]
  53. Ruckwied, K.; Götz, A.E.; Jones, P. Palynological records of the Permian Ecca Group (South Africa): Utilizing climatic icehouse–greenhouse signals for cross basin correlations. Palaeogeogr. Palaeoclimatol. Palaeoecol. 2014, 413, 167–172. [Google Scholar] [CrossRef]
  54. McKay, M.P.; Coble, M.A.; Hessler, A.M.; Weislogel, A.L.; Fildani, A. Petrogenesis and provenance of distal volcanic tuffs from the Permian–Triassic Karoo Basin, South Africa: A window into a dissected magmatic province. Geosphere 2016, 12, 1–14. [Google Scholar] [CrossRef]
  55. Belica, M.E.; Tohver, E.; Poyatos-Moré, M.; Flint, S.; Parra-Avila, L.A.; Luca Lanci, L.; Steven Denyszyn, S.; Pisarevsky, S.A. Refining the chronostratigraphy of the Karoo Basin, South Africa: Magnetostratigraphic constraints support an early Permian age for the Ecca Group. Geophys. J. Int. 2017, 211, 1354–1374. [Google Scholar] [CrossRef]
  56. Peters, K.E.; Cassa, M.R. Applied source rock geochemistry. In The Petroleum System—From Source to Trap; Magoon, L.B., Dow, W.G., Eds.; American Association of Petroleum Geologists (AAPG): Tulsa, OK, USA, 1994; Volume 60, pp. 93–120. [Google Scholar]
  57. Crain, E.K. Crain Petrophysical Handbook. 2000. Available online: https://spec2000.net/00-resume.htm (accessed on 1 January 2015).
  58. Peters, K.E. Guidelines for evaluating petroleum source rocks using programmed pyrolysis. Am. Assoc. Pet. Geol. Bull. 1986, 70, 318–329. [Google Scholar]
  59. Ross, D.J.K.; Bustin, R.M. Characterizing the shale gas resource potential of Devonian–Mississippian strata in the Western Canada sedimentary basin: Application of an integrated formation evaluation. Am. Assoc. Pet. Geol. Bull. 2008, 92, 87–125. [Google Scholar] [CrossRef]
  60. Espitalié, J.; Laporte, J.L.; Madec, M.; Marquis, F.; Leplat, P.; Paulet, J.; Boutefeu, A. Rapid method for source rocks characterization and for determination of petroleum potential and degree of evolution. Rev. I’Institut Français Pétrole 1977, 32, 23–42. [Google Scholar] [CrossRef]
  61. Senguler, I.; Ayyildiz, T.; Onal, Y.; Onal, M. Organic geochemical characterization and mineralogic properties of Mengen oil shale (Lutetian), Bolu-Turkey. Oil Shale 2008, 25, 359–375. [Google Scholar] [CrossRef]
  62. Beyssac, O.; Coffé, B.; Petitet, J.-P.; Froigneux, E.; Moreau, M.; Rouzaud, J.N. On the characterisation of disordered and heterogeneous carbonaceous materials by Raman spectroscopy. Spectrochim. Acta Part A Mol. Biomol. Spectrosc. 2003, 59, 2267–2276. [Google Scholar] [CrossRef]
  63. Sadezky, A.; Muckenhuber, H.; Grothe, H.; Niessner, R.; Pöschl, U. Raman microspectroscopy of soot and related carbonaceous materials: Spectral analysis and structural information. Carbon 2005, 43, 1731–1742. [Google Scholar] [CrossRef]
  64. Sheng, C. Char structure characterised by Raman spectroscopy and its correlations with combustion reactivity. Fuel 2007, 86, 2316–2324. [Google Scholar] [CrossRef]
  65. Schito, A.; Romano, C.; Corrado, S.; Grigo, D.; Poe, B. Diagenetic thermal evolution of organic matter by Raman spectroscopy. Org. Geochem. 2017, 106, 57–67. [Google Scholar] [CrossRef]
  66. Kelemen, S.; Afeworki, M.; Gorbaty, M.; Sansone, M.; Kwiatek, P.; Walters, C.; Freund, H.; Siskin, M.; Bence, A.; Curry, D. Direct characterization of kerogen by X-ray and solid-state 13C nuclear magnetic resonance methods. Energy Fuels 2007, 21, 1548–1561. [Google Scholar] [CrossRef]
  67. Bény-Bassez, C.; Rouzaud, J.N. Characterization of carbonaceous materials by correlated electron and optical microscopy and Raman microspectroscopy. Scanning Electron Microsc. 1985, 1, 119–132. [Google Scholar]
  68. Spötl, C.; Houseknecht, D.W.; Jaques, R.C. Kerogen maturation and incipient graphitization of hydrocarbon source rocks in the Arkoma basin, Oklahoma and Arkansas: A combined petrographic and Raman spectrometric study. Org. Geochem. 1998, 28, 535–542. [Google Scholar] [CrossRef]
  69. Chabalala, V.P.; Wagner, N.; Potgieter-Vermaak, S. Investigation into the evolution of char structure using Raman spectroscopy in conjunction with coal petrography; Part 1. Fuel Process. Technol. 2011, 92, 750–756.72. [Google Scholar] [CrossRef]
  70. Beyssac, O.; Rouzaud, J.-N.; Goffé, B.; Brunet, F.; Chopin, C. Graphitization in a high-pressure, low-temperature metamorphic gradient: A Raman microspectroscopy and HRTEM study. Contrib. Mineral. Petrol. 2002, 143, 19–31. [Google Scholar] [CrossRef]
  71. Ferrari, A.C.; Robertson, J. Interpretation of Raman spectra of disordered and amorphous carbon. Phys. Rev. B 2000, 61, 14095–14100. [Google Scholar] [CrossRef]
Figure 1. Geological map of the Main Karoo Basin showing the location of the KWV−01 drill core studied, as indicated by the yellow circle (modified from Geel et al., 2015 [2]).
Minerals 13 01199 g001
Figure 2. International Chronostratigraphic chart 2020/03 [51,52,53,54,55]. Formations of relevance to this research are indicated.
Minerals 13 01199 g002
Figure 3. Maceral data (mineral matter basis) for selected KWV−01 samples.
Minerals 13 01199 g003
Figure 4. A modified van Krevelen diagram showing the kerogen type for the KWV−01 and Berea Sandstone project samples (modified from Espitallié et al., 1977 [60]; Peters, 1986 [58]). Solid curved lines indicate kerogen type (kerogen I to III).
Minerals 13 01199 g004
Figure 5. HI vs. Tmax (°C) showing the thermal maturity range of organic matter for the Berea Sandstone project samples (modified after Espitallié et al., 1977 [60]; Senguler et al., 2008 [61]). The KWV−01 samples were not included in this figure as their Tmax results were artifacts. Solid curved lines indicate kerogen type (Type I, II and III). Broken lines indicate vitrinite reflectance (RoV) cut-off.
Minerals 13 01199 g005
Figure 6. Example of deconvoluted Raman spectrum of the KWV−01 sample.
Minerals 13 01199 g006
Figure 7. Examples of deconvoluted Raman spectrum of the Berea Sandstone project samples.
Minerals 13 01199 g007
Figure 8. G–D1 Band separation versus RoV for the Berea Sandstone project and KWV−01 samples [24]. Note that RoVr was conducted for the Berea Sandstone samples while average calculated RoVeq was conducted for KWV samples (n—number of analyses). The blue line shows the G–D1 band separation curve that increase with RoVr. The colourful boxes indicate the windows of each resource.
Minerals 13 01199 g008
Figure 9. Correlation of Raman Gfwhm versus vitrinite-based reflectance presenting a negative relationship. The standard deviations are indicated by bars on the plot (n—number of samples).
Minerals 13 01199 g009
Figure 10. Correlation of % RoV with G band position (n—number of samples).
Minerals 13 01199 g010
Figure 11. Correlation of Raman D1fwhm versus RoV for the Berea Sandstone project and KWV−01 samples (n—number of samples).
Minerals 13 01199 g011
Table 1. TOC, RoV and programmed pyrolysis results of the Berea Sandstone project and the KWV−01 Karoo Basin samples.
Sample NameGeological Unit/FormationSample NumberTOC *RoVr/RoVeq.AvProgrammed Pyrolysis
S1
(mg HC/g)
S2
(mg HC/g)
S3
(mg HC/g)
Tmax
(°C)
HI
(mg HC/g)
PITOC **
(wt%)
(wt%)(%)
Berea Sandstone project3 Lick34116.470.560.8524.321.494263570.036.82
Cleveland341512.160.562.3766.510.994314900.0313.57
341616.150.562.386.111.334295170.0316.66
34174.700.570.4621.820.574264040.025.4
Sunbury342020.190.522.6999.173.044154670.0321.24
342415.930.532.4684.332.344195050.0316.71
342622.240.553.77112.602.714154890.0323.05
L. Huron33739.990.72-------
Sunbury3812.54.941.22-------
U. Huron41552.351.28-------
KWV−01Ripon1315.53-66 *0.394.400.060.060.09-100.480.61
1415.55-61 *0.314.290.040.080.09-220.350.37
Whitehill2300.53-63 *6.903.740.10.20.23-30.336.84
2307.37-42 *5.763.980.210.280.22-50.436.2
Prince Albert2319.00-07 *0.184.080.020.070.13-300.250.23
2328.93-29.00 *0.853.970.10.120.12-170.460.69
TOC *—total organic carbon from carbon analyzer; TOC **—total organic carbon from Rock-Eval 6; RoV—random vitrinite reflectance (RoVr) and average calculated vitrinite reflectance equivalent (* RoVeq.Av—applicable to overmature samples); RoVr—random vitrinite reflectance. Sample numbers with * are KWV samples and those without a * are Berea Sandstone samples.
Table 2. Raman spectroscopy results for the Berea Sandstone project and the KWV−01 Karoo Basin samples.
Sample NameGeological Unit/FormationSample NumberD4 BandD1 BandD3 BandG BandG—D1
(cm−1)
PID5 Band (2nd Order)D6 Band (2nd Order)
PositionID4/IGFWHMPositionID1/IGFWHMPositionID3/IGFWHMPositionFWHMPositionFWHMPositionFWHM
Berea Sandstone project3 Lick3411---1343 ± 31.126260 ± 31---1594 ± 375 ± 3251 ± 0.30.46----
Cleveland3415---1349 ± 60.995289 ± 25---1591 ± 280 ± 5242 ± 40.46----
3416---1357 ± 60.926292 ± 24---1591 ± 187 ± 7234 ± 50.46----
3417---1355 ± 60.929291 ± 15---1591 ± 185 ± 7236 ± 40.46----
Sunbury3420---1346 ± 40.958298 ± 24---1585 ± 279 ± 5239 ± 20.46----
3424---1349 ± 40.978295 ± 17---1585 ± 284 ± 5236 ± 20.46----
3426---1350 ± 40.982306 ± 23---1585 ± 286 ± 6235 ± 20.46----
L. Huron3373---1349 ± 50.89254 ± 15---1592 ± 182 ± 4243 ± 40.46----
Sunbury3812.5---1341 ± 40.954244 ± 16---1594 ± 372 ± 5253 ± 10.46----
U. Huron4155---1339 ± 40.97243 ± 18---1593 ± 370 ± 5254 ± 10.46----
KWV −01Ripon1315.53–66 *12510.1713181343 ± 31.00296 ± 1015430,136991603 ± 445 ± 2260 ± 10.4626545542922131
Whitehill2300.53–63 *11940.1012571354 ± 0.62.07859 ± 415000,0821061601 ± 0.962 ± 1247 ± 0.30.4626871532937104
2307.37–42 *11880.0991871351 ± 0.91.82370 ± 315510,117801605 ± 149 ± 2254 ± 0.20.4626732642930130
Prince Albert2328.93–29.00 *11960.0941691350 ± 0.61.71666 ± 115520,083681605 ± 146 ± 1255 ± 0.50.4626702722934111
ID1/IG—intensity ratio of D1 to G band; ID3/IG—intensity ratio of D3 to G band; ID4/IG—intensity ratio of D4 to G band; FWHM—full width at half maximum; (G—D1)—band separation; PI—Production Index. Sample numbers with * are KWV samples and those without a * are Berea Sandstone samples.
Disclaimer/Publisher’s Note: The statements, opinions and data contained in all publications are solely those of the individual author(s) and contributor(s) and not of MDPI and/or the editor(s). MDPI and/or the editor(s) disclaim responsibility for any injury to people or property resulting from any ideas, methods, instructions or products referred to in the content.

